1. Introduction
Vehicles have evolved beyond mere means of transportation and are now integral to daily life. Self-driving technology enables drivers to reach their destinations without focusing on driving [
1,
2,
3]. However, reaching fully autonomous driving, where no driver intervention is needed, will take more time [
4]. Autonomous driving depends on safe driving, and various safety technologies are constantly being developed and implemented in autonomous vehicles. To support safe driving of self-driving vehicles, safety support technologies are constantly being applied to vehicles but not road infrastructure [
5,
6,
7]. Technologies for vehicle safety support are also being applied to road signs, lanes, traffic lights, and tunnels [
7,
8]. Three elements are required to drive a vehicle: the road, vehicle, and driver. However, the adoption of technologies in vehicles to enhance driver focus for safe driving remains significantly low [
8]. For example, there are scenarios in which one cannot concentrate on driving because of the use of a smartphone, watching multimedia, or talking to a passenger, which can lead to traffic accidents. Recently, technologies related to safe driving of autonomous vehicles have been released and installed as commercial products in both general and autonomous vehicles. Typical examples are lane departure prevention forward collision avoidance and surround view monitoring systems [
9,
10,
11]. Autonomous driving support systems focus on detecting vehicles on the road and providing safety support technologies that recognize the distance, driving direction, trajectory, and speed of the vehicle [
12,
13]. If the system can also identify and classify the types and colors of the detected vehicles, it will be possible to provide safer driving technology support based on more information.
For example, when an autonomous vehicle is driving on a four-lane road and has to change lanes, it is crucial to select the safest lane and adjust the driving route accordingly. Lane selection is typically based on the presence of vehicles in adjacent lanes, both in front of and behind the driving vehicle [
14]. If a large truck or bus is driving in three lanes, although it does not pose a direct safety threat while driving, it will change from two lanes to one lane rather than from two lanes to three lanes [
15]. Therefore, vehicle type detection and classification processes are required [
16,
17,
18]. In addition, accurately classifying the color of a vehicle can improve its detection and tracking capabilities. The proposed method classifies vehicle types by tracking the bounding boxes of the vehicles detected in three consecutive frames. Previous studies have proposed methods for detecting vehicles and determining their types from a single input image [
19,
20,
21]. However, in dynamic road environments like highways, as explored in this paper, real-time simultaneous identification of a vehicle’s type and color using a black-box camera I not feasible [
22,
23].
In this study, the You Only Look Once version 4 (YOLO v4) deep learning neural network (DNN) [
24], which is based on the pre-trained ResNet-50 convolutional neural network (CNN) [
25], was used to detect vehicles in successive frames. Subsequently, the type and color of the detected vehicle were classified using a ResNet-50 CNN. The vehicle types were classified into four types (sedan, SUV, truck, and bus) according to the vehicle size for safe driving, and the vehicle colors were classified into eight types (white, black, silver, yellow, red, orange, blue, and green).
The proposed method detects vehicles driving ahead in a dynamic environment, such as a highway, and classifies the types and colors of vehicles in real time. The proposed method provides several advantages when using ResNet-50 CNN. First, it is composed of deep neural network layers and exhibits an excellent performance in learning complex patterns and features, which helps to detect various vehicle features and shapes. Second, learning efficiency is enhanced by skipping layers through residuals, which facilitates information transfer and reduces the gradient loss problem, thereby enabling the training of deeper networks.
Third, ResNet-50 provides pre-trained models on large datasets, such as ImageNet. These pre-trained weights can be used to quickly learn the features required for vehicle detection. This has the advantage of being able to train the model effectively, even when the amount of training data is small.
Finally, the ResNet-50 CNN has a relatively high accuracy compared with the other models, excellent computational efficiency, and efficient memory usage. These advantages enable the ResNet-50 CNN to achieve high accuracy and efficiency in vehicle detection research, facilitating the fast and accurate detection of vehicles in various environments. Thus, the proposed method establishes a neural network that can perform vehicle detection, type, and color classification relatively accurately in real-time in a relatively small learning data environment. The superiority of the proposed method has been demonstrated through various experiments to optimize the learning parameters.
Training the neural network used to extract vehicle features from road driving images requires significant time and effort. The proposed method involves extracting image features using a pre-trained neural network, and then training a classifier with these features. Vehicle features were trained using the YOLO v4 classifier. Using a pre-trained neural network for feature extraction offers a fast and efficient method to harness deep learning capabilities without training the entire neural network from scratch. This method is particularly useful when a GPU is unavailable because it requires only one pass through the training images. The proposed method utilizes a pre-trained image classification neural network to extract features from road images and learn vehicle detection, type, and color classification tasks. Transfer learning, using a pre-trained neural network, is typically faster and easier than training a neural network from scratch. When selecting a pre-trained neural network for vehicle detection, we must consider its accuracy, speed, and size. If the vehicle learning dataset is small, obtaining driving data for all road environments can be challenging. In such cases, we should use transfer learning to extract features by applying a pre-trained neural network. The advantage of using a pre-trained neural network as a starting point is that it allows for a faster training speed when training a simple classifier on the extracted features. In addition, fine-tuning the deeper layers of a neural network on a new dataset can enable it to learn features specific to that dataset, even if the network has already learned a variety of image features. This approach is particularly useful for training a neural network to recognize vehicles from driving images. Fine-tuning a neural network is a relatively slow and more effort-intensive process than simple feature extraction. However, as a neural network can be trained to extract different features, the final neural network often provides more accurate results.
In the proposed method, ResNet-50 is used as an effective feature extractor. ResNet-50 is a convolutional neural network that consists of 50 layers. This pre-trained neural network could classify images into 1000 object categories, including keyboards, pencils, and various animals. It can learn various features representing different images.
The feature was used as a classifier. Through various studies, YOLO deep learning networks have been developed from v1 to v8. YOLO v1 and v2 are suitable for models in which accuracy is prioritized. YOLO v3 and v4 are suitable for models in which speed is a priority. YOLO v5 and v6 are suitable for models that require a balance between accuracy and speed. YOLO v7 and v8 can be mainly applied when memory and computing performance are limited, and are suitable for models that apply pose estimation or object tracking by detecting objects with small calculations and low memory usage. YOLO v4, while slower than v5, can enhance frames per second (FPS) performance, whereas YOLO v5 offers simpler configuration and environmental implementation compared to v4. The proposed method requires rapid processing of fast-driving vehicle detection on the highway. To achieve this, the YOLO v4 deep learning network was utilized, which produced accurate detection results.
The paper is structured as follows: Chapter 1 introduces and reviews previous research. Chapter 2 presents the proposed method. Chapter 3 presents the experimental results, and Chapter 4 provides the conclusions and discussion.
Previous Research
Research on classifying vehicle types and colors while driving on the road has several applications, such as traffic management information systems [
26] and intelligent transportation systems [
20].
Pillai and Valles [
20] proposed a method to classify and analyze vehicle colors and types using a deep learning neural network. This method can be applied to Amber and Silver Alert emergency situations. Their proposed method was classified into six types of vehicles: trucks, buses, vans, SUVs, sedans, and motorcycles, and eight categories of vehicle colors: green, blue, black, white, gray, yellow, turquoise, and red. The dataset used for training included images of various types of vehicles, such as sedans, buses, SUVs, and trucks. However, in their method, pre-processing was applied to the images used for learning to improve image quality due to changes in lighting, haze, and excessive exposure to lighting. As a result, its real-time application to self-driving vehicles is limited.
Hu et al. [
21] proposed a method for vehicle detection and color classification that can be used for intelligent traffic management and support in vehicular criminal investigations. They pre-trained a lightweight MobileNet-v2 CNN [
27] and reduced the network complexity by replacing Darknet-5 on the YOLO v3 backbone network. They trained a total of 24 color datasets and proposed a color classification method. Their research aimed to detect vehicles and classify their colors from images captured by fixed cameras installed on the upper part of the road, not in a driving environment. The detected vehicles in their research were relatively large and had the characteristics of driving only in a certain area. They presented relatively good color classification results by experimenting with images obtained from a high-resolution camera.
Irhebhude et al. [
28] proposed a method for classifying pedestrians and vehicle types at night using thermal imaging cameras. To classify vehicle types in the special environment of night, only the features of vehicle outlines obtained from thermal images were extracted and Histogram of Oriented Gradients(HoG) features and SVM classifier were used to classify types of trucks and sedans.
Imperial et al. [
29] proposed a method that used the YOLO v4 DNN to detect and classify vehicles as coupes, pickups, sedans, SUVs, and vans. However, the method had the disadvantage of requiring a significant amount of learning time due to the acquisition of side images of vehicles parked on the road and learning the deep learning algorithm of YOLO v4 being learned without the use of a transfer learning. Their proposed method classified vehicle types from side images of parked vehicles rather than driving vehicles, which allowed for more information about the side parts of the vehicle. However, our method differs from this by classifying vehicle types using rear and some side images of the moving vehicle.
Hsieh et al. [
19] proposed a method to classify vehicles into seven colors under different lighting conditions by color correction. To reduce the risk of misclassifying the same vehicle color into different colors due to light scattering and diffuse reflection on the vehicle surface, they designed a tree-based color classifier. The classifier was binary classified into achromatic and chromatic, and then classified into detailed colors using color features. They presented the method to improve the accuracy of vehicle color classification, even when the vehicles have different colors and are acquired under varying lighting conditions. The method involved extracting only the vehicle regions by removing the background from the image sequence, and classifying colors using a tree-based classification of representative colors of vehicles with the same color.
Hicham et al. [
30] proposed a method for classifying vehicle types in CNN-based rear vehicle images. The detected vehicle region was normalized to a fixed size of 32 × 32 pixels before classification. They used a CNN network to classify three types of vehicles (sedans, microbuses, and SUVs) from input images. The authors trained the networks using image vectors normalized to a size of 32 × 32 as input. The method used does not differentiate between large buses and trucks and sedans or SUVs by uniformly normalizing the vehicle region to a small area.
Several studies have proposed methods for classifying vehicle types and colors. However, most of these studies focus on extracting features from parts of the vehicle that contain a relatively large number of features, such as the side or front of the vehicle, and use CNN learning algorithms.
Transfer learning models have recently been proposed to extract feature information, and deep learning algorithms have been used to classify the type and color of objects of interest [
18,
20,
25,
29,
30]. However, this research is limited to high resolution images and learning datasets obtained from the side or front of the vehicle, or from road images obtained by a fixed camera. Therefore, it is necessary to develop a method to determine the type and color of the preceding vehicle using only the rear and some side regions. This will enable the autonomous vehicle to effectively select the lane when changing lanes. To achieve this, a method for classifying vehicles by physical size, such as sedan, SUV, truck, and bus, is required. In addition, a reliable method for classifying vehicle color must be able to withstand variations in illumination, diffuse reflection from the vehicle surface, and adverse weather conditions.
2. Proposed Method
This paper introduces a method for real-time detection and classification of vehicles ahead on the road by type and color. Vehicle types and colors can be used as selection information for optimal decision algorithms for autonomous vehicles to change driving lanes in real-time while driving. Road management systems can also be used to provide driving information suitable for vehicles [
31].
Several studies have been conducted to classify vehicle types and colors. However, previous studies have mainly focused on classifying vehicle types or colors from stationary vehicle images or classifying them from the front or side of the vehicle. Furthermore, the color of the vehicle is estimated by simplifying the image into five or six colors using a color histogram. This process makes it relatively difficult to accurately classify the color owing to changes in illumination, random reflections on the surface of the vehicle, and image blur caused by high-speed driving. Therefore, to classify the types and colors of vehicles detected while driving, we must classify the same vehicle types and colors obtained in multiple frames rather than in a single image frame.
The proposed method uses a pre-trained ResNet-50 CNN as a base network to train YOLO v4 for vehicle detection in the input image sequence. The detected vehicle bounding box is then used to classify the type and color of the vehicle. There were four types of vehicles and eight types of vehicle colors.
2.1. Overview
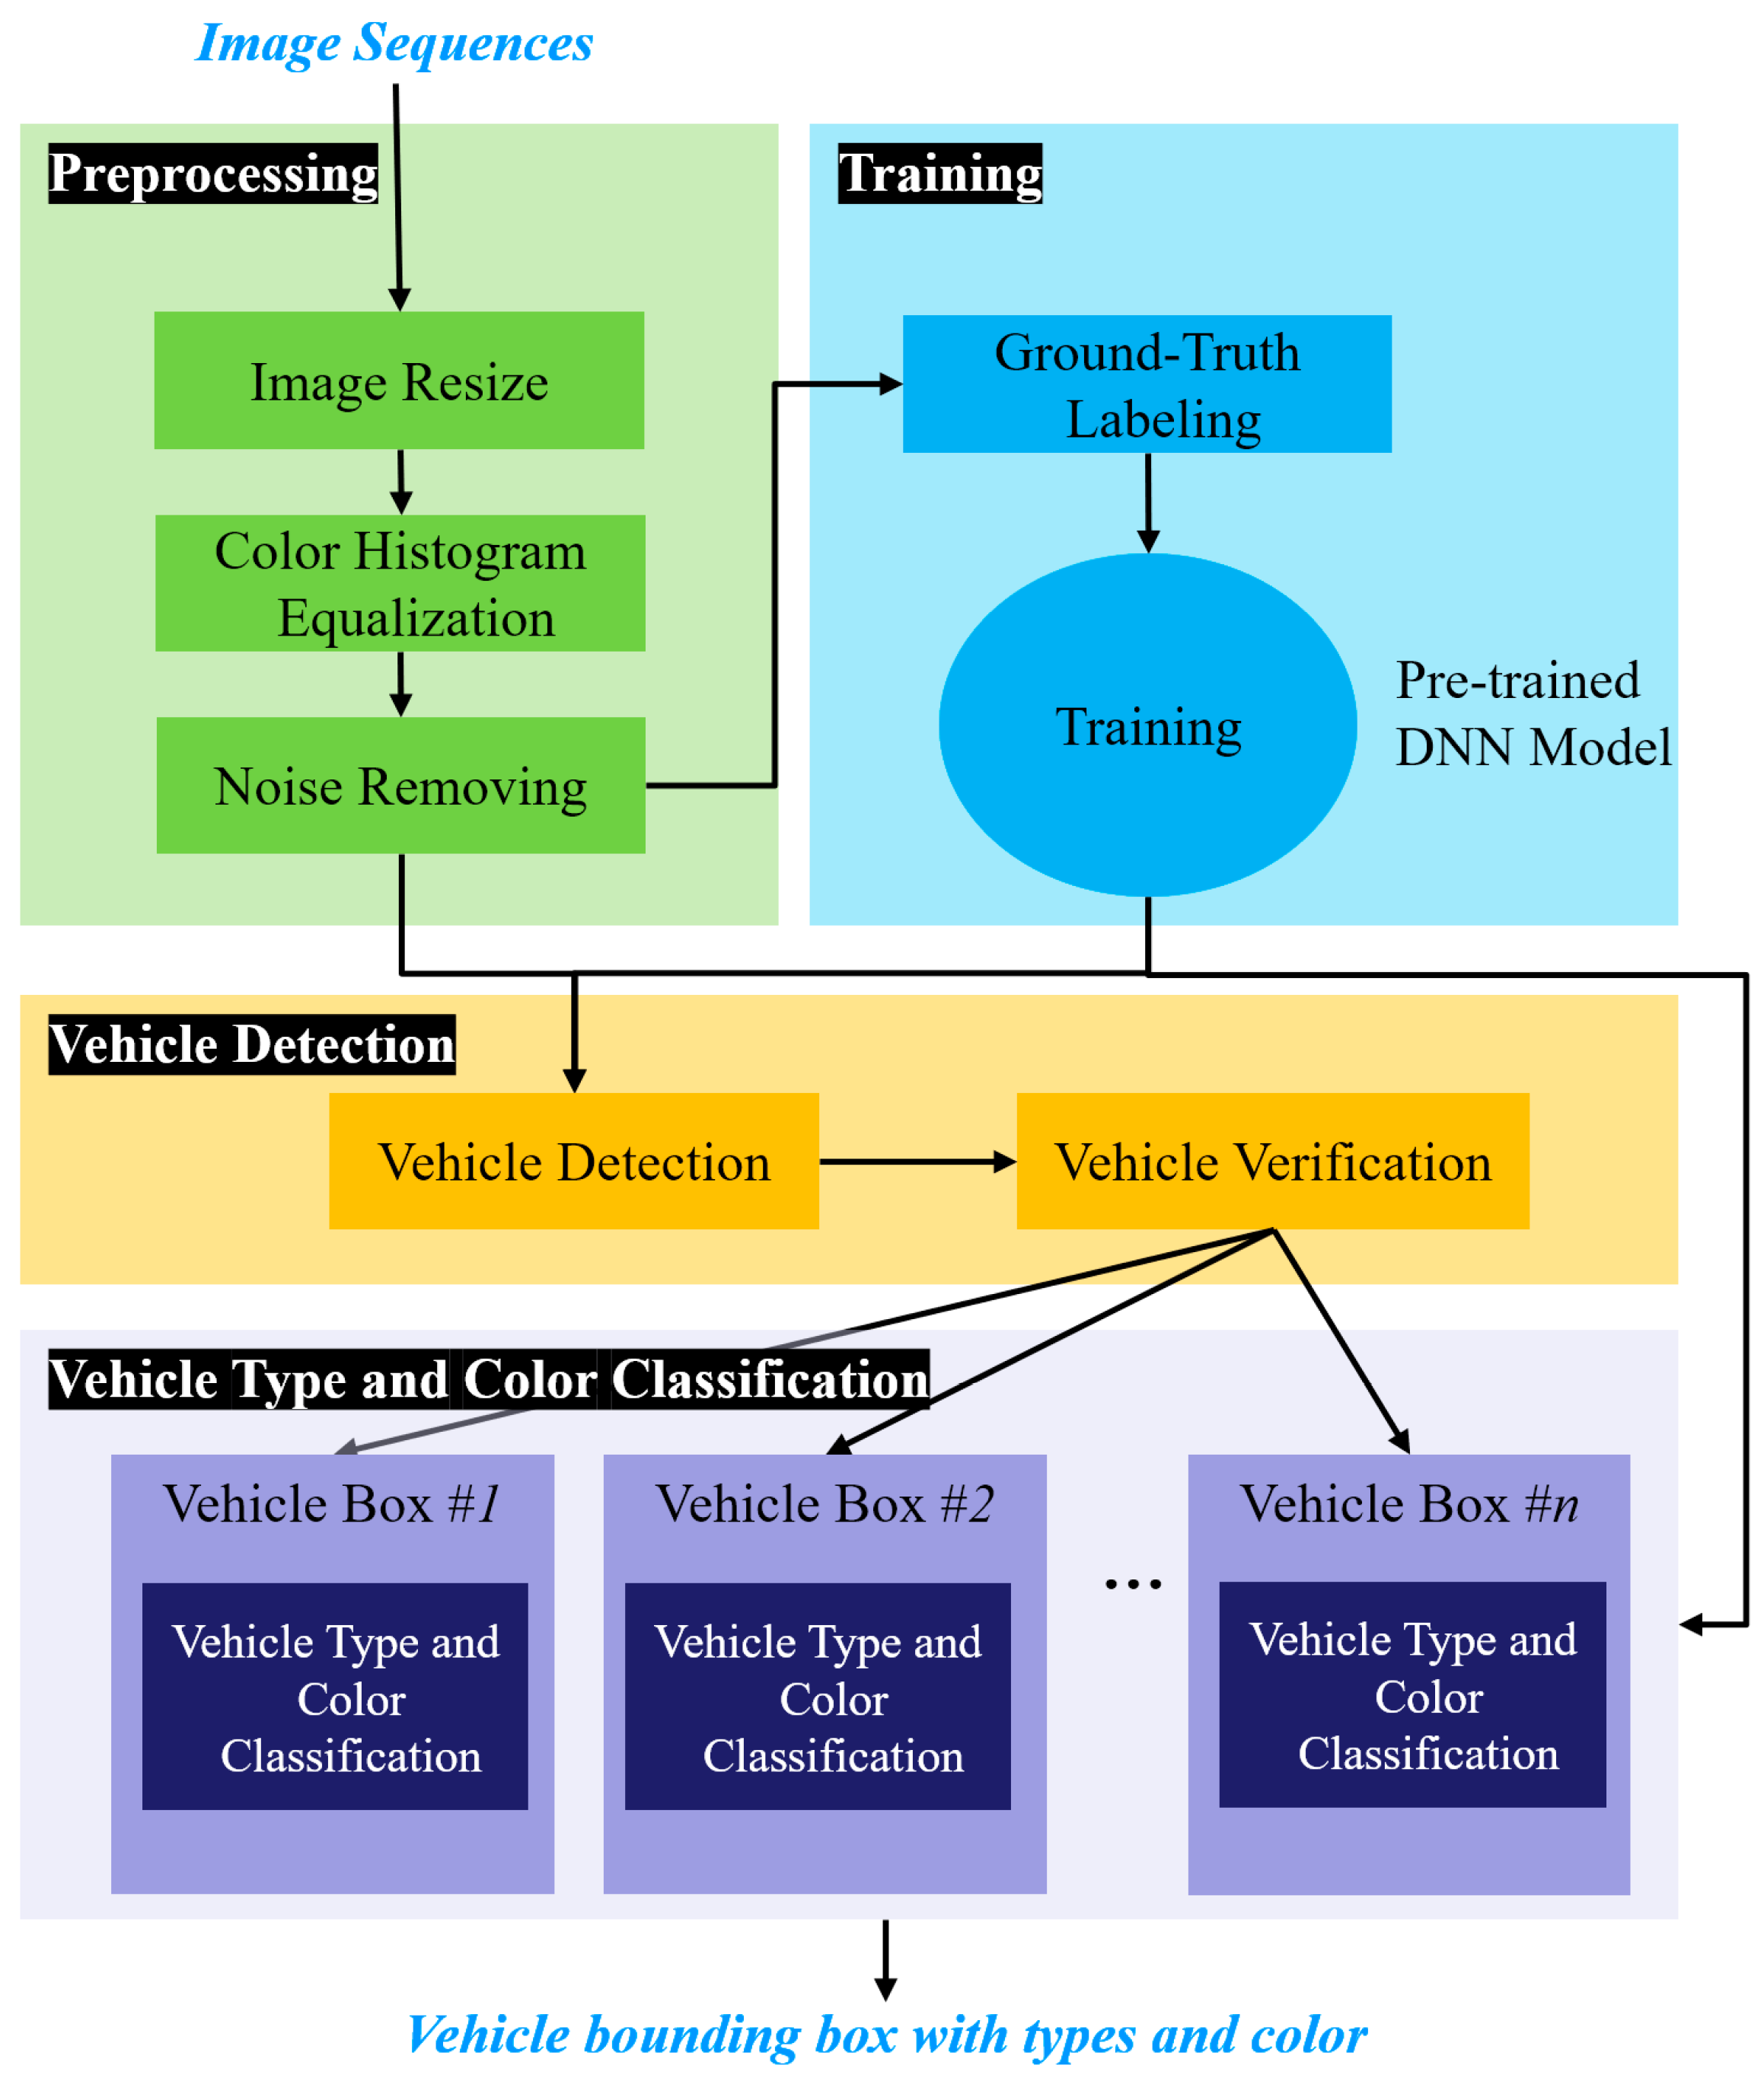
Figure 1 shows the processing flow of the proposed method for classifying the vehicle type and color. The method consists of three steps: the first is a pre-processing step, the second is a vehicle detection step, and the third is a vehicle type and color classification step. The proposed method selects a region of interest (ROI) in road images captured during driving, where the vehicle is located, and applies a vehicle detection method along with type and color classification within the ROI. The pre-processing step enhances the quality of the input road image to improve the accuracy of vehicle detection and classification of types and colors. Image quality enhancement is necessary for images acquired while driving on the road because of the presence of various noises sources.
In the pre-processing step, the input image is resized to reduce the processing load. Additionally, the RGB color space was converted to the Lab color space and the color contrast was enhanced using contrast-limited adaptive histogram equalization [
32]. Furthermore, atmospheric haze is reduced by removing noise, which in turn reduces smoke caused by light scattering or vehicle exhaust in the atmosphere.
In the vehicle detection step, the pre-trained deep learning model was used to remove noise and reduce the size of the input road image. The YOLO v4 deep learning neural network was then used to detect bounding boxes containing vehicles. To verify that the detected vehicle regions contained actual vehicles, a template matching method was used if the region exceeded the threshold.
In the vehicle type and color classification step, a ResNet-50 pre-trained CNN [
33,
34] was used to classify the detected vehicle bounding boxes [
33,
34]. These bounding boxes represent the rear or rear side images of the vehicle in front. The types of colors of the vehicle were then determined by analyzing more than three consecutive frames. To improve the accuracy, vehicle bounding boxes from more than three frames were detected without classifying them using a single image result. Therefore, the input of the proposed method is an image sequence, and the output is bounding boxes containing vehicles in the image sequence, the vehicle types, and colors.
2.2. Pre-Processing
Road images capturing a moving vehicle have limitations in terms of feature extraction due to various noises and diffuse reflections caused by lighting. Additionally, the quality of the captured road images deteriorates due to diffuse illumination and haze, making it difficult to accurately classify vehicle types and colors, especially when it comes to classifying vehicle colors. Therefore, the proposed method improves color contrast by reducing the image size and equalizing the color histogram during the pre-processing step. Additionally, it improves selective color contrast by estimating atmospheric light based on the dark channel before reducing atmospheric haze [
4,
35].
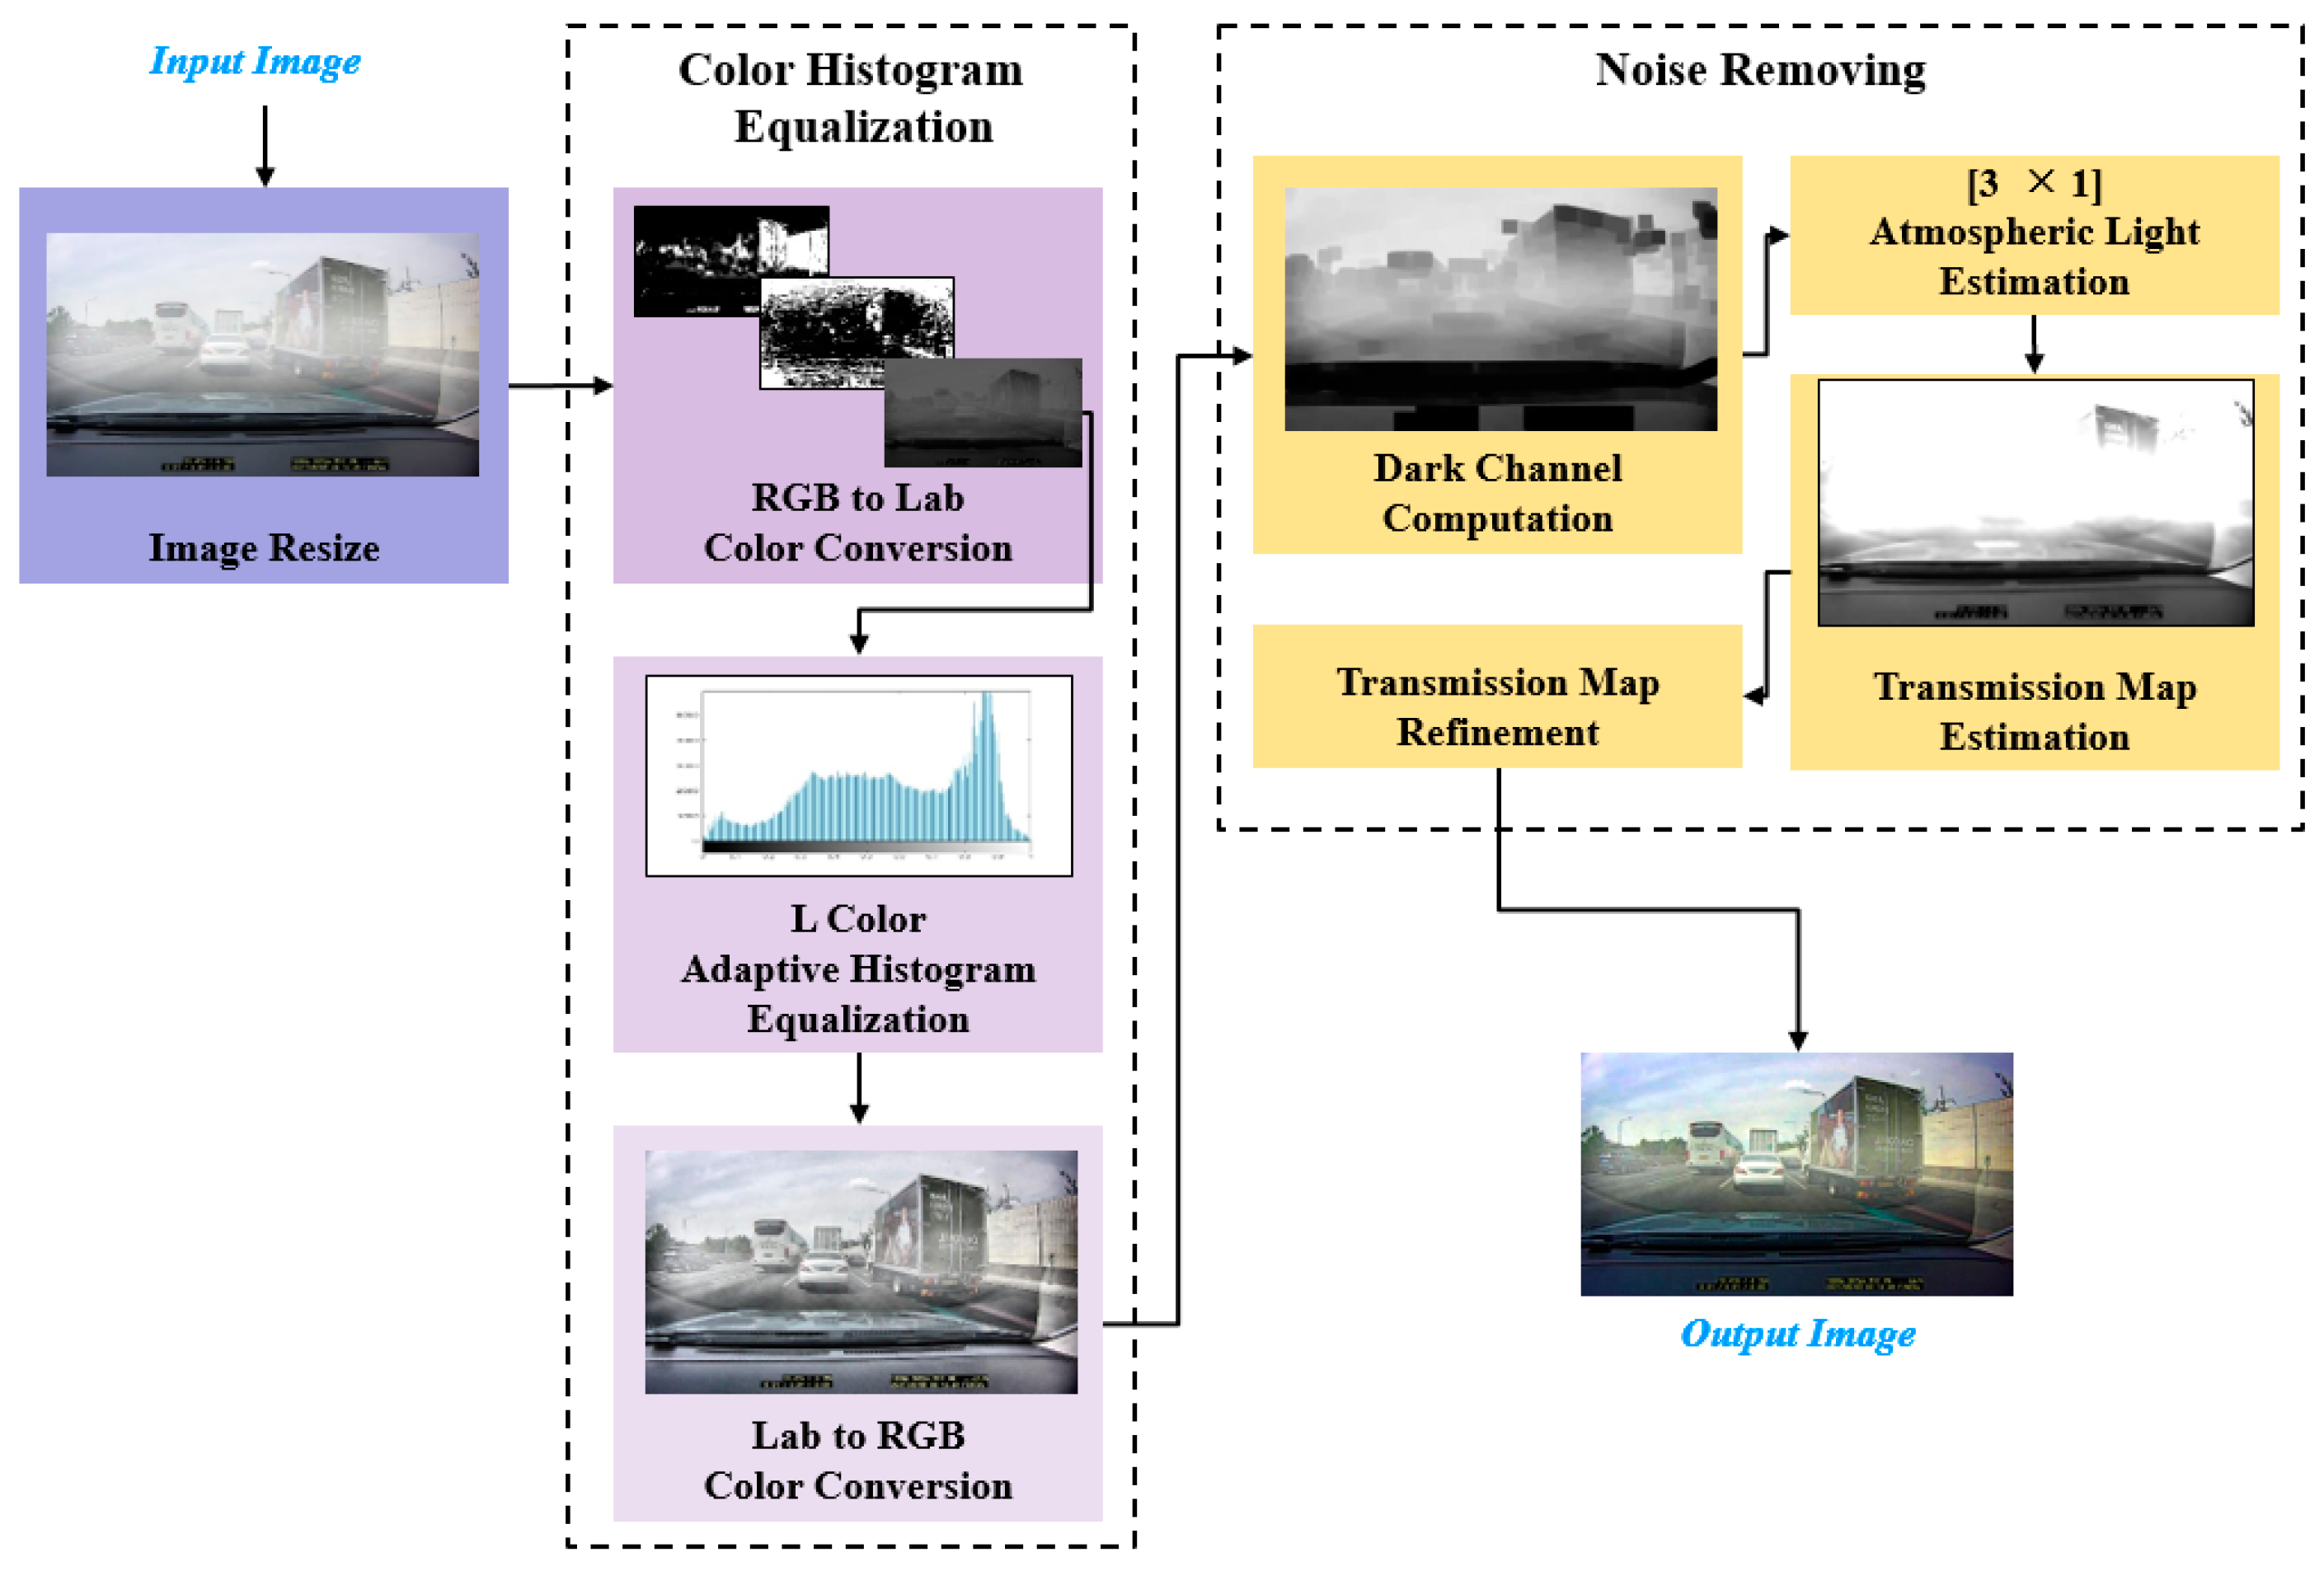
The proposed method uses a full HD road image with dimensions of a size of 1920 × 1080 pixels as input. In order to reduce processing computations during vehicle detection, types and colors classification, the input image is resized to 960 × 540 pixels using the nearest neighborhood interpolation. The RGB color space of the input road image is first converted to the Lab color space. Contrast-limited adaptive histogram equalization [
31] is then applied only to the luminance layer (L-space). The image is then converted back to the RGB color space. This process only affects the pixel intensity by adjusting the luminance, while the original color is preserved. As the final step of pre-processing, the dark channel priority based dehazing algorithm [
32] is applied to remove the haze phenomenon contained in the road image, and the input road image (
I) is as shown in Equation (1).
Here,
I is the observed distorted image,
J is the original image before it is distorted by haze,
A is the atmospheric light, and
t is the transmission map representing the proportion of light that finally reaches the camera through the atmosphere. A portion of
J(x) is lost as it passes through the atmosphere, leaving only a signal equal to
J(x)
t(x). In addition, the airlight (
A) produced by the sun and other ambient light sources is partially mixed into the original image before being distorted, and finally obtained as the observation image
I(x). The dehazing algorithm generates a dehazed image (
J) by estimating the transmission map and the atmospheric light as shown in Equation (2). First, the atmospheric light (
A) is estimated using the dark channel prior, and then the transmission map (
t) is estimated.
Figure 2 shows the processing flow of the pre-processing step, which involves reducing the image size, emphasizing contact, and removing haze from the input road image.
2.3. Vehicle Detection
In this step, features are extracted using a pre-trained deep learning model used in previous studies [
4,
8]. Vehicle detectors are then generated using the YOLO v4 deep learning network. The CNN structure used to detect vehicle bounding boxes from the input road image consists of various combinations of convolution and pooling layers [
4].
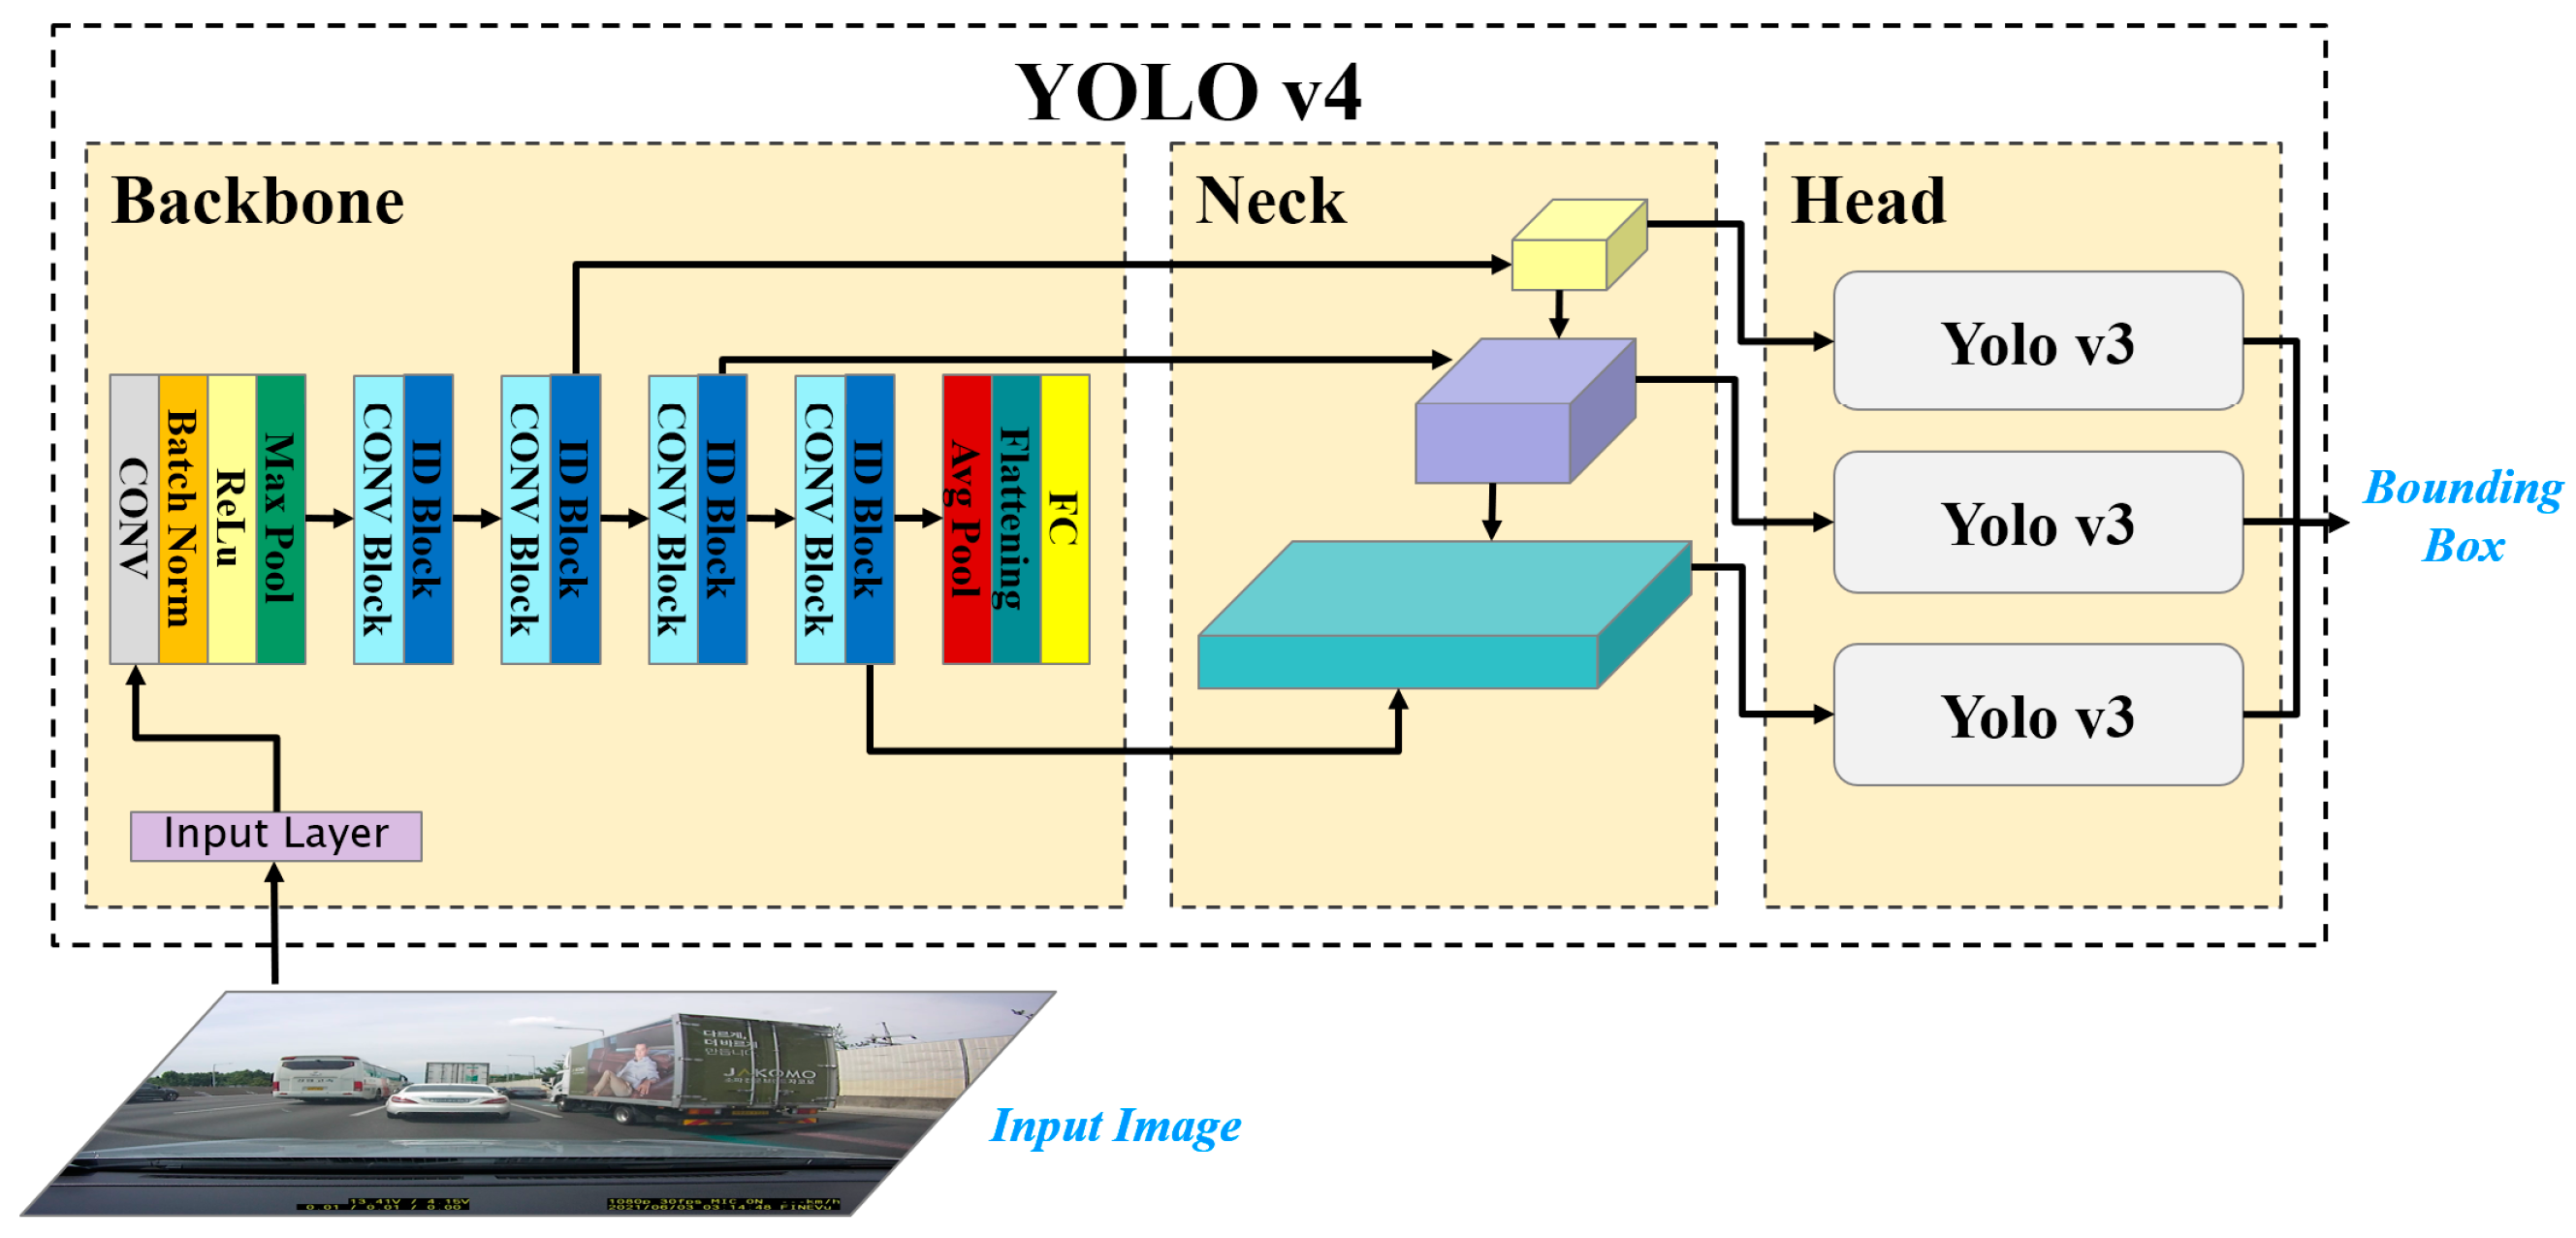
Figure 3 shows the processing flow of the vehicle detection step. In the Backbone of
Figure 3, features are extracted through a pre-trained Resnet-50 CCN, and Conv Block is a set of convolutional layers with various filter sizes. The Backbone in
Figure 3 extracts features using a pre-trained Resnet-50 CCN, while Conv Block is a set of convolutional layers with various filter sizes.
The vehicle detection network used in this step is a one-stage object detection network based on YOLO v4. It consists of three parts: the Backbone, Neck, and Head. In
Figure 3, the Backbone of the YOLO v4 vehicle detection network uses a pre-trained ResNet-50 CNN as a base network. It calculates features for vehicle detection from input images. To extract features from road images, the first input layer of the ResNet-50 CNN is resized to 224 × 224 pixels. Feature extraction in the pre-trained ResNet-50 CNN uses the activation_22_Rectified Linear Unit (ReLU) and activation_40_ReLU layers. The Neck part of YOLO v4 connects the Backbone and Head and consists of a Spatial Pyramid Pooling (SPP) module and a Path Aggregation Network (PAN). The Neck connects feature maps from different layers of the Backbone network and serves as input to the Head. The Head predicts the bounding box containing the object of interest and the probability score of the object within the bounding box from the feature maps. The YOLO v3 object detector is used in the Head, and anchor boxes are calculated to train a YOLO v4 deep running network using the ResNet-50 CNN as the base network. Anchor boxes are pre-calculated boxes with statistically estimated heights and widths that are used to improve the speed and efficiency of DNN framework detection [
36]. They are defined to capture the scale and aspect ratio of the specific object class to be detected, usually estimated based on the size of the objects in the training dataset.
The use of an anchor box in the YOLO v4 DNN enables the detection of objects of different scales and overlapping objects. Furthermore, object detection using an anchor box allows for real-time processing of the entire input image [
4].
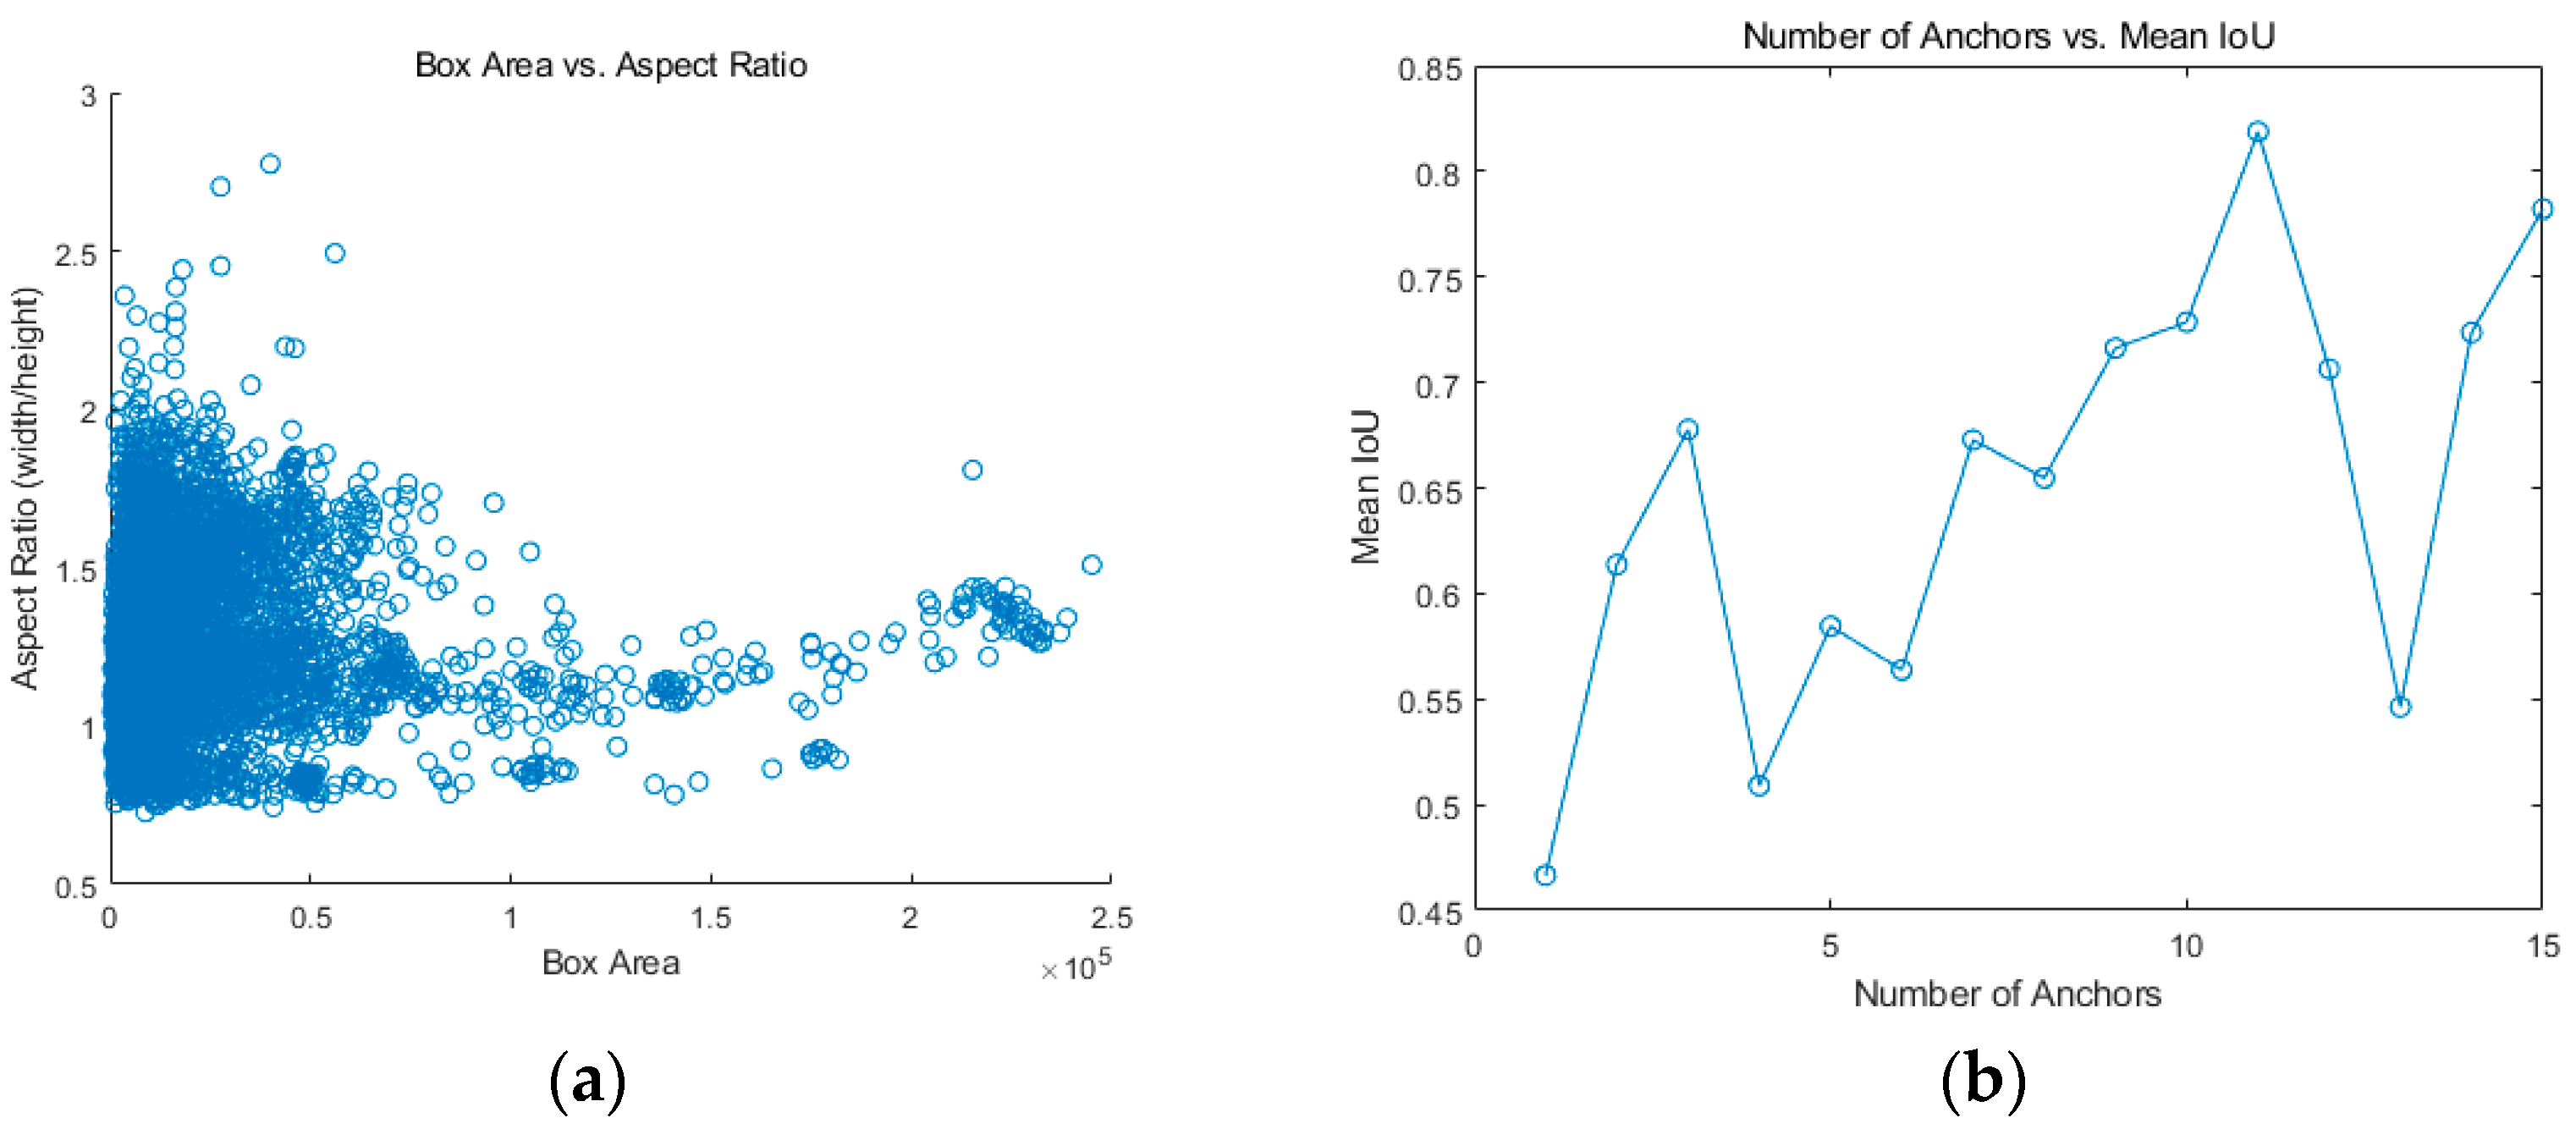
Figure 4a shows the size and aspect ratio of the manually labeled bounding boxes in the driving image captured from the road. In
Figure 4, the labeled vehicle regions are concentrated in a specific area, while some are distributed. To extract optimal anchor boxes, the k-means clustering algorithm is used. To select the optimal anchor boxes, consider the clustered anchor boxes are considered as well-overlapped boxes only if the actual intersection over union (IOU) value is 0.5 or higher. Then, the number of anchor boxes with the highest average IOU and the lowest number is selected.
Figure 4b shows the change in average IOU as a function of the number of anchor boxes. The number of anchor boxes with the highest average IOU value in
Figure 4b is 11.
The YOLO v4 network uses the ResNet-50 CNN as its backbone to extract features from input road images. These feature maps are then input into the Neck part of the YOLO v4 network. Feature maps are output from a total of 49 activation layers of the ResNet-50 CNN, with the 22nd ReLU layer extracting features of size 28 × 28 × 512 and the 40th ReLU layer extracting features of size 14 × 14 × 1024. The initial convolutional layer of the Resnet-50 CNN is responsible for detecting basic features such as color and edges of the target class. As the network progresses through deeper convolutional layers, it becomes capable of detecting more complex and intricate features of the target class. The proposed method inputs images into a pre-trained ResNet-50 CNN to detect vehicles in road images. The output of the ReLU layer of the neural network is then checked, and the convolutional layers that extract the most optimal features are selected from the 50 layers of convolutional layers.
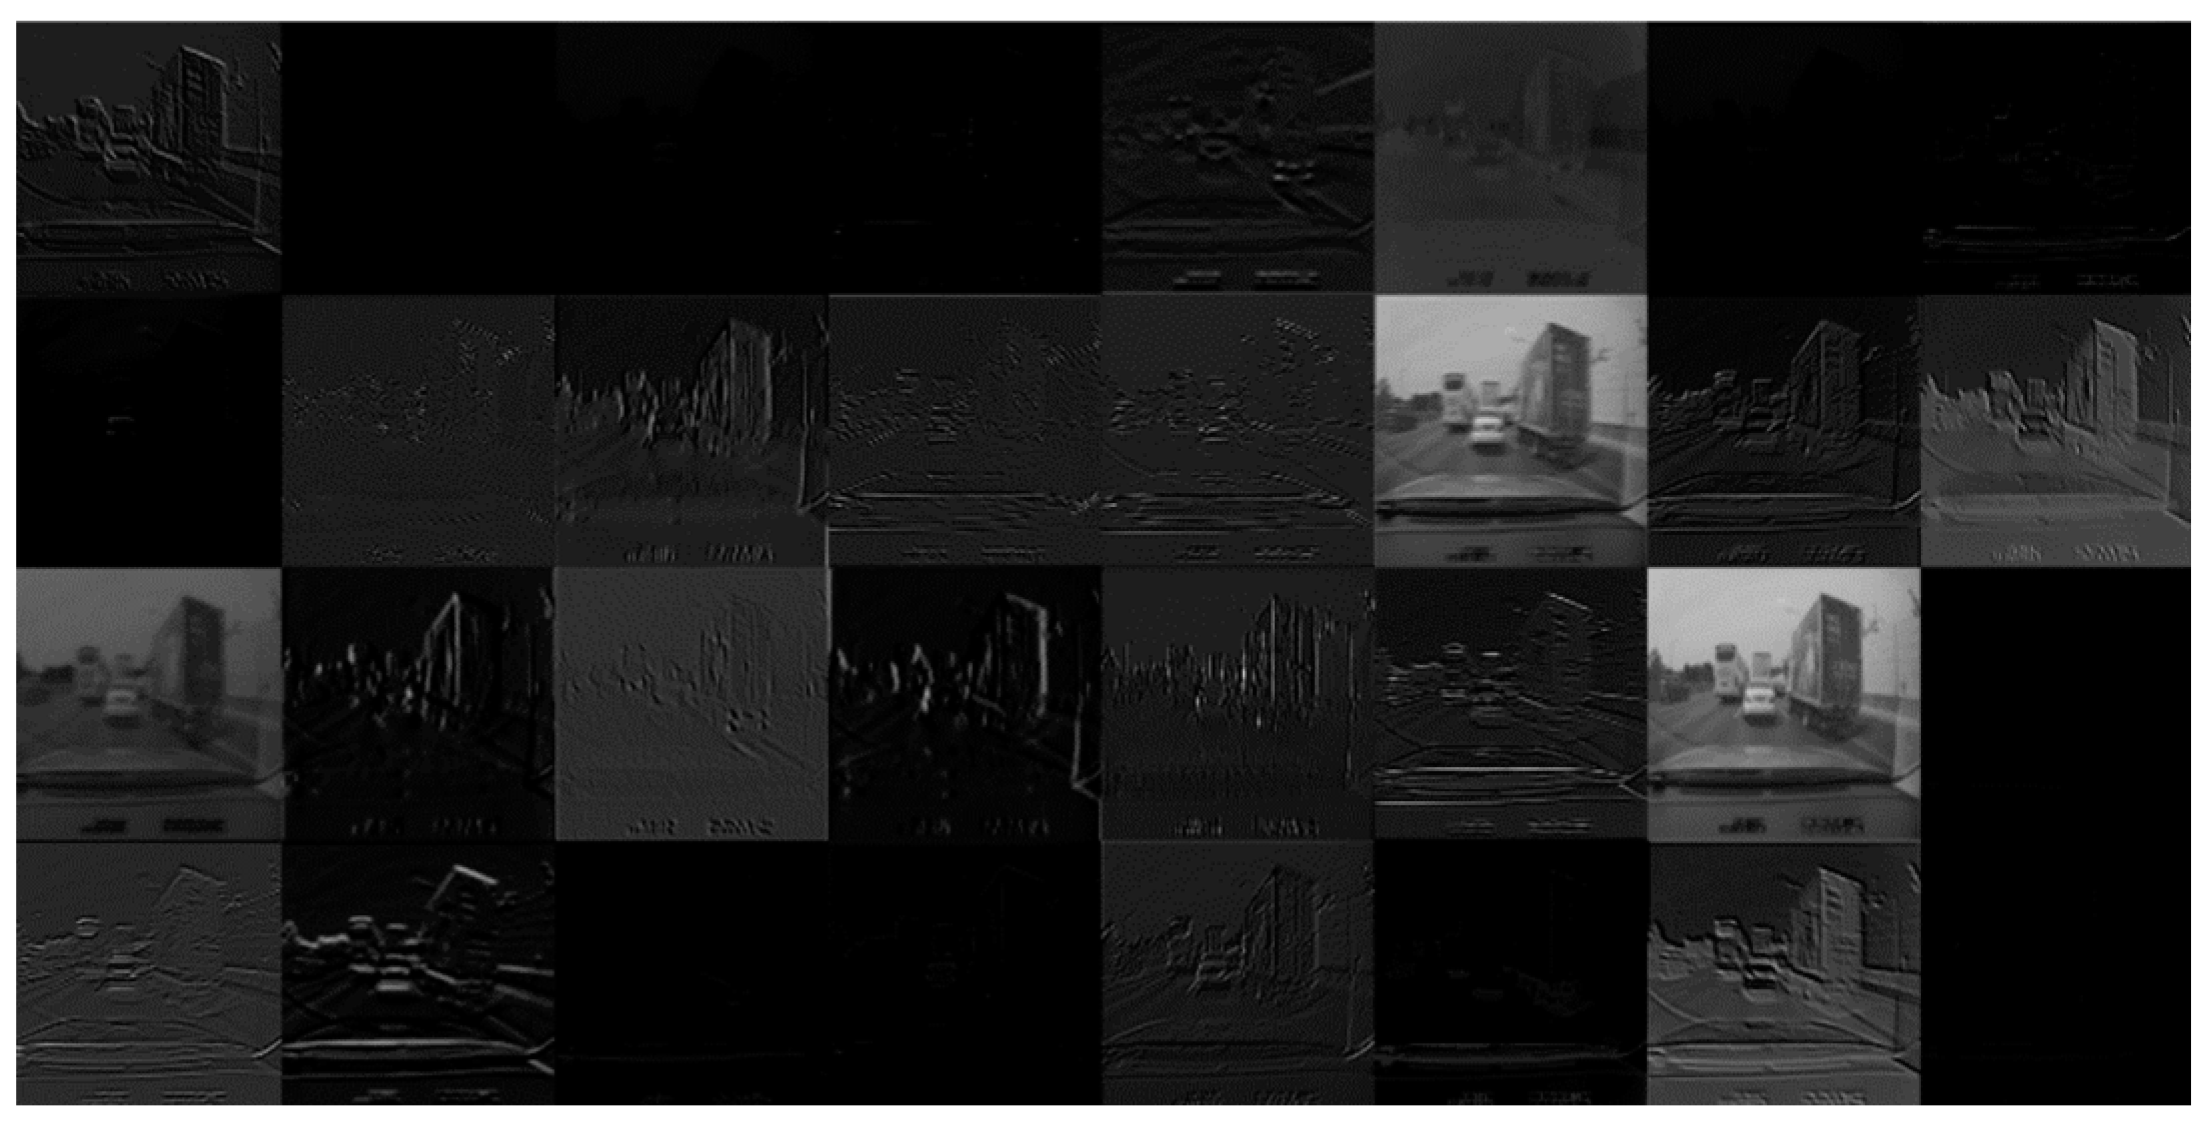
Figure 5 shows the activated output value of the first convolutional layer [112 × 112 × 64] of the Resnet-50 CNN on the road image. The output represents 24 channels out of a total of 64 channels in the first ReLU layer. In
Figure 5, white pixels indicate strong positive activation, while black pixels indicate strong negative activation. The network appears to be learning low-level features, such as edges and textures. The first channel emphasizes the features of the vehicle in the input road image. This may be due to the distinct shape, form, and color of the vehicle
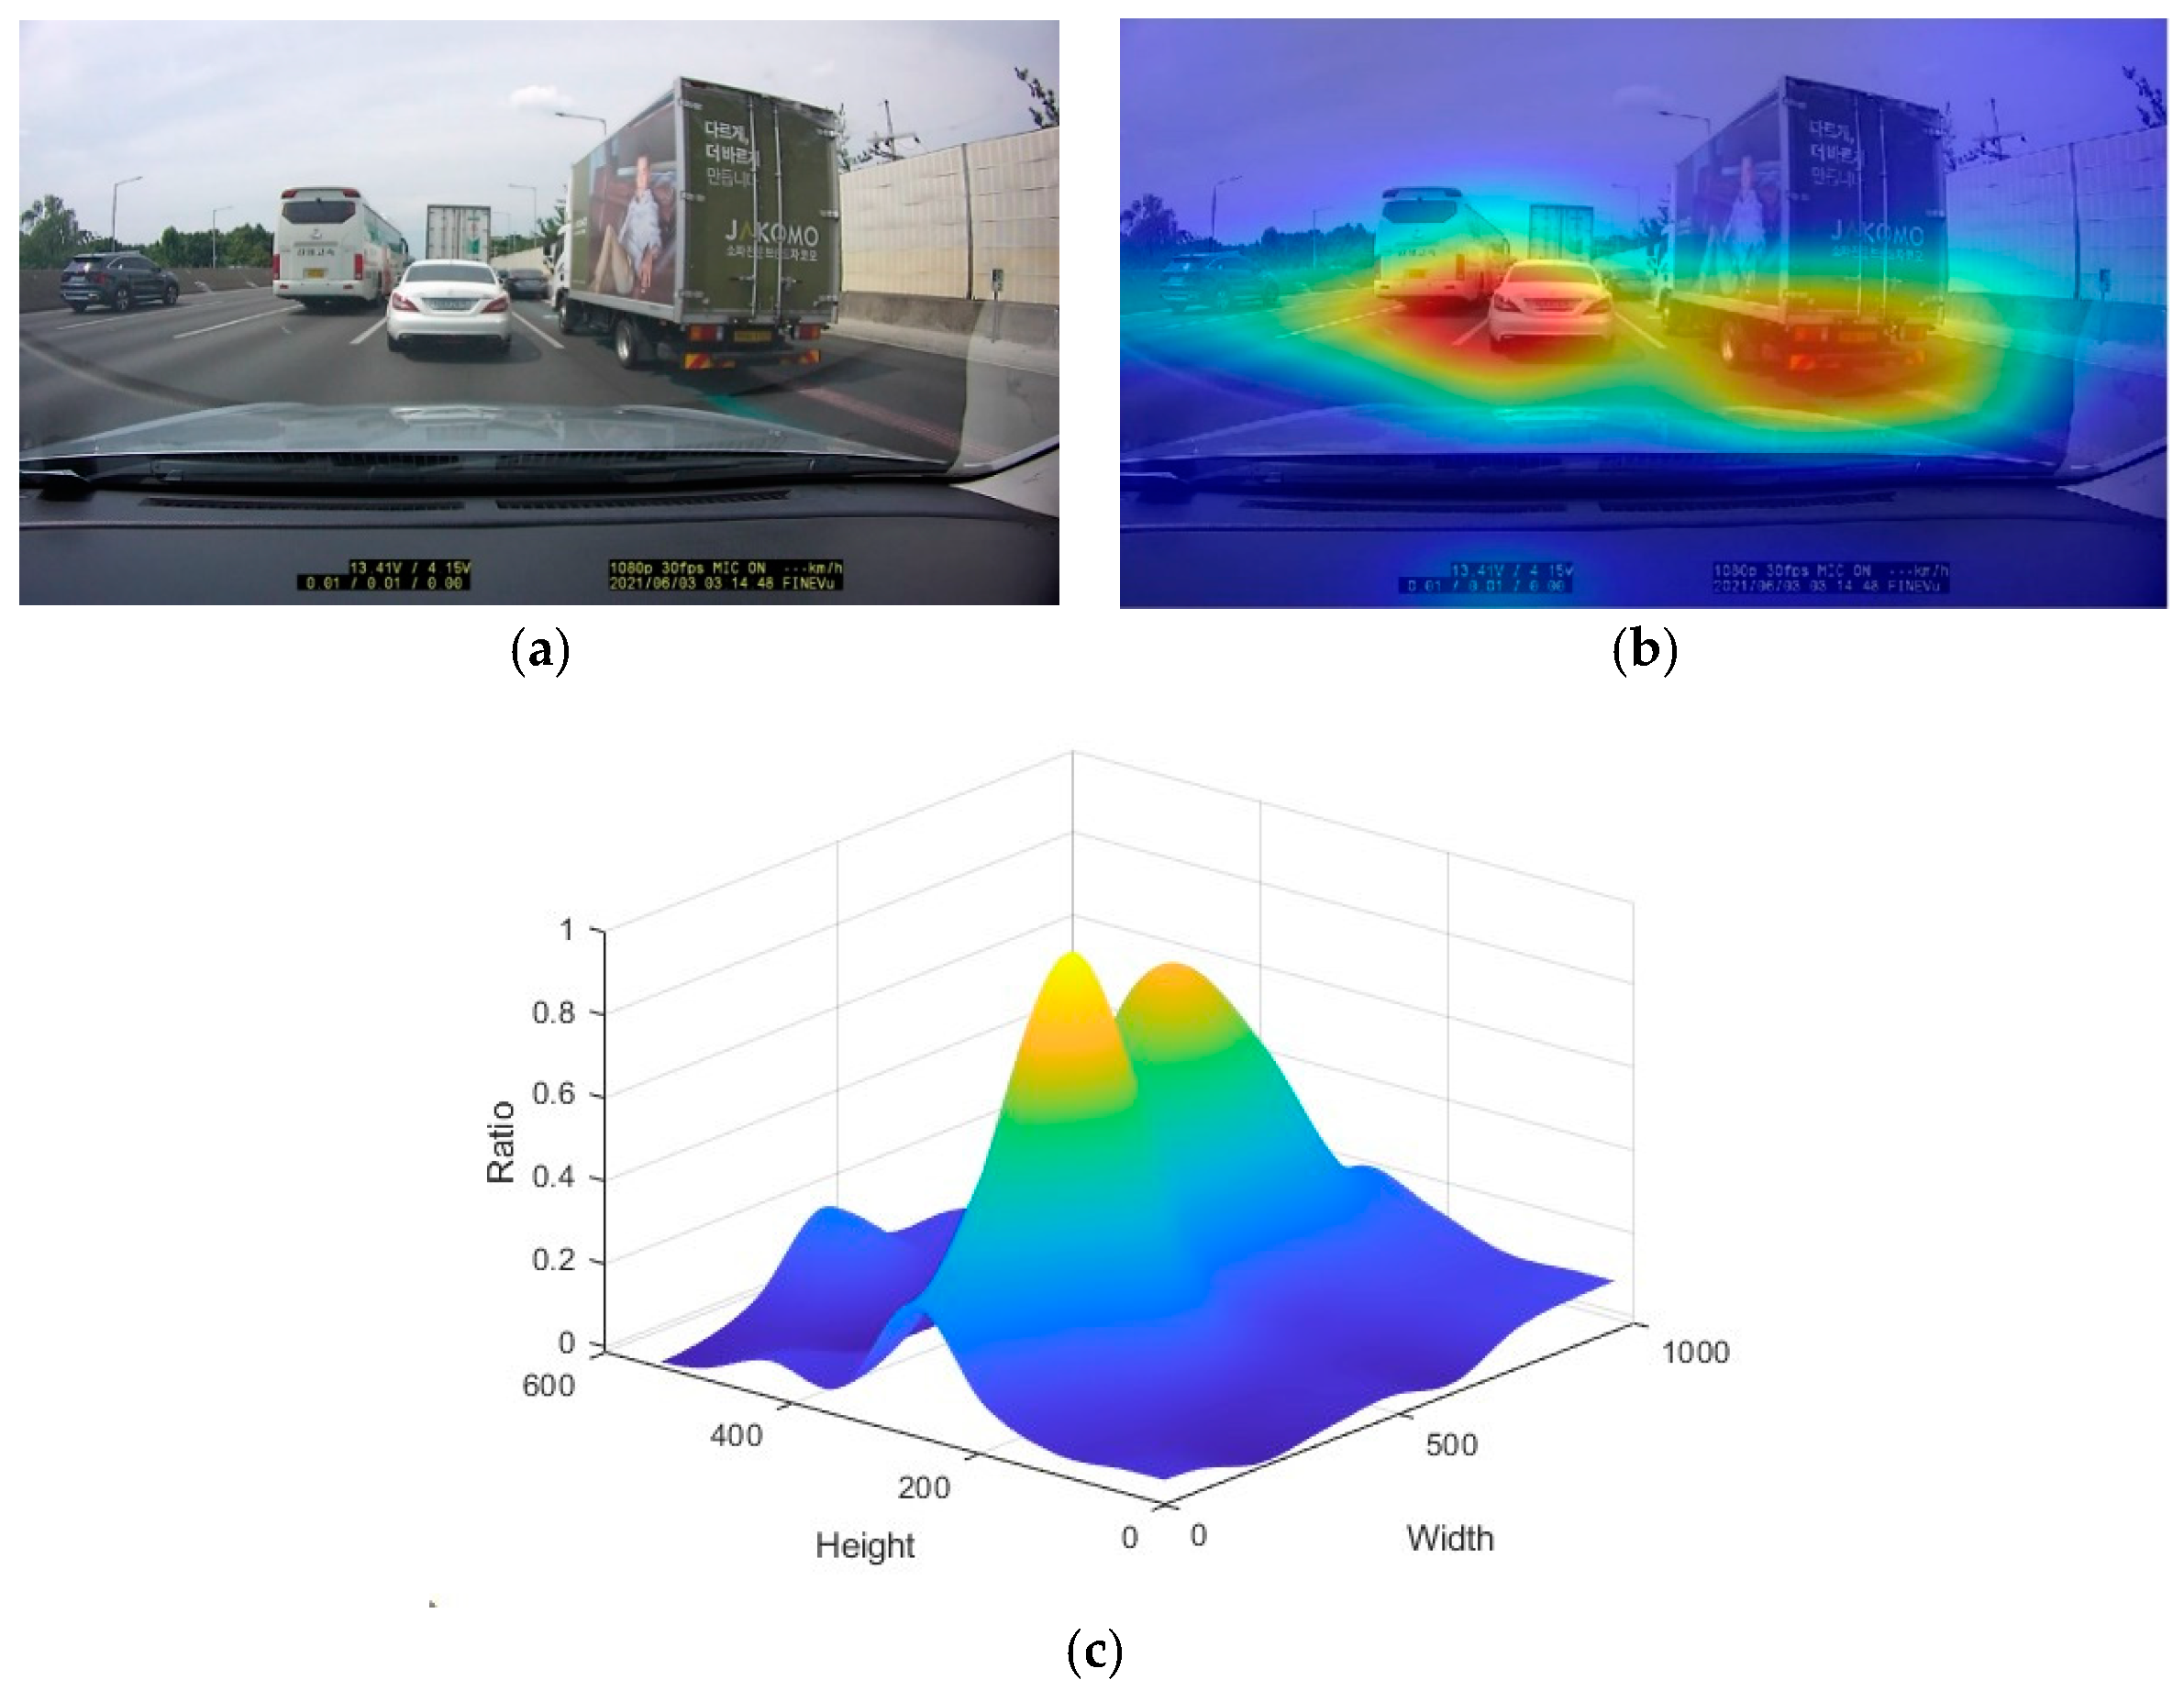
Figure 6 shows a visualization of the strongest activation channel in the 40th ReLU layer [14 × 14 × 1024]. Additionally,
Figure 6b shows the degree of positive activation in the regions where the vehicles are located in the input road image, indicating that the feature extraction layers are extracting more complex features. The activation_40_ReLU layer contains 1024 channels, and an image exists for each channel. However, the visualization results show that only the area containing the vehicle in the input road image is well activated, as confirmed by the channel with the strongest activation. An importance map was computed by taking the derivative of the reduction layer output for the vehicle class from the feature map extracted from the ResNet-50 network convolution layer in the road image shown in
Figure 6a. In
Figure 6b, the importance map shows the area containing the vehicle. The dark blue area represents the lowest probability of including the vehicle, while the dark red area represents the highest probability of including the vehicle. The road image shows that the outline and window of the vehicle have the greatest influence on the vehicle detection.
Figure 3 shows that feature maps are extracted from the input image and used as input in the Neck part. The SPP module in the Neck part extracts the most representative features from the input image by connecting the maximum pooling output of the low resolution feature map. The SPP module uses a kernel of sizes 1 × 1, 5 × 5, 9 × 9, and 13 × 13 for maximum pooling operations, with a stride value of 1. By connecting the feature maps, it is possible to detect small objects, thereby increasing the accuracy of object detection. The feature map connected in the SPP module is merged with the high-resolution feature map using the PAN. The PAN module combines low-level and high-level features using up-sampling and down-sampling operations [
8,
37] and outputs a feature map set for object detection prediction. The YOLO v4 network consists of three object detection Heads, each using a YOLO v3 network to compute the final prediction. The network produces feature maps of sizes 19 × 19, 38 × 38, and 76 × 76, and predicts both vehicle bounding boxes and classification scores.
2.4. Vehicle Type and Color Classification
In this step, the detected vehicle bounding boxes are continuously tracked across the input frames, while classifying their types and colors. To ensure accurate vehicle detection in the next frame, the position of the vehicle bounding box detected in the previous frame is predicted in the next frame using Kalman filtering, as applied in previous research [
4,
8]. A pre-trained Resnet-50 CNN is used to classify the type and color of the vehicle. A deep learning based classification network has been developed to categorize vehicles by types and colors. The network learns from labeled datasets and predicts the type and color of vehicles based on bounding boxes using a pre-trained model.
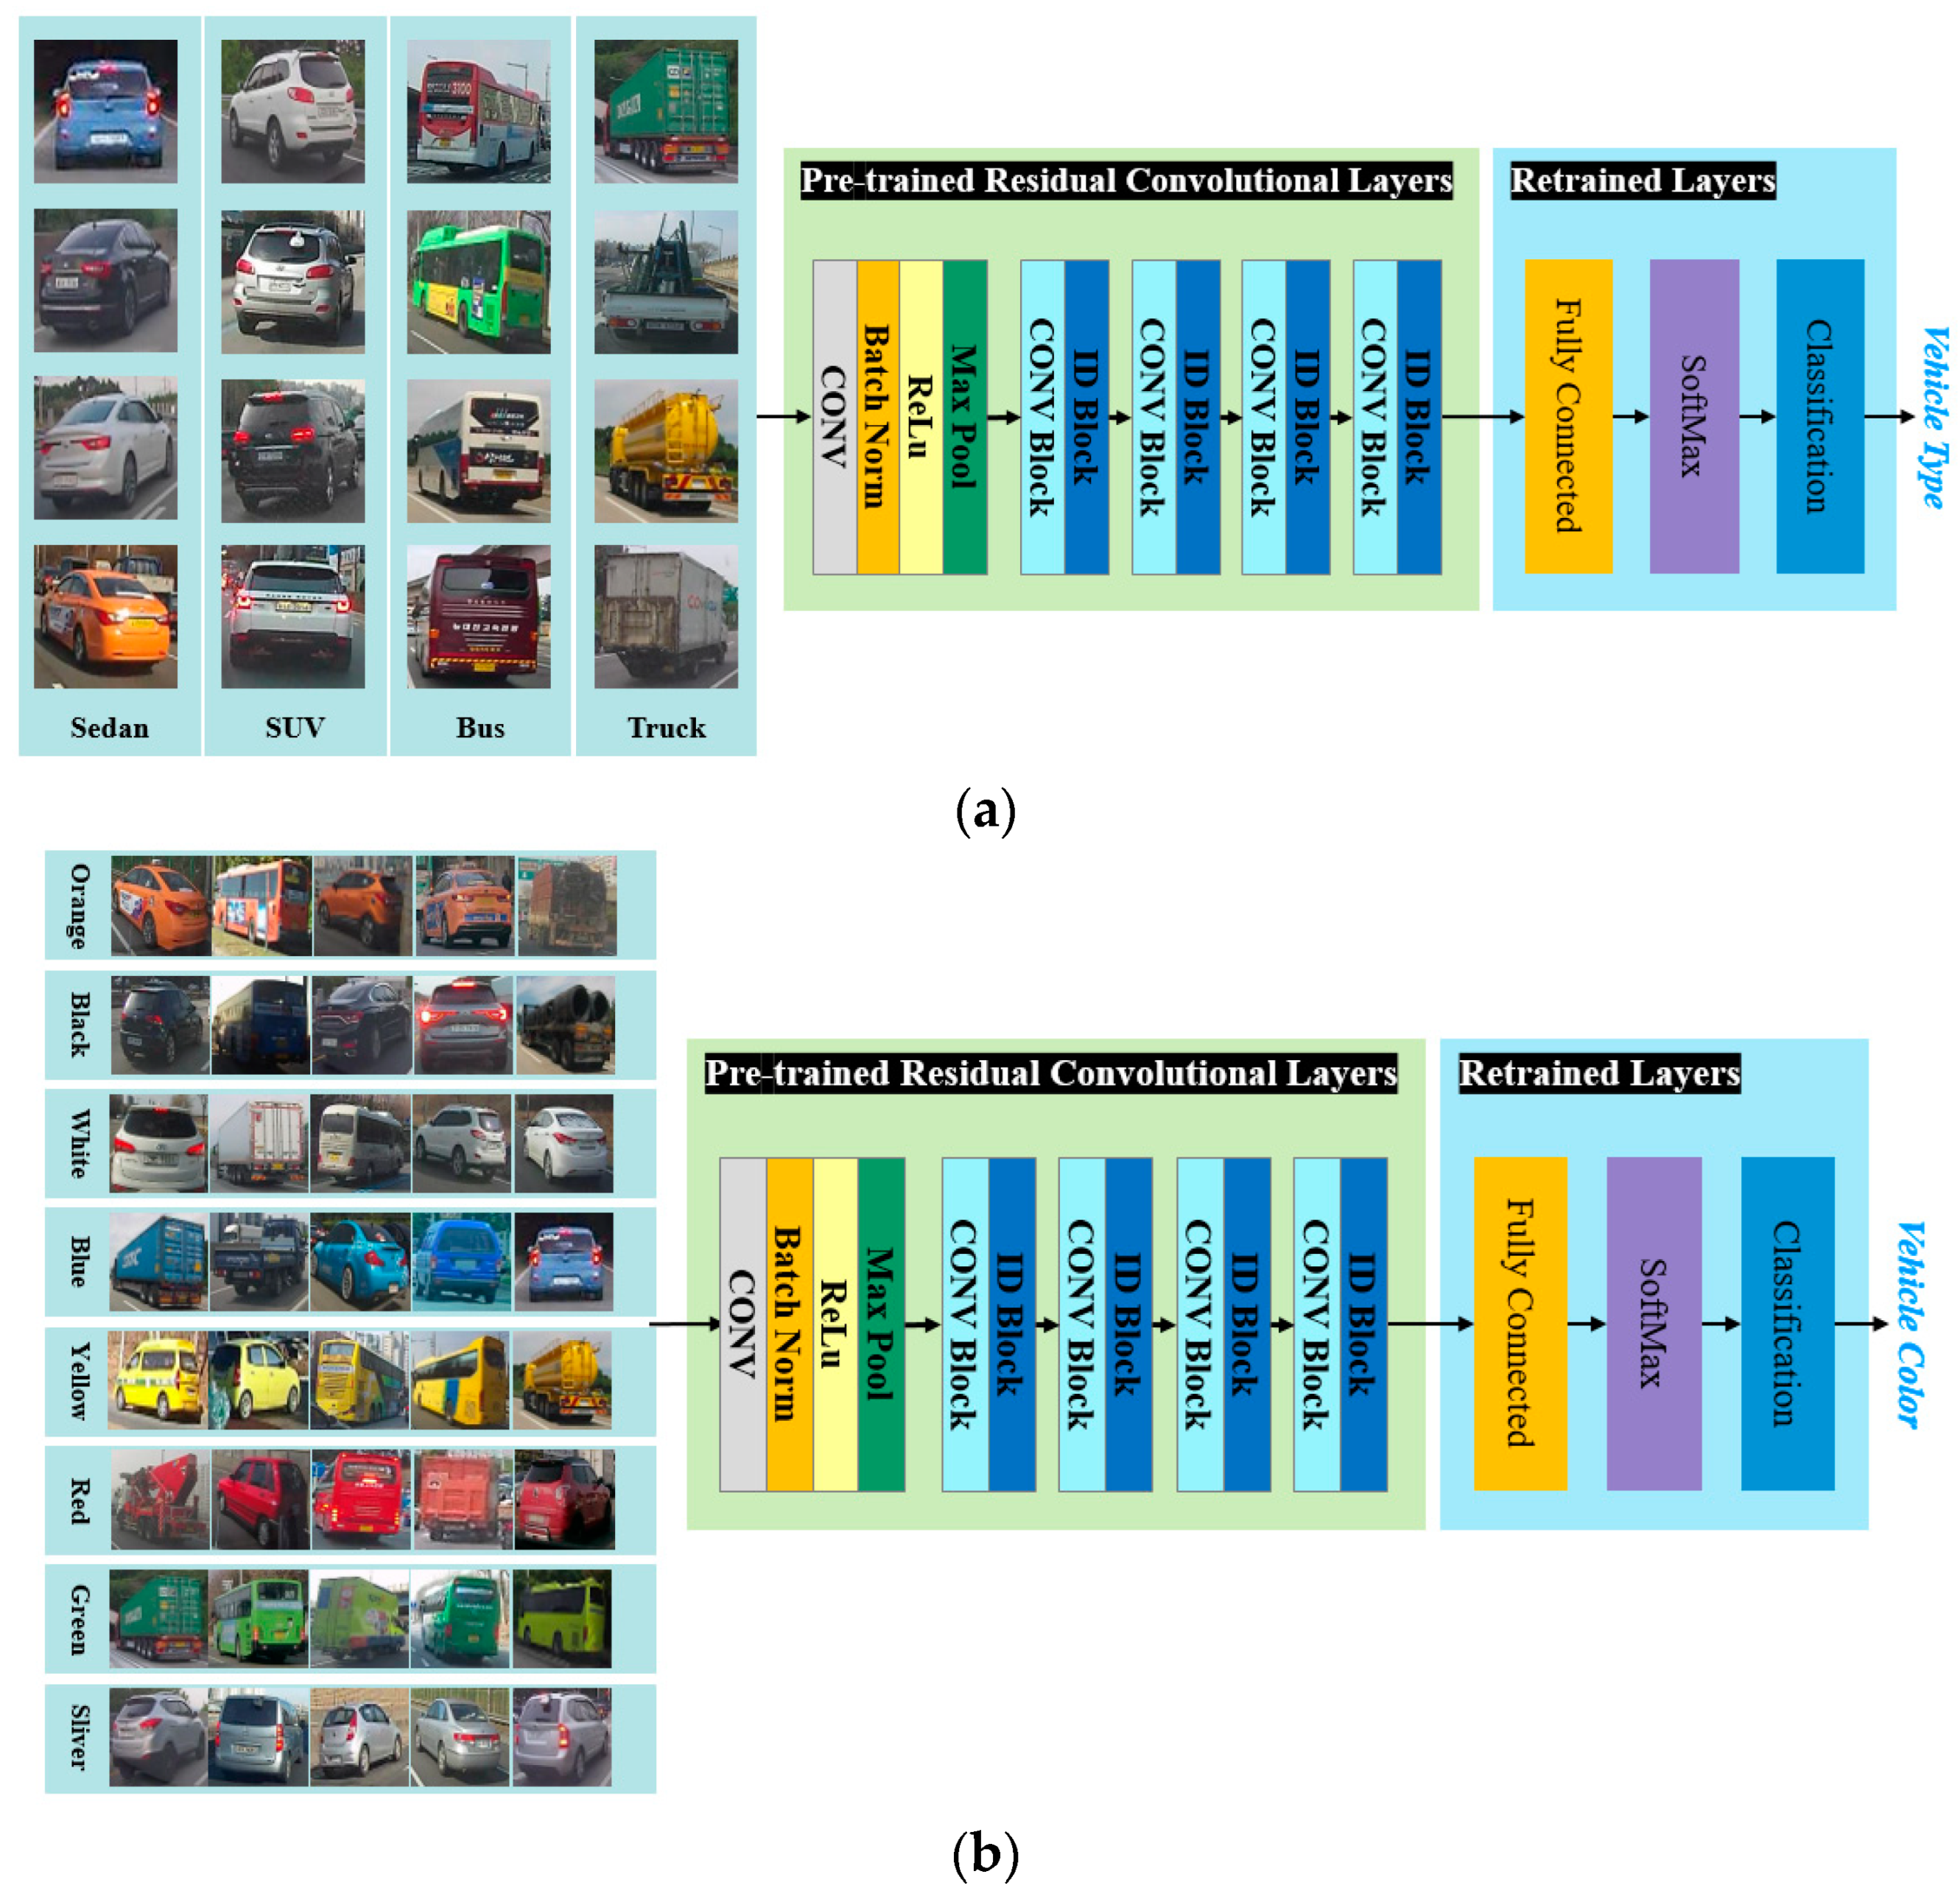
The proposed method uses the network shown in
Figure 7 for vehicle type and color classification. The pre-trained Resnet-50 CNN is used, and during the retraining step, the fully connected layer, softmax, and classification layer are modified to create a network that can classify into the respective class.
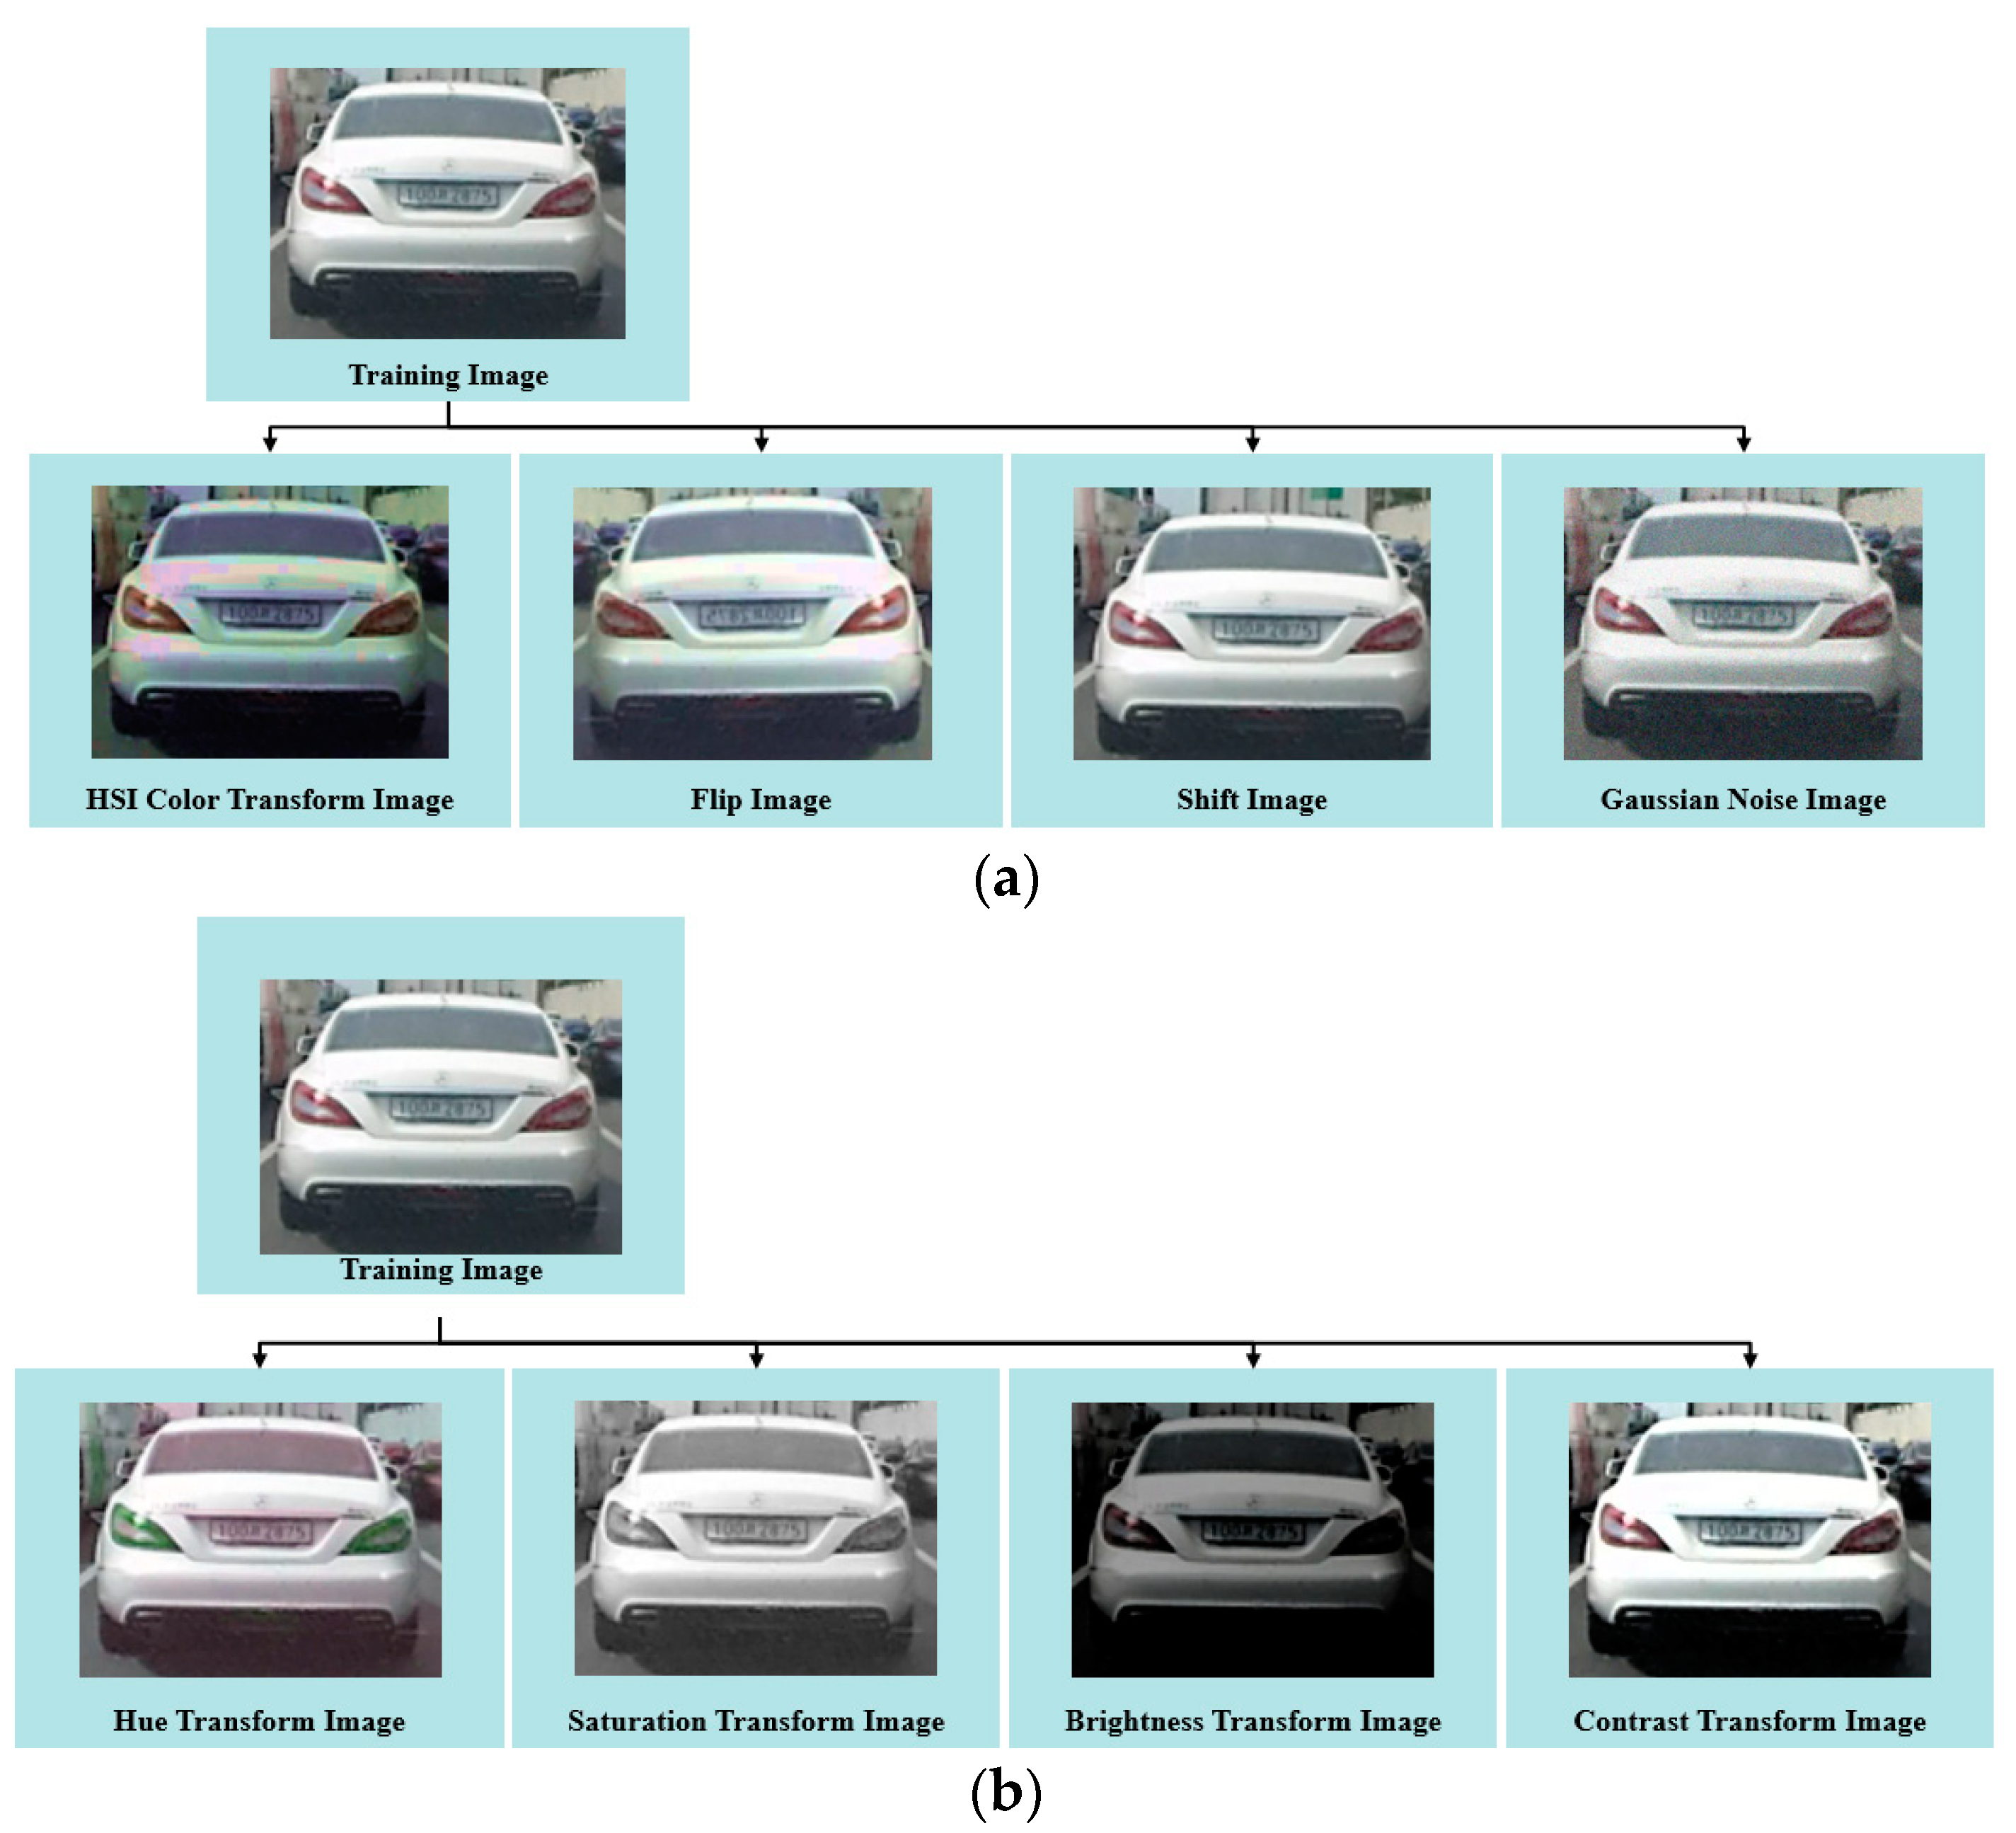
This paper presents a study on the classification of vehicle color and type using deep learning networks. Images of the rear of front-driving vehicles on highways and general roads were obtained from the vehicle’s DashCam camera. The learning dataset was classified into four classes: sedan, bus, truck, and SUV. Buses were defined as vehicles with more than 25 passengers, while trucks were defined as vehicles capable of carrying more than 1 ton of cargo. The objective of this paper is to determine the optimal lane for the presence of large buses and trucks in adjacent lanes during a lane change maneuver. Due to the challenge of obtaining a significant amount of training data for scenarios involving buses and trucks, a data augmentation process is performed to obtain additional learning data. This process aims to improve the model’s ability to generalize new and unseen data. The training data is randomly augmented with four variations to increase its diversity: HSI color change, horizontal flip, pixel movement, and addition of Gaussian noise, as shown in
Figure 8. The HSI color space normalizes hue, saturation, and brightness values to a range of [0, 1]. Augmented data is generated by using the hue value to 0.1, and the saturation and brightness values to 0.3.
Shift augmented data is generated by randomly shifting [
5,
10] pixels in four directions. Additionally, augmented data containing Gaussian white noise with a variance of 0.01 and a mean of 0 is also generated. The hue, saturation, brightness, and contrast values in the HSI color space of the detected vehicle bounding boxes are modified to generate augmented data. This augmented data is then used to train the color classification model. To generate augmented data for learning vehicle color classification, the HSI color space is first normalized to a range of [0, 1]. Next, the hue color space is then normalized to a range of [0.01, 0.6], the saturation color space to a range of [−0.4, −0.1], and the brightness space is normalized to a range of [−0.9, −0.1].
A random value is then selected from each of these ranges and used to augment the data. Additionally, contrast-enhanced data is generated by calculating the average brightness value (M) of the brightness (B) and then applying the formula (B-M) × scale + M. The value of the scale is randomly selected from the range [1.1, 3.9].
The dataset used to classify vehicle type and color was learned from images captured by DashCam cameras installed in moving vehicles in different road environments. Vehicle images obtained from various cameras, including the front, side, and rear, were used to train the color classifier. Ground truth labeling was used to label each vehicle region, type, and color.
3. Experimental Results
This paper presents a method for detecting vehicles and classifying their types and colors using images captured while driving on highways and city roads in Korea. The road images were acquired using a DashCam camera installed in the vehicle. The acquired images were HD-level, 24-bit color frames with a resolution of 1920 × 1080 pixels, and were obtained at a rate of 15 frames per second. The proposed method was tested on a Windows 10 operating system with a 3.2 GHz processor (16 cores up to 5.2 GHz, 30 MB cache, 24 threads), a 4090 GPU (24 GB), 128 GB RAM, 4 TB SSD, and Matlab. The vehicle detection model was trained on 32,500 images, while 156,000 vehicle images were used to train the vehicle color classification model.
This study aims to improve the reliability of autonomous driving services by selecting and changing driving lanes for optimal lane changes with driving autonomous vehicle. Furthermore, vehicle types and colors are used in the vehicle detection and tracking process. Experiments were conducted on vehicle detection, vehicle type classification, and vehicle color classification in road images. In the vehicle detection step, the pre-trained Resnet-50 CNN extracts features from the input images and detects vehicles using the YOLO v4 deep learning neural network. To classify vehicle types and colors, neural network classifiers were trained by modifying the fully connected, softmax, and classification layers of the pre-trained Resnet-50 CNN to set the optimal network hyperparameters and training options. The Resnet-50 CNN is a neural network designed to classify 1000 classes. For the proposed vehicle type and color classification, the fully connected layer of the Resnet-50 CNN was replaced with a new fully connected layer. The number of output values in the new layer was determined by the number of vehicle types and colors to be classified.
3.1. Evaluation of Vehicle Detection Accuracy According to Hyperparameters and Training Options
To evaluate the performance of the proposed method, the training dataset was divided into 60%, 10%, and 30% for training, validation, and testing, respectively, and the size of the input image was normalized to 224 × 224. Experiments were conducted to determine the obtain optimal training options and neural network hyperparameters for the YOLO v4 DNN learning process for vehicle detection, as shown in
Table 1. To order to select the optimal parameters for training a deep learning NN, training was performed by setting the NN solver was to {Stochastic Gradient Descent with Momentum (SGDM) [
38], Adaptive Moment Estimation (Adam) function [
39], Root Mean Square Propagation (RMSProp) function [
40], the initial learning rate to {0.00001, 0.0001, 0.001}, the mini-batch size to {32, 64, 128}, and the epochs to 30.
Among the NN training options, the experiment was conducted with Reset Input Normalization set to false, Batch Normalization Statistics set to moving, and Execution Environment set to GPU for the hardware resource to be used for NN training. The values of Weight Learn Rate Factor and Bias Learn Rate Factor of the fully connected layer were both set to 10 to allow faster learning in the new layer than in the transferred layer of the ResNet-50 CNN.
Table 1 shows only the top 10 experimental scenarios with the highest average vehicle detection accuracy out of a total of 27 scenarios.
Table 1 shows that the NN learning solver used the RMSProp optimization function, resulting in the highest accuracy for vehicle detection, and the Square Gradient Decay Factor was set to 0.9. The initial learning rate used for NN training was 0.0001, and the maximum number of epochs trained was 30. The mini-batch size used for each training iteration was set to 32 to achieve the highest vehicle detection accuracy and the lowest detection failure rate.
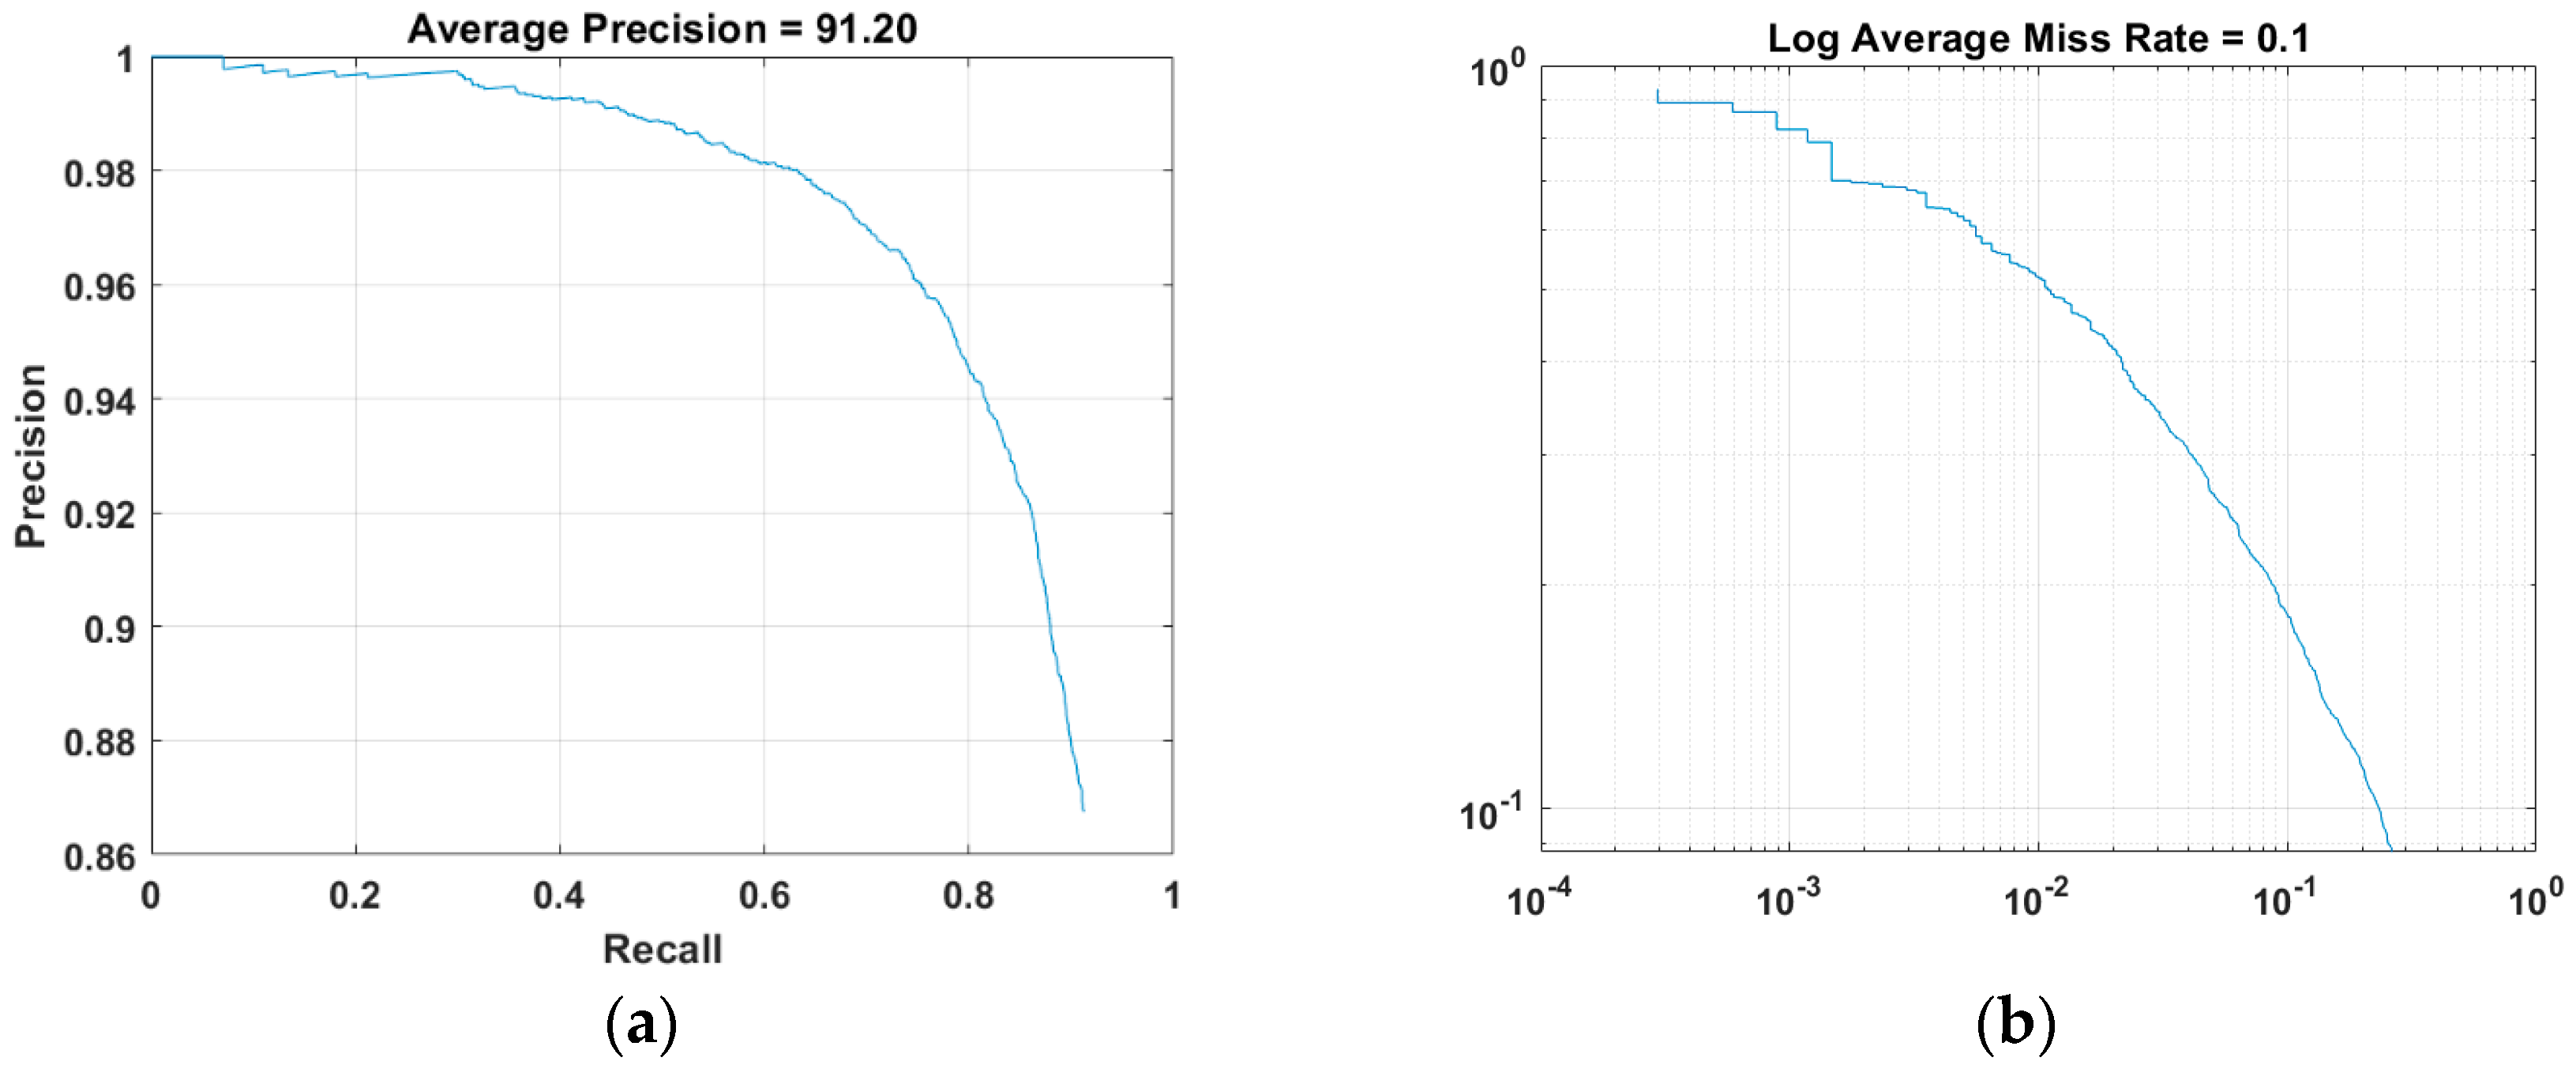
Figure 9 shows the Precision-Recall (PR) curve, which represents the average accuracy of the vehicle detection results in road images, and the log miss rate-false positives image (FPPI)-based log error rate from the vehicle detector generated using the optimal learning parameters for vehicle detection. Precision refers to the ability of the vehicle detector to perform the correct classification (Precision = TP/(TP + FP)), and Recall refers to the ability to identify all related objects (Recall = TP/(TP + FN)). The PR curve shows the precision of the vehicle detector at various recall levels. Ideally, the precision should be 1 at all recall levels. Increasing the size of the training dataset can improve the average precision, but this approach has limitations that require additional training time.
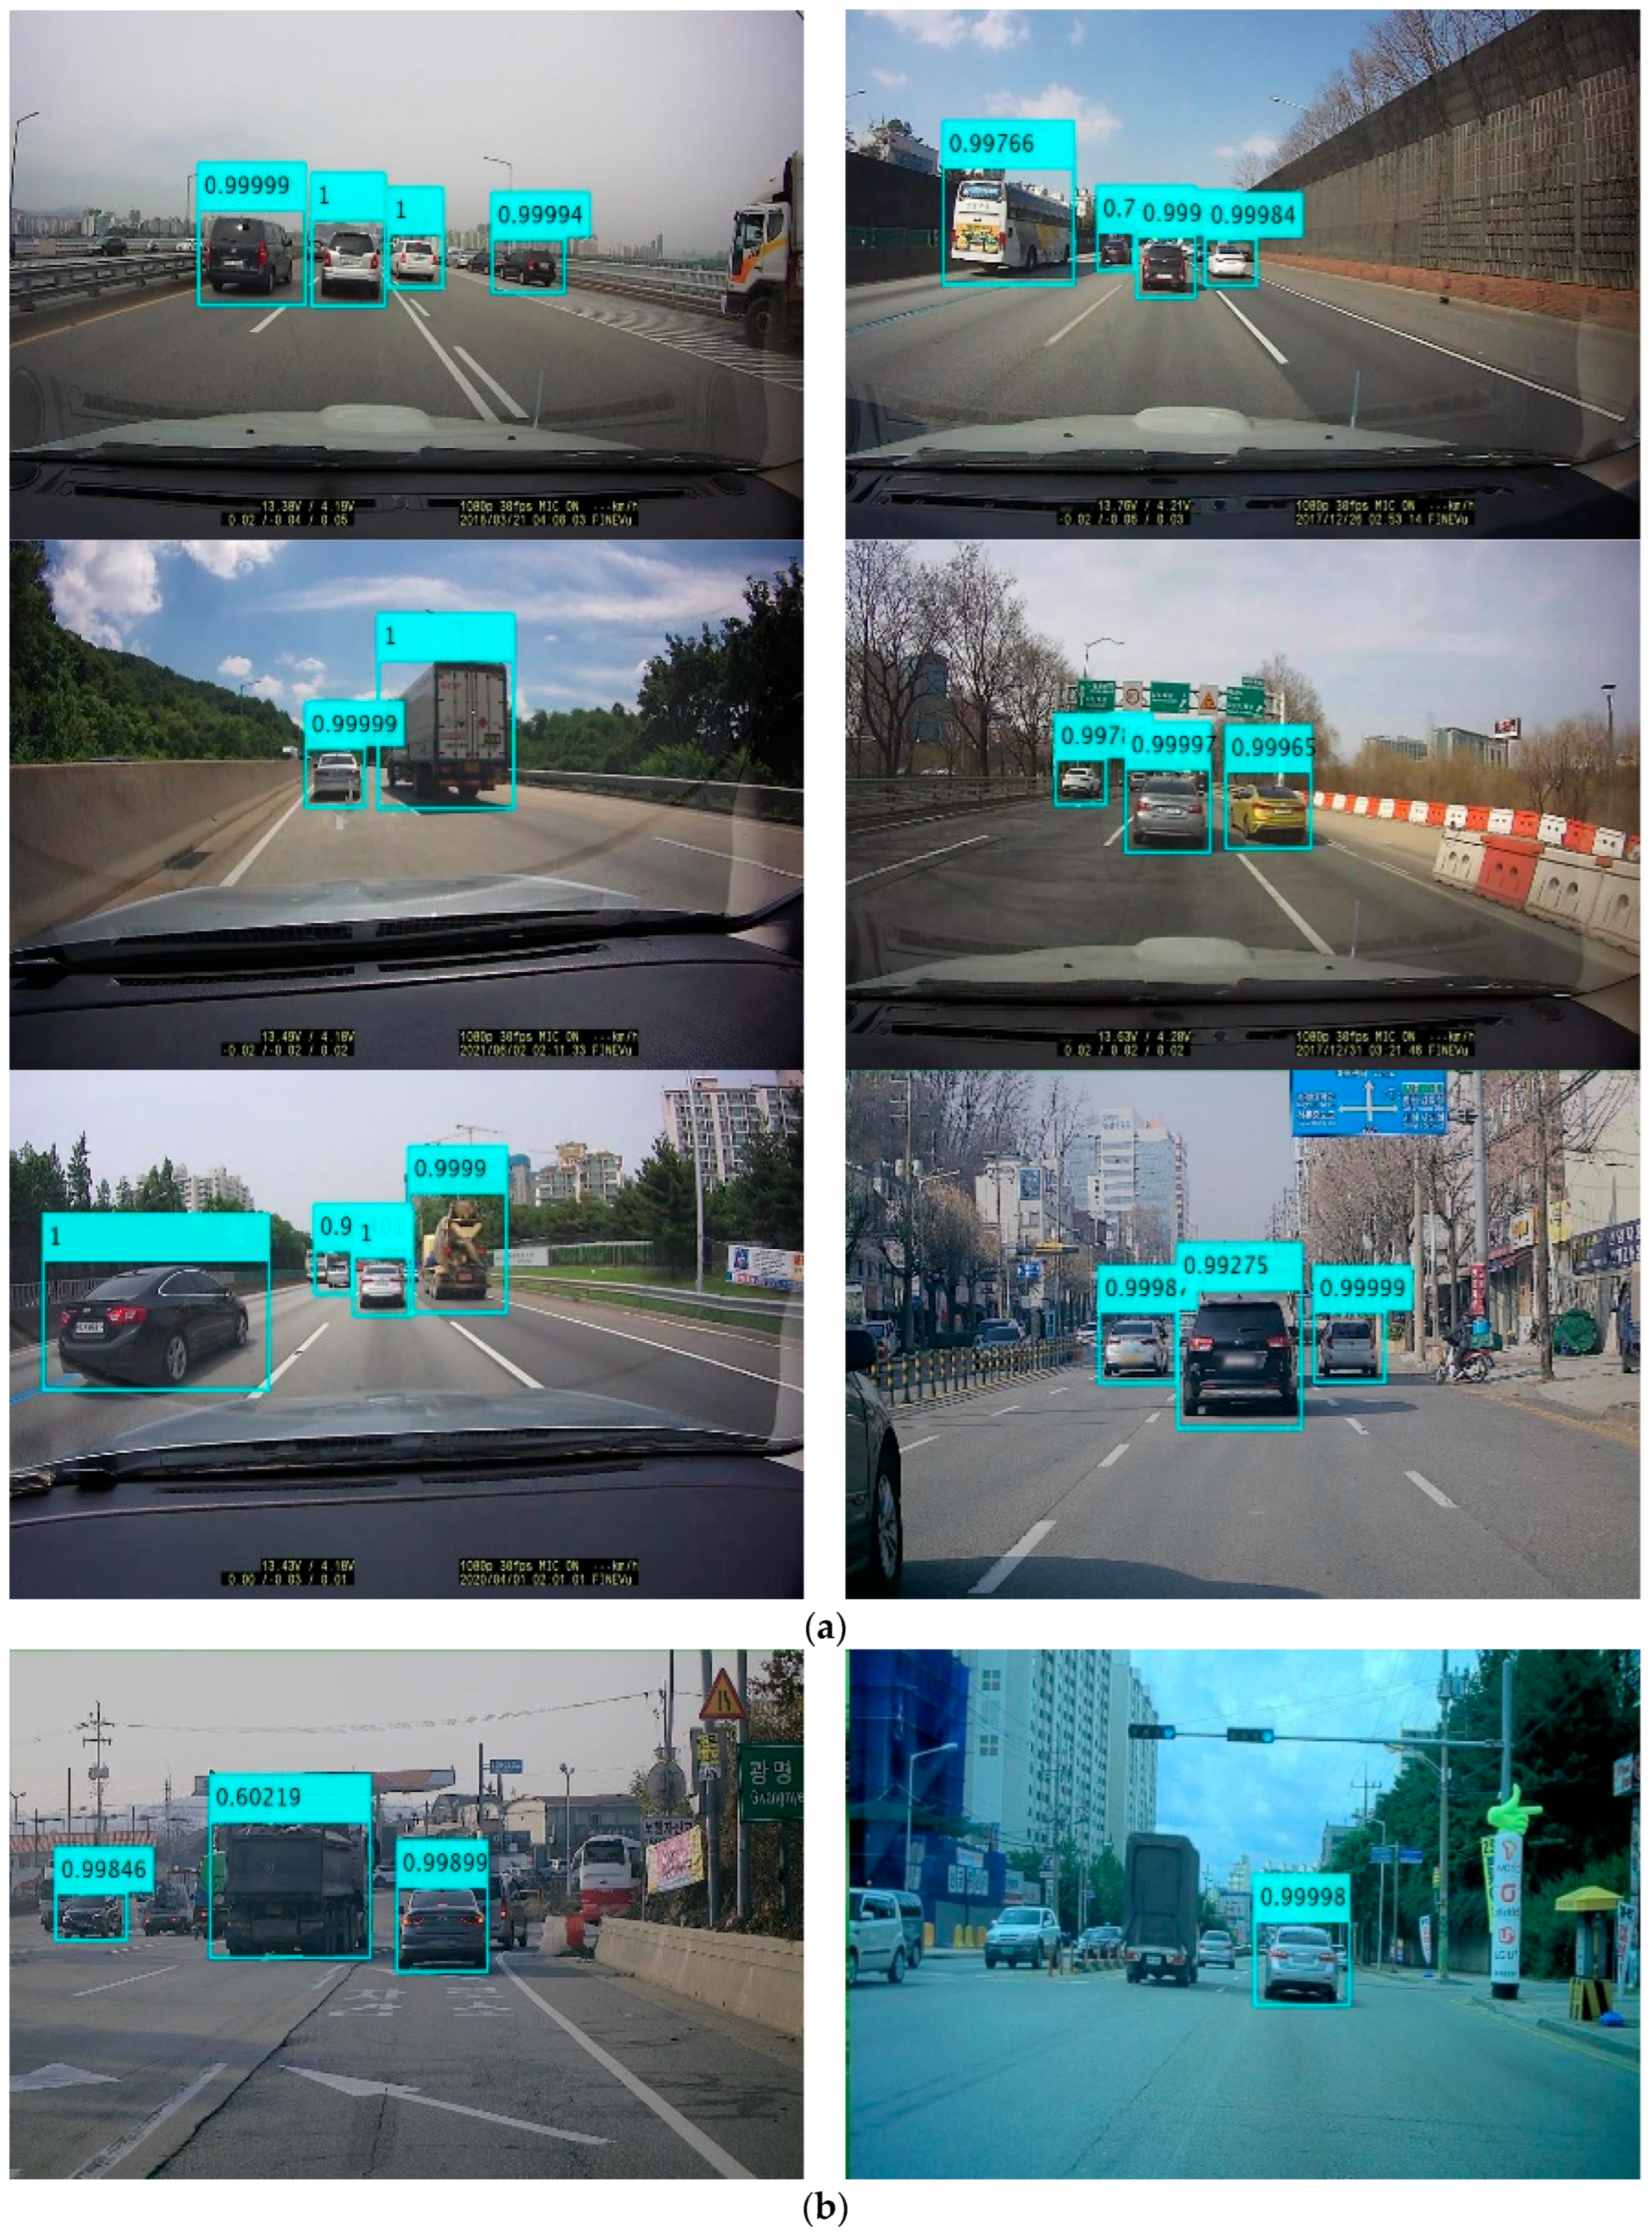
Figure 10 shows the result of detecting a vehicle in front in a road image with the vehicle detector with the highest average detection accuracy (AP) among different hyper-parameters. The experiment resulted in an average vehicle detection rate of 91%. During the experiment, errors in vehicle detection occurred due to misidentification of the vehicle in the opposite lane. To address this issue, the proposed method focuses on detecting the rear area of the moving vehicle instead of the front area, which improves the accuracy of vehicle detection.
Figure 10b shows that the vehicle was incorrectly detected because the front area of the vehicle was not detected or overlapped, resulting in a relatively low vehicle detection accuracy.
Figure 10a shows the real-time detection of the rear areas of a moving vehicle from various road images. This information can be used as a basis for optimal lane change in autonomous vehicles. The accuracy of vehicle detection in driving images from different roads was compared, and it was found that applying the pre-processing step before vehicle detection improved accuracy by at least 0.7%. Applying the pre-processing step increased the additional processing time increased by an average of 0.3 s. However, this did not affect real-time processing. The pre-processing step improved vehicle detection accuracy when images were acquired on roads with limited forward visibility due to environmental factors such as fog or cloudy weather. Therefore, the time-consuming processing can be offset by the increase in hardware processing speed, improving the safety of autonomous vehicles.
3.2. Evaluation of Vehicle Detection Accuracy by Applying Transfer Learning Networks
Table 2 shows a performance comparison table of the vehicle detection results obtained using various transfer learning networks. The vehicle detector was trained by extracting features from the activation layers of the base network on the detection Head part of the YOLO v4 structure. To extract features from the input image, specific feature extraction layers configured in the base network were added to the YOLO v4 detection head. The pre-trained deep learning network used as the base network applies transfer learning to the YOLO v4 vehicle detector for feature extraction performance. To compare vehicle detection accuracy, the experiment was conducted using various transfer learning networks including SqueezNet, GoogLeNet, Resnet-18, Resnet-50, and MobilNet-v2 [
41]. The vehicle detector was trained using the RMSProp optimization function with a learning rate that was reduced by 0.2 every 5 epochs. The maximum number of training epochs was set to 30, with a mini-batch size of 64 for each iteration. The initial learning rate used for training was 0.0001. The transfer learning NN of the YOLO v4 network extracts features from the input image by selecting the activated layer from the last convolution layer and the first convolution layer, where the size of the input vector is reduced by half.
Table 2 presents the experimental results, which show that the activation layers of the Resnet-50 CNN transfer learning network, used as the feature extraction layer in the Head part of the YOLO v4 vehicle detector network structure, achieved the highest vehicle detection accuracy. When comparing the accuracy of vehicle detection using different transfer learning neural networks, it is more effective to use a transfer learning NN for feature extraction and then fine-tune the NN weights through learning, rather than training with randomly initialized weights. This is because features can be quickly transferred to new tasks using fewer training images. This paper extracted features using pre-trained activation layers of the ResNet-50 CNN and detected vehicles using the YOLO v4 deep learning neural network.
To verify that the bounding boxes detected in the vehicle detection step contain actual vehicles, if the similarity between the detected bounding box and the template generated from the vehicle regions labeled by the ground truth method in the learning step is greater than 0.5. If it is, the bounding box is considered to contain the vehicle.
The proposed method resulted in an average vehicle detection rate of 91.5%. The low vehicle detection performance is due to the fact that the front area of a vehicle driving on the opposite lane on the highway is detected as a vehicle. This paper only learned to detect the rear area of a driving vehicle, resulting in a low average vehicle detection rate. However, the detection results of over 94% on average were presented in the rear area of the vehicle.
3.3. Evaluation of Vehicle Type and Color Classification Accuracy
The bounding box for the detected vehicle was trained using the Resnet-50 CNN for vehicle type and color classification. Augmented data was generated from training images using various methods for vehicle type and color classification. The ResNet-50 CNN, a trained model, is designed to classify 1000 different objects. To classify vehicle type and color, the last fully connected layer, softmax layer, and classification layer of the Resnet-50 CNN were removed, and a new output layer was connected.
For the transfer learning of the vehicle type classification, the output size of the new fully connected layer was set to 4, which is the vehicle type to be classified, the Weigh Learning Rate Factor for the weight was 10, the Bias Learn Rate Factor for the bias was 10, and the learning rate factor for the bias was 10, and the L2 normalization factor for the bias has been was set to 1. To generate the augmented data, random changes were applied to the x- and y-axes. Rotation is in the range of −10 to 10 degrees, scaling is in the range of 0.5 to 1.5, and horizontal and vertical pixel movement is in the range of −5 to 5. Color changes were made randomly within 10% of the Hue, Saturation, and Intensity values in the HSI color space.
The dataset used to train the vehicle type classifier consists of 26,125 images, whereas the dataset used to train the vehicle color classifier consists of 115,356 images. The dataset for vehicle classification uses only the rear parts of the vehicle while driving. The dataset for vehicle color classification, however, uses various images, including the front, side, and rear parts of the vehicle, acquired under different illumination conditions to improve color classification accuracy. The total learning dataset was divided into a training dataset (60%), a verification dataset (10%), and a test dataset (30%).
Figure 7 shows the training dataset used for vehicle type and color classification.
Table 3 presents the results of the accuracy experiments for various learning parameters used in the vehicle type and color classifier. To select optimal learning parameters for the classification accuracy experiments, the proposed method generates a set of options for training neural networks using Stochastic Gradient Descent with SGDM Momentum, Adam optimization function and RMSProp optimization function. The learning rate was reduced by a factor of 0.2 every 5 epochs. The maximum number of epochs is 30. The mini-batch size used for each training iteration was either 64 or 128. The initial learning rates for training were set to 0.0001 and 0.00001. Experiments on vehicle type classifiers indicate that the optimal training option was to create a set of options to train the neural network using the Adam optimization function, use a mini-batch with 64 observations for each iteration, and set the initial learning rate to 0.0001.
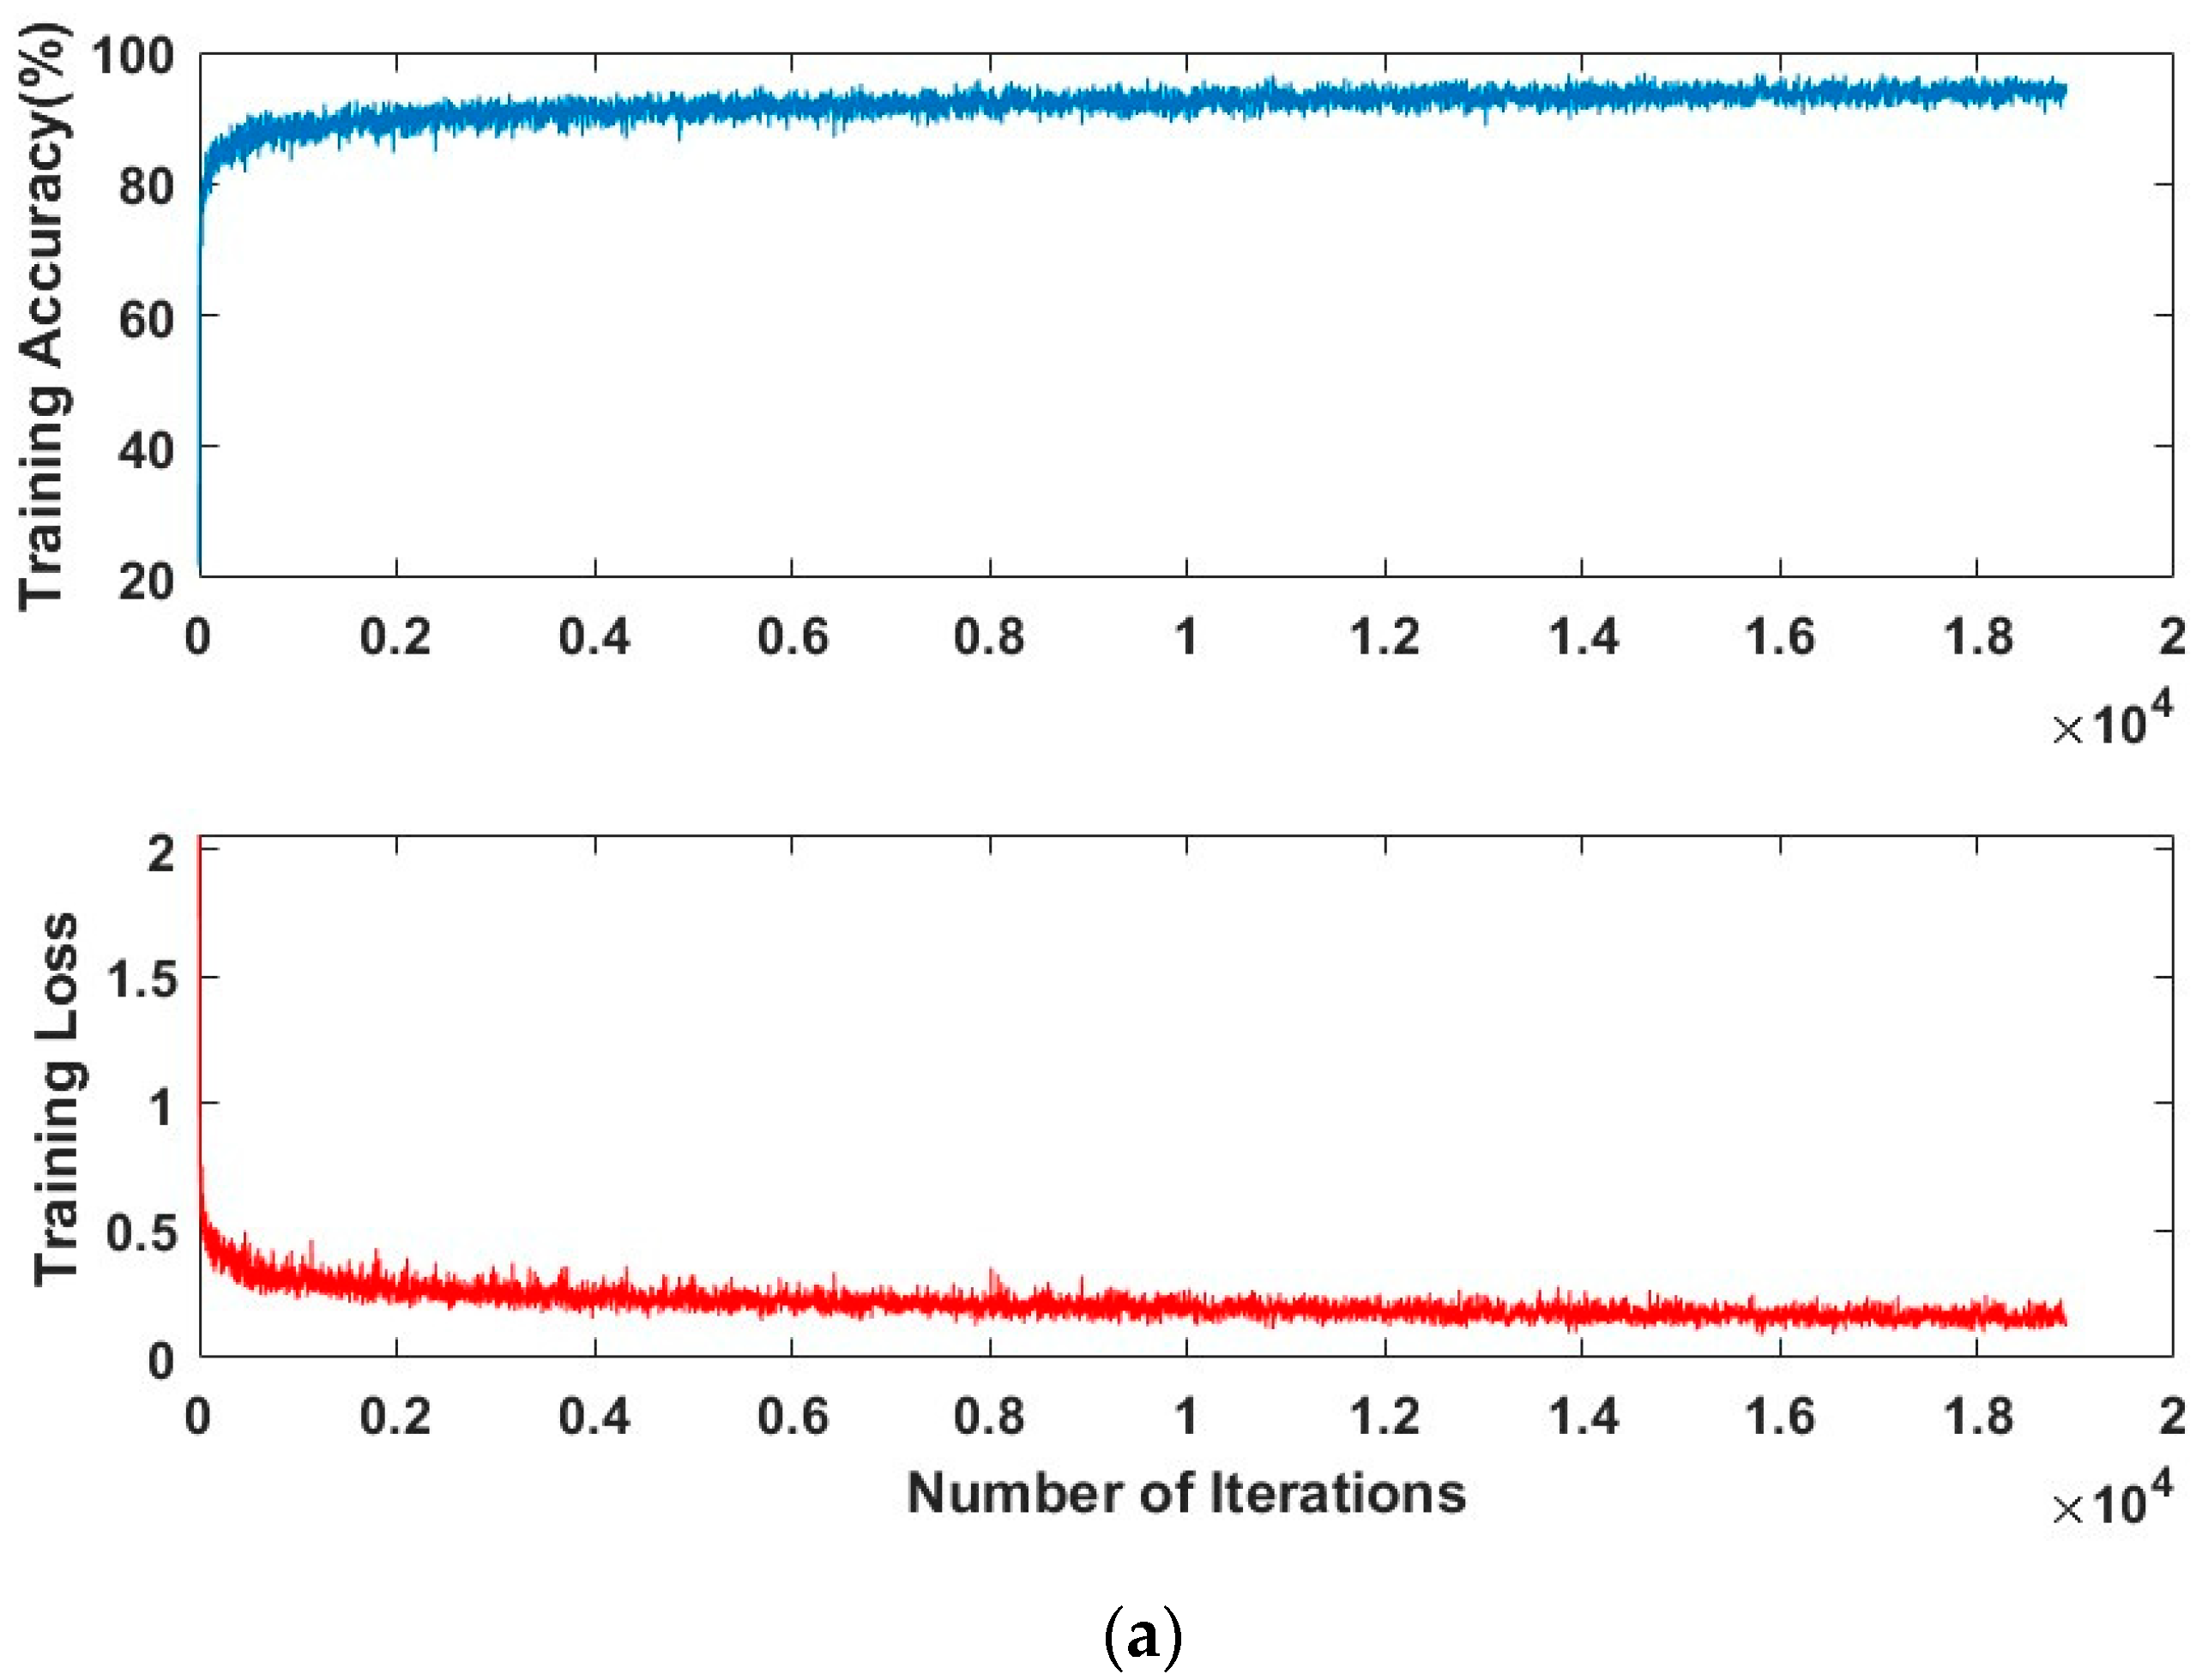
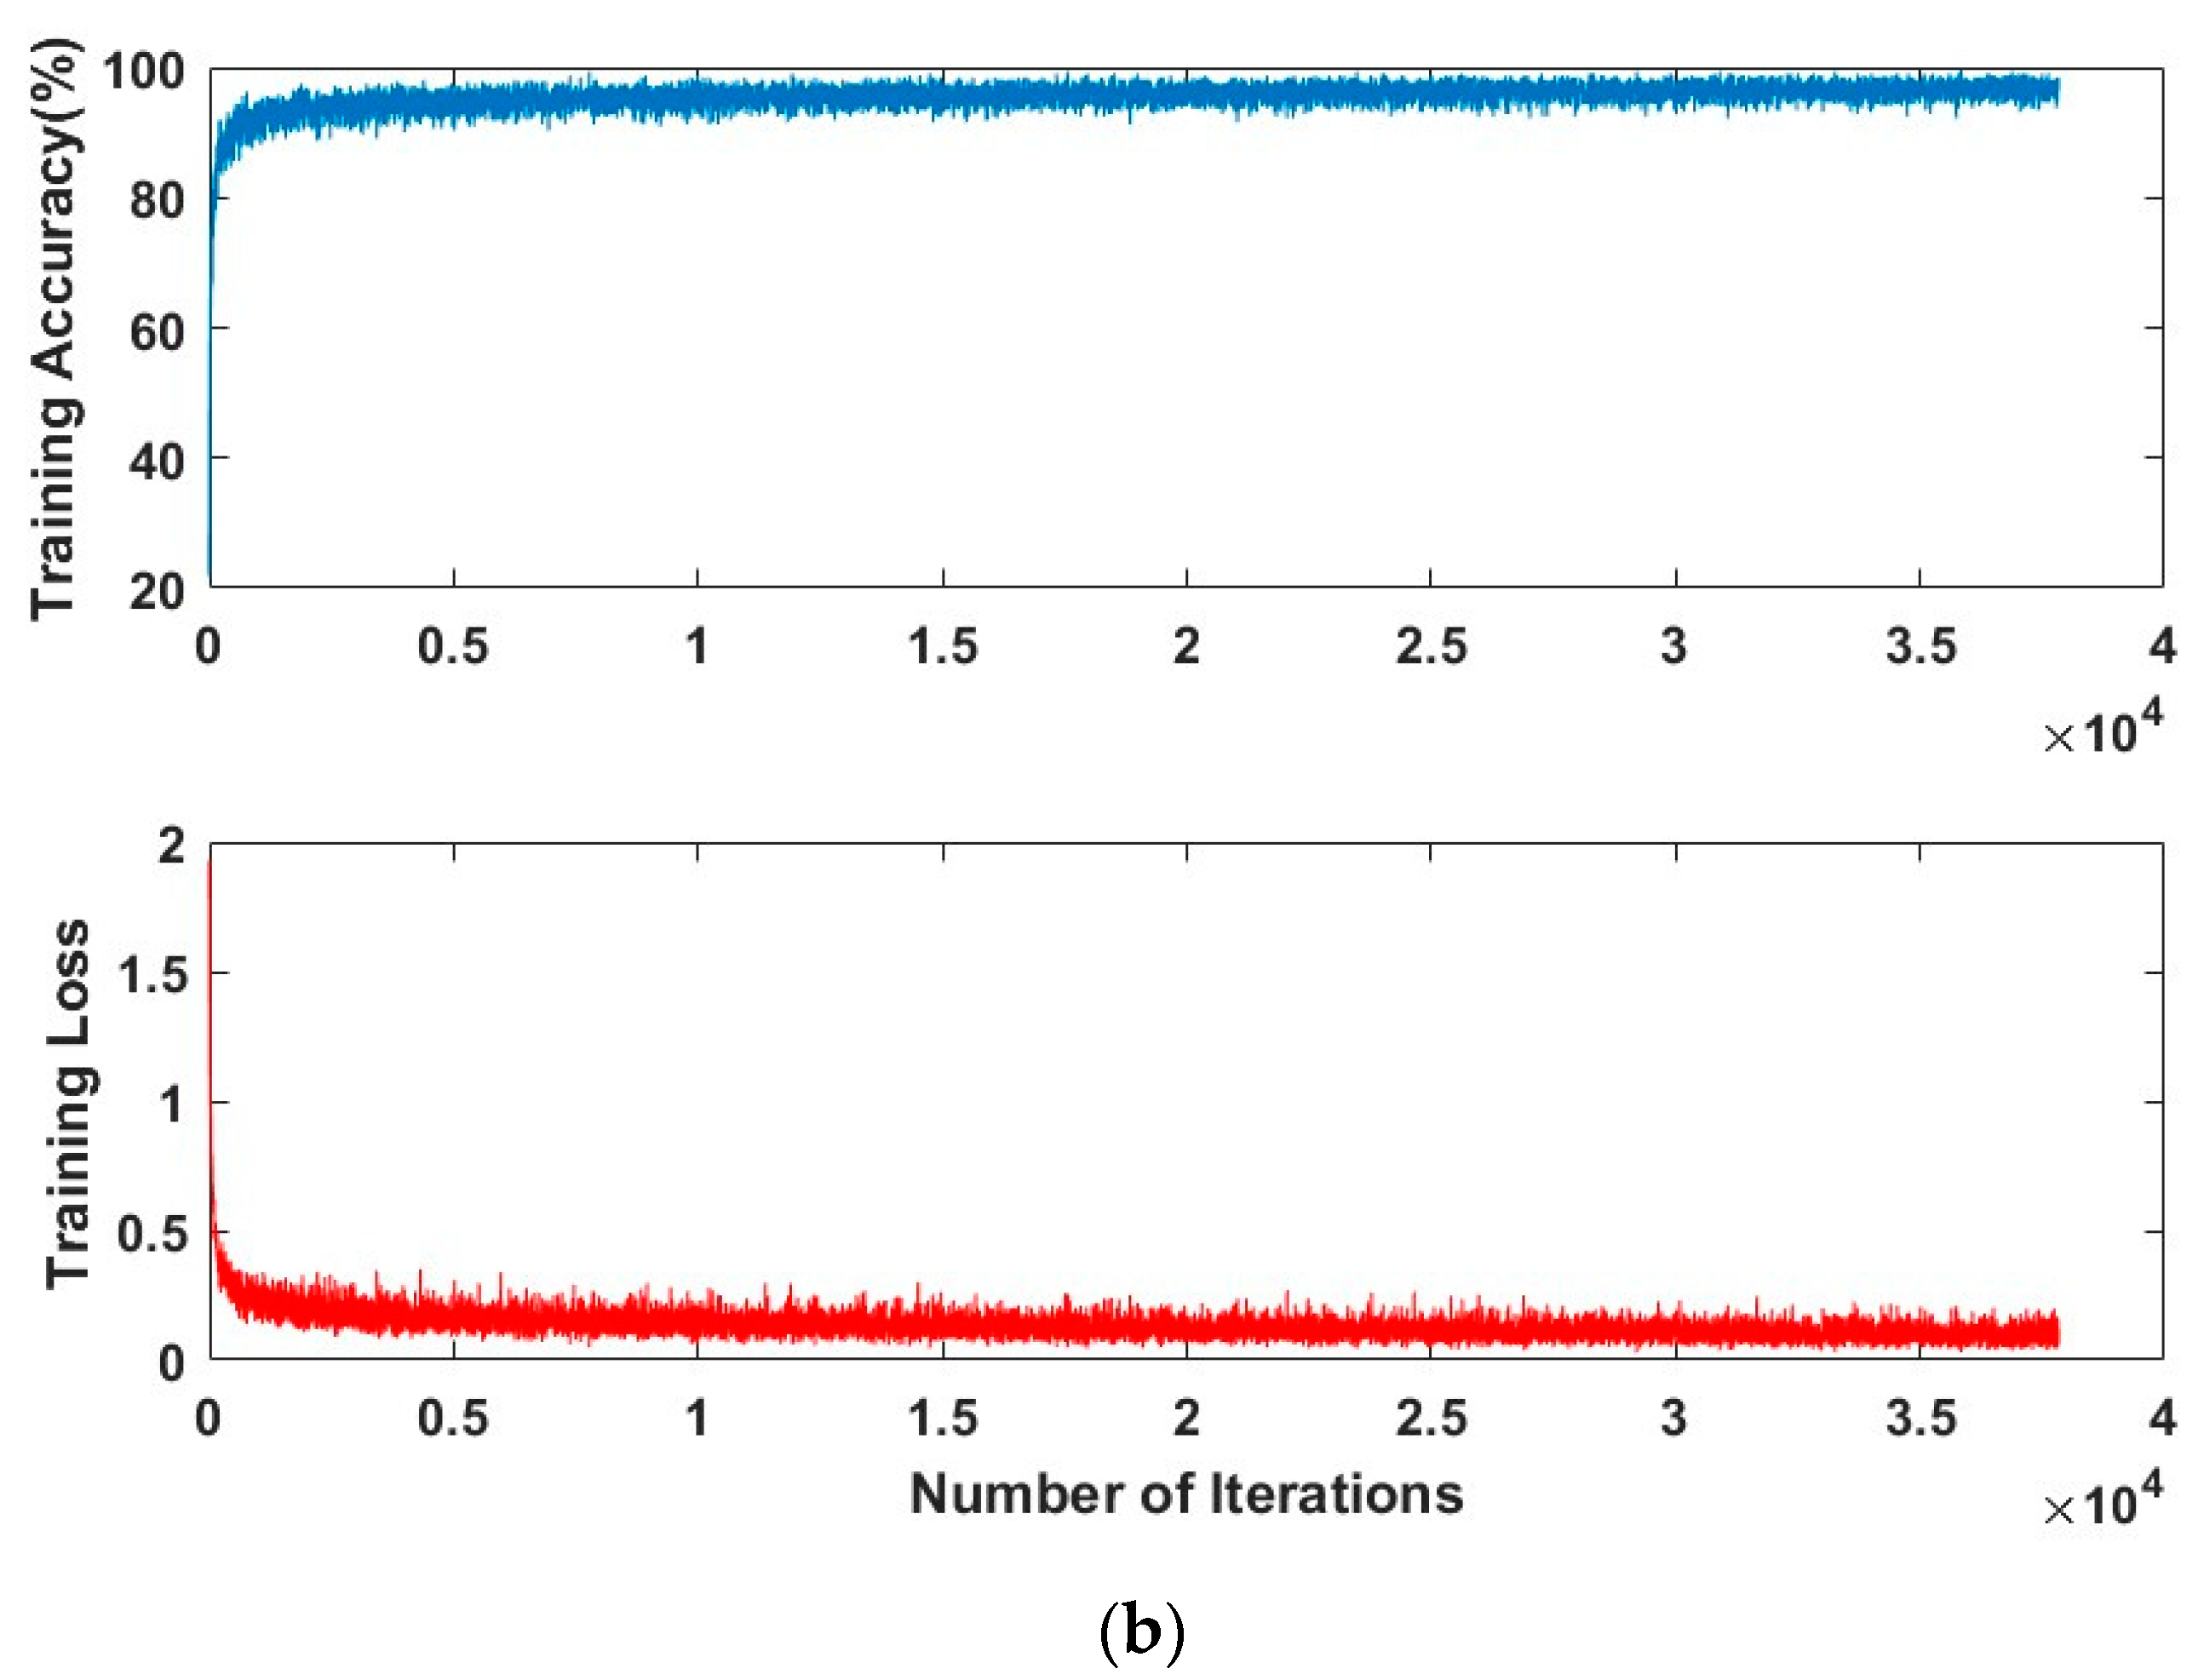
Table 3 presents the results of the vehicle type classifier experiment. Among the training options used, the sixth training set {Solver = Adam optimization function, initial learning rate = 0.00001, internal batch size = 64} and the ninth training set {Solver = RMSProp optimization function, initial learning rate = 0.0001, internal batch size = 30} resulted in the same accuracy. However, the ninth training set required the shortest learning time. Experiments conducted on vehicle color classifiers suggest that the optimal training option is to create a set of options to train the neural network using the RMSProp optimization function, use a minibatch with 64 observations for each iteration, and set the initial learning rate to 0.00001. The training progress of the classifier using the optimal NN hyperparameters and training options is shown in
Figure 11.
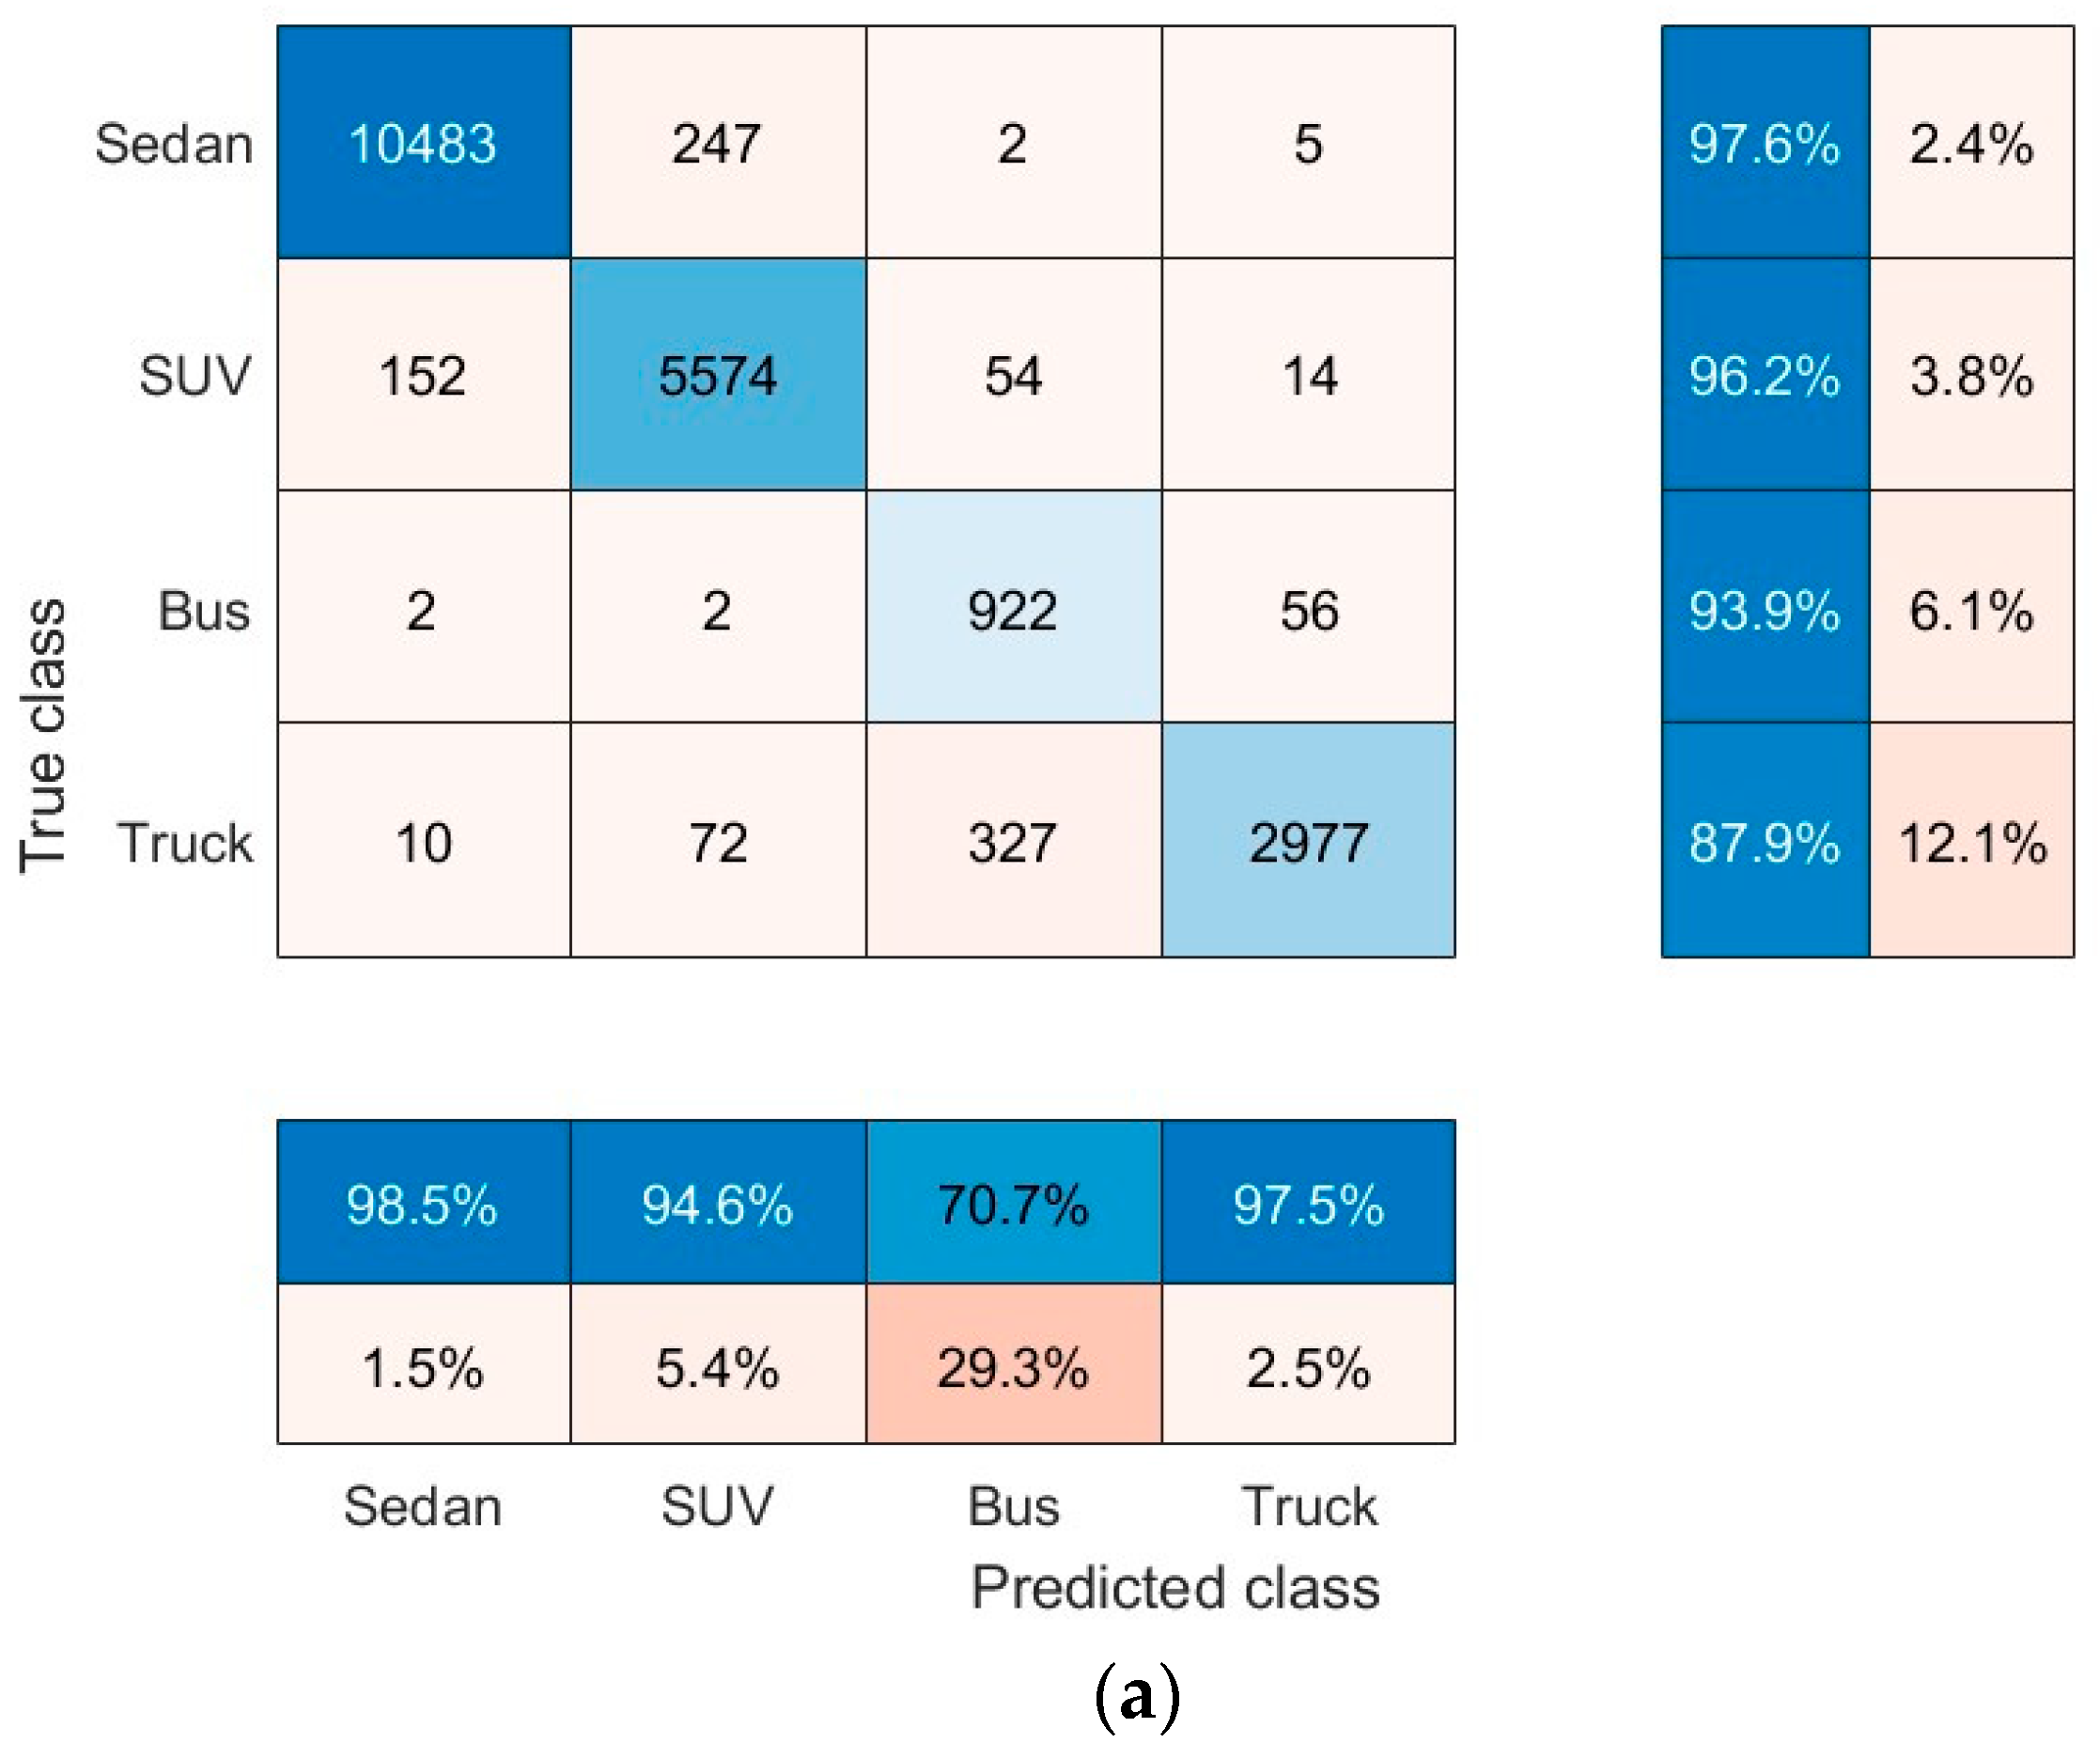
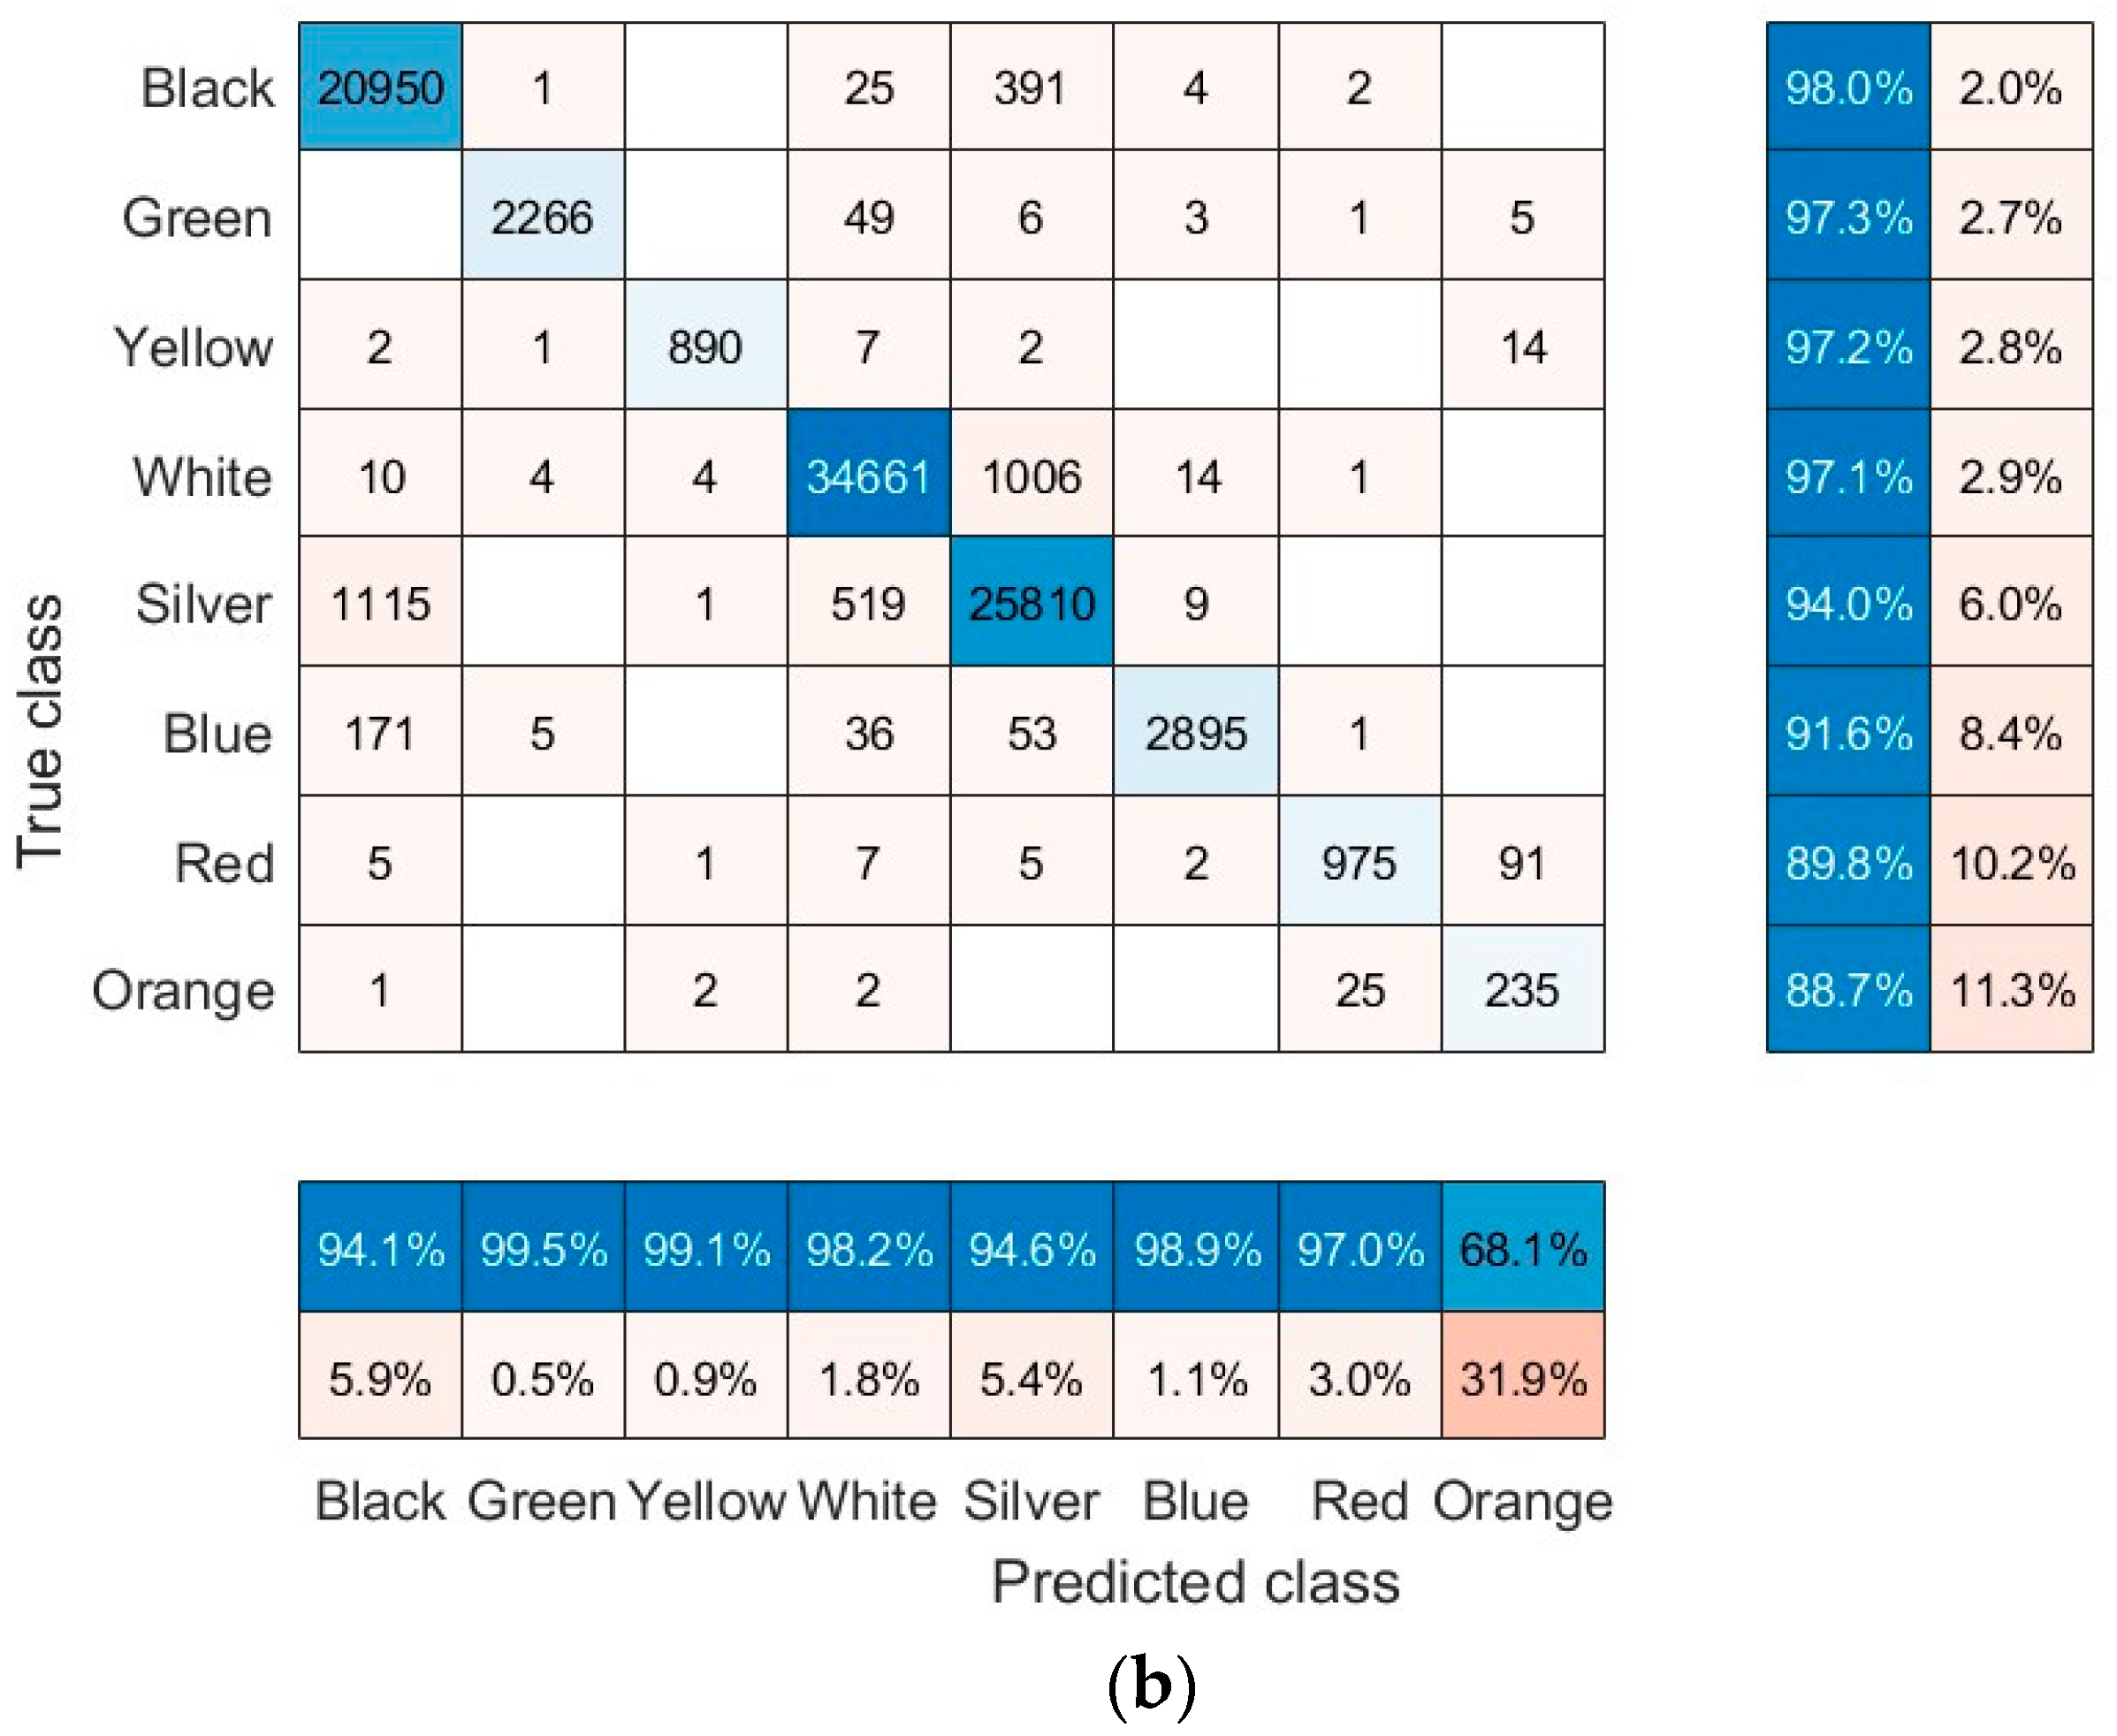
Figure 12 shows the confusion matrix for the vehicle type and color classifier, calculated for both the training and validation sets. The matrix shows the accuracy of classification by vehicle type and color class. The normalized column summary in
Figure 12 shows the percentage of correctly and incorrectly classified observations for each predicted class relative to the total number of observations in the predicted class. The normalized row summary shows the percentages of accurately and inaccurately classified observations for each actual class. Experiments show that vehicle type classifiers encounter the most difficulty distinguishing between buses and trucks, whereas vehicle color classifiers struggle the most, distinguishing between orange and red. The experiment resulted in a 93.9% accuracy rate for vehicle type classification and a 94.2% accuracy rate for vehicle color classification.
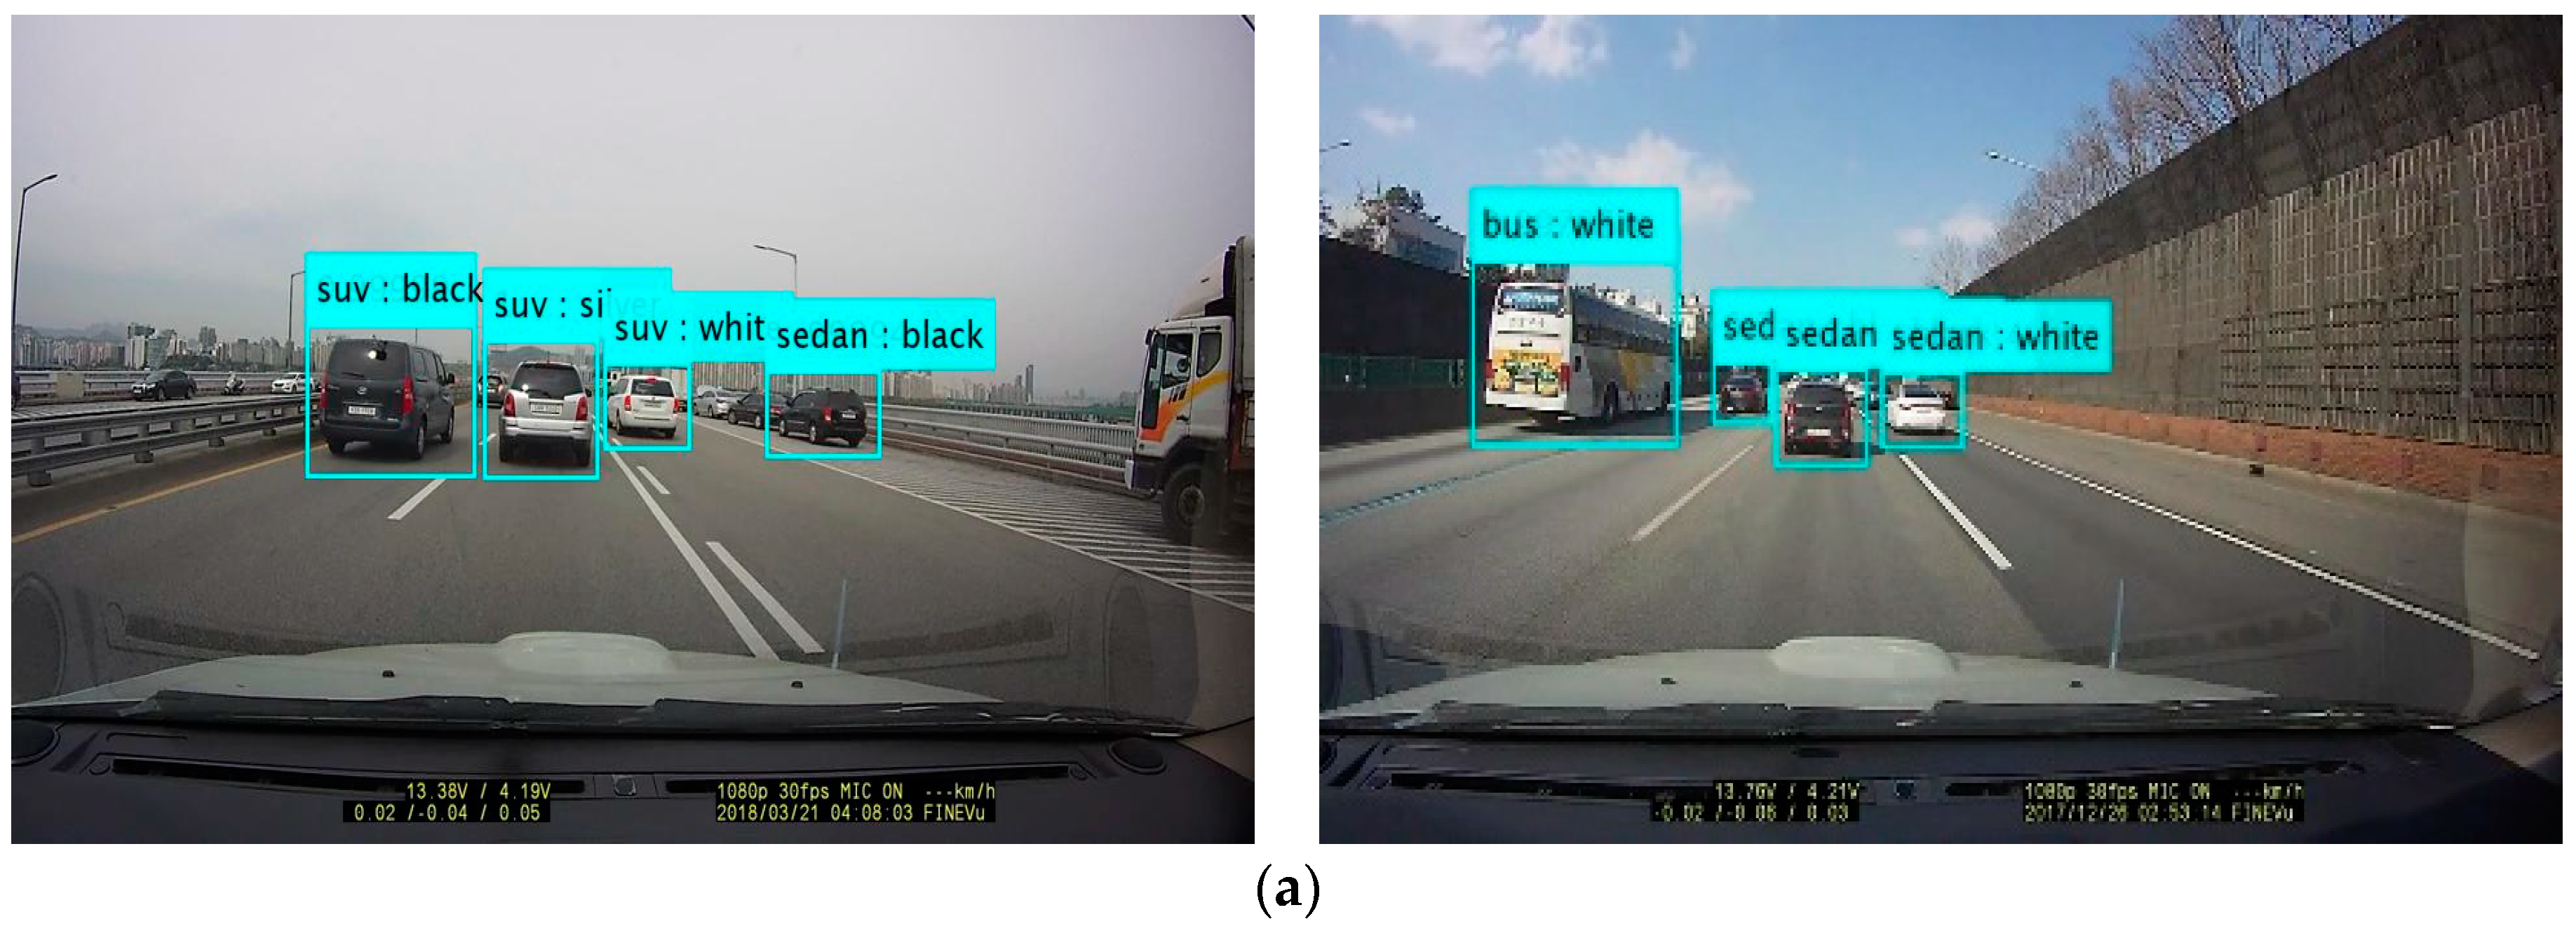
Figure 13 shows the results of detecting a moving vehicle from a road image and classifying its type and color. The experimental image on the left in
Figure 13b failed to detect the truck on the left, misclassified the SUV in the center as a truck, and misclassified the truck as an SUV. The image on the right shows a vehicle in the opposite lane misclassified as a sedan. During the experiment, there were instances in which vehicles were misidentified because of overlap. In addition, at certain intersections, the front of a vehicle approaching from the opposite direction was also detected as a vehicle, resulting in slightly lower detection performance.
Table 4 shows the accuracy results for vehicle detection and color classification, comparing the proposed method to existing research methodologies [
19,
21,
23]. Therefore, to compare the existing studies with the proposed method, [
19,
23] is a vehicle color classification study, and [
21] is a vehicle detection study. To compare the proposed method with existing methods, the vehicle color classification step proposed in [
21] was applied. The experiment was conducted on highway with a higher proportion of trucks and buses than passenger sedans. Experimental results showed an average improvement of 2.8% in the accuracy of vehicle type and color classification using the proposed method. However, the proposed method derives the final result from three frames, and the pre-processing step consumes an additional 0.3 s of processing time on average.
Performance comparison experiments between YOLO v3 and YOLO v5s were performed for the vehicle detector. YOLO v5s was built in Python and used a deep learning network in Github. By comparing the YOLO v3 and YOLO v5s deep learning networks for vehicle detection, the vehicle detection accuracy of the YOLO v3 and YOLO v5s model were 12% and 1.8% higher, respectively. However, the YOLO v5s model has shorter learning time and lower memory usage compared with YOLO v4. Future research will involve conducting vehicle detection experiments using the newest YOLO deep learning network under low-light conditions.
4. Discussion and Conclusions
This paper proposes a method for autonomous vehicles to detect and classify vehicles ahead based on their type and color in order to select the optimal lane. The proposed method extracts feature from input images using a transition learning model as the base network and uses the YOLO v4 object detector to generate the vehicle detector. To classify the type and color of the vehicle within the detected bounding box, the final layer of the Resnet-50 CNN was modified, and a classifier was generated. The proposed method, tested in a road driving environment, achieved approximately 93.2% accuracy in detecting vehicle and classifying their type and color. It only identified the rear area of the vehicle as a correct vehicle detection and classified the detection of vehicles in the opposite lane as a false detection. Thus, the overall vehicle detection was relatively low. However, the accuracy of the vehicle type and color classification was high. However, this method has limitations and cannot be used under low light conditions or at night. Future research will explore applying this method infrared and thermal imaging sensors.
The study proposes the following points for enhancing autonomous vehicle safety based on its method:
Firstly, we must determine the type of vehicle being driven when changing lanes on high-speed roads. Vehicle types can be determined by size and can be used to select the optimal and safest driving lane. Because the experimental environment in this paper only considers vehicle types, we must integrate a driving vehicle management system that can manage vehicles driving on various roads in a cloud database.
Secondly, using the color information of moving vehicles can increase vehicle identification and tracking accuracy. Although vehicle color can only be used during the day, it can identify vehicles for tracking purposes. To classify vehicle colors, a method that simplifies the classification of colors by grouping them is required.
Finally, we must use a significant amount of vehicle data to determine the type and color of the vehicle ahead accurately. This information can support the safe driving of self-driving vehicles, therefore, driving data must be collected continuously. Self-driving vehicles require increased driver convenience, improved vehicle safety, enhanced driver assistance systems, and an efficient traffic flow. Therefore, national road safety authorities should prioritize research and development, particularly in new safe driving technologies that enhance the safety of self-driving vehicles.


