Article

Measurement of the Mechanical Impedance of Ear Cartilage and Development of a Coupler for Vibrator Evaluation of Cartilage Conduction Hearing Aids

Technology Development Center, Rion Co., Ltd., Kokubunji, Tokyo 185-8533, Japan
*
Author to whom correspondence should be addressed.
Appl. Sci. 2024, 14(4), 1536; https://doi.org/10.3390/app14041536
Submission received: 15 November 2023 / Revised: 2 February 2024 / Accepted: 9 February 2024 / Published: 14 February 2024
(This article belongs to the Special Issue Advances in Hearing Simulations and Hearing Aids)

Abstract

:
Cartilage conduction hearing aids (CCHAs) are new devices that have attracted attention in recent years for external auditory canal atresia. In these devices, a vibrator is attached to the ear cartilage to transmit sound through vibration. In this study, we measure the mechanical impedance of the ear concha auriculae, which represents the mechanical load on the vibrator. To evaluate the output of the CCHAs, we develop a coupler simulating the ear cartilage that measures the sound pressure corresponding to the eardrum sound pressure of the normal ear. Consequently, the mechanical impedance of the developed coupler is several times larger than that of the human ear cartilage measured in this study; however, it is an acceptable value considering the difference in the contact area. The output sound pressure of the vibrator with the coupler simulating the ear cartilage roughly simulates the sound pressure in the ear canal with normal hearing (with the ear canal sealed). In this study, the measured mechanical impedance of the human ear cartilage is approximately 20 dB less than that of the mechanical coupler specified in IEC (International Electrotechnical Commission) 60318-6 for the evaluation of the bone conduction vibrator.

1. Introduction

Currently, the number of people with hearing difficulties is estimated to be 1.5 billion worldwide, equivalent to approximately one in five people. Such people often experience reduced quality of life and encounter lifelong difficulties, including delayed language development and academic failure in childhood, limited employment opportunities in adulthood, and accelerated cognitive decline in old age. Hard-of-hearing disability has economic repercussions, and the associated global annual macroeconomic losses are estimated at more than 980 billion dollars [1]. Hearing aids are devices used to compensate for difficulties in hearing, such as age-related hearing loss, or when comorbidities interfere with the treatment. Air-conduction hearing aids are often used to treat sensorineural hearing loss. However, air conduction hearing aids, such as external auditory canal atresia, may not provide effective hearing compensation. In such cases, bone conduction hearing aids are used [2]. These aids require a vibrator to vibrate the head bones, and the mastoid process presses against the vibrator with a force of 2–3 N from a headband, which causes painful skin aches and other problems. In a device called the bone-anchored hearing aid (BAHA), a titanium bolt is implanted in the head bones, and a vibrator is attached to it; consequently, the surgical procedure is burdensome for the patient. In collaboration with Nara Medical University, we developed cartilage conduction hearing aids (CCHAs) that transmit sound through vibrations by attaching a small vibrator to the ear cartilage [3,4]. CCHAs have been developed for patients suffering from external auditory canal atresia and have demonstrated effectiveness and advantages in clinical studies [5,6,7]. In Japan, the product has been commercially available since 2017 and several medical institutions have published various reports on it [8,9,10,11,12,13]. Furthermore, in recent years, the applicability of CCHAs to patients diagnosed with various hearing impairments has also been under consideration [14].
Output performance is an important criterion in hearing aid evaluation methods, such as the IEC (International Electrotechnical Commission) 60118-0. The method for evaluating the output characteristics of bone conduction hearing aids is specified in the IEC (International Electrotechnical Commission) 60118-9. The evaluation method used a mechanical coupler specified in the IEC (International Electrotechnical Commission) 60318-6, which was used to measure the force level of bone conduction vibrators in audiometers. In the case of bone conduction, the mastoid or forehead of the human head vibrates to transmit vibrations to the inner ear through the head bones. The mechanical coupler simulated the mechanical impedance of a human mastoid with a circular contact area of 175 mm2 [15]. A mechanical coupler is also used in the output evaluation of bone conduction hearing aids with the smaller contact area. This allows performance values from different manufacturers and models to be evaluated on the same basis.
The presentation of mechanical impedance in papers and conference reports contributes to product diversification because it can be used by hearing device engineers to simulate output characteristics when designing vibrators. The mechanical impedance of the human head has been studied for bone conduction hearing aids such as BAHA [16,17]. However, little is known about the mechanical impedance of the ear cartilage to evaluate the output of the CCHAs.
There are three transmission pathways for cartilaginous conduction: direct air, cartilage-air, and cartilage-bone [18,19]. When the vibrator of the CCHAs is worn in the concha auriculae (Figure 1), the sound pressure on the eardrum of a normal ear with a sealed ear canal entrance is highly dependent on the sealing condition. In air conduction hearing aids, the sound pressure is evaluated using a sound pressure object that simulates the eardrum in a sealed ear canal. This avoids measurement difficulties, such as howling.
To evaluate the output of a CCHA, we developed a coupler simulating the ear cartilage that can obtain a value close to the sound pressure on the eardrum when the ear canal is sealed, as in a normal hearing aid, while also applying a load close to the mechanical impedance of the ear cartilage to the vibrator. The aim of this study is to establish a standardized method for assessing the performance of CCHAs. This paper reports the measurement of the mechanical impedance of the ear cartilage and the coupler simulating the development of ear cartilage.

2. Materials and Methods

2.1. Subjects

All the subjects in this experiment were adults with normal ear canals. The 17 subjects (34 ears) for mechanical impedance measurement were in the age range of 23–49 years, with a median age of 34 years. The age of the four subjects (four ears) for sound pressure level measurement ranged from 31 to 63 years, with a median age of 41 years.

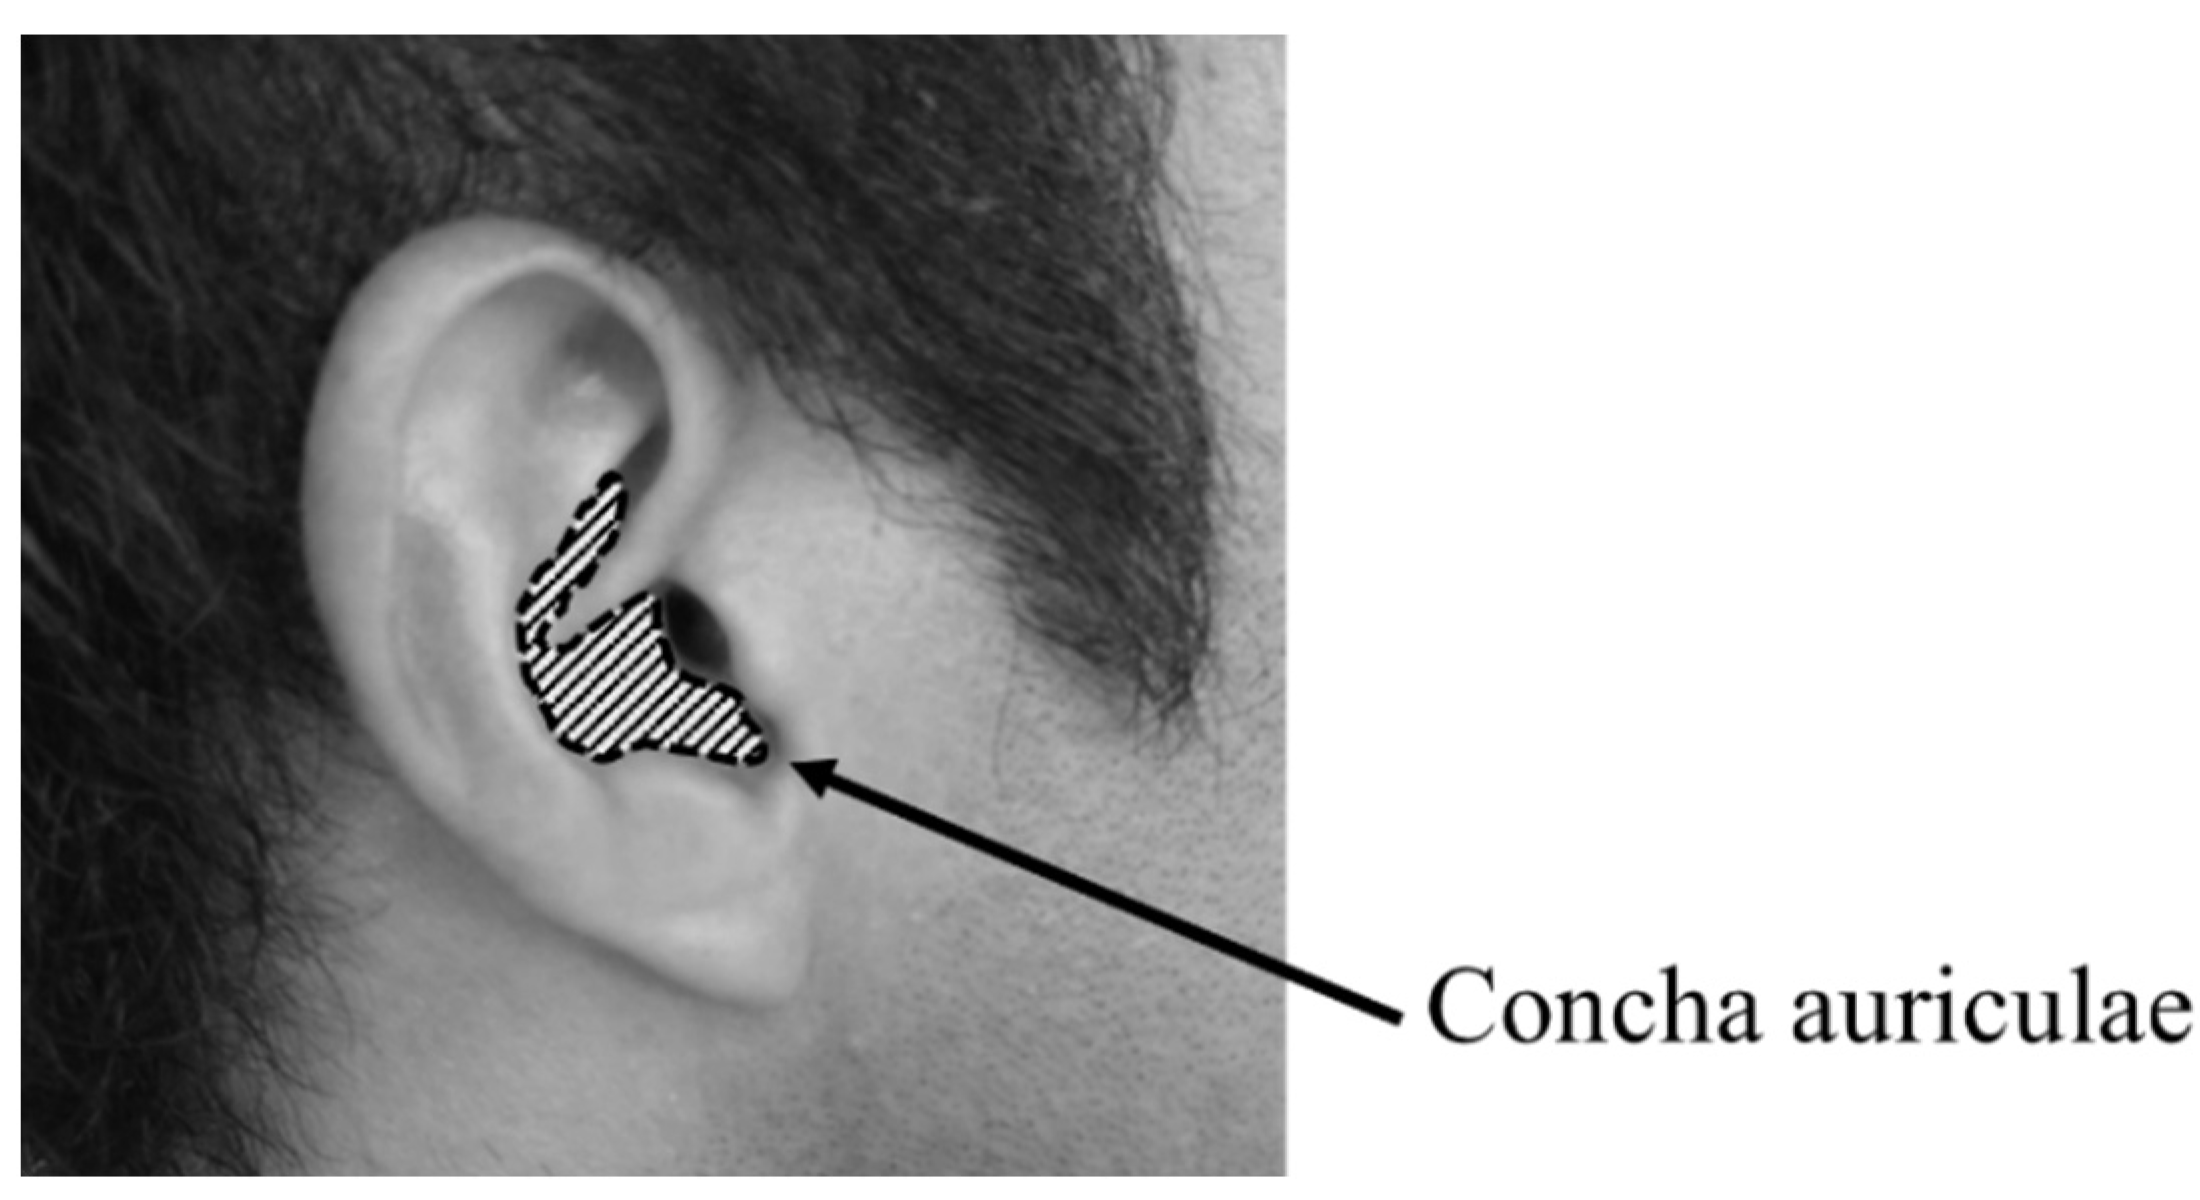
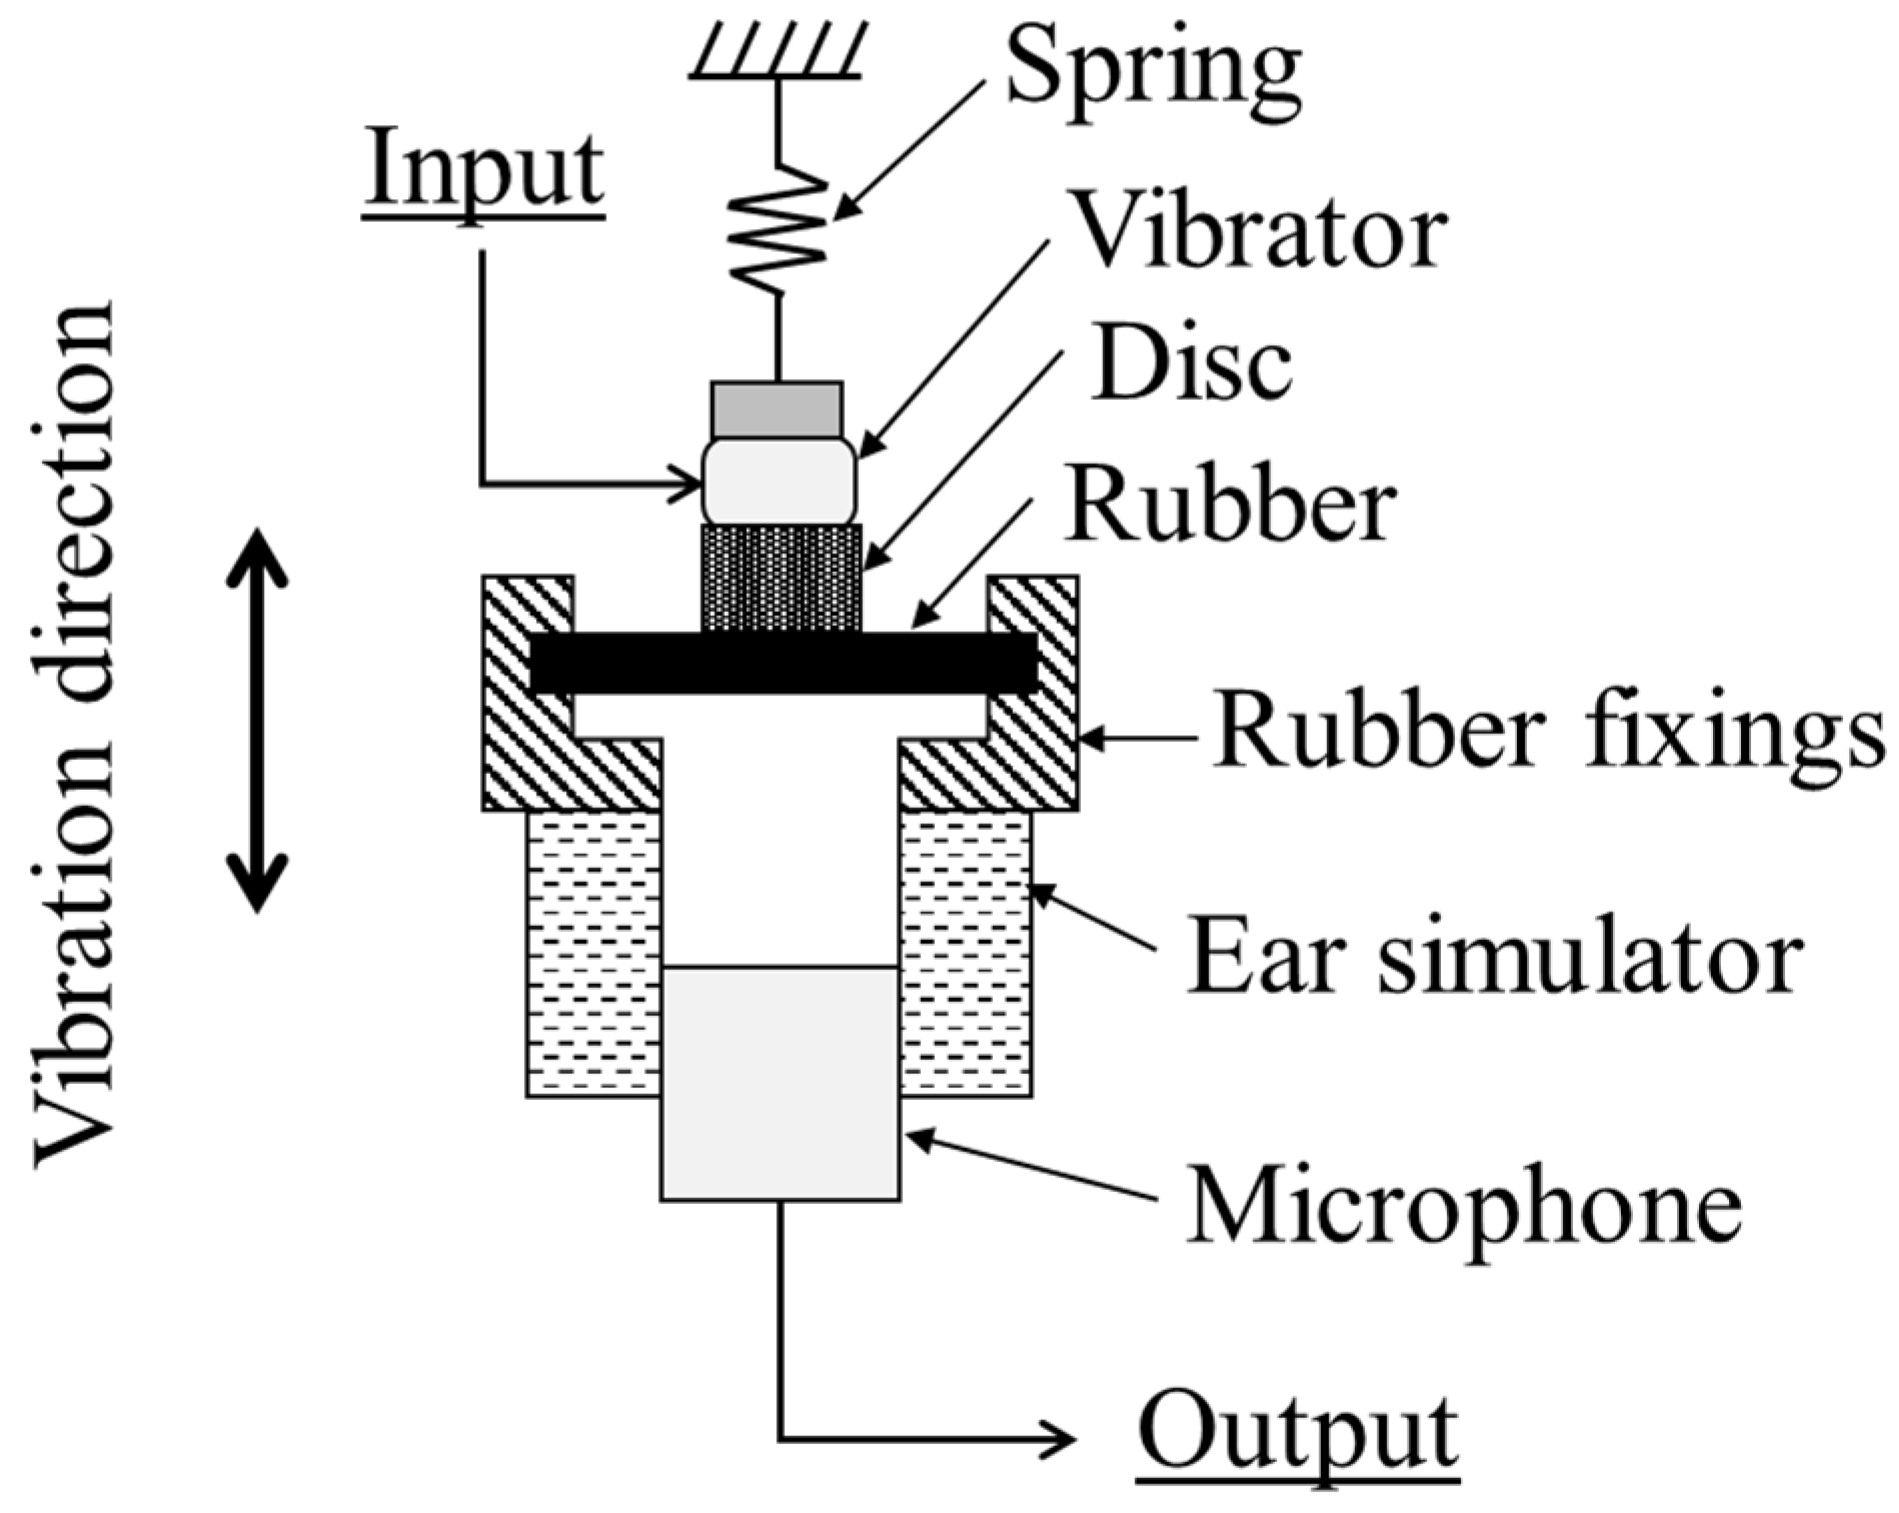
2.2. Coupler Simulating the Ear Cartilage

The output evaluation of a general air conduction hearing aid consists of measuring the sound pressure equivalent to the eardrum sound pressure in normal hearing when the ear canal is sealed. We designed a coupler to simulate the ear cartilage with a mechanical load on the vibrator close to the mechanical impedance of the ear cartilage. This was done to simulate the eardrum sound pressure in a sealed ear canal while wearing a CCHA.
Figure 2 shows the configuration of the prototype coupler that simulates the ear cartilage. The coupler consisted of a spring, disc, rubber, rubber fixings, ear simulator, and microphone. Each component was selected and designed such that the mechanical impedance from the vibrator was close to the mechanical impedance of the ear cartilage when a vibrator was placed on the coupler. The rubber connected to the disc was fixed around the periphery using the rubber fixings. The ear simulator was an occluded-ear simulator as specified in the IEC 60318-4. This simulates the acoustic impedance of the ear canal and eardrum beyond the earplug tip when using inserted earphones. Because the CCHA is worn at the entrance of the ear cartilage, an additional ear canal (10 mm long) was added to the earplug portion. When the measuring vibrator is placed on the disc and it vibrates, the rubber also vibrates, which generates the sound pressure in the coupler. Therefore, the vibrations of the vibrator can be measured as sound pressure output.
The materials and dimensions of the main components of the coupler simulating the ear cartilage are described below. Rubber is sometimes selected as a material for living body simulation [20,21,22]. Because the mechanical impedance of concha auriculae is dominated by resistance, the rubber was selected experimentally by evaluating various rubber materials and shapes. Consequently, the HANENITE rubber (GP60LE; Naigai Rubber Industry, Hyogo, Japan) with an effective diameter of 16 mm and thickness of 1 mm was adopted as the material. The disk was made of acrylonitrile-butadiene-styrene (ABS) resin with an outer diameter of 6 mm and thickness of 1.5 mm, and polychloroprene rubber (CR) of the same diameter and a thickness of 0.5 mm, which was glued to the top. The spring was soft (stiffness of 70 N/m, about −20 dB (ref. 1 Ns/m) at 100 Hz), with negligible mechanical impedance, and was used to hold the vibrator at 1 N. The disc and spring stabilized the contact between the vibrator and coupler, simulating the ear cartilage. The occluded ear simulator was a CZ-32 (RION, Tokyo, Japan) and the microphone was a UC-33P (RION, Tokyo, Japan).

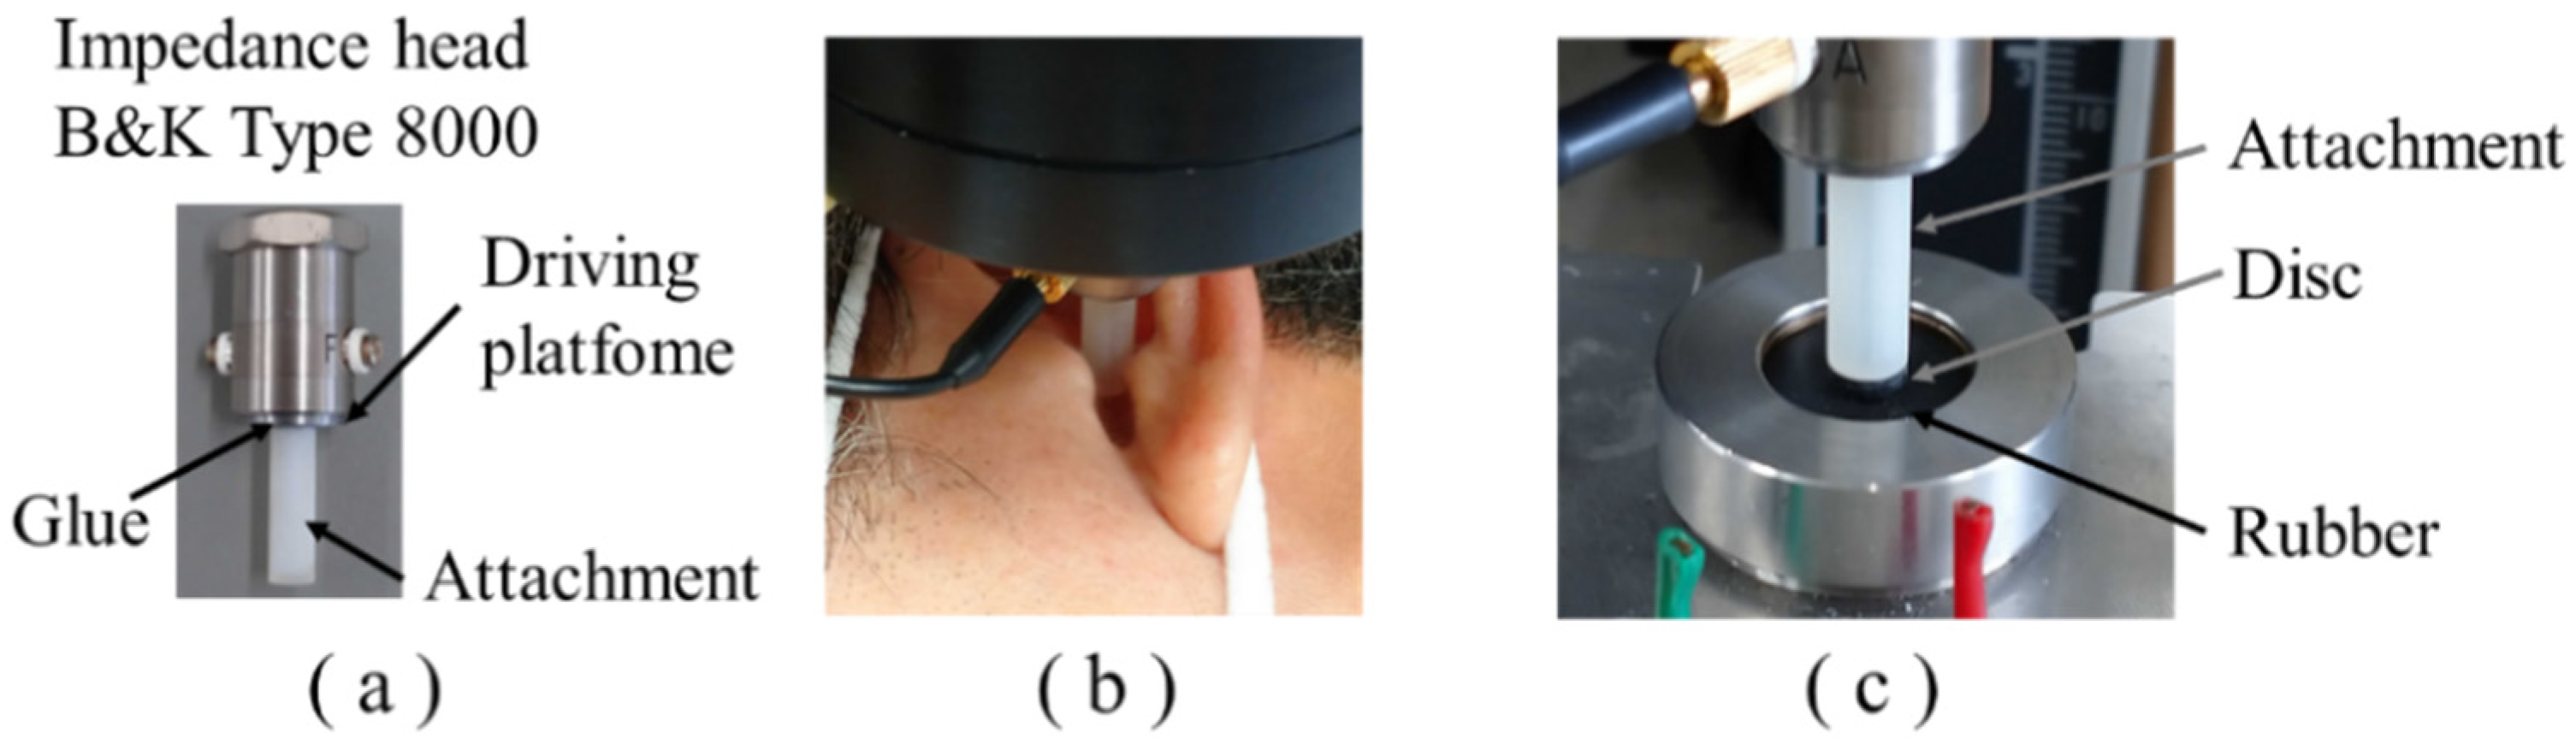
2.3. Mechanical Impedance Measurement Methods

Mechanical impedance is widely used in engineering as an indicator of an object’s difficulty to move against vibration, and its frequency characteristics allow deriving physical quantities such as elasticity, friction (resistance), and object mass. The mechanical impedance Z(ω) is defined in Equation (1) for the case of a sinusoidal vibration force F (ω) of frequency f applied to an action point of an object with the response velocity v (ω) in the direction of the force at that action point:
Z ω = F ( ω ) v ( ω ) ,
where ω is the angular frequency (ω = 2 π f). The mechanical impedance depends on the area and direction of the force. In this case, an increase in the area results in a proportional increase in mechanical impedance. Changes in direction are influenced by the anisotropy of components, such as the shape of parts and the crystalline or molecular characteristics of the materials. Here, an impedance head (Type 8000; Brüel & Kjaer, Naerum, Denmark) was used to measure the force and acceleration a (ω). The acceleration was time integrated and converted into velocity, and the mechanical impedance is given by Equation (2):
Z ω = j ω · F ω a ω ,
where j is the imaginary unit. Because the human auricle has a complex three-dimensional shape, it is not possible to position the driving platform (175 mm2) of the impedance head in the concha auriculae without contacting the other parts of the auricle. Therefore, an attachment with a diameter of 6 mm (28.3 mm2) and length of 20 mm was glued to the driving platform for measurement. A common method for measuring the mechanical impedance of an object consists in using an impedance head and measuring the mechanical impedance when it is in contact with the object (Z1) and when it is not in contact with the object (Z0). If Z1 is considered as the series combination of Z0 and the mechanical impedance ZM of the object, ZM can be obtained as the difference between complex numbers Z1 and Z0, as depicted in Equation (3).
Z M ω = Z 1 ω Z 0 ω ,
Based on the measurement of the mechanical impedance Z0 with the attachment, the resonant frequency was approximately 17 kHz; hence, the platform and attachment could be considered as one object up to approximately 10 kHz.
Figure 3 shows the block diagram of the mechanical impedance measurement setup, which measures the mechanical impedance of the object from the output of the impedance head F (ω) and a (ω) while transmitting the vibration of the shaker (Type4810; Brüel & Kjaer, Naerum, Denmark) through the impedance head and attachment.
The AC signal generated by the PC was converted through an AD/DA converter (Analog Discovery; DIGILENT, WA, USA) to a constant-voltage signal stabilized by an amplifier and then input to a shaker to generate vibrations. The shaker input signal was a 0.1 VRMS sine wave, and measurements using swept sinusoidal signals were performed in the frequency range of 100–10,000 Hz. Under these input conditions, the impedance head was subjected to excitation forces of 1 mNRMS to 10 mNRMS order. The electric charge output of the impedance head was converted into a voltage signal using a charge amplifier (UV-16; RION, Tokyo, Japan), and the voltage signal was recorded on the PC through the AD/DA converter. The PC calculated the mechanical impedance from the force, acceleration and their phase differences, considering the sensitivity value of the impedance head and amplification of the charge amplifier.
The impedance head was fixed to the shaker using screws. The fastening of the screw has been securely accomplished with a torque below the specified maximum limit of 2 Nm, as stipulated by the impedance head. The shaker was coupled to a force gauge suspended at the fixed end via a spring so that the static load on the object being measured could be determined. The static load on the object was adjusted in the range of 0.2 ± 0.1 N. The attachment was glued with an epoxy adhesive at a position on the central axis of the driving platform of the impedance head (Figure 4a). The mass of the attachment was 0.35 g. The load mass combining the mass of the driving platform of the impedance head and that of the adhesive was approximately 1.7 g. To verify the integrity of the mechanical impedance measurements, measurements of not in contact with the object (Z0) were conducted before and after all measurements, ensuring the absence of any issues.
In the case of measurement with human ear cartilage, the subject lies down on a mattress with the face turned sideways. The head was placed on a soft pillow, and the attachment was placed in contact with the concha auriculae, which ensured a horizontal contact surface (Figure 4b).
In the case of measurement with a coupler simulating the ear cartilage, the attachment was in contact with the disk (Figure 4c).

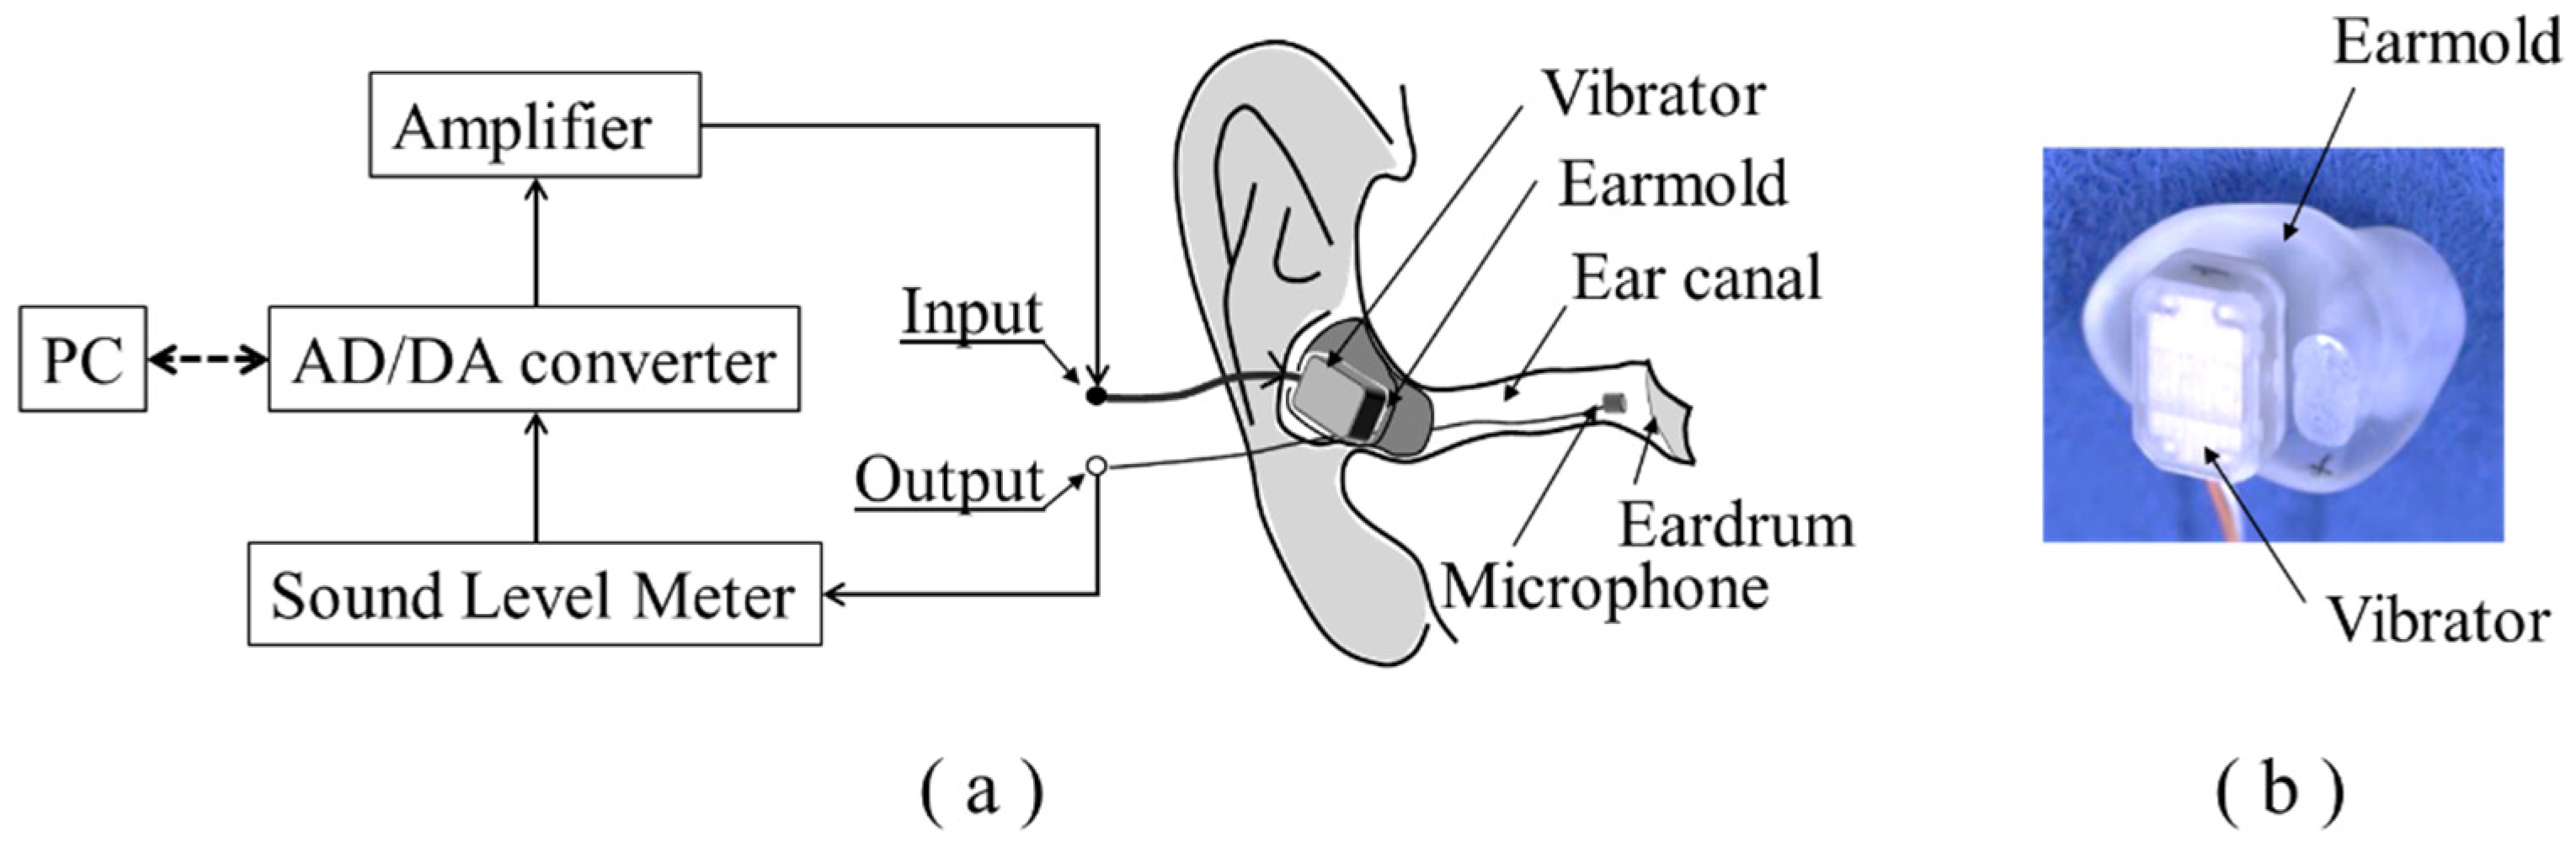
2.4. Sound Pressure Measurement Methods

The magnetic vibrator (BB-01; RION, Tokyo, Japan) of a CCHA (HB-J1CC; RION, Tokyo, Japan) was used for sound pressure measurements. The external dimensions were 4.7 × 7.8 × 12 mm, and the mass was 1.4 g.
To measure the sound pressure on the eardrum when the ear canal was sealed and the device was worn on the ear cartilage, an earmold as displayed in Figure 5b was created from the ear forms of each participant. The vibrator was fixed on the earmold, and a small microphone (8002; SONION, Roskilde, Denmark) with a thin lead wire was placed in the ear canal. To measure the sound pressure in the ear canal, the microphone was positioned at 5–20 mm from the tip of the earmold, although the position varied slightly for each measurement (Figure 5a).
Measurements of the coupler simulating the ear cartilage were performed by adding a piece of metal to the vibrator with a mass (approximately 1.5 g) equivalent to that of the earmold used for the real ear measurements. This allowed for the comparison of sound pressure measurements to those performed in the ear canal by the real ear. The measurement setup between the input and output in Figure 5a was replaced with a coupler simulating the ear cartilage (Figure 2).

3. Results

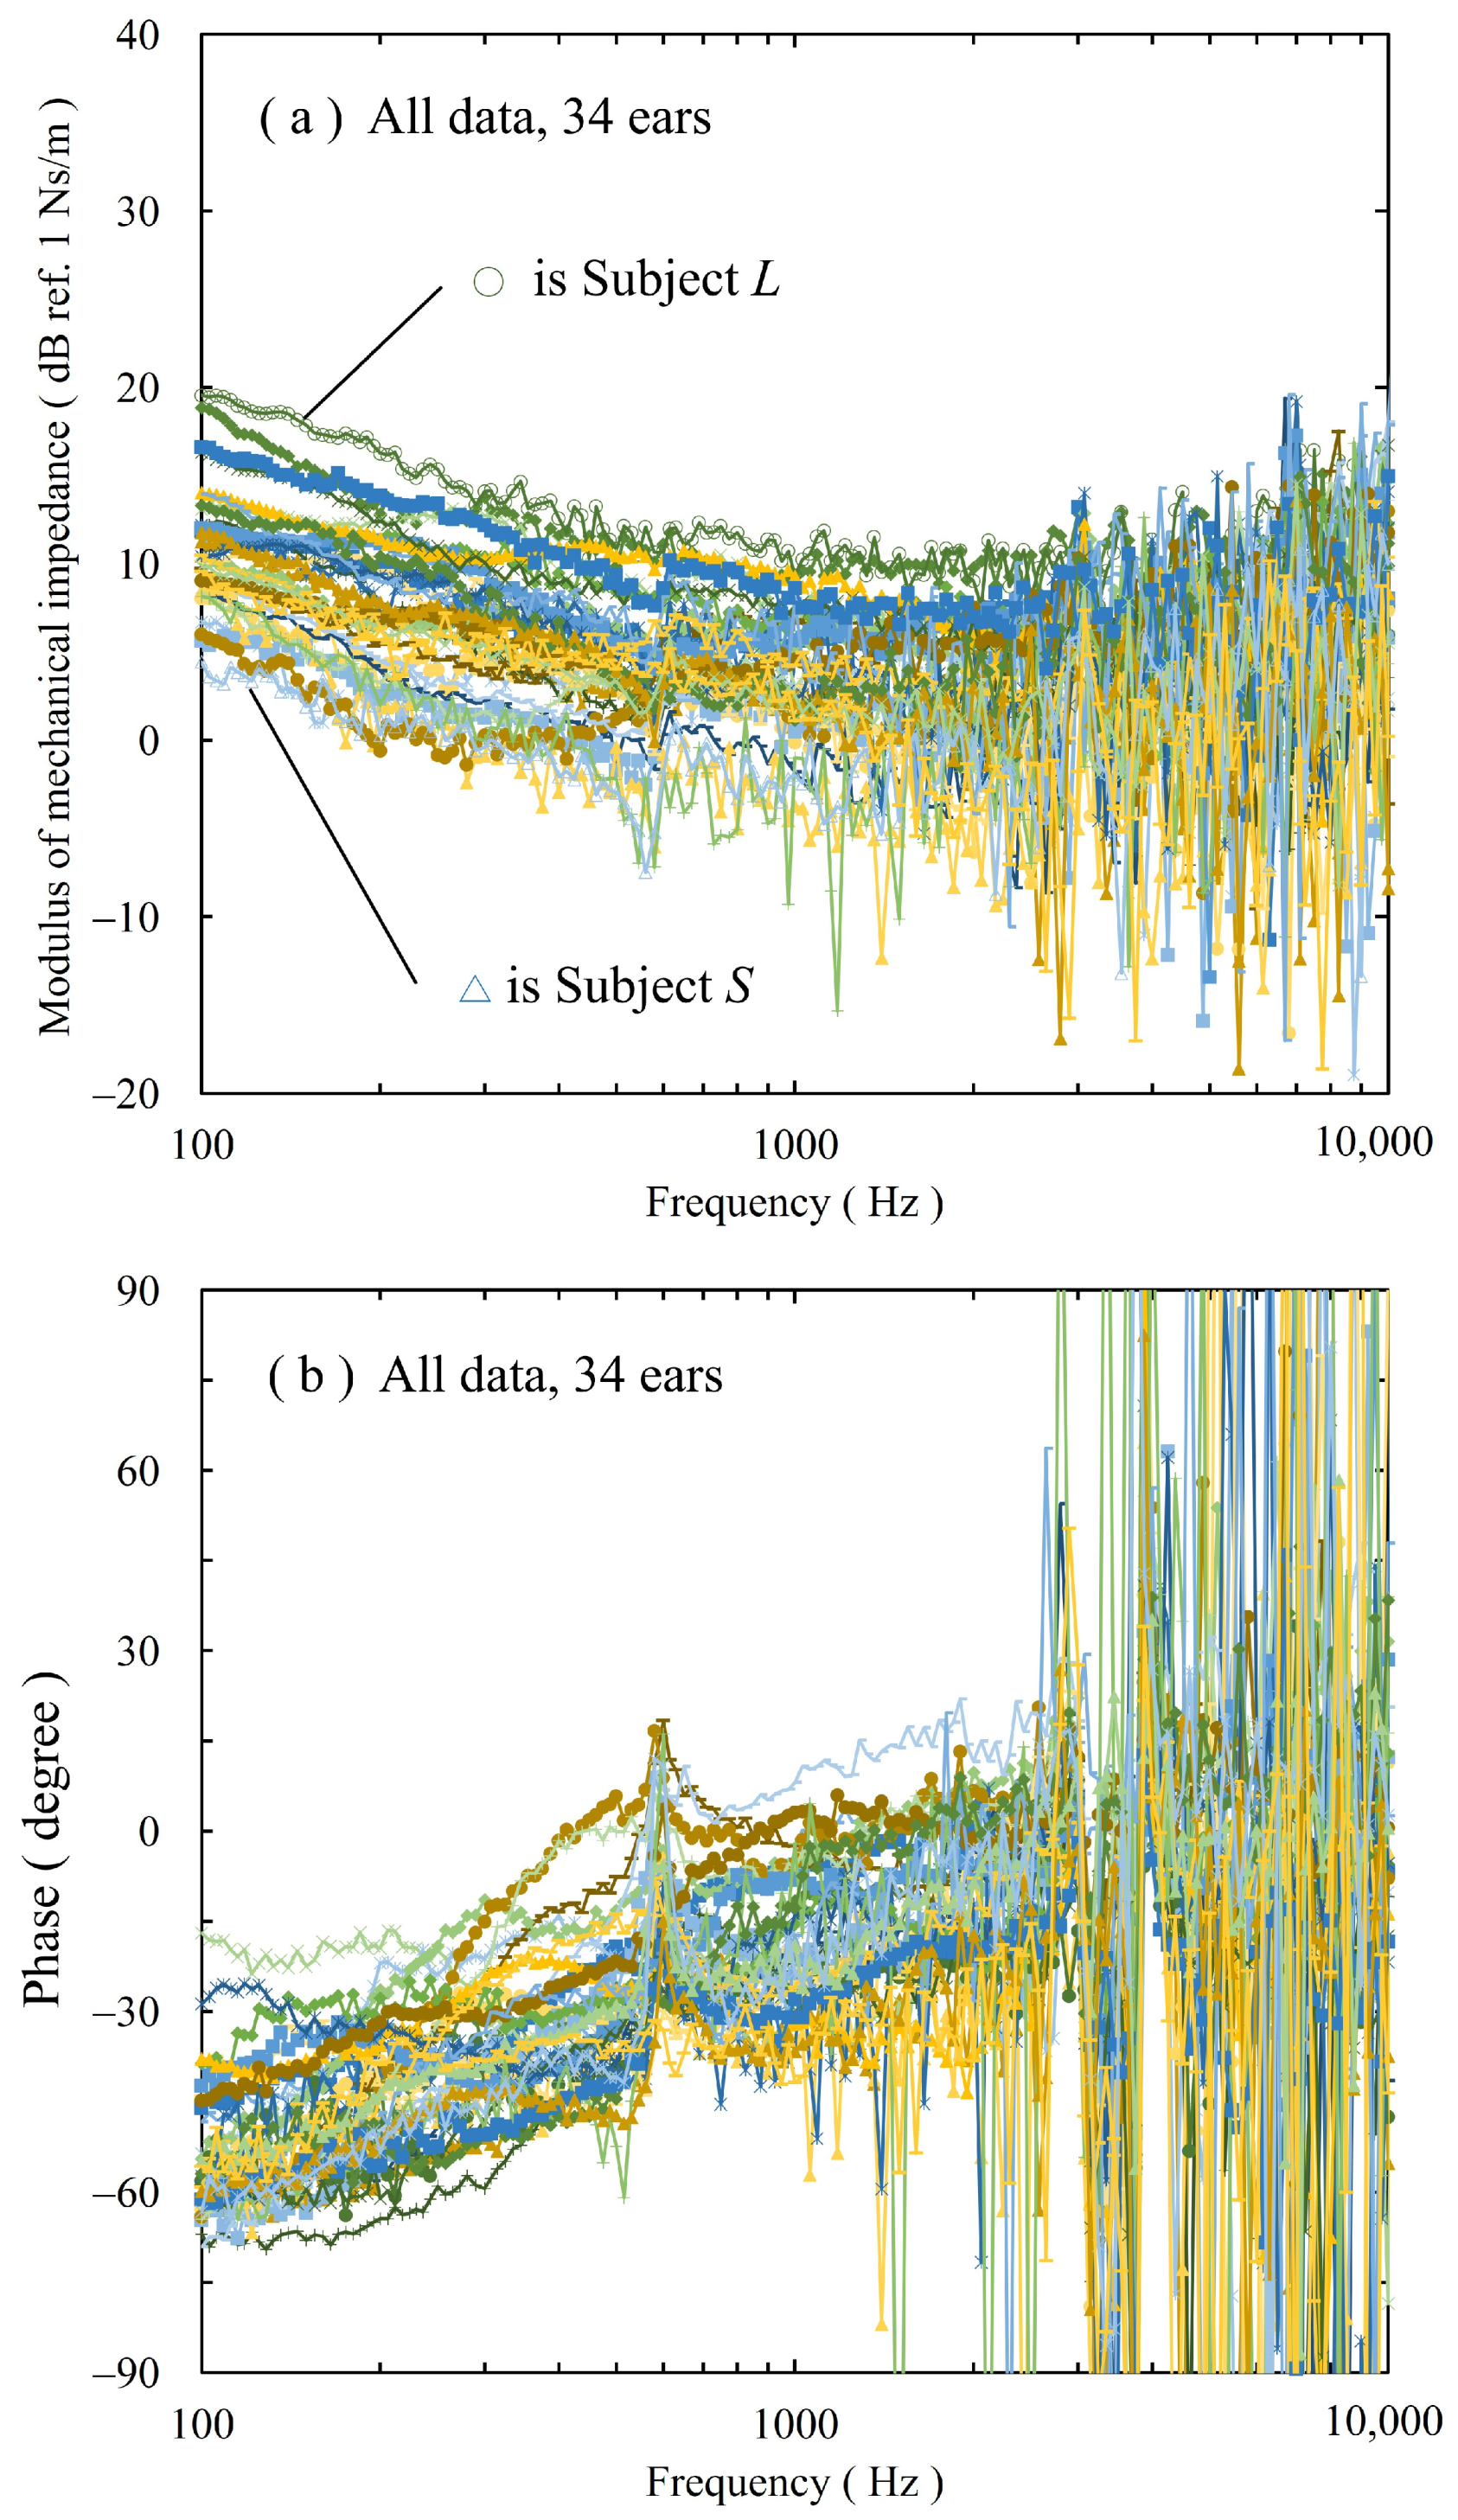
3.1. Mechanical Impedance of Ear Cartilage

Figure 6a depicts the modulus of the mechanical impedance of the human concha auriculae in 34 ears of 17 subjects. The mechanical impedance is described in level notation (ref. 1 Ns/m) as in a study by Flottorp et al. [13], in which the mechanical impedance of the mastoid and forehead was measured. The variability of the measured mechanical impedance was small, below about 2000 Hz, but significantly above about 2000 Hz. In the preliminary measurement, five repeated measurements were performed on one subject that was below 1000 Hz within ±2 dB, below 2000 Hz within ±4 dB and above 2000 Hz the measurement accuracy was not good as the variation increased to approximately ±10 dB. Additionally, the variation of the static load (0.2 ± 0.1 N) had no significant effect on the measurement results.
Figure 6b depicts the phase results, which exhibit a similar trend corresponding to the modulus of the mechanical impedance.
Figure 7a,b display the mechanical resistance and reactance data for subjects L and S, respectively, as representative results of Figure 6a. The mechanical resistance (Figure 7a) is calculated from the real parts of the respective mechanical impedance and phase results. The mechanical reactance (Figure 7b) is derived from the imaginary parts of the respective mechanical impedance and phase results. The inset in Figure 7b displays an enlarged graph from 100 Hz to 200 Hz. From the data in Figure 7a, the resistance of Z1Z0 is displayed in Figure 7c as ΔRL and ΔRS for subjects L and S, respectively. Similarly, from the data in Figure 7b, the reactance of Z1Z0 is displayed in Figure 7d as ΔΧL and ΔΧS for subjects L and S, respectively. For the resistance, significant values were obtained up to 3200 Hz but were not obtained above approximately 5000 Hz. Negative values between 500 Hz and 2000 Hz were attributed to errors in the measurement system. Significant values were obtained for the reactance up to similar frequencies. However, ΔΧL above 1700 Hz and ΔΧS above 5800 Hz appear to have small values that are below the measurement error. These results suggest that the phase above these frequencies is near zero, and the gradual increase in the modulus of the mechanical impedance above 2000 Hz is due to the resistance.
Figure 8 displays the average mechanical impedance values tabulated separately for the left and right ears for all the subjects. The average differences between the left and right ears are also presented. Individual differences in the mechanical impedance asymmetry of the ear cartilage exist. On average, there is a systematic reduction in values in the right ear. However, the asymmetry between the left and right sides is diminished. The mechanical impedance of ear cartilage depends on the components that constitute the tissue. Considering the tendency for most individuals to favor one side and the fact that both ears are composed of the same components, the observed results can be understood as a natural outcome. It is believed that the mechanical impedance measurements of the ear cartilage conducted in this study were accurate.

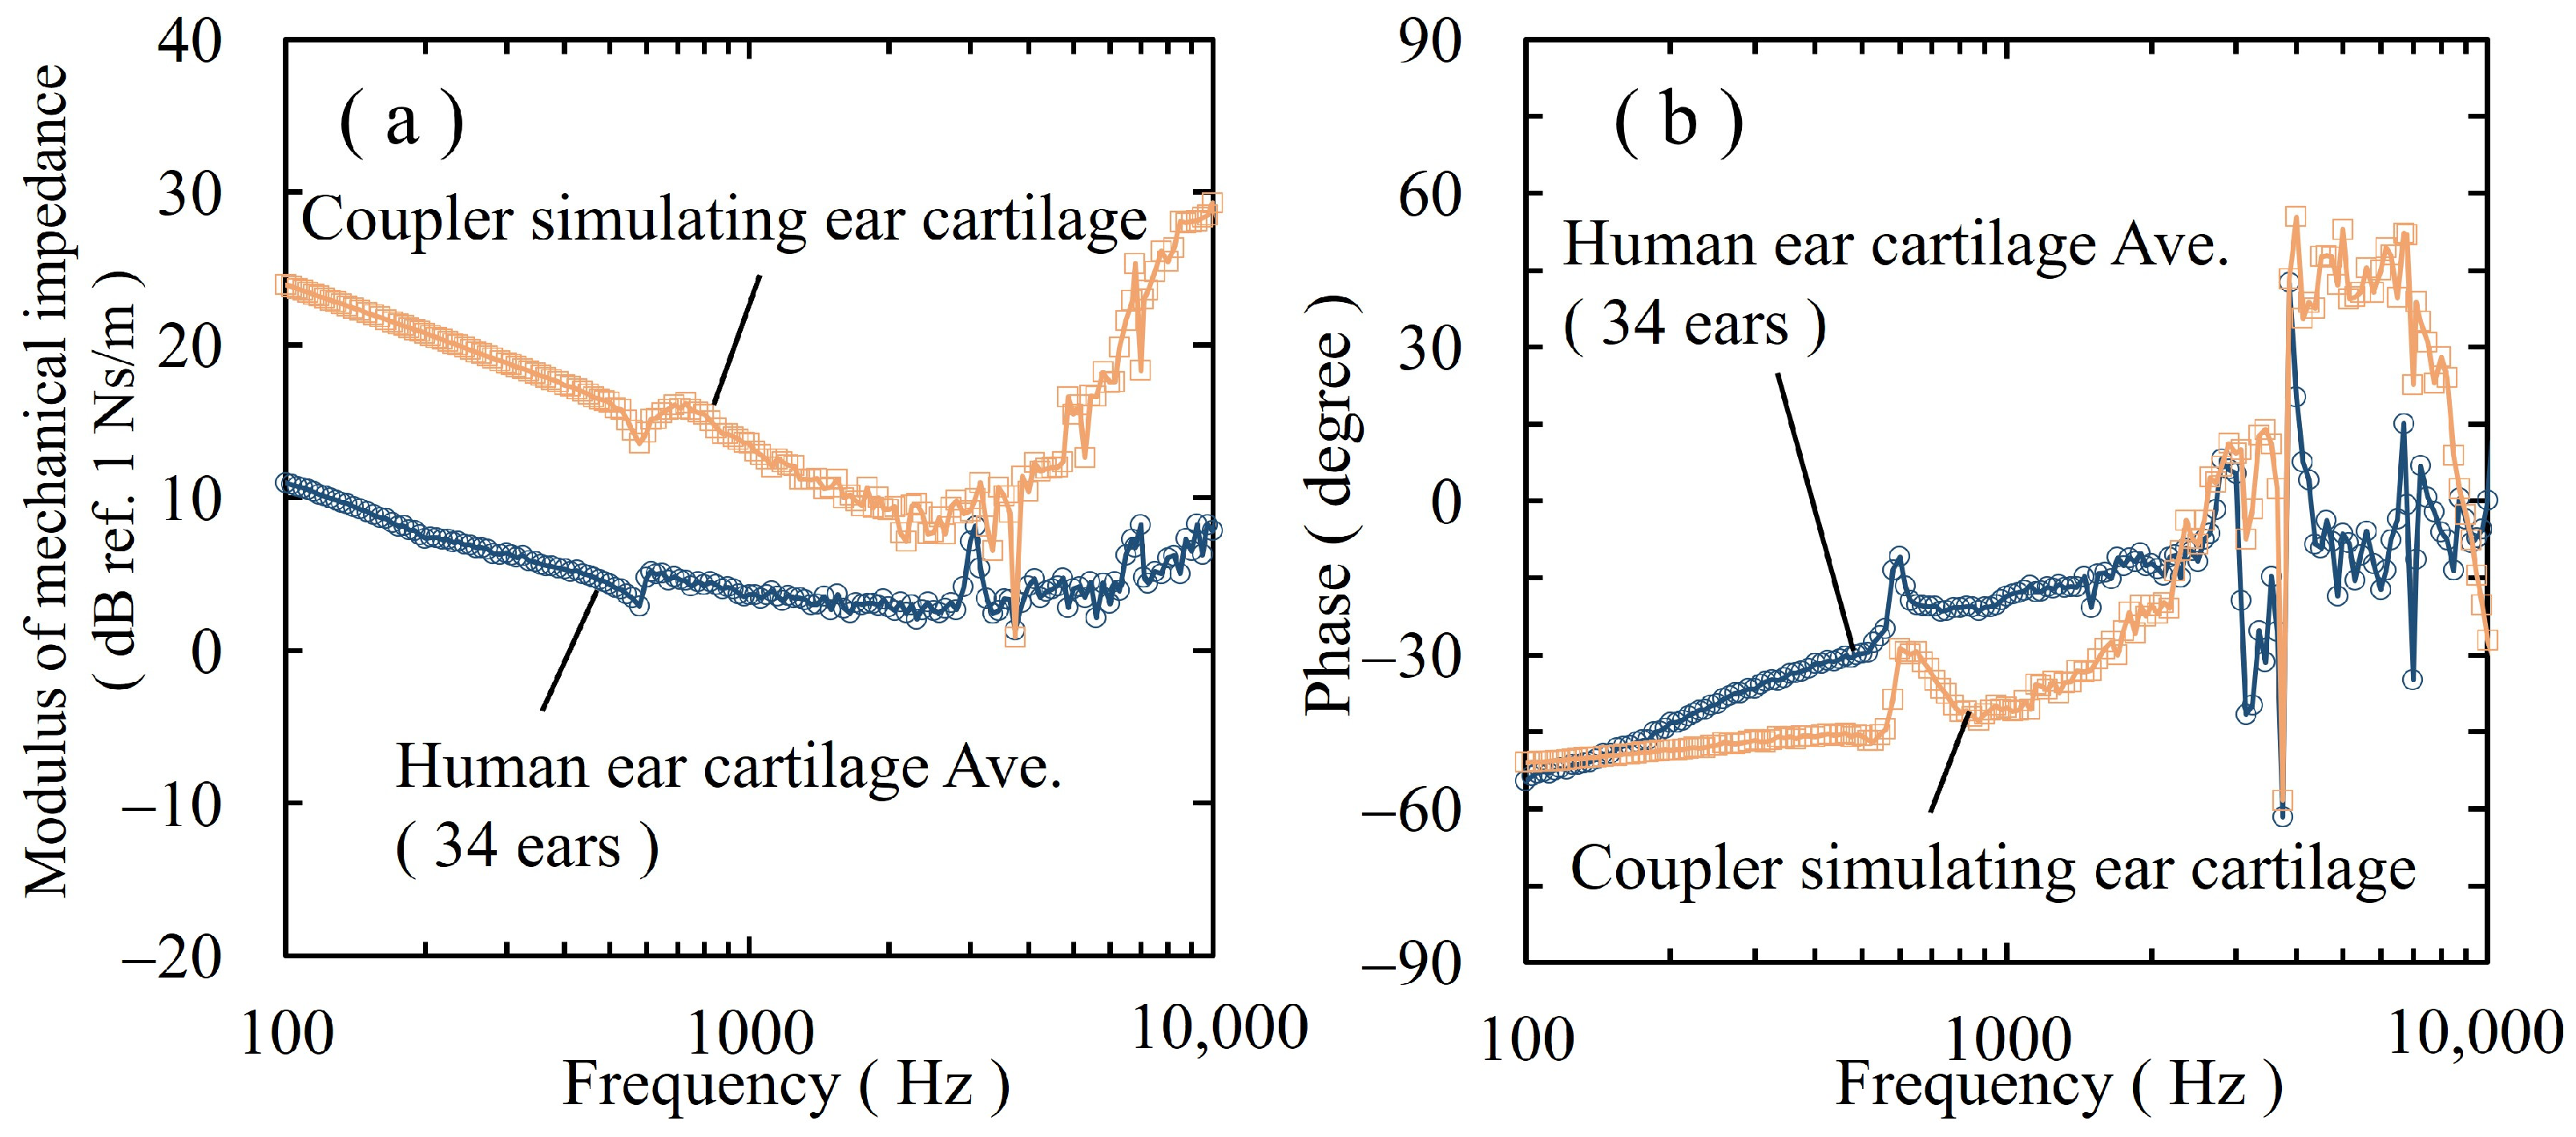
3.2. Mechanical Impedance of the Coupler Simulating the Ear Cartilage

Figure 9a depicts the modulus of the mechanical impedance (level notation in ref. 1 Ns/m) at the coupler simulating the ear cartilage and the average mechanical impedance of the human ear cartilage in all 34 ears. The overall mechanical impedance of the coupler was approximately 10 dB greater than that of the human ear cartilage, except for the range of 3000–4000 Hz. Figure 9b shows the phase results. Although the phase is the same as that of human ear cartilage at 100 Hz and 2000 Hz, the curves between these frequencies are slightly different. Above 4000 Hz, the phase of the coupler simulating the ear cartilage was between +50° and +60°, which is different from that of the human ear cartilage.

3.3. Sound Pressure Characteristics in Human Ear Cartilage Conduction

Figure 10a depicts the measured sound pressure levels in the ear canals of the four ears using human ear cartilage conduction. The difference between the maximum and minimum values below 300 Hz and above 5000 Hz was approximately 20 dB; however, in the frequency band between 300 Hz and 5000 Hz, it was within 12 dB.

3.4. Sound Pressure Characteristics of the Coupler Simulating the Ear Cartilage
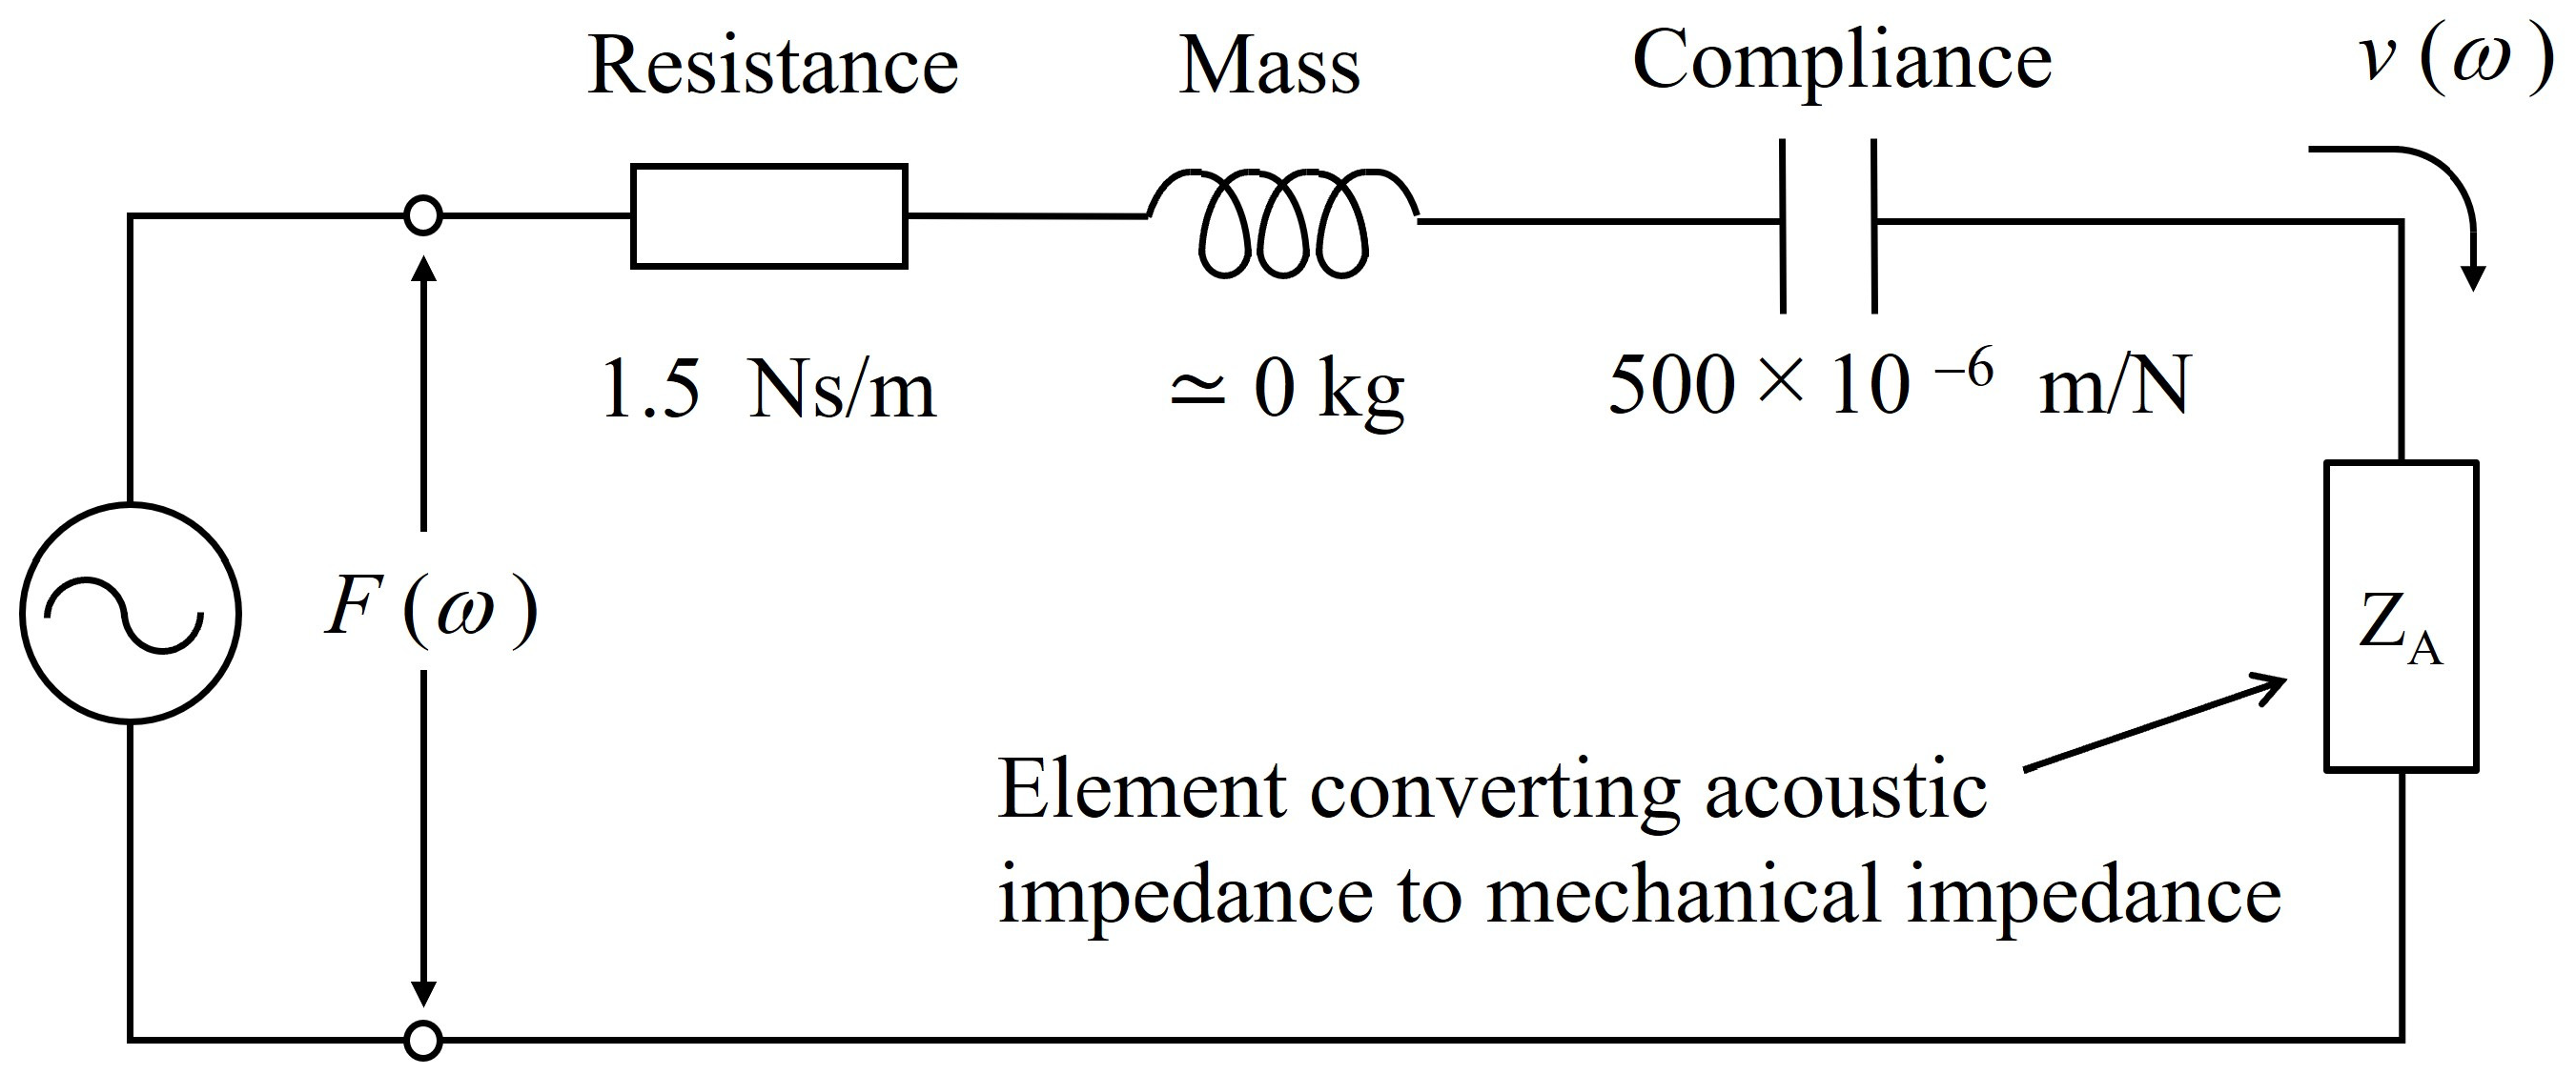
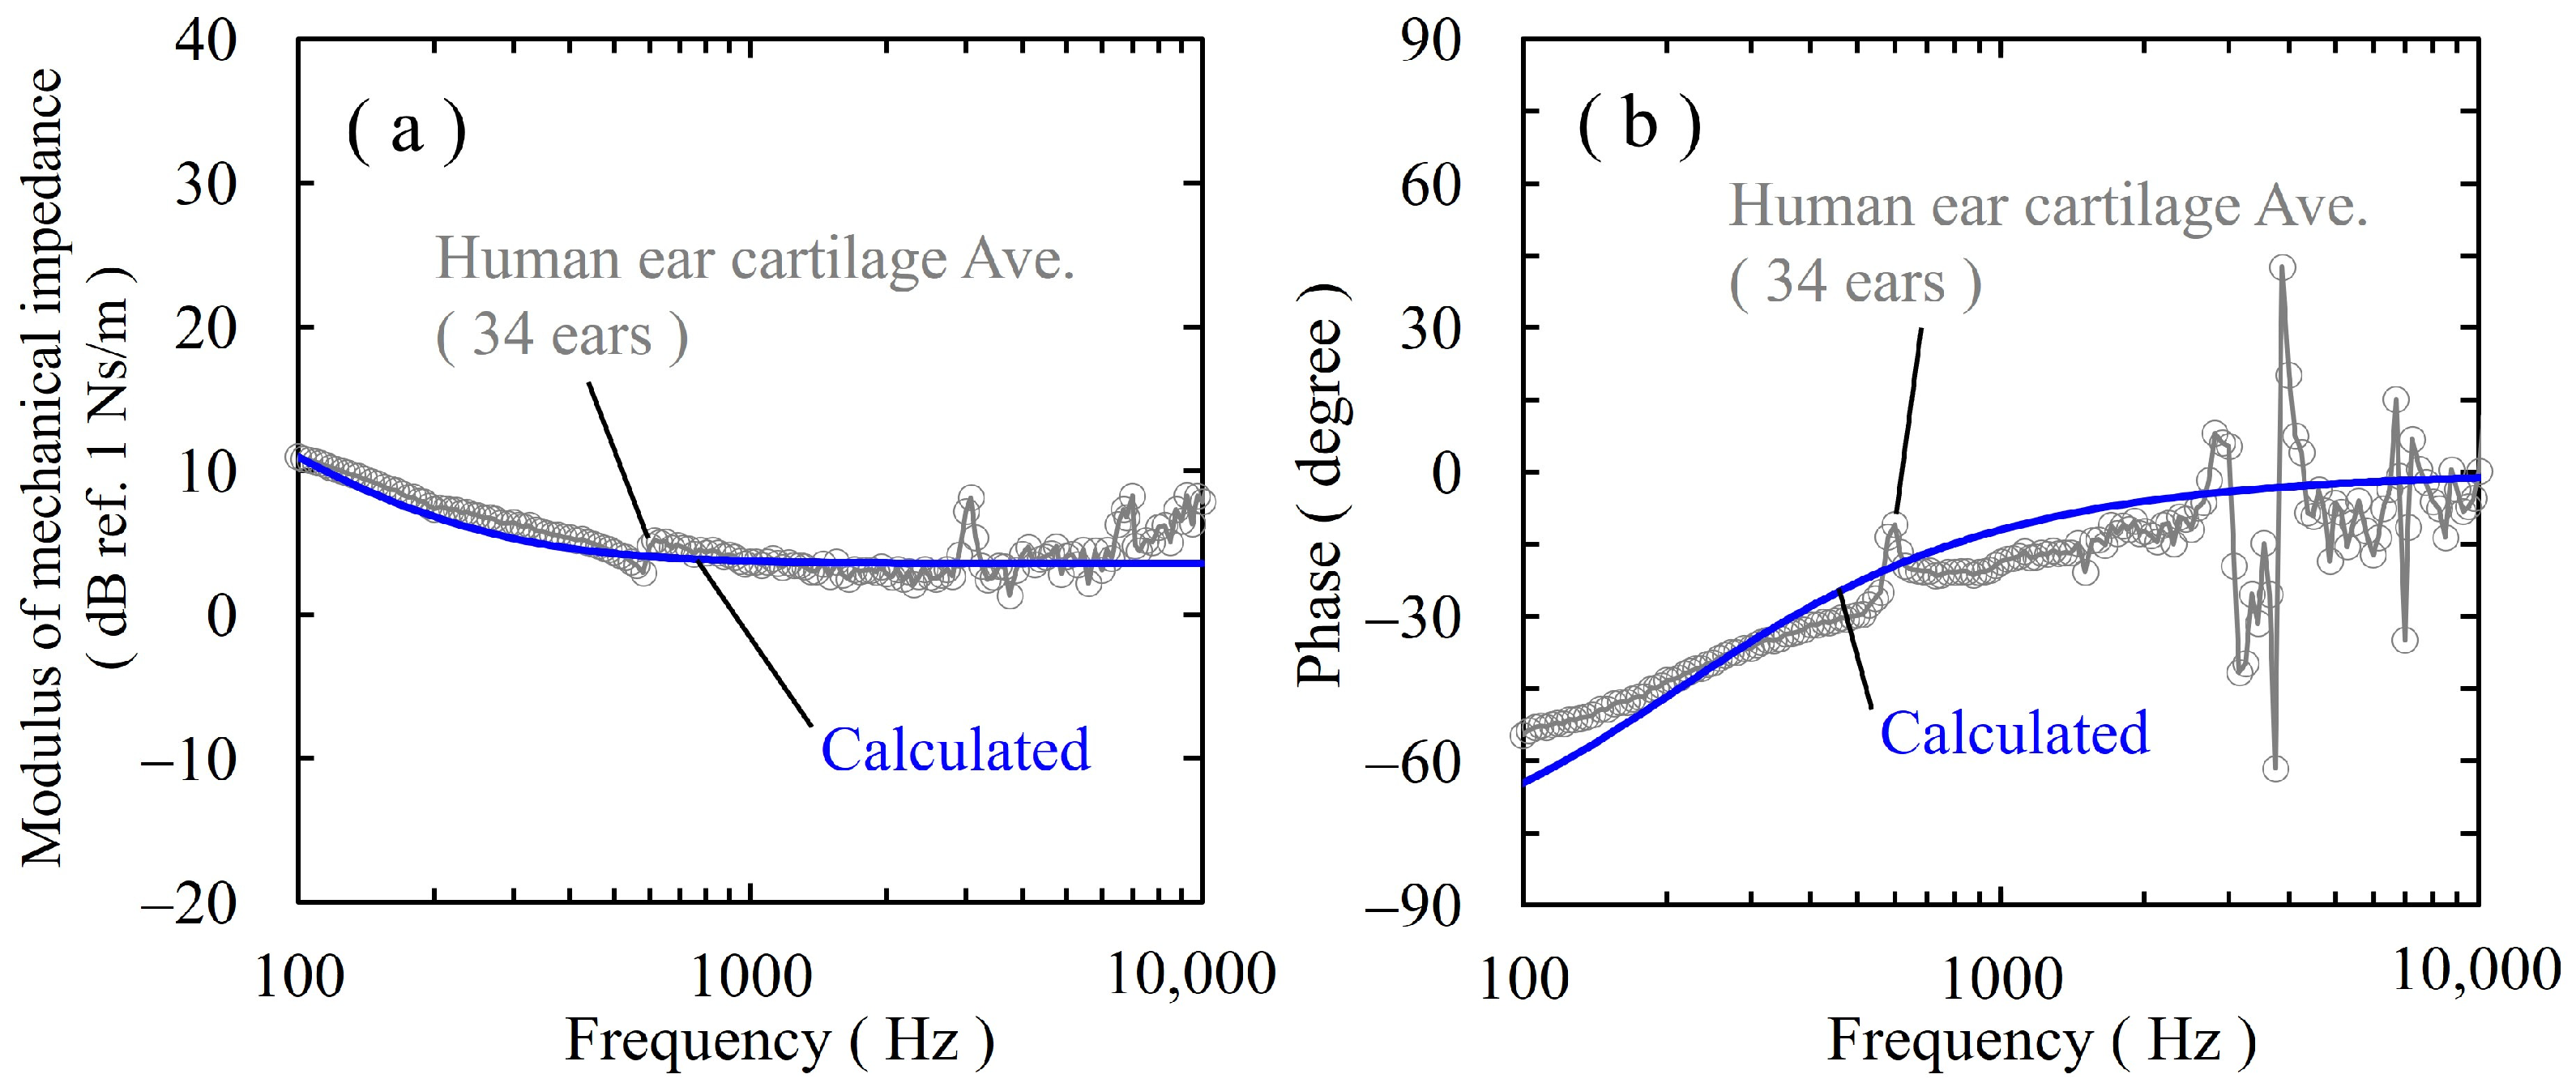
Figure 10b(i) displays the sound pressure characteristics measured by the vibrator with the coupler simulating the ear cartilage. Figure 10b(ii) displays the sound pressure characteristics measured by the vibrator adding a mass of 1.5 g with a coupler simulating the ear cartilage. Figure 10b(iii) displays the average sound pressure characteristics for the human cartilage conduction compiled from Figure 10a. The characteristics in Figure 10b(ii) were obtained by adding 1.5 g to the vibrator, which had the same mass as the earmold, for comparison with human characteristics. Below 500 Hz, the coupler results showed a 10–20 dB increase in sound pressure compared with the human ear cartilage conduction results; however, above 500 Hz, the results were a good approximation. The output in the high-frequency range was significantly reduced when mass was added to the vibrator; therefore, the sound pressure characteristics in Figure 10b(i) were also added for reference.

4. Discussion

Regarding the measurement results of mechanical impedance, it can be observed in the graph of Figure 9a that the downward-sloping region corresponds to elastic behavior, while the flat section represents resistive behavior. The mechanical impedance of the human ear cartilage obtained from Figure 9 gradually changed from a predominantly elastic behavior at low frequencies to a predominantly resistive behavior at above 2000 Hz. However, as described in the results, the phase above 2000 Hz and the modulus of mechanical impedance above 5000 Hz were not measured with sufficient accuracy. Future experiments are necessary to improve the accuracy.
The average mechanical impedance of the human ear cartilage in the present study was approximately 5 dB lower than the pre-measured mechanical impedance of the concha auriculae over the entire bandwidth during the design of the coupler simulating the ear cartilage. The previous measurement method produced an ear-shaped shell for each subject for the attachment, which was in contact with a surface that matched the subject’s ear shape. We believe that the smaller measurement result was due to the difference in the contact areas of the attachments. In this case, the vibrator is subjected to the mechanical impedance based on the contact area and the overall mechanical impedance of the coupler, which is connected in series downstream. When a CCHA is used, the contact area between the vibrator and the ear cartilage is several times larger than that of the present attachment. Considering this, the mechanical impedance of the coupler simulating ear cartilage is reasonable.
Figure 10b shows that the sound pressure characteristics of the coupler simulating the ear cartilage and human cartilage conduction have a difference of approximately 10 dB below 500 Hz, although there is good agreement above 500 Hz. However, normal hearing is most sensitive in the frequency range of 300 to 4000 Hz. We assume that the coupler simulating the ear cartilage is sufficient for vibrator evaluations because it simulates the sound pressure characteristics of normal hearing within a sealed ear canal.
Figure 11 shows the mechanical equivalent circuit of the concha auriculae using the obtained mechanical impedance of the ear cartilage. The acoustic impedance ZA was negligible because it was sufficiently small.
Figure 12 shows the calculated characteristics of the mechanical impedance (F(ω)/ v(ω)) and the phase using the mechanical constants shown in the equivalent circuit. The blue lines in Figure 12 show the calculated characteristics. The grey plot in Figure 12 shows the average value of the measured ear cartilage from Figure 9. The mechanical constants shown in Figure 11 are consistent with the calculated and measured characteristics, which suggests that they are universal physical quantities of concha auriculae. These estimated results provide guidance for future developers of CCHAs. By representing the mechanical impedance when the vibrator is applied to the cartilage in an equivalent circuit, it can be utilized as a crucial design parameter when designing the vibrator and the associated CCHAs.
The transducer developed for CCHAs is promising for open-air type hearing aids that do not seal the ear, not only for external auditory canal atresia, but also for slight hearing difficulties. In this case, the output sound pressure must be evaluated using a measurement system that simulates actual wearing conditions. This study obtained an accurate mechanical impedance of the human ear cartilage using an attachment with a diameter of 6 mm.
Figure 13 shows a comparison of the mechanical impedance of the ear cartilage obtained in this study and that of the mechanical coupler specified in the IEC 60318-6. The mechanical impedance of the ear cartilage was 20 dB lower than that of the IEC 60318-6 mechanical coupler, even when considering the difference in the tip area (approximately 16 dB) between the two measurements.

5. Conclusions

In summary, based on the results of the measurements, the developed coupler simulating ear cartilage had a mechanical impedance close to that of the human ear cartilage. When measured using this coupler, the vibrator output characteristics of the cartilage conduction hearing aid (CCHA) had sound pressure characteristics close to those in the ear canal of normal hearing within sealed ear canals. This paper has outlined and demonstrated the utility of a method for evaluating the performance of CCHAs. We anticipate that discussions towards standardization will be initiated in the future.
The mechanical impedance characteristics of the human ear cartilage obtained in the measurements were approximately 20 dB lower than those of the mechanical coupler specified in the IEC 60318-6. To increase the number of hearing aid options for people with hearing loss, it is necessary to further develop and disseminate vibrators for CCHAs with the above data.

Author Contributions

Conceptualization, S.-i.I. and T.I.; methodology, S.-i.I. and T.I.; software, S.-i.I.; formal analysis, S.-i.I. and T.I.; investigation, S.-i.I. and K.W.; data curation, S.-i.I.; writing—original draft preparation, S.-i.I.; writing—review and editing, K.W. and T.I.; supervision, K.W.; K.W. and T.I. read and agreed with the published version of the manuscript. All authors have read and agreed to the published version of the manuscript.

Funding

This research was supported by the Program to Support the Development of Medical Equipment and Devices to Solve Unmet Medical Needs No. 25-076 (Ministry of Economy, Trade and Industry).

Institutional Review Board Statement

The study was conducted in accordance with the Declaration of Helsinki and approved by the Institutional Review Board of the Ethics Committee of the RION Technical Development Center (protocol code: 20220001; date of approval: 24 June 2022) in studies involving humans.

Informed Consent Statement

Informed consent was obtained from all the subjects involved in the study.

Data Availability Statement

The data presented in this study are available on request from the corresponding author. There is data that we restrict for ethical reasons.

Acknowledgments

We thank Tadashi Nishimura for their contributions to improving the quality of this manuscript.

Conflicts of Interest

Authors Shin-ichi Ishikawa, Keisuke Watanuki and Takashi Iwakura were employed by the company Technology Development Center, Rion Co., Ltd. The remaining authors declare that the research was conducted in the absence of any commercial or financial relationships that could be construed as a potential conflict of interest.

References

  1. World Health Organization. World Report on Hearing; World Health Organization: Geneva, Switzerland, 2021; ISBN 9789240020481. [Google Scholar]
  2. Reinfeldt, S.; Håkansson, B.; Taghavi, H.; Eeg-Olofsson, M. New developments in bone-conduction hearing implants: A review. Med. Devices 2015, 8, 79–93. [Google Scholar] [CrossRef] [PubMed]
  3. Hosoi, H.; Yanai, S.; Nishimura, T.; Sakaguchi, T.; Iwakura, T.; Yoshino, K. Development of cartilage conduction hearing aid. Arch. Mat. Sci. Eng. 2010, 42, 104–110. [Google Scholar]
  4. Shimokura, R.; Hosoi, H.; Iwakura, T.; Nishimura, T.; Matsui, T. Development of monaural and binaural behind-the-ear cartilage conduction hearing aids. Appl. Acoust. 2013, 74, 1234–1240. [Google Scholar] [CrossRef]
  5. Nishimura, T.; Hosoi, H.; Saito, O.; Shimokura, R.; Yamanaka, T.; Kitahara, T. Cartilage conduction hearing aids for severe conduction hearing loss. Otol. Neurotol. 2018, 39, 65–72. [Google Scholar] [CrossRef] [PubMed]
  6. Suwento, R.; Widodo, D.W.; Airlangga, T.J.; Alviandi, W.; Watanuki, K.; Nakanowatari, N.; Hosoi, H.; Nishimura, T. Clinical Trial for Cartilage Conduction Hearing Aid in Indonesia. Audiol. Res. 2021, 11, 410–417. [Google Scholar] [CrossRef] [PubMed]
  7. Nairn, E.M.; Chen, A.S.; Nishimura, T.; Berezovsky, A.; Stucken, E.Z. Hearing Outcomes of a New Cartilage Conduction Device vs. Bone Conduction Devices. Otolaryngol. Head Neck Surg. 2023, 168, 821–828. [Google Scholar] [CrossRef] [PubMed]
  8. Sakamoto, Y.; Shimada, A.; Nakano, S.; Kondo, E.; Takeyama, T.; Fukuda, J.; Udaka, J.; Okamoto, H.; Takeda, N. Effects of FM system fitted into the normal hearing ear or cartilage conduction hearing aid fitted into the affected ear on speech-in-noise recognition in Japanese children with unilateral congenital aural atresia. J. Med. Investig. 2020, 67, 131–138. [Google Scholar] [CrossRef] [PubMed]
  9. Nishiyama, T.; Oishi, N.; Ogawa, K. Who are good adult candidates for cartilage conduction hearing aids? Eur. Arch. Otorhinolaryngol. 2020; in press. [Google Scholar] [CrossRef]
  10. Nishimura, T.; Hosoi, H.; Saito, O.; Shimokura, R.; Yamanaka, T.; Kitahara, T. Sound localisation ability using cartilage conduction hearing aids in bilateral aural atresia. Int. J. Audiol. 2020, 59, 891–896. [Google Scholar] [CrossRef] [PubMed]
  11. Nishiyama, T.; Oishi, N.; Ogawa, K. Efficacy of cartilage conduction hearing aids in children. Int. J. Pediatr. Otorhinolaryngol. 2021; in press. [Google Scholar] [CrossRef]
  12. Nishimura, T.; Hosoi, H.; Sugiuchi, T.; Matsumoto, N.; Nishiyama, T.; Takano, K.; Sugimoto, S.; Yazama, H.; Sato, T.; Komori, M. Cartilage conduction hearing aid fitting in clinical practice. J. Am. Acad. Audiol. 2021; in press. [Google Scholar]
  13. Nishimura, T.; Hosoi, H.; Morimoto, C.; Okayasu, T.; Shimokura, R.; Kitahara, T. Comparison of Cartilage Conduction Hearing Devices Designed by Ear Impression and Computed Tomography. Appl. Sci. 2023, 13, 6152. [Google Scholar] [CrossRef]
  14. Kitama, T.; Nishiyama, T.; Iwabu, K.; Wakabayashi, T.; Shimanuki, M.N.; Hosoya, M.; Oishi, N.; Ozawa, H. Comparison of Cartilage Conduction Hearing Aid, Bone Anchored Hearing Aid, and ADHEAR: Case Series of 6 Patients with Conductive and Mixed Hearing Loss. Appl. Sci. 2022, 12, 12099. [Google Scholar] [CrossRef]
  15. Flottorp, G.; Solberg, S. Mechanical impedance of human headbones (forehead and mastoid portion of the temporal bone) measured under ISO/IEC conditions. J. Acoust. Soc. Am. 1976, 59, 899. [Google Scholar] [CrossRef] [PubMed]
  16. Chang, Y.; Nim, N.; Stenfelt, S. The development of a whole-head human finite-element model for simulation of the transmission of bone-conducted sound. J. Acoust. Soc. Am. 2016, 140, 1635–1651. [Google Scholar] [CrossRef] [PubMed]
  17. Håkansson, B.; Woelflin, F.; Tjellström, A.; Hodgetts, W. The mechanical impedance of the human skull via direct bone conduction implants. Med. Devices 2020, 13, 293–313. [Google Scholar] [CrossRef] [PubMed]
  18. Hosoi, H.; Nishimura, T.; Shimokura, R.; Kitahara, T. Cartilage conduction as the third pathway for sound transmission. Auris Nasus Larynx 2019, 46, 151–159. [Google Scholar] [CrossRef] [PubMed]
  19. Morimoto, C.; Nishimura, T.; Hosoi, H.; Saito, O.; Fukuda, F.; Shimokura, R.; Yamanaka, T. Sound transmission by cartilage conduction in ear with fibrotic aural atresia. J. Rehabil. Res. Dev. 2014, 51, 325–332. [Google Scholar] [CrossRef] [PubMed]
  20. Rahimi, A.; Mashak, A. Review on rubbers in medicine: Natural, silicone and polyurethane rubbers. Review on rubbers in medicine: Natural, silicone and polyurethane rubbers. Plast. Rubber Compos. 2013, 42, 223–230. [Google Scholar] [CrossRef]
  21. Sheiko, S.S.; Dobrynin, A.V. Architectural Code for Rubber Elasticity: From Supersoft to Superfirm Materials. Macromolecules 2019, 52, 7531–7546. [Google Scholar] [CrossRef]
  22. Shimokura, R.; Nishimura, T.; Hosoi, H. Vibrational and Acoustical Characteristics of Ear Pinna Simulators That Differ in Hardness. Audiol. Res. 2021, 11, 327–334. [Google Scholar] [CrossRef] [PubMed]
Figure 1. Position of the ear concha auriculae.
Applsci 14 01536 g001
Figure 2. Configuration of the coupler simulating the ear cartilage.
Applsci 14 01536 g002
Figure 3. Block diagram of the mechanical impedance measurement setup.
Applsci 14 01536 g003
Figure 4. (a) Impedance head and attachment bonding. (b) Attachment and concha auriculae contact. (c) Attachment and coupler simulating the ear cartilage contact.
Applsci 14 01536 g004
Figure 5. (a) Block diagram of sound pressure level measurement. (b) Earmold with the vibrator.
Applsci 14 01536 g005
Figure 6. (a) Modulus of the mechanical impedance of the human ear cartilage from concha auriculae in 34 ears of 17 subjects. (b) Phase of the mechanical impedance of the human ear cartilage from concha auriculae in 34 ears of 17 subjects.
Applsci 14 01536 g006
Figure 7. (a) Frequency characteristics of the mechanical resistance in subjects L and S before calculation. (b) Frequency characteristics of the mechanical reactance in subjects L and S before calculation. The inset shows an enlargement of the 100–200 Hz reactance data. (c) Frequency characteristics of the mechanical resistance ΔRL and ΔRS that excluded the effects of measurement systems for subjects L and S, respectively. (d) Frequency characteristics of the mechanical reactance ΔΧL and ΔΧS that excluded the effects of measurement systems in subjects L and S, respectively.
Applsci 14 01536 g007
Figure 8. Average mechanical impedance values plotted separately for the left and right ears for all subjects, and the average difference between the left and right ears.
Applsci 14 01536 g008
Figure 9. (a) Modulus of the mechanical impedance measured by the coupler simulating the ear cartilage and calculated average for the human ear cartilage. (b) Phase of the mechanical impedance measured by the coupler simulating the ear cartilage and calculated average for the human ear cartilage.
Applsci 14 01536 g009
Figure 10. (a) Measured sound pressure levels in the ear canal of 4 ears of 4 persons using human ear cartilage conduction. (b) (i) Sound pressure characteristics measured by the vibrator with the coupler simulating the ear cartilage. (ii) Sound pressure characteristics measured by the vibrator with an added mass of 1.5 g with a coupler simulating the ear cartilage. (iii) Average sound pressure characteristics for human ear cartilage conduction compiled from Figure 10a.
Applsci 14 01536 g010
Figure 11. Equivalent circuit estimation of the obtained mechanical impedance from the concha auriculae.
Applsci 14 01536 g011
Figure 12. (a) Modulus of the mechanical impedance calculated from the equivalent circuit shown in Figure 11 (b) Phase of the mechanical impedance calculated from the equivalent circuit shown in Figure 11.
Applsci 14 01536 g012
Figure 13. Comparison of the mechanical impedance of the IEC 60318-6 mechanical coupler with that of the ear cartilage obtained in this study. Grey plots are data from the coupler simulating the ear cartilage.
Applsci 14 01536 g013
Disclaimer/Publisher’s Note: The statements, opinions and data contained in all publications are solely those of the individual author(s) and contributor(s) and not of MDPI and/or the editor(s). MDPI and/or the editor(s) disclaim responsibility for any injury to people or property resulting from any ideas, methods, instructions or products referred to in the content.

