Article

Time-Varying Meshing Stiffness and Dynamic Parameter Model of Spiral Bevel Gears with Different Surface Roughness

1
Key Laboratory of Helicopter Transmission Technology, Zhuzhou 412002, China
2
School of Mechanical, Electronic and Control Engineering, Beijing Jiaotong University, Beijing 100044, China
3
Tangshan Research Institute of Beijing Jiaotong University, Tangshan 063000, China
*
Authors to whom correspondence should be addressed.
Appl. Sci. 2024, 14(4), 1533; https://doi.org/10.3390/app14041533
Submission received: 19 January 2024 / Revised: 6 February 2024 / Accepted: 11 February 2024 / Published: 14 February 2024
(This article belongs to the Section Acoustics and Vibrations)

Abstract

:
In order to explore the time-varying mesh stiffness and dynamic parameters of bevel gears with different surface roughness, the fractal dimension and characteristic scale coefficient are calculated to determine the fractal dimension of tooth surfaces of spiral bevel gears with rough features. Spiral bevel gears with distinct surface roughness are obtained by simulating the gear-cutting process, and after analysis, a dynamic differential equation for spiral bevel gears considering the surface roughness is proposed. By combining the differential equation with finite element analysis (FEA), the time-varying mesh stiffness of spiral bevel gears with various surface roughness is determined. FEA analysis yields the time-varying mesh stiffness under different surface roughness. The vibration velocity and acceleration of spiral bevel gears with different surface roughness are revealed by combining the time-varying mesh stiffness with the dynamic equation. The intricate relationship between gear surface microstructure and its mechanical behavior during engagement is thoroughly analyzed. A comprehensive dynamic parameter model is proposed to capture the influence of microtopological changes on gear dynamics. The results can offer valuable insights for the design and optimization of bevel gears, aiming to enhance their performance and durability.

1. Introduction

Spiral bevel gears are widely applied in complex surface conjugate gear meshes within space transmission systems. Its advantages include a compact structure, large torque capacity, and high efficiency. However, factors such as time-varying stiffness, nonlinear contact, and friction during the meshing process lead to vibration and noise in the transmission system, affecting its operational stability and lifespan. Therefore, studying the dynamic characteristics of spiral bevel gear transmission systems is a crucial approach to enhancing their design and manufacturing levels.
Pei et al. [1] established a transient mixed lubrication model and a two-degrees-of-freedom torsional dynamic model for spiral bevel gears, considering time-varying contact parameters and defects on the meshing path. Chen et al. [2] proposed an analysis model that accurately and effectively calculates the nonlinear excitation and loading meshing characteristics of spiral bevel gears. Li [3] presented a formula describing the mechanical power loss of gear meshing under the conditions of coupling the equations of six-degrees-of-freedom motion and thermal mixed elastohydrodynamic lubrication and study the dynamic characteristics under the conditions of interaction between gear dynamics and tribology. Wang et al. [4] proposed a numerical calculation model for time-varying meshing stiffness considering gear cracks and compared this model with the finite element method. The model allows for faster calculation of time-varying meshing stiffness in spiral bevel gears. Yin et al. [5] proposed an interface characteristic model for a gear system considering the roughness of wheel teeth, affecting oil film distribution, contact damping, and friction. They investigated the dynamic characteristics of the gear system under different roughness and input torque conditions. Wang et al. [6] proposed a new calculation model for meshing power loss in planetary gearsets, considering gear surface roughness based on the elastohydrodynamic lubrication method.
In the process of studying the impact of gear surface roughness on dynamics, it is crucial to accurately establish gear models with different surface roughness. Investigating how to accurately establish spiral bevel gear models with different surface roughness is the foundation of this research. Patir [7] proposed generating Gaussian friction surfaces using known spectral density functions. Spedding [8] proposed simulating rough surfaces through time series. Ausloos et al. [9] substituted multiple surface parameter variables into the W m function to describe the height distribution of spatial surfaces. Meng et al. [10], based on fractal geometry theory, proposed an anisotropic three-dimensional fractal rough surface model. They established a six-degrees-of-freedom model to explore the impact of fractal parameters on gear dynamics.
Ding et al. [11] proposed a novel semi-finite element predictive model to address the accurate dimensions, directions, and positions of dynamic meshing impact under high-speed and heavy-load conditions in spiral bevel gear transmission. Liu et al. [12] proposed a 12-degrees-of-freedom dynamic model and investigated the nonlinear dynamic behavior of a central bevel gear system considering internal and external excitations. When considering the relationship between tooth surface friction and dynamics, the selection of the friction coefficient needs to be studied, focusing on the choice of the friction coefficient [13,14,15]. Britton et al. [16] analyzed the surface roughness of ground and superfinishing tooth surfaces. Simultaneously, the study investigated the impact of the smoothness of the processed tooth surface on the dynamic characteristics of the gear pair, finding that the low surface roughness of superfinished wheel teeth significantly improves the gear dynamics. The roughness parameters in these studies were directly measured in experiments, and mathematical models for tooth surface roughness were not considered when establishing the gear dynamic model. Schleich et al. [17] studied the surface morphology of gears and believed that fractal theory could describe surface waviness and roughness. Chen et al. [18] constructed the W m fractal function to characterize the nonlinear random clearances of gears using fractal theory. They compared and studied the impact of nonlinear random clearances on gear dynamics. Sayles et al. [19] pointed out that the engineering surface is a nonstationary random surface. Due to different gear manufacturing processes, such as hobbing and grinding, gears’ surfaces exhibit varying roughness. This paper proposes an eight-degrees-of-freedom dynamic analysis method that takes into account the diverse microgeometries of tooth surfaces. The method is employed to analyze the influence of tooth surface microgeometries on time-varying mesh stiffness and vibration characteristics.
In the realm of gear dynamic research considering errors, Bonori and Pellicano [20] established a gear dynamic model incorporating random manufacturing errors and analyzed the impact of randomly distributed profile errors on dynamics. Inalpolat et al. [21] studied gear dynamic characteristics mainly driven by long-period quasi-static transmission errors induced by pitch errors. Wang and Zhang [22] decomposed transmission errors into harmonic components and random components, proposing a dynamic analysis model for gear systems considering random errors. Chang et al. [23] investigated the calculation method of comprehensive meshing errors in gears and their impact on system vibration. Shi et al. [24] introduced the concept and acquisition method of overall gear pair errors and studied the gear dynamic behavior considering overall errors. Huang et al. [25] conducted research on the nonlinear dynamics of gears under the influence of roughness based on fractal theory. However, the simplified pure torsional model is currently the most commonly used. FEA methods provide adequate means to achieve a higher degree of engineering component safety and accurate service life prediction [26].
Based on the aforementioned research, a dynamic parameter solution model for spiral bevel gears, considering the microtopography of tooth surfaces, has been proposed in the paper. Models for spiral bevel gears with different fractal dimensions have been established, and finite element analysis has been employed to address time-varying mesh stiffness under various fractal dimensions. Initially, models for spiral bevel gears with different surface roughness have been developed, with surface roughness characterized by the profile arithmetic mean deviation, an early parameter proposed for roughness evaluation, still widely adopted internationally. The relationship between roughness, fractal dimension, and characteristic scale factor has been provided by Ge et al. [27,28] based on experimental determinations. Through model simulation and numerical calculations, parameters such as vibration velocity, vibration acceleration, and time-varying mesh stiffness of the spiral bevel gears have been obtained. The vibration characteristics of spiral bevel gears under different surface roughness have been deduced through comparative analysis of results, highlighting the significance of this method in examining the dynamic characteristics of spiral bevel gears with diverse surface microtopographies.

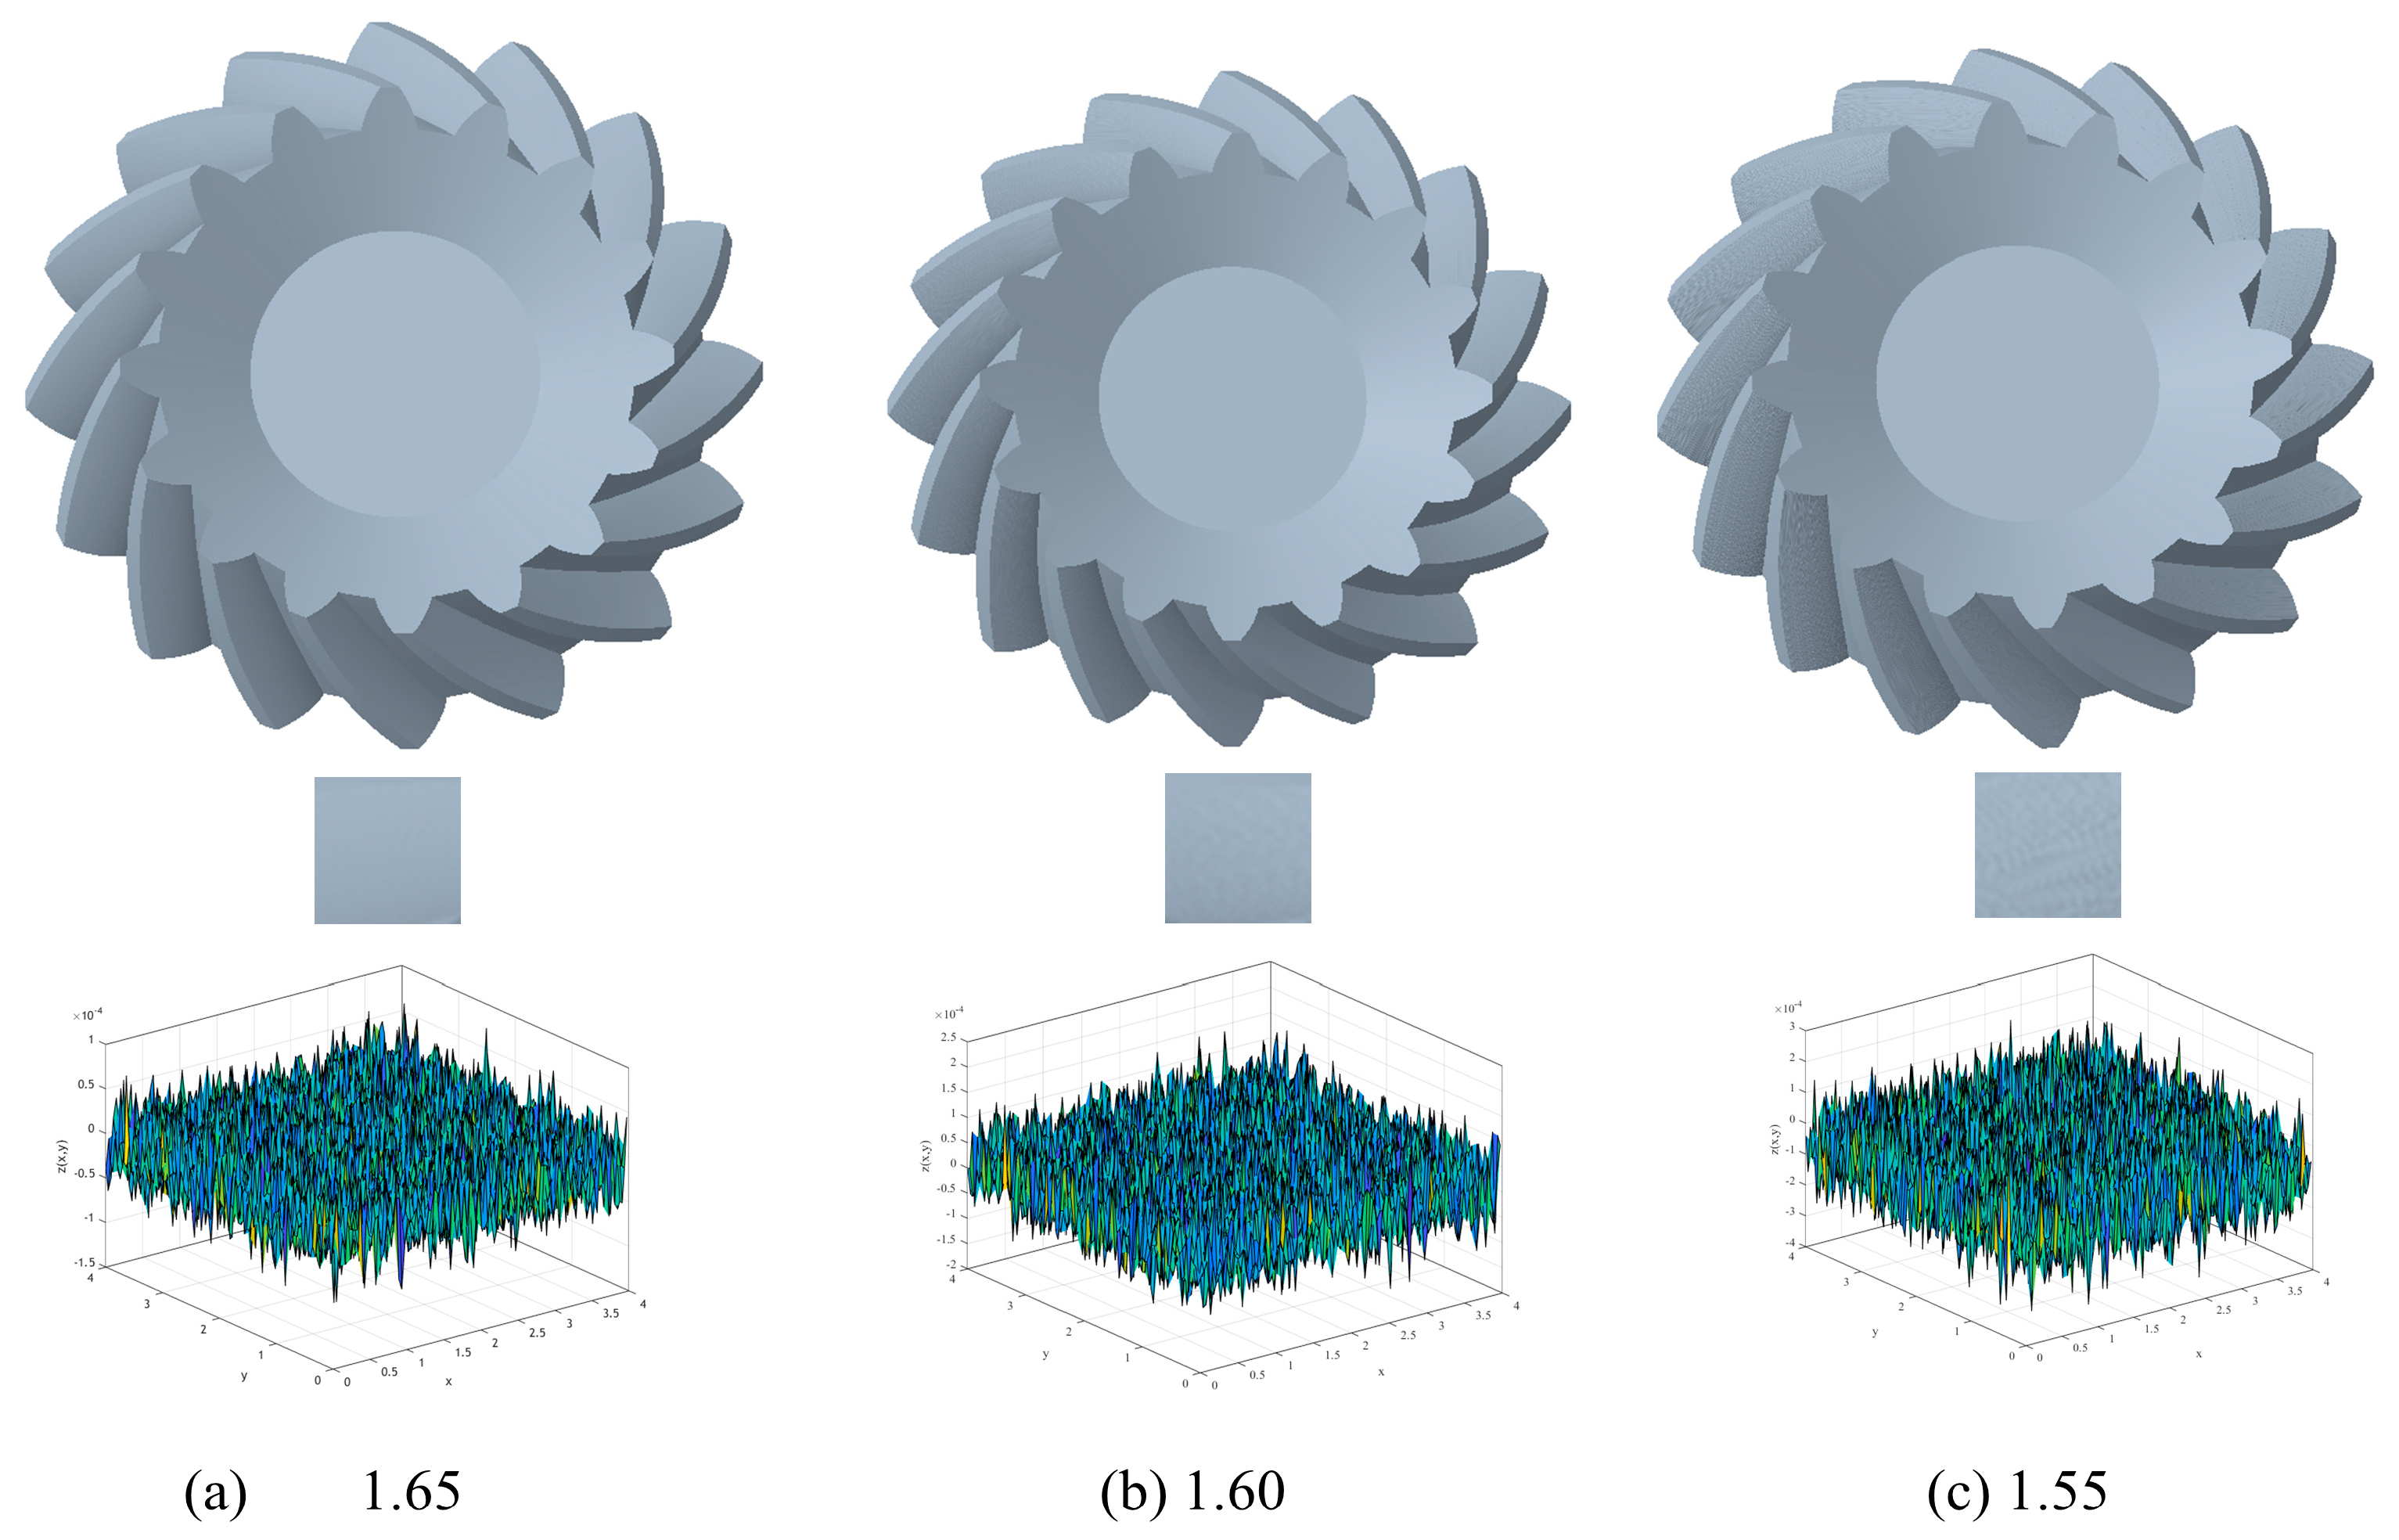
2. Establishment of Tooth Surfaces with Different Roughness

With the continuous development of science and technology, the measurement of rough surfaces has become increasingly precise. Simultaneously, because rough surfaces are random and discrete, direct research on rough surfaces lacks representative significance for tribology. Therefore, numerous scholars employed various functions to simulate the topography of rough surfaces. Currently, the main methods for simulating rough surfaces using fractal theory include fractal Brownian motion simulation, inverse Fourier transform simulation, W-M function simulation, fractal interpolation simulation, time series simulation, and composite fractal simulation. The W-M function simulation method [29] is adopted in the paper. To simplify calculations, the W-M function commonly used to simulate surface roughness is expressed by the following formula:
z ( x ) = G ( D 1 ) n = n l γ ( 2 D ) n cos ( 2 π γ n x )
where x represents the displacement coordinate of the profile; z(x) represents the random profile height; D is the fractal dimension of the surface profile, used to indicate the complexity of the surface profile at all scales; G is the characteristic scale factor reflecting the magnitude of z(x); γ represents the randomly distributed surface following a normal distribution, usually set to γ = 1.5; and nl represents the order corresponding to the lowest cutoff frequency in the profile curve, typically set to nl = 0.
The fractal dimension D and characteristic scale factor G can be estimated from the power spectrum of the W-M function, as given by the following Equation (2):
S ( w ) = G 2 ( D 1 ) 2 ln γ 1 w ( 5 2 D )
where w represents the operating frequency of the measuring instrument, which is the reciprocal of the wavelength of the surface profile roughness.
This approach involves the generation of spiral bevel gears with varying surface roughness by employing distinct involute profiles. The surface roughness of the spiral bevel gears is altered by modifying the fractal dimension. The relationship between the fractal dimension and roughness is utilized to establish spiral bevel gears with different levels of roughness.
The creation of gears is obtained through the stretching of involutes. Therefore, the representation of gear surface roughness can be achieved by obtaining involutes of different shapes. The involute gear is obtained through the involute formula and is calculated using MATLAB software (2022a Edition) for spiral bevel gears. The formula for the large-end involute of a spiral bevel gear is shown in Equation (3):
{ x = R cos θ + π R θ sin θ / 180 y = R sin θ π R θ cos θ / 180
The small-end involute of a spiral bevel gear is expressed, as shown in Equation (4):
{ x = r cos θ + π r θ sin θ / 180 y = r sin θ π r θ cos θ / 180
Firstly, the involute of the spiral bevel gear is obtained by determining the basic parameters of the gear. The involute is then generated in MATLAB software (2022a Edition). Subsequently, the fractal dimension is introduced into the involute of the gear to obtain an involute with roughness characteristics. Using the involute with roughness as the gear-cutting curve, the tooth surface is cut and drawn to produce the spiral bevel gear with a defined roughness.
Figure 1 displays involute profiles established with fractal dimensions of 1.65, 1.60, and 1.55. A larger fractal dimension results in a smoother involute, corresponding to a smaller roughness. Utilizing these different roughness involutes, finite element models of spiral bevel gears are established using software (such as Creo) to serve as finite element models for simulation.
The involute profiles of spiral bevel gears are computed for different fractal dimensions using Equations (2)–(4). Diverse machining traces of the spiral bevel gears are obtained based on the variations in involute profiles. In Figure 2, tooth surface images under different machining traces demonstrate that a smaller fractal dimension leads to more pronounced machining traces and higher surface roughness.
The spiral bevel gears with roughness levels are machined by common machining methods, as detailed in Table 1. So, the appropriate machining approach is chosen based on the specified requirements for tooth surface roughness.

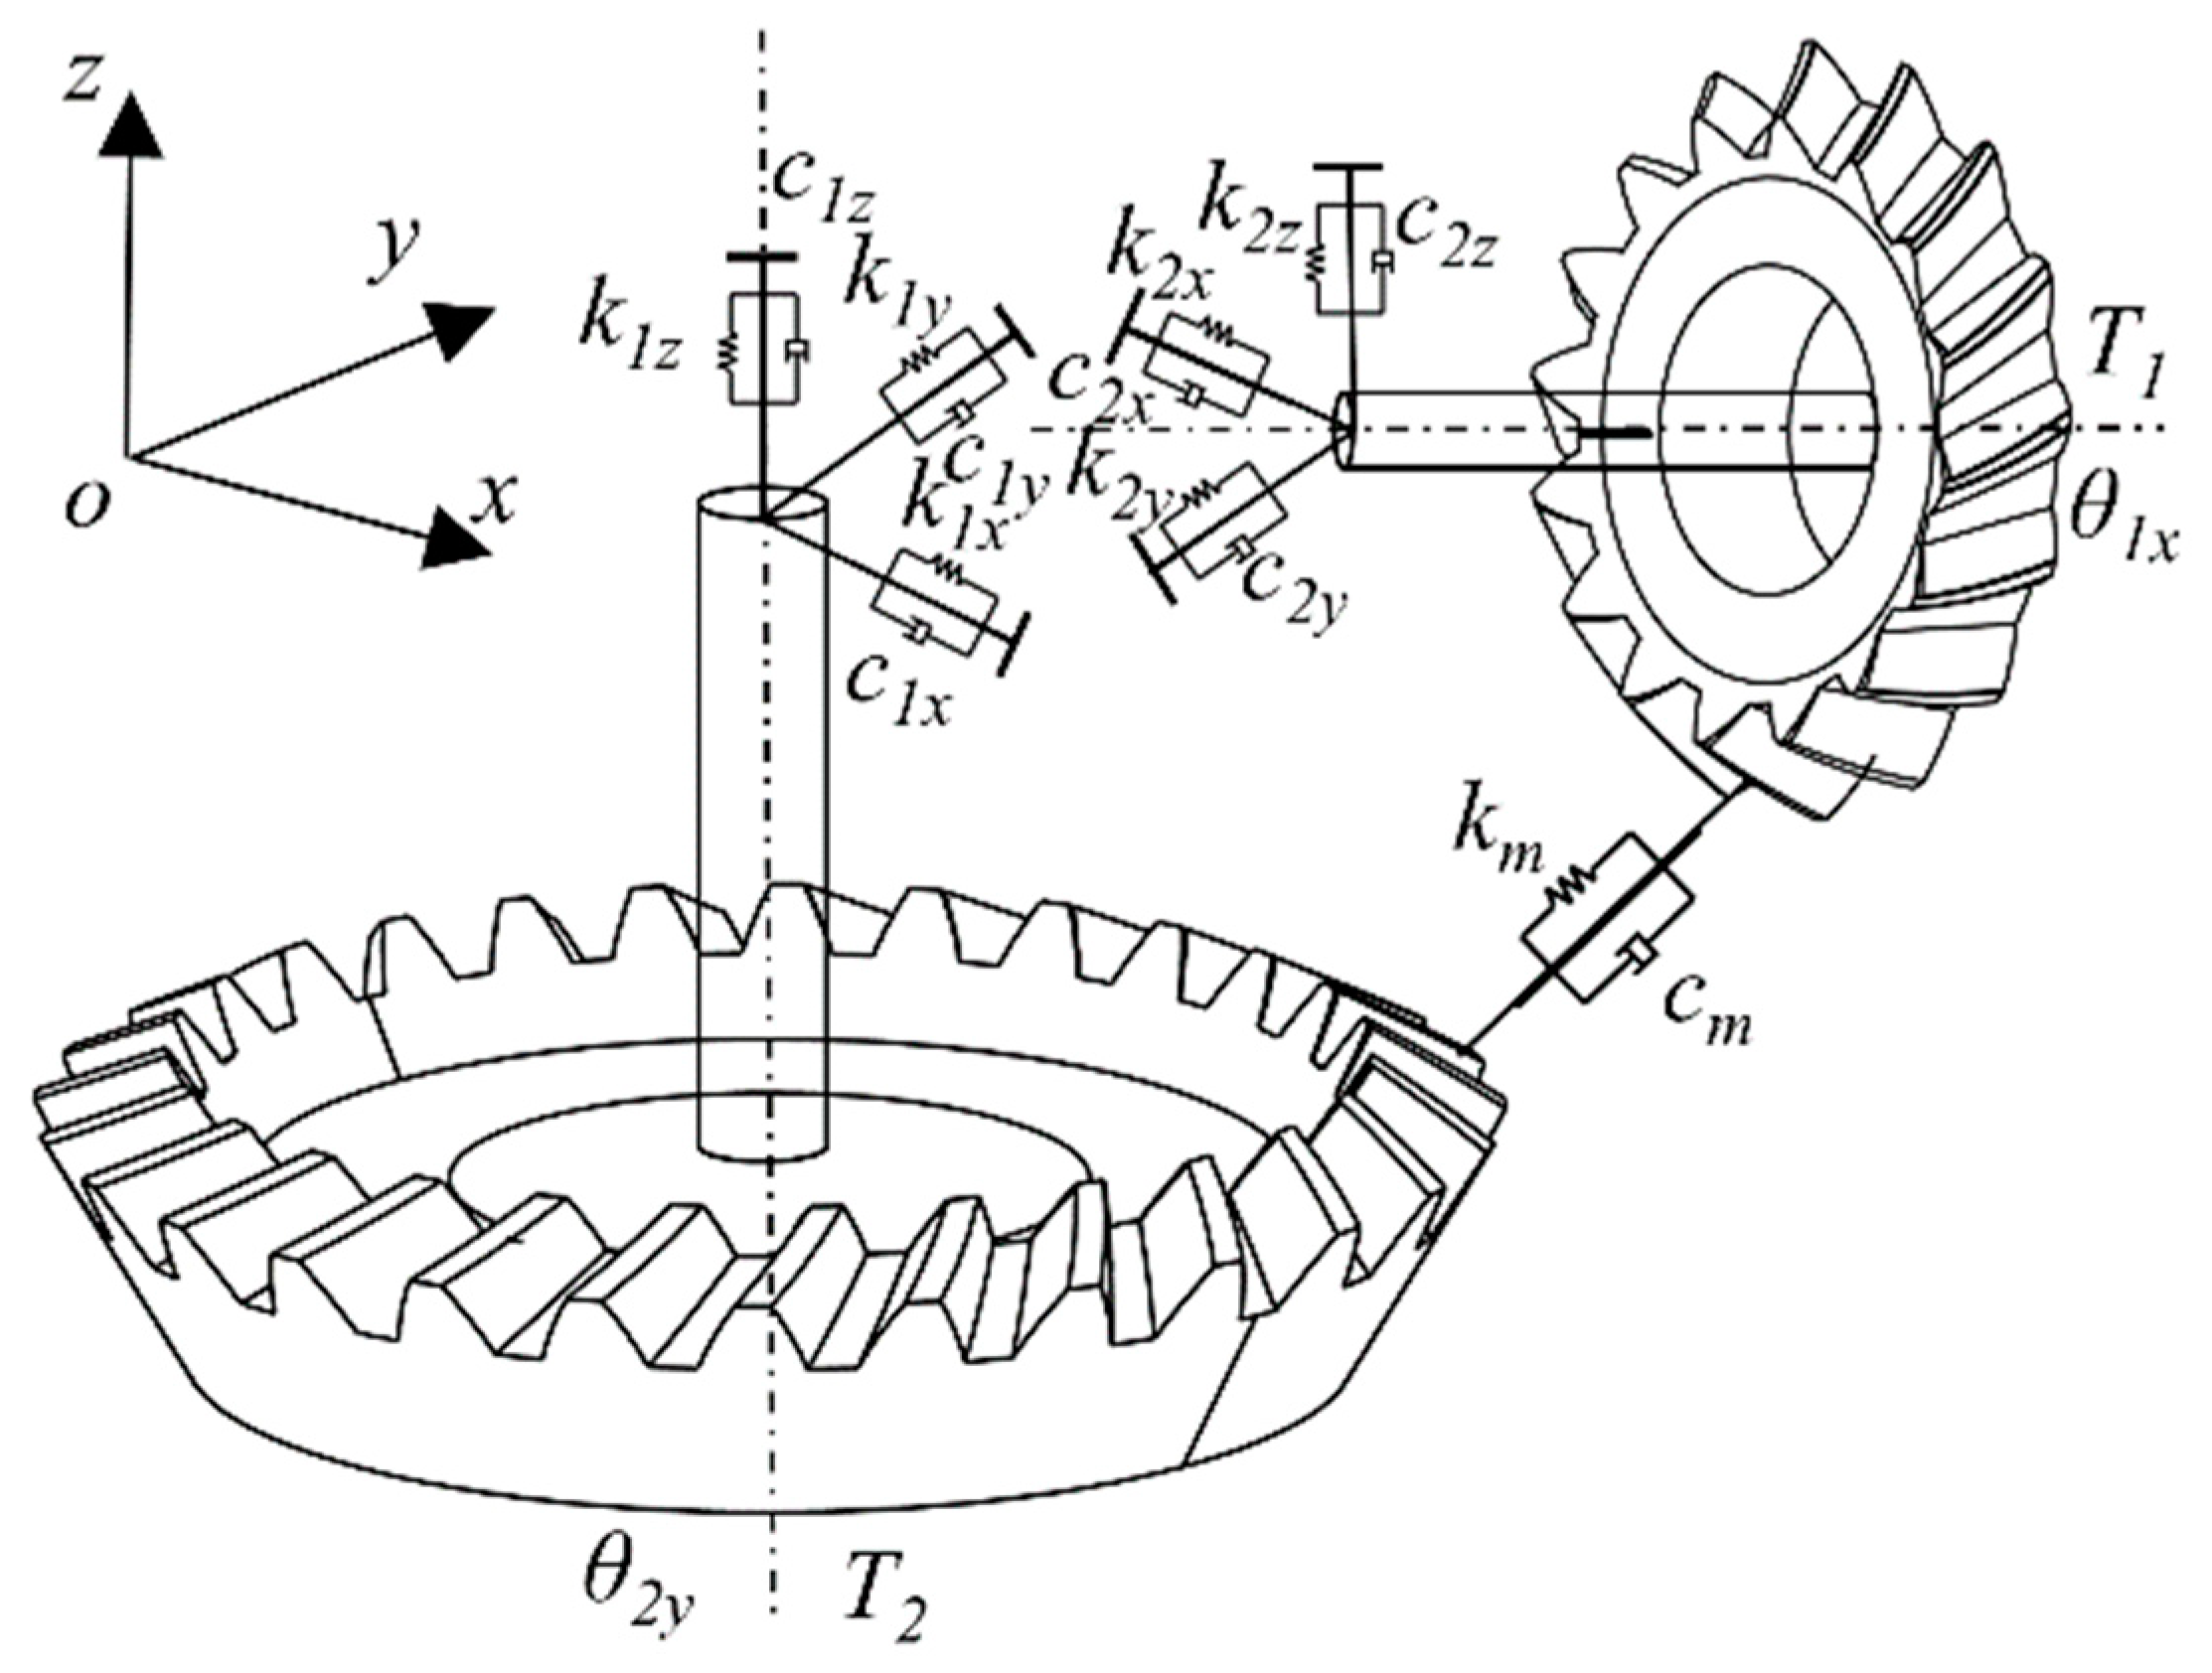
3. Establishment of the Dynamic Model for Spiral Bevel Gears

3.1. Dynamic Transmission Error

Dynamic transmission error mainly occurs when the gear does not operate at the speed dictated by the gear ratio. Dynamic transmission error is a primary dynamic parameter of gears and can be expressed in terms of angles. It can be represented by the following formula:
δ ( φ 1 ) = ( φ 2 φ 2 0 ) i 21 ( φ 1 φ 1 0 )
where φ10 and φ20 represent the initial angular positions of the small and large gears, respectively, while φ1 and φ2 represent their actual angular positions. Z1 and Z2 denote the number of teeth on the small and large gears, respectively [30].
Gear transmissions are inherently conjugate, ensuring a constant transmission ratio. Therefore, under normal circumstances, the transmission error is zero. However, in actual gear transmissions, the gears are subjected to forces, and the rotational motion between two gears deviates from the ideal transmission ratio, leading to the generation of dynamic transmission error.
The linearity of transmission error can be derived by taking the following:
( φ 2 φ 2 0 ) = F ( φ 1 φ 1 0 )
Performing a Taylor series expansion, we can obtain the following:
F ( φ 1 φ 1 0 ) = m 21 ( φ 1 φ 1 0 ) + 1 2 m · 21 ( φ 1 φ 1 0 ) 2 + 1 6 m · · 21 ( φ 1 φ 1 0 ) 3
Omitting higher-order terms in the formula, the expression for the transmission error is as follows:
δ ( φ 1 ) = 1 2 m · 21 ( φ 1 φ 1 0 ) 2
Equation (8) indicates a quadratic parabolic equation for calculating the transmission error. A negative value assigned to the first derivative of m21 results in a downward-opening parabolic curve for the transmission error. Dynamic transmission error curves for spiral bevel gears are derived by shifting each graph following the engagement cycle. The impact of the transmission error curve is twofold: Firstly, the acceleration curve of the quadratic parabolic transmission error affects the dynamic characteristics of the gear pair at the engagement transition point. Secondly, the angle between the two tangents at the meshing transition point influences the gear pair’s dynamic performance, with an increase in the angle reducing the impact on the gear teeth. Figure 3 illustrates the process of toothcontact analysis.
The TCA (tooth contact analysis) method is conducted by applying the principles of contact mechanics to calculate parameters such as contact stress, contact area, and contact pressure distribution on gear tooth surfaces. The contact stress, contact area, and pressure distribution mentioned in the text are reflected in subsequent sections through finite element analysis. This typically involves numerical simulation methods and finite element analysis, with subsequent analysis primarily developed using finite element methods.

3.2. Tooth Flank Normal Clearance

Gear contact forms elliptical contact patches, which are created by the movement of the contact path. During loading, tooth surfaces contact each other and deform elastically, forming an elliptical contact area according to the Hertzian contact theory. Consider establishing a plane tangent to both tooth surfaces, with S0 as the coordinate of the contact point on the tooth surfaces, M as the contact point between the two tooth surfaces, and n0 as the common normal vector at the contact point. Let Q be a point on the major axis of the contact ellipse, and its position vector is given by the following:
r O ( Q ) = r O ( M ) + M Q
When determining the tooth surface clearance in the context of spiral bevel gear contact, where Q point is situated on any point along the major axis of the contact ellipse, it becomes crucial to draw a line passing through point Q with a direction parallel to the common tangent at the contact point. The Equation (9) for line L passing through point Q is given by the following:
x x Q n x = y y Q n y = z z Q n z
Combine this line with the tooth surface Equation (12) to obtain the meshing point. The distance between the two meshing points is the spacing of the tooth surface at that location. The tooth surface Equation (12) is derived from the gear processing tool. When machining spiral bevel gears using the tilted cutter method, the tooth surface Equation (12) is transformed based on the surface Equation (12) of the machining tool. The tools used for machining spiral bevel gears using the tilted cutter method are divided into inner cutters and outer cutters. A three-dimensional model of the gear tool is established using simulation software for analysis.
In the established coordinate system, Sd (Xd, Yd, and Zd) is rigidly connected to the gear tool, and the coordinate axes rotate with the cutter. The parameters of the gear tool are represented in the Sd coordinate system. The inner cutter radius and outer cutter radius are denoted as r1 and r2, and u1 and u2 represent the surface parameters of the gear tool. The sign of u1 and u2 is determined based on whether they are in the same direction as the Z-axis. The tool relief angle for the inner cutter is α1, and for the outer cutter is α2—positive values for the inner cutter and negative values for the outer cutter. The cutting surface Equation (11) for the spiral bevel gear tool is derived based on the established tool model and coordinate relationships:
r k ( u k ) = [ r k + u k sin α k r k + u k sin α k u k cos α k 1 ]
Here, k = 1, 2 represents the inner cutter and outer cutter, and the meanings are the same in the following Equation (12).
The matrix in the formula represents the coordinate transformation matrix from the cutter disk coordinates to the workpiece coordinates. The specific coordinate transformation matrix, derived from the relationship between the previously mentioned cutter disk coordinate system and the workpiece coordinates, is as follows:
M m c M c j M j i M i t = [ cos ( φ q ) sin ( φ q ) 0 0 sin ( φ q ) cos ( φ q ) 0 0 0 0 1 0 0 0 0 1 ] [ sin j cos j 0 S t cos j sin j 0 0 0 0 1 0 0 0 0 1 ] [ cos i 0 sin i 0 0 1 0 0 sin i 0 cos i 0 0 0 0 1 ] [ cos θ sin θ 0 0 sin θ cos θ 0 0 0 0 1 0 0 0 0 1 ]
According to the relationship between the generating wheel and the workpiece coordinates, following the previous method, the tooth surface Equation (12) and the unit normal vector in the workpiece coordinate system can be obtained through the coordinate transformation matrix as follows:
r w ( u k , θ ) = M w h M h s M s m r m ( u k , θ )
n w ( u k , θ ) = L w h L h s L s m n m ( u k , θ )
The coordinate transformation matrix for the unit normal vector, without considering positional changes, is obtained by removing the last row and column. Based on the derived formula for the tooth surface of the spiral bevel gear, the manufacturing parameters of the spiral bevel gear have an impact on the generated gear. In accordance with the manufacturing process of the spiral bevel gear, a series of coordinate transformations are applied to convert the cutter disk’s Equation (11) on the tooth surface into the workpiece coordinate system, thereby obtaining the tooth surface Equation (12) in the workpiece coordinate system. The matrix transformation leading to the obtained expression is represented as follows:
M w h M h s M s m = [ 1 0 0 0 0 cos ψ sin ψ 0 0 sin ψ cos ψ 0 0 0 0 1 ] [ cos γ m 0 sin γ m X p 0 1 0 0 sin γ m 0 cos γ m 0 0 0 0 1 ] [ 1 0 0 0 0 1 0 E m 0 0 1 X b 0 0 0 1 ] L w h L h s L s m = [ 1 0 0 0 cos ψ sin ψ 0 sin ψ cos ψ ] [ cos γ m 0 sin γ m 0 1 0 sin γ m 0 cos γ m ] [ 1 0 0 0 1 0 0 0 1 ]
Combining Equation (10) with the tooth surface Equation (12), we can obtain the two intersection points, P1(x1, y1, z1) and P2 (x2, y2, z2), of the line L with the two tooth surfaces. Using these two intersection points, we can calculate the distance between them, which represents the tooth surface normal gap between the two tooth surfaces:
d = ( x 1 x 2 ) 2 + ( y 1 y 2 ) 2 + ( z 1 z 2 ) 2
Following the principles outlined above for drawing the spiral bevel gear model, simulate the gear-cutting process during gear drawing, where the gear-cutting tool is illustrated, as shown in Figure 4. Perform coordinate transformations according to Equations (12) and (13) and use the relationships to convert the gear from the gear cutter disk to the gear surface for the cutting process.

3.3. Loaded Tooth Contact Analysis (LTCA)

Referring to the work of Mu et al. [31], the LTCA method is employed to optimize the formula for solving transmission errors in this approach. The tooth surface gap values obtained from Equation (14) are further utilized for the gear LTCA. The following figure illustrates the contact analysis:
The initial gap between the teeth of the wheel before deformation can be expressed as the following:
w k = δ k + d k         ( k = 1 , 2 )
where the initial gap is a collection of initial gaps at each position, and the normal gap and intertooth gap are collections of gaps at each position:
{ w k = [ w 1 , , w i , w n ] T d k = [ d 1 , , d i , d n ] T δ k = δ k [ 1 , , 1 , 1 ] T
where n represents the number of discrete points taken, and di is the tooth surface normal gap at the i-th discrete point. As derived from Equation (14), δ i represents the tooth gap before deformation. This can be obtained from Equation (15).
It can be observed that under the action of discrete load P, the gear undergoes elastic deformation. Assuming the small gear is fixed, and the large gear experiences a normal displacement Z due to the load, the coordinated Equation (17) for the deformed displacement is as follows:
F k p k + w k = Z + s k   ( k = 1 , 2 )
The main focus of dynamic analysis is on the transmission error obtained from LTCA. The definition of transmission error in a gearbox, based on the transmission model, is presented in this paper, taking into account surface contact. Transmission error is defined as the product of the difference between the actual measured output position and the measured input position, multiplied by the gear transmission ratio. The LTCA module is implemented through the MASTA software (2022a Edition), enabling the analysis of time-varying mesh stiffness and tooth surface forces for spiral bevel gears [32,33].
Based on the gear surface Equation (12), the expression of the gear surface Equation (18) in their respective coordinate systems is obtained:
r i ( u i , θ i ) C 2 r i u i × r i θ i 0 ( u i , θ i ) E i ( i = 1 , 2 )
Two distinct tooth surfaces are denoted by subscripts 1 and 2. The unit normal vector of the curved surface is represented as follows:
n i = r u i × r i θ i | r u i × r i θ i |
Pinion 1 is presumed to rotate about a fixed axis in the rigid coordinate system Sm, while gear 2 rotates about another fixed axis in the assumed coordinate system Sq. The position and orientation of Sq relative to Sm simulate installation errors, consolidating all installation errors into gear 2. The representation of the two tooth surfaces in Sm is formulated as the following:
r m ( 1 ) = M m 1 r 1 r m ( 2 ) = M m q M q 2 r 2
The unit normal vector is represented in the Sm coordinate system as the following:
n m ( 1 ) = L m 1 n 1 r m ( 2 ) = L m q L q 2 n 2
where M is the position transformation matrix, and L is the vector transformation matrix.
By using the established gear surface Equation (12) in the rigidly fixed coordinate system Sm of the frame, an engagement contact analysis of the gear surface Equation (12) is performed. It is required that they coincide in a certain position in terms of normal direction and position vector, as shown in Figure 5. The contact Equations (22) and (23) of the gear pair can be expressed as the following:
r m ( 1 ) ( u 1 , θ 1 , φ 1 ) = r m ( 2 ) ( u 2 , θ 2 , φ 2 )
n m ( 1 ) ( u 1 , θ 1 , φ 1 ) = n m ( 2 ) ( u 2 , θ 2 , φ 2 )
Combining the tooth surface Equation (12) for spiral bevel gears, the solution is obtained using Equations (21) and (22). Taking the rotation angle φ1 of the pinion 1 as the independent variable, the meshing points on the tooth surface can be determined. Substituting the rotation angle of gear 2 into Equation (5) yields the transmission error for spiral bevel gears [34].
The spiral bevel gear transmission system can be equivalent to an eight-degrees-of-freedom dynamic model, where the system’s degrees of freedom are represented as a column vector:
Q = { X 1 , Y 1 , Z 1 , θ 1 x , X 2 , Y 2 , Z 2 , θ 2 y }
where Xi, Yi, and Zi (i = 1, 2) represent the pinion and gear’s movements along the x-axis, y-axis, and transverse z-axis, respectively. θ1x and θ2y represent the torsional vibrations of the pinion around the x-axis and the passive gear around the y-axis. The relative displacement along the normal direction of the meshing points on the tooth surfaces due to vibration and errors is given by the following equation:
λ n = ( x 1 x 2 ) a 1 ( y 1 y 2 ) a 2 [ ( z 1 + r 1 θ 1 y ) ( z 2 + r 2 θ 1 x ) ] a 3 e n ( t )
The parameters a1, a2, and a3 are related to the pressure angle and spiral angle. en(t) represents the normal static error of the gear pair; r1 and r2 are the meshing point radius.
The tooth profile error is expressed using a sine harmonic function:
e n ( t ) = e 0 + e r cos ( Ω h t + φ )
where e0 and er are the constant and amplitude of the meshing error, with e0 typically being 0; Ω h is the meshing frequency; and φ is the phase angle, typically set to φ = 0.
The normal dynamic load and force components along the coordinate directions during the meshing of the gear pair are as follows:
{ F n = k n ( t ) λ n + c h λ · n F x = F n a 4 F y = F n a 5 F z = F n a 6
The time-varying meshing stiffness is given by the following equation:
k h ( t ) = k m + l = 1 n A k l cos ( l Ω h t + Φ k l )
where ch represents the meshing damping; km is the average meshing stiffness; Ak1 is the amplitude of the l-th harmonic of the stiffness; Φ k l is the initial phase of the l-th harmonic of the stiffness. The meshing stiffness of the spiral bevel gear can be obtained and fitted according to the principles of LTCA. In this study, it is obtained and fitted through finite element analysis (FEA). According to empirical formulas, the meshing damping of the gear is given by the following equation:
c h = 2 ξ g k h J 1 J 2 R 1 2 R 2 2 R 1 2 J 1 + R 2 2 J 2
where, J1 and J2 are the moments of inertia for the pinion and wheel; R1 and R2 are the base circle radii for the pinion and wheel; ξ is the meshing damping ratio; and ξ is taken as 0.1 in this study. ch represents damping in tooth surface contact, and it is applied to the damping results in three directions in the general equation of dynamic Equation (36).
Considering the influence of friction on the dynamic process, the relationship between the friction coefficient and friction force is first examined. According to empirical formulas, the friction coefficient can be expressed as the following:
μ = μ 0 + μ r · R
where μ0 is the static friction coefficient between surfaces. In the case of metal–metal friction, it typically ranges from 0.6 to 1.0. For this study, considering good lubrication conditions, we use μ0 = 0.6. μr is an additional friction coefficient related to roughness, which can vary with changes in roughness. In this study, we use μr = 0.01. R is the effective roughness between the contacted surfaces [35].
The relationship between the roughness R and fractal dimension D is commonly approximated as the following:
R = C L ( 1 D )
where R represents roughness, typically the root mean square roughness of the surface. D stands for the fractal dimension, describing the geometric complexity of the surface. L represents the characteristic scale on the surface, also known as the measurement length. C is a constant related to the specific system and measurement units. In this study, C = 1 is adopted, and Table 2 gives the result.
The friction force is expressed as the following:
F f = μ F n
D = 1.515 / R a 0.088
G = 10 5.26 / R a 0.042
The integrated relationship between the friction coefficient and the fractal dimension is obtained as follows:
μ = μ 0 + μ r ( C L ( 1 D ) )
Combining the above analysis, this paper establishes an eight-degrees-of-freedom dynamic model for spiral bevel gears, considering the fractal dimension. The model decomposes friction forces in various directions. Incorporating Newton’s second law, the dynamic equation for spiral bevel gears considering the fractal dimension are derived as follows:
{ m 1 X · · 1 + c x 1 X · 1 + k x 1 X 1 = F x F f 1 x m 1 Y · · 1 + c y 1 Y · 1 + k y 1 Y 1 = F y F f 1 y m 1 Z · · 1 + c z 1 Z · 1 + k z 1 Z 1 = F z F f 1 z J 1 θ · · 1 x = T 1 F z r 1 + F f r f 1 x m 2 X · · 2 + c x 2 X · 2 + k x 2 X 2 = F x F f 2 x m 2 Y · · 2 + c y 2 Y · 2 + k y 2 Y 2 = F y F f 2 y m 2 Z · · 2 + c z 2 Z · 2 + k z 2 Z 2 = F z F f 2 z J 2 θ · · 2 x = T 2 F z r 2 + F f r f 2 x
where, m1 and m2 are the masses of the pinion and wheel; cij and kij (i = x, y, z; j = 1, 2) are the damping and stiffness coefficients of the pinion and wheel along the x, y, z directions; T1 is the input torque; and T2 is the load torque. Ffij represents the component of frictional force along the j direction on gear i; ri is the lever arm of the normal force component on tooth i; and rfix is the lever arm of the frictional force on tooth i.

4. Calculating Time-Varying Mesh Stiffness

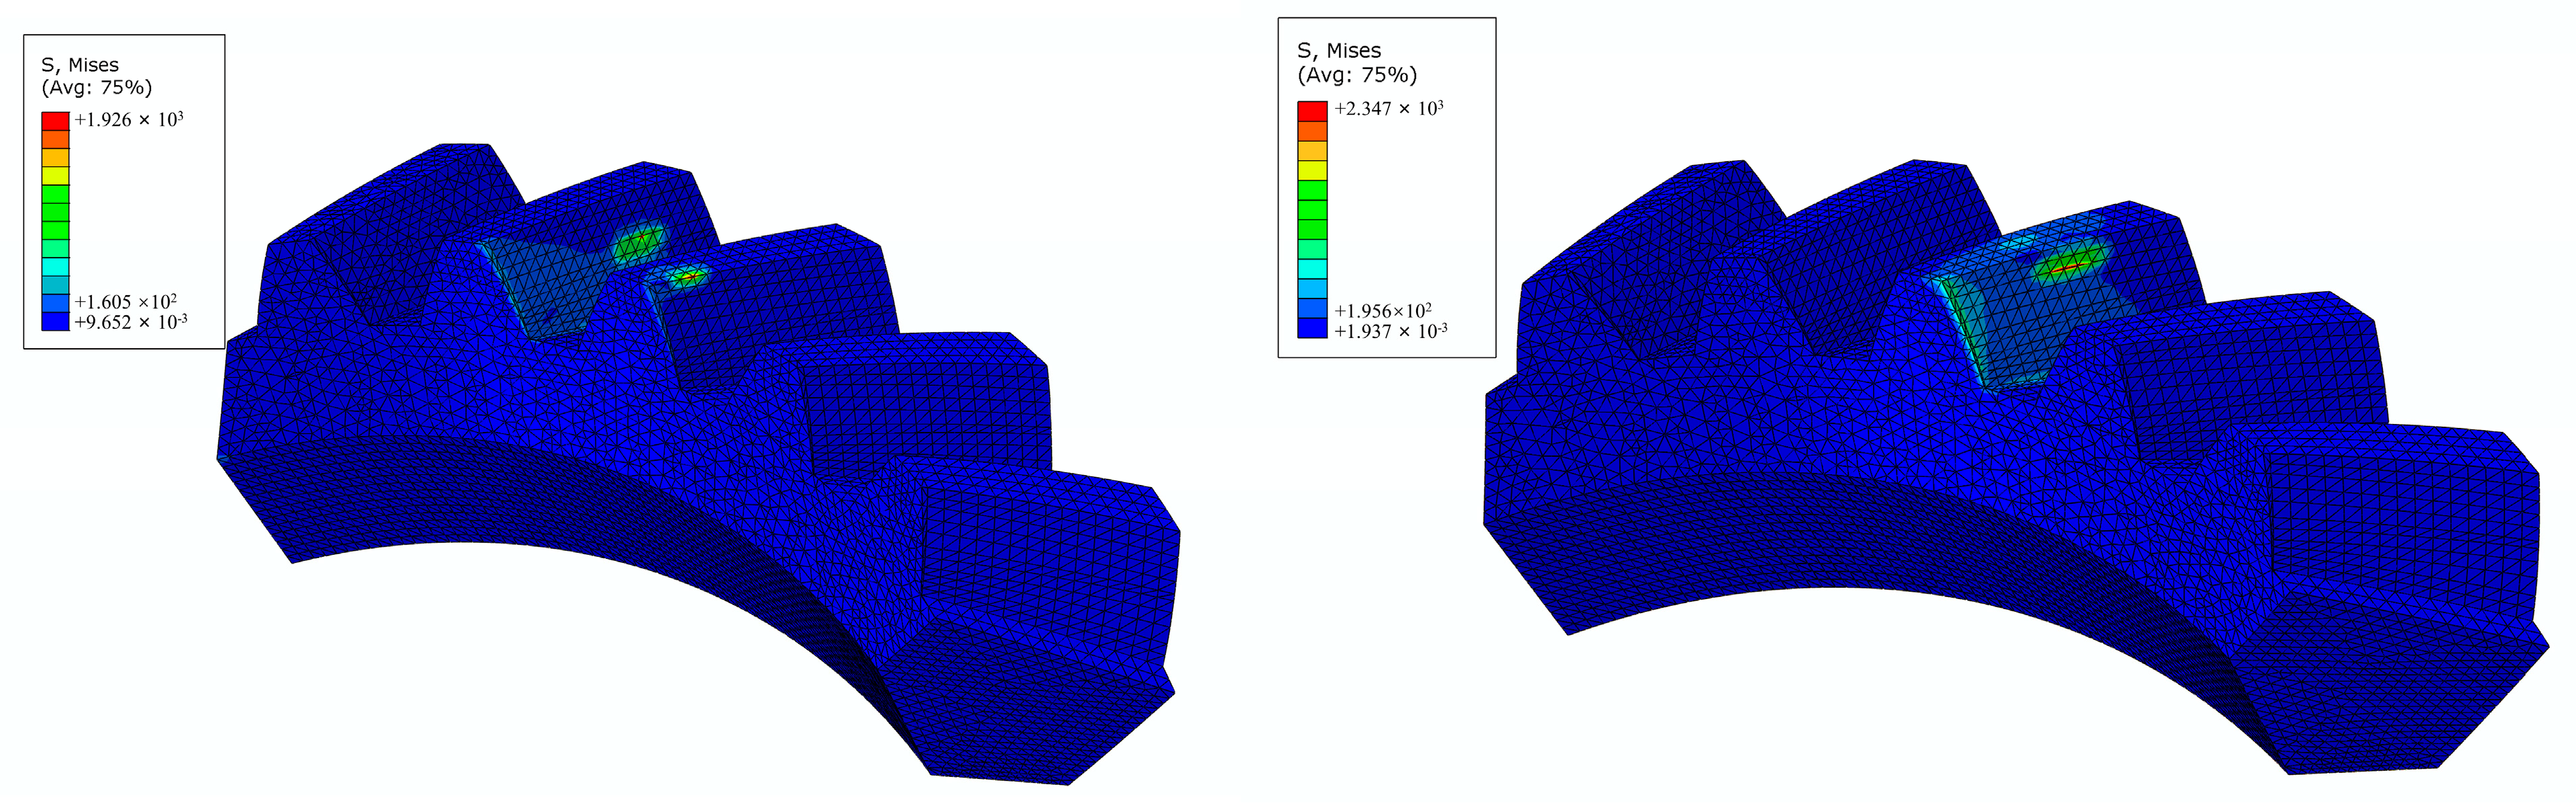
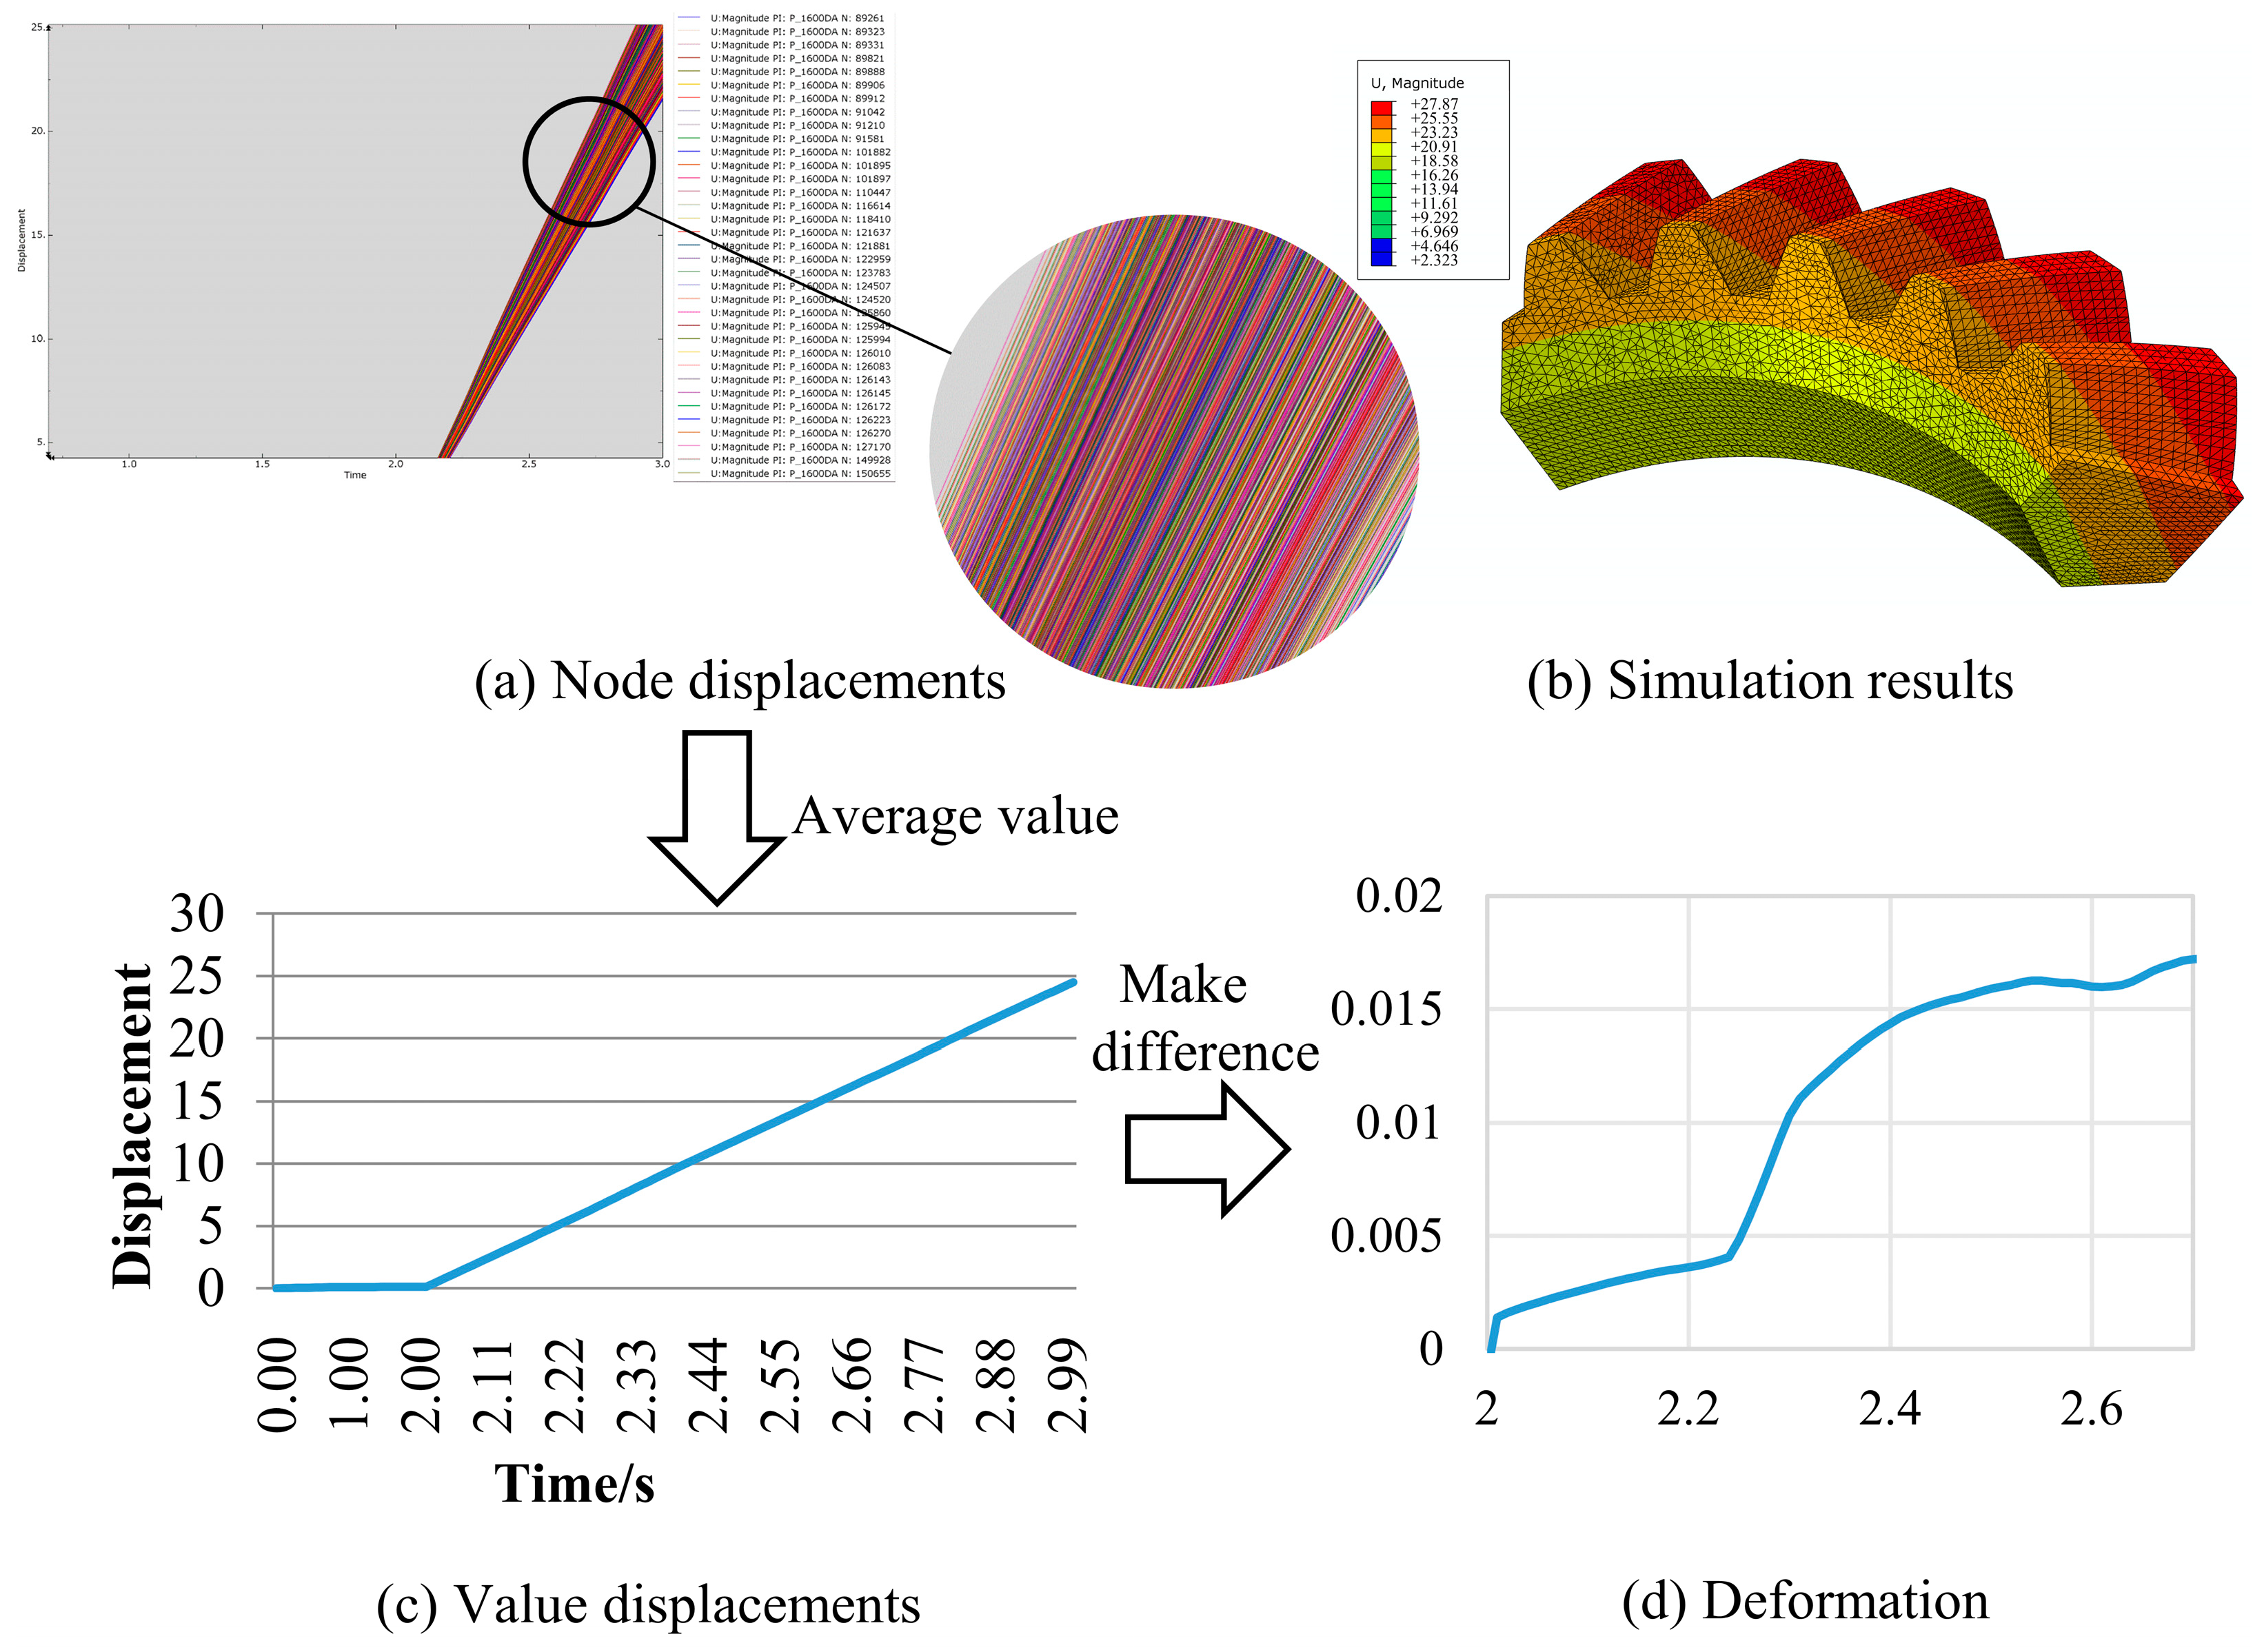
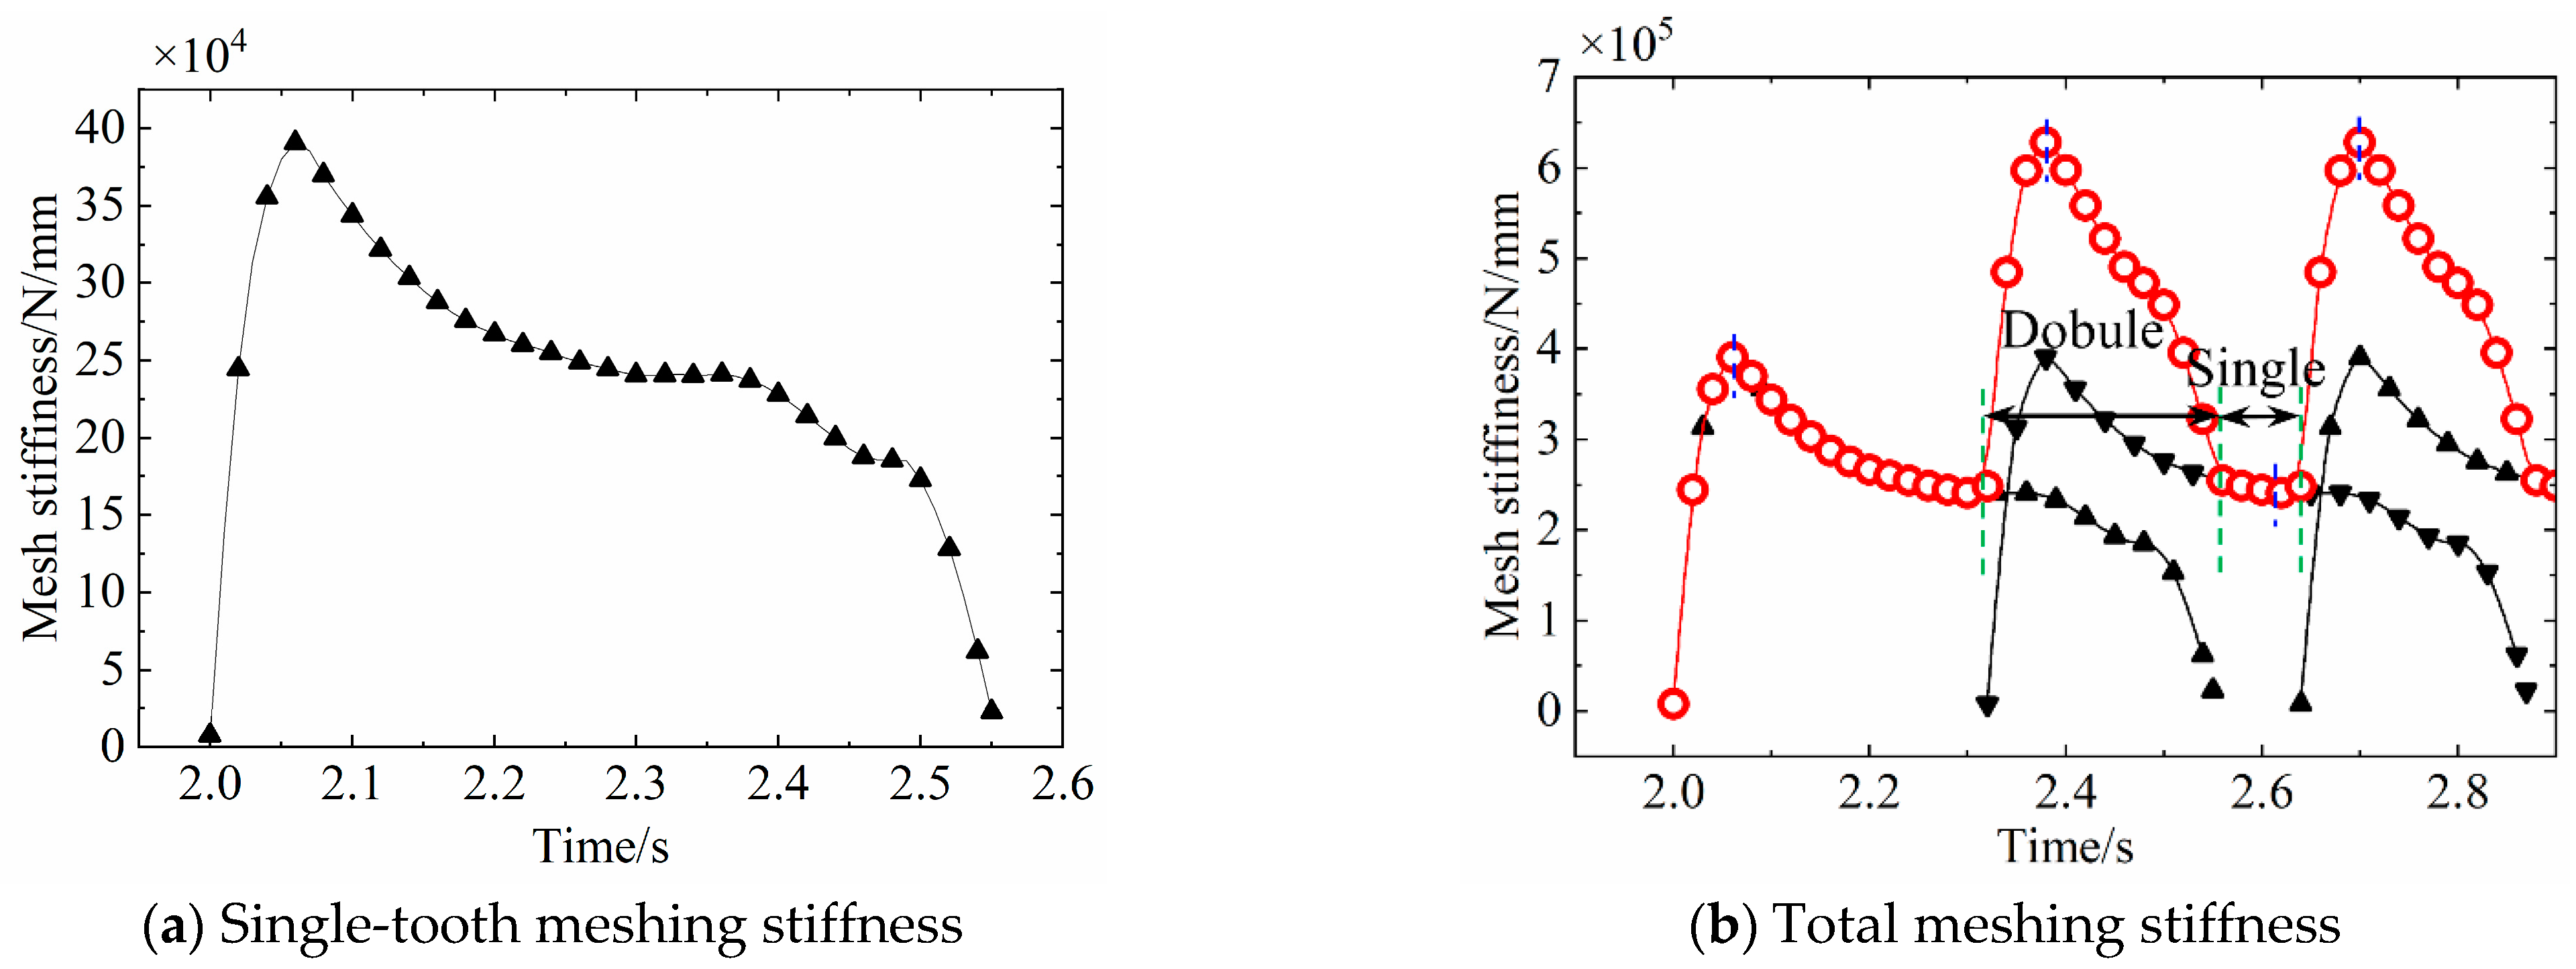
4.1. Model Establishment and Stiffness Analysis

The time-varying mesh stiffness model in this paper is obtained through FEA by establishing time-varying mesh stiffness models with different roughness and importing the model into the analysis software. The solution is obtained in three steps. Unlike the ideal smooth surfaces, the engagement between rough surfaces involves multipoint contact among the asperities. The average deformation of all asperities constitutes the contact deformation of the rough surface. Figure 6 represents the surface conditions of gears at different roughness levels.
The roughness reflected in the relationship between fractal dimension and roughness corresponds to the contour arithmetic mean deviation Ra. The fractal dimensions corresponding to roughness levels of 0.8, 0.4, and 0.2 are 1.55, 1.60, and 1.65, respectively.
The expression for the single-tooth meshing stiffness is generally the following:
k n = F n u n
where Fn is the normal contact force acting on the tooth surface, and un is the deformation during single-tooth meshing.
The normal contact force on the spiral bevel gear tooth profile surface includes tangential, radial, and axial components. Analytical calculations for this are hard to get. Therefore, FEA is taken to obtain its numerical solution directly in this paper.
The comprehensive elastic deformation of the gear tooth should include contact elastic deformation due to the local Hertz contact (uh), displacement of the gear tooth contact position due to gear bending (ub), and the influence of deformations from bearings, shafts, and supporting structures on the contact point position (uf). However, considering the deformations of bearings, shafts, and supporting structures would make the problem more complex. Therefore, uh and ub are considered as the total tooth surface deformation, and the calculation formula is expressed as follows:
u n = i = 1 2 u H i + i = 1 2 u b i
When spiral bevel gears undergo multitooth meshing, there is a coupling relationship between the individual tooth pairs. Therefore, the overall contact stiffness of spiral bevel gears is expressed as the following:
k m = i = 1 p k n i
where p is the number of teeth simultaneously in contact.

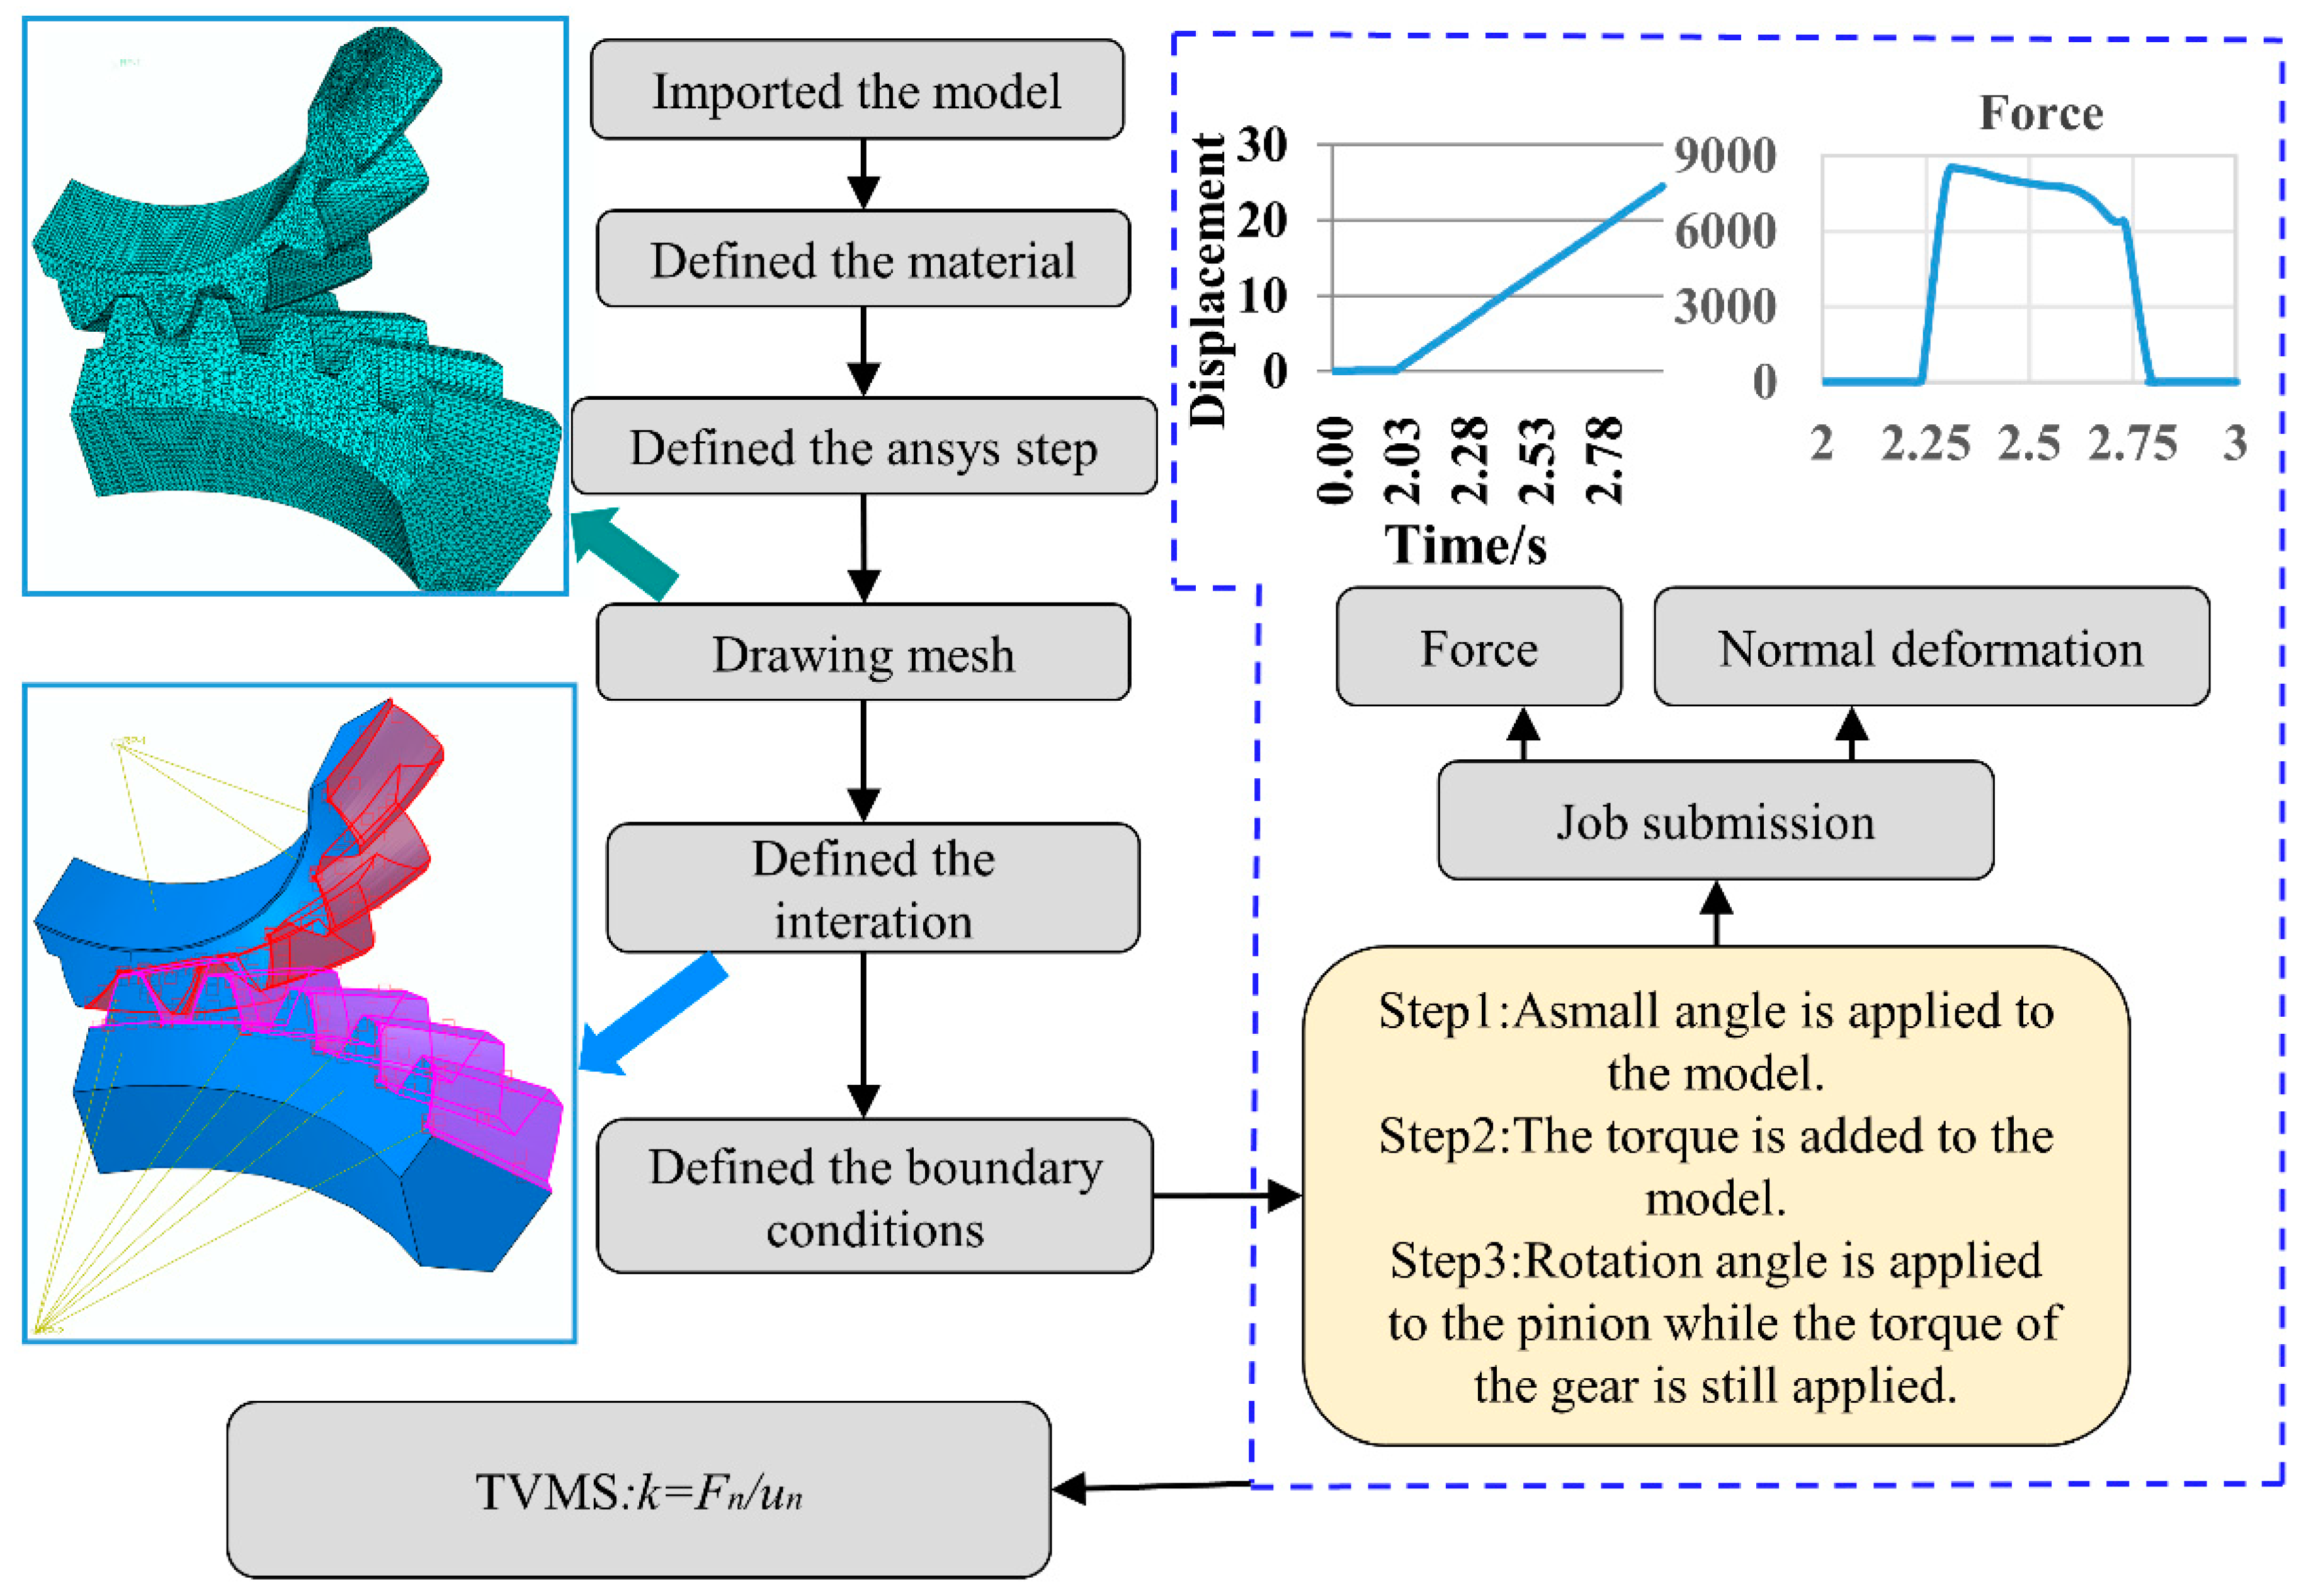
4.2. Finite Element Preprocessing

Table 3 contains the parameters for generating the three-dimensional model of the spiral bevel gear. Based on the fundamental data of the spiral bevel gear, the three-dimensional model of the gear is created. The tooth surface roughness is obtained by simulating cutting with different involute curves. Based on the relationship between the gear model diagram and the tooth surface fractal dimension, various models of spiral bevel gears with different surface fractal dimensions are obtained. Analyzing the models with different fractal dimensions allows for an exploration of the dynamic characteristics of spiral bevel gears under varying fractal dimensions.
The established gear model is subjected to FEA. Proper preprocessing steps are crucial for the analysis, shown in Figure 7. The key steps in preprocessing include material definition, meshing, analysis type specification, contact pair definition, and boundary condition definition. These steps should be determined based on the actual working conditions. Figure 8 shows the tooth contact force cloud diagram by taking the middle tooth of the five teeth as the analysis object.
From Figure 8, it can be observed that, during the loading, the tooth surface contact region is formed by an elongated ellipse tilted on the tooth surface. The output of the contact force magnitude over time is obtained by setting the total force on the middle tooth as a historical variable.
The elastic modulus of the material is defined as 210 GPa, and the Poisson’s ratio is 0.377. The analysis type is defined as implicit static analysis. The analysis is conducted with a time step of 0.01. The contact pairs are defined between the pinion and gear, with a friction coefficient of 0.15 in the tangential contact. Boundary conditions are defined in accordance with the analysis steps. The analysis is conducted in three steps: Step 1 introduces a small rotation to the pinion to eliminate the gap between gear surfaces, ensuring mutual contact between the pinion and gear. Step 2 applies torque to the gear, representing the operational torque. In Step 3, torque is applied to the gear while simultaneously imparting a rotation to the pinion, thereby simulating the entire process of meshing motion between the gear pair.
To simplify the analysis model, the five-tooth model is used as the research model. Upon completion of the run, the tooth surface contact stress and contact positions are obtained, as shown in Figure 8. Analysis variables are output as historical variables to calculate the normal contact force between tooth surfaces, with results presented in Figure 7. Tooth surface deformations are extracted from the deformation of unit points on the tooth surface. The deformation values of contact points with forces are averaged to represent tooth surface deformations, as illustrated in Figure 9.
Simulation analysis was conducted using the commercial software Abaqus 2016. Initially, historical variables were set for the normal force of a single tooth. The analysis step was set as static general analysis. Deformation of the specified tooth surface was obtained through historical variable output. Stiffness calculation formulas were applied to compute the time-varying meshing stiffness for a single tooth. The overall meshing stiffness was obtained based on the relationship between gear overlap and the time of single-tooth meshing.
The stress results are displayed, as shown in Figure 8, and the stress is lower than the stress in the case of single-tooth contact. Therefore, in actual operating conditions, using spiral bevel gears can accommodate larger loads.
The deformation values of contact points with forces are averaged to represent tooth surface deformations, as illustrated in Figure 9.
For the contact force, in the simulation analysis, a load of 300 N·m is applied. The force on a single tooth is zero when not in contact, and it increases when loaded. Once the contact is established, the force decreases back to zero, and the contact is no longer present. Therefore, the load on a single tooth follows a pattern of initially increasing and decreasing. In this state, the maximum contact force for a single tooth is 8525.05 N, and the contact time (T) for a single tooth is 0.56 s. The time difference between the contact of adjacent teeth is 0.33 s. Based on this data, the total contact stiffness is determined. Figure 10 represents the process of solving time-varying mesh force.
Based on the above results combined with Equation (37), the time-varying meshing stiffness for a single tooth is obtained, as shown in Figure 11. The time-varying meshing stiffness between individual teeth is coupled with a phase difference between the meshing stiffness of two adjacent teeth. Therefore, the total time-varying meshing stiffness is the superposition of the single-tooth meshing stiffness achieved by shifting the phase angle. The time from the generation to the disappearance of contact force is the actual engagement time T for a single tooth. This time can be obtained through simulation analysis. The time when adjacent teeth start or stop engaging is given by the reference [30], and the overlap ratio can be expressed as follows:
ε = T t
By calculating the time-varying meshing stiffness of this spiral bevel gear model, it is found to be 1.956. Figure 11 shows the single-tooth meshing stiffness and total meshing stiffness of the gear. The relationship between single-tooth engagement time and overlap ratio is used to determine the comprehensive meshing stiffness.
Finally, the time-varying meshing stiffness for spiral bevel gears with different fractal dimensions is solved. The comprehensive time-varying meshing stiffness exhibits clear periodicity. When the results are summarized, it is observed that as the fractal dimension decreases, the time-varying meshing stiffness continuously decreases.
The coarser roughness of gear tooth surfaces leads to a reduction in the actual contact area. Ideally, gear tooth surfaces should be smooth to maximize the contact area, but this is limited by the machining method. As roughness increases, the contact area decreases, resulting in increased deformation under the same contact force. Consequently, the time-varying meshing stiffness decreases. Figure 12 compares the time-varying mesh stiffness under different roughness levels.
Therefore, reducing the fractal dimension to some extent helps decrease the time-varying meshing stiffness of the gears, thereby improving the smoothness of motion. Additionally, from the experimental results, it is evident that as the tooth surface fractal dimension decreases, the rate of change in the time-varying meshing stiffness increases. In other words, with a smaller tooth surface fractal dimension, the variation in time-varying meshing stiffness becomes more pronounced, indicating a more significant impact on vibration conditions.

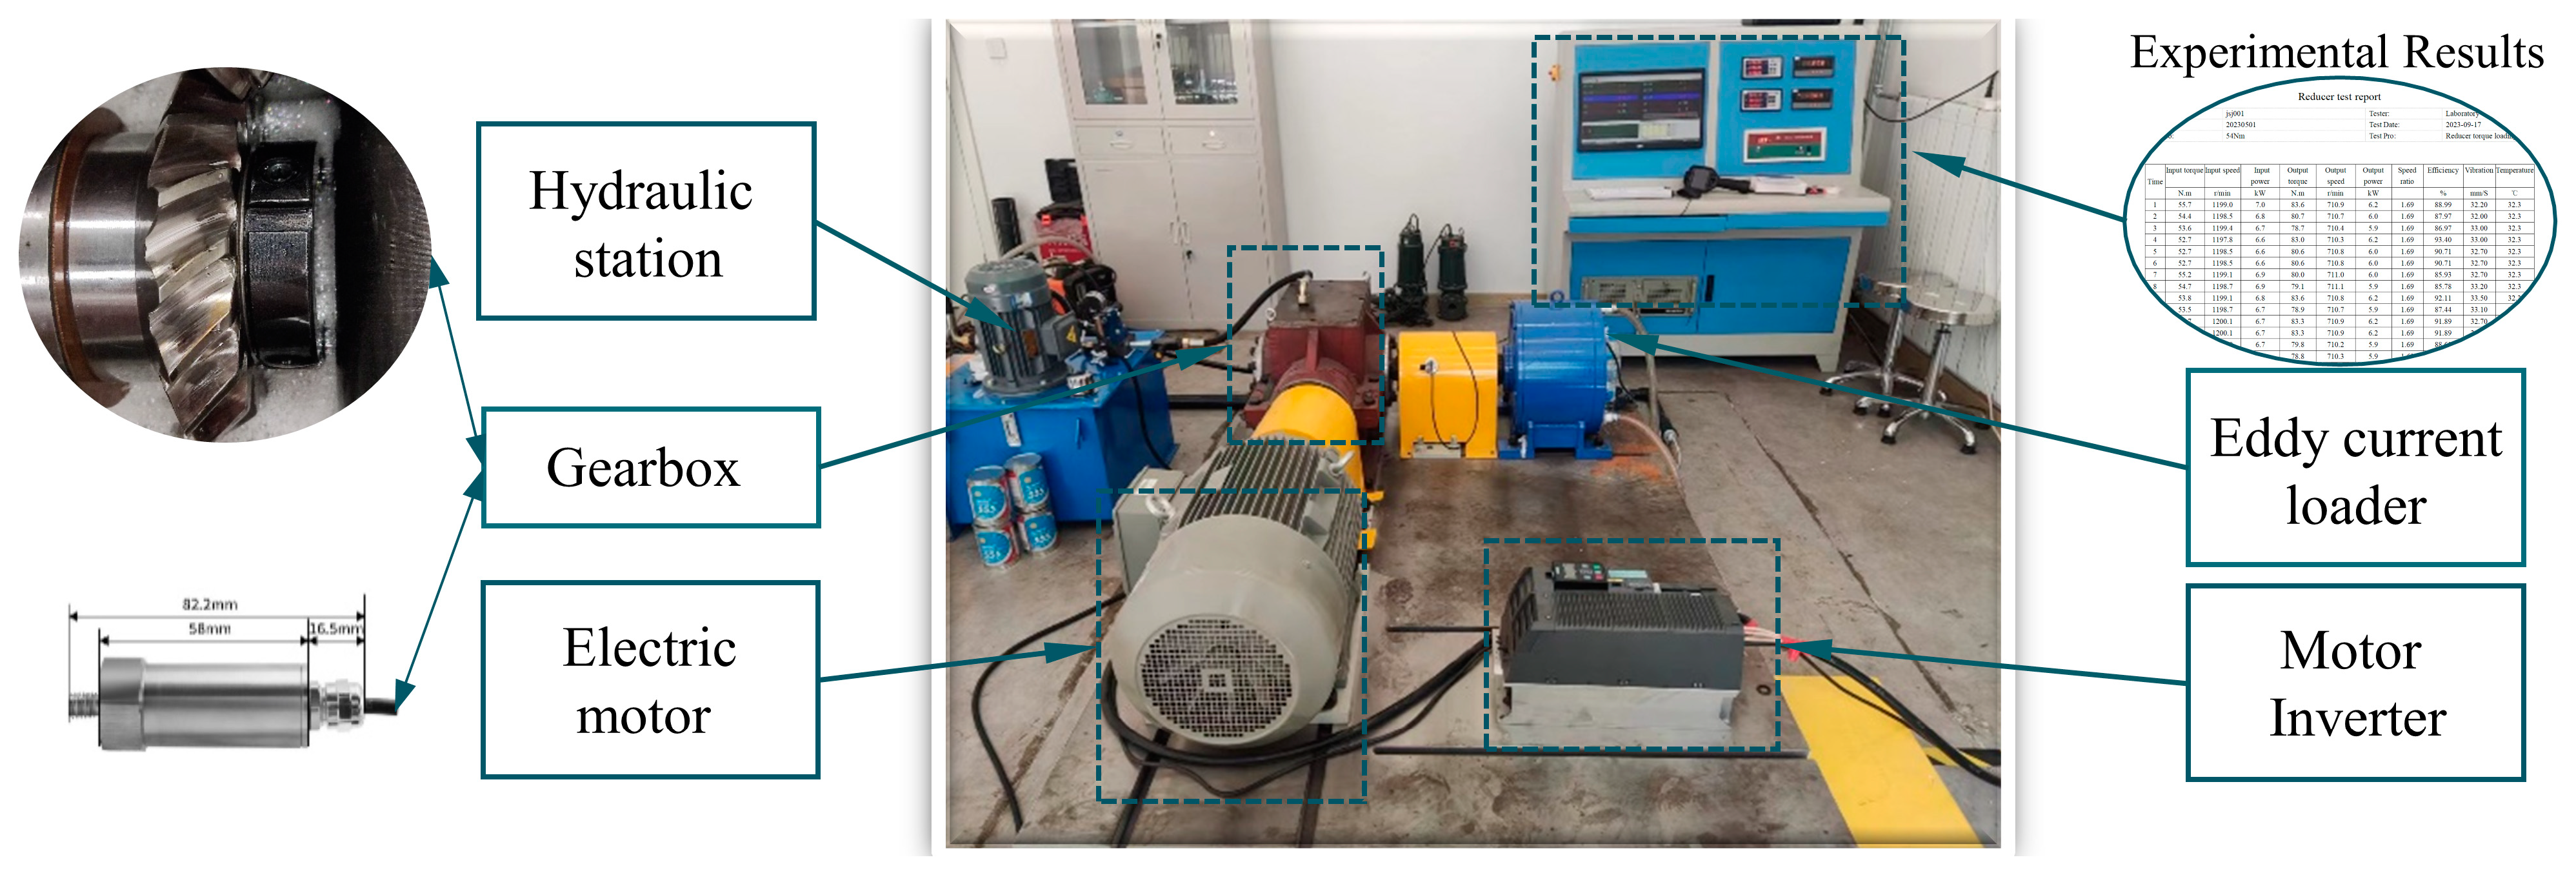
4.3. Experiment Result Analysis

To validate the model, an experimental setup for the bevel gear was constructed, and experiments were conducted. The bevel gear test rig, as shown in Figure 11, is powered by a 30 kW electric motor with a maximum speed of 2950 rad/min. The power is transmitted to the gearbox through a coupling, which is equipped with vibration, speed, and torque sensors. The sensor shown in the figure is a vibration sensor that extracts real-time vibration data. The extracted data is transmitted in real time to the central control system for storage. Some of the data is illustrated in Figure 13. The bevel angle of the bevel gear is 90°, and power is transmitted to the output side through a reduction gearbox. An eddy current loader is installed on the output side, and the central control system can control the loaded torque by setting the output torque.
During the experiment, the gear speed was controlled in real time through the inverter, with an experimental speed set at 1200 rpm and applied torques of 77 N·m and 105 N·m. Data were recorded at intervals of 1 s after starting the experiment. From the experiments, it was observed that as the torque increased, the vibration of the gears intensified. This was reflected in the laboratory by the continuous increase in shaft vibration, the growing noise of the gearbox, and an accelerated rise in oil temperature. The obtained experimental vibration data has been systematically organized. Figure 14 shows that under a 77 N·m load, the average experimental vibration velocity registers at 4.195 mm/s. Concurrently, the simulation yields an average velocity of 4.06 mm/s under identical conditions, resulting in a deviation of 3.22% when compared to the experimental results.
As shown in Table 4, at a rotational speed of 1200 rpm and torque of 105 N·m, the experimental average vibration is 4.384 mm/s. Under analogous conditions, the simulated vibration speed averages 4.116 mm/s, resulting in a deviation of 6.113% between the simulation and experiment. Comparative analysis between the two sets of experimental and simulated results indicates a minimal discrepancy, substantiating the accuracy of the model.
Figure 15 illustrates the comparison of vibration speeds of bevel gears with four different roughness levels. The vibration speed exhibits periodicity, and as the roughness increases, the vibration becomes more intense. Figure 16 reflects the vibration acceleration of bevel gears with four different roughness levels. With the increase in roughness, the vibration acceleration shows periodicity and continues to increase.
Compared to the smooth surface spiral bevel gear, the maximum vibrational velocity increases by 5.53% for the spiral bevel gear with a roughness of Ra0.4. Similarly, for the spiral bevel gear with a roughness of Ra0.4, the maximum vibrational velocity experiences a 12.04% increase compared to the smooth surface counterpart. Furthermore, the vibrational velocity of the spiral bevel gear with Ra0.8 roughness is found to increase by 16.44% compared to the maximum vibrational velocity under smooth conditions.
D = 1.528 R a 0.042
Using the proposed computational method, the maximum vibration accelerations for four different roughness levels are determined to be 13.517 m/s2, 21.525 m/s2, 23.953 m/s2, and 27.503 m/s2. The results reveal a consistent trend where the maximum vibration acceleration increases with greater surface roughness. The relationship between roughness and fractal dimension is reflected in Equation (41). Specifically, for the roughness of Ra0.2, the spiral bevel gear exhibits a 59.2% increase in maximum vibration acceleration compared to its smooth counterpart. Similarly, for the roughness of Ra 0.4, the maximum vibration acceleration increases by 77.21%, and for Ra 0.8, the vibration acceleration surpasses the smooth condition by 103.47%.
The analysis of these results indicates a pronounced variation in the vibration characteristics of spiral bevel gears with increasing roughness. Consequently, the method proposed in this study for analyzing the vibration of spiral bevel gears under different roughness conditions holds significant importance for evaluating the vibrational behavior of spiral bevel gears with varying degrees of roughness.

5. Conclusions

Based on fractal geometry theory, this study establishes three-dimensional models of spiral bevel gears under different fractal dimensions and analyzes the dynamic characteristics of these gears. A modeling method for spiral bevel gears with different roughness is proposed by combining the W m function with the fractal dimension. Utilizing the finite element method, the single time-varying mesh stiffness is obtained, leading to a method for solving the total time-varying mesh stiffness of spiral bevel gears. By combining the time-varying mesh stiffness with dynamic equations, the vibration velocity and acceleration of spiral bevel gears with different surface roughness are revealed. A detailed analysis is conducted on the complex relationship between the microstructure of the gear surface and its mechanical behavior during meshing.
As the fractal dimension decreases, the tooth surface becomes rougher, and the time-varying mesh stiffness decreases, and both vibrational velocity and vibrational acceleration increase. The specific results are as follows:
(1)
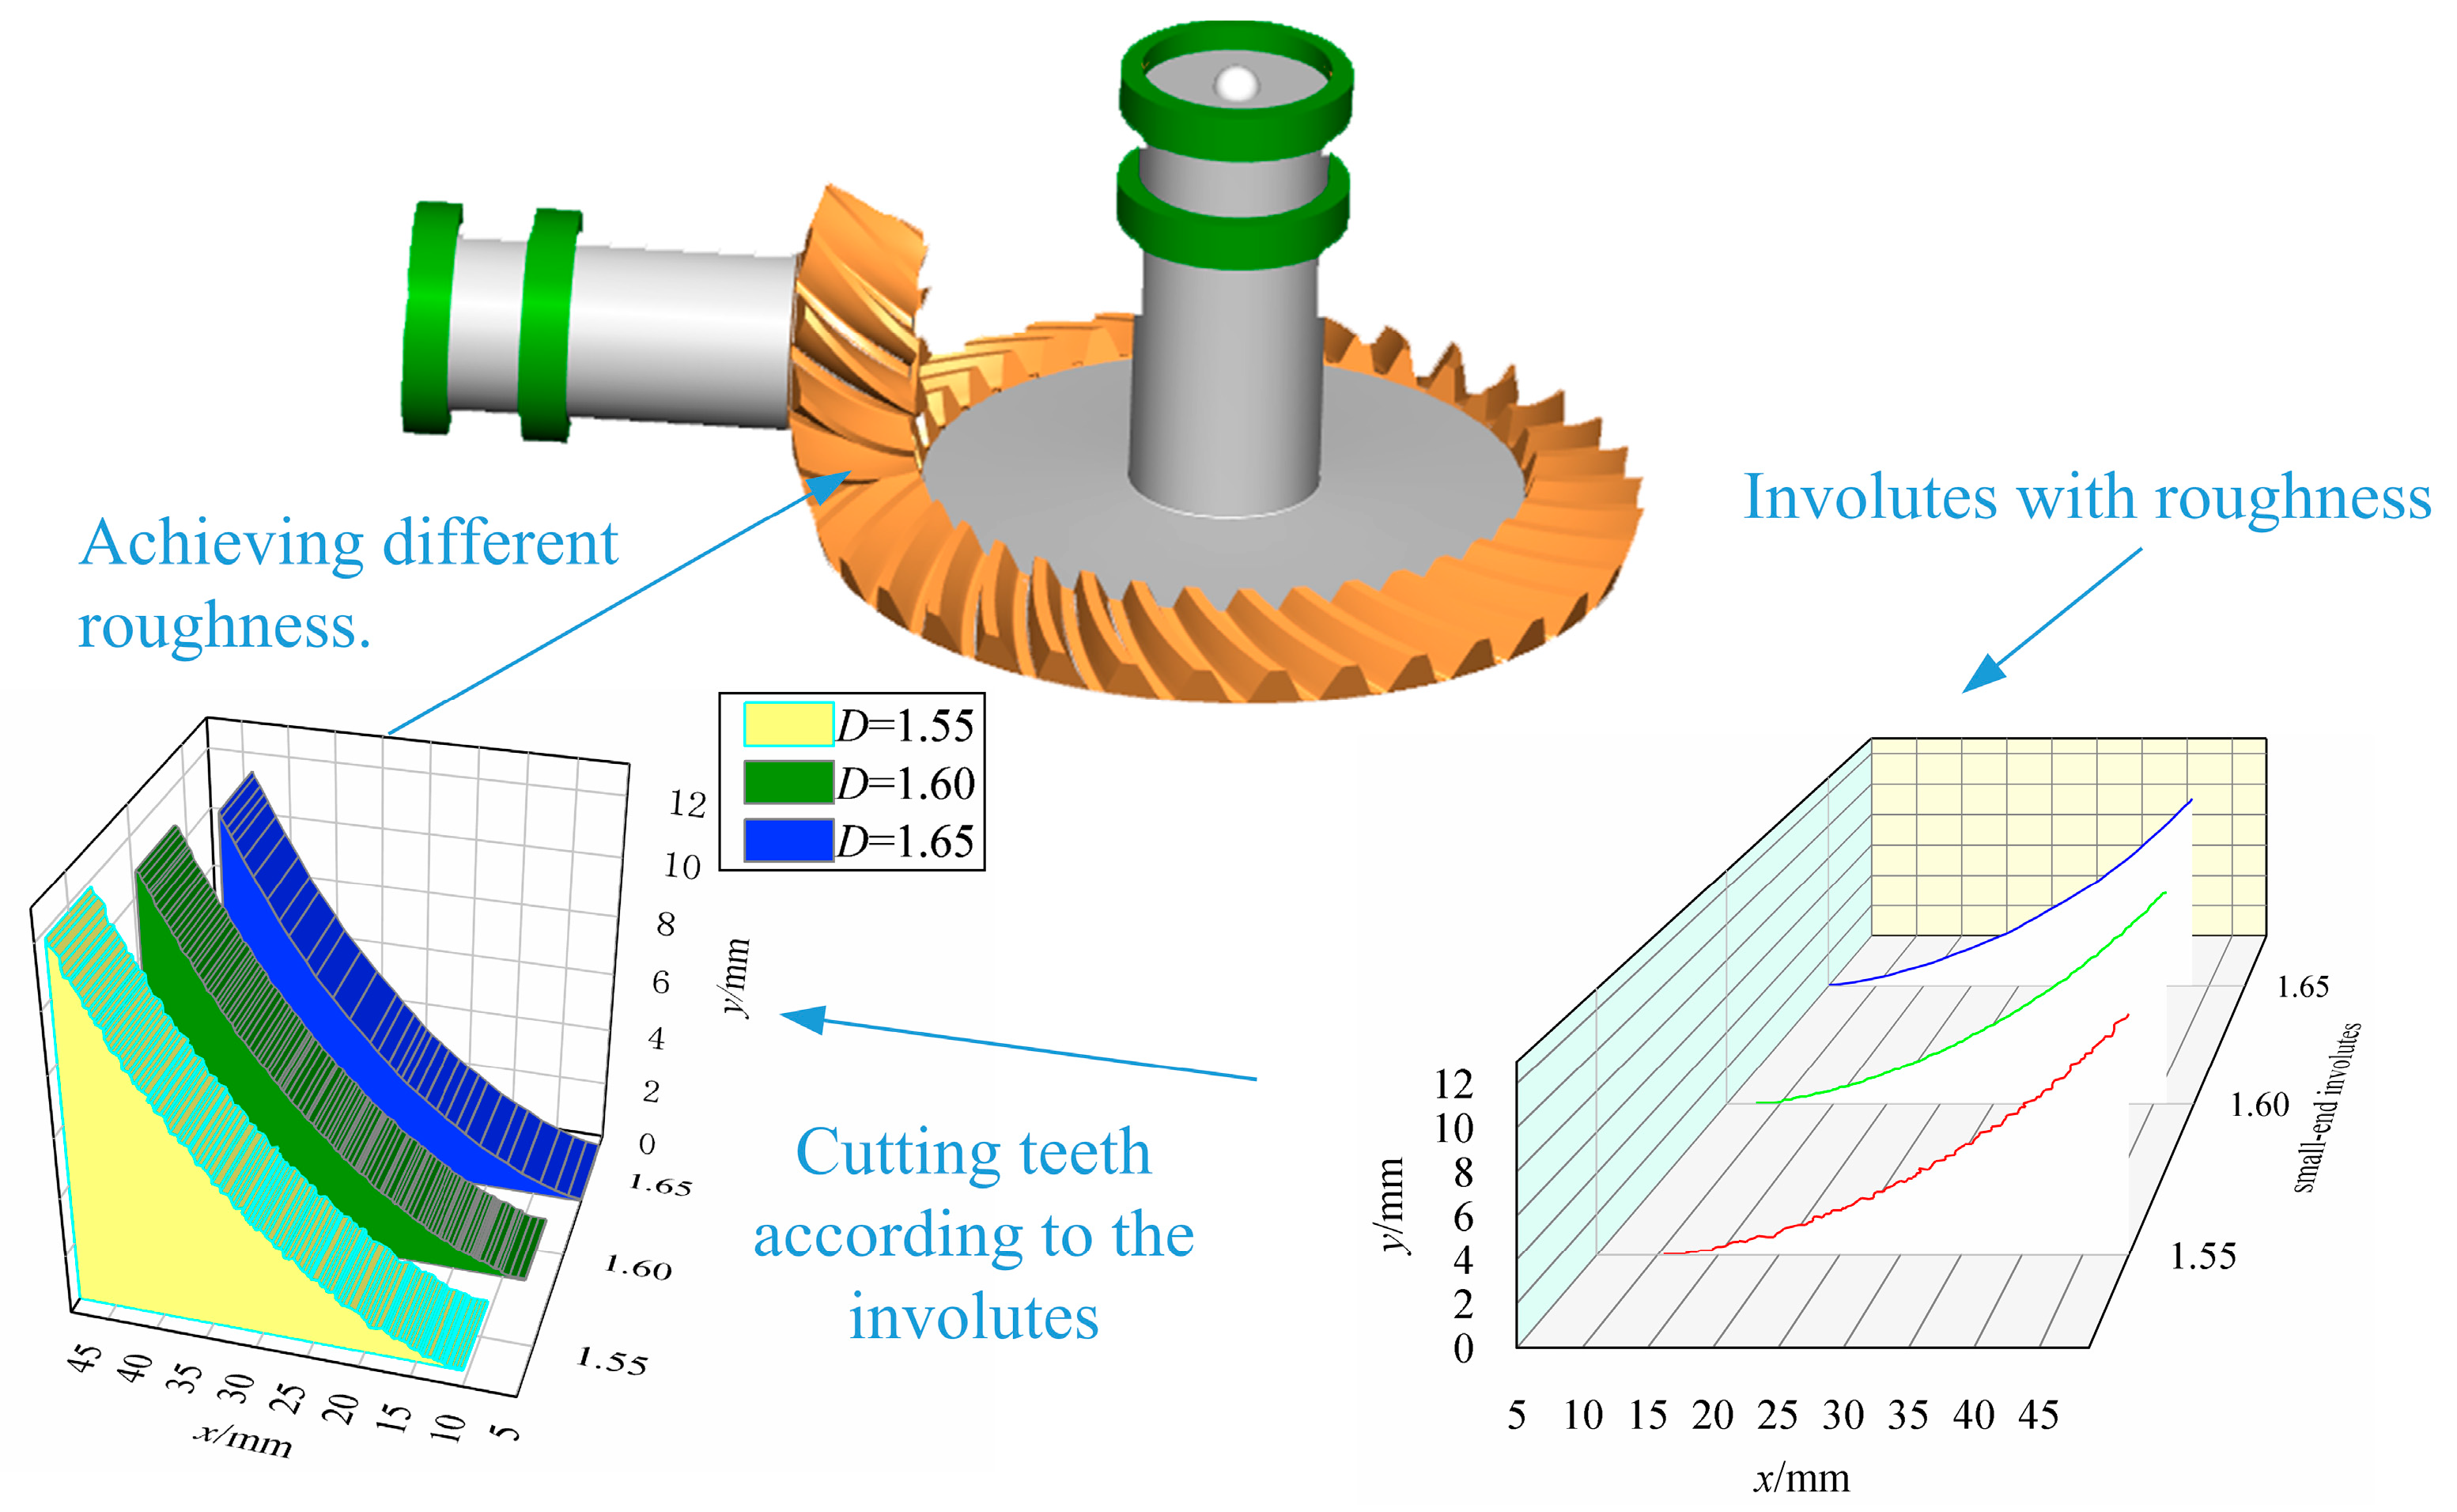
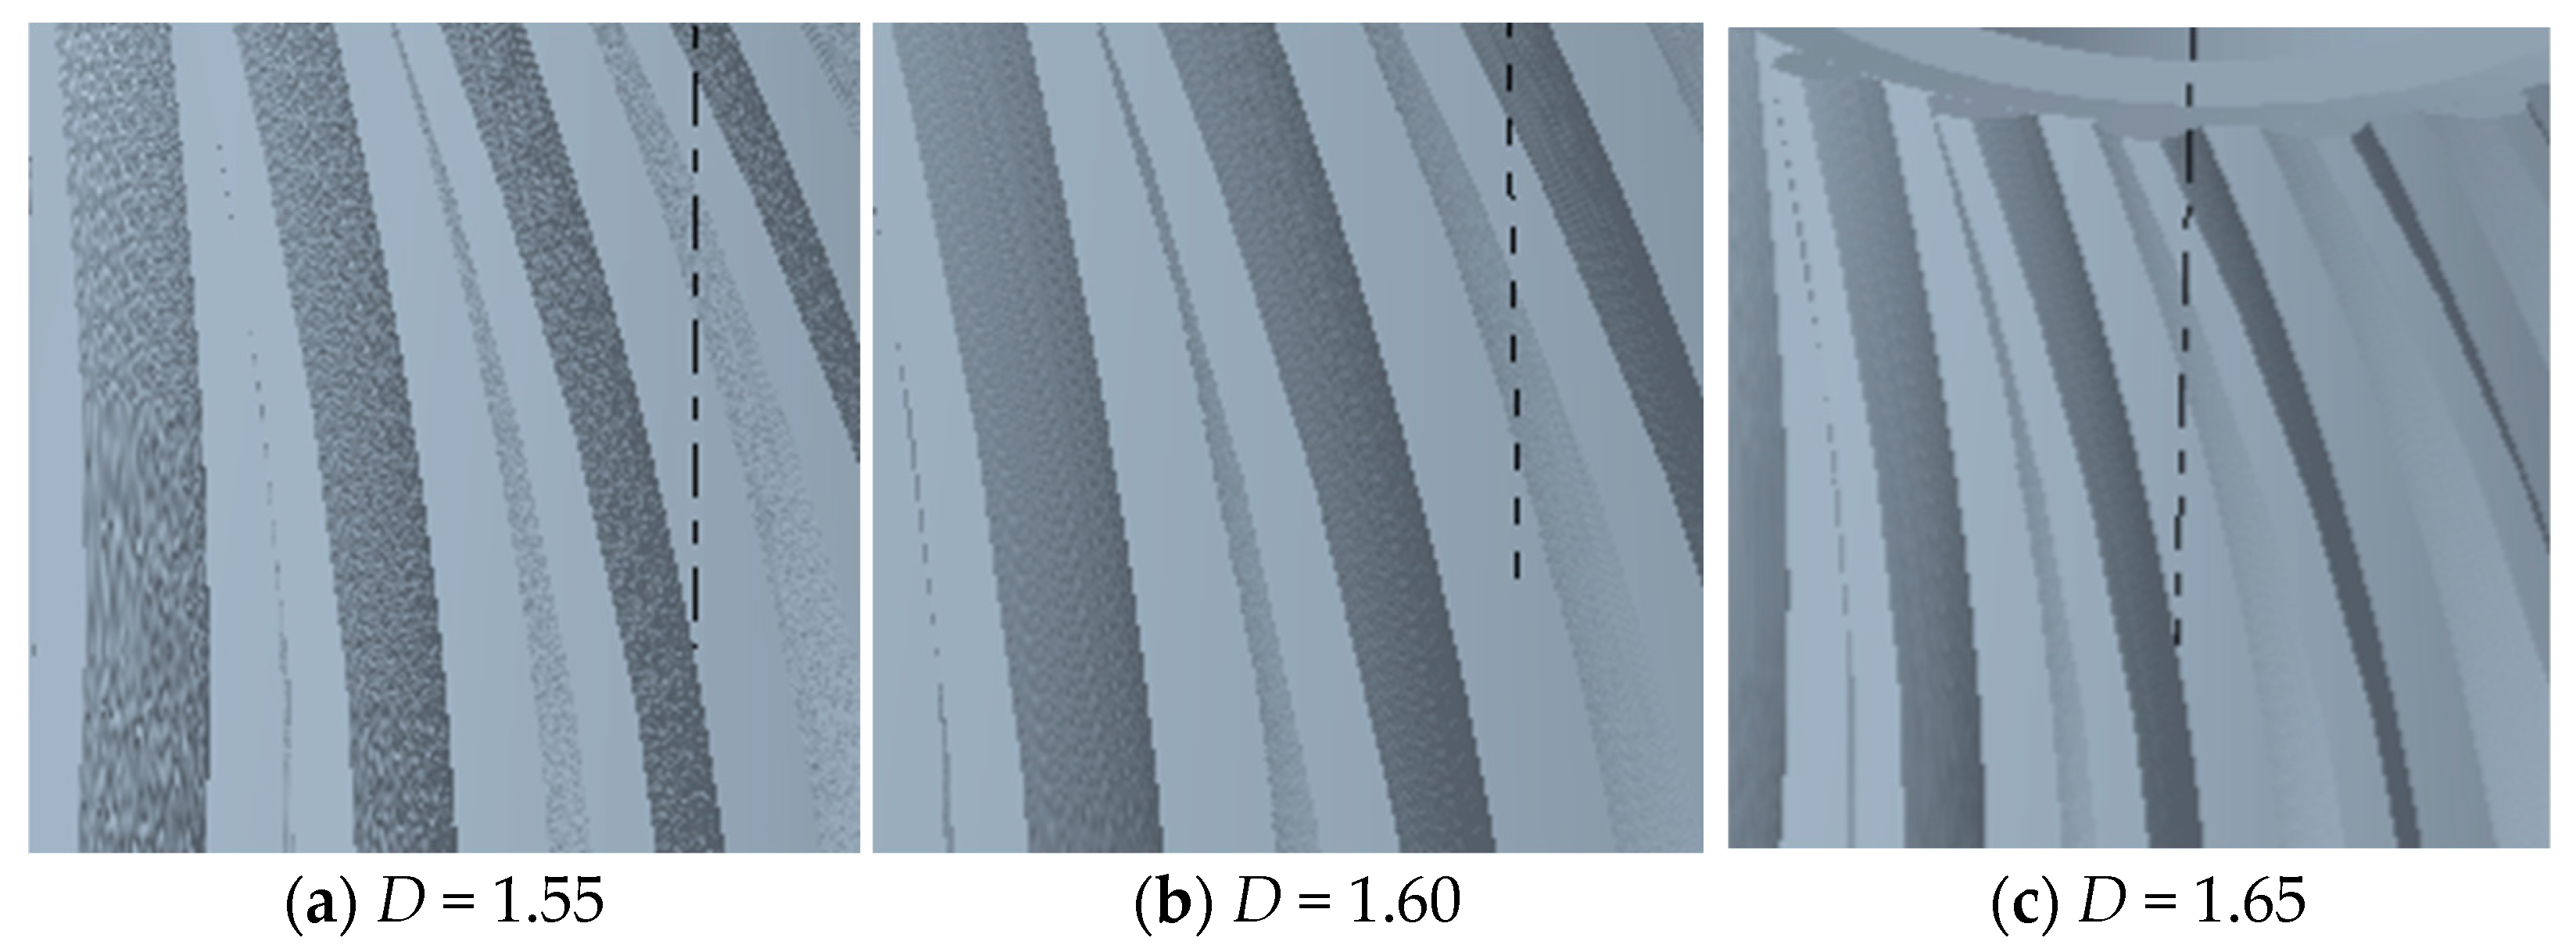
Fractal dimensions are introduced into the involute equation. The MATLAB software is utilized to calculate the involute profiles under different roughness levels. By establishing the relationship between fractal dimensions and tooth surface roughness, the tooth profiles under varying roughness conditions are determined. The three-dimensional models of spiral bevel gears under different surface roughness levels are obtained using the principle of tooth cutting with a gear hob.
(2)
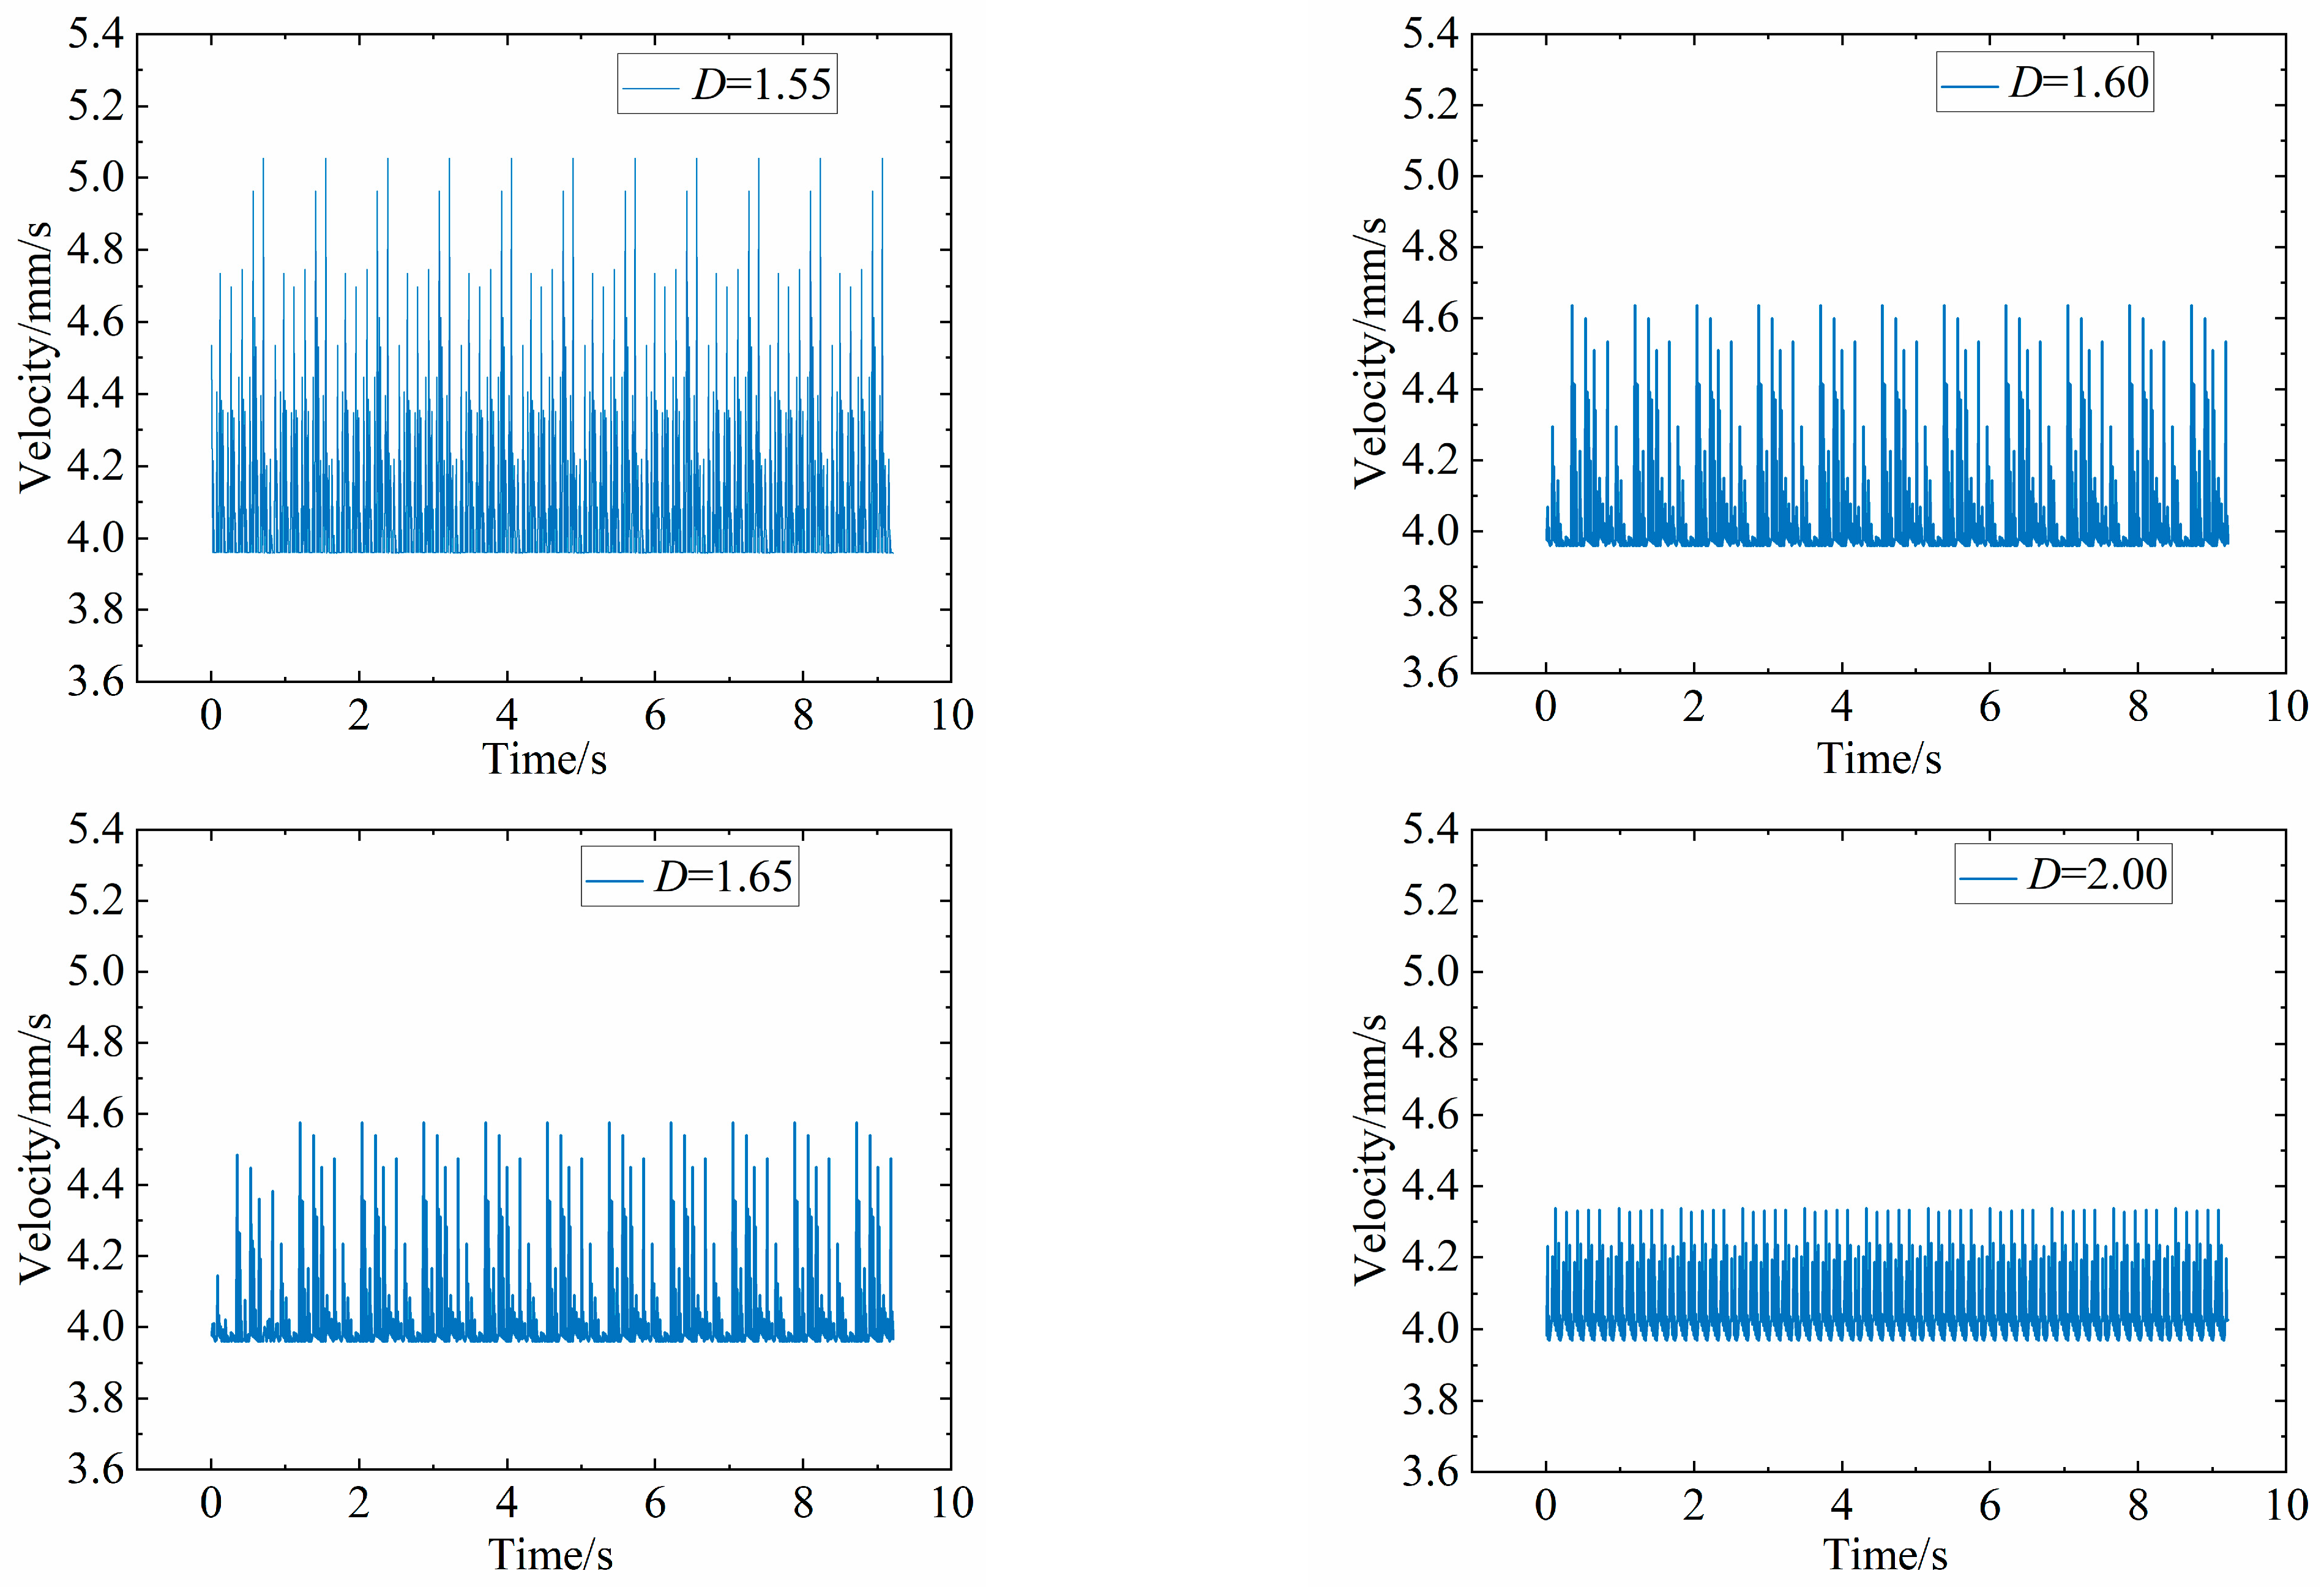
A novel model is proposed for calculating the mesh stiffness of spiral bevel gears under different fractal dimensions. Fractal dimensions are introduced into the differential dynamic equations of spiral bevel gears to determine the factors influencing the dynamic characteristics due to fractal dimensions and surface friction. Finite element analysis is employed to investigate the models of spiral bevel gears under various fractal dimensions, resulting in the determination of the time-varying mesh stiffness under different fractal dimensions. The results indicate that as the fractal dimension decreases, the time-varying mesh stiffness continuously decreases. Therefore, reducing the fractal dimension to some extent contributes to decreasing the time-varying mesh stiffness of the gears, thereby enhancing the smoothness of motion.
(3)
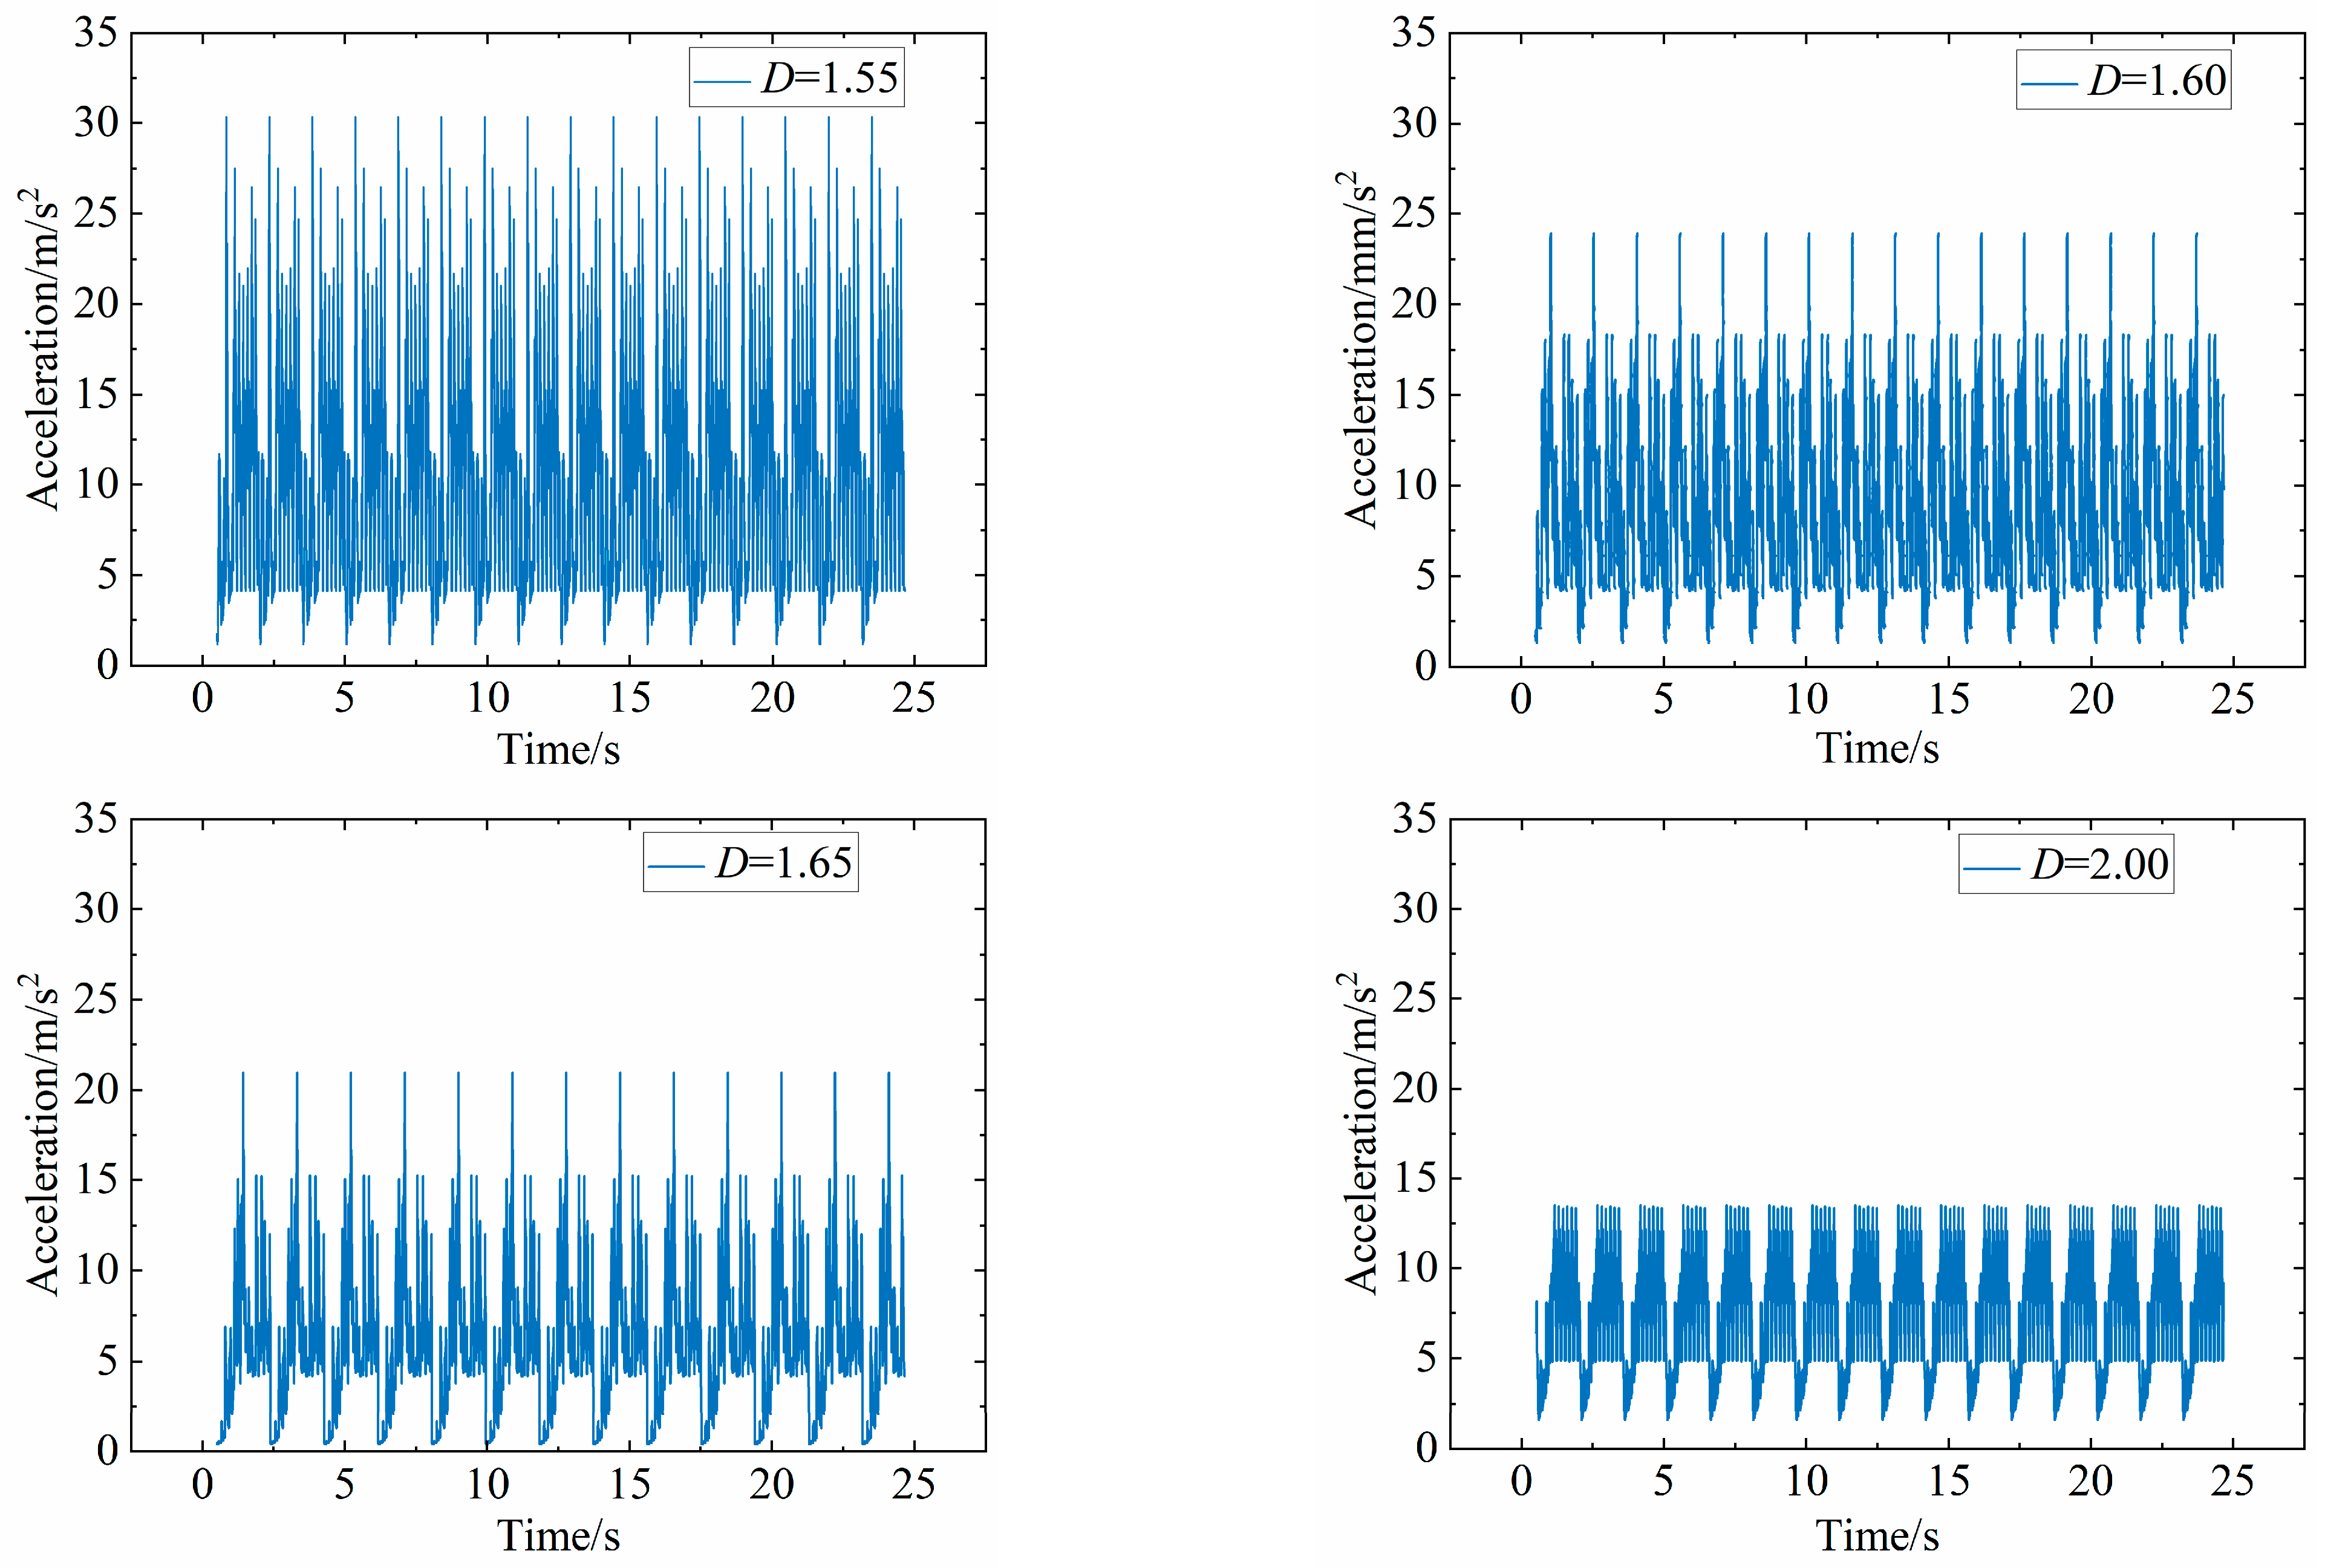
After establishing an experimental setup for spiral bevel gears, tests showed that the errors under two operating conditions were found to be 3.22% and 6.11%, respectively, indicating a small margin of error and validating the accuracy of the model. Through dynamic analysis using the developed model, the vibration characteristics of gears under different fractal dimensions were examined.
The study can take insights into the variations in vibration characteristics under various fractal dimensions for spiral bevel gears, providing a new model for investigating the vibration behavior of spiral bevel gears under different roughness conditions.

Author Contributions

Methodology, X.-Q.Z.; Investigation, S.-W.Y.; Data curation, H.-Q.L. and L.-N.W.; Funding acquisition, Z.-J.C. and R.S. All authors have read and agreed to the published version of the manuscript.

Funding

This work was funded by the China Aviation Development Innovation Special Fund Project (No. KY-1003-2021-0020) and the Development Funds of the Central Government for Local Science and Technology (No. 236Z1701G).

Institutional Review Board Statement

Not applicable.

Informed Consent Statement

Not applicable.

Data Availability Statement

The data presented in this study are available on request from the corresponding author. The data is not publicly available.

Conflicts of Interest

The authors declare no conflict of interest.

References

  1. Pei, X.; Pu, W.; Wang, Z. Contact stiffness and dynamic behavior caused by surface defects of spiral bevel gear in mixed lubrication. Eng. Fail. Anal. 2021, 121, 105129. [Google Scholar] [CrossRef]
  2. Chen, S.; Zhang, A.; Wei, J.; Lim, T.C. Nonlinear excitation and mesh characteristics model for spiral bevel gears. Int. J. Mech. Sci. 2023, 257, 108541. [Google Scholar] [CrossRef]
  3. Li, S. A thermal tribo-dynamic mechanical power loss model for spur gear pairs. Tribol. Int. 2015, 88, 170–178. [Google Scholar] [CrossRef]
  4. Wang, Y.; Wang, H.; Li, K.; Qiao, B.; Shen, Z.; Chen, X. An analytical method to calculate the time-varying mesh stiffness of spiral bevel gears with cracks. Mech. Mach. Theory 2023, 188, 105399. [Google Scholar] [CrossRef]
  5. Yin, L.; Deng, C.; Yu, W.; Shao, Y.M.; Wang, L.M. Dynamic characteristics of gear system under different micro-topographies with the same roughness on tooth surface. J. Cent. South Univ. 2020, 27, 2311–2323. [Google Scholar] [CrossRef]
  6. Wang, X.; Xiang, C.; Li, C.; Li, S.; Shao, Y.; Wang, L. Effect of roughness on meshing power loss of planetary gear set considering elasto-hydrodynamic lubrication. Adv. Mech. Eng. 2020, 12, 1687814020908422. [Google Scholar] [CrossRef]
  7. Patir, N. A numerical procedure for random generation of rough surfaces. Wear 1978, 47, 263–277. [Google Scholar] [CrossRef]
  8. Watson, W.; Spedding, T.A. The time series modelling of non-Gaussian engineering processes. Wear 1982, 83, 215–231. [Google Scholar] [CrossRef]
  9. Ausloos, M.; Berman, D.H. A multivariate Weierstrass–Mandelbrot function. Proc. R. Soc. Lond. A Math. Phys. Sci. 1985, 400, 331–350. [Google Scholar]
  10. Meng, F.; Xia, H.; Zhang, X.; Wang, J.; Jin, Y. Study on nonlinear dynamic characteristics of gear system with 3D anisotropic rough tooth surface based on fractal theory. Int. J. Non-Linear Mech. 2023, 150, 104366. [Google Scholar] [CrossRef]
  11. Ding, H.; Rong, S.; Rong, K.; Tang, J. Semi-FEM dynamic meshing impact forecasting model for spiral bevel and hypoid gear transmission. Appl. Math. Model. 2022, 104, 279–305. [Google Scholar] [CrossRef]
  12. Liu, J.; Zhang, H.; Zhai, J.; Han, Q. Research on nonlinear dynamic performance of the central bevel gear transmission system in aero-engine with complex excitation. Mech. Based Des. Struct. Mach. 2023, 51, 6680–6703. [Google Scholar] [CrossRef]
  13. Heingartner, P.; Mba, D. Determining power losses in helical gear mesh: Case study. In Proceedings of the International Design Engineering Technical Conferences and Computers and Information in Engineering Conference, Chicago, IL, USA, 2–6 September 2003; pp. 965–970. [Google Scholar]
  14. Anderson, N.E.; Loewenthal, S.H. Efficiency of nonstandard and high contact ratio involute spur gears. J. Mech. Transm. Autom. Des. 1986, 108, 119–126. [Google Scholar] [CrossRef]
  15. Anderson, N.E.; Loewenthal, S.H. Design of spur gears for improved efficiency. J. Mech. Des. 1982, 104, 767–774. [Google Scholar] [CrossRef]
  16. Britton, R.D.; Elcoate, C.D.; Alanou, M.P.; Evans, H.P.; Snidle, R.W. Effect of surface finish on gear tooth friction. J. Trib. 2000, 122, 354–360. [Google Scholar] [CrossRef]
  17. Schleich, B.; Anwer, N.; Mathieu, L.; Wartzack, S. Skin Model Shapes: A new paradigm shift for geometric variations modelling in mechanical engineering. Comput. Aided Des. 2014, 50, 1–15. [Google Scholar] [CrossRef]
  18. Chen, Q.; Ma, Y.; Huang, S.; Zhai, H. Research on gears’ dynamic performance influenced by gear backlash based on fractal theory. Appl. Surf. Sci. 2014, 313, 325–332. [Google Scholar] [CrossRef]
  19. Sayles, R.S.; Thomas, T.R. Surface topography as a nonstationary random process. Nature 1978, 271, 431–434. [Google Scholar] [CrossRef]
  20. Bonori, G.; Pellicano, F. Non-smooth dynamics of spur gears with manufacturing errors. J. Sound Vib. 2007, 306, 271–283. [Google Scholar] [CrossRef]
  21. Inalpolat, M.; Handschuh, M.; Kahraman, A. Influence of indexing errors on dynamic response of spur gear pairs. Mech. Syst. Signal Process. 2015, 60, 391–405. [Google Scholar] [CrossRef]
  22. Wang, Y.; Zhang, W. A Proposed Model for Stochastic Vibration Analysis of Gear Transmission Systems. In International Design Engineering Technical Conferences and Computers and Information in Engineering Conference; American Society of Mechanical Engineers: New York, NY, USA, 1996; Volume 97584, p. V02BT02A012. [Google Scholar]
  23. Chang, L.; Liu, G.; Wu, L. Determination of composite meshing errors and its influence on the vibration of gear system. J. Mech. Eng. 2015, 51, 123–130. [Google Scholar] [CrossRef]
  24. Shi, Z.Y.; Kang, Y.; Lin, J.C. Comprehensive dynamics model and dynamic response analysis of a spur gear pair based on gear pair integrated error. J. Mech. Eng. 2010, 46, 55–61. [Google Scholar] [CrossRef]
  25. Kang, H. Research on gear dynamics considering influence of tooth surface roughness. J. Plast. Eng. 2019, 26, 234–239. [Google Scholar]
  26. Papadopoulou, S.; Pressas, I.; Vazdirvanidis, A.; Pantazopoulos, G. Fatigue failure analysis of roll steel pins from a chain assembly: Fracture mechanism and numerical modeling. Eng. Fail. Anal. 2019, 101, 320–328. [Google Scholar] [CrossRef]
  27. Ge, S.R.; Tonder, K. The fractal behavior and fractal characterization of rough surfaces. Tribology 1997, 17, 73–80. [Google Scholar]
  28. Kleemola, J.; Lehtovaara, A. Experimental simulation of gear contact along the line of action. Tribol. Int. 2009, 42, 1453–1459. [Google Scholar] [CrossRef]
  29. Mu, Y.M.; He, X.M.; Fang, Z.D. Design and dynamic performance analysis of high-contact-ratio spiral bevel gear based on ease-off technology. Int. J. Precis. Eng. Manuf. 2021, 22, 1963–1973. [Google Scholar] [CrossRef]
  30. Simon, V. Design of face-hobbed spiral bevel gears with reduced maximum tooth contact pressure and transmission errors. Chin. J. Aeronaut. 2013, 26, 777–790. [Google Scholar] [CrossRef]
  31. Deng, X.Z.; Fan, M.; Yang, H.B. Relationship between contact ratio and load of spiral bevel gears. China Mech. Eng. 2002, 12, 878–880. [Google Scholar]
  32. Simon, V. Load distribution in spiral bevel gears. ASME J. Mech. Des. 2007, 129, 2406090. [Google Scholar] [CrossRef]
  33. Simon, V. FEM stress analysis in hypoid gears. Mech. Mach. Theory 2000, 35, 1197–1220. [Google Scholar] [CrossRef]
  34. Qu, W.; Ding, H.; Tang, J. An innovative semi-analytical determination approach to numerical loaded tooth contact analysis (NLTCA) for spiral bevel and hypoid gears. Adv. Eng. Softw. 2020, 149, 102892. [Google Scholar] [CrossRef]
  35. ISO 6336-21:2017; Calculation of Load Capacity of Spur and Helical Gears. Calculation of Scuffing Load Capacity (also Applicable to Bevel and Hypoid Gears). Integral Temperature Method. ISO: Geneva, Switzerland, 2017.
Figure 1. Involute profiles of gears under different fractal dimensions.
Applsci 14 01533 g001
Figure 2. Surfaces under different fractal dimensions.
Applsci 14 01533 g002
Figure 3. Depicts the diagram of the tooth contact analysis.
Applsci 14 01533 g003
Figure 4. Gear cutter disk.
Applsci 14 01533 g004
Figure 5. Dynamic model of spiral bevel gear.
Applsci 14 01533 g005
Figure 6. Tooth surface conditions based on different fractal dimensions of W-M functions.
Applsci 14 01533 g006
Figure 7. Process diagram of FEA.
Applsci 14 01533 g007
Figure 8. Contact stress.
Applsci 14 01533 g008
Figure 9. Deformation solution graph.
Applsci 14 01533 g009
Figure 10. Meshing force on the tooth surface.
Applsci 14 01533 g010
Figure 11. Meshing stiffness on the tooth surface.
Applsci 14 01533 g011
Figure 12. Time-varying meshing stiffness under different fractal dimensions.
Applsci 14 01533 g012
Figure 13. Experimental process illustration.
Applsci 14 01533 g013
Figure 14. The comparative of experimental and simulation results.
Applsci 14 01533 g014
Figure 15. Simulation analysis of vibration velocity under different fractal dimensions D.
Applsci 14 01533 g015
Figure 16. Simulation analysis of vibration accelerations under different fractal dimensions D.
Applsci 14 01533 g016
Table 1. Manufacturing methods for spiral bevel gears.
Postprocessing OperationRoughness/μm
Unground machining0.8
Grinding machining0.4
Polishing0.2
Table 2. The relationship between roughness and fractal dimension.
Postprocessing
Operation
Surface
Roughness/μm
Fractal DimensionCharacteristic Scale
Coefficient
Unground machining0.81.555 × 10−6
Grinding machining0.41.603 × 10−6
Polishing0.21.652 × 10−6
Table 3. Parameters of the spiral bevel gear.
PinionGear
Number of teeth1627
Module (mm)4.25
Face width (mm)12
Pressure angle (°)20
Spiral angle (°)30
Shaft angle (°)90
Hand of spiralLeft handRight hand
Table 4. Comparison between experiment and simulation data in the 30 s.
Time/sSimulation Data under 77 N·m (mm/s)Experimental Data under 77 N·m (mm/s)Simulation Data under 105 N·m (mm/s)Experimental Data under 105 N·m (mm/s)
13.973.983.944.53
24.134.093.954.55
33.964.073.964.55
44.044.124.194.62
53.964.103.964.49
63.974.103.954.44
74.014.043.964.41
84.024.094.584.41
94.214.193.964.35
104.024.184.174.33
114.074.183.964.42
124.014.245.004.45
134.344.213.964.39
143.994.134.634.39
154.084.153.964.33
163.984.154.534.29
174.234.173.964.37
183.974.234.214.39
194.034.223.964.39
203.964.153.954.42
213.984.153.964.40
224.014.173.954.30
234.024.234.404.35
244.204.193.954.35
254.024.164.064.35
264.073.983.964.41
274.003.984.734.42
284.333.993.964.44
293.994.014.384.44
304.094.053.964.41
Disclaimer/Publisher’s Note: The statements, opinions and data contained in all publications are solely those of the individual author(s) and contributor(s) and not of MDPI and/or the editor(s). MDPI and/or the editor(s) disclaim responsibility for any injury to people or property resulting from any ideas, methods, instructions or products referred to in the content.

