Article

Adsorption of Coxsackievirus in Sediments: Influencing Factors, Kinetics, and Isotherm Modeling

1
College of Construction Engineering, Jilin University, Changchun 130026, China
2
College of Life Sciences, Jilin University, Changchun 130026, China
3
College of Environmental and Municipal Engineering, Qingdao University of Technology, Qingdao 266520, China
*
Author to whom correspondence should be addressed.
Appl. Sci. 2024, 14(4), 1480; https://doi.org/10.3390/app14041480
Submission received: 5 January 2024 / Revised: 31 January 2024 / Accepted: 4 February 2024 / Published: 12 February 2024

Abstract

:
Drinking groundwater contamination by pathogenic viruses represents a serious risk to worldwide public health, particularly for enteric viruses, which exhibit high prevalence and occurrence during outbreaks. Understanding how enteric viruses adsorb in groundwater is essential to protecting human health and ensuring the sustainable use of water resources. The adsorption properties of Coxsackievirus A16 (CA16), a common gastrointestinal virus that spreads through groundwater, were investigated in this work. A typical batch equilibrium approach was used to investigate CA16 adsorption and factors that influence it. In a laboratory recognized nationally as a biosafety level 2 facility, stringent research protocols were followed to guarantee compliance with experimental standards. The variables that were investigated included the size of the sediment particles, the starting concentration of the virus, temperature, pH level, and humic acid content. The findings showed that the CA16 virus was more strongly attracted to finer sediment particles and that its adsorption increased as the size of the sediment particle decreased. Furthermore, it was discovered that higher temperatures improved the CA16 virus’s ability to bind to sediment particles. The pH of the aqueous environment has a significant effect on the effectiveness of virus adsorption; higher effectiveness was seen in acidic environments. Furthermore, it was found that the presence of humic acid decreased the ability of clay to adsorb CA16, suggesting that humic acid has a detrimental influence on clay’s ability to adsorb viruses. The examination of kinetic models demonstrated that, in every scenario examined, the adsorption process of CA16 adhered to the pseudo-second-order kinetics model. Additionally, the Langmuir and Freundlich isotherm models were used to assess the equilibrium data that were collected in this investigation. The outcomes amply proved that the most accurate representation of the adsorption equilibrium was given by the Langmuir isotherm model. The study offered a solid scientific foundation for treating groundwater and creating plans to stop the spread of viruses.

1. Introduction

Groundwater plays a critical role in maintaining an ecosystem balance and promoting the sustainable advancement of human society, particularly in regions facing rapid economic and population growth [1]. In recent years, there has been a growing focus on groundwater pollution caused by viruses [2,3,4]. The origins of bacteria and viruses in groundwater primarily stem from sources such as domestic sewage, hospital wastewater, and leachate from waste. Undisinfected sewage carries a substantial load of bacteria and viruses, leading to the biological contamination of groundwater through infiltration during sewage irrigation and seepage pits reaching the vadose zone and saturated water zone. It affects millions of people globally each year, standing as a major contributor to health issues worldwide [5,6,7]. Cases involving viruses have become increasingly prevalent and widespread [1]. Among the viruses leading to water contamination, the presence of enteric viruses is responsible for considerable mortality worldwide, with frequent reports of outbreaks linked to contaminated drinking water sources, especially in developing countries [8,9,10,11,12]. The prevalence and extensive distribution of enteric viral infections have led to significant research attention on attenuating viruses in sediments [13,14]. Among them, coxsackieviruses are common among enteroviruses that can survive in the aquatic environment for weeks to months and migrate in groundwater systems [15,16]. Enteric viruses can cause a range of illnesses and are associated with symptoms such as gastroenteritis, respiratory problems, conjunctivitis, hepatitis, central nervous system infections, and muscular syndromes. Infected individuals can excrete a large number of virus particles in their stool, typically between 105 and 1011 virus particles per gram. Consequently, wastewater that contains fecal matter can have high concentrations of enteric viruses. While wastewater treatment systems can remove around 20–80% of these viruses, a significant viral load is still released into the environment through effluent discharge. This can result in the spread of viruses in groundwater, estuarine water, seawater, and rivers. It is important to note that the concentration of enteric viruses in water can vary based on factors such as season, prevalence of viral infections, and the type of pollution sources [17].
The attenuation of viral particles in groundwater is mainly controlled by two processes: inactivation and adsorption aggregation [18,19]. These mechanisms actively contribute to reducing the concentration of infectious virus in the aqueous phase [20]. Generally, the inactivation and adsorption of viruses in groundwater are considered separate phenomena [21]. Within a few hours, viral inactivation can be reasonably overlooked, with existing reports suggesting that it has reached or been presumed to have achieved equilibrium adsorption [22]. When examining virus adsorption, the influence of inactivation is typically disregarded due to its occurrence within a relatively short time span of hours [23]. Conversely, when studying virus inactivation, adsorption phenomena are considered inconsequential as virus viability is monitored over the course of several days or months [24]. Hence, acquiring a thorough comprehension of the adsorption behavior exhibited by viruses in groundwater is essential to ensure the preservation of water quality and overall safety.
The adsorption of viruses onto suspended particles predominantly depends on the interplay between the surface structures and chemical compositions of both the adsorbent and adsorbate [25]. Attaining maximum virus adsorption onto clay materials can happen instantaneously or may take several minutes, or even hours [26]. Empirical scrutiny has uncovered correlations between virus adsorption onto sediment surfaces and a range of factors, including microbial and sediment typologies, sediment particle size, adsorption duration, adsorption temperature, pH values, ion concentrations, and solid-liquid ratios [27,28]. The ionizable amino acid composition of the protein coat in most viruses makes them sensitive to environmental pH, which in turn affects their ionization and influences their adsorption and desorption behavior on particle surfaces. Numerous equilibrium experiments consistently demonstrate a decreasing trend in virus adsorption onto particles as pH increases [29,30,31]. Cao, Tsai [32] discovered that in sandy soil, dissolved soil organic matter competes with MS-2 for binding sites and can modify the surface charges of sorption sites. This can suppress the salinity effect on MS-2 sorption, but high salinity levels can overcome this suppression and result in MS-2 sorption on reversible sites in sandy soil.
However, current research commonly employs bacteriophages (such as MS2, PRD1) as proxies for pathogenic viruses, with limited consideration given to real viruses [33,34,35]. Yet, significant distinctions exist in terms of morphology, activity, and physicochemical properties between bacteriophages and viruses [36]. Studies have demonstrated that bacteriophage indicators or substitutes are often absent or lack a direct correlation with enteric viruses [37]. Using bacteriophages as substitutes may lead to the underestimation of virus occurrence, casting doubt on the reliability of predictive assessments [38,39]. Meanwhile, when examining the influential factors on virus behavior even with a real virus, experiments often tend to be conducted from a purely biological perspective, overlooking the significance of the groundwater environment [40,41].
Coxsackievirus, a common enteric virus, serves as a representative in the category of enteric viruses for groundwater transmission. It can result in mild to severe gastrointestinal symptoms, including diarrhea, vomiting, and abdominal pain. The physicochemical attributes of Coxsackievirus, including size, morphology, surface charge, capsid conformation, and the arrangement of charged, hydrophilic, and hydrophobic amino acids, play a significant role in the interaction between the virus and the adsorbent material [42].
Therefore, this study aims to investigate the adsorption behavior of Coxsackievirus A16 (CA16), the most common strain of coxsackievirus associated with mild to severe gastrointestinal symptoms. The research was conducted in a state-of-the-art biosafety level 2 laboratory, strictly adhering to rigorous experimental standards to ensure the accuracy and reliability of the results. Using the standardized batch equilibrium method, the study thoroughly investigated the influence of various factors, including the virus’s initial concentration, temperature, sediment particle size, pH value, and presence of humic acid, on its adsorption and adsorption behavior in this study. The main aim was to analyze the adsorption patterns of CA16, observe variations under different influencing factors, and establish quantitative relationships between adsorption and the aforementioned factors. Comparative analysis of different virus models, developed under diverse experimental conditions, was conducted to identify the most suitable model. The findings from this research are significant in two key aspects. Firstly, they contribute to an enhanced understanding of the interactions and behaviors of viruses in groundwater. Secondly, they provide crucial safety evidence for evaluating health risks associated with virus contamination in groundwater.

2. Material and Methods

2.1. Preparation of Viruses

For CA16 virus preparation, host cells (Human rhabdomyosarcoma RD cells) were cultured in disposable T-150 cell culture flasks until they reached 80–90%. confluency. Cell culture flasks were replenished with 2% Dulbecco’s modified Eagle medium (DMEM) supplemented with Fetal Bovine Serum (FBS), and viruses were added for infection at a multiplicity of infection (MOI) of 0.1. The infection was carried out under incubation conditions with 5% at 37 °C (Figure 1). After 2–3 days of infection, cell morphology was observed. Upon reaching a cytopathic effect (CPE) of approximately 90%, all cells and supernatants were collected. The collection process began by transferring the contents to 15 mL centrifuge tubes and centrifuging them at 1000 revolutions per minute (rpm) for 5 min at 4 °C. After centrifugation, the cell supernatants were stored at 4 °C. Meanwhile, the cell pellet was resuspended in DMEM and underwent three freeze-thaw cycles using a liquid nitrogen −37 °C water bath. Following the freeze-thaw cycles, it was centrifuged again at 3000 rpm for 5 min at 4 °C. The resulting supernatants were combined with the previously collected viral supernatant. The mixture was sterile filtered using a 0.22 μm filter membrane, dispensed, and stored in an ultra-low-temperature freezer at −80 °C until further use [43].

2.2. Virus Detection

The viral activity was determined by using the half-tissue culture infectious dose (TCID50) assay. To conduct this assay, RD cells were plated in 96-well plates when they reached 70–80% confluency. A pre-diluted 10-fold gradient CA16 suspension (100 μL) was applied to columns 1–11 of the 96-well plate, with DMEM-2% FBS (100 μL) added to column 12 as a control. The plates were then incubated in a CO2 thermostat set at 5% CO2 and 37 °C to facilitate viral infection of the cells. Daily observations were conducted for the subsequent 3 to 5 days to evaluate viral infection. The number of wells exhibiting 50% CPE was recorded until no new wells displayed CPE (Figure 2). The Reed-Muench method, based on the half-tissue cell infectious dose, was employed for calculating TCID50 value (expressed as TCID50/mL).

2.3. Virus Adsorption Batch Experiment

Virus adsorption batch experiments were conducted using the standardized batch equilibrium method under controlled laboratory conditions. In every experiment, 0.3 g of sediment particles were added to 12 plastic centrifuge tubes, each with a 4 mL volume. Following that, 1 mL of virus suspension at a specific concentration was added to each plastic centrifuge tube. Subsequently, the tubes were placed on a temperature-controlled shaker and agitated at a speed of 200 rpm. At specific time points (0, 5, 10, 15, 20, 30, 45, 60, 75, 90, 100, and 120 min), one centrifuge tube was randomly selected, and the supernatant was carefully collected. To assess the viral suspension activity, the supernatant underwent filtration using a 0.45 μm aqueous filter. Three replicates were conducted at each time point, and the average value was calculated. To minimize experimental error, additional plastic centrifuge tubes with only 1 mL of viral suspension were utilized as blank controls. Table 1 presents a comprehensive overview of the detailed experimental scheme to facilitate data analysis. A control experiment of virus decay is first conducted in the study. In the control experiment, a 0.05 log reduction is observed within 120 min. Therefore, this study solely focuses on the deactivation attributed to adsorption.
The adsorption decay curve of CA16 under different conditions was calculated using log C t / C 0 , and Equation (1) was utilized to calculate the equilibrium adsorption capacity of CA16 on different sediment particles [44]:
Q e = C 0 C e V W
where Q e   is the quantity of CA16 adsorbed by the medium at adsorption equilibrium (TCID50/g); C 0 is the initial viral activity titer of CA16 (TCID50/mL); C t is the activity titer of the virus at time t (TCID50/mL); C e is the activity titer of the toxin at adsorption equilibrium (TCID50/mL); V is the volume of solution (mL); and W is the mass of adsorption medium (g).

2.3.1. Sediment Particle Size

The samples underwent treatment using a specific gravity method and sieving technique [45]. Through these methods, the samples were categorized into clay particles (<0.002 mm), silt (0.002–0.05 mm), fine sand (0.05–0.25 mm), medium sand (0.25–0.5 mm), and coarse sand (0.5–2 mm). Subsequently, the segregated sediments underwent a thorough washing process to remove impurities adhering to their surface, including soil, dust, and salt. The dry-sieved particles were sterilized through high-temperature and high-pressure treatment. Initially, they were placed in a high-pressure steam sterilization pot and exposed to 121 °C for 20 min. Following this, the sterilized samples were evenly spread over a tray and dried in a forced-air drying oven at 105 °C for 4 h. Finally, the processed sediment media were obtained and stored for future use. For viral analysis, precisely weighed portions of clay, silt, fine sand, medium sand, and coarse sand (0.3 g each) were individually transferred into separate EP tubes. Subsequently, the adsorption experiment was conducted using the methodology outlined in Section 2.3, followed by a sampling test.

2.3.2. Temperature

For each experiment, 0.3 g of clay was placed into individual centrifuge tubes. Then, 1 mL of CA16 suspension was added to each tube. These tubes, containing the virus suspension, were placed on a constant temperature shaker, with temperatures precisely set at 10 °C and 25 °C. Subsequently, the adsorption experiment was conducted following the methodology outlined in Section 2.3, followed by a sampling test.

2.3.3. pH Values

For pH quantification, 1 mL of CA16 suspension was first added to individual centrifuge tubes. Subsequently, 0.3 g of clay was accurately weighed and transferred into each tube. The pH of the adsorption system was adjusted using minimal volumes of 0.1 mol/L HCl and NaOH solutions to attain targeted pH values of 5.5, 6.5, 8.5, and 9.5, respectively. Following this adjustment, the adsorption experiment was conducted as per the methodology outlined in Section 2.3, followed by a sampling test.

2.3.4. Humic Acid

For humic acid content adjustment, 0.3 g of clay was precisely weighed and transferred into separate plastic centrifuge tubes. Following this, 1 mL of CA16 suspension was added to each tube. The humic acid solution was introduced into the virus suspension, and the humic acid content was adjusted to 0 mg/L, 5 mg/L, and 10 mg/L, respectively. Subsequently, the adsorption experiment was conducted as per the outlined methodology in Section 2.3, followed by a sampling test.

2.3.5. Initial Concentrations

To evaluate the activity titer of the viral suspension, various concentrations of CA16 were prepared by adjusting the initial concentration: 1 × 10⁸ TCID50/mL, 1 × 10⁷ TCID50/mL, 4.6 × 10⁶ TCID50/mL, 2.1 × 10⁵ TCID50/mL, 4.6 × 10⁴ TCID50/mL respectively. And then, the adsorption experiment was conducted following the methodology outlined in Section 2.3, followed by a sampling test.

2.4. Adsorption Kinetics

To examine the adsorption kinetics of the virus on the medium, four kinetic models were utilized: first-order (Equation (2)), second-order (Equation (3)), pseudo-first-order (Equation (4)), and pseudo-second-order (Equation (5)) [46,47,48,49].
ln C 0 C t = K 1 t
1 C t 1 C 0 = K 2 t
ln Q e Q t = ln Q e K 1 t
t Q t = 1 K 2 Q e 2 + t Q e
where K 1 is the primary adsorption rate constant, K 2 is the secondary adsorption rate constant, K 1 is the pseudo-first-order adsorption rate constant, and K 2 is the pseudo-second-order adsorption rate constant.

2.5. Adsorption Isotherm

The adsorption isotherm equation describes the relationship between the equilibrium concentration of the adsorbate and the quantity adsorbed on the adsorbent. This equation enhances our understanding of the correlation between these factors and provides valuable insights into the maximum adsorption capacity and other relevant parameters of the adsorbent. The adsorption isotherm curve depicts the relationship between the adsorption amount and the corresponding concentration, maintaining a constant temperature. Two frequently used isotherm models are the Freundlich (Equation (6)) and Langmuir models (Equation (7)) [50,51].
Q e = K F C e 1 n
Q e = Q m K L C e 1 + K L C e
where C is the viral activity titer of the supernatant after sample treatment (TCID50/mL), Q m is the maximum adsorption capacity (TCID50/g), K F   is the Freundlich constant, K L is the Langmuir constant, n is the empirical constants.
Equations (6) and (7) can be reformulated into Equations (8) and (9), respectively.
log Q e = 1 n log C e + log K F
1 Q e = 1 Q m + 1 K L Q m × 1 C e

3. Results and Discussion

3.1. Effect of Different Factors on Virus Adsorption

3.1.1. Sediment Particle Size

Figure 3a illustrates CA16 adsorption onto sediment particles of different sizes, emphasizing the significant role of particle size in this process. The figure demonstrates that as particle size decreases, the impact of sediment particles on CA16 adsorption becomes more pronounced. Specifically, fine sand, medium sand, and coarse sand reach adsorption equilibrium in approximately 70 min, resulting in a reduction of virus concentration to 1.83 log, 1.56 log, and 1.30 log, respectively. Conversely, clay and silt complete adsorption within 120 min, achieving an adsorption rate exceeding 99%, and reducing virus concentration to 2.50 log and 2.10 log at equilibrium, respectively. Importantly, Figure 3a indicates an observed increase in the adsorption rate of CA16 as sediment particle size decreases, following the sequence: clay > silt > fine sand > medium sand > coarse sand. This phenomenon is mainly attributed to the larger specific surface area of sediment particles accompanying their reduction in size [52], resulting in a higher availability of adsorption sites on their surface, thereby facilitating virus adsorption.

3.1.2. Temperature

The graph in Figure 3b illustrates the adsorption data of CA16 at different temperatures. It is evident that there is an increased adsorption of CA16 onto clay as the temperature rises from 10 °C to 25 °C. At equilibrium, the reduction in CA16 concentration rises from 2.17 log to 2.5 log. Furthermore, the adsorption rate of CA16 increases with the temperature elevation. This temperature-dependent enhancement can be attributed to the accelerated reaction rate between viruses and adsorbents. The increased temperature induces higher molecular dynamics, facilitating adsorption reactions and ultimately boosting the virus’s adsorption capacity. This observation aligns with previous studies [53]; for instance, Chrysikopoulos and Aravantinou [54] reported a significant increase in the adsorption rate of bacteriophages MS2 and DX174 by quartz sand when the temperature increased from 4 °C to 20 °C. Additionally, they found that the adsorption of bacteriophage MS2 was higher compared to QX174, and montmorillonite exhibited higher adsorption than kaolinite. Hydrophobic forces played a crucial role, as the stability of hydrophobic interactions increases at higher temperatures. Bales et al. further suggested that if adsorption is partially governed by hydrophobic forces, the adsorption process will accelerate with an increase in temperature [16].

3.1.3. pH Values

According to the observations in Figure 3c, the pH of the aqueous environment significantly influences CA16 adsorption by clay. The graph shows higher adsorption efficiency of the sediment under acidic conditions, diminishing notably in alkaline environments. With the pH increasing from 5.5 to 9.5, there is a visible decline in clay’s adsorption capacity for CA16. At pH 5.5, the reduction in CA16 concentration after reaching equilibrium is 2.93 log. Conversely, at pH 9.5, the reduction is 2.33 log, indicating a 24.7% decrease in CA16 concentration reduction as pH rises from 5.5 to 9.5. These findings confirm pH sensitivity in CA16 adsorption, favoring higher efficiency under acidic conditions. This can be explained by pH fluctuations impacting the surface charges of the virus and clay. Changes in pH may modify the surface charges, affecting their adsorption capacities. Generally, high pH supports free viruses, while low pH encourages virus adsorption. However, the isoelectric points of the virus and surface may also contribute to this interaction [49].

3.1.4. Humic Acid

The influence of humic acid on the adsorption of CA16 by clay is illustrated in Figure 3d. As humic acid concentrations increase, a more pronounced inhibitory effect is observed, resulting in a gradual decline in adsorption capacity. This can be explained by the competitive interaction between the virus and humic acid for available adsorption sites on the clay particle surface [55]. This competition reduces the availability of adsorption sites for the virus, leading to a decrease in adsorption capacity. Additionally, higher humic acid concentrations contribute to increased solution viscosity and the formation of organic colloids due to elevated molecular weight. These colloidal substances can form complex structures with the virus, impeding effective contact and adsorption onto the clay particles.

3.1.5. Initial Concentrations

In the adsorption experiments, CA16 at various concentrations (1 × 10⁸, 1 × 10⁷, 4.6 × 10⁶, 2.1 × 10⁵, 4.6 × 10⁴) was utilized. The adsorption isotherm of CA16 on clay is presented in Figure 3e. The graph demonstrates an inverse relationship between virus concentration and the relative adsorption capacity of clay for the virus. This observation can be explained by considering that at lower concentrations of CA16, the surfaces of sediment particles provide an abundance of available adsorption sites, and as a result, the virus has a higher adsorption capacity. Meanwhile, as the concentration of the CA16 suspension increases, the adsorption capacity decreases due to limited available adsorption sites on the surfaces when the CA16 concentration in the solution is high. Consequently, some viruses may remain in a free state without being adsorbed. It is notably that continuous shaking during the experiment may induce the detachment of loosely adsorbed CA16 under shear forces, contributing to the observed decrease in adsorption capacity at higher virus concentrations [56,57,58]. In addition, the variation in results observed among the different experiments (1, 6, 9, 12, and 15) under the same condition can be attributed to the difference in initial concentration of the virus within each group. The error within these experiments is further analyzed and demonstrated in Figure 3f. It can be seen that the error range is less than 10%, indicating that the TCID50 method yields consistent results within an acceptable range of error.

3.2. Kinetic Modelling

3.2.1. Fitting of the Kinetic Models with Varied Sediment Particle Sizes

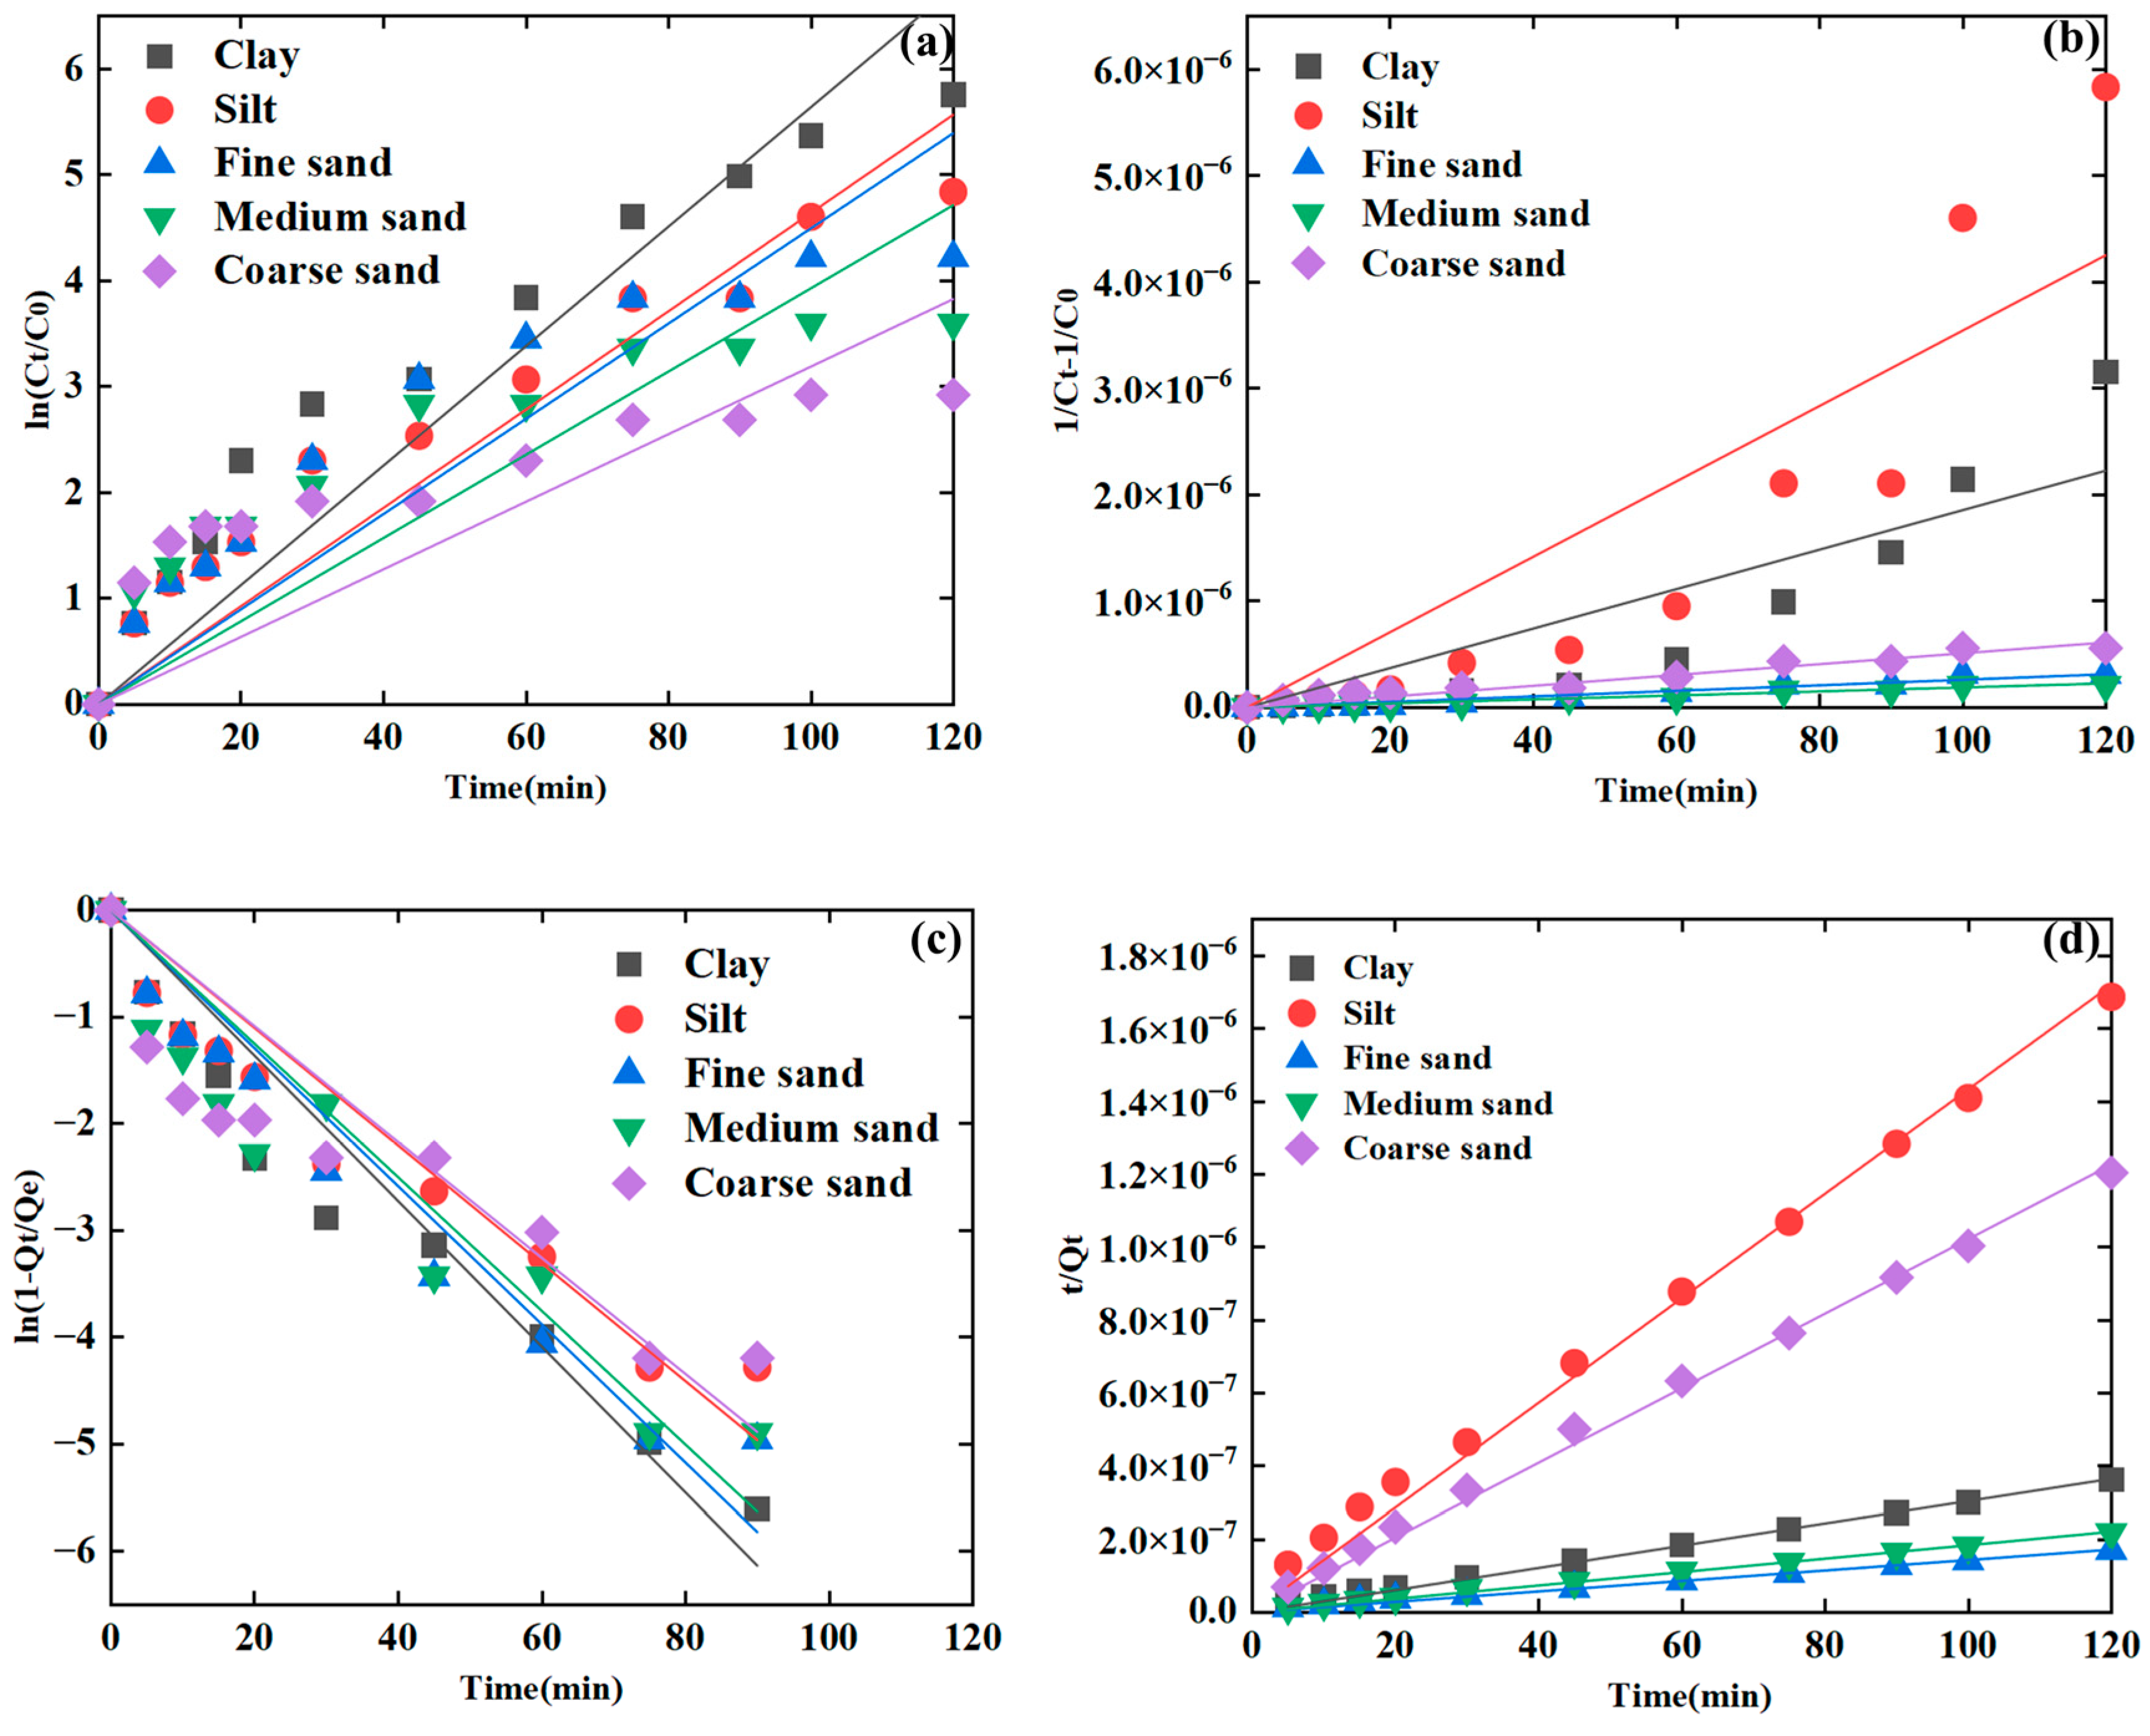
A series of experiments were conducted to investigate the impact of CA16 adsorption at various sediment particle sizes. The collected data were analyzed using four kinetic models: first-order, second-order, pseudo-first-order, and pseudo-second-order kinetic models. The analysis of the results presented in Figure 4a–d indicates that the pseudo-second-order kinetic model provides the best fit to the experimental data, exhibiting a stronger correlation with the observed adsorption behavior. This validates the reliability of the pseudo-second-order kinetic model in precisely describing the adsorption kinetics of CA16 on clay surfaces at different sediment particle sizes.
Table 2 presents the kinetic parameters and linear correlation coefficients of CA16 adsorption at varying sediment particle sizes. The coefficient of determination (R2) values gauge the goodness of fit between the experimental data and the kinetic models. Particularly noteworthy is the superior fit of the pseudo-second-order kinetic model to the experimental data, with R2 values exceeding 0.99 (p < 0.05). Additionally, the outstanding agreement between the experimental values and the predicted values derived from the pseudo-second-order kinetic model reaffirms its suitability for accurately elucidating the adsorption process. These findings emphasize the robustness and reliability of the pseudo-second-order kinetic model in revealing the mechanisms and kinetics of CA16 adsorption at different sediment particle sizes.

3.2.2. Fitting of the Kinetic Models with Varied Temperatures

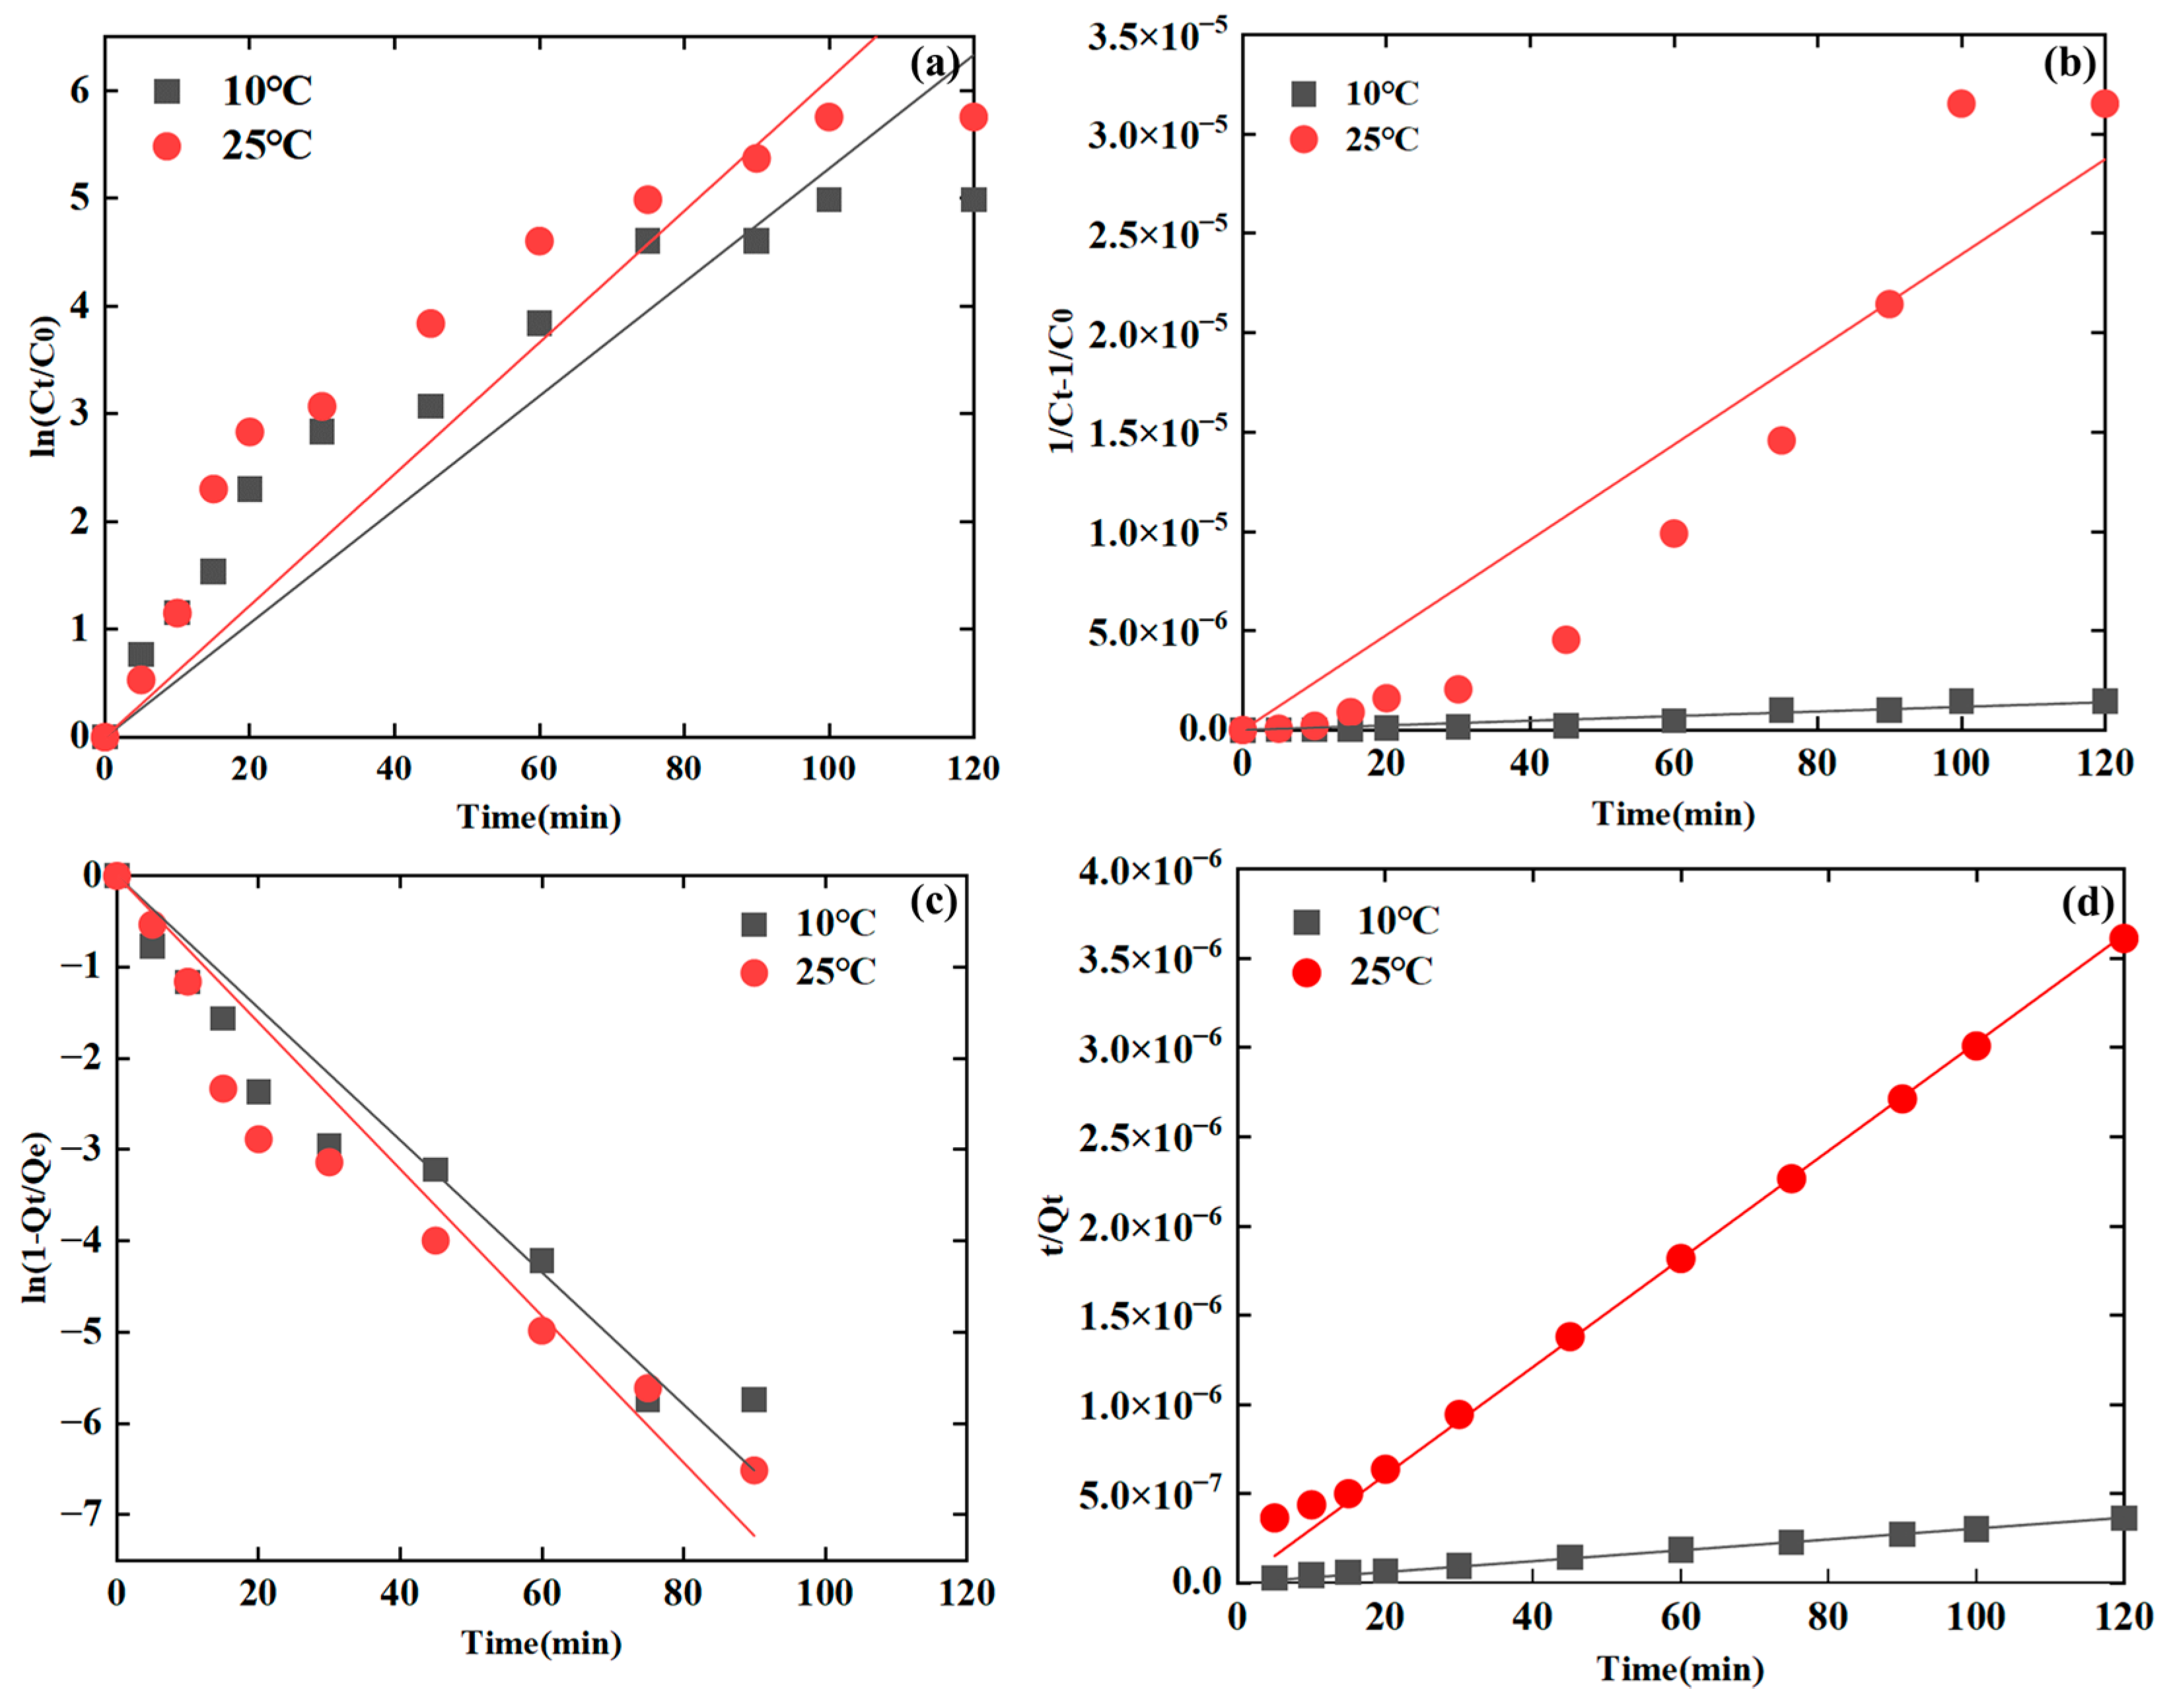
To explore the influence of clay on CA16 adsorption at different temperatures, a series of experiments were conducted. Figure 5a–d present various fits of kinetic models, and it is evident that the pseudo-second-order adsorption kinetic model provides the best fit to the experimental data. This underscores its superior ability to depict the kinetics of CA16 adsorption onto clay at various temperatures. Furthermore, the outstanding agreement observed between the experimental data and the predicted values from the pseudo-second-order kinetic model affirms its effectiveness in clarifying the adsorption process.
Table 2 presents the kinetic parameters and adjusted R2 values obtained from the adsorption of CA16 onto clay at various temperatures. The goodness of fit between the experimental data and the kinetic models is evaluated using the adjusted R2 value. Remarkably, the pseudo-second-order kinetic model exhibits the strongest fit for the experimental data, with adjusted R2 values surpassing 0.99 (p < 0.05). This result highlights the effectiveness of the pseudo-second-order kinetic model in elucidating the mechanisms and kinetics of CA16 adsorption on clay surfaces at varying temperatures. The experimental values closely match the predicted values from the pseudo-second-order kinetic model, further affirming the model’s accuracy in describing the adsorption process.

3.2.3. Fitting of the Kinetic Models with Varied pH Values

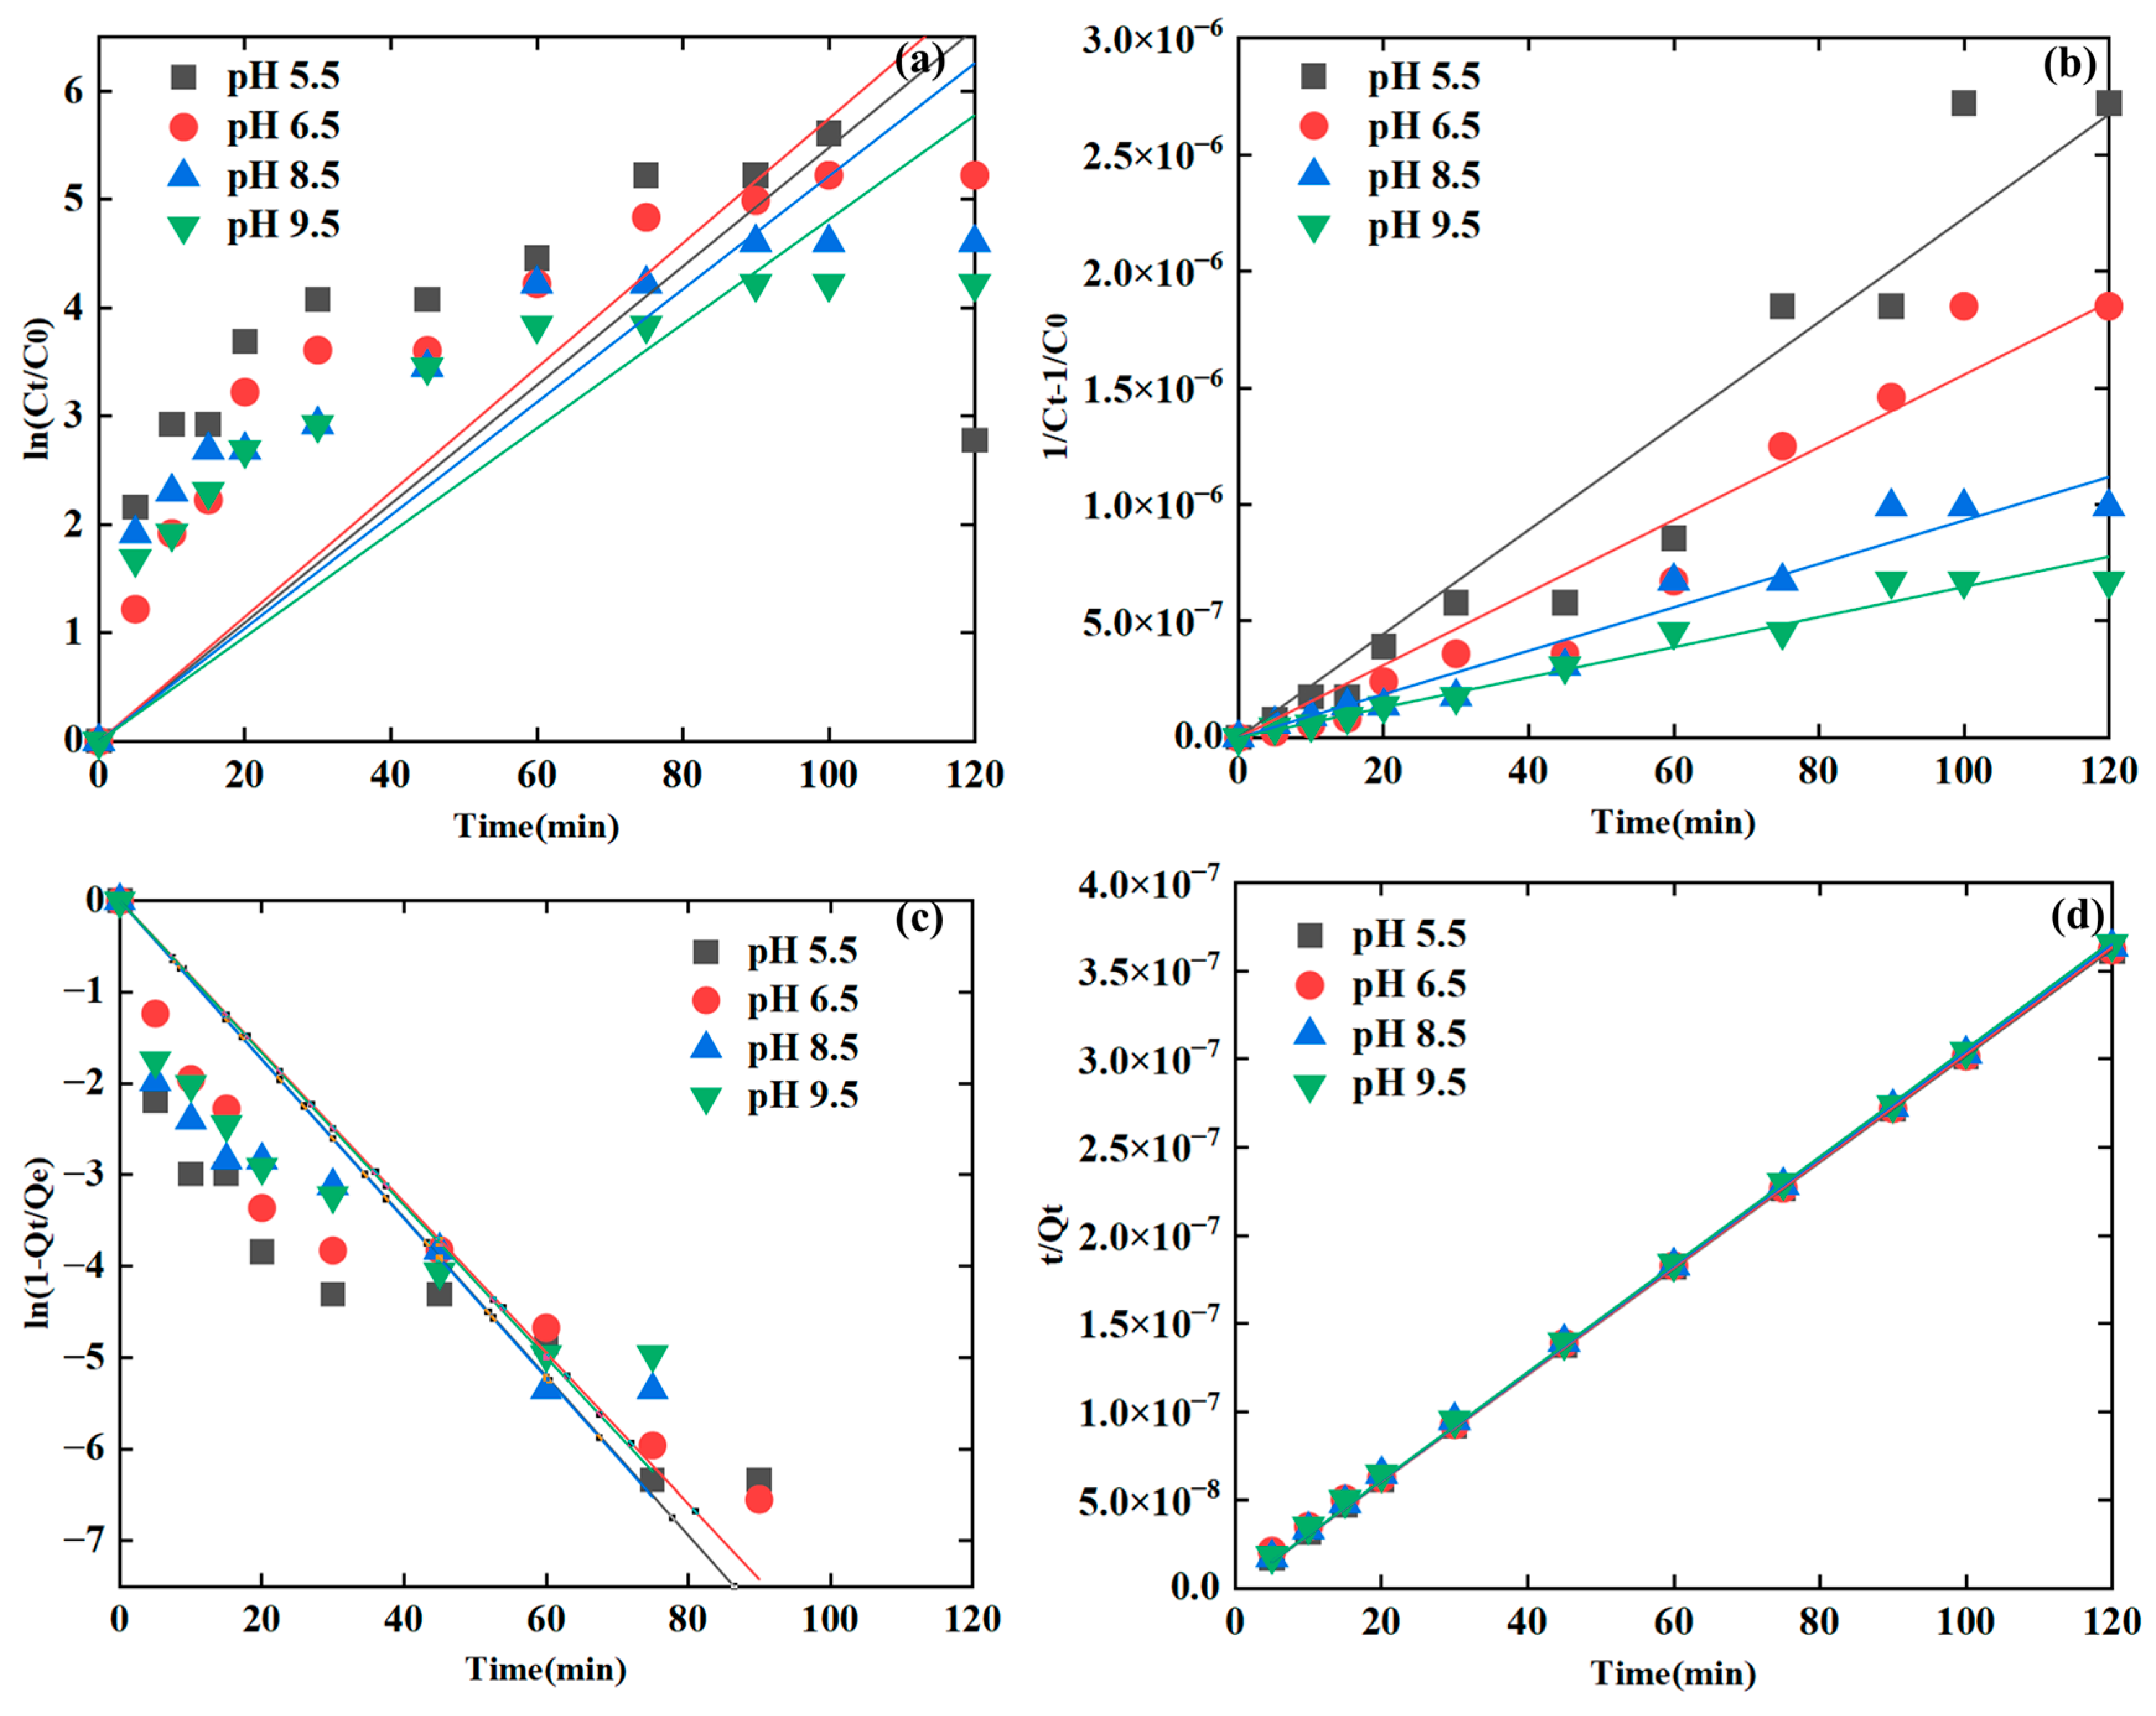
The results of the fitting, as illustrated in Figure 6a–d, demonstrate that the pseudo-second-order adsorption kinetic model offers the most precise fit to the experimental data. The insights gained from Figure 6 underscore the exceptional performance of the pseudo-second-order adsorption kinetic model in precisely depicting the adsorption dynamics of CA16 onto clay surfaces across diverse pH values. This empirical evidence reinforces the dependability and suitability of the pseudo-second-order kinetic model in elucidating the mechanisms and kinetics of CA16 adsorption on clay under varying pH conditions.
As presented in Table 2, the pseudo-second-order kinetic model best aligns with the experimental data, yielding high adjusted R2 values ranging from 0.996 to 0.999 (p < 0.05). It is noteworthy that a close concordance exists between the experimental values and those predicted by the pseudo-second-order kinetic model. This alignment substantiates the precision of the kinetic model in portraying the adsorption dynamics of CA16 onto clay. The dependability and applicability of the pseudo-second-order kinetic model in unraveling the kinetics and mechanisms of CA16 adsorption on clay surfaces at varying pH levels were further affirmed by the robust agreement observed between the experimental and predicted values.

3.2.4. Fitting of the Kinetic Models with Varied Humic Acid Concentrations

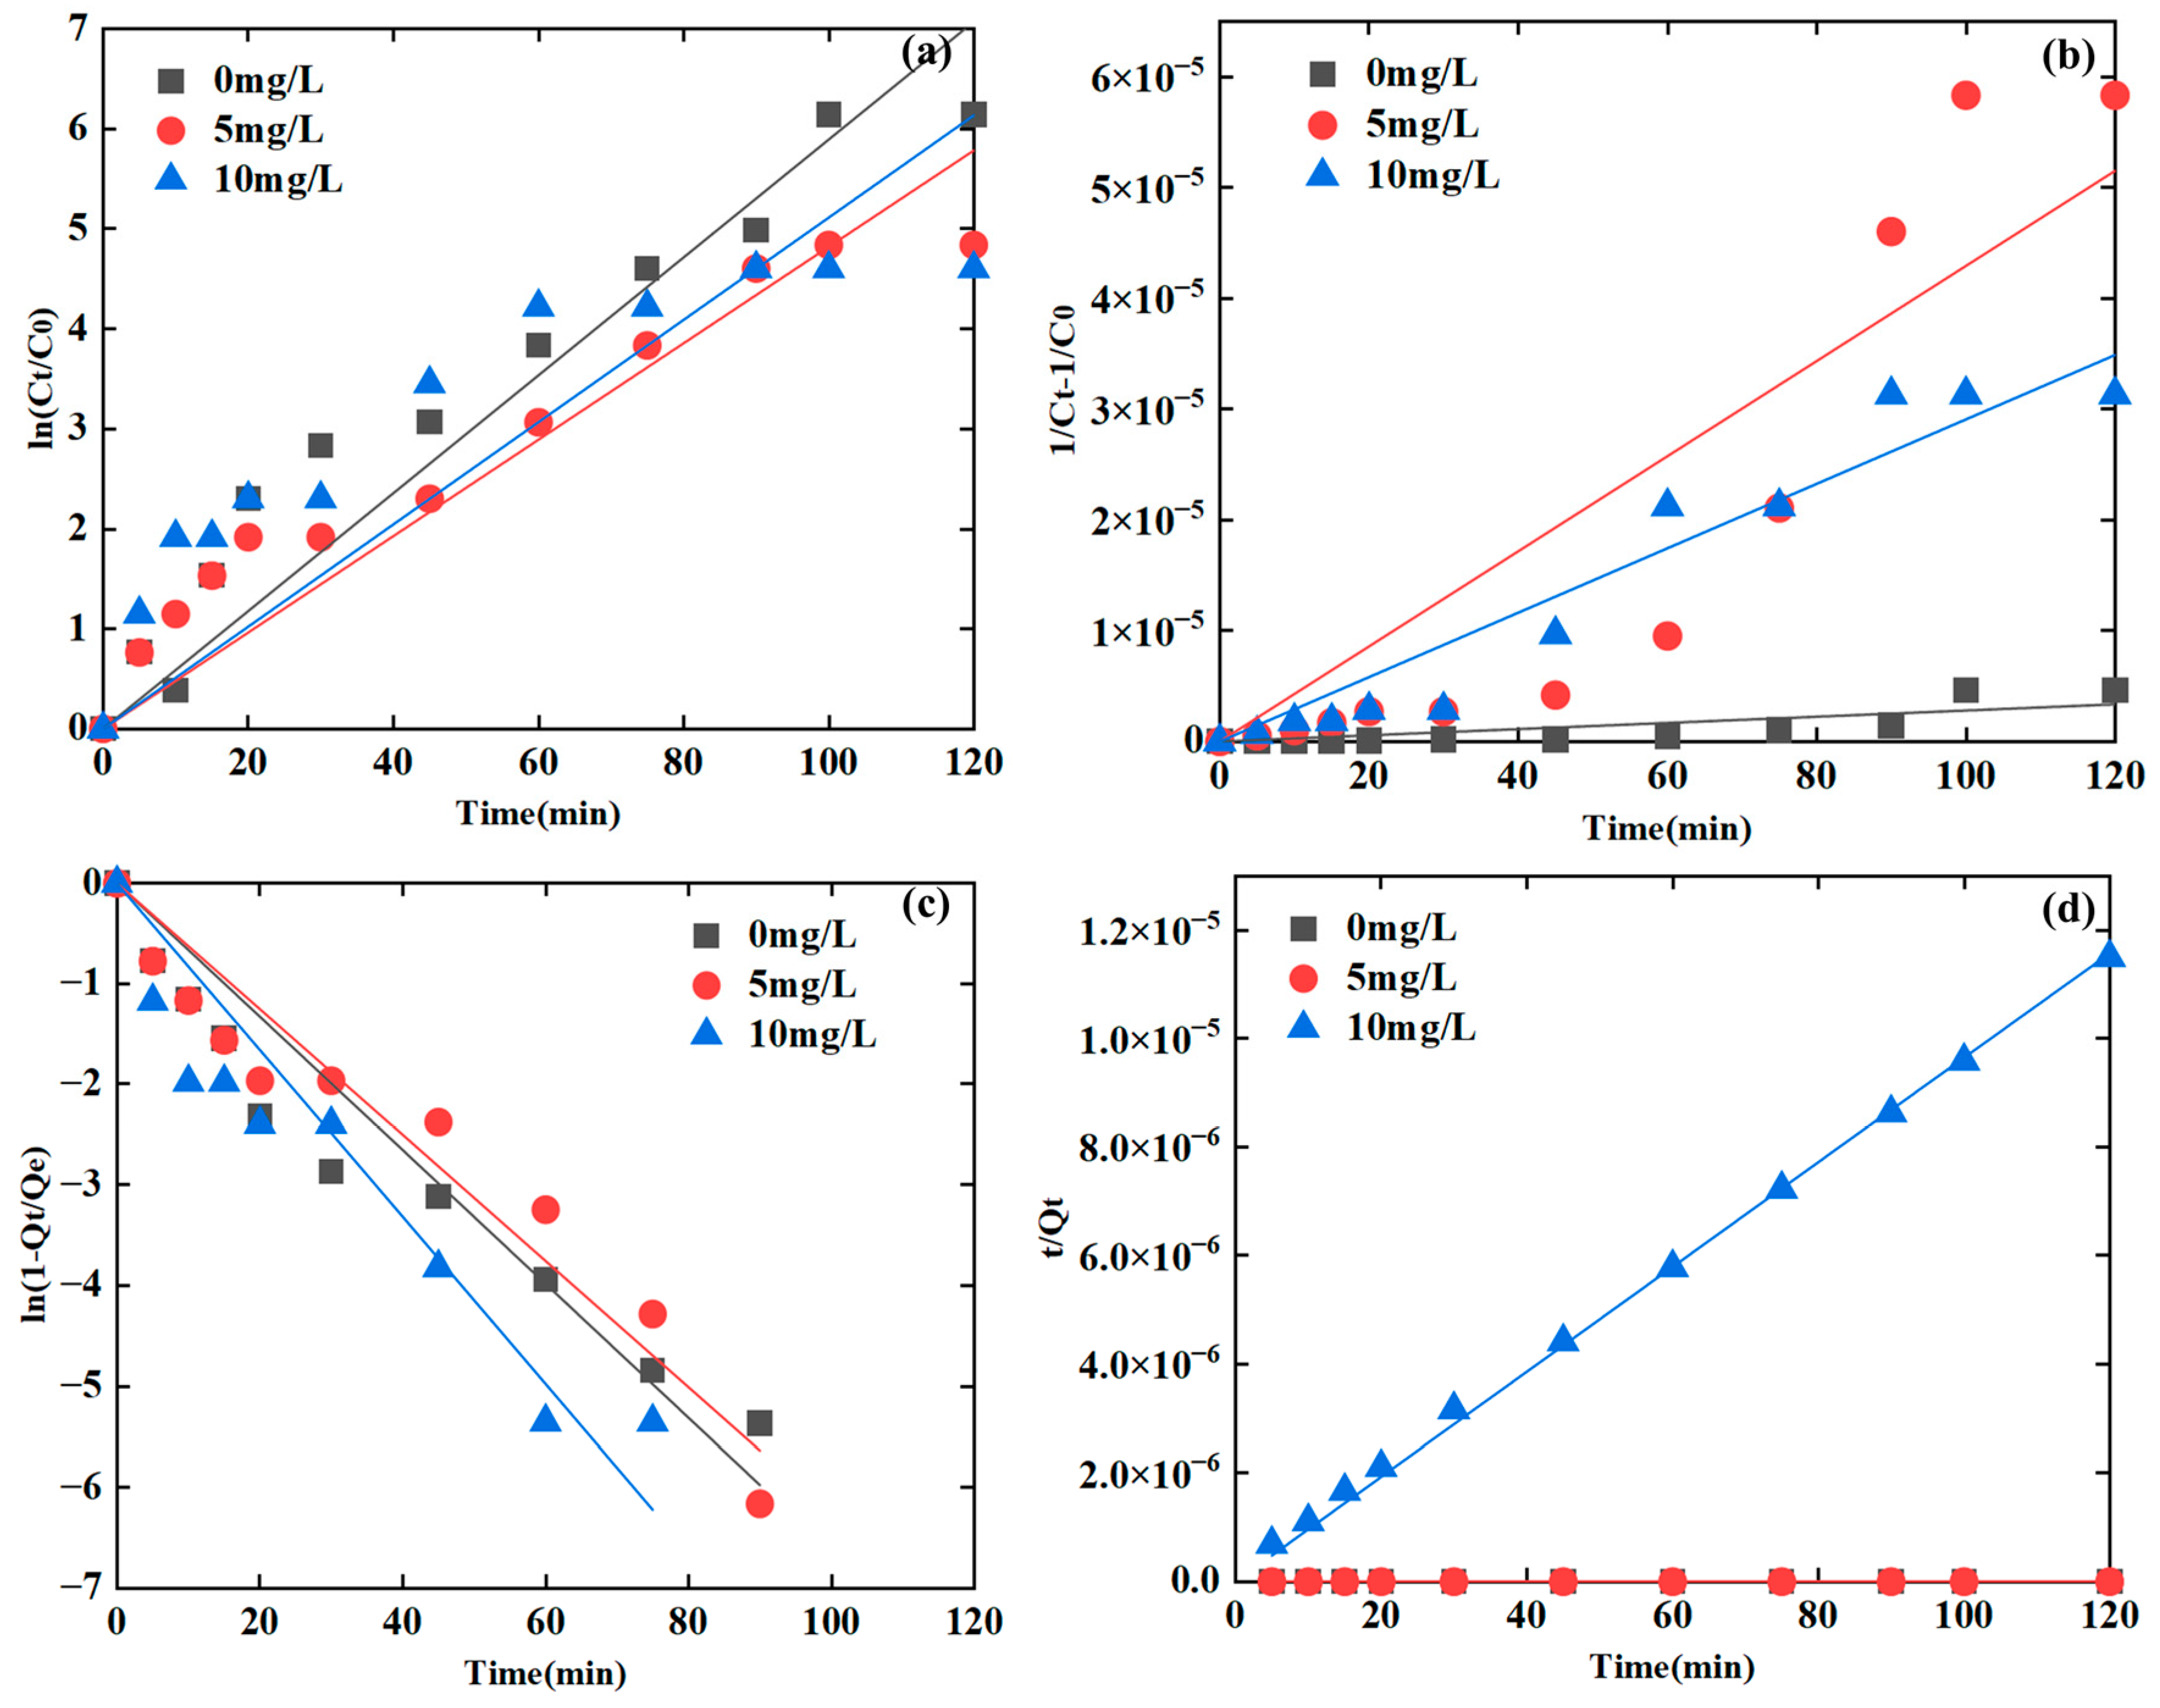
The results of the fitting are presented in Figure 7a–d and clearly indicate that the pseudo-second-order adsorption kinetic model offers the most accurate fit. The insights from Figure 7 emphasize the effectiveness of the pseudo-second-order adsorption kinetic model in precisely describing the adsorption dynamics of CA16 in the presence of humic acid. This empirical evidence underscores the reliability and appropriateness of the pseudo-second-order kinetic model as the preferred choice for elucidating the mechanisms and kinetics of CA16 adsorption in the presence of humic acid.
Table 2 provides the kinetic parameters and adjusted R2 values derived from the adsorption of CA16 at different humic acid concentrations. The adjusted R2 values indicate that the pseudo-second-order kinetic model provides the best fit for the adsorption data across diverse humic acid conditions (adjusted R2 > 0.98) (p < 0.05). Importantly, the experimental values closely align with the predicted values calculated by the pseudo-second-order kinetic model. This agreement emphasizes the sufficiency and reliability of the model in precisely elucidating the adsorption process of CA16 in the presence of varying humic acid concentrations. The robust correlation observed between the experimental and predicted values further validates the appropriateness of the pseudo-second-order kinetic model in accurately portraying the mechanisms and kinetics involved in the adsorption of CA16 under diverse humic acid conditions.

3.3. Isotherm Analysis

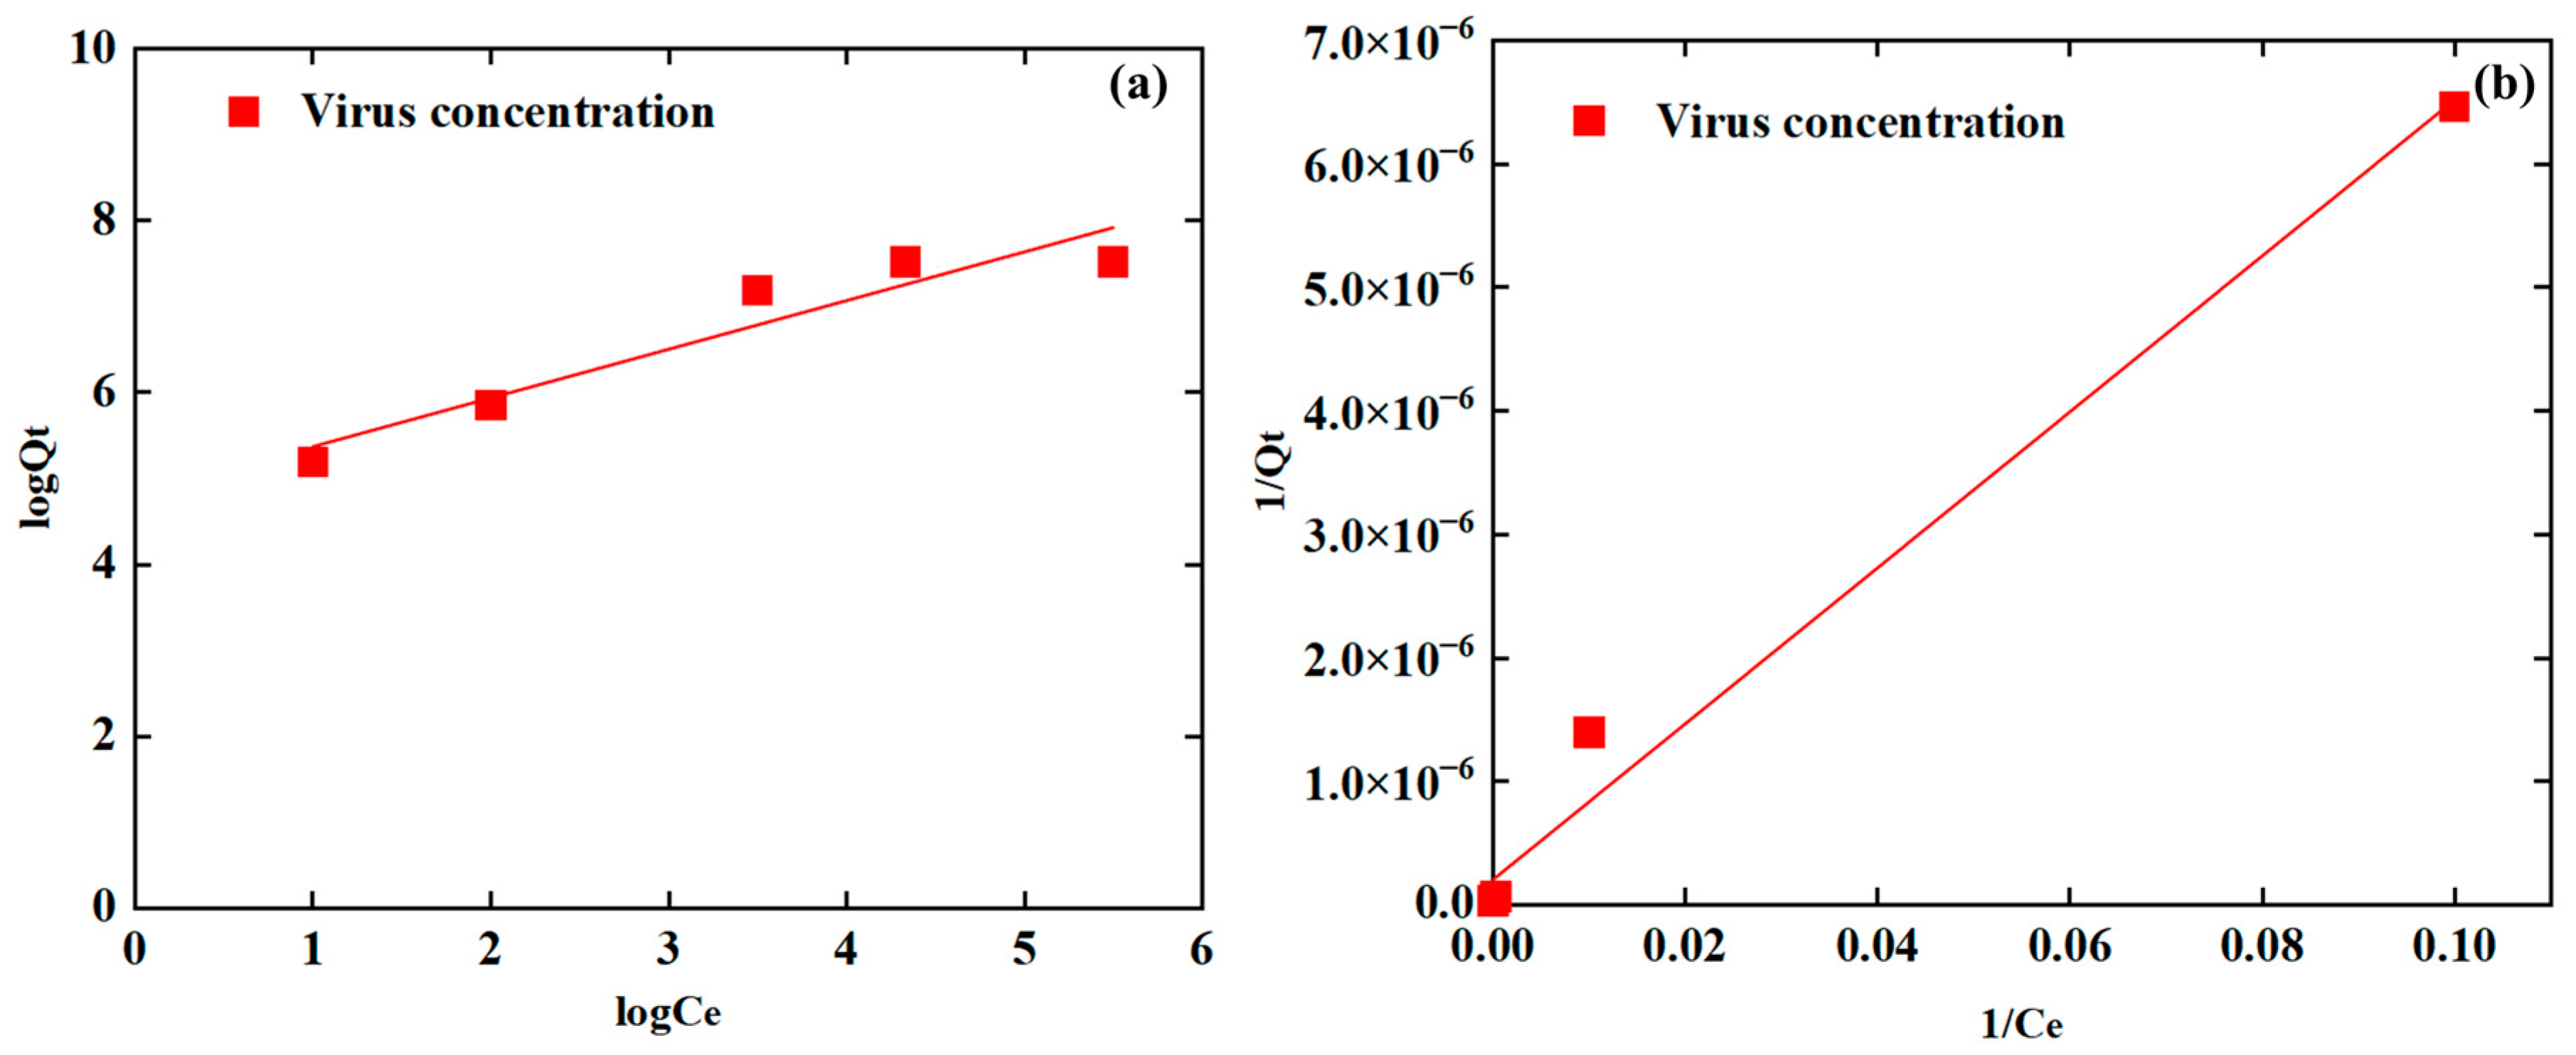
Utilizing Equations (8) and (9), the logarithm of the equilibrium concentration log C e was plotted against the logarithm of the equilibrium adsorption capacity log Q e , while 1 / C e was plotted against 1/ Q e . Regression analysis was conducted on the experimental data to derive regression lines. The results are presented in Figure 8, revealing a linear correlation between the equilibrium adsorption capacity and the equilibrium concentration. The correlation coefficients resulting from fitting the data using these two equations are detailed in Table 3. Upon examining both the graph and table, it becomes evident that the Langmuir model exhibits a stronger correlation with the experimental data. This is further supported by the higher adjusted R2 value for the Langmuir equation, indicating its superior suitability for describing the adsorption behavior of clay for CA16. Overall, the simulation results demonstrate that the Langmuir equation more accurately depicts the isotherm adsorption characteristics of clay for CA16.

4. Conclusions

This study utilized the standard batch equilibrium method to explore the impact of various environmental factors in sediments, including different initial virus concentrations, particle sediment sizes, temperatures, pH values, and humic acid on the adsorption of CA16. Results showed that smaller sediment particle sizes, especially clay, exhibited heightened adsorption capacity for CA16 compared to silt, fine sand, medium sand, and coarse sand. Additionally, higher temperatures led to increased CA16 adsorption by sediment particles, resulting in a viral titer reduction from 2.17 log to 2.5 log as the temperature rose from 10 °C to 25 °C. The pH of the water significantly influenced sediment adsorption, with acidic environments showing higher efficiency than alkaline ones. Clay’s adsorption capacity for CA16 decreased with rising pH (5.5 to 9.5), causing a 24.7% reduction in concentration decay. Moreover, the presence and concentration of humic acid were found to negatively impact the adsorption capacity of clay for CA16. The experimental data were fitted using adsorption kinetic models, with the pseudo-second-order model closely aligning with simulated results, exhibiting adjusted R2 values above 0.9. Conclusions drawn from static adsorption experiments indicate that higher initial CA16 concentrations resulted in lower relative adsorption capacities of clay, eventually reaching a maximum per unit of sediment. Furthermore, adsorption isotherm models revealed the Langmuir model as the most representative, outperforming the Freundlich model. These findings are vital for accurately assessing health risks associated with viral contamination in aquifers, offering crucial safety evidence. In the future, more geochemical factors will be considered to study the impact of the groundwater environment on the behavior of viruses with dynamic transport experiments.

Author Contributions

M.L.: Conceptualization, Investigation, Methodology, Formal analysis, Writing—original draft. X.Z.: Conceptualization, Methodology, Writing—review and editing, Funding acquisition. W.S.: Supervision, Writing—review & editing. F.C.: Supervision, Writing—review & editing. T.L.: Writing—review and editing. Z.D.: Methodology, Writing—review and editing. All authors have read and agreed to the published version of the manuscript.

Funding

This work was supported by the National Natural Science Foundation of China (42272285).

Institutional Review Board Statement

Not applicable.

Informed Consent Statement

Not applicable.

Data Availability Statement

The data presented in this study are available on request from the corresponding author. However, the data are not publicly available due to reasons related to privacy and ethical considerations. These restrictions aim to protect the confidentiality of study participants and adhere to ethical guidelines. If you would like access to the data, please feel free to reach out to the corresponding author for further information.

Conflicts of Interest

The authors declare that they have no conflicts of interest or personal relationships that could have influenced the findings reported in this paper.

References

  1. Rimstad, E. Examples of emerging virus diseases in salmonid aquaculture. Aquac. Res. 2011, 42, 86–89. [Google Scholar] [CrossRef]
  2. Baker, R.E.; Mahmud, A.S.; Miller, I.F.; Rajeev, M.; Rasambainarivo, F.; Rice, B.L.; Takahashi, S.; Tatem, A.J.; Wagner, C.E.; Wang, L.-F.; et al. Infectious disease in an era of global change. Nat. Rev. Microbiol. 2022, 20, 193–205. [Google Scholar] [CrossRef]
  3. Yazeed, V.W.; Eunice, U.-J.; Dippenaar, M.A. Potential SARS-CoV-2 contamination of groundwater as a result of mass burial: A mini-review. Sci. Total Environ. 2022, 835, 155473. [Google Scholar] [CrossRef]
  4. Masciopinto, C.; Osvalda, D.G.; Scrascia, M.; Fortunato, F.; La Rosa, G.; Suffredini, E.; Pazzani, C.; Prato, R.; Montagna, M.T. Human health risk assessment for the occurrence of enteric viruses in drinking water from wells: Role of flood runoff injections. Sci. Total Environ. 2019, 666, 559–571. [Google Scholar] [CrossRef] [PubMed]
  5. Li, P.; Karunanidhi, D.; Subramani, T.; Srinivasamoorthy, K. Sources and consequences of groundwater contamination. Arch. Environ. Contam. Toxicol. 2021, 80, 1–10. [Google Scholar] [CrossRef] [PubMed]
  6. Pradhan, B.; Chand, S.; Chand, S.; Rout, P.R.; Naik, S.K. Emerging groundwater contaminants: A comprehensive review on their health hazards and remediation technologies. Groundw. Sustain. Dev. 2023, 20, 100868. [Google Scholar] [CrossRef]
  7. Lee, H.; Kim, M.; Lee, J.E.; Lim, M.; Kim, M.; Kim, J.-M.; Jheong, W.-H.; Kim, J.; Ko, G. Investigation of norovirus occurrence in groundwater in metropolitan Seoul, Korea. Sci. Thetotal Environ. 2011, 409, 2078–2084. [Google Scholar] [CrossRef] [PubMed]
  8. Fout, G.S.; Martinson, B.C.; Moyer, M.W.N.; Dahling, D.R. A multiplex reverse transcription-PCR Method for detection of human enteric viruses in groundwater. Appl. Environ. Microbiol. 2003, 69, 3158–3164. [Google Scholar] [CrossRef]
  9. Opere, W.M.; John, M.; Ombori, O. Occurrence of enteric viruses in surface water and the relationship with changes in season and physical water quality dynamics. Adv. Virol. 2020, 2020, 9062041. [Google Scholar] [CrossRef]
  10. Lanrewaju, A.A.; Enitan-Folami, A.M.; Sabiu, S.; Edokpayi, J.N.; Swalaha, F.M. Global public health implications of human exposure to viral contaminated water. Front. Microbiol. 2022, 13, 981896. [Google Scholar] [CrossRef]
  11. Osvalda, D.G.; Caggiano, G.; Bagordo, F.; Barbuti, G.; Brigida, S.; Lugoli, F.; Grassi, T.; La Rosa, G.; Lucentini, L.; Uricchio, V.F.; et al. Enteric viruses and fecal bacteria indicators to assess groundwater quality and suitability for irrigation. Int. J. Environ. Res. Public Health 2017, 14, 558. [Google Scholar] [CrossRef]
  12. Upfold, N.S.; Luke, G.A.; Knox, C. Occurrence of human enteric viruses in water sources and shellfish: A focus on Africa. Food Environ. Virol. 2021, 13, 1–31. [Google Scholar] [CrossRef] [PubMed]
  13. Quanrud, D.M.; Carroll, S.M.; Gerba, C.P.; Arnold, R.G. Virus removal during simulated soil-aquifer treatment. Water Res. 2003, 37, 753–762. [Google Scholar] [CrossRef]
  14. Taylor, L.H.; Latham, S.M.; Woolhouse, M.E.J. Risk factors for human disease emergence. Philos. Trans. R. Soc. London. Ser. B Biol. Sci. 2001, 356, 983–989. [Google Scholar] [CrossRef] [PubMed]
  15. Rehmann, L.L.C.; Welty, C.; Harvey, R.W. Stochastic Analysis of Virus Transport in Aquifers. Water Resour. Res. 1999, 35, 1987–2006. [Google Scholar] [CrossRef]
  16. Bales, R.C.; Hinkle, S.R.; Kroeger, T.W.; Stocking, K.; Gerba, C.P. Bacteriophage adsorption during transport through porous media: Chemical perturbations and reversibility. Environ. Sci. Technol. 1991, 25, 2088–2095. [Google Scholar] [CrossRef]
  17. La Rosa, G.; Fratini, M.; Libera, S.d.; Iaconelli, M.; Muscillo, M. Emerging and potentially emerging viruses in water environments. Alcohol Alcohol. 2012, 48, 397–406. [Google Scholar] [CrossRef] [PubMed]
  18. Sen, T.K. Processes in pathogenic biocolloidal contaminants transport in saturated and unsaturated porous media: A Review. Water Air Soil Pollut. 2011, 216, 239–256. [Google Scholar] [CrossRef]
  19. Farkas, K.; Varsani, A.; Pang, L. Adsorption of rotavirus, MS2 bacteriophage and surface-modified silica nanoparticles to hydrophobic matter. Food Environ. Virol. 2015, 7, 261–268. [Google Scholar] [CrossRef]
  20. Diamond, M.S.; Kanneganti, T.-D. Innate immunity: The first line of defense against SARS-CoV-2. Nat. Immunol. 2022, 23, 165–176. [Google Scholar] [CrossRef]
  21. Gassilloud, B.; Gantzer, C. Adhesion-aggregation and inactivation of poliovirus 1 in groundwater stored in a hydrophobic container. Appl. Environ. Microbiol. 2005, 71, 912–920. [Google Scholar] [CrossRef] [PubMed]
  22. Schijven, J.F.; Hassanizadeh, S.M. Removal of viruses by soil passage: Overview of modeling, processes, and parameters. Crit. Rev. Environ. Sci. Technol. 2000, 30, 49–127. [Google Scholar] [CrossRef]
  23. Kohantorabi, M.; Wagstaffe, M.; Creutzburg, M.; Ugolotti, A.; Kulkarni, S.; Jeromin, A.; Krekeler, T.; Feuerherd, M.; Herrmann, A.; Ebert, G.; et al. Adsorption and Inactivation of SARS-CoV-2 on the surface of anatase TiO2(101). ACS Appl. Mater. Interfaces 2023, 15, 8770–8782. [Google Scholar] [CrossRef]
  24. Zhang, L.; Xi, T.; Zhu, D.; Shen, H.; Su, W.; Yu, P.; Lyu, C. Adsorption-enhanced photocatalytic waterborne virus inactivation by graphite carbon nitride conjugated with covalent organic frameworks. Chem. Eng. J. 2023, 472, 144893. [Google Scholar] [CrossRef]
  25. Merhi, T.; Atasi, O.; Coetsier, C.; Lalanne, B.; Roger, K. Assessing suspension and infectivity times of virus-loaded aerosols involved in airborne transmission. Proc. Natl. Acad. Sci. USA 2022, 119, e2204593119. [Google Scholar] [CrossRef] [PubMed]
  26. Syngouna, V.I.; Chrysikopoulos, C.V. Interaction between viruses and clays in static and dynamic batch systems. Environ. Sci. Technol. 2010, 44, 4539–4544. [Google Scholar] [CrossRef]
  27. Zhang, H.; Zhang, J.; Zhao, B.; Zhang, C. Removal of bacteriophages MS2 and phiX174 from aqueous solutions using a red soil. J. Hazard. Mater. 2010, 180, 640–647. [Google Scholar] [CrossRef]
  28. Chen, F.; Yuan, X.; Song, Z.; Xu, S.; Yang, Y.; Yang, X. Gram-negative Escherichia coli promotes deposition of polymer-capped silver nanoparticles in saturated porous media. Environ. Sci. Nano 2018, 5, 1495–1505. [Google Scholar] [CrossRef]
  29. Loveland, J.P.; Ryan, J.N.; Amy, G.L.; Harvey, R.W. The reversibility of virus attachment to mineral surfaces. Colloids Surfaces. A Physicochem. Eng. Asp. 1996, 107, 205–221. [Google Scholar] [CrossRef]
  30. Erkurt, H.A.; Özyurt, M.; Özer, A. Adsorption by active and inactive aspergillus oryzae: Batch studies. Adsorpt. Sci. Technol. 2012, 30, 317–330. [Google Scholar] [CrossRef]
  31. Das, S.; Behera, B.C.; Mohapatra, R.K.; Pradhan, B.; Sudarshan, M.; Chakraborty, A.; Thatoi, H. Kinetic modeling and isotherm approach for biosorptive removal of hexavalent chromium using heat inactivated fungal biomass. Int. J. Chem. Kinet. 2023, 55, 365–380. [Google Scholar] [CrossRef]
  32. Cao, H.; Tsai, F.T.C.; Rusch, K.A. Salinity and soluble organic matter on virus sorption in sand and soil columns. Ground Water 2010, 48, 42–52. [Google Scholar] [CrossRef]
  33. Hornstra, L.M.; Schijven, J.F.; Waade, A.; Prat, G.S.; Smits, F.J.C.; Cirkel, G.; Stuyfzand, P.J.; Medema, G.J. Transport of bacteriophage MS2 and PRD1 in saturated dune sand under suboxic conditions. Water Res. 2018, 139, 158–167. [Google Scholar] [CrossRef] [PubMed]
  34. Pang, L.; Farkas, K.; Lin, S.; Hewitt, J.; Premaratne, A.; Close, M. Attenuation and transport of human enteric viruses and bacteriophage MS2 in alluvial sand and gravel aquifer media—Laboratory studies. Water Res. 2021, 196, 117051. [Google Scholar] [CrossRef]
  35. Zhang, X.; Qi, L.; Li, W.; Hu, B.X.; Dai, Z. Bacterial community variations with salinity in the saltwater-intruded estuarine aquifer. Sci. Total Environ. 2021, 755 Pt 1, 142423. [Google Scholar] [CrossRef] [PubMed]
  36. Laine, R.F.; Goodfellow, G.; Young, L.J.; Travers, J.; Carroll, D.; Dibben, O.; Bright, H.; Kaminski, C.F. Structured illumination microscopy combined with machine learning enables the high throughput analysis and classification of virus structure. eLife 2018, 7, e40183. [Google Scholar] [CrossRef]
  37. Grabow, W.O.K. Bacteriophages: Update on application as models for viruses in water. Water SA 2001, 27, 251–268. [Google Scholar] [CrossRef]
  38. Leclerc, H.; Edberg, S.; Pierzo, V.; Delattre, J.M. Bacteriophages as indicators of enteric viruses and public health risk in groundwaters. J. Appl. Microbiol. 2000, 88, 5–21. [Google Scholar] [CrossRef]
  39. Fout, G.S.; Borchardt, M.A.; Kieke, B.A.; Karim, M.R. Human virus and microbial indicator occurrence in public-supply groundwater systems; meta-analysis of 12 international studies. Hydrogeol. J. 2017, 25, 903–919. [Google Scholar] [CrossRef]
  40. Petricevich, V.L.; Palomares, L.A.; González, M.; Ramírez, O.T. Parameters that determine virus adsorption kinetics: Toward the design of better infection strategies for the insect cell—Baculovirus expression system. Enzym. Microb. Technol. 2001, 29, 52–61. [Google Scholar] [CrossRef]
  41. Bruinsma, R.F.; Wuite, G.J.L.; Roos, W.H. Physics of viral dynamics. Nat. Rev. Phys. 2021, 3, 76–91. [Google Scholar] [CrossRef]
  42. Bartels, J.; Batista, A.G.; Kroll, S.; Maas, M.; Rezwan, K. Hydrophobic ceramic capillary membranes for versatile virus filtration. J. Membr. Sci. 2019, 570–571, 85–92. [Google Scholar] [CrossRef]
  43. Li, Z.; Yu, J.; Liu, L.; Wei, Z.; Ehrlich, E.S.; Liu, G.; Li, J.; Liu, X.; Wang, H.; Yu, X.-f. Coxsackievirus A16 infection induces neural cell and non-neural cell apoptosis in vitro. PLoS ONE 2014, 9, e111174. [Google Scholar] [CrossRef]
  44. Omo-Okoro, P.N.; Curtis, C.J.; Karásková, P.; Melymuk, L.; Oyewo, O.A.; Okonkwo, J.O. Kinetics, isotherm, and thermodynamic studies of the adsorption mechanism of PFOS and PFOA using inactivated and chemically activated maize tassel. Water Air Soil Pollut. 2020, 231, 485. [Google Scholar] [CrossRef]
  45. Mouri, M. Comparison between particle-size analyses of fine-grained soils by sieve-hydrometer and laser diffraction methods. J. Jpn. Soc. Civ. Eng. Ser. C Geosph. Eng. 2021, 77, 59–69. [Google Scholar] [CrossRef] [PubMed]
  46. Crini, G.; Badot, P.-M. Application of chitosan, a natural aminopolysaccharide, for dye removal from aqueous solutions by adsorption processes using batch studies: A review of recent literature. Prog. Polym. Sci. 2008, 33, 399–447. [Google Scholar] [CrossRef]
  47. Venkata, M.S.; Ramanaiah, S.V.; Rajkumar, B.; Sarma, P.N. Removal of fluoride from aqueous phase by biosorption onto algal biosorbent Spirogyra sp.-IO2: Sorption mechanism elucidation. J. Hazard. Mater. 2007, 141, 465–474. [Google Scholar] [CrossRef]
  48. Xue, X.T.; Zhong, L.; Zhang, G.X.; Zhang, F.X. Adsorption kinetic study of reactive dyes on silk with octyl trimethyl ammonium bromide as accelerant. Adv. Text. Eng. 2011, 331, 291–297. [Google Scholar] [CrossRef]
  49. Revellame, E.D.; Fortela, D.L.; Sharp, W.; Hernandez, R.; Zappi, M.E. Adsorption kinetic modeling using pseudo-first order and pseudo-second order rate laws: A review. Clean. Eng. Technol. 2020, 1, 100032. [Google Scholar] [CrossRef]
  50. Feng, Y.; Zhang, Z.; Gao, P.; Su, H.; Yu, Y.; Ren, N. Adsorption behavior of EE2 (17α-ethinylestradiol) onto the inactivated sewage sludge: Kinetics, thermodynamics and influence factors. J. Hazard. Mater. 2010, 175, 970–976. [Google Scholar] [CrossRef]
  51. Zhang, X.; Ma, F.; Yin, S.; Wallace, C.D.; Soltanian, M.R.; Dai, Z.; Ritzi, R.W.; Ma, Z.; Zhan, C.; Lü, X. Application of upscaling methods for fluid flow and mass transport in multi-scale heterogeneous media: A critical review. Appl. Energy 2021, 303, 117603. [Google Scholar] [CrossRef]
  52. Kleber, M.; Bourg, I.C.; Coward, E.K.; Hansel, C.M.; Myneni, S.C.B.; Nunan, N. Dynamic interactions at the mineral–organic matter interface. Nat. Rev. Earth Environ. 2021, 2, 402–421. [Google Scholar] [CrossRef]
  53. Bellou, M.I.; Syngouna, V.I.; Tselepi, M.A.; Kokkinos, P.A.; Paparrodopoulos, S.C.; Vantarakis, A.; Chrysikopoulos, C.V. Interaction of human adenoviruses and coliphages with kaolinite and bentonite. Sci. Total Environ. 2015, 517, 86–95. [Google Scholar] [CrossRef]
  54. Chrysikopoulos, C.V.; Aravantinou, A.F. Virus attachment onto quartz sand: Role of grain size and temperature. J. Environ. Chem. Eng. 2014, 2, 796–801. [Google Scholar] [CrossRef]
  55. Ternes, T.A.; Andersen, H.; Gilberg, D.; Bonerz, M. Determination of estrogens in sludge and sediments by liquid extraction and GC/MS/MS. Anal. Chem. 2002, 74, 3498–3504. [Google Scholar] [CrossRef]
  56. Thommes, M.; Kaneko, K.; Neimark, A.V.; Olivier, J.P.; Rodriguez-Reinoso, F.; Rouquerol, J.; Sing, K.S.W. Physisorption of gases, with special reference to the evaluation of surface area and pore size distribution (IUPAC Technical Report). Pure Appl. Chem. 2015, 87, 1051–1069. [Google Scholar] [CrossRef]
  57. Rashid, A.; Bhatti, H.N.; Iqbal, M.; Noreen, S. Fungal biomass composite with bentonite efficiency for nickel and zinc adsorption: A mechanistic study. Ecol. Eng. 2016, 91, 459–471. [Google Scholar] [CrossRef]
  58. Kumar, K.V.; Porkodi, K. Comments on “Removal of Congo red from aqueous solution by anilinepropylsilica xerogel” by Pavan FA, Dias SLP, Lima EC, Benvenutti EV. Dyes and Pigments 2008;76:64–9. Dye. Pigm. 2008, 77, 481–482. [Google Scholar] [CrossRef]
  59. Bewick, V.; Cheek, L.; Ball, J. Statistics review 9: One-way analysis of variance. Crit Care 2004, 8, 130–136. [Google Scholar] [CrossRef]
Figure 1. CA16 preparation diagram. (a) Cell culture passage; (b) Virus amplification.
Applsci 14 01480 g001
Figure 2. Virus titer determination experimental procedure. (a) TCID50 assay experimental process; (b) TCID50 assay results.
Applsci 14 01480 g002
Figure 3. Adsorption of CA16 with different varied factors. (a) sediment particle sizes; (b) temperatures; (c) pH values; (d) humic acid concentrations; (e) initial concentrations; (f) error bar plot of experiments under the same condition.
Applsci 14 01480 g003
Figure 4. Kinetic models’ fitting of CA16 adsorption on different sediment particles. (a) first-order; (b) second-order; (c) pseudo-first-order; and (d) pseudo-second-order.
Applsci 14 01480 g004
Figure 5. Kinetic models fitting of CA16 adsorption on clay at different temperatures. (a) first-order; (b) second-order; (c) pseudo-first-order; (d) pseudo-second-order.
Applsci 14 01480 g005
Figure 6. Kinetic models’ fitting of CA16 adsorption on clay at different pH values. (a) first-order; (b) second-order; (c) pseudo-first-order; (d) pseudo-second-order.
Applsci 14 01480 g006
Figure 7. Kinetic models’ fitting of CA16 adsorption on clay at different humic acid concentrations. (a) first-order; (b) second-order; (c) pseudo-first-order; (d) pseudo-second-order.
Applsci 14 01480 g007
Figure 8. Model fittings of CA16 adsorption data for the group with different initial concentrations (experiment 15–19); (a) Freundlich isotherm model; (b) Langmuir isotherm model.
Applsci 14 01480 g008
Table 1. The adsorption experiments under different conditions.
NumberFactorsSediment ParticleTemperature
(°C)
pHHumic Acid
(mg/L)
Virus Concentration
(TCID50/mL)
1Sediment particleClay106.501 × 108
2Silt106.50
3Fine sand106.50
4Medium sand106.50
5Coarse sand106.50
6TemperatureClay106.502.15 × 108
7Clay256.50
8pHClay105.501.7 × 108
9Clay106.50
10Clay108.50
11Clay109.50
12Humic acidClay106.506.4 × 107
13Clay106.55
14Clay106.510
15Virus concentrationClay106.501 × 108
16Clay106.501 × 107
17Clay106.504.6 × 106
18Clay106.502.1 × 105
19 Clay106.504.6 × 104
Table 2. Fitting of the kinetic equation parameters for CA16 adsorption under different factors.
Kinetic ModelAdjusted R2p Value
FactorFirst-OrderSecondary-OrderPseudo-First-OrderPseudo-Second-Order
Sediment particleClay0.96020.85970.97070.9985<0.05 *
Silt0.96370.85800.96440.9974
Fine sand0.93450.97340.97490.9977
Medium sand0.89750.98570.94710.9985
Coarse sand0.85090.97900.90690.9987
Temperature
(°C)
100.93830.94050.97280.9985<0.05 *
250.93200.92750.96480.9982
pH5.50.72470.96470.87350.9983<0.05 *
6.50.88640.96780.93620.9964
8.50.84970.97760.89600.9999
9.50.84670.98540.90300.9977
Humic acid
(mg/L)
00.97030.74380.96620.9908<0.05 *
50.96430.87030.96970.9870
100.90180.96640.95270.9994
* Calculating using Analysis of Variance (ANOVA) method [59].
Table 3. Fitting parameters of Freundlich and Langmuir isotherm equations.
Adsorption IsothermsModel EquationAdjusted R2p Value
Freundlich Q e = K F C e 1 n 0.8748<0.05 *
Langmuir Q e = Q e K L C e 1 + K L C e 0.9826<0.05 *
* Calculating using Analysis of Variance (ANOVA) method.
Disclaimer/Publisher’s Note: The statements, opinions and data contained in all publications are solely those of the individual author(s) and contributor(s) and not of MDPI and/or the editor(s). MDPI and/or the editor(s) disclaim responsibility for any injury to people or property resulting from any ideas, methods, instructions or products referred to in the content.