1. Introduction
Bridges are a key link in the road network, serving as a critical component to ensure road safety and control traffic. According to the 2022 Statistical Bulletin on the Development of the Transport Industry in China [
1], there were 1,033,200 highway bridges across the country at the end of 2022, representing an increase of 72,000 bridges from the previous year. Consequently, China has been transitioning from a major country in bridge construction to a major country in bridge maintenance. During the operation and maintenance phase, the bridge condition rating serves as the basis for bridge rehabilitation and maintenance planning. At present, bridge condition levels are evaluated through existing inspection data from regular inspections conducted every two years. However, current inspection data only provide the current condition of the bridge; they do not enable predictions of the performance deterioration trend during the bridge maintenance stage. Since the degradation trend of bridge performance is crucial for decision-making in bridge maintenance and repair, predicting the future condition rating of bridges is necessary to allocate resources reasonably during the maintenance stage.
Existing methods for bridge condition deterioration prediction are categorized into deterministic models, stochastic models, and artificial intelligence models. Deterministic models describe the deterioration of bridge components as a fixed relationship with selected independent variables. While linear regression models and nonlinear regression models are commonly employed as deterministic models, they lack the accuracy needed for the long-term prediction of bridge condition performance and do not effectively represent the deterioration of bridge conditions over time. Consequently, nonlinear regression models are generally preferred.
Deterministic modeling is a common approach in the prediction of bridge conditions. Bolukbasi et al. [
2] developed a cubic polynomial regression model for fitting and prediction based on the inspection data of 2601 bridges, and this model was found to predict bridge conditions better. Tolliver et al. [
3] used regression modeling to construct a model for predicting bridge conditions based on different bridge characteristics. However, deterministic models lead to different results for different models due to varying assumptions, even when the same data are used. Lu et al. [
4] compared the predictive abilities of different regression models for highway bridge condition deterioration. Although this method is the simplest for predicting the future condition of a bridge, obtaining the best-fit functional form is time-consuming and labor-intensive.
A stochastic model assumes that the bridge condition rating is a stochastic process, taking into account inherent uncertainty and variability due to unobserved explanatory variables, measurement errors, and the randomness of the deterioration process. The Markov method, which assumes that bridge deterioration is a stochastic process based on a Markov chain, is the most common probabilistic model and is widely used in the simulation of bridge performance deterioration. The Markov method describes state deterioration in terms of probabilities—that is, the transition probabilities from one condition state to another during an inspection interval.
Markov models are capable of predicting the condition of bridges in different situations. Soetjipto et al. [
5] proposed a dynamic Markov bridge failure prediction model, through which they constructed the relationship between bridge components and were able to identify the components that significantly affect the condition of the bridge. Li et al. [
6] constructed a Markov model considering the maintenance situation and predicted the condition of the entire bridge and each part of it.
Markov chain theory relies on two assumptions: memorylessness (i.e., the future state of the process depends only on the current state) and homogeneity (i.e., the transition probability from one state to another remains constant throughout the entire life cycle). Ilbeigi et al. [
7] adopted Markov chains to predict the bridge deterioration process and statistically determined the optimal inspection interval for bridges. Ranjith et al. [
8] proposed a stochastic Markov chain model to predict the stress condition of timber bridge members. Three methods of Markov modeling using state data—including the percentage prediction method, a regression method based on optimization, and a nonlinear optimization technique to predict the transition probability matrix—were compared in order to select the optimal Markov method for predicting the deterioration of timber bridges. Collins et al. [
9] analyzed a variety of Markov models for predicting bridge deterioration and found variability among different models, then proposed a combined deterioration model to improve prediction accuracy.
Moreover, with the advancement of computer science, artificial intelligence techniques have been widely applied to the field of bridge engineering, and bridge deterioration prediction is no exception. Liu et al. [
10] proposed a condition prediction model for bridge components using a convolutional neural network (CNN), which achieved a prediction accuracy of more than 85%. Dinh et al. [
11] applied artificial neural networks (ANN) for predicting the condition rating of bridge decks. The ANN model was trained using eight parameters, namely bridge age, average daily traffic, design load, main structure design, approach span design, number of main spans, percentage of daily truck traffic, and the average daily growth rate of traffic, alongside the output values of the bridge deck condition. Then, the ANN model was used to predict future bridge conditions; the results indicate that the established neural network’s prediction accuracy has reached 73.6%, and the accuracy of the model can reach 98.5% if the allowable error in the bridge condition rating is ±1. Artificial intelligence models aim to explain bridge deterioration by capturing the connections between bridge features from inspection reports. Artificial neural networks are the most commonly used approach in artificial intelligence. Ariza et al. [
12] proposed an artificial neural network model to predict bridge deterioration performance and, when comparing it with the Markov model and the semi-Markov model, found that the artificial neural network prediction accuracy was higher. Srikanth et al. [
13] summarized the features of ANNs in bridge deterioration prediction, highlighting that they can generate missing inspection data to fill data gaps resulting from unscheduled inspections. Because of the neural networks’ generalization ability, they can handle large amounts of data.
In summary, bridge deterioration models based on the Markov chain or ANN have been widely used in bridge condition prediction, with significant results achieved. However, the process of selecting bridge features for training neural networks in previous methods was based on the experience of bridge engineers and literature. In this study, a sensitivity analysis of bridge feature parameters is firstly carried out using the ReliefF algorithm to effectively select bridge features. Then, based on the importance and influence of the feature parameters on the bridge condition, a combination of feature parameters is selected for neural network training, reducing the data dimensionality of training. Finally, a novel prediction model is proposed that combines the Elman neural network (ENN) with the state-based Markov chain method to predict the long-term performance of bridges. To verify the accuracy of the model, the prediction results from the proposed model are compared with actual bridge condition levels. The bridge condition prediction process based on the ENN and Markov chain is illustrated in
Figure 1.
3. Case Study
In the ENN prediction model for bridge deterioration, it is first necessary to classify the bridge data to predict the deterioration of a specific bridge type. However, the feature selection for evaluating bridge conditions relies on the engineering judgment, which lacks rigor, and no scientific method has been established. In this study, the model is based on bridge inspection data from the NBI Texas Bridge Inventory from 1992 to 2022. The features influencing bridge deterioration are identified using the ReliefF algorithm, followed by the classification of data according to the extracted feature values. These data are then used to train the ENN prediction model. The transition probability matrix is calculated by the trained ENN model, and the bridge deterioration curve is fitted using a Markov chain to predict the condition rating of an actual bridge. This predicted rating is then compared with the actual detected value to verify the model’s effectiveness.
3.1. Data Pre-Processing
The Texas NBI data, published by the Federal Highway Administration, is utilized in this study. The NBI database encompasses over 130 types of bridge characterization information, coded and stored according to the uniform American bridge inspection standards. Each bridge component is rated on a scale from 0 to 9, and the final rating of the entire bridge is derived from the lowest condition rating among its components. Studies have indicated that predicting the condition of individual bridge components has a minimal impact on the overall bridge condition. Consequently, the Elman neural network will be employed to directly predict the bridge’s overall condition.
Before predicting future bridge deterioration, it is necessary to process the bridge features. Initially, records with missing indicators are excluded from the NBI data, as well as data coded with ‘N’, which applies to culverts and other structures without deck slabs, and bridges with a rating of less than 3. The latter are considered failed in the bridge inventory description. Subsequently, the characteristics of each bridge are extracted and organized into a time series format that correlates bridge age with its condition.
To accommodate computer performance and ensure the completeness of the time series for each bridge, this study focuses on data for Texas bridges from 1992 to 2022.
3.2. Feature Selection
In the NBI data, numerous features correlate with bridge conditions, but not all data are necessary for the feature selection database. In this study, bridge feature data are selected based on prior research, which includes the basic structural information of the bridge, traffic volume, and bridge age, as shown in
Table 1. The detailed descriptions of these features can be found in Ref. [
19]. Since the study addresses bridge deterioration over time and does not account for maintenance and reconstruction measures during the operational phase, the features for bridge reconstruction and structural rehabilitation lengths are set to 0, indicating that no maintenance or reconstruction measures have been taken for these bridges. Existing studies have concluded that these feature sets are closely related to the future condition rating of the bridge, and a modified ReliefF algorithm was used to determine the appropriate feature sets.
A Pareto chart illustrating feature importance is shown in
Figure 4, which indicates the degree of influence of features on bridge condition. It can be seen that bridge age, average daily truck traffic, material type, and skew have a significant effect on bridge condition. In contrast, the number of approach spans does not have a significant effect.
When training an Elman neural network, it is first necessary to classify the bridge features. Thus, it is essential to select bridge features that have a significant impact on bridge condition. If too few features are selected, they cannot represent the entire dataset; however, if too many features are chosen, the amount of neural network training data cannot be guaranteed. Therefore, this study will apply the following four different types of feature parameter combinations for Elman neural network training and prediction. The accuracy of the prediction results is shown in
Table 2. It can be seen that classifying the data through six features yields the highest prediction accuracy. Consequently, this study will select six features for data classification, as shown in
Table 2, including bridge age, average daily truck traffic, type of material, skew, deck structure type, and type of bridge.
3.3. Elman Neural Network for Bridge Condition Prediction
The data are classified based on the features mentioned above. Out of the datasets from Texas, 5600 are eligible; 70% of the data are used for training, 20% for validation, and 10% for testing. The data with selected features and completed classification are used as ENN inputs to predict the long-term performance of a given bridge. Assuming the prediction for Year 60 results, the Elman neural network predicts these results by adding the predicted values of
t59 to the original ENN inputs from
t1–
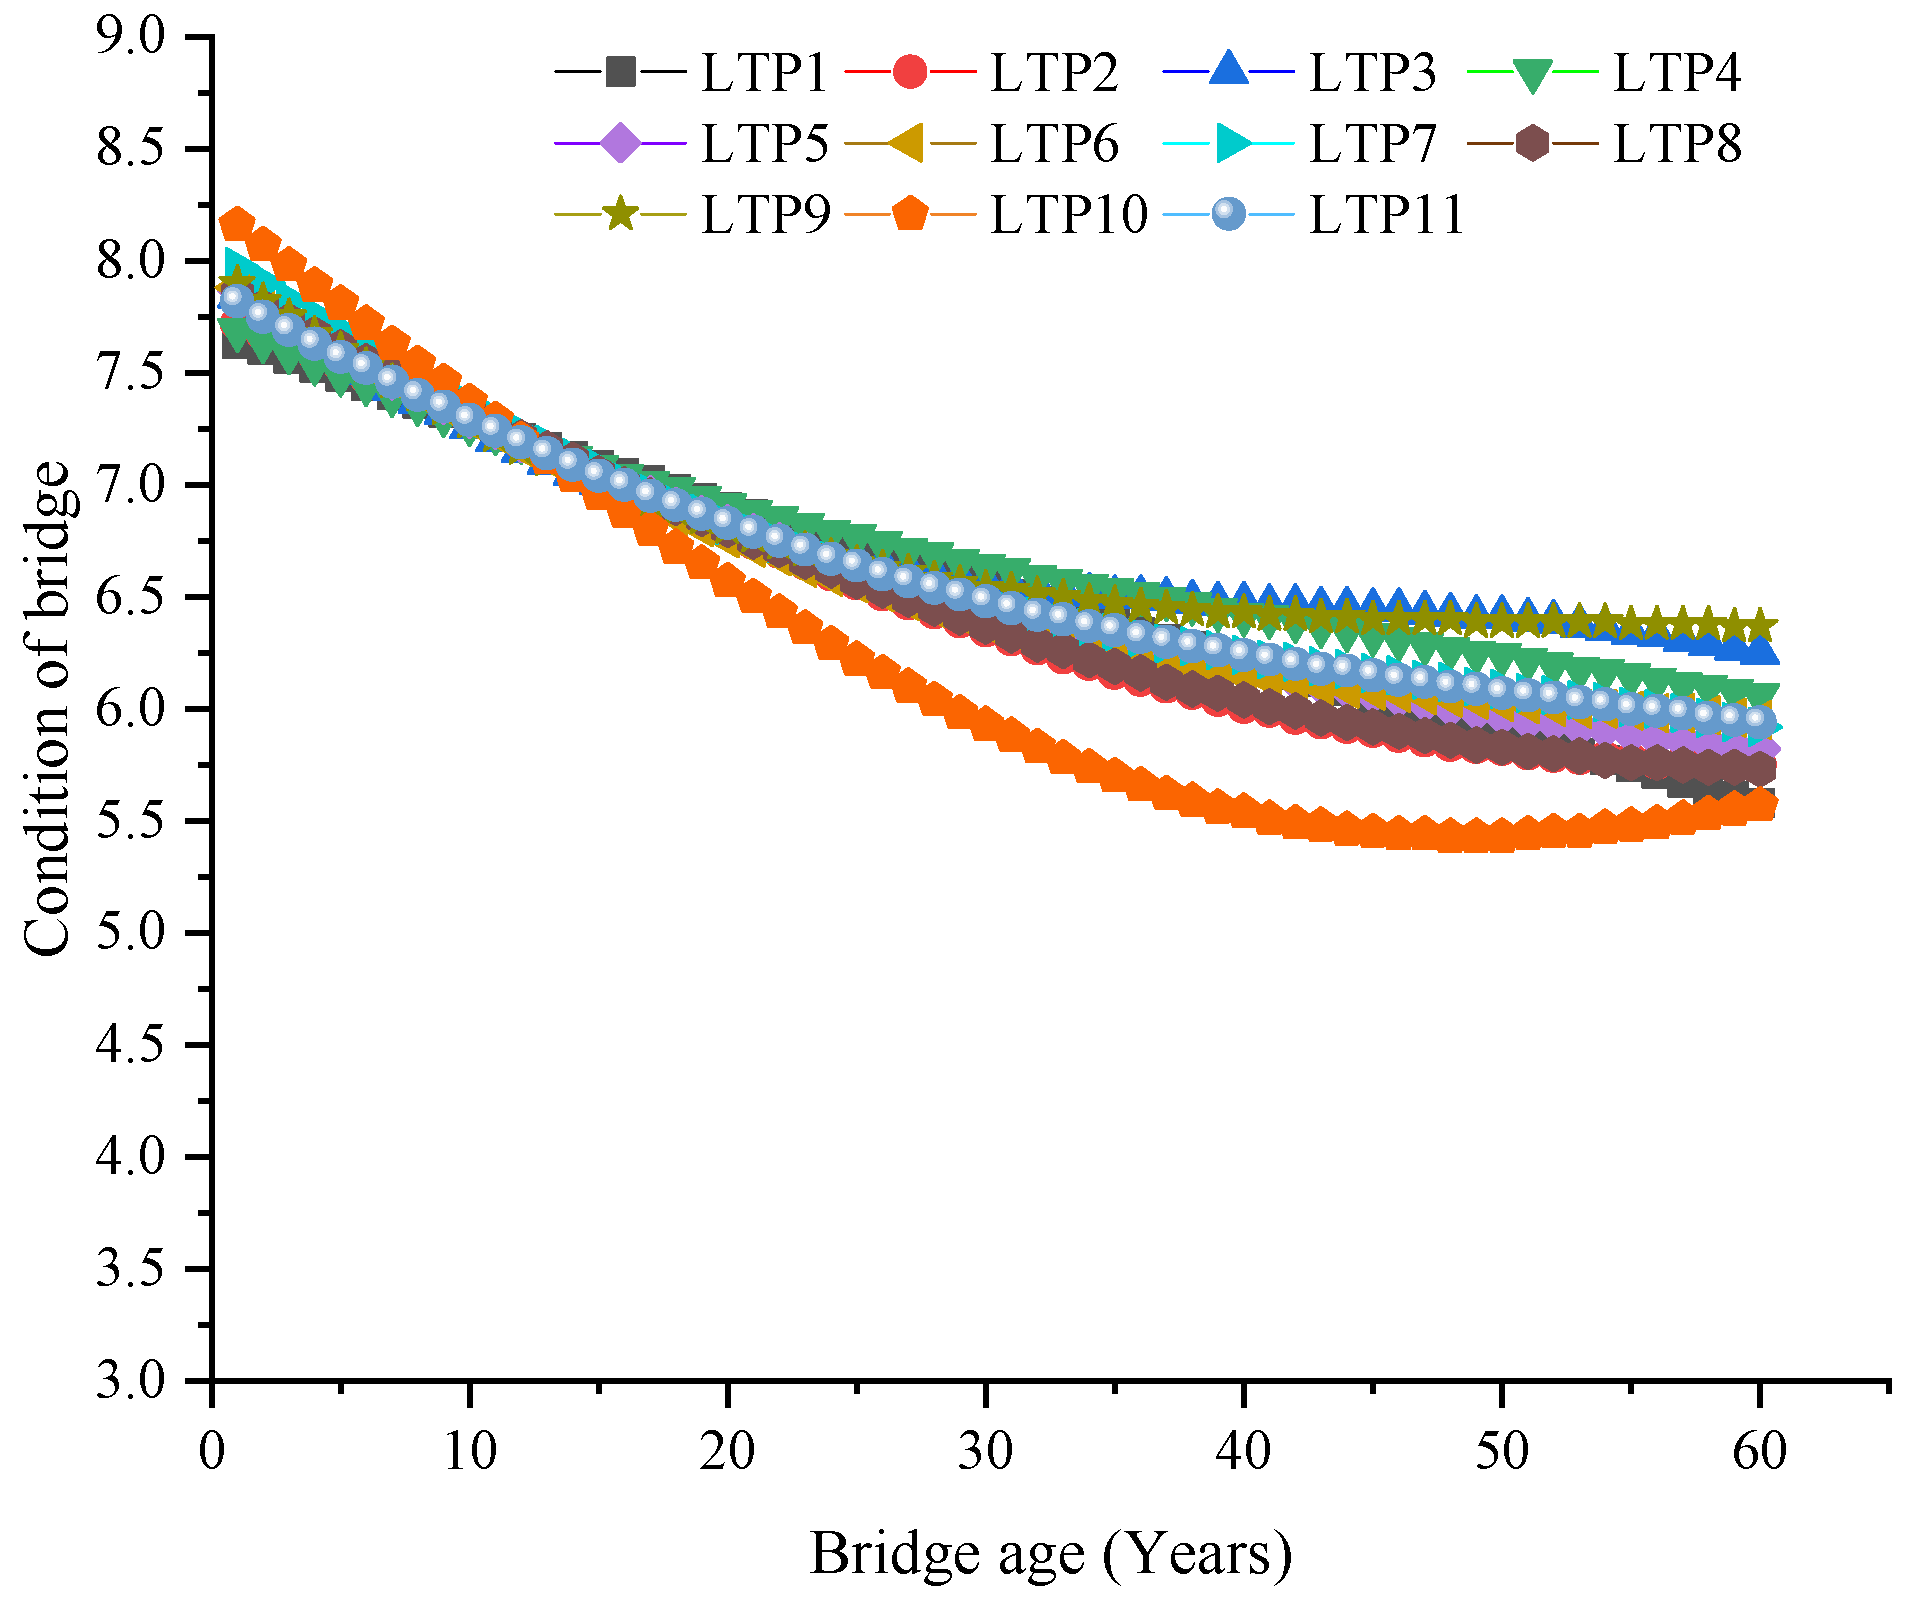
t58. In this study, this iteration of the one-step prediction process lasts for 60 cycles, as shown in the figure, and the total number of long-term predictions (LTP) for the ENN of the bridge is 10, as shown in
Figure 5.
Before analyzing these prediction results, a filtering process of the predicted condition is required to further improve the quality of the long-term predictions. The filtering process adheres to the guideline that the condition of the previous year should be greater than or equal to the condition of the following year. That is, if the bridge does not undergo maintenance, the condition rating should not improve, as bridge degradation is a continuous, gradual, and slow progression. Therefore, if the predicted bridge condition rating is 5.45 in Year 53 and 5.47 in Year 54 for LTP10 in
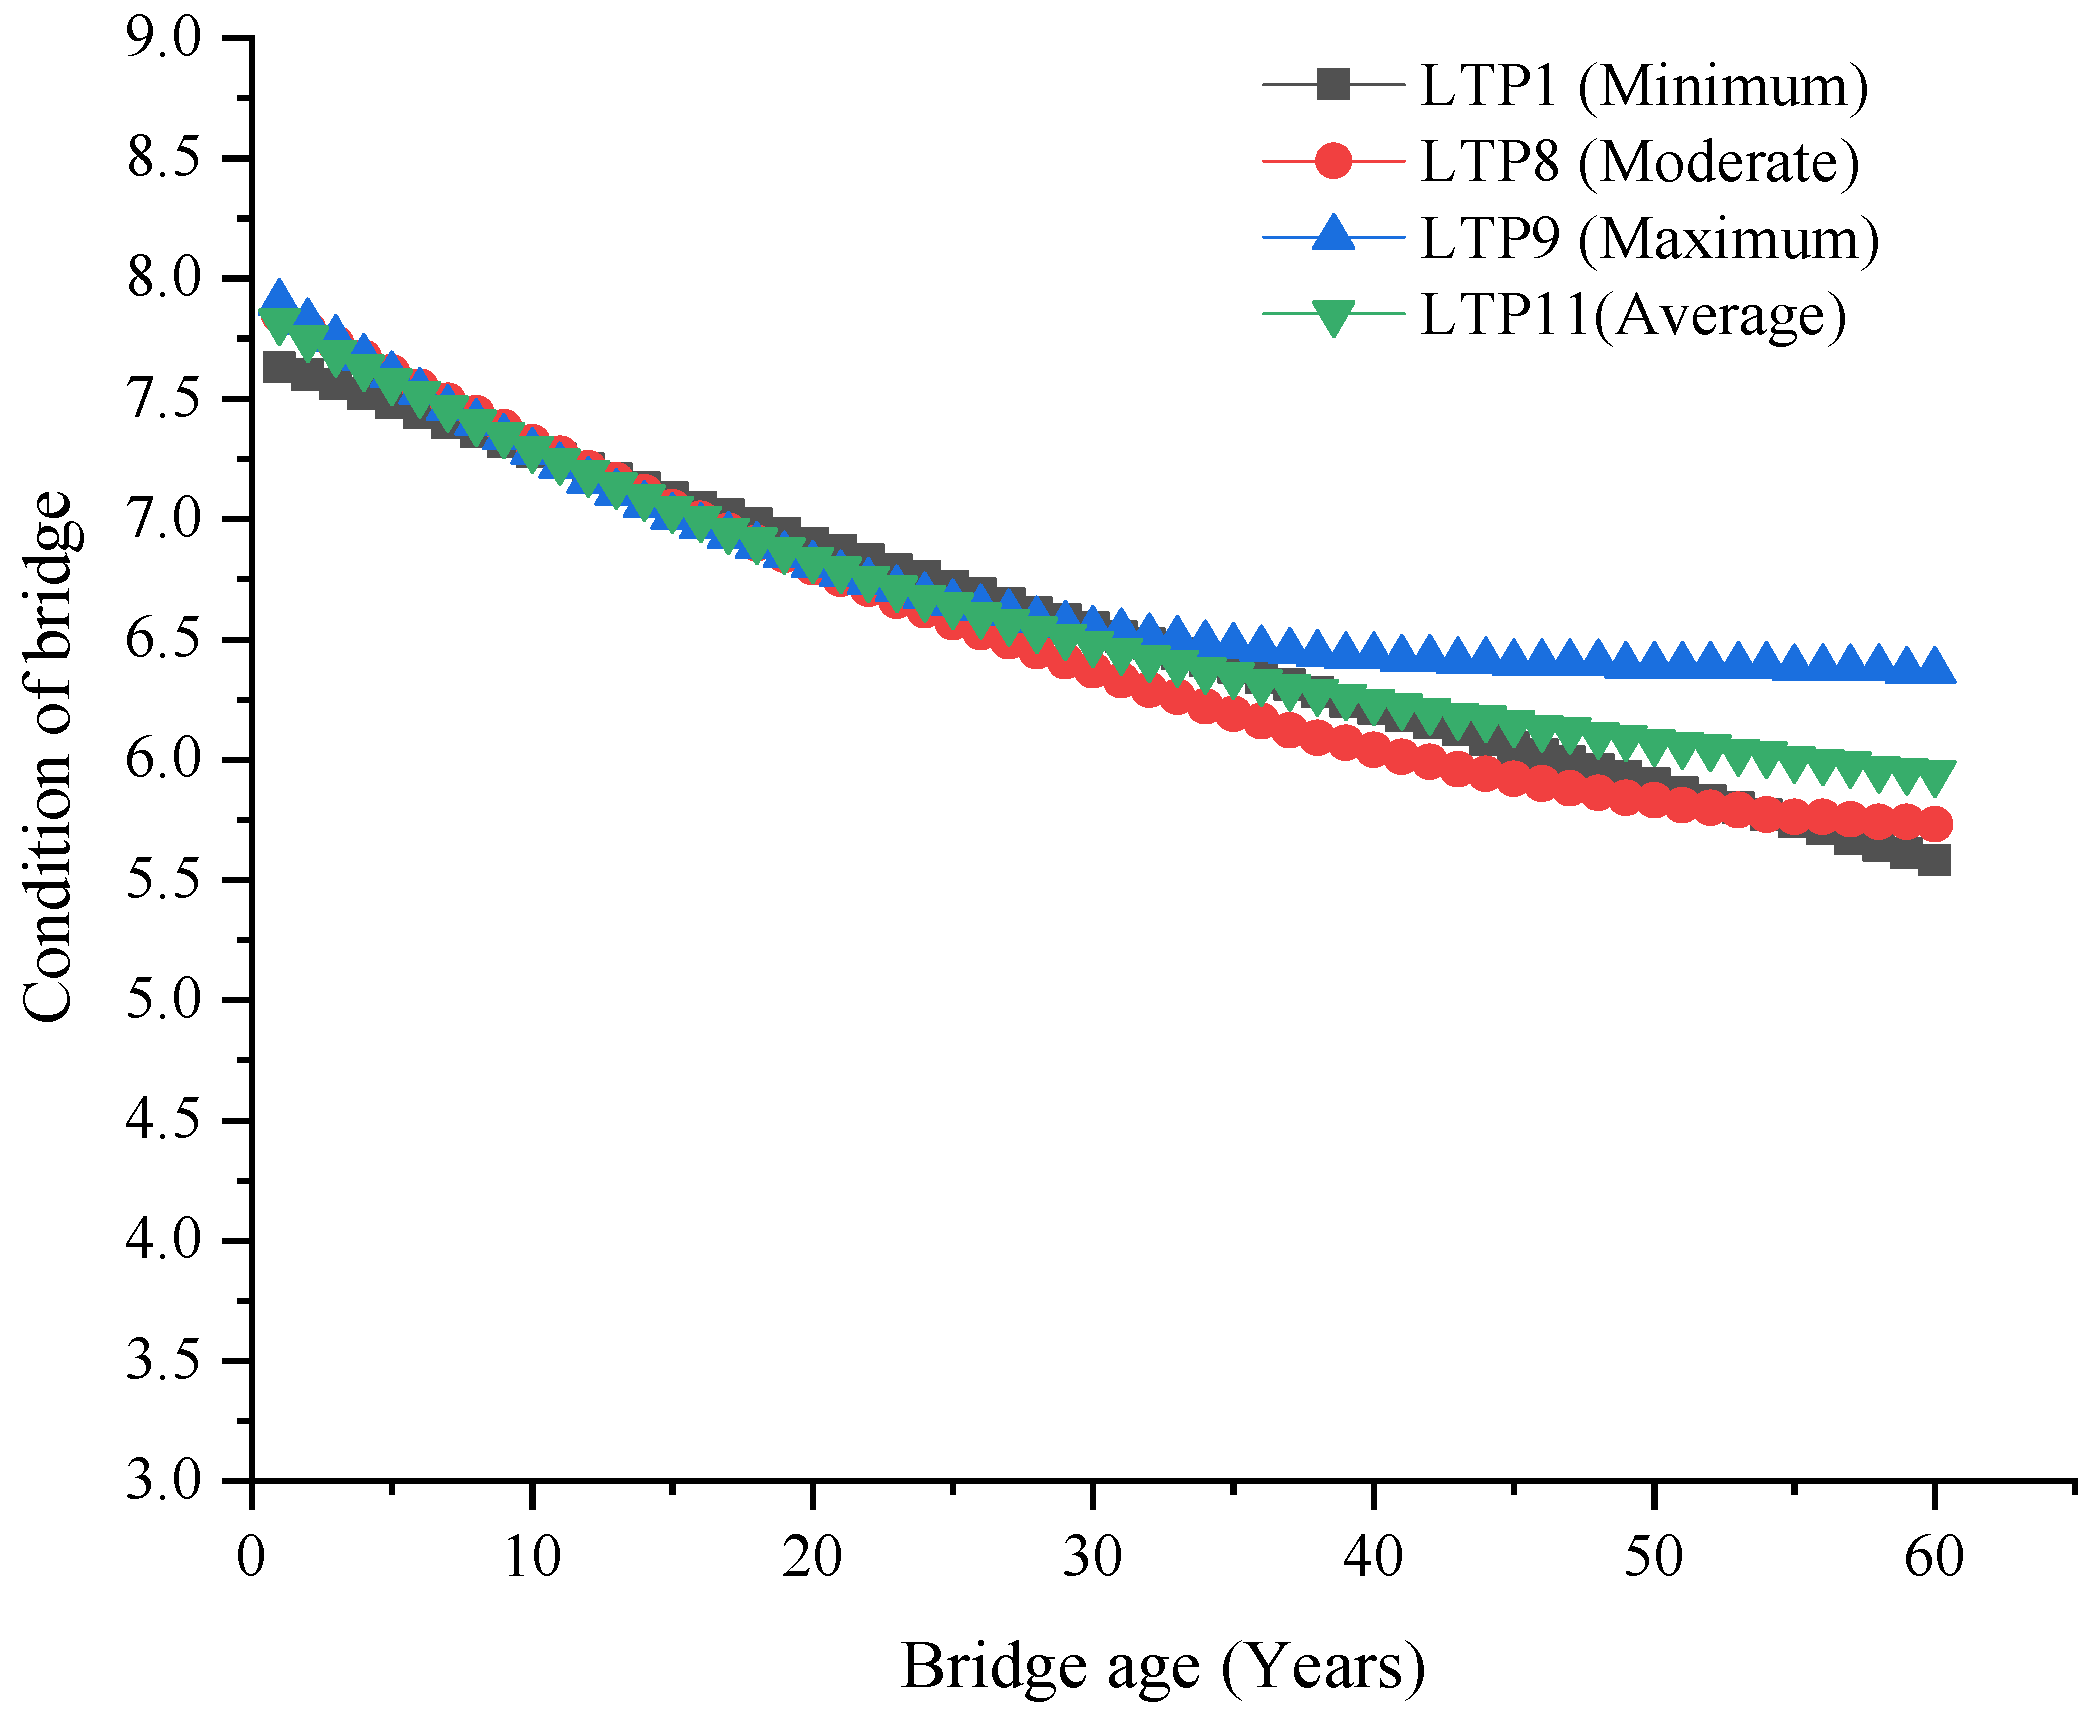
Figure 5, this does not correspond to the actual rule of bridge deterioration, so this prediction dataset for LTP10 should be discarded. The results of the bridge condition prediction are removed from the deterioration curves with the highest and lowest predicted conditions, because these two curves deviate significantly, as shown in
Figure 6.
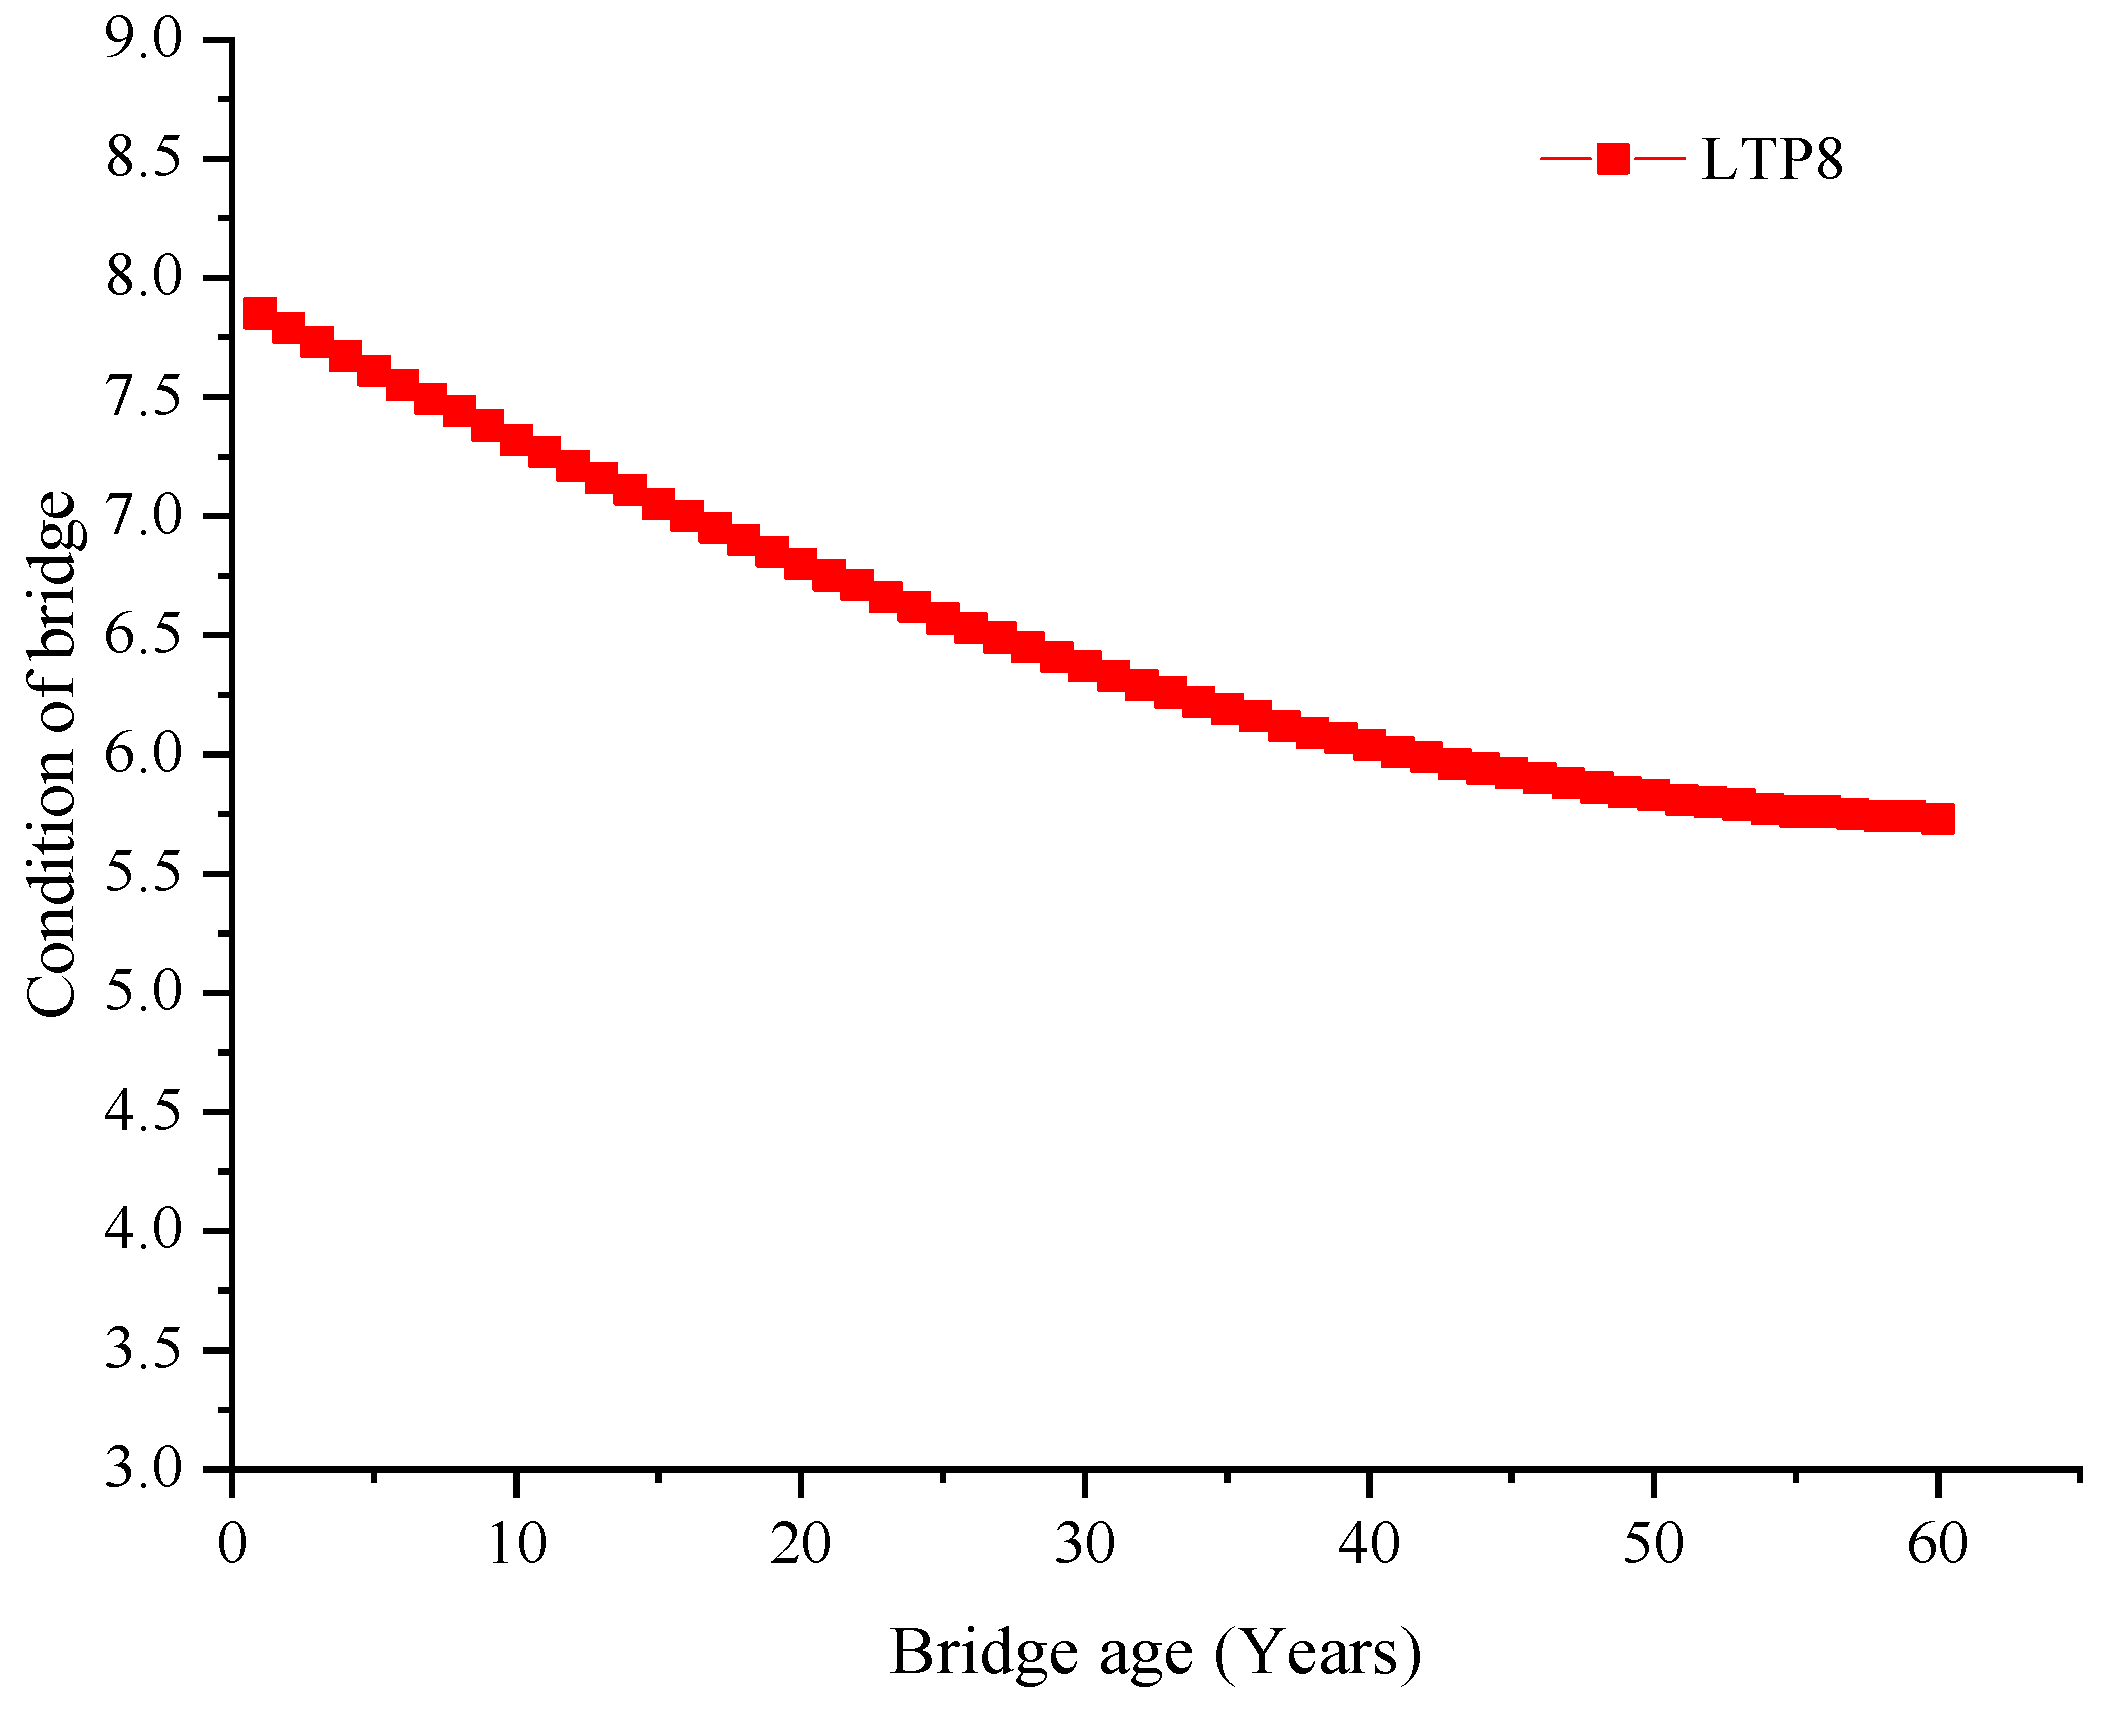
After completing network training and optimization analysis, the selected prediction curve for the condition rating of the bridge is shown in
Figure 7. The transition probability matrix of the Markov chain is calculated using the selected bridge deterioration curve. Owing to the straightforward process of the genetic algorithm, the optimal solution of the objective function can be found through the continuous iteration of the function. Therefore, a genetic algorithm will be used.
The genetic algorithm is an optimization search algorithm inspired by the principles of natural selection and genetics. It is a stochastic search technique commonly used to solve various optimization problems. Specifically, the process of the genetic algorithm involves initializing the population, evaluating fitness, selecting, crossing over, mutating, and repeating the process. The advantage of the genetic algorithm is that it can conduct a global search in the solution space and is well-suited for optimization problems with high complexity and a large search space.
To calculate the transition probability matrix of the bridge condition over a span of 60 years, the following steps are taken: first, the 60-year range is divided into 10 intervals of 6 years each, and the transition probability matrix for each interval is calculated. Then, the genetic algorithm code is written in MATLAB software 2022, and Equations (2) and (3) is expressed as Equations (2)–(6) with the function
fun1, which is then inserted into the genetic algorithm to perform the iterative operation. Since each unknown quantity in the function represents a transition probability matrix—for example,
P(1) denotes the transition probability matrix from Condition 9 to Condition 8—the range of each unknown is between 0 and 1.
The genetic algorithm determines that the results of the transition probability matrix for the first 6 years are:
P(1) = 0.844,
P(2) = 0.905,
P(3) = 1,
P(4) = 1,
P(5) = 1, and
P(6) = 0.998. Following the same methodology, the transition probability matrix is solved for the period of 1–60 years, and the transition probability matrix for the 60-year period is shown in
Table 3.
The accuracy of the transition probability depends on the closeness of A(t) to E(t). The chi-square fit test can be used to verify the accuracy of the transition probability matrix. The chi-square test is conducted as follows:
where
χ2 denotes the chi-square distribution with
k − 1 degrees of freedom;
Ei represents the condition rating value in year
i predicted by the state-based stochastic model;
Ai is the condition rating value in year
i predicted by the ENN bridge deterioration curves; and
k is the number of years predicted. The calculated
χ2 for the Markov chain and Elman neural network is 0.0006, which is significantly smaller than the chi-square value corresponding to the significance level
α = 0.05. This indicates that the generated transition probability matrices are acceptable for predicting the long-term performance of bridges. The fitted values from the Elman neural network and Markov chain are shown in
Figure 8.
After obtaining the transition probability matrix, the condition rating of the bridge can be predicted using Equations (2)–(4). Taking an actual bridge as an example, it is selected for the long-term deterioration performance prediction of the bridge. The long-term performance prediction is based on the latest inspection records as the initial state vector, which is used to predict the bridge state level over the next 20 years. The bridge deterioration prediction model is validated by comparing the predicted values with the actual values, as shown in
Table 4.
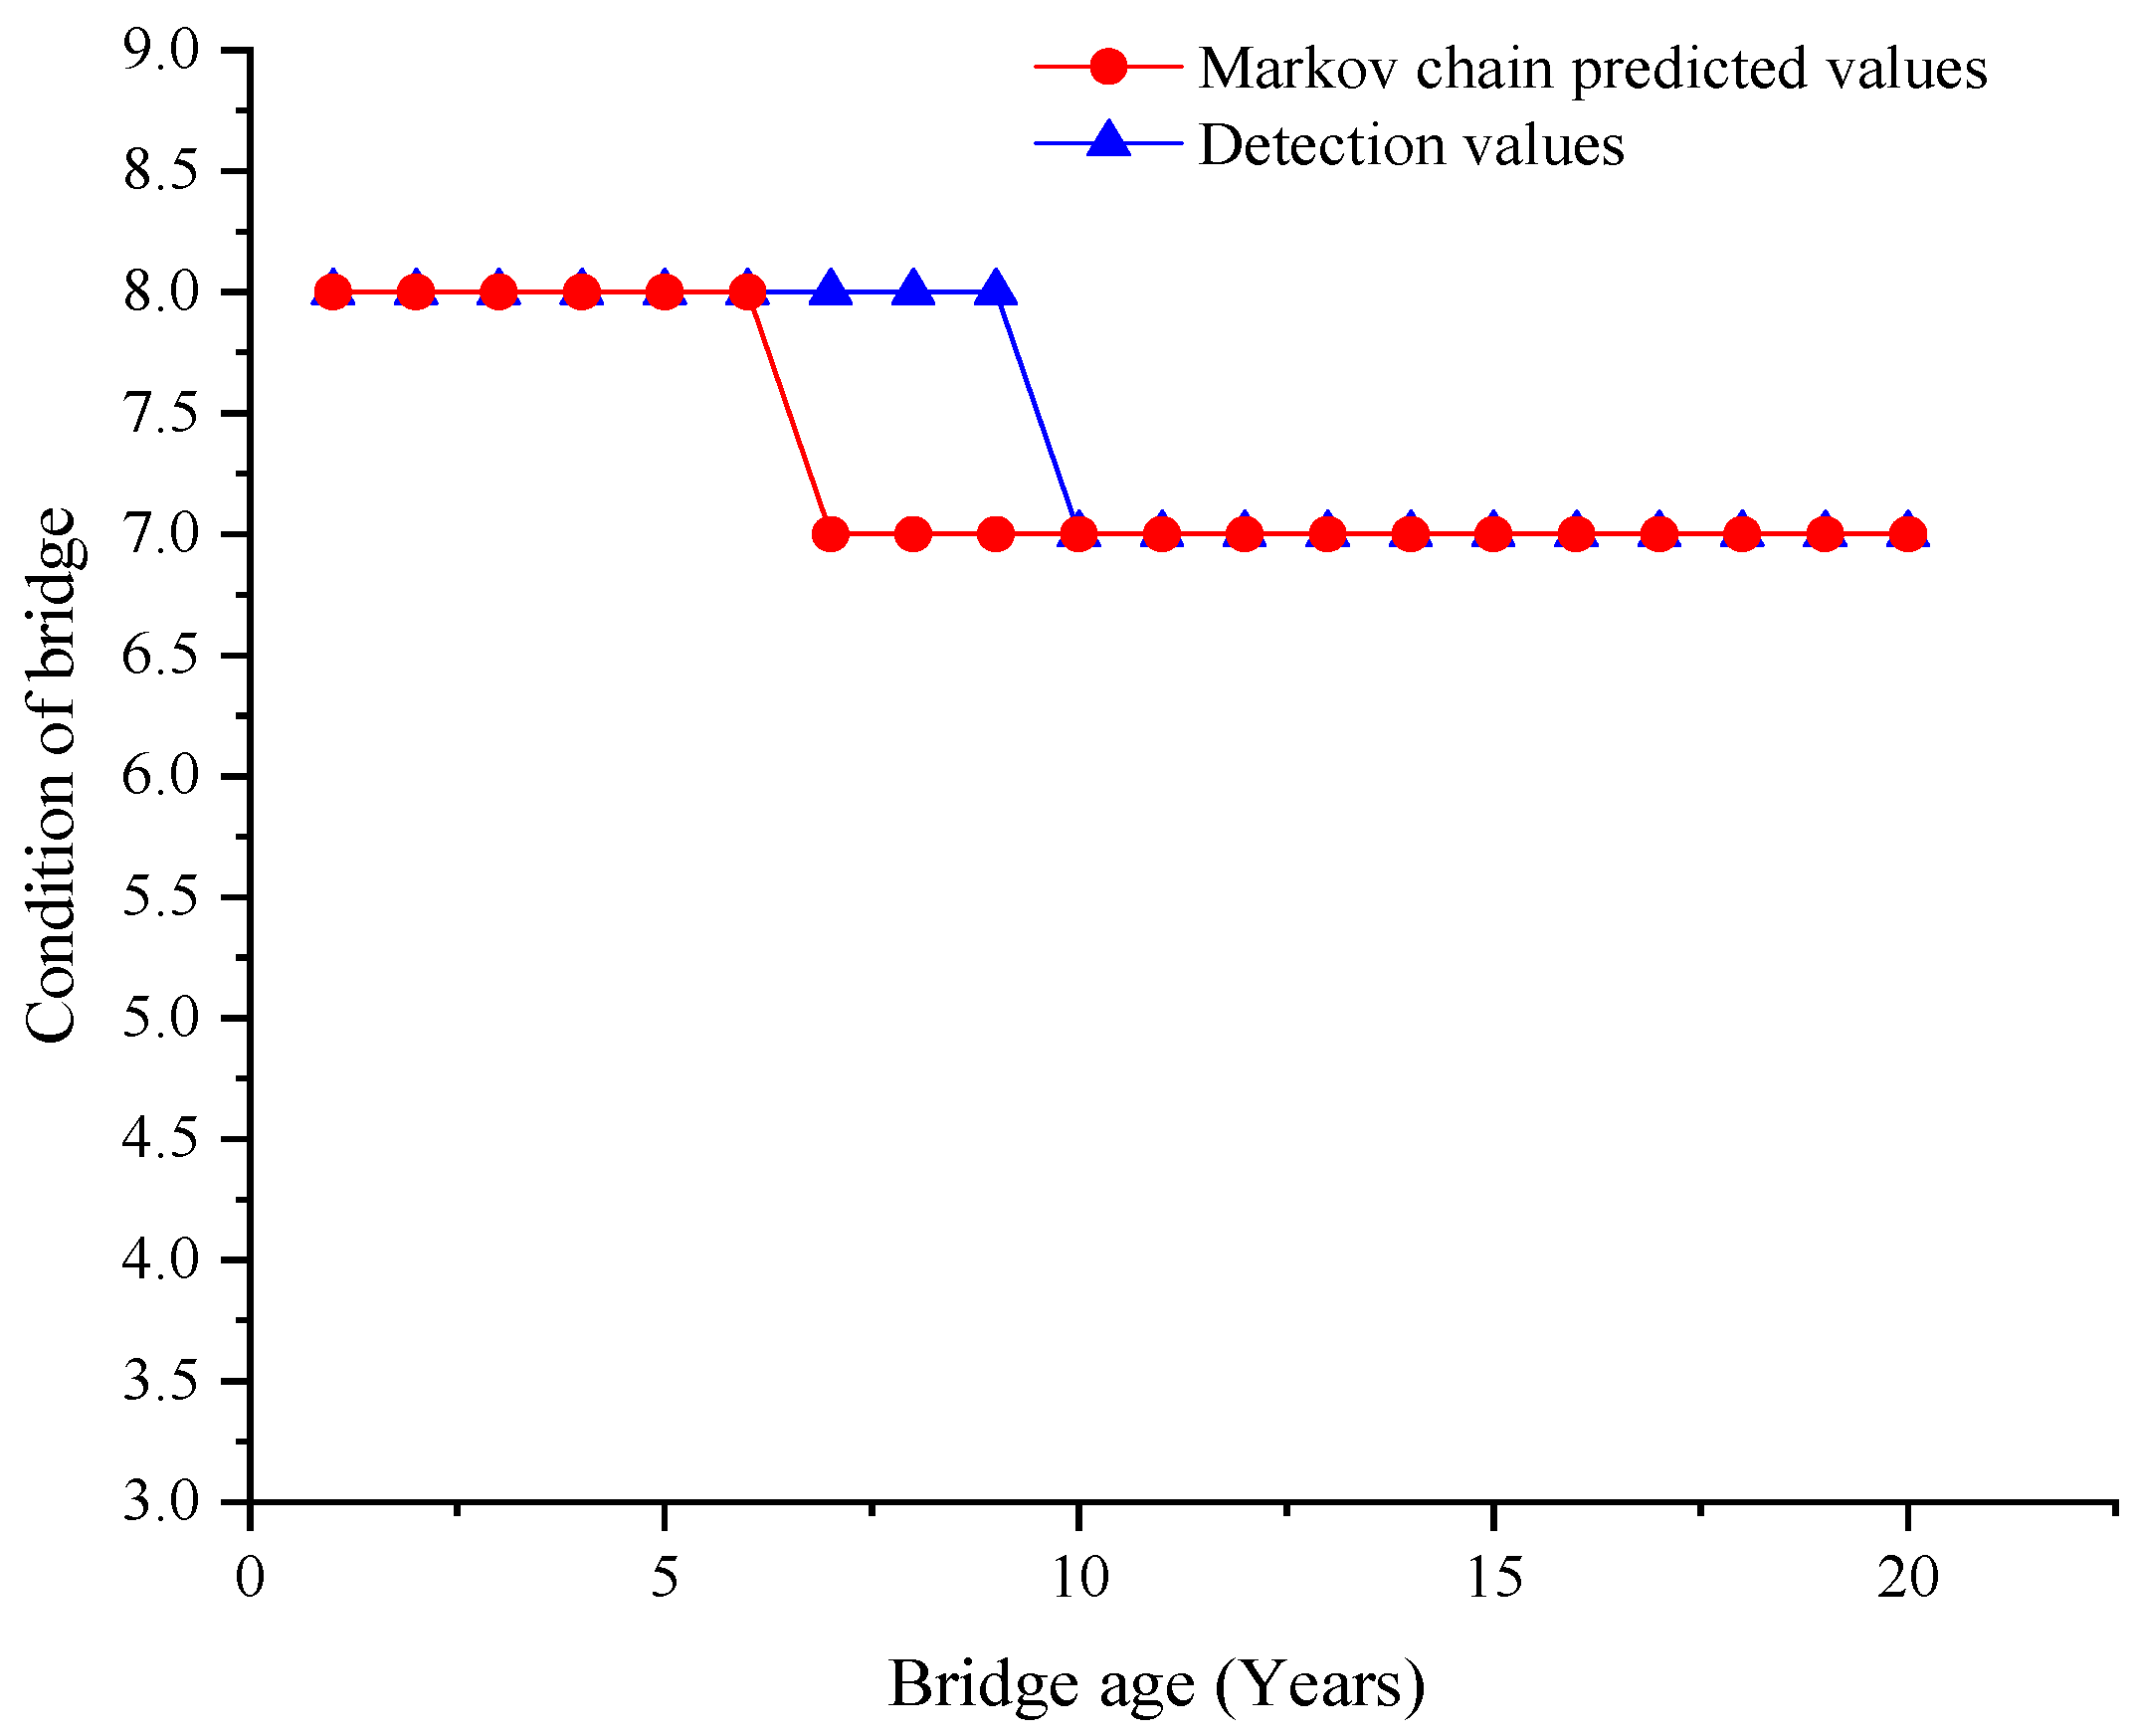
In the real-world scenario, the bridge condition ratings are whole numbers. Therefore, the predicted data for the bridge condition levels from 1 to 20 years are rounded. The predicted values are then compared with the actual values, as depicted in
Figure 9, which demonstrates that the prediction results align well with the actual values. Thus, a 60-year bridge condition rating for the case study is predicted. As illustrated in
Figure 10, the 1–20 year condition levels from the bridge inspection reports are compared with the prediction results of the bridge condition level by the Markov chain model from 1 to 60 years, where the bridge condition prediction curve closely matches the actual bridge condition. This reflects the real deterioration performance of the bridge accurately. The bridge condition worsens over time, and the deterioration rate becomes increasingly slower, consistent with the actual deterioration performance of the bridge.
4. Conclusions
During the bridge maintenance stage, the maintenance cycle tends to be lengthy and the costs high. It is observed that the technical condition of a bridge tends to deteriorate over time due to environmental factors and vehicular effects. Maintenance units must determine the maintenance technology plan and set priorities based on the technical condition level of the bridge. Furthermore, they should implement preventive maintenance measures to enhance the bridge’s long-term performance. This necessitates an accurate prediction of the bridge’s future technical condition level. In this study, a novel method is proposed to predict bridge condition ratings by combining the Elman neural network and the Markov chain, considering the reasonable selection of features that affect the technical condition level of the bridge. The following conclusions can be drawn based on the work completed:
(1) The ReliefF algorithm can be effectively used for the extraction of bridge features. From the NBI bridge feature dataset spanning 1992–2022 in Texas, the bridge feature data are analyzed using the ReliefF algorithm. This analysis identifies six significant bridge features, including bridge age, average daily truck traffic, concrete material type, the skew angle, deck structure type, and the type of bridge.
(2) The original feature database is reclassified according to the extracted features and then input into the Elman neural network. Through the training, validation, and testing of the Elman neural network, the optimal bridge condition rating curves within a 60-year timeframe are achieved. Concurrently, the transition probability matrix for the Markov chain over 60 years is determined through iterative calculations using a genetic algorithm. The results reveal that the Markov prediction curve closely aligns with the predictions from the Elman neural network.
(3) The prediction model is validated using the condition ratings of an actual bridge. A case study bridge was selected, and its condition levels from 1 to 20 years were compared with the predicted results, showing a good fit with the actual condition levels of the bridge. Additionally, the predicted bridge deterioration curves correspond well with the bridge’s actual deterioration patterns.


