1. Introduction
The use of plastics is widespread, but it presents significant environmental challenges. The United Nations reports that approximately 11 × 10
9 kg of plastic waste enters the oceans annually [
1,
2], forming large plastic pollution patches and endangering marine life. A study published in
Science Advances reports that the global plastic production has been over 8.3 billion metric tons since the 1950s [
3], with only a small portion of it recycled. The remaining plastic waste often ends up in landfills, incinerators, or as litter, taking hundreds of years to decompose. This necessitates the development of biocomposites (BCs) with tailored properties to suit specific applications. Biocomposites, composed of natural-fibre/particle-reinforced polymer matrixes, find diverse applications across various industries [
4,
5,
6]. In the automotive sector [
7], they contribute to the manufacturing of interior components, like door panels and dashboards, as well as exterior elements, such as body panels. The construction industry [
8] benefits from biocomposites in structural elements like beams and insulation materials, as they offer eco-friendly alternatives. The versatile applications of biocomposites in consumer goods, the aerospace industry, electronics, and the medical field underscore their potential to create sustainable solutions across various industries [
9]. In the biomedical field, surgical instruments benefit from the combination of strength and biocompatibility that they provide [
9]. Ongoing research continues to expand the range of applications for these eco-friendly biocomposite materials.
The packaging industry has witnessed a surge of interest in incorporating sustainable practices, prompted by mounting environmental concerns [
5,
9]. Bioplastics have gained prominence as a promising solution due to their ability to replace fossil fuel-derived plastics and facilitate a transition towards a more sustainable future. The European Commission’s Communication on the EU policy framework classifies bioplastics into compostable, biodegradable, and biobased plastics. Among these, there are biobased bioplastics that are non-degradable [
10]. However, there are biodegradable biobased bioplastics that are fetching widespread interest [
9,
11,
12]. Noteworthy are bioplastic options commonly considered in the packaging industry, which include polylactic acid, polyhydroxyalkanoates, polyhydroxybutyrate, polyethylene furanoate, polybutylene succinate, as well as renewable forms of polyethylene and polypropylene [
9]. These bioplastics hold immense potential to alleviate environmental pressures and foster a greener trajectory for the packaging sector. One strategy to enhance bioplastics’ processing properties and strength involves the incorporation of starch into polyester blends [
9,
11]. Nevertheless, the available literature [
13] indicates that an elevation in the starch content reduces the tensile strength and melt flow index and also causes an increase in the moisture absorption within starch/polybutylene succinate blends. Furthermore, before blending, the starch must undergo a conversion process to become thermoplastic starch, typically involving the use of glycerol. This conversion process extends the production time and associated costs. The glycerol content is also important in the performance of the blends, as a higher glycerol content tends to shift the blends to the brittle side. However, adding glycerol facilitates the process and enhances the crystallinity content [
13].
This research paper aims to investigate the use of tapioca starch and Siam weed, two readily available and renewable resources, as integral components in developing bioplastics with enhanced properties. Tapioca starch (TS), derived from the cassava plant, is widely employed in the production of a bioplastic variant known as thermoplastic starch [
13]. TS exhibits desirable characteristics, such as renewability and biodegradability, while offering a processing compatibility akin to conventional plastics. Tapioca processing from cassava results in significant amounts of solid waste with high starch and cellulose contents. If left untreated, this waste increases greenhouse gas emissions, exacerbating global climate change [
14]. The discarded or unconsumed portions of tapioca, including peels, leftover cooked tapioca, and by-products generated during food preparation, add to the overall waste. Tapioca processing generates liquid and solid waste, accounting for 70–80% of the raw material. Locally known as “onggok”, the solid waste produced during the pulping and pressing of cassava constitutes 20–30%, potentially reaching 4–6 million tons of solid waste [
14,
15]. Thus, the use of tapioca starch in bioplastic manufacturing [
16,
17] is advantageous due to its abundant availability, cost-effectiveness, and favourable intrinsic properties. Conversely, Siam weed (SW) presents an intriguing composition, comprising 39.6%, 28.7%, 27.5%, and 4.2% cellulose, lignin, hemicellulose, and extractive components, respectively [
18]. The significant lignin content in Siam weed renders it a potential substitute for gelatine. Notably, starch and lignocellulosic materials, such as Siam weed, are polysaccharides with comparable chemical structures. From the literature [
19,
20], it is understood that Siam weed exhibits antimicrobial properties. Consequently, its synergistic interactions within the starch matrix can contribute to the improved performance characteristics of bioplastics with microbial resistance.
This study aimed to develop a biodegradable, biobased, bioplastic packaging material from naturally available tapioca starch, Siam weed extract, and flax seed gel. The work also opens up the possibility of the effective utilization of discarded unconsumed portions of tapioca that balances functionality, environmental responsibility, and the conservation of valuable resources.
2. Materials and Methods
In the present study, the biocomposite films were prepared by using Manihot esculenta (or tapioca/cassava starch (TS)) as the base polymer, Chromolaena odorata (Siam weed (SW)) as an inhibitor, and flax seed gel (FS) as a binder. The process began by preparing the base polymer, adding 20 g of TS to 200 mL of water, and thoroughly mixing it for 30 min using a magnetic stirrer. The leaves of SW were collected, cleaned, and ground in an agate motor and pestle using water as the solvent for the preparation of the inhibitor. In this way, 500 mL of leaf extract was prepared from 100 g of leaves. Next, the leaf extract was added to the starch solution in three different concentrations, 40 mL, 80 mL, and 120 mL, and stirred for 30 min. To this mixture containing the TS and SW, binder FS was added and stirred for 1 h till a slurry solution was obtained. Then, it was poured into a mould to form sheets and allowed to sun dry for 24 h, followed by an air-drying period of 24 h, forming thin sheets of biocomposite material. The biocomposite samples with 40 mL, 80 mL, and 120 mL SW extracts, labelled as BC1, BC2, and BC3, respectively, were subjected to various characterisations to find their applications in day-to-day life and industries.
The investigation of the biocomposites involved a thorough exploration of their physical, optical, and antibacterial properties. The samples’ morphologies and structures are understood from the field-emission scanning electron microscopic (FESEM—Nova Nano, FEI, Hillsboro, OR, USA) images and X-ray diffraction (Bruker D8 ADVANCE —XRD, Billerica, MA, USA) patterns. The composites’ thermal stabilities and yields were studied through thermogravimetric analysis (TGA) employing the PerkinElmer (Waltham, MA, USA) simultaneous thermal analyser 6000, and vibrational mode analysis within the 4000–400 cm−1 range was conducted using a PerkinElmer Fourier Transform Infrared (FTIR) spectrometer. The composites’ optical characteristics, like the absorption and optical emissions, were obtained through the Jasco (Oklahoma City, OK, USA) V550 Ultraviolet–visible (UV-Vis) absorption spectrometer and the Horiba (Kyoto City, Japan) Flurolog TCSPC photoluminescence spectrometer, respectively. The antibacterial properties of all the biocomposites were identified using the agar-well diffusion method. The goal of this multifaceted analysis was to offer a thorough comprehension of the varied properties displayed by the composite material.
3. Results and Discussion
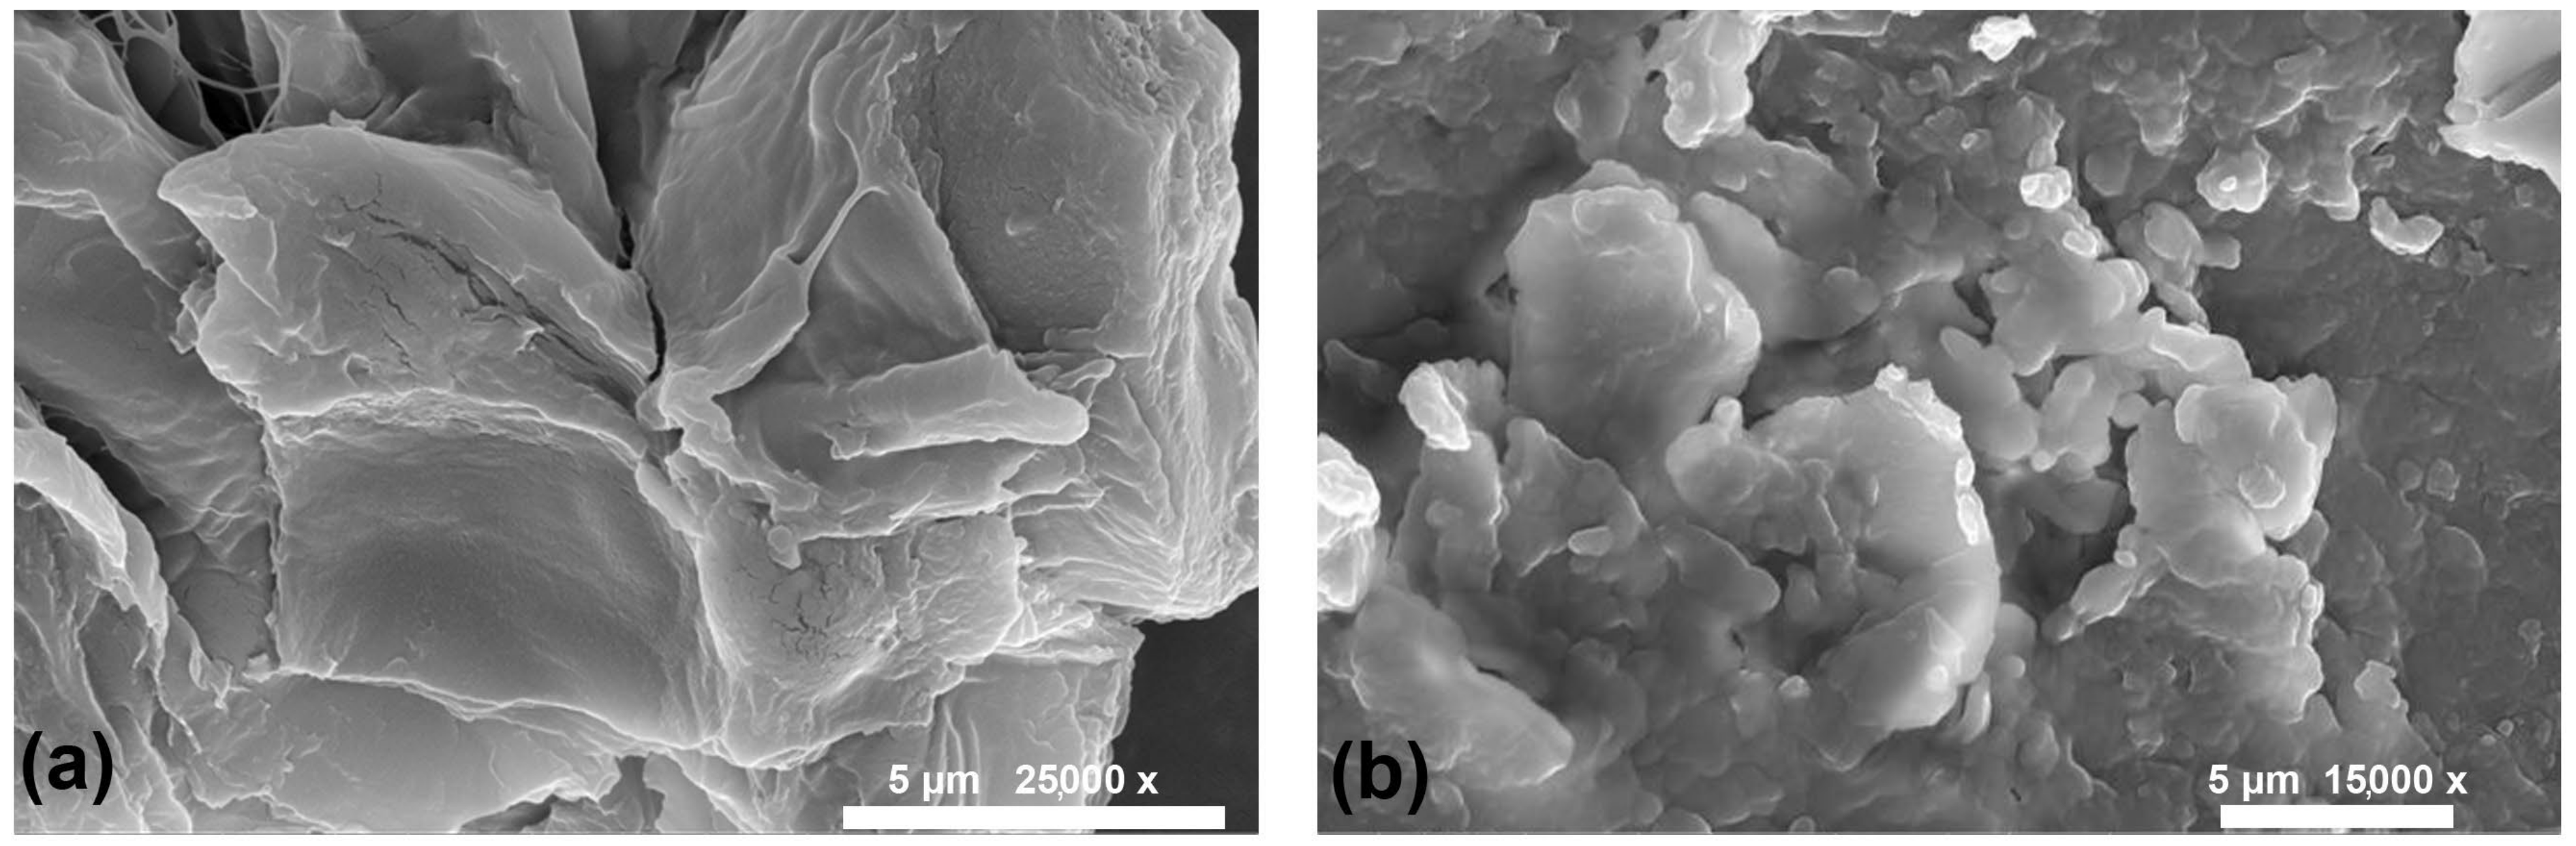
A biocomposite’s morphology is crucial for specific applications, like biopackaging, biomedicine, and electronics, where the effective surface area plays a crucial role. An FESEM image of starch and the biocomposite BC1 as a representative (as BC2 and BC3 also exhibit the same morphology) is shown in
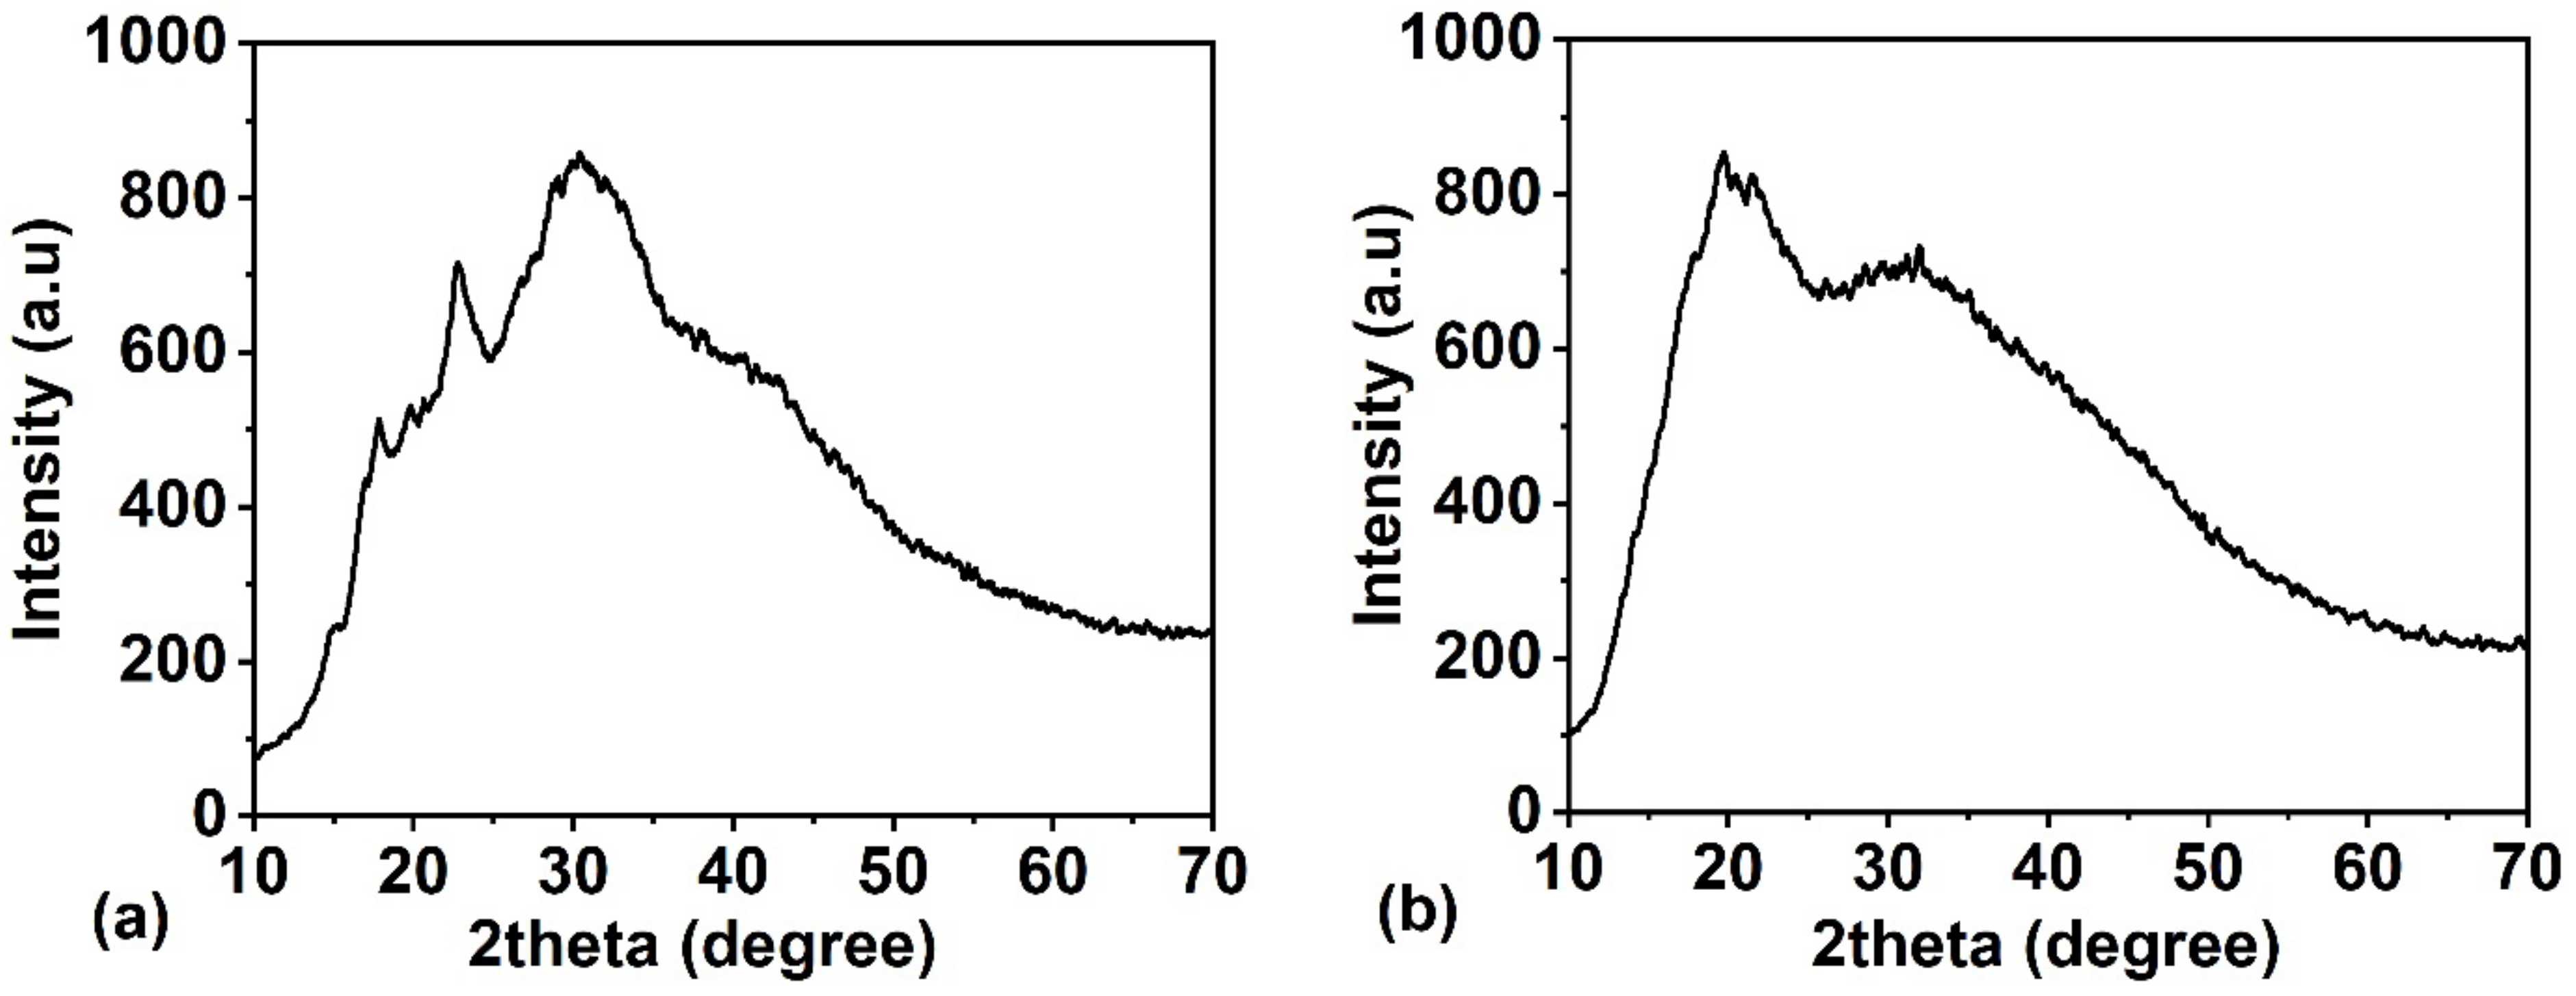
Figure 1. When the starch shows stacked laminae, BC1 shows fragmented, agglomerated structures. The crystalline characteristics and amorphous structures of the cellulose-based materials are understood from the sharp and broad XRD peaks. Starch displays various polymorphs that are distinguished by unique crystalline structures. The primary polymorphs include A-type, B-type, and C-type starches, each characterised by a distinct arrangement of starch molecules within its crystalline lattice [
21,
22]. Starch with a C-type crystalline structure, derived from legumes or plant roots like pea seeds or cassava roots, features a unique composition formed by the coexistence of A- and B-type crystallites [
21,
22]. Specifically, C-type starch has a B-type structured core surrounded by A-type crystallites. The base polymer’s (TS) XRD pattern shown in
Figure 2a exhibits peaks at 15°, 17.97°, 19.93°, 22.78°, 28.7°, 30.69°, and 40.21° that correspond to the C-type crystallite structure of TS. The XRD pattern of the representative biocomposite, BC1, shown in
Figure 2b, also exhibits peaks at 17.83° (−102), 19.6° (021), 20.4° (002), 21.6° (012), 28° (210), and 32.03° (013), which are assigned to the cellulosic peaks in comparison with the ICDD data (00-003-0226) indicating the C-type crystalline structure in TS.
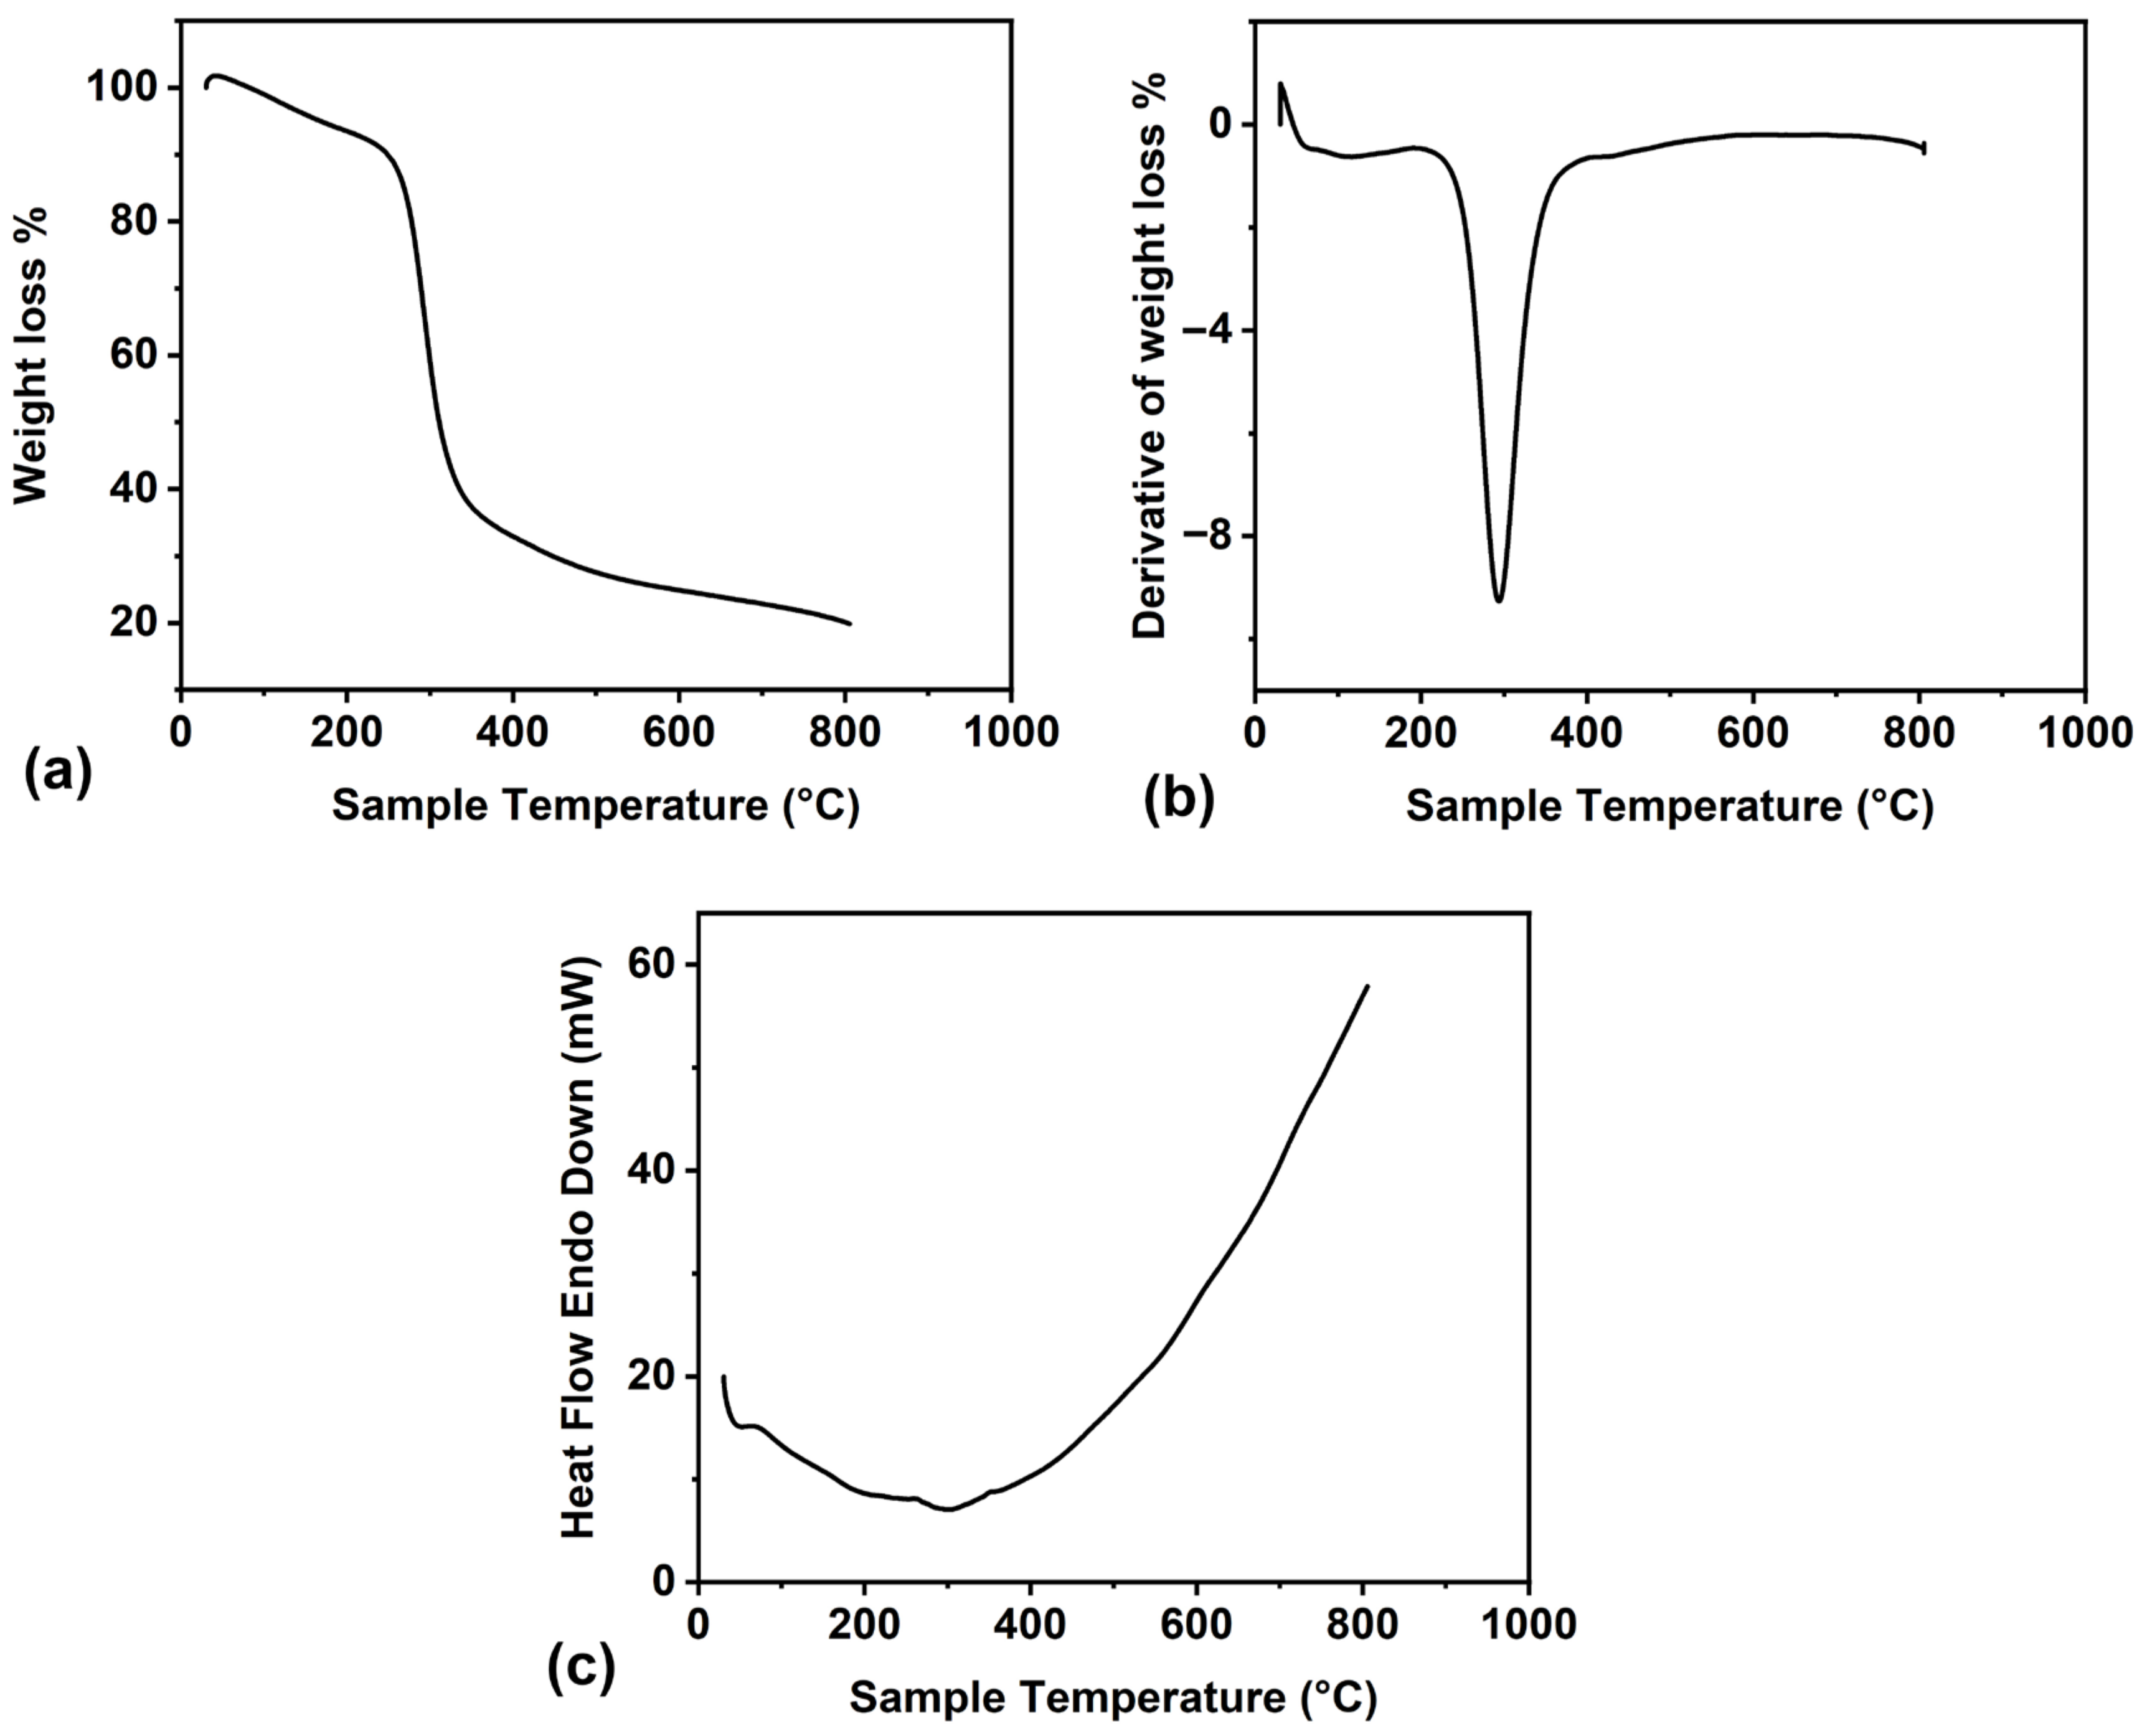
The thermal stability of biocomposite materials is a critical factor that can positively impact their performance, durability, and suitability for diverse applications, spanning from construction and automotive applications to electronics and beyond. The literature [
23,
24] indicates that starch undergoes a small initial weight loss up to 100 °C as a result of moisture removal. Subsequently, between 100 and 200 °C, the weight loss occurs as a result of the elimination of absorbed water resulting from gelatinisation. The highest decomposition occurs around 200–400 °C, and it is attributed to the breaking of glycosidic bonds in the starch. The TG and DTG analysis plots of the biocomposite BC1 are displayed in
Figure 3a and b, respectively. The TGA curve exhibits three stages of thermal decomposition that occurred in the sample: up to 250 °C; between 250 °C and 340 °C; and from 340 °C to 800 °C. A weight reduction of 11.40% in the initial stage, up to 250 °C, can be attributed to the evaporation of water adsorbed on the surface of the composite and the removal of amorphous carbon. Between 250 °C and 340 °C, the composite experienced its most significant weight loss, amounting to 51.96%. This points to the peak decomposition of the composite, likely due to the oxidation of the partially decomposed starch and the fibre degradation. After 340 °C, the TGA curve shows a plateau region, as the remaining residue was typically composed of inorganic ash. The ash content represents the incomplete combustion of the organic components of the starch [
24]. From the DTG analysis (
Figure 3b), 300 °C can be considered as the safe limit for using the prepared biocomposite, where the TGA curve shows only a 40% weight loss.
DSC is a thermal analysis method employed for examining the heat flow linked to the physical and chemical transitions within a sample observed in relation to temperature variations. This information helps characterise various properties, such as the phase transitions, melting points, and heat capacity, providing valuable insights into the material’s thermal behaviour and stability. According to the literature, TS typically exhibits endothermic peaks in the DSC thermogram, corresponding to events such as gelatinisation and retrogradation [
23]. The DSC plot of the biocomposite BC1, shown in
Figure 3c, exhibits endothermic peaks at 50 °C and 300 °C. The peak at 50 °C observed in the DSC plot of TS corresponds to the gelatinisation process. Tapioca starch, composed of amylose and amylopectin molecules in granules, undergoes gelatinisation when exposed to heat and water. This complex thermodynamic transition involves heat absorption, disrupting hydrogen bonds, allowing water penetration, and resulting in the swelling and hydration of the starch granules. The endothermic peak in the DSC plot signifies the heat absorption required for gelatinisation, and its temperature indicates the onset of this process. The endothermic peak at 300 °C indicates the phase transition of the composite by evaporation or sublimation due to the decomposition of the sample and removal of amorphous carbon [
23]. Thus, thermal analysis provides insights into the composite’s thermal behaviour, aiding in understanding its functional properties for bioplastic packaging applications.
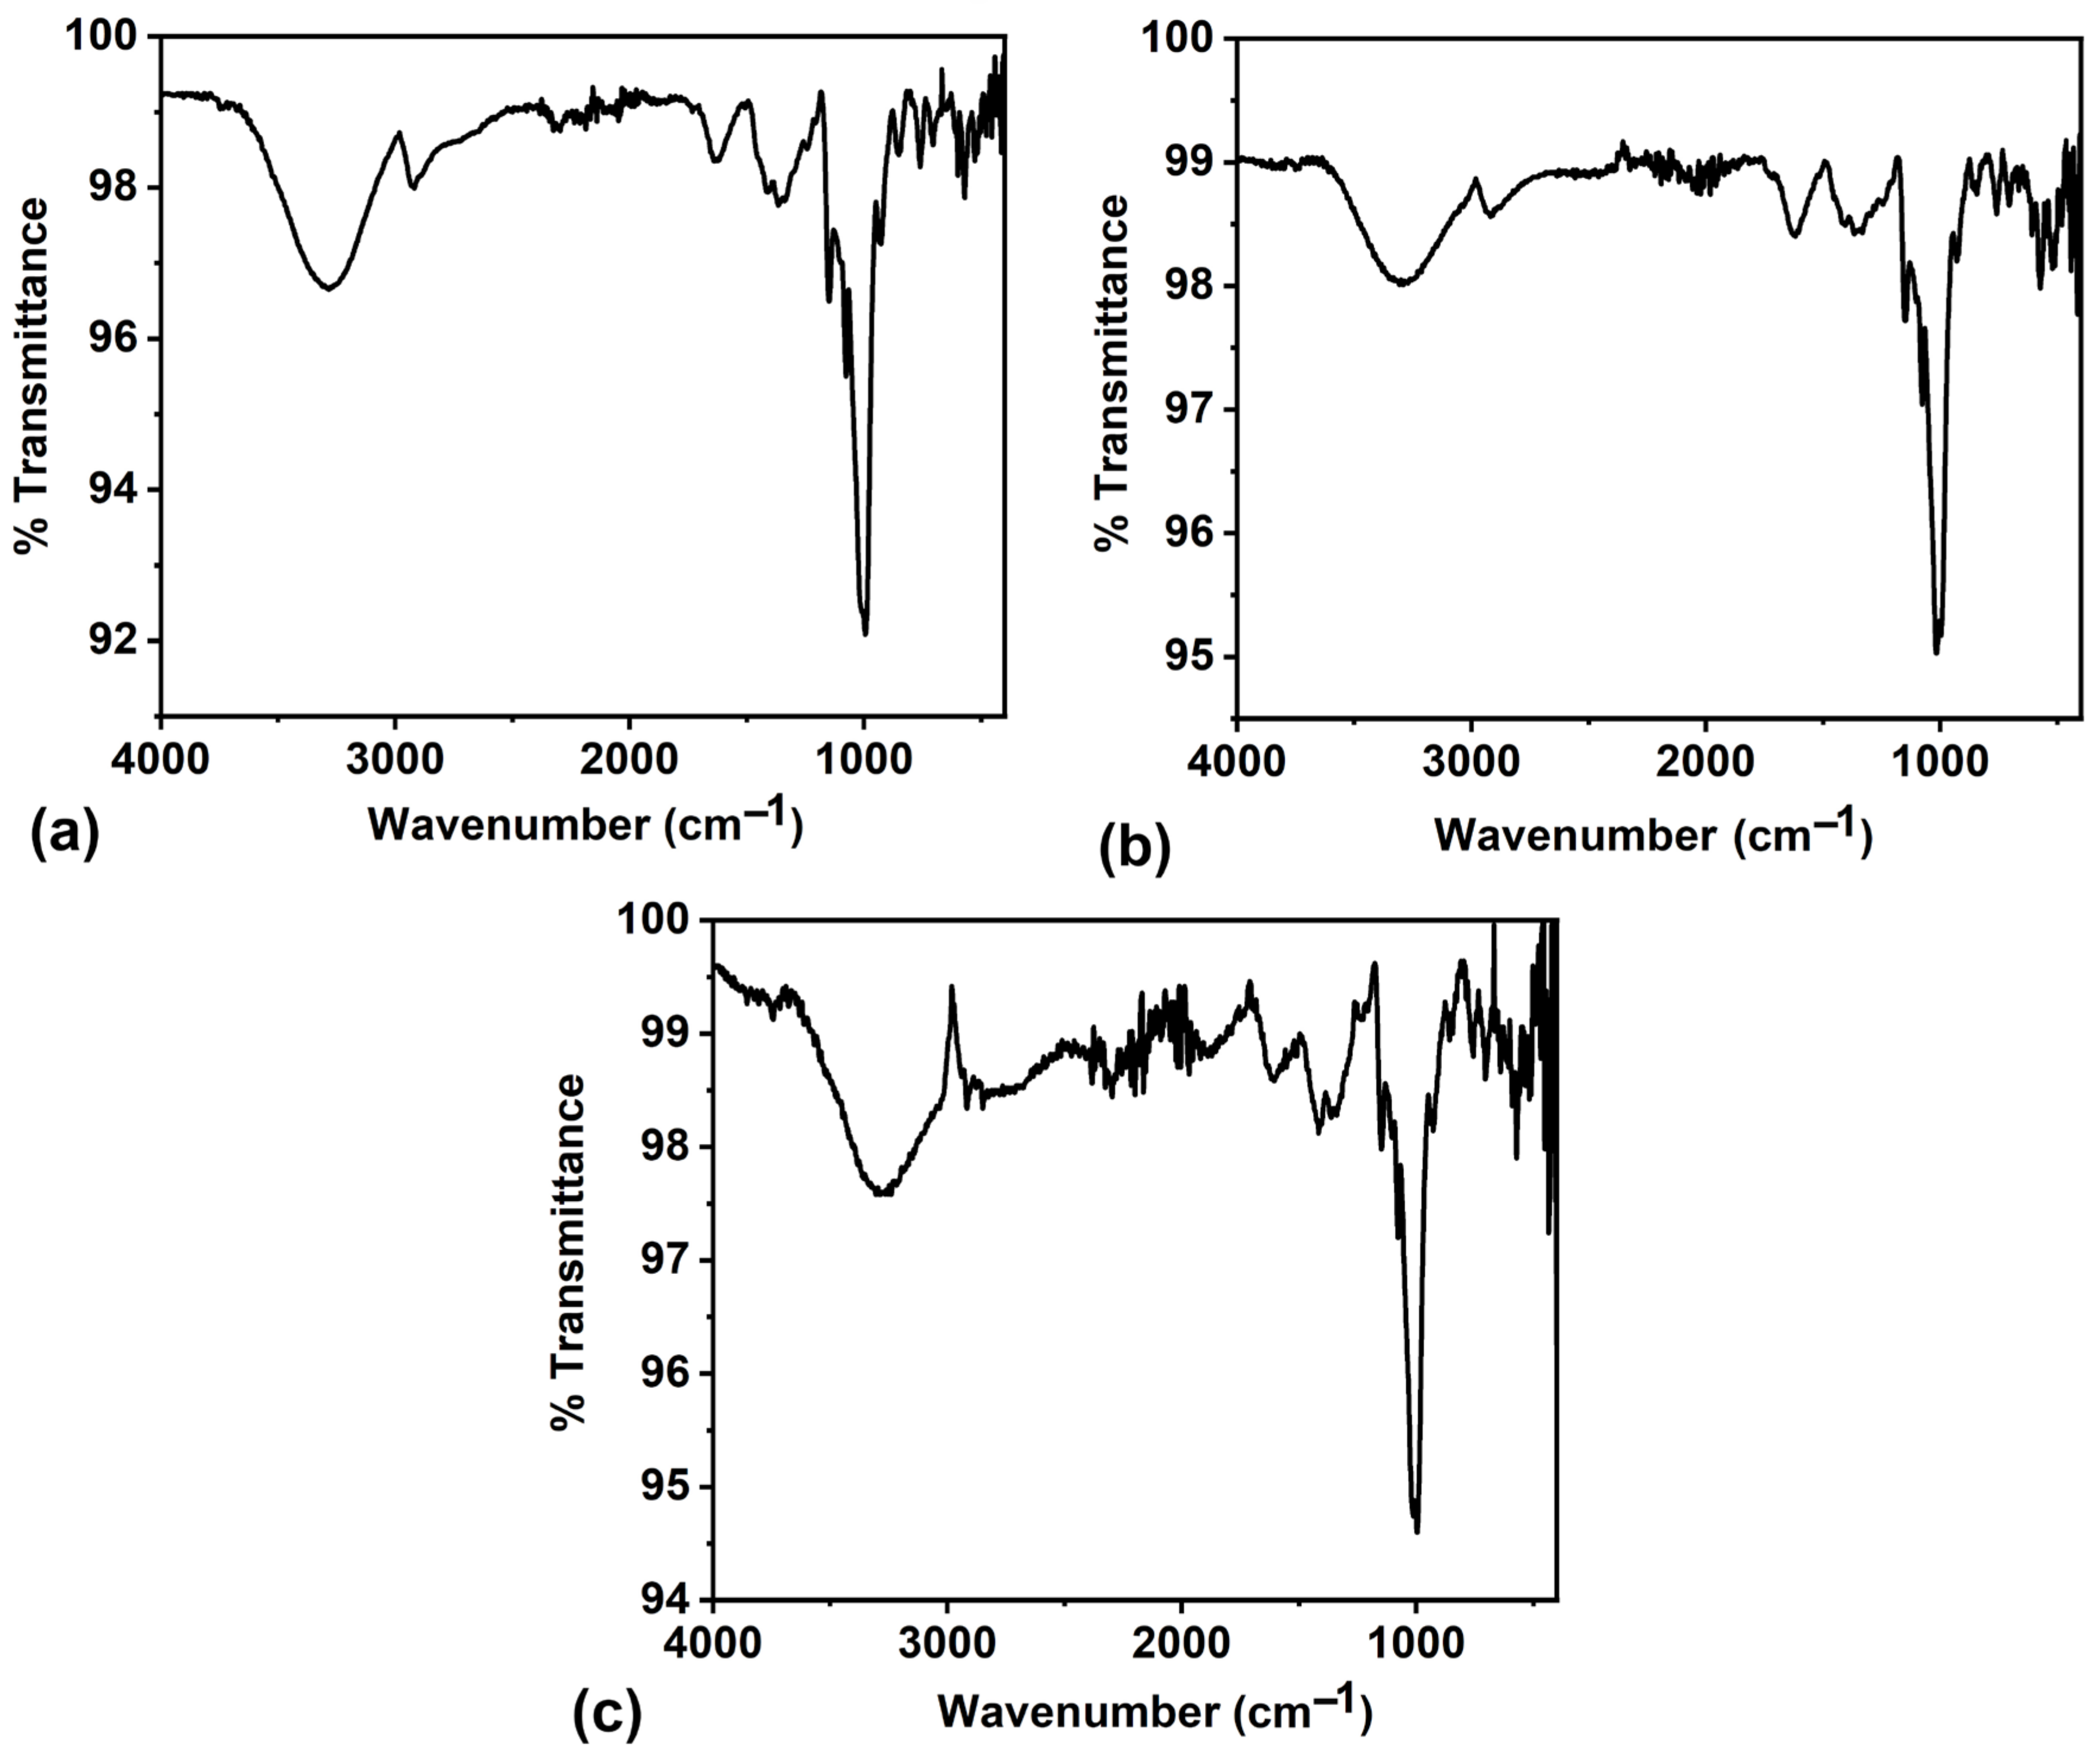
FTIR spectroscopy is a versatile analytical technique with several advantages in analysing biocomposites. It enables comprehensive chemical composition analysis, identifying individual components and their respective functional groups. The FTIR spectra of the biocomposites BC1, BC2, and BC3 are shown in
Figure 4, with their peak assignments in
Table 1. The proteins often contain amide bonds, and the N-H stretching and bending vibrations typically appear in the regions around 3300 cm
−1 and 1600–1500 cm
−1, the O-H stretching vibrations appear around 3300 cm
−1, the carbonyl stretching vibrations appear around 1700–1750 cm
−1, the C=C stretching vibrations appear around 1600–1500 cm
−1, and P=O stretching appears around 1000–1300 cm
−1 [
13,
23,
25,
26,
27,
28,
29]. These functional groups indicate the possibility of the presence of various antibacterial compounds in the sample.
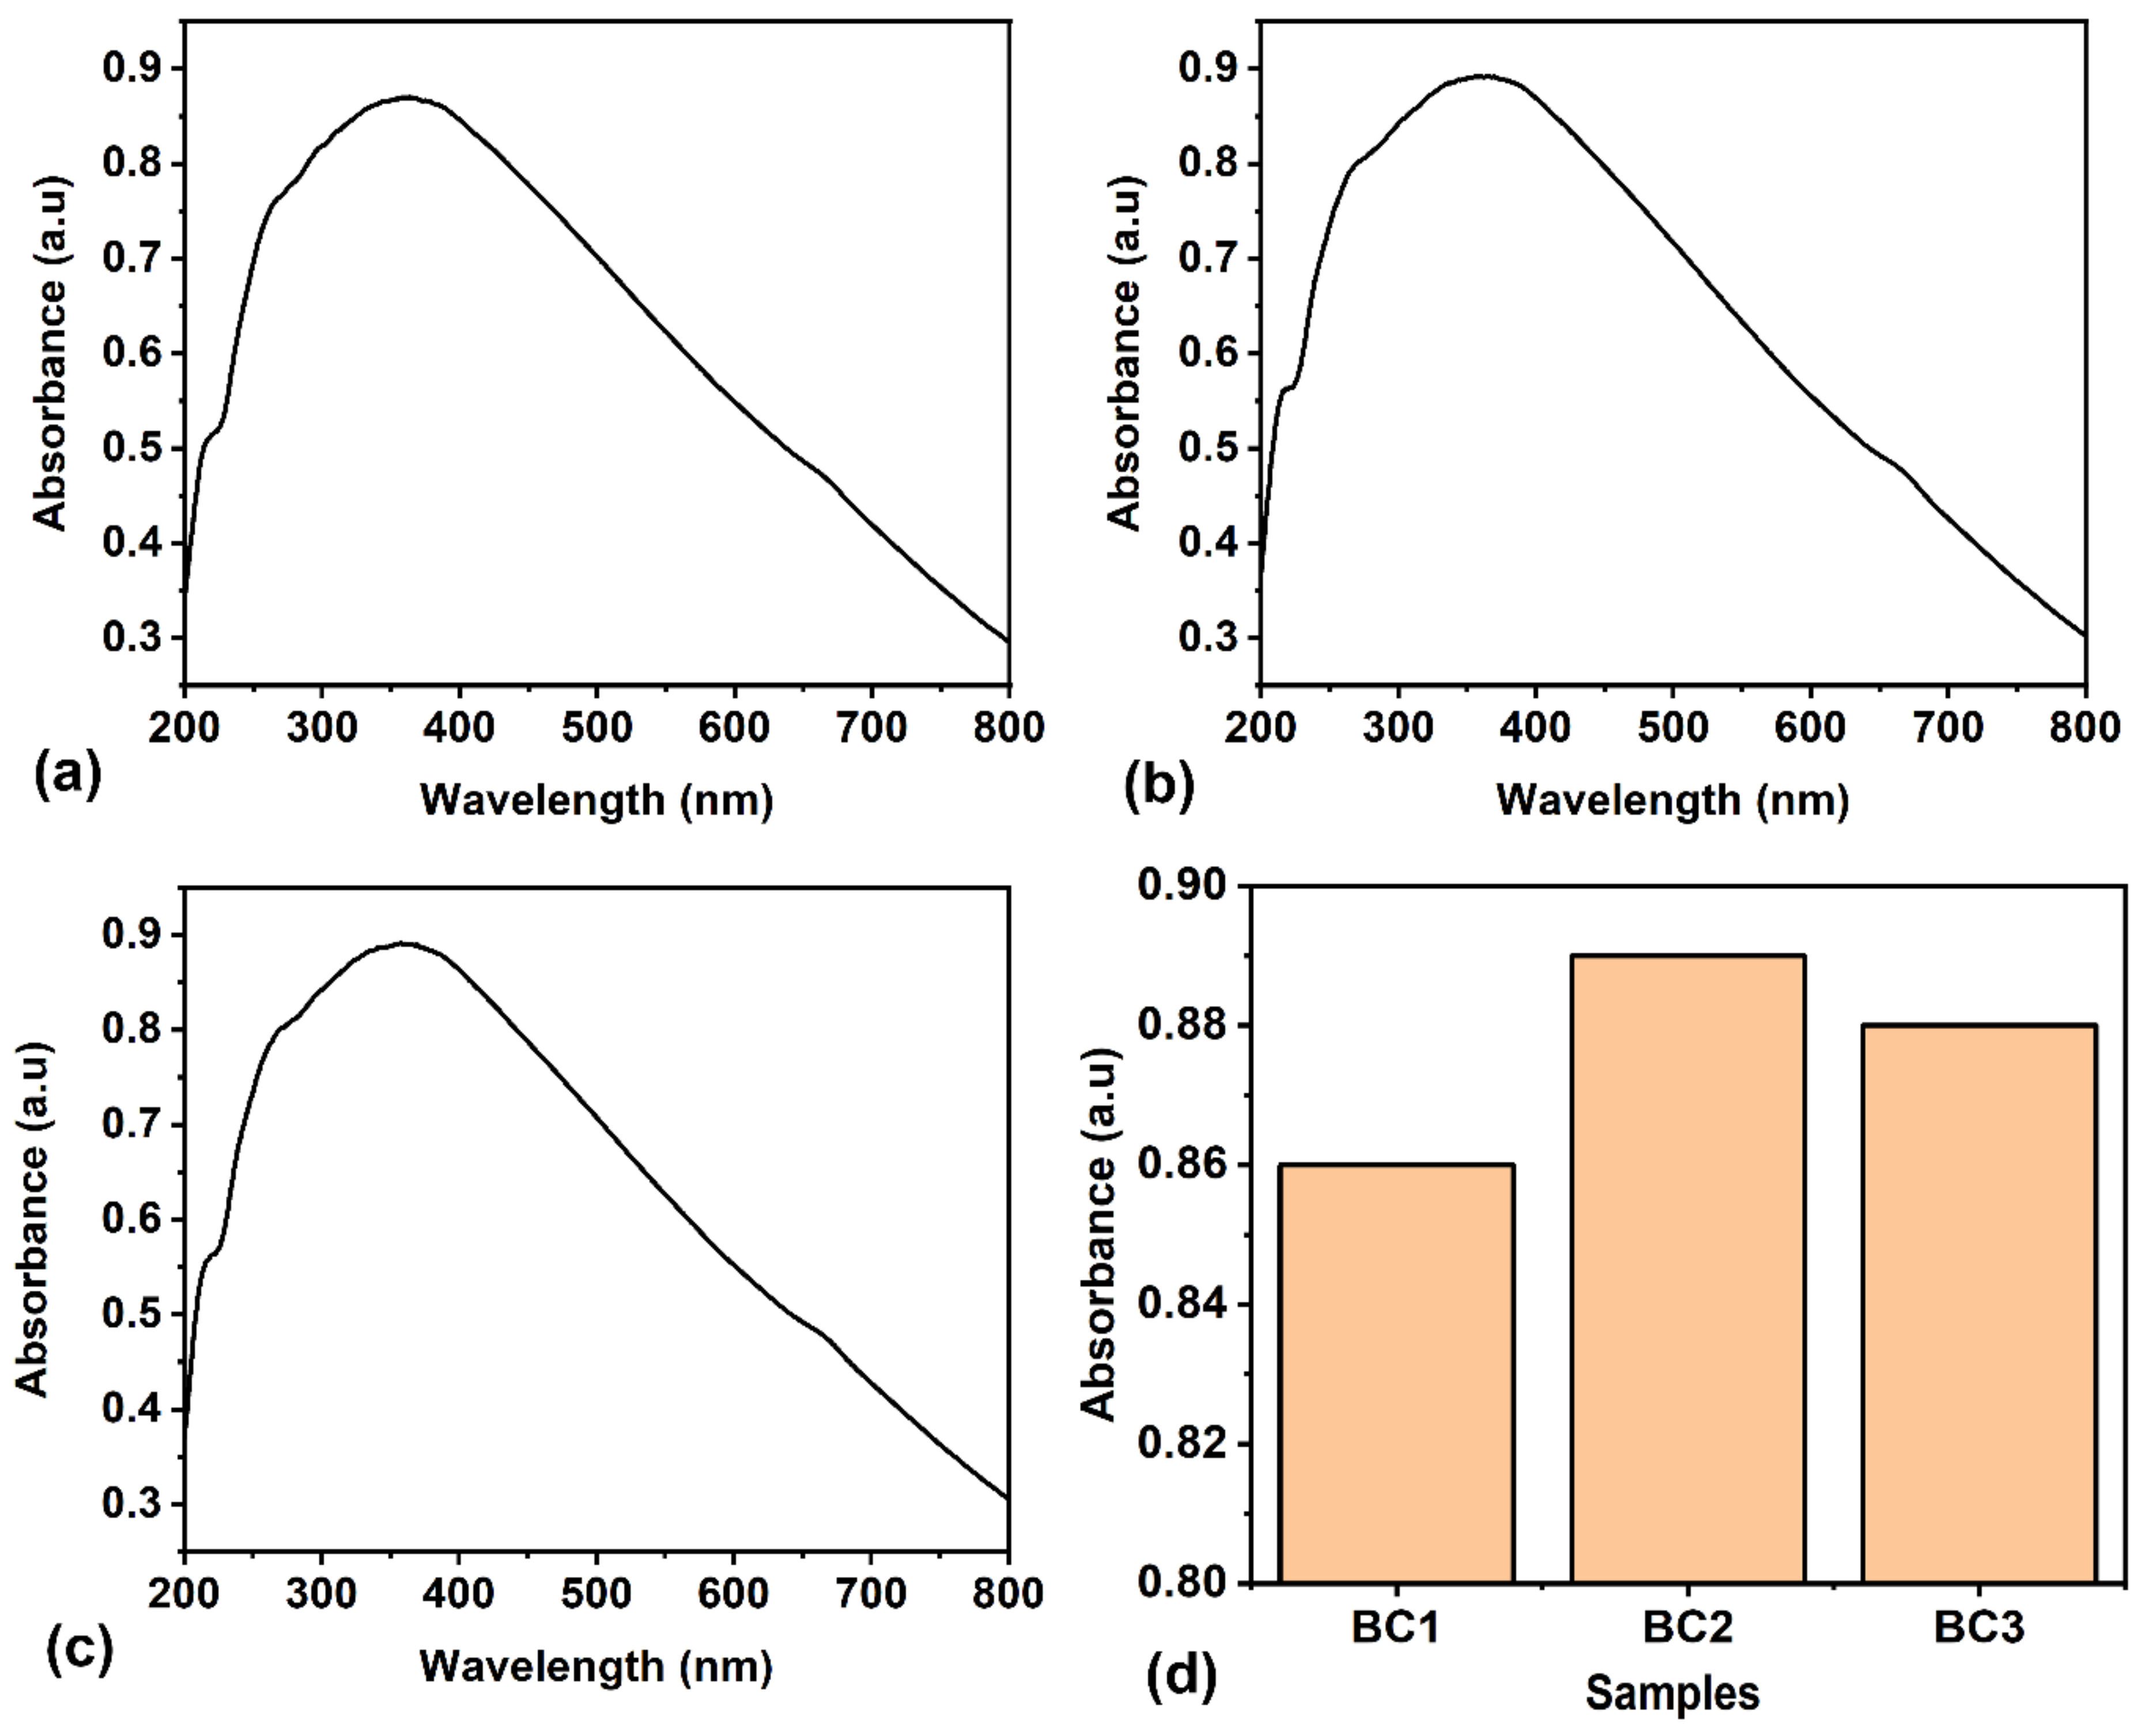
The UV spectral study of bioplastic packaging materials provides valuable insights into their molecular compositions and structural characteristics and is particularly useful for analysing the electronic transitions of organic compounds. The broad UV–visible spectrum suggests the presence of a chromophore that absorbs in the UV–visible range. The UV–visible absorption spectrum of the composites are displayed in
Figure 5. They show a broad absorption peak at 360 nm and small humps at 213 nm and 656 nm. The occurrence of a broad peak in the UV–visible spectrum is due to the presence of conjugated systems or electronic transitions within the molecules. Conjugated systems, which consist of alternating single and double bonds or aromatic structures, are responsible for the absorption in the UV region. The broader the peak, the more complex the conjugated system or the greater the number of electronic transitions involved. The factors contributing to the broadening of peaks in the UV spectrum are longer conjugation lengths, π-π* electronic transitions, and the molecular structure. Siam weed contributed to the peak at 656 nm, indicating chlorophyll in the biocomposite. From
Figure 5d, it can be observed that adding more Siam weed extract does not significantly affect the optical absorption (i.e., the absorbance level increases from sample BC1 to BC2 and, further, there is no significant change in BC3). The Tauc plot analysis of
Figure 5a–c yields direct bandgap energies of 2.08 eV, 2.14 eV, and 2.05 eV for the BC1, BC2, and BC3 samples, respectively.
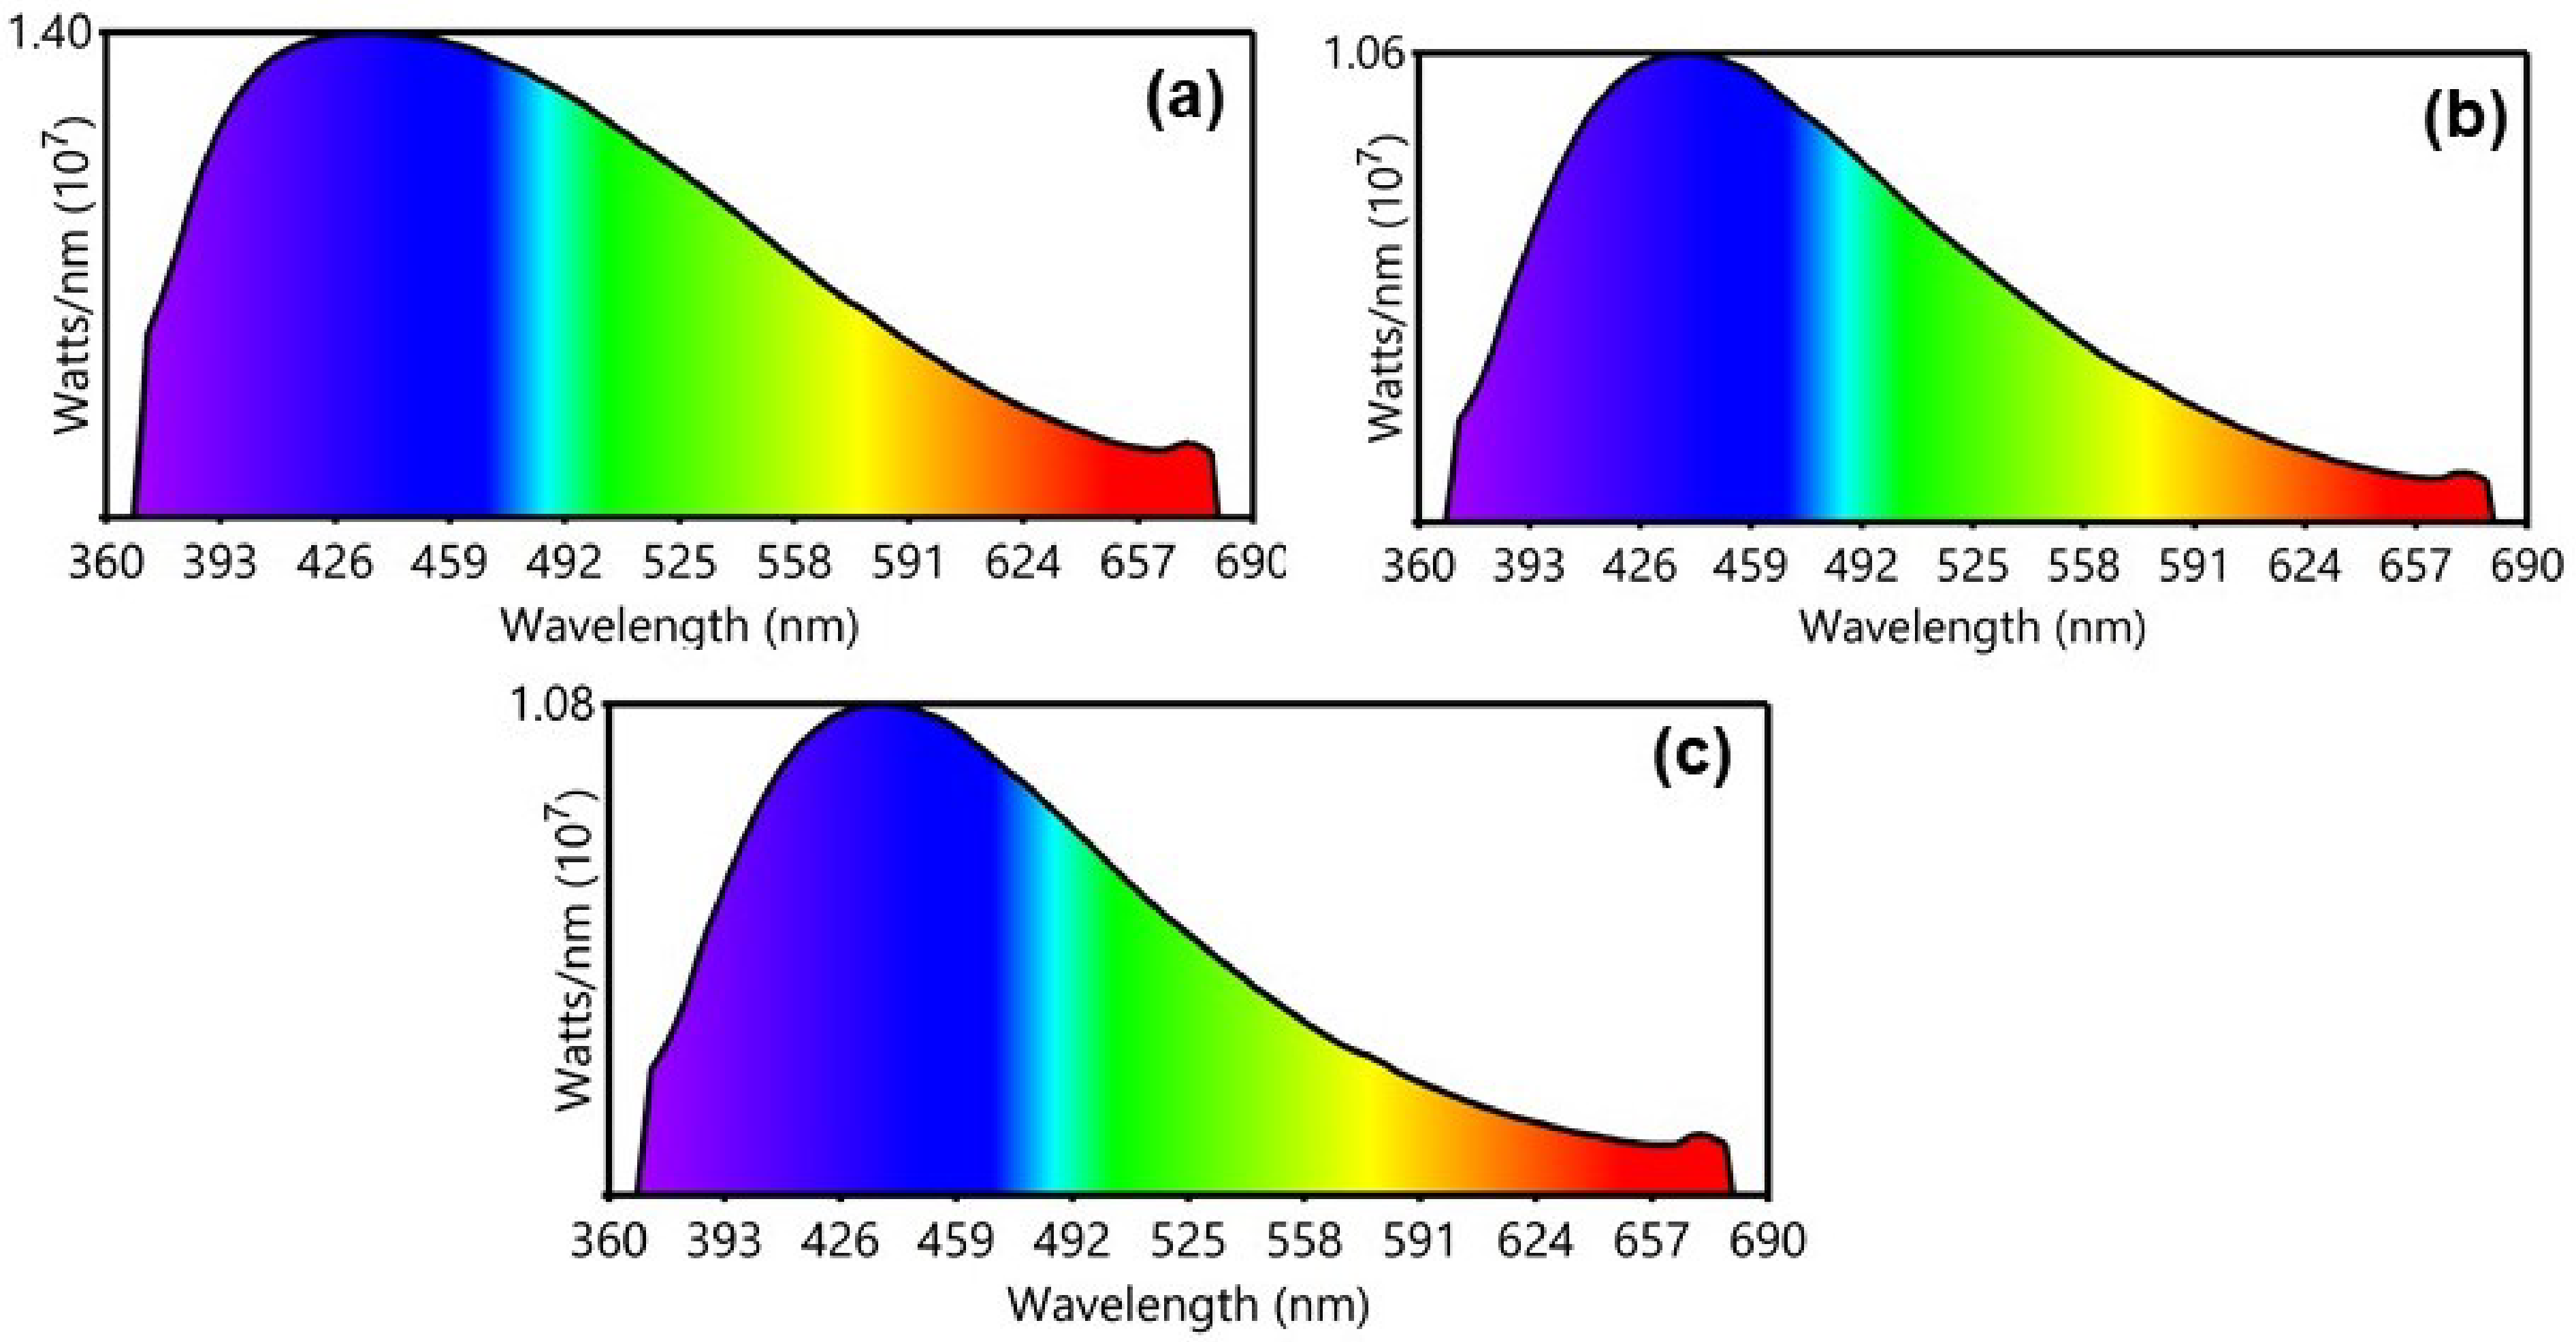
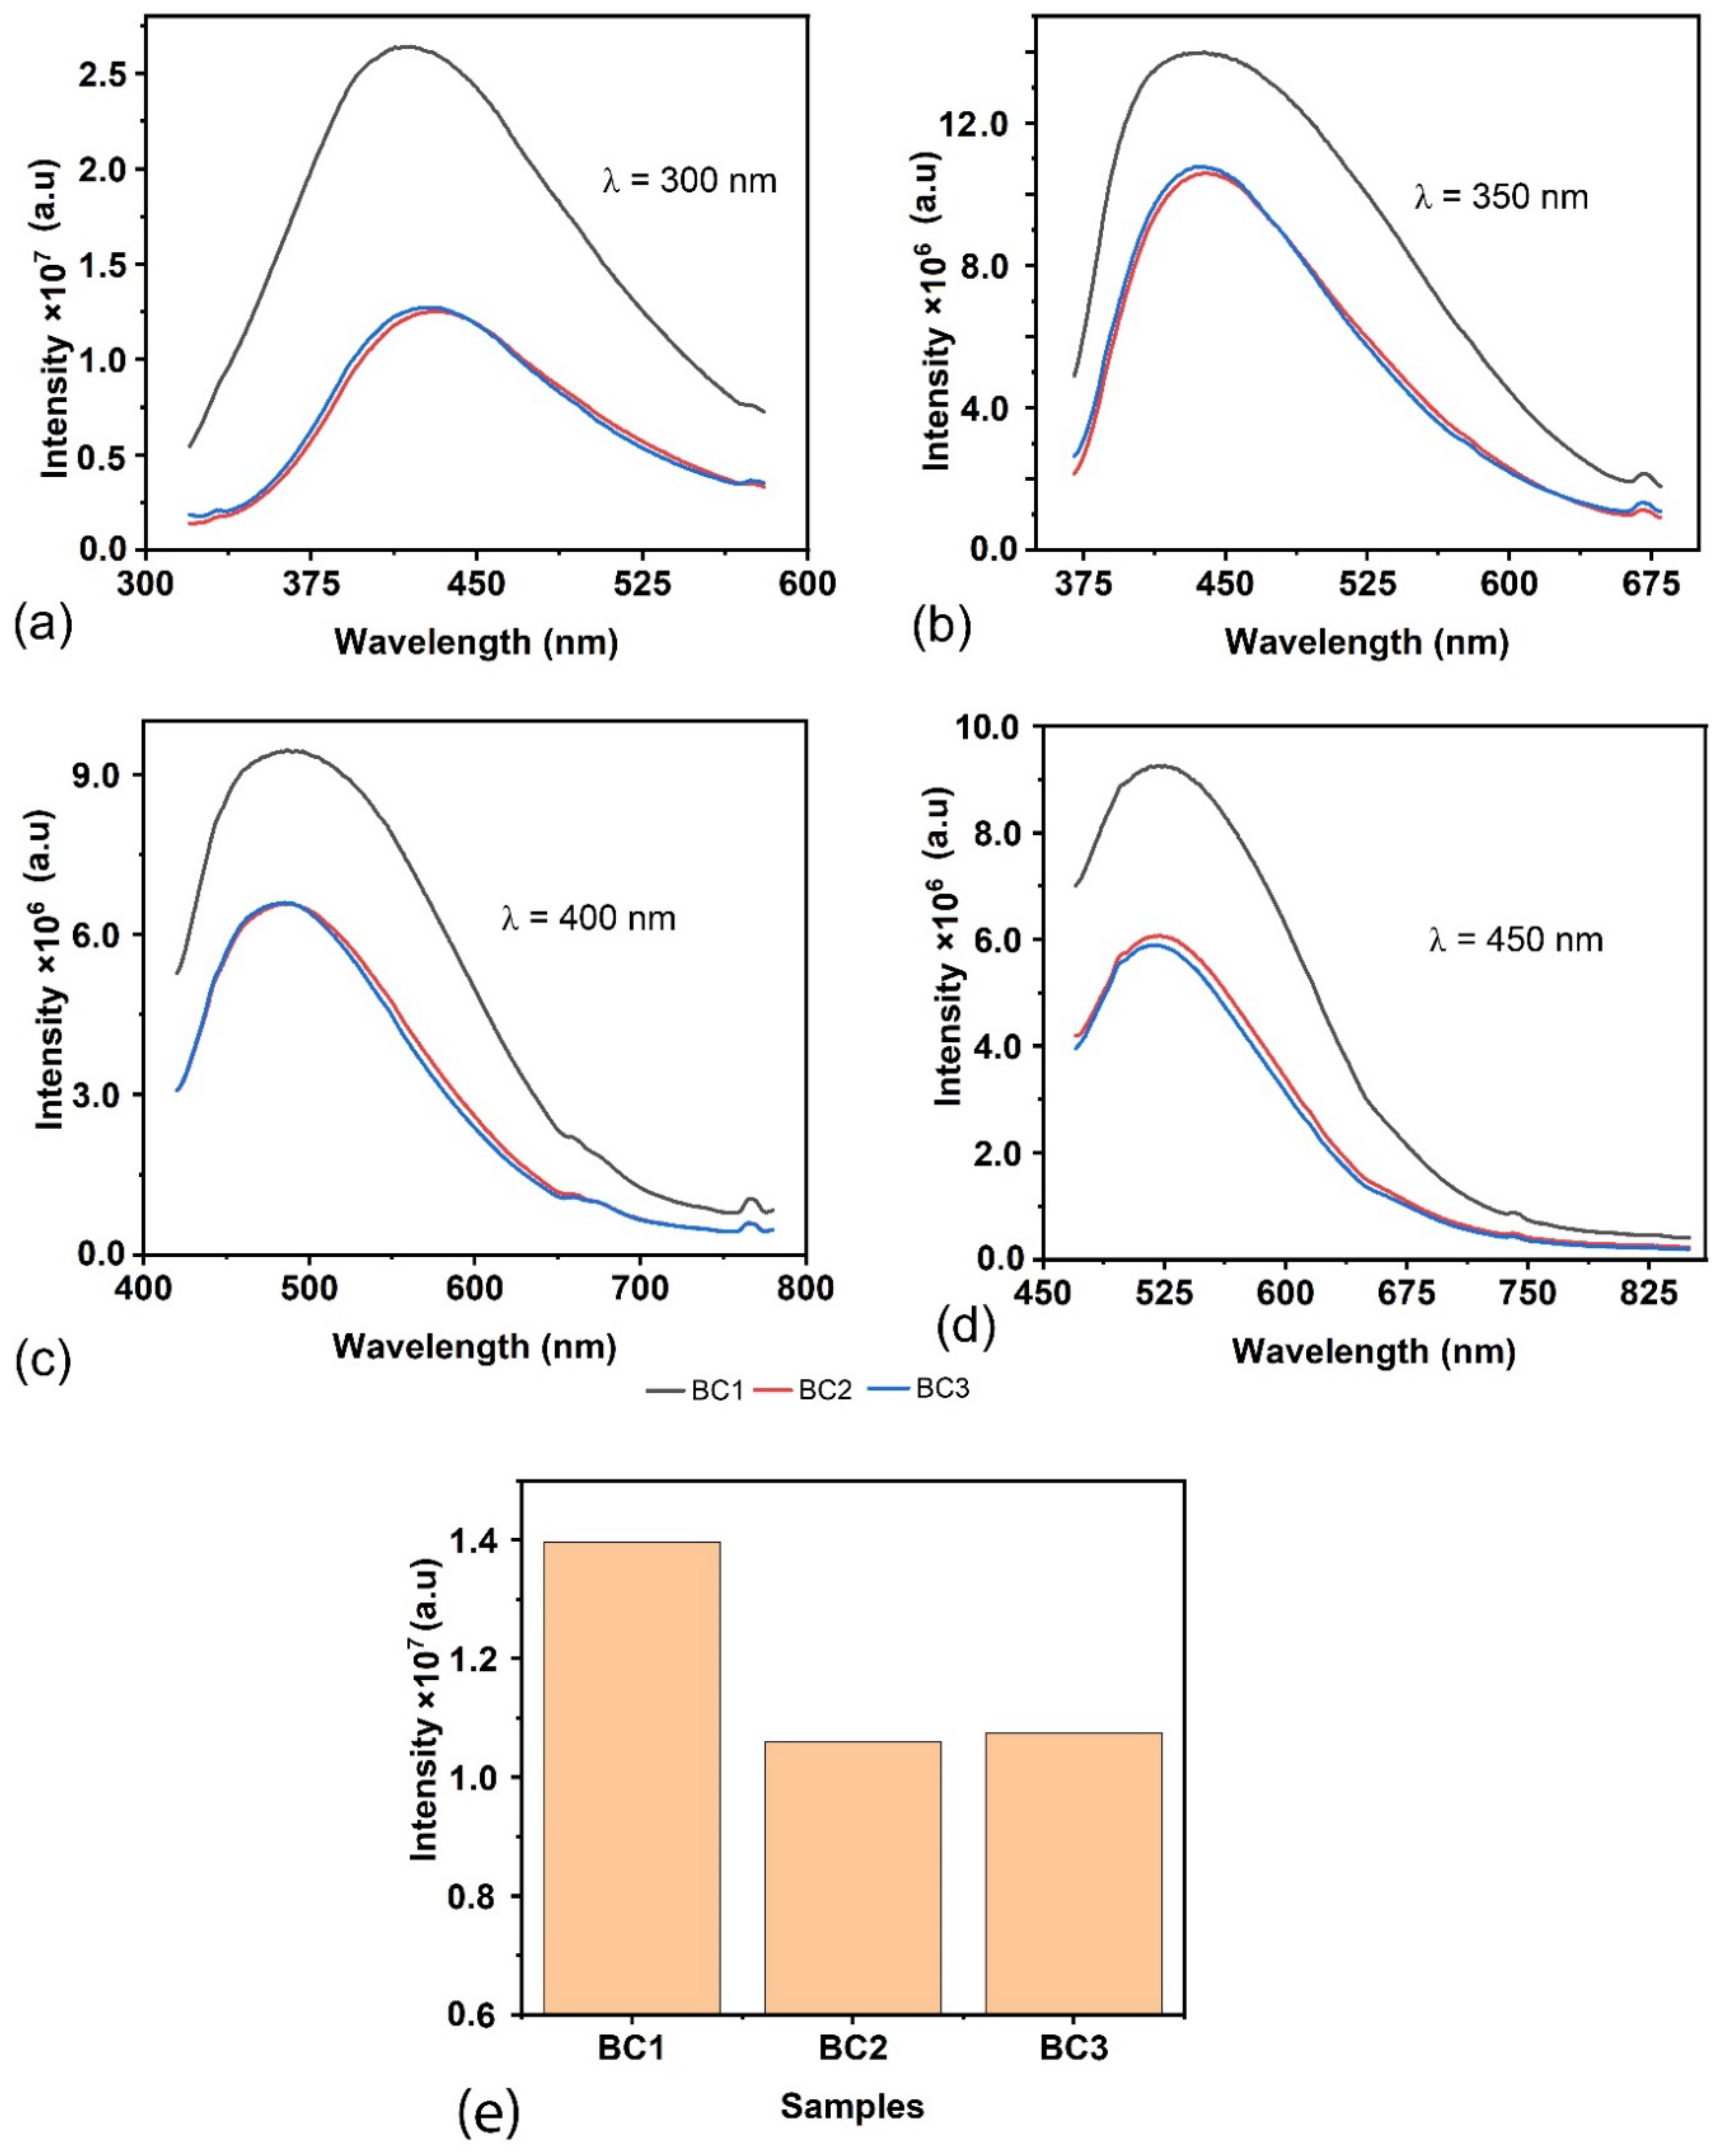
Photoluminescence (PL) spectral studies of biopackaging materials provide valuable information about their optical and photophysical characteristics. The emission peaks and intensity in the PL spectrum can indicate the material’s composition and molecular arrangement and the presence of specific fluorophores or chromophores. By studying the PL properties of bioplastic packaging materials, researchers can gain insights into their fluorescence behaviour, which is crucial for product labelling or tracking applications. The PL spectra of BC1, BC2, and BC3 for the excitations 300 nm, 350 nm, 400 nm, and 450 nm are shown in
Figure 6. All the samples exhibited broad emissions at 425 nm irrespective of the excitation. The addition of Siam weed lowered the emission intensity (i.e., the emissions decrease from the BC1 sample to the BC2 sample and, further, there is no significant change in BC3). A representative variation in the emission intensity peak at 440 nm corresponding to the excitation at 350 nm is shown in
Figure 6e. When the PL spectrum is analysed in light of
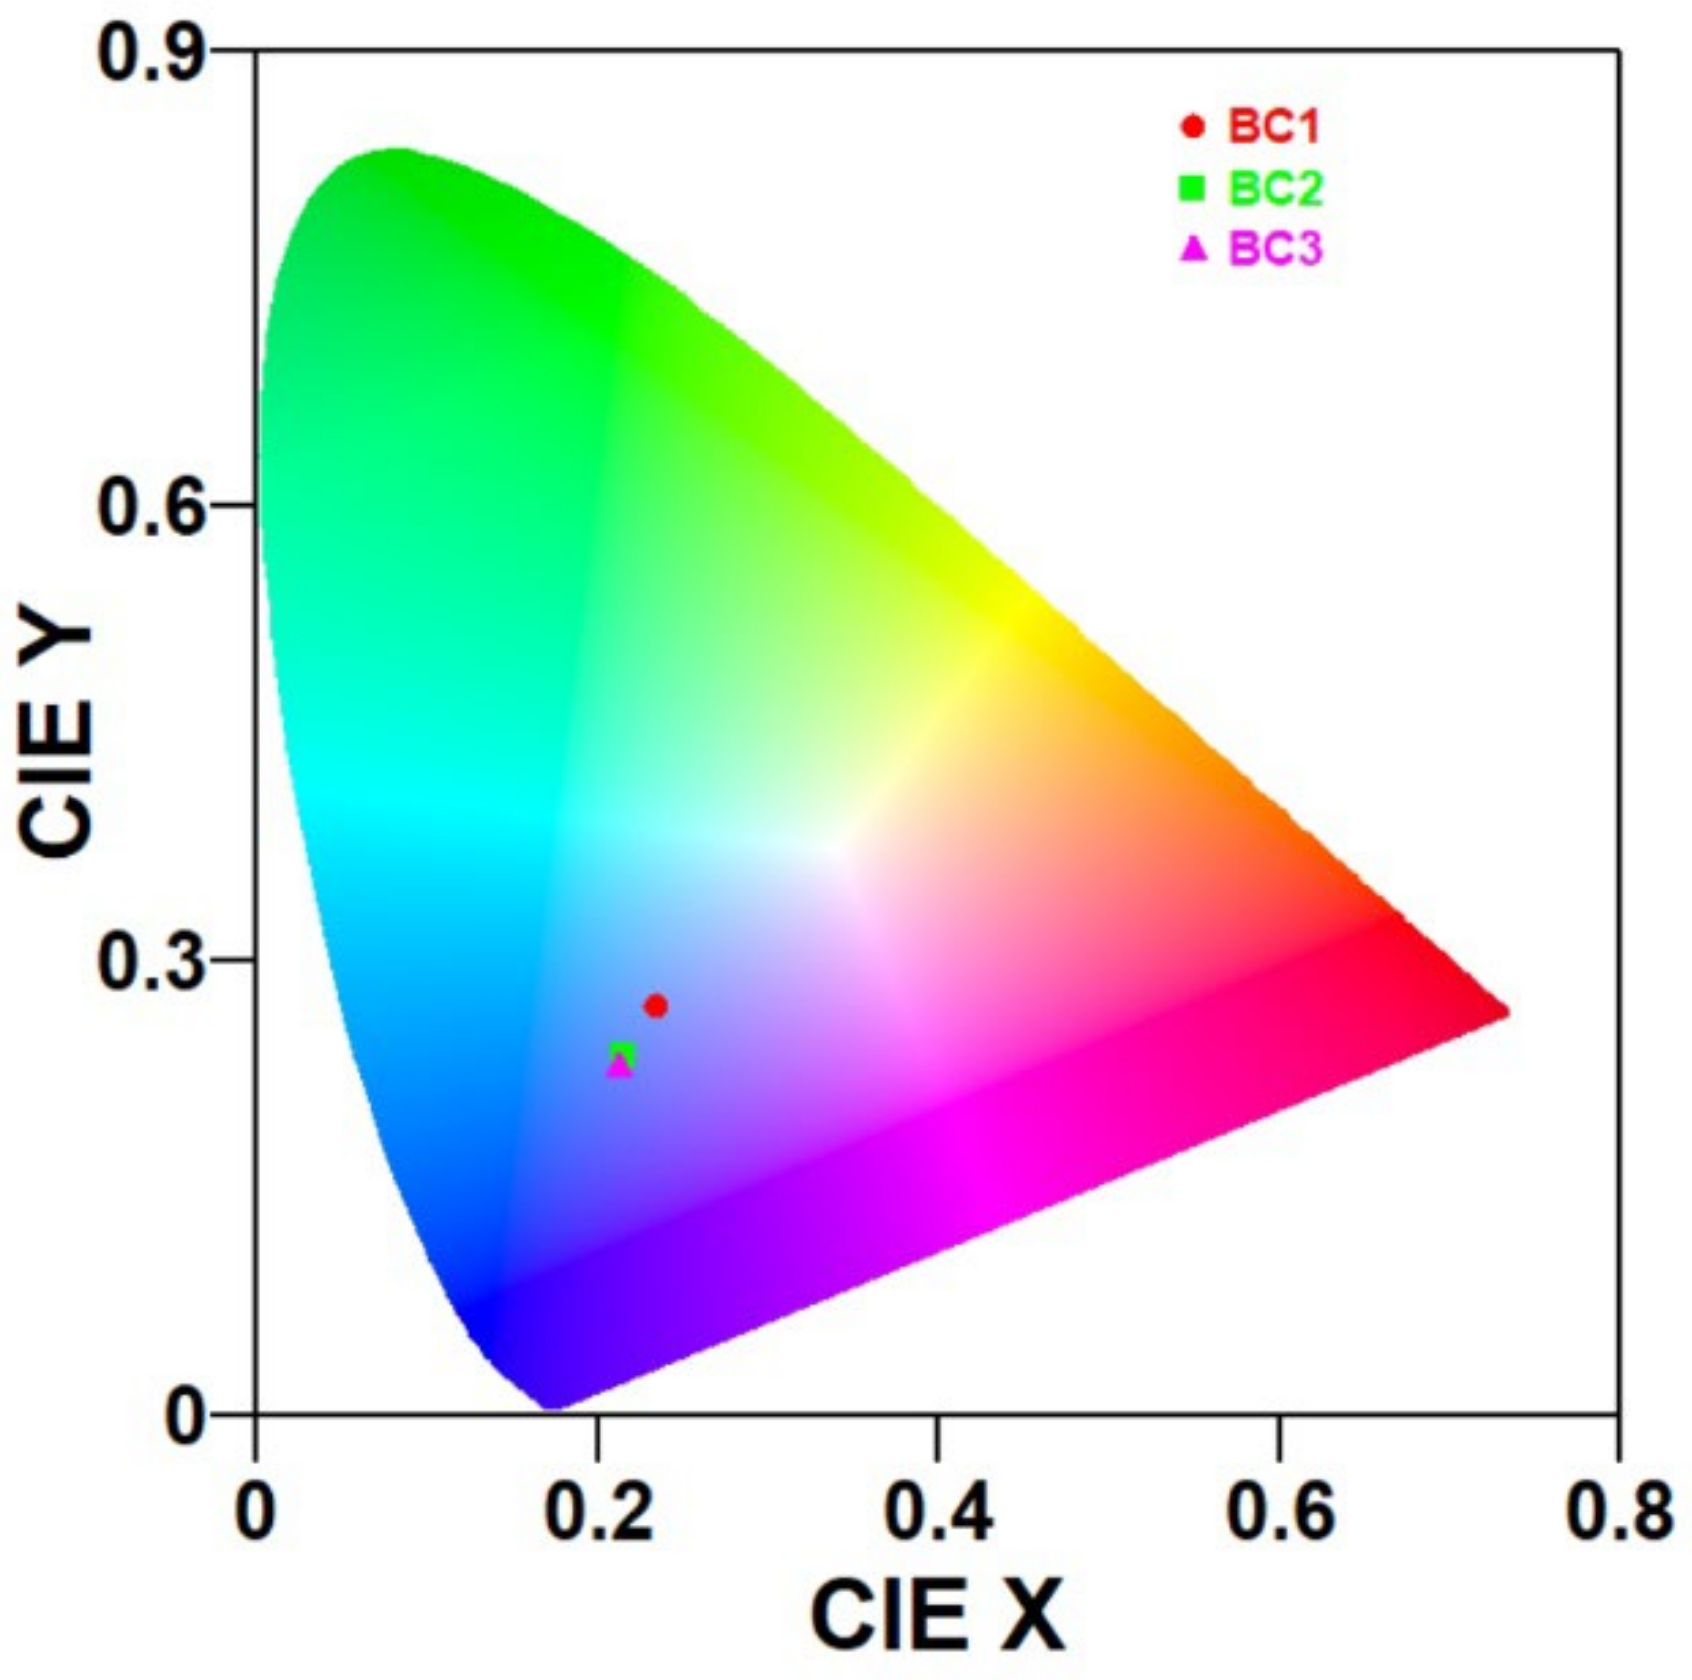
Figure 5, it is observed that although the absorbance level increases from BC1 to BC2, the emission behaviour is just the opposite. The optical energy distribution in the emission spectrum can be understood from the power spectral analysis and the colour purities of the emissions from the CIE plot. The representative power spectrum and CIE plot corresponding to the 350 nm excitation are shown in
Figure 7 and
Figure 8, respectively. The samples BC1, BC2, and BC3 exhibited emissions in the blue region with colour purities of 38.5%, 48.5%, and 50.1%, respectively. From the PL analyses, it can be inferred that more energy was dissipated by non-radiative deexcitation, raising the system enthalpy. The change in enthalpy can help with the biological activity of the sample, which is understood from the antimicrobial studies.
Antibacterial analysis helps determine the biocomposite’s potential to inhibit or reduce the growth of bacteria, providing valuable information for applications in fields such as medical devices and food packaging. In the present study, the antibacterial properties of the biocomposites against the Gram-negative
Staphylococcus aureus and Gram-positive
Pseudomonas aeruginosa were investigated. It is well known that
Pseudomonas aeruginosa [
30,
31,
32] causes severe infections in immunocompromised individuals, leading to conditions such as pneumonia, urinary tract infections, and bloodstream infections, and
Staphylococcus aureus [
31,
33] causes infections like streptococcal infections (e.g., strep throat, scarlet fever), Clostridium difficile infections, listeriosis, enterococcal infections, diphtheria, anthrax, and tetanus. Both bacteria are capable of forming biofilms, which are slimy layers of microorganisms embedded in an extracellular matrix. Biofilms on packaging materials can create an environment for other microorganisms to thrive, leading to the deterioration of the material and potentially affecting the integrity of the packaging [
34].
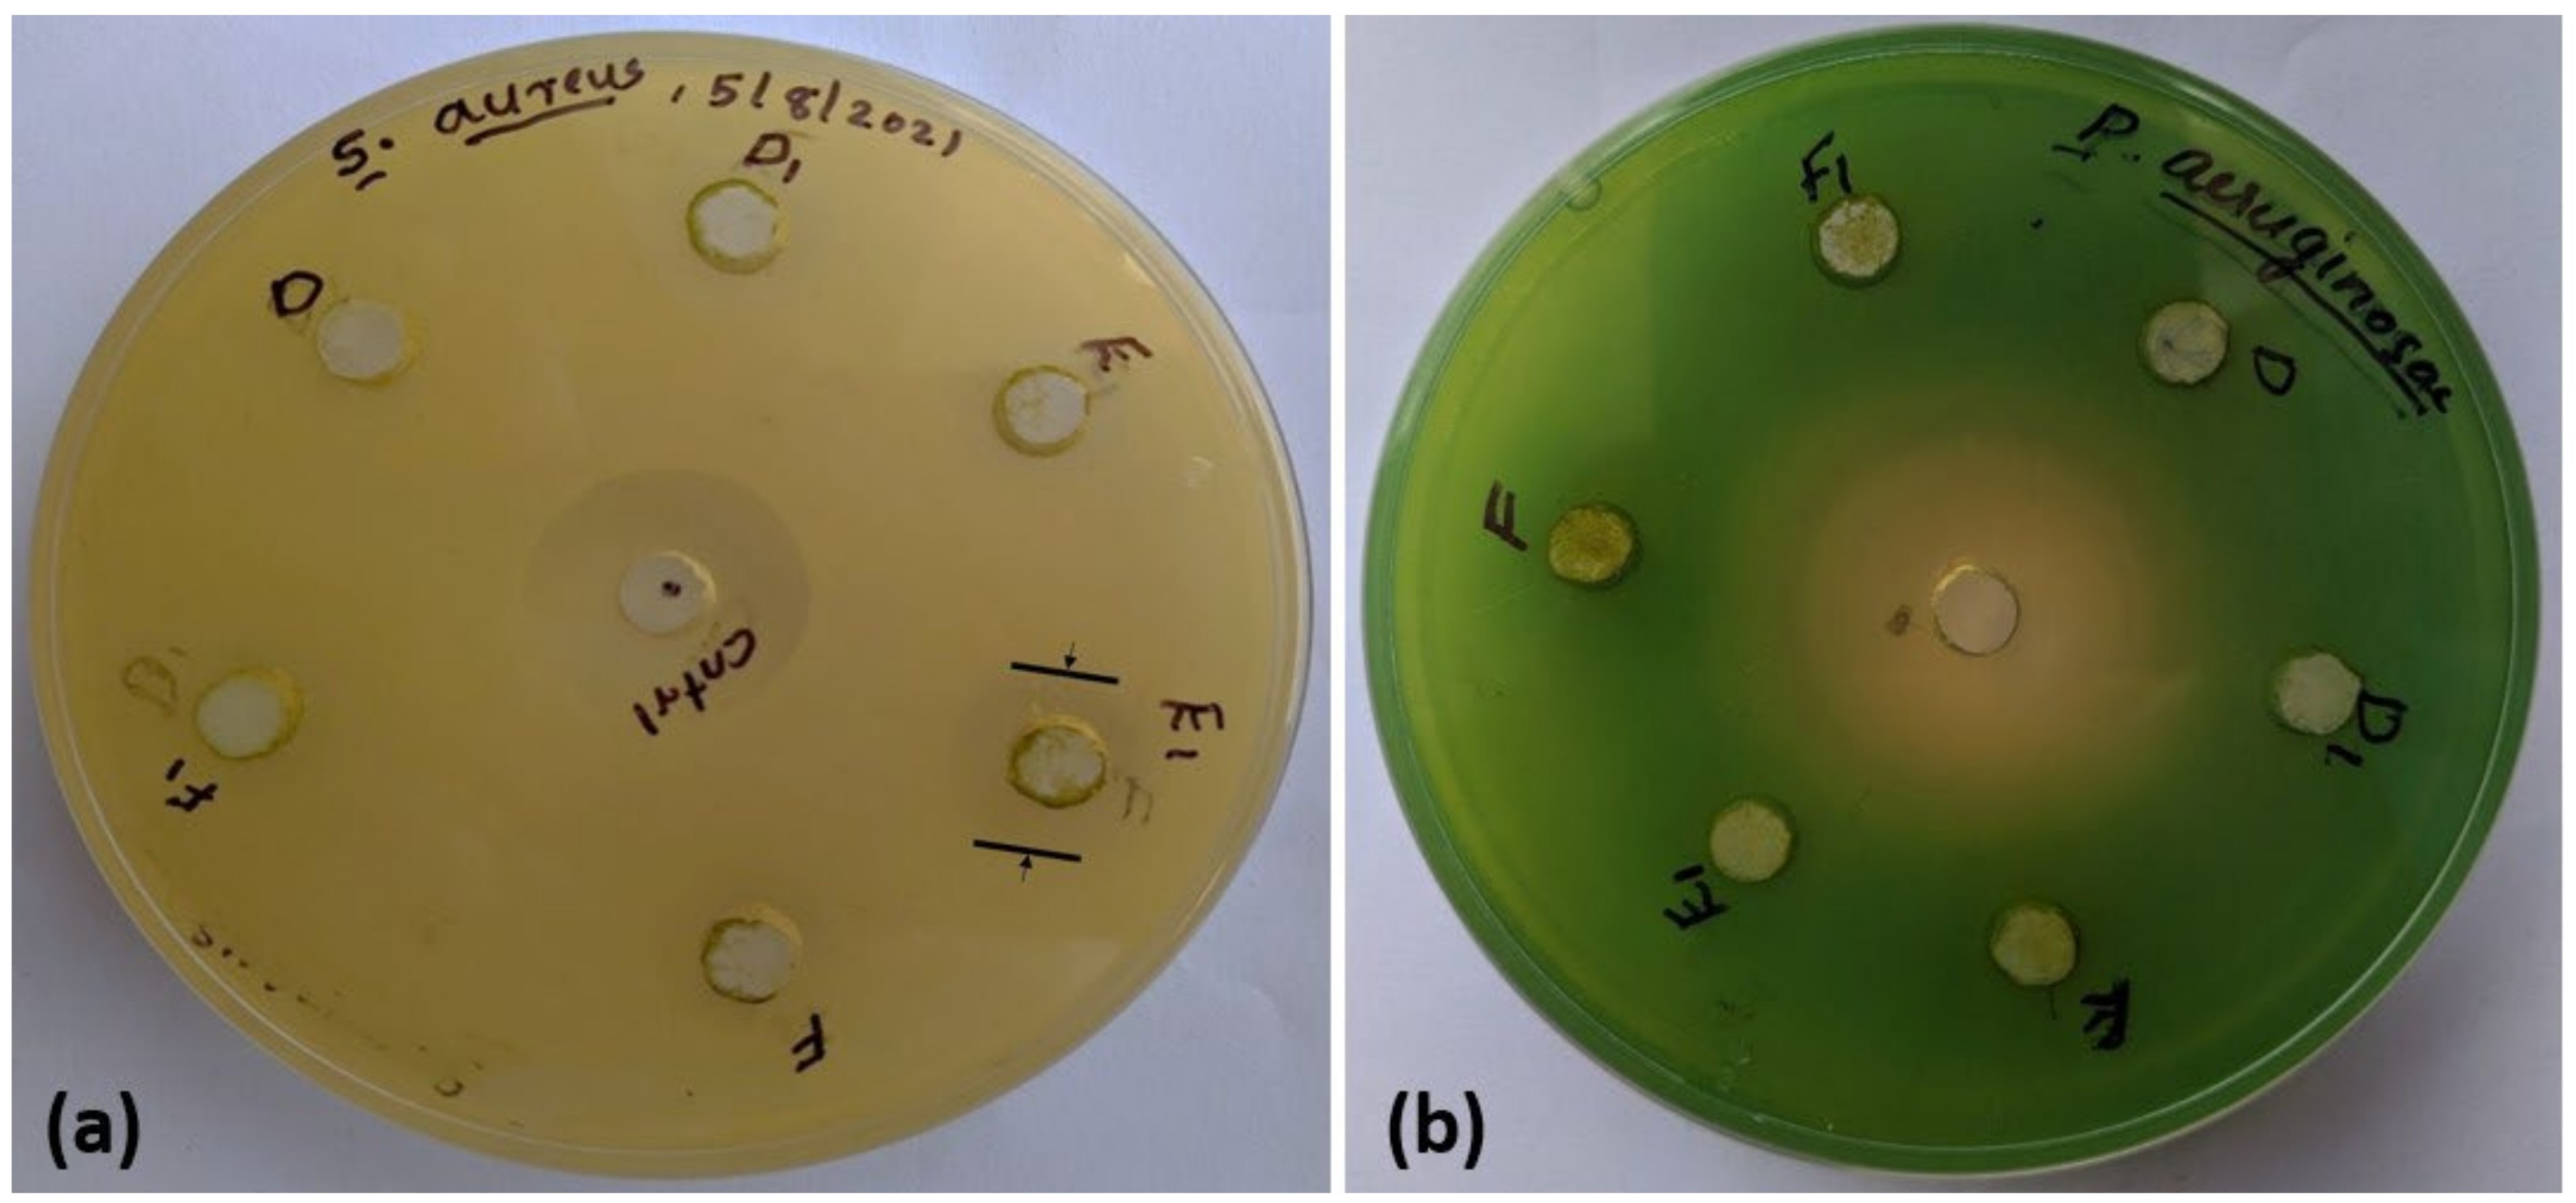
The agar-well diffusion method was employed to assess the samples’ antibacterial efficacies against both Gram-positive (
Pseudomonas aeruginosa) and Gram-negative (
Staphylococcus aureus) bacteria. Petri plates, each having 20 mL of Muller Hinton Agar Medium, were inoculated with cultures of Gram-negative and Gram-positive bacteria. The bacterial cultures were adjusted based on the McFarland Standard. Wells, approximately 10 mm in diameter, were created using a well cutter, and two different concentrations of the sample (1 μg/μL and 4 μg/μL) were introduced into two different wells. Subsequently, the Petri plates were incubated at 37 °C for 24 h. During this incubation period, the antimicrobial components from the samples diffuse into the medium and interact with the freshly seeded test organisms on the plates. The standard antibacterial agent streptomycin served as the positive control in this experiment. The resulting zones of inhibition exhibited a uniform circular pattern due to the confluent lawn of bacterial growth. The antibacterial activity was quantified by measuring the inhibition zone’s diameter surrounding each well, representing the bacterial resistance to the antimicrobial agent. A larger zone generally indicates greater susceptibility, while a smaller or absent zone may suggest resistance. The interpretation of the results was based on established guidelines and breakpoints provided by the European Committee on Antimicrobial Susceptibility Testing. The zones of inhibition against Staphylococcus aureus and Pseudomonas aeruginosa are displayed in
Figure 9a and 9b respectively, and the zone diameters are shown in
Table 2. The higher concentration of BC2 shows the highest zone diameter, followed by the higher concentration of BC1. The packaging developed using this biocomposite is resistant to Staphylococcus aureus infections. The negative results observed for all samples against Gram-negative bacteria could be attributed to their more intricate cell wall structure than that of Gram-positive bacteria. Their cell walls consist of a thin peptidoglycan layer surrounded by an outer membrane. This outer membrane contains lipopolysaccharides, which are important for the pathogenicity of many Gram-negative bacteria. This is why Gram-negative bacteria exhibit greater resistance than Gram-positive bacteria [
35]. From the literature [
36,
37], it can be seen that the FTIR spectra of materials exhibiting antibacterial properties show peaks corresponding to the N-H, C=O, and C=C, vibrational modes. The antibacterial properties exhibited by the biocomposites can be attributed to the presence of these bonds observed in the FTIR spectra shown in
Figure 4.
The antibacterial action in a biocomposite containing TS, FS, and SW results from the combined effects of their individual antimicrobial properties. Tapioca starch, acting as a matrix, facilitates the dispersion and release of antimicrobial agents from the other components. Flax seed gel contributes bioactive compounds [
38], such as polyphenols and lignans, which can disrupt bacterial cell walls and membranes. With its flavonoids, alkaloids, and tannins, Siam weed extract [
19] further enhances the antibacterial activity by potentially interfering with bacterial enzymes and DNA replication. The synergistic effects of these components, along with the physical properties of the biocomposite, create a formulation that may effectively inhibit bacterial growth and provide a promising avenue for antibacterial applications.
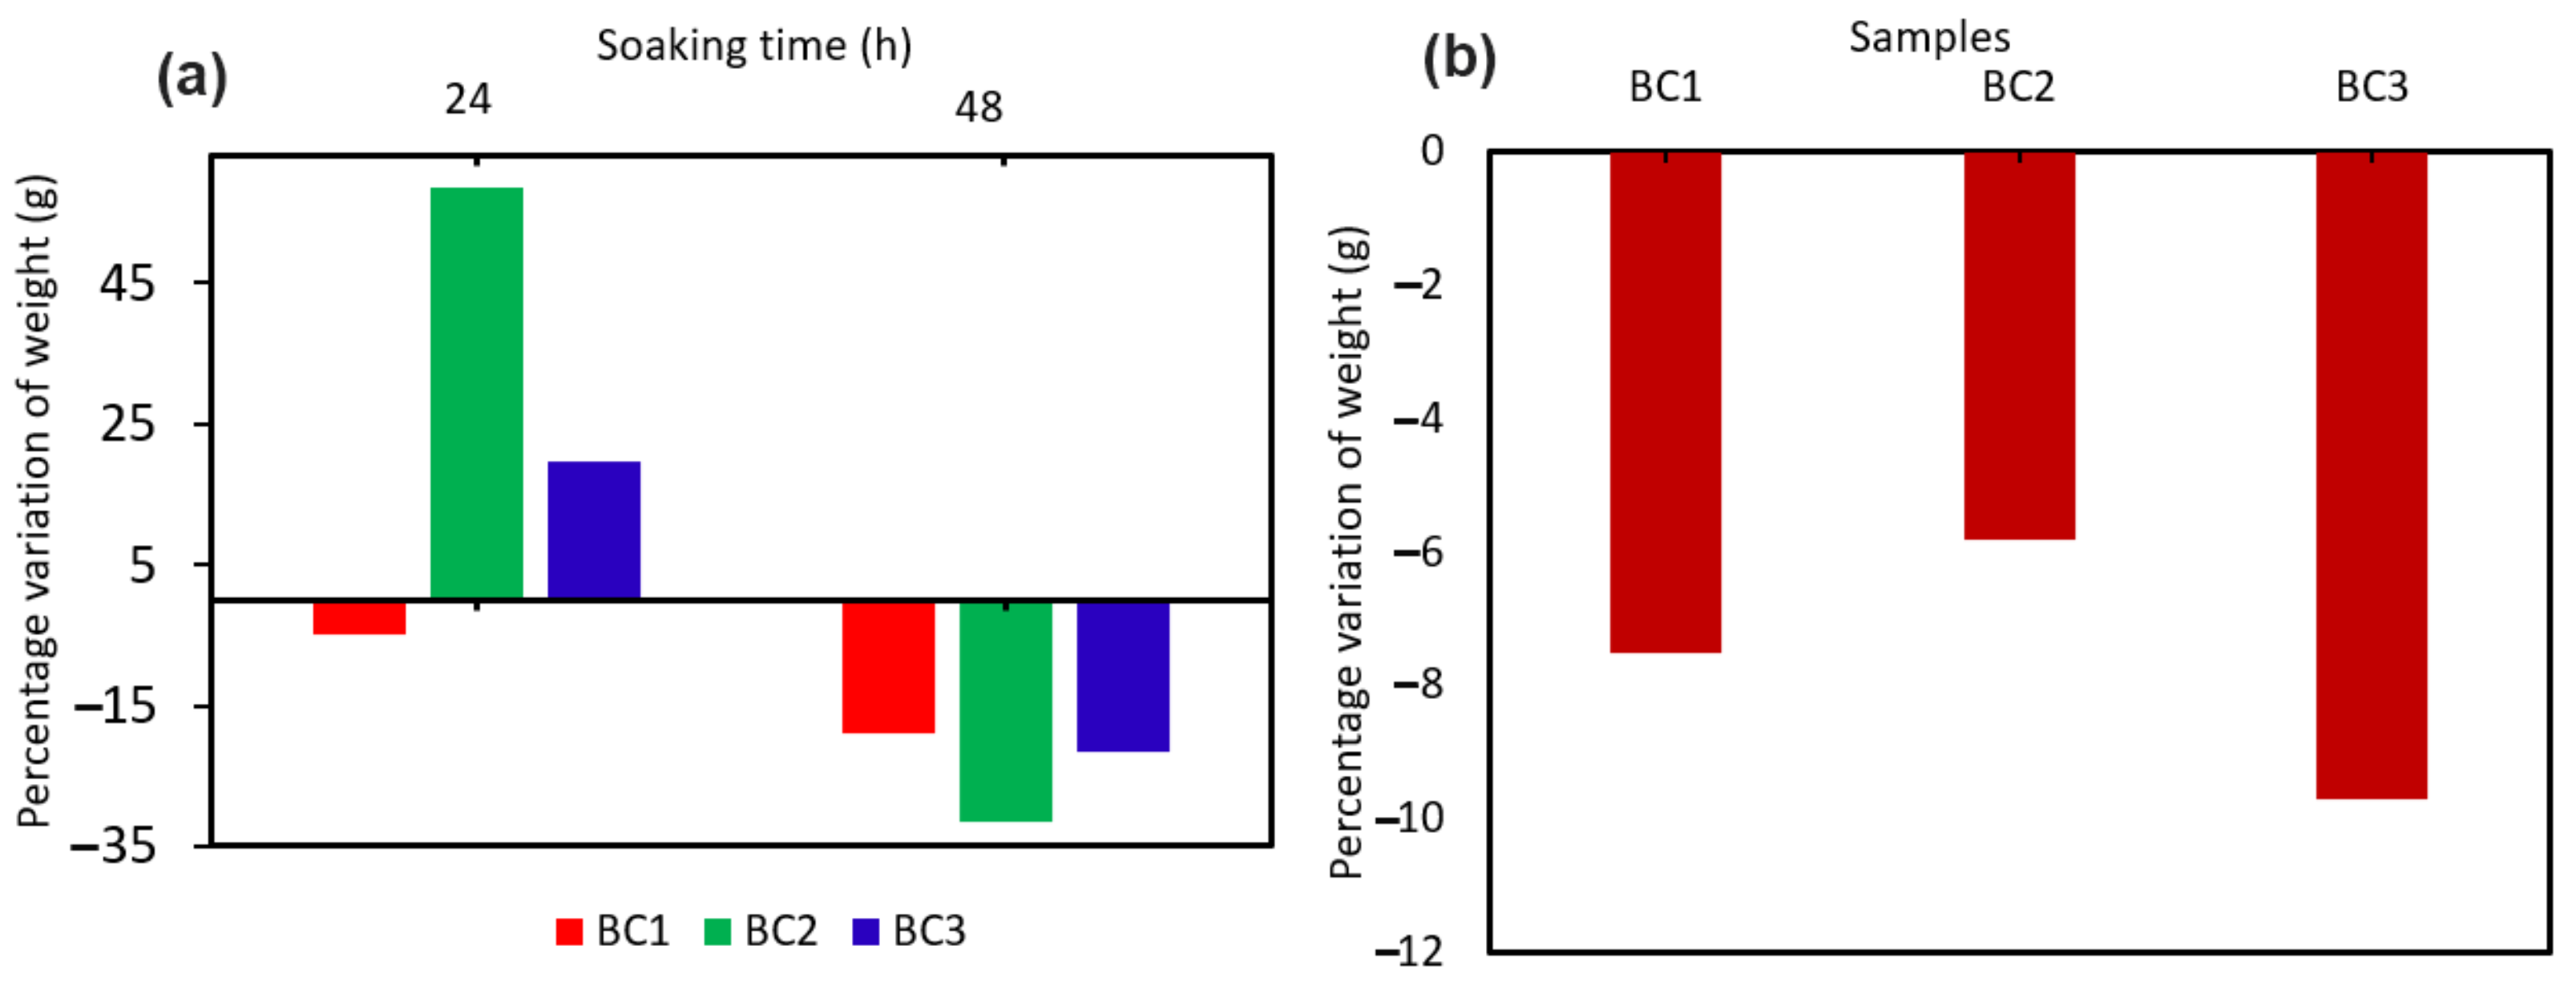
The water solubilities of the samples were studied by immersing them in water for 24 h and 48 h, and the process was repeated seven times. The percentage variation in the weights for the biocomposites is shown in
Figure 10a. The water solubility study of biocomposites holds significant importance due to its implications across various fields. This analysis is crucial for assessing the environmental impact and biodegradability of biocomposites and provides insights into their behaviour in moist or wet conditions. The study helps understand bioactive compounds’ release kinetics, influencing applications in drug delivery, agriculture, and food packaging. Additionally, it serves as a quality control measure during manufacturing, ensuring consistent properties and reliability. In biomedical and agricultural applications, knowledge of the water solubility of a material is vital for evaluating its safety and predicting its lifespan in specific environments.
Figure 10a shows that the BC2 and BC3 samples remained insoluble for up to 24 h, indicated by the positive percentage variation in their weights. However, all three samples showed weight loss after 48 h of immersion in water. It is worth noting that the maximum weight loss percentage was only 31.4% after 48 h of immersion in water. Hence, the samples can exhibit good stability against atmospheric humidity variation when they are used for packaging.
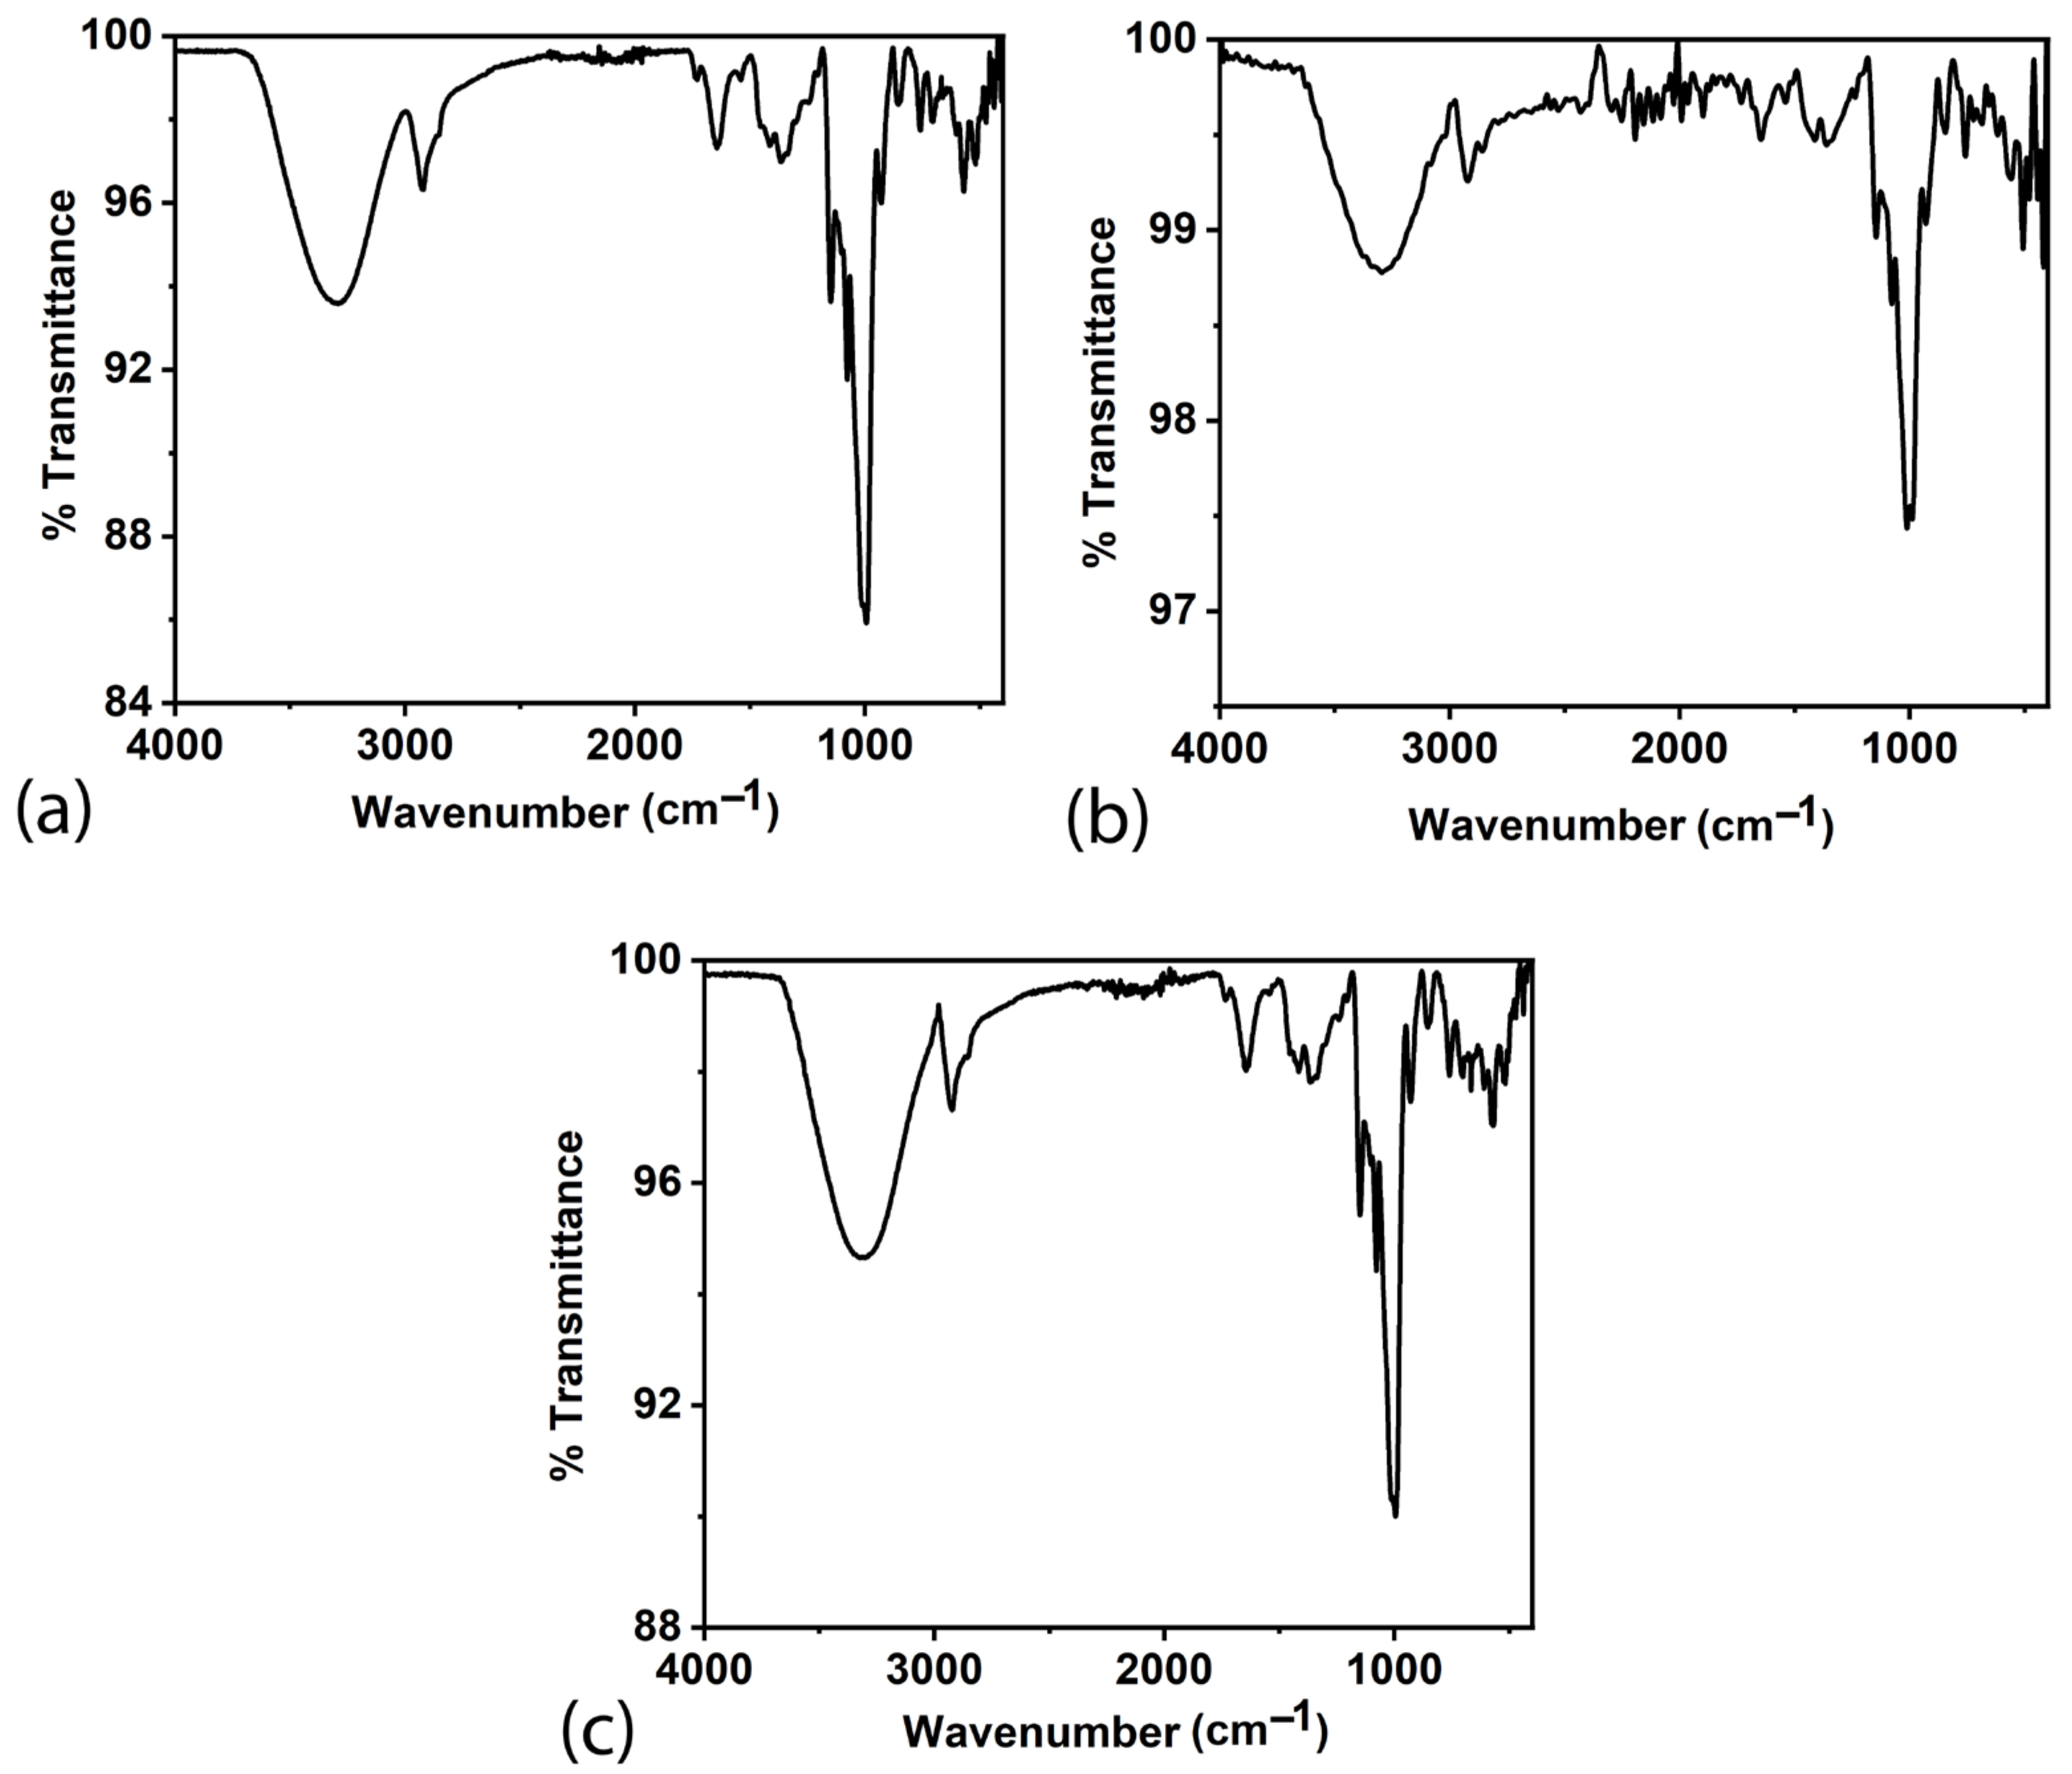
The temperature study of biocomposites is pivotal for optimising manufacturing processes, assessing the thermal stability, and predicting the material performance. Understanding how biocomposites respond to temperature variations is crucial for ensuring the integrity of their structures and functional properties during processing and potential exposure to different environments. This knowledge informs the selection of appropriate materials for specific applications. Temperature studies enhance biocomposites’ overall reliability, durability, and efficiency. The samples, soaked for 48 h in water, were heated at 80 °C for 2 h in an air oven, and the percentage variation in the weights for the samples is shown in
Figure 10b. The study reveals that the weight loss was minimal (5.8%) for sample BC2, and the maximum weight loss obtained was only 9.8% for sample BC3. The study points to the thermal stability of the composites. To confirm that the biocomposites did not undergo any structure modifications, the FTIR spectra of the samples heated at 80 °C were recorded and are shown in
Figure 11. The spectra show no structure modifications, confirming the stability and suitability of the biocomposites for biopackaging.


 ,
, 


