1. Introduction
The most important factors in choosing the right robot are its accuracy and repeatability. Selecting a robot suitable for performing the envisioned task requires giving thought to all working properties of the robot, covering the entire range of its deployment. Path accuracy and path repeatability are important indicators of the accuracy of industrial robots. Errors that lead to poor positioning accuracy can be divided into two categories: geometric and non-geometric errors. Geometrical errors are most affected by a lack of calibration of the joint’s position, arm length, angular errors, and thermal deformations [
1]. A further issue is the economic aspect of the robot used. At the same time, it would be appropriate, in addition to economic indicators, to take into account other reasons for choosing a robot, for example, on the basis of a comprehensive comparison of multi-criteria decision making [
2]. Small firms lack the capital to procure a new, fully functioning robot to be safely deployed in a robotic application. That is why small enterprises are often indirectly forced to purchase an already-deployed robot, which necessitates its prior complete restructuring [
3].
The overall condition of the robot can be determined by measuring its working properties, which should then be evaluated in view of the suitability of the robot’s redeployment. The results of such an evaluation should facilitate the decision on the fitness of the robot to be redeployed, whether it has any speed constraints, whether such constraints should be introduced, or whether the operating load of the end-effector of the robot should be reduced [
4]. These measurements are subject to standardization, such as that of the international ISO 9283 standard. A standard represents individual working properties of industrial robots and the procedures for their proper measurement [
5]. These standards were developed in the wake of requirements of the robotic systems manufacturers that must satisfy the applicable directives.
Standards addressing the robotic systems and general properties are the following:
ISO 10218—robots and robotics devices—safety requirements for industrial robots [
6];
ISO 13482—robots and robotics devices—safety requirements for personal care robots [
7];
ISO 9283—manipulating industrial robots—performance criteria and related test methods [
5].
This study will take a closer look at the ISO 9283 standard, which sets out the path-accuracy measurements. High-performance industrial or collaborative robots are a commodity indispensable for the successful delivery of orders in the technological process. At present, many robotic systems manufacturers provide little or limited information on the working properties of their robots. In many aspects, we encounter only basic accuracy or repeatability information. Evaluating all working properties is taxing not only for the control unit of the robot itself but also in terms of data processing using a metrological apparatus, which is very expensive [
8].
Many metrological devices ensuring precise measurements of the end effector, thus harvesting the data needed, already exist. The principles on which these devices work vary. Nevertheless, they yield high-precision data [
9,
10]. The working properties of industrial robots are practically measured most frequently with devices based on laser interferometry, coordinate measuring devices, or the so-called telescopic ballbars. The most available universal machine for measuring the mentioned properties is the so-called coordinate measuring machine (CMM). This machine suffers from many disadvantages. For example, it can only make static measurements or calibration. That is why it is not very suitable for measuring the working properties of robots. The group of devices based on laser interferometry includes one from Renishaw XL-80, which is used for high-performance measuring and the calibration of moving systems. Despite this calibration of the laser speed and precision, it is not used in industrial robots. If it is used, then it is rather an exception [
11]. Another measuring technology is known as a telescopic ballbar, first introduced in 1982 and used in robotics ever since. Verification via a telescopic ballbar offers a relatively easy and fast check of CNC-machining machines positioning according to globally recognized ISO and ANSI standards [
12]. The ISO 230-1 standard mentions the ballbar as the regular tool, which made it the most frequently used tool for verifying the properties of not only industrial robots [
13,
14]. It offers troubleshooting that enables problem detection, thus making it possible to identify the source of error. Furthermore, many cheaper methods and tools can be found, such as positioning with a reference object in space (measuring cube or sphere) [
15]. In the future, it would be advisable, especially at already-installed robotic workplaces, to ensure the planning of the measurement path, even before the verification itself [
16]. This would make it possible to reduce costs related to workplace downtime.
2. Measuring System GEPARD by Raytec
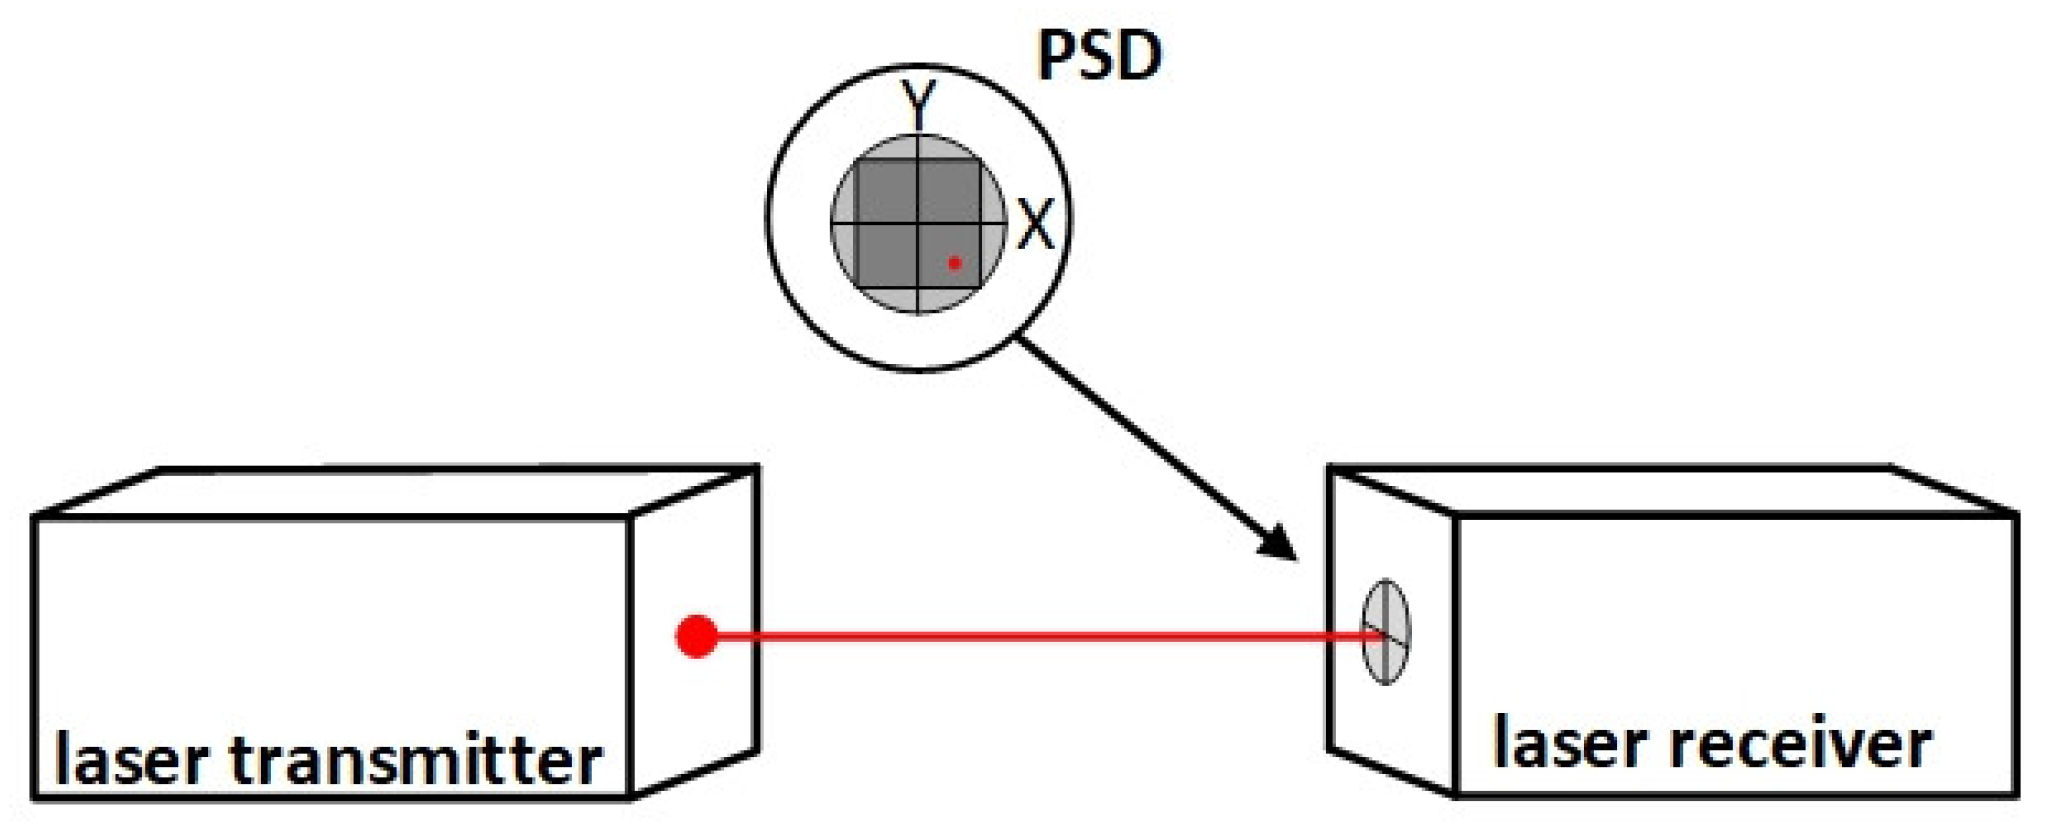
The GEPARD device is primarily used for measuring the linearity, parallelism, and perpendicularity of linear guides but also for measuring position deviations and coaxiality. It works with a laser beam as a reference standard for linearity. The device consists of a laser transmitter and a laser receiver. The laser beam is simply aimed parallel to the linear guide, targeting the laser receiver. The latter can detect subtle changes in the position of the incident beam on the receiving sensor in a very simple way. The linearity of the path is measured by moving the receiver along the linear trajectory and continuously measuring the beam deflections [
17].
Compared to conventional solutions, a huge advantage of the device is that it enables measuring deviations in both directions perpendicular to each other simultaneously, even in dynamic mode. This mode enables the user, for example, to align the guiding with the final curves being evaluated in real-time. A significant advantage is the wireless interconnection of all components. The laser receiver communicates with the computer through Bluetooth technology. Both the laser transmitter and the receiver are powered by batteries [
18]. The main part of the receiver is a sensitive position detection matrix (PSD) and the amplifying and evaluating electronics. The GEPARD (type 5) matrix is 10 mm × 10 mm in size. The laser beam hits the matrix through a ground opening, so the transverse range of measurement in the X- and Y-axes is 5 mm × 5 mm,
Figure 1. [
19].
To measure linearity, place the laser transmitter at the beginning of the measured guiding and guide the transmitter beam to target the laser receiver position sensor. To set the beam, use micrometric screws. In the software, select the position-measuring mode. In this mode, the area of the beam position sensor will appear on the personal computer screen, indicating the place where the beam falls. Using micrometric screws, we make the place of the beam incidence more precise, as close to the geometric center of the sensor as possible, in the range of the measured length [
20].
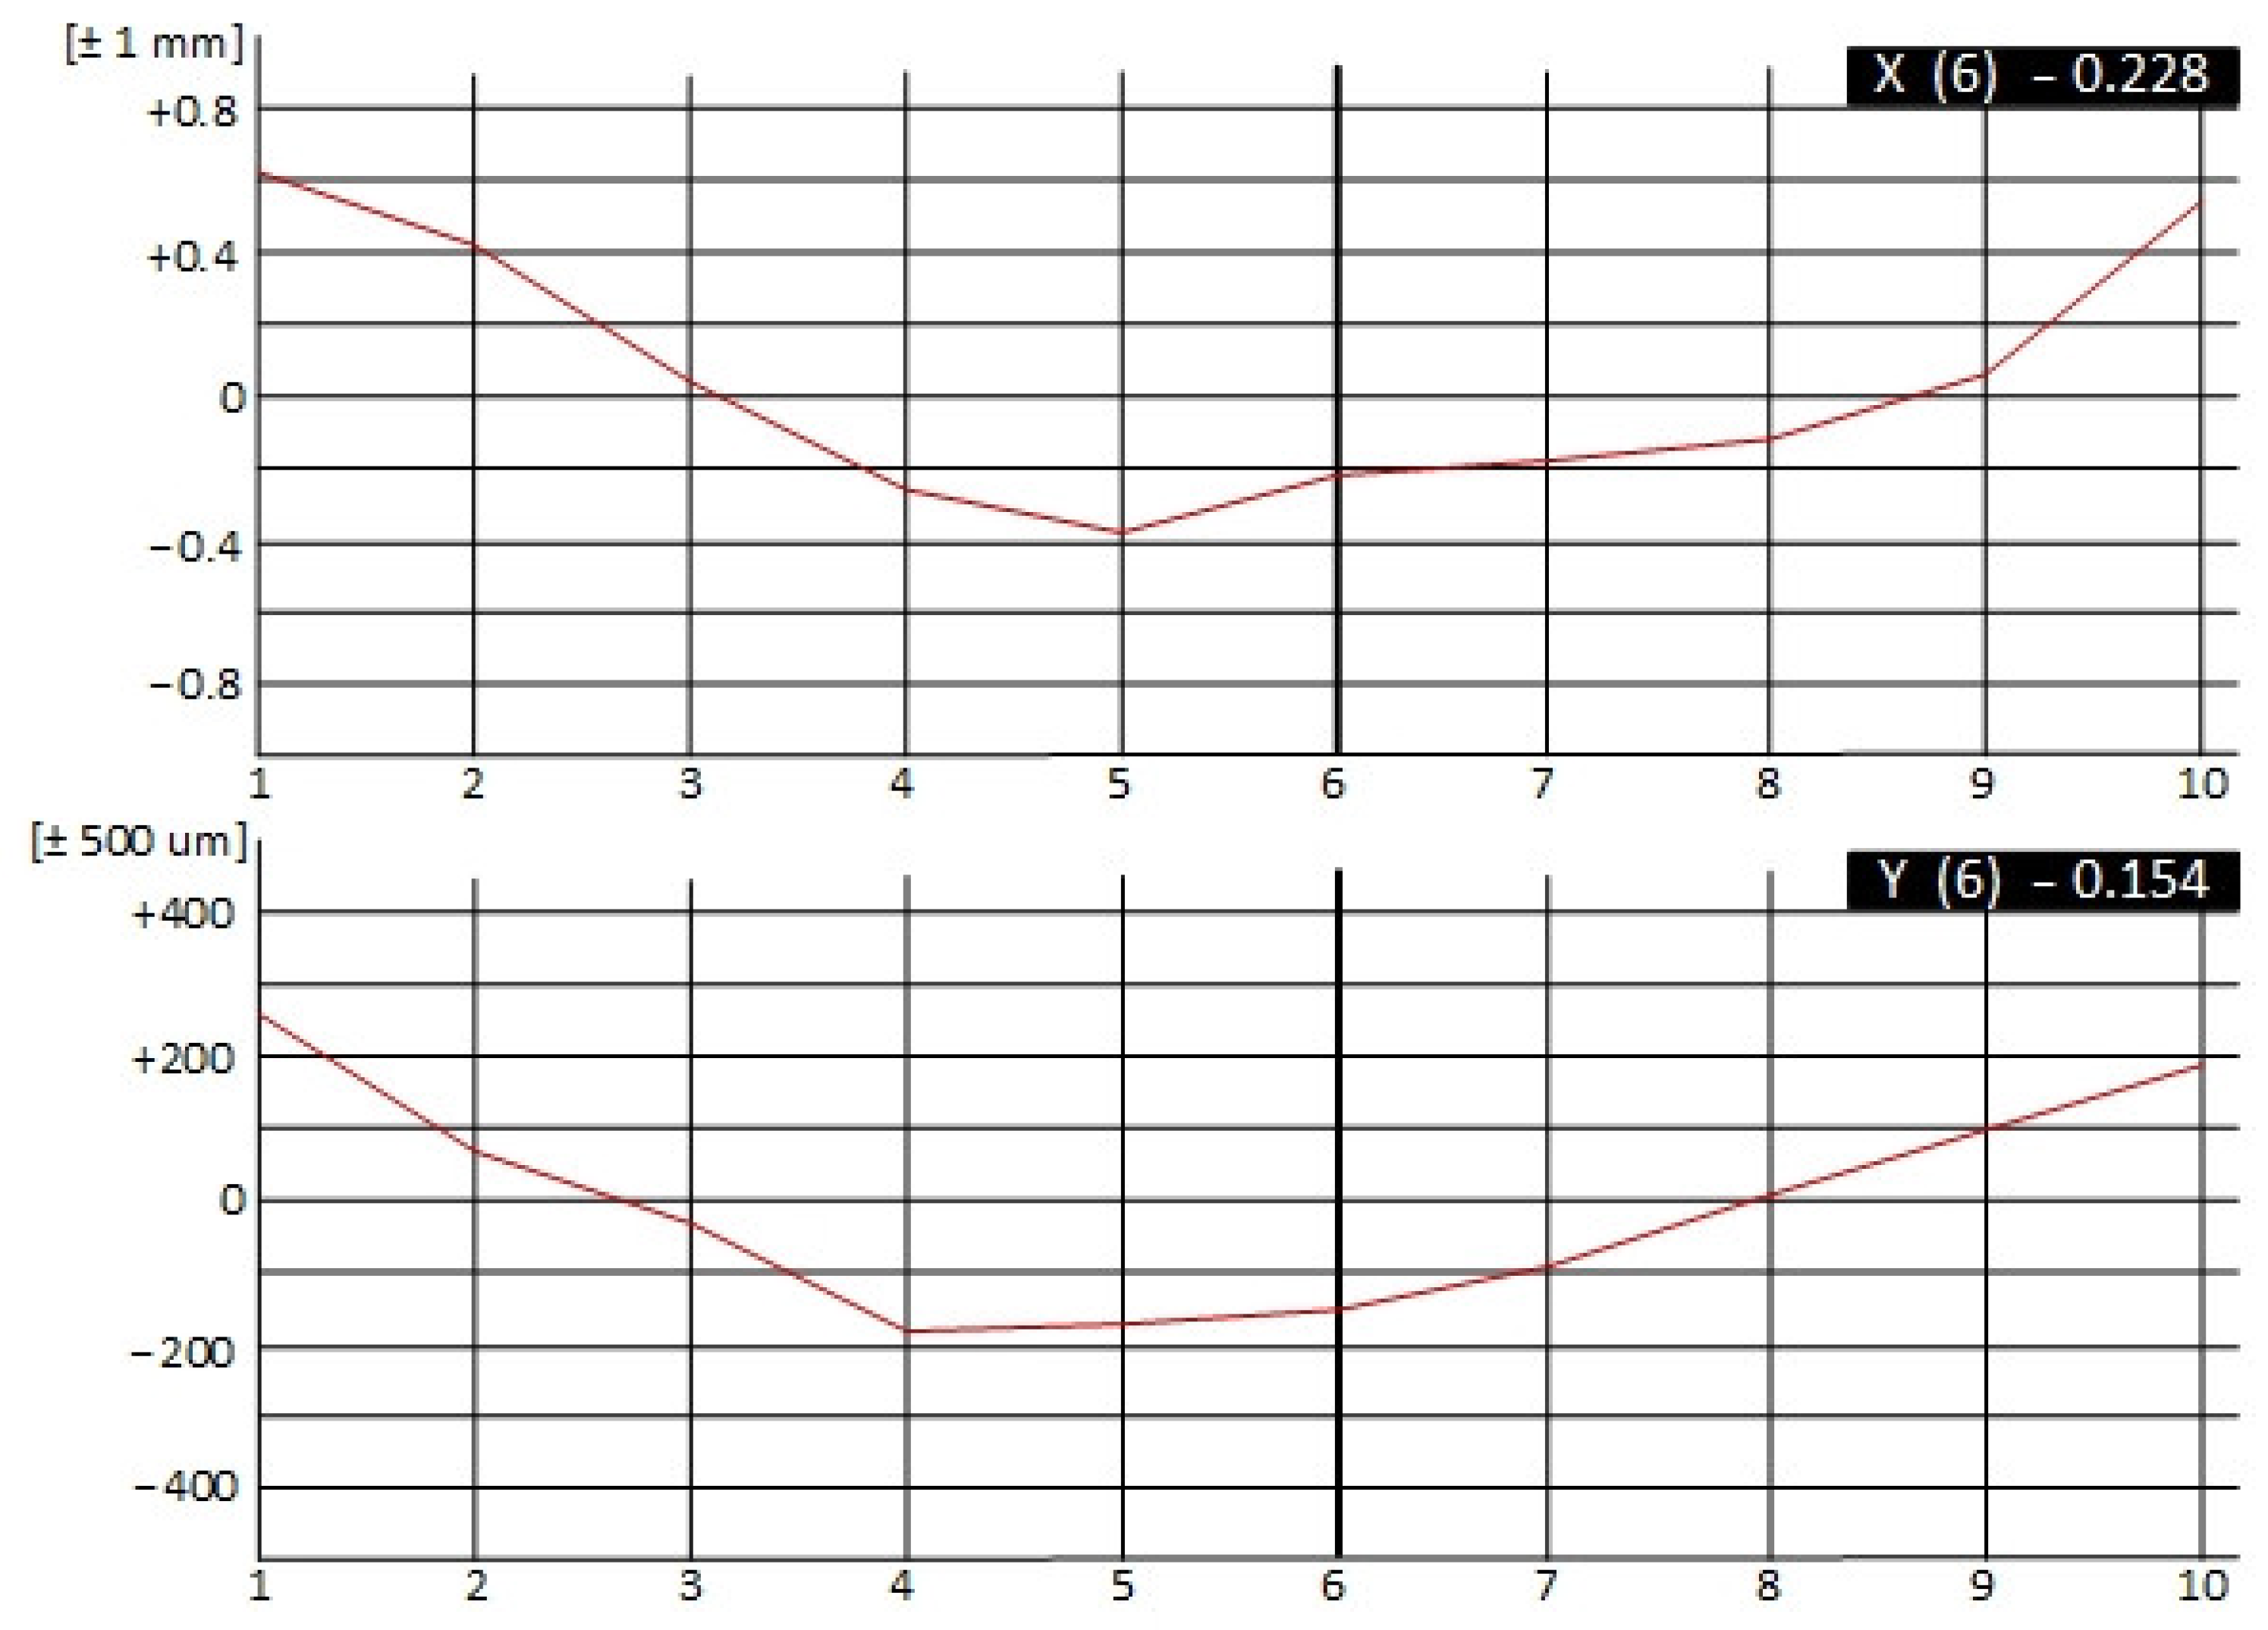
The laser receiver gradually moves along the measured path to selected points, and at each point, the position of the incident laser beam is measured in the x- and y-axes. The measured data appear on the computer screen and are plotted in two ready-made charts [
21], with axis x showing the receiver distances from the first measured point and axis y showing the measured deviations. The values measured on axis x are plotted in the first graph, and those measured on axis y in the second,
Figure 2 [
22].
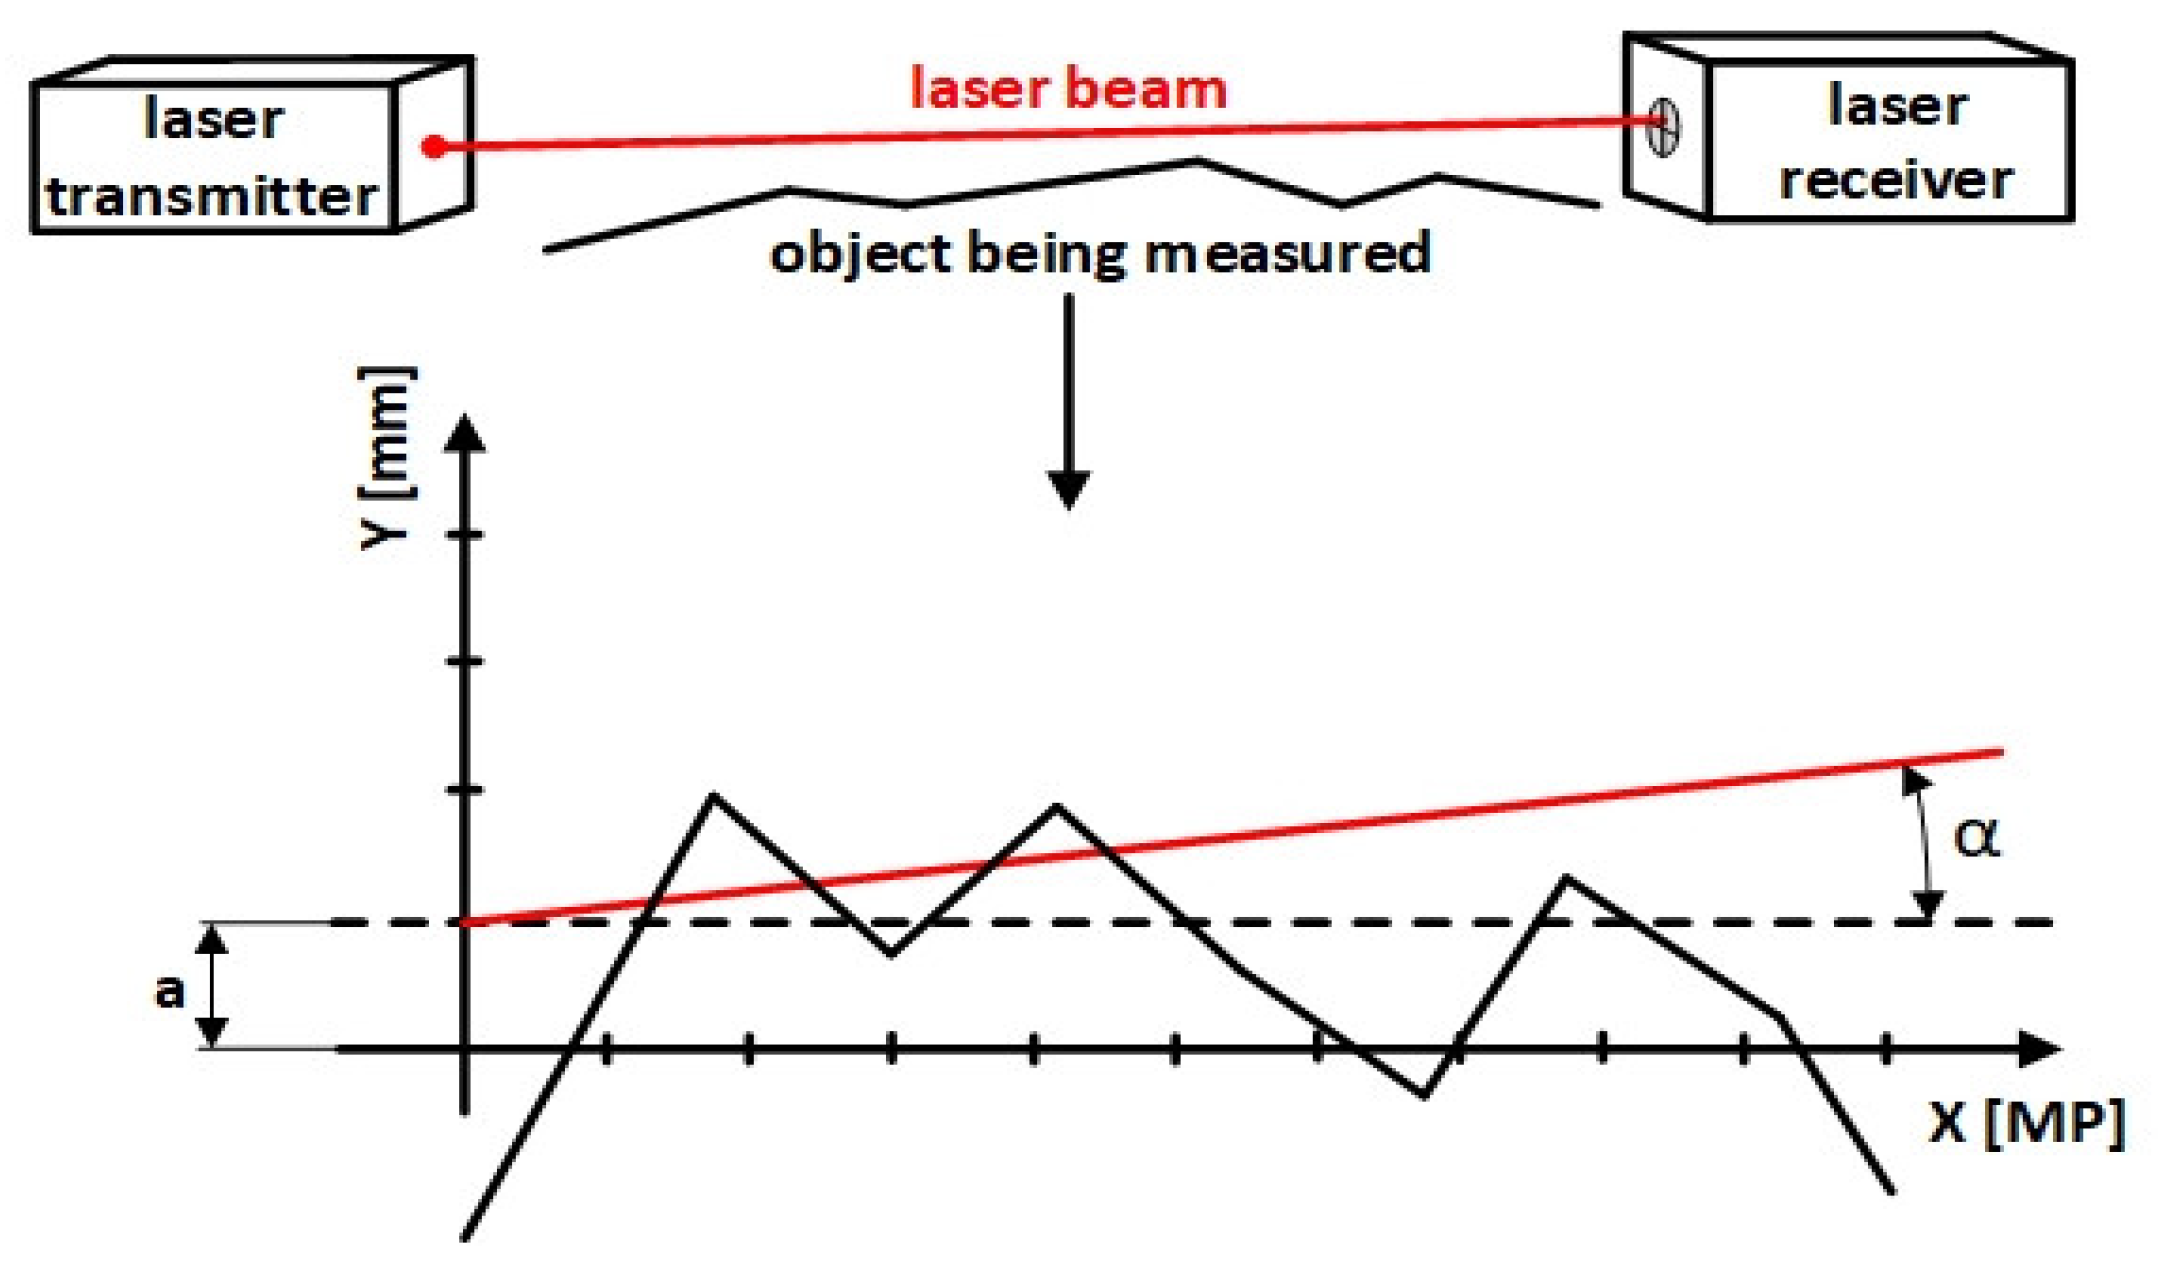
Using the least squares method, the software lays a straight line, which is called the regression line, over the measured points. The least squares method is a mathematical and statistical method of approximating pairs of measured data [
x;
y]. Approximation means the closest representation of the real value. The simplest case of using the least squares method is an approximation of the measured data using the straight line
ŷ = k
x + q. The resulting sum of the areas of all the squares must be the smallest possible:
Upon inserting the dependence function for the straight line, we obtain the following:
We are looking for the k and q factors so that all the Δ
yi deviations are the smallest possible. A criterion is that the sum of the second power of all deviations must have the least value. We use the second power to obtain a positive value. Thus, in terms of geometry, we deal with the square [
23].
For the user to see an exact deviation of lengthwise measurements from zero or the reference line, the individual measured values must be mathematically processed to compensate for deflection (a) and the tilt angle (α). In this way, the regression line becomes the “zero line” of the graph,
Figure 3.
An overview of the receiver and transmitter parameters of the measuring system GEPARD is shown in
Table 1.
3. Standardization ISO 9283—Path Accuracy
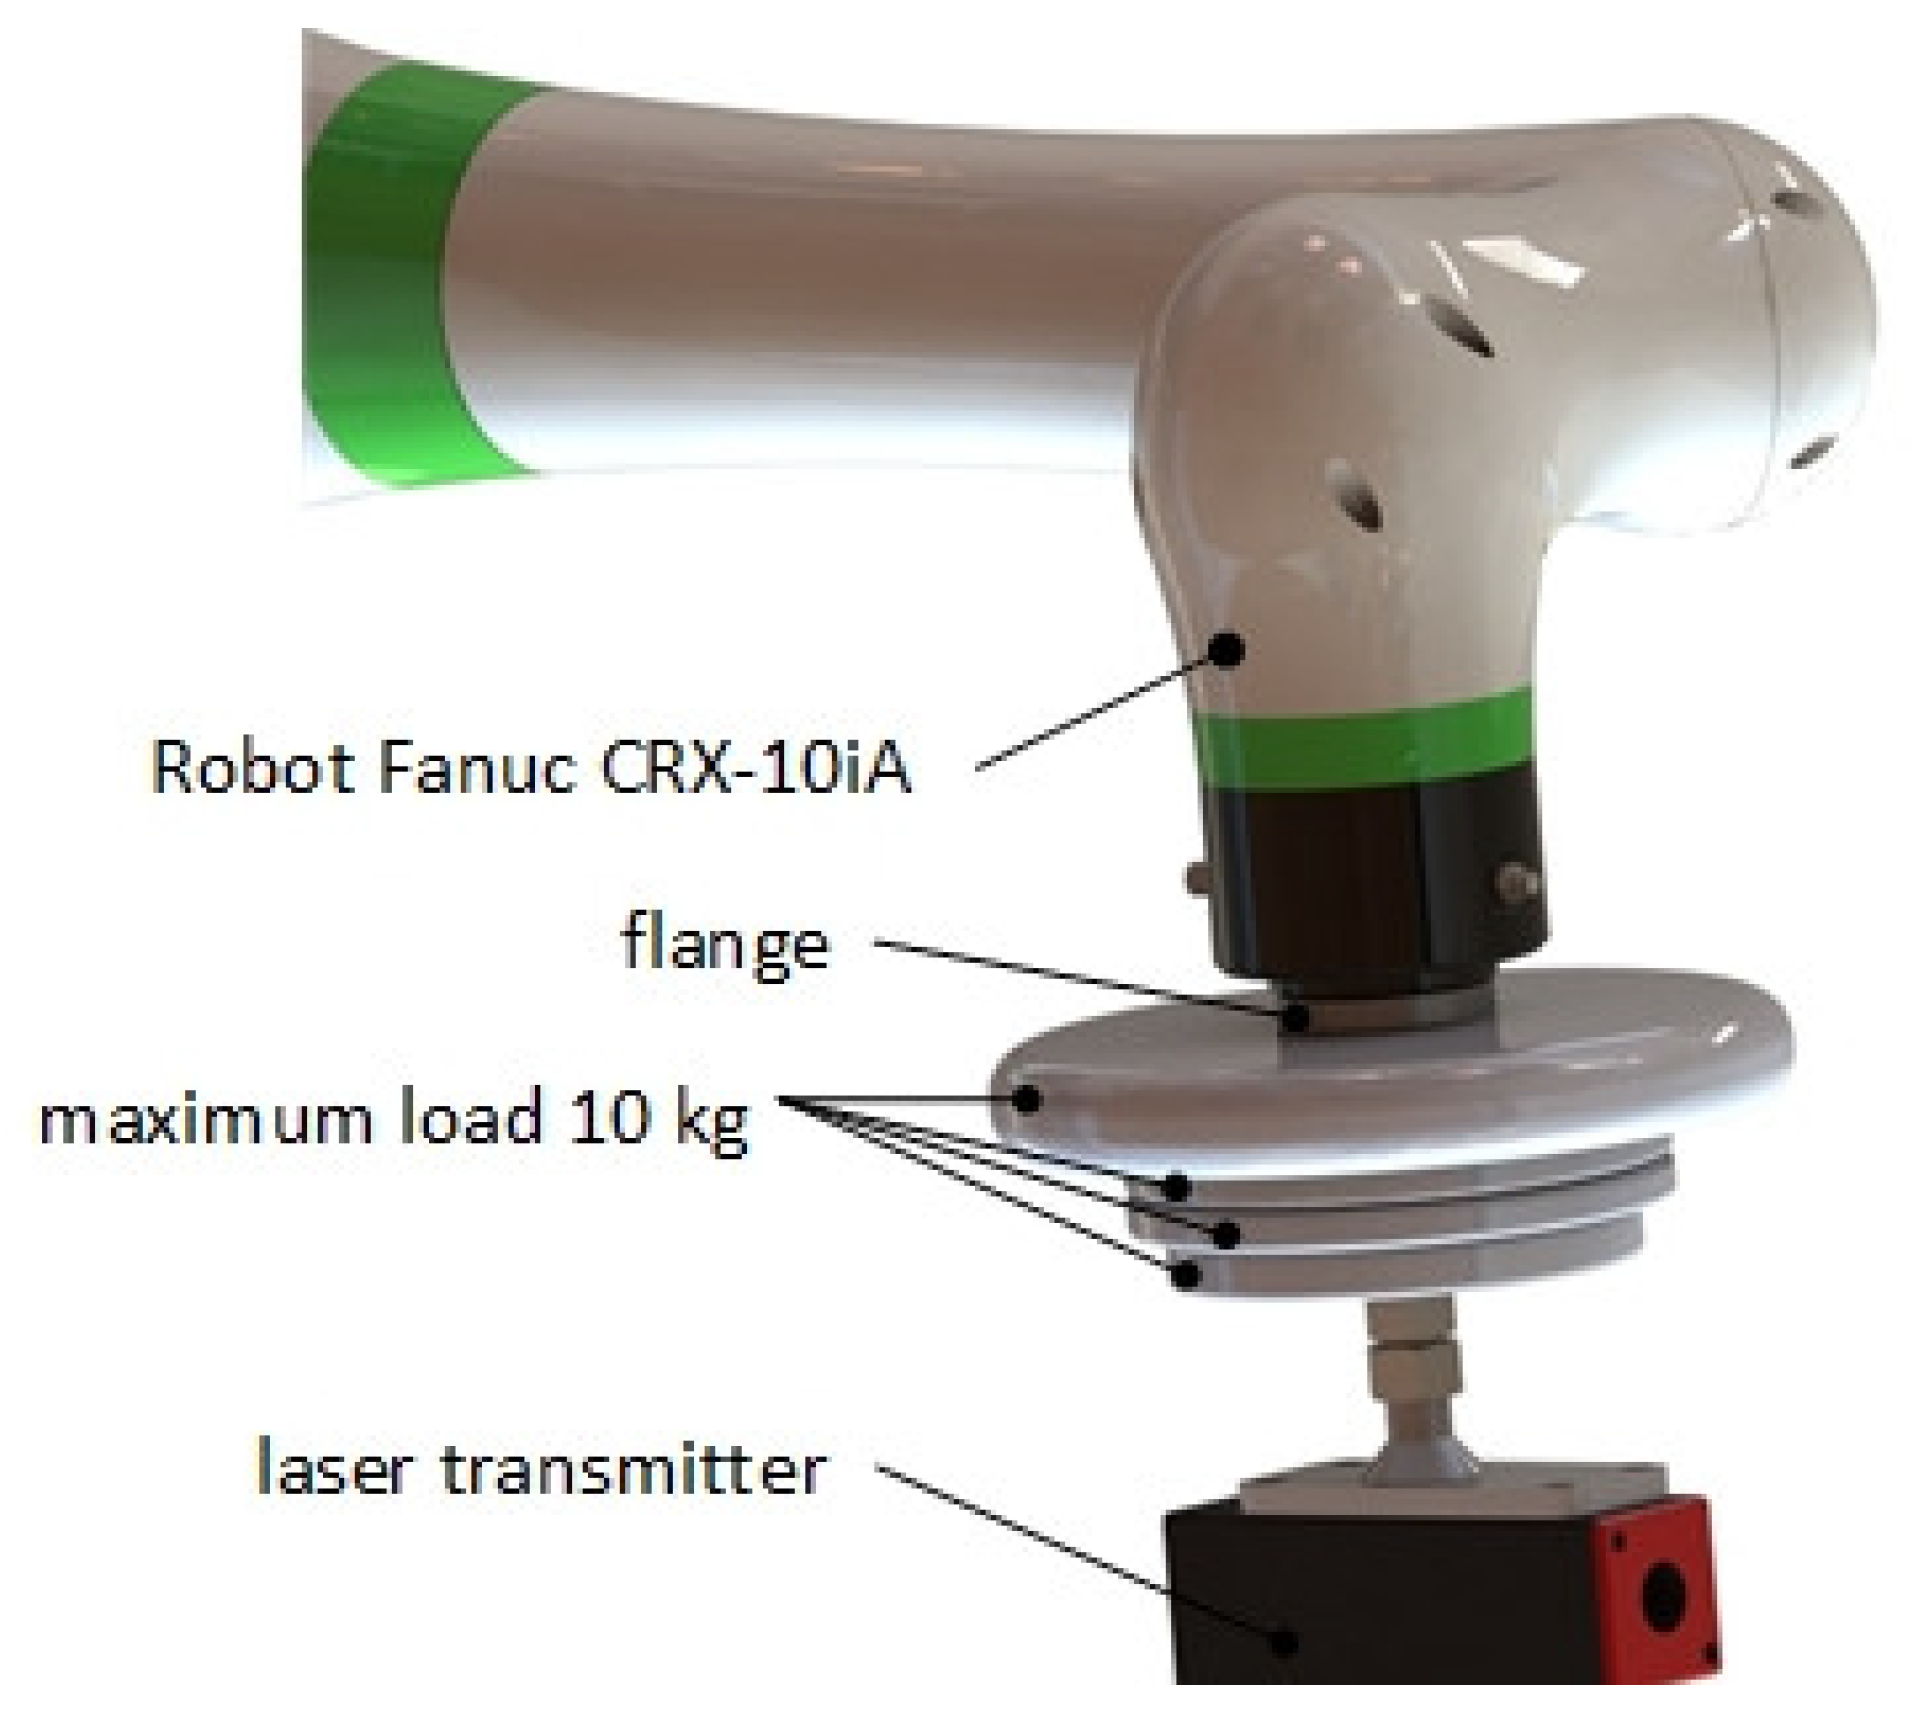
Conditions for conducting measurements must comply with the recommendations of the manufacturer, especially when it comes to installation. The robot should be functioning and installed correctly from the manufacturer’s point of view, and all its balancing should be appropriate. If a start-up phase is indicated, it should be performed. The standard sets the ambient temperature at 20 ± 2 °C or ranging between 5 and 40 °C. The measurements were performed at the ambient temperature of 20 °C on the collaborative robot FANUC CRX-10iA (Yamanashi, Japan) with a suitable control cabinet and a pendant. Verification was performed using a mechanical flange interface connected to the measuring device, with a maximum load of 10 kg. The measured path was set on a measuring plane as prescribed by the standard [
5,
24].
Definitions of the path accuracy and repeatability do not depend on the shape of the programmed path. Two examples of the programmed paths‘ different shapes are shown in
Figure 4 and
Figure 5 [
25].
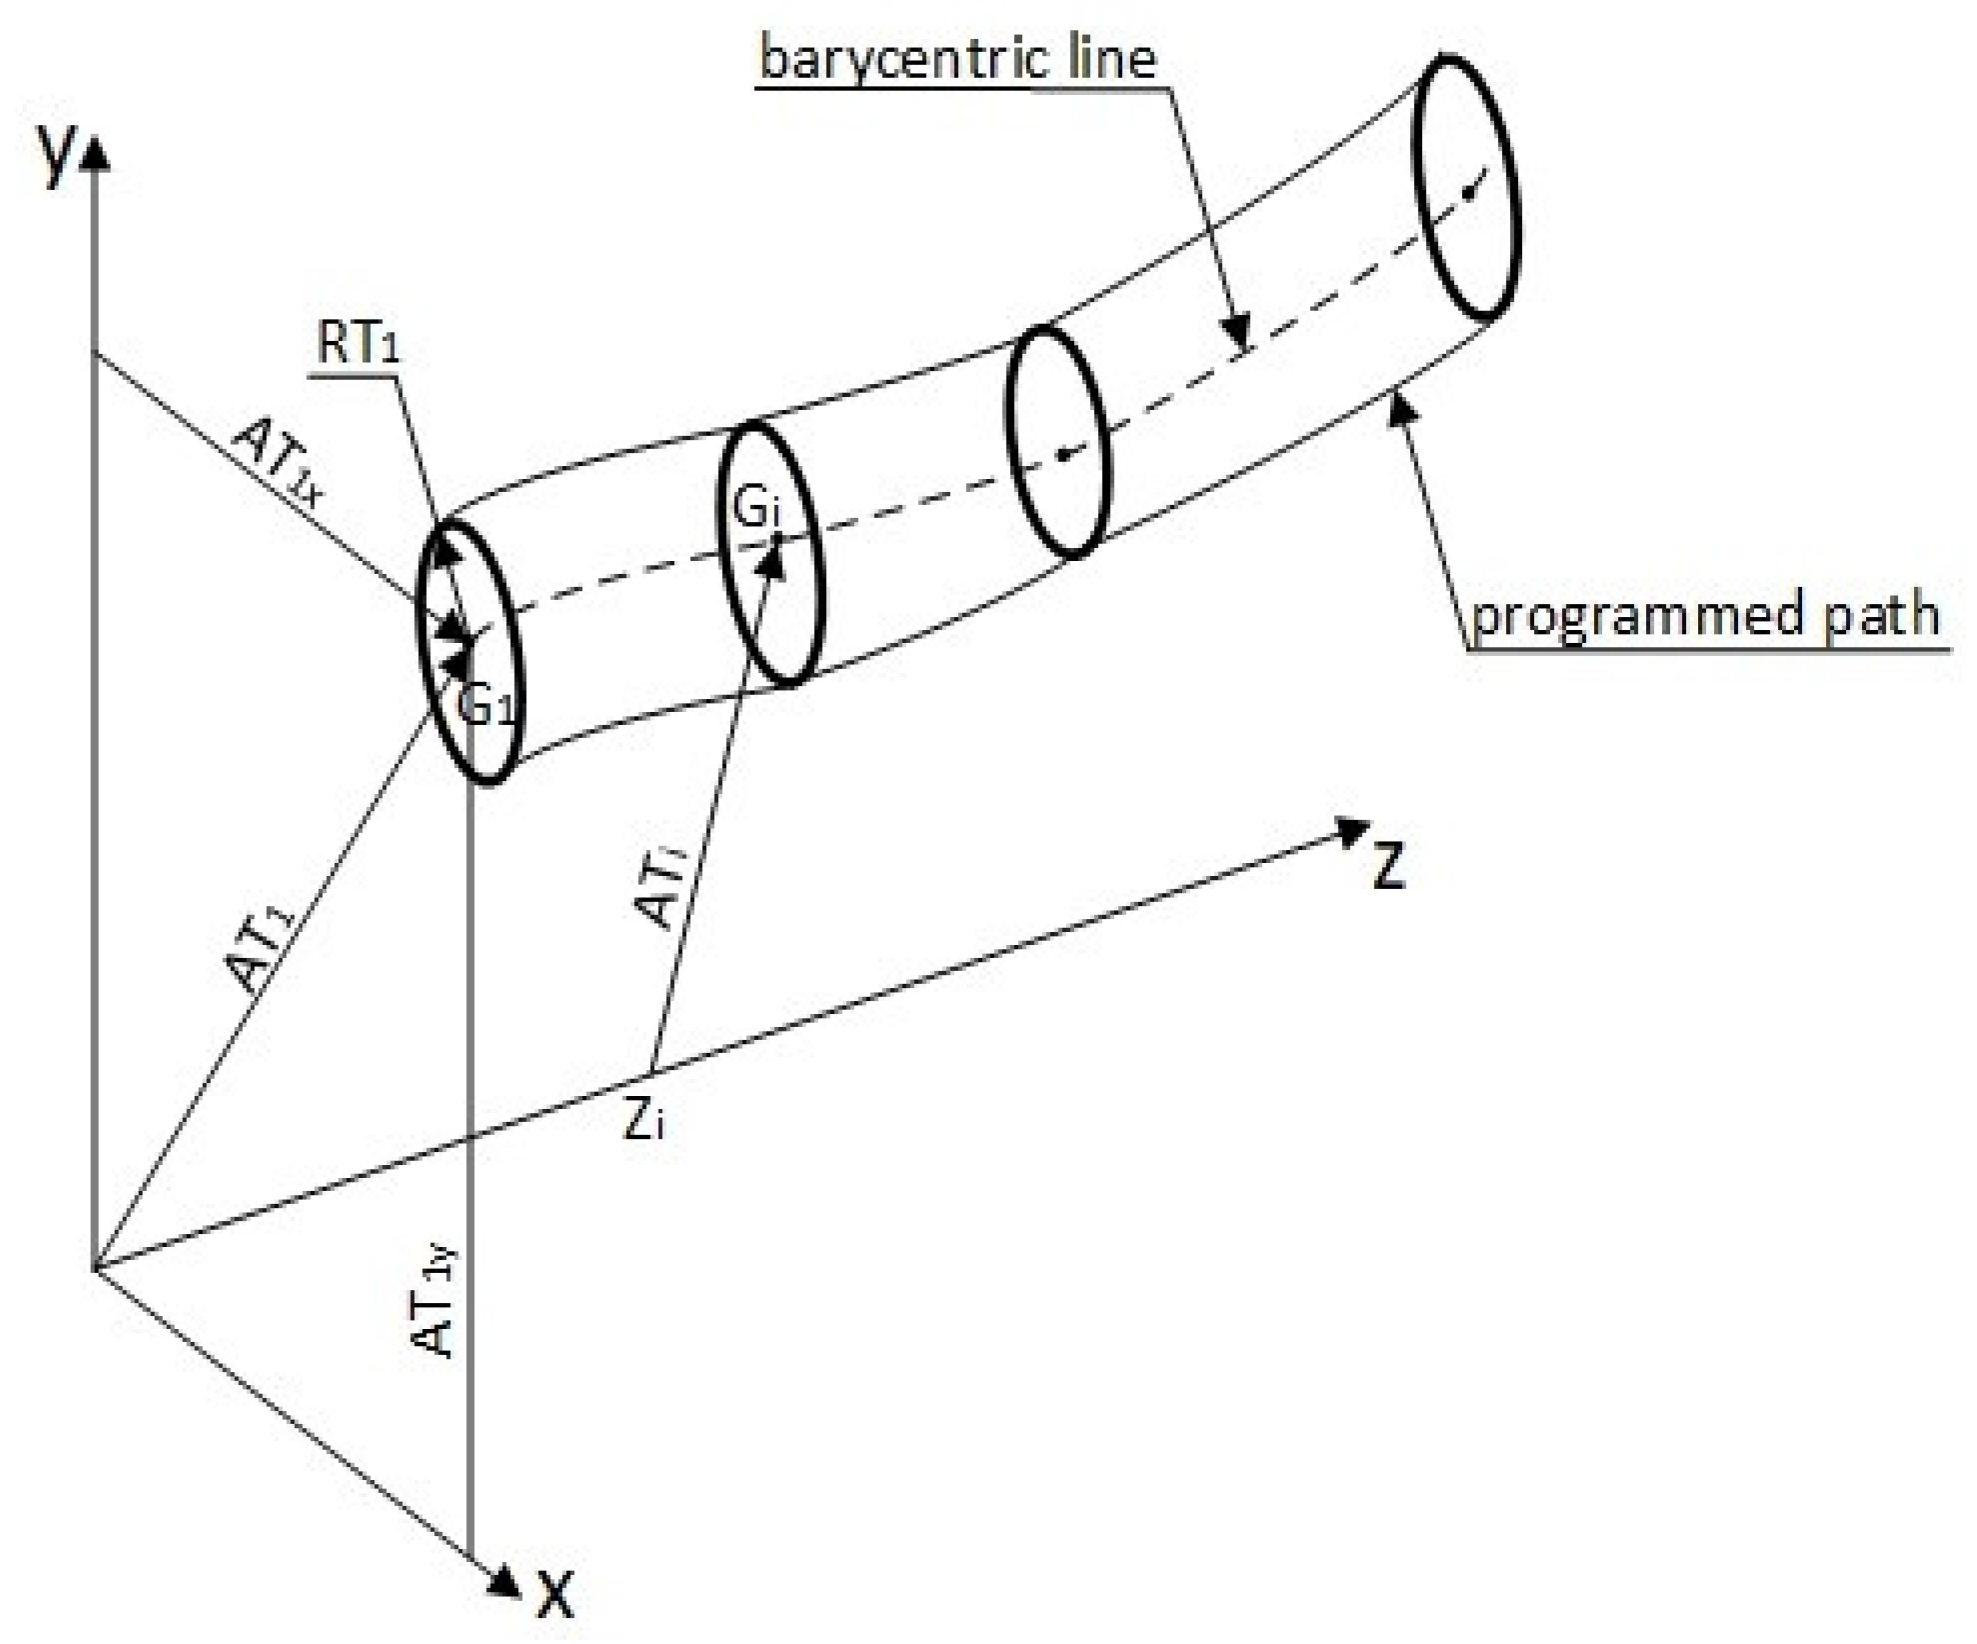
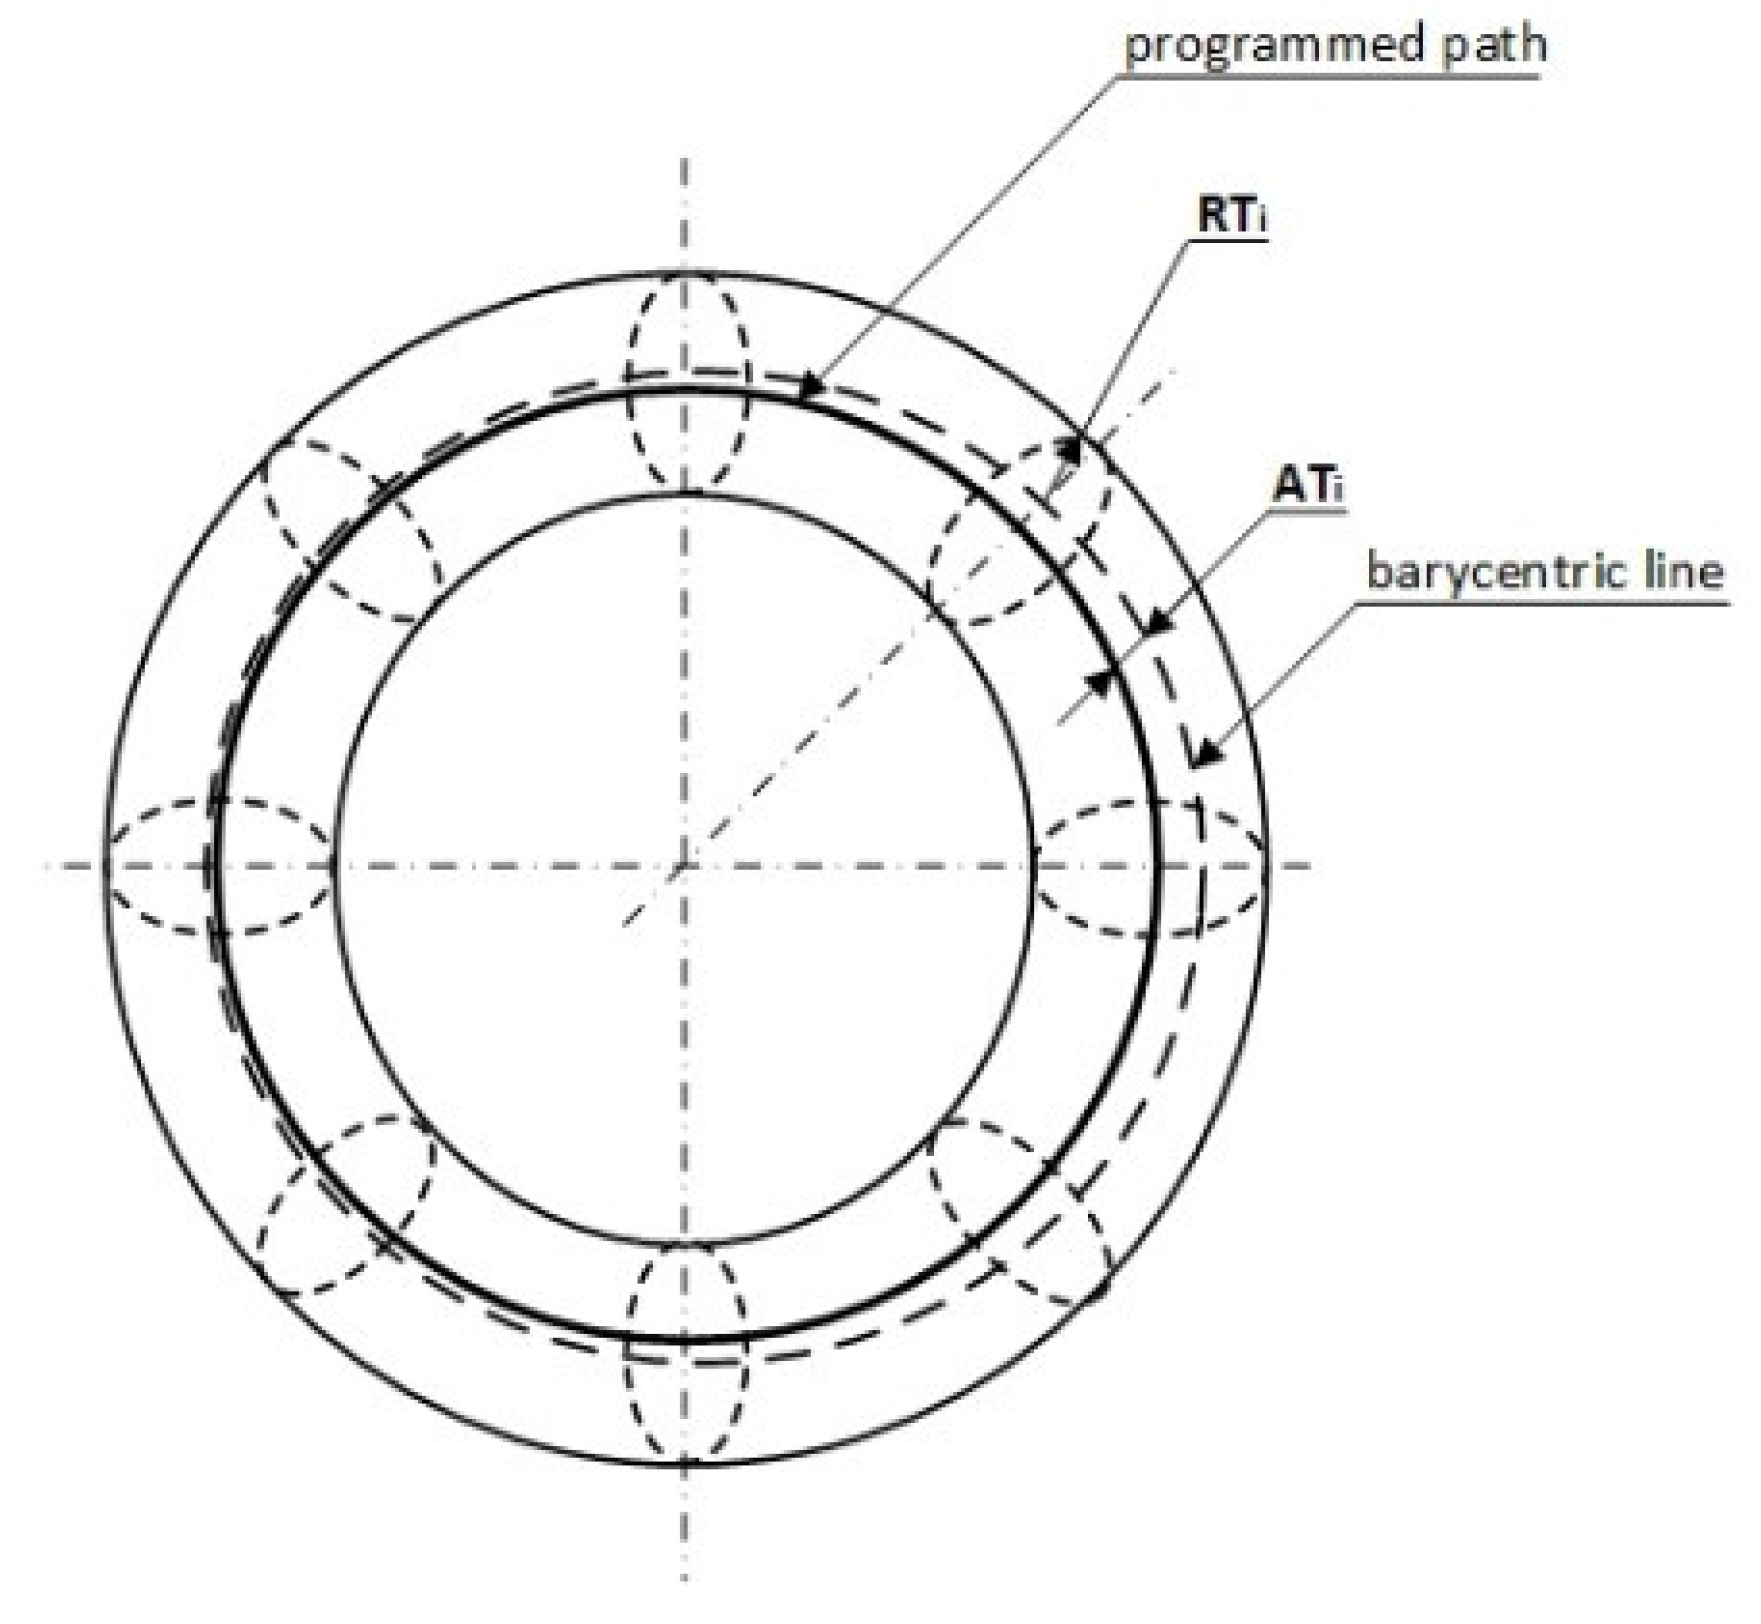
Path accuracy describes the robot’s ability to move through its interface along the programmed path n-times in one direction and n-times in the opposite direction. Path accuracy is determined by two factors:
Thus, path accuracy is the utmost path deviation obtained during positioning and orientation. Accuracy of the path positioning,
AT, is defined as the utmost distance between the programmed path and the barycenters
Gin in measurements of each of the number of measuring points (
m) along the path [
26]. If the programmed path is defined as the axis Z, then the path-positioning accuracy will be calculated from the following equation:
whereas
where
—point coordinates on the programmed path corresponding to the measuring point .
—point coordinates of the achieved path corresponding to the measuring point for jth repetition.
Accuracies of the
ATa,
ATb, and
ATc path orientation are defined as the utmost deviation from the programmed angles along the path. However, this experimental method does not allow for their exact determination [
27].
While the path-accuracy definition defines path accuracy as a distance-dependent value, measuring the achieved path may be performed either as a function of distance or of time. Where significant speed fluctuations along the path are present, repeated measurements must be performed as a function of time. Repeated measurements must relate to the same points in space along the programmed path. The initial measuring point must lie outside the testing plane, and the checks must be bidirectional [
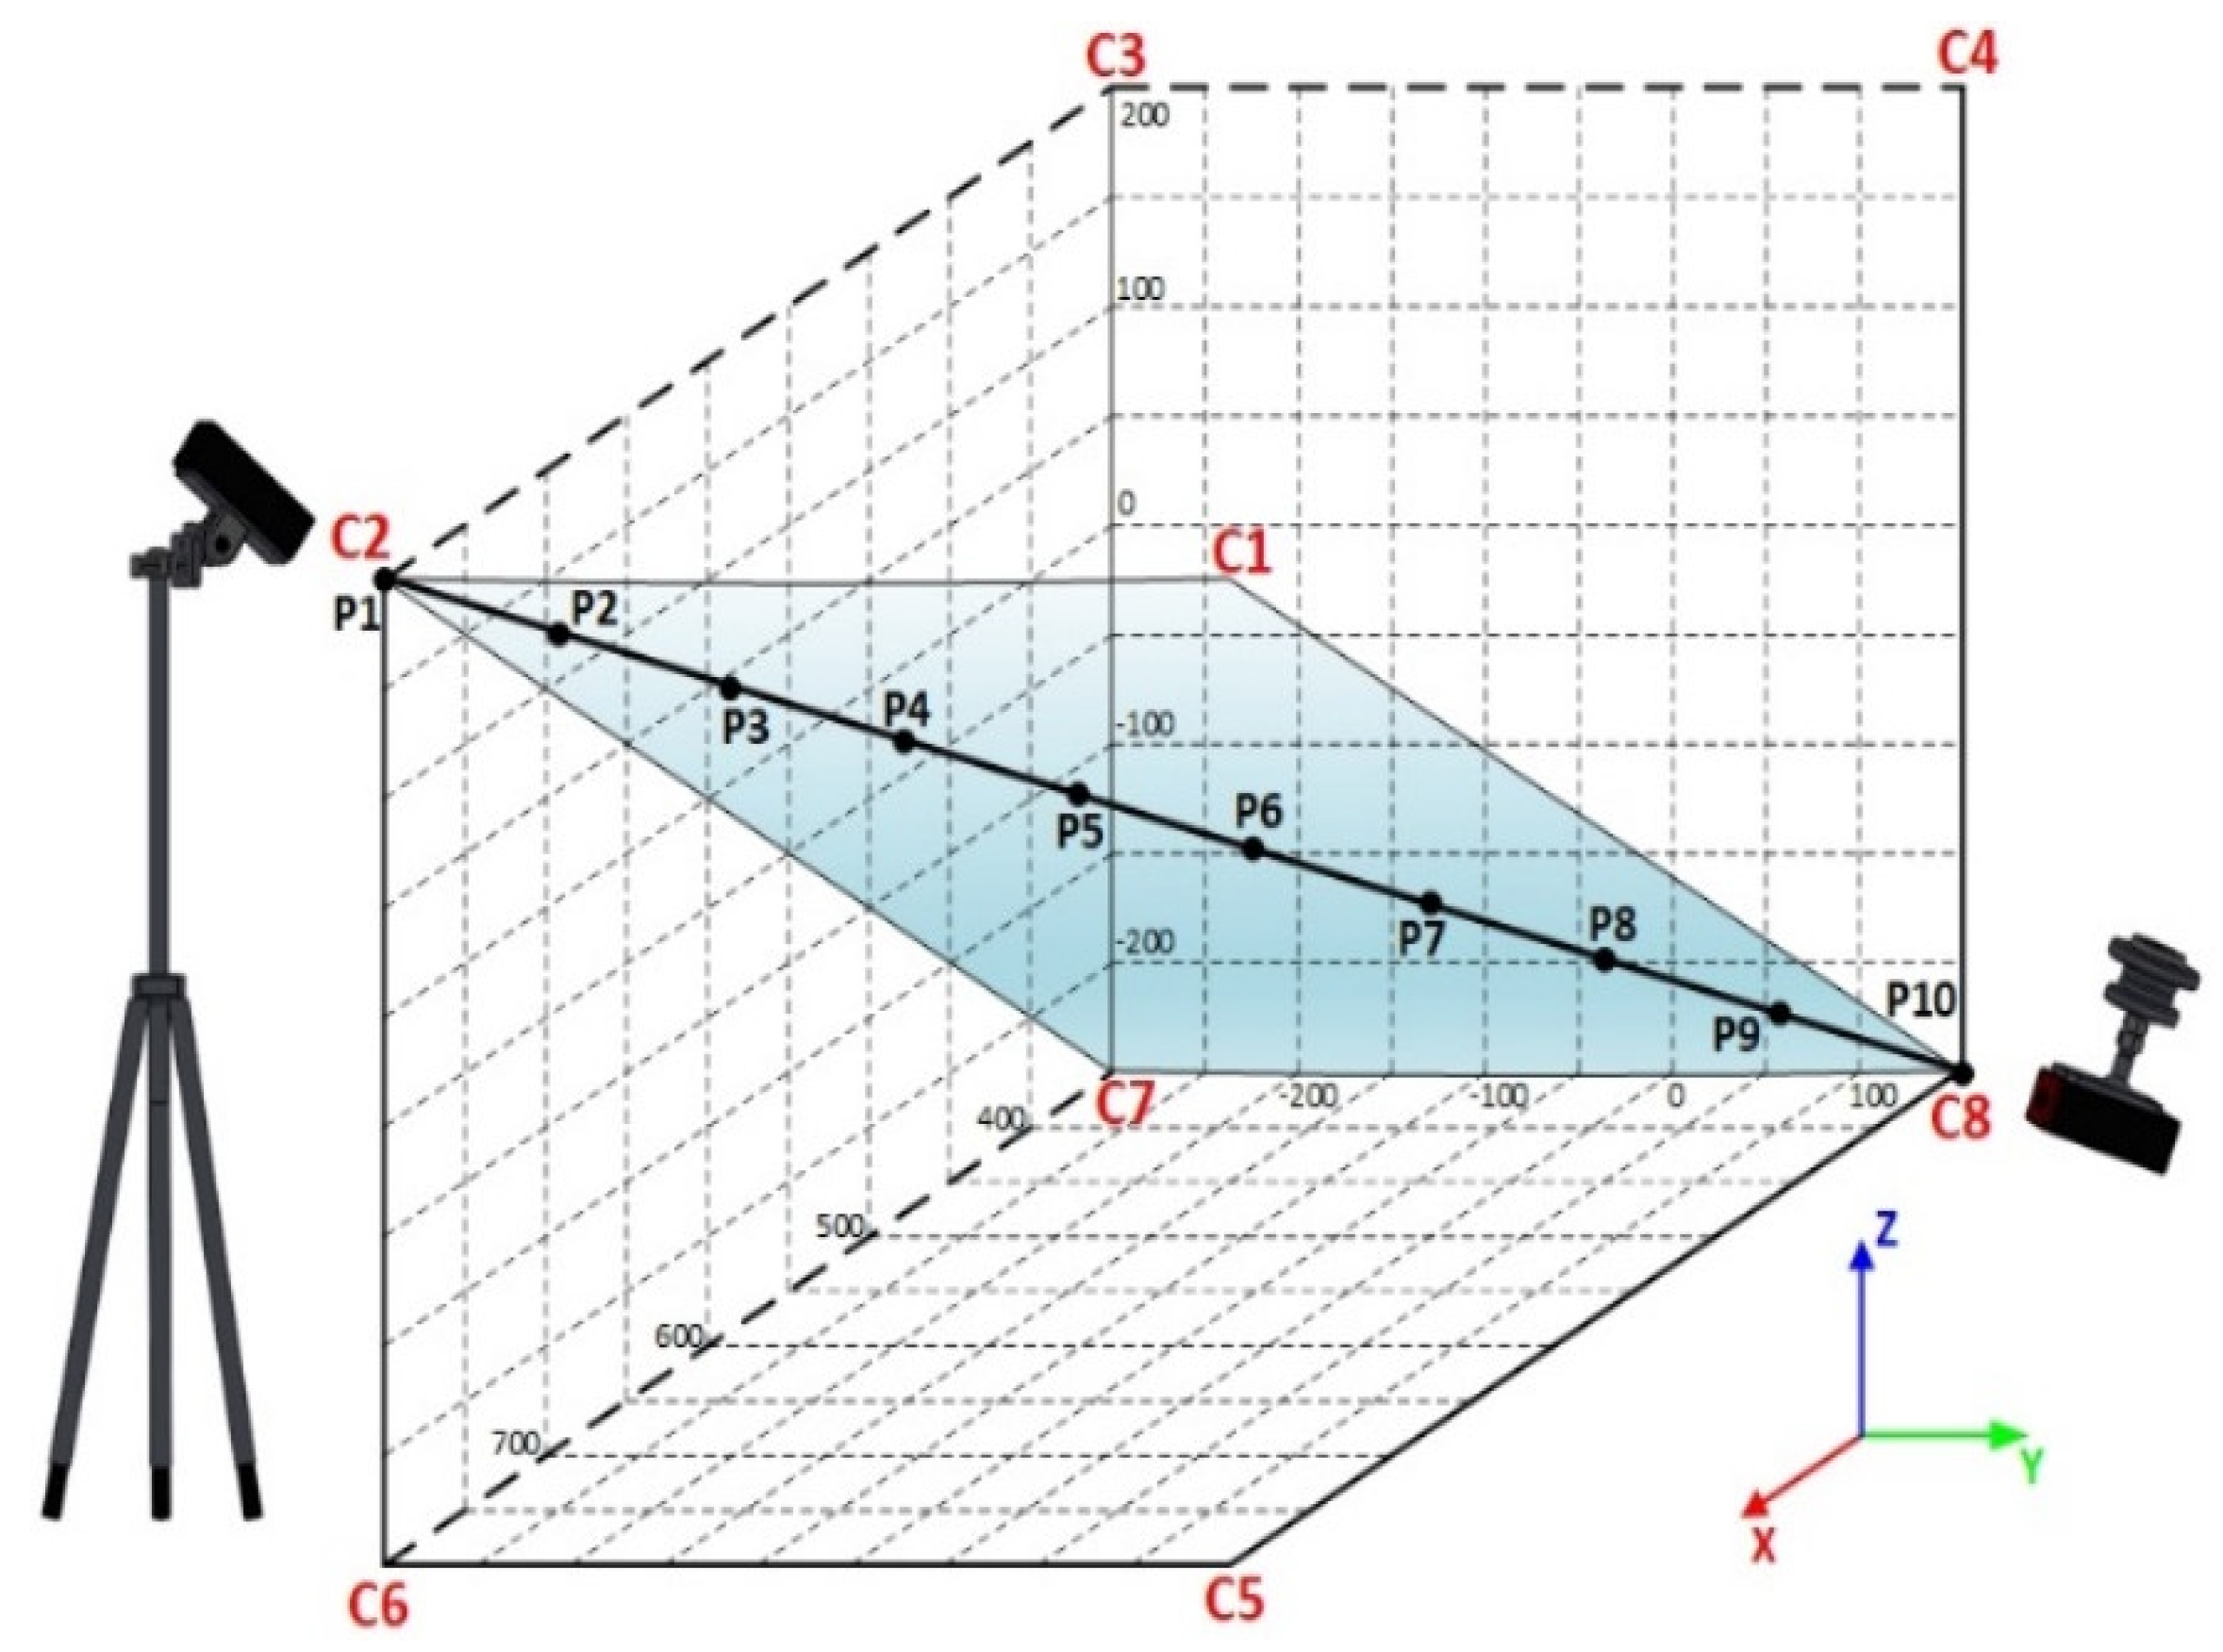
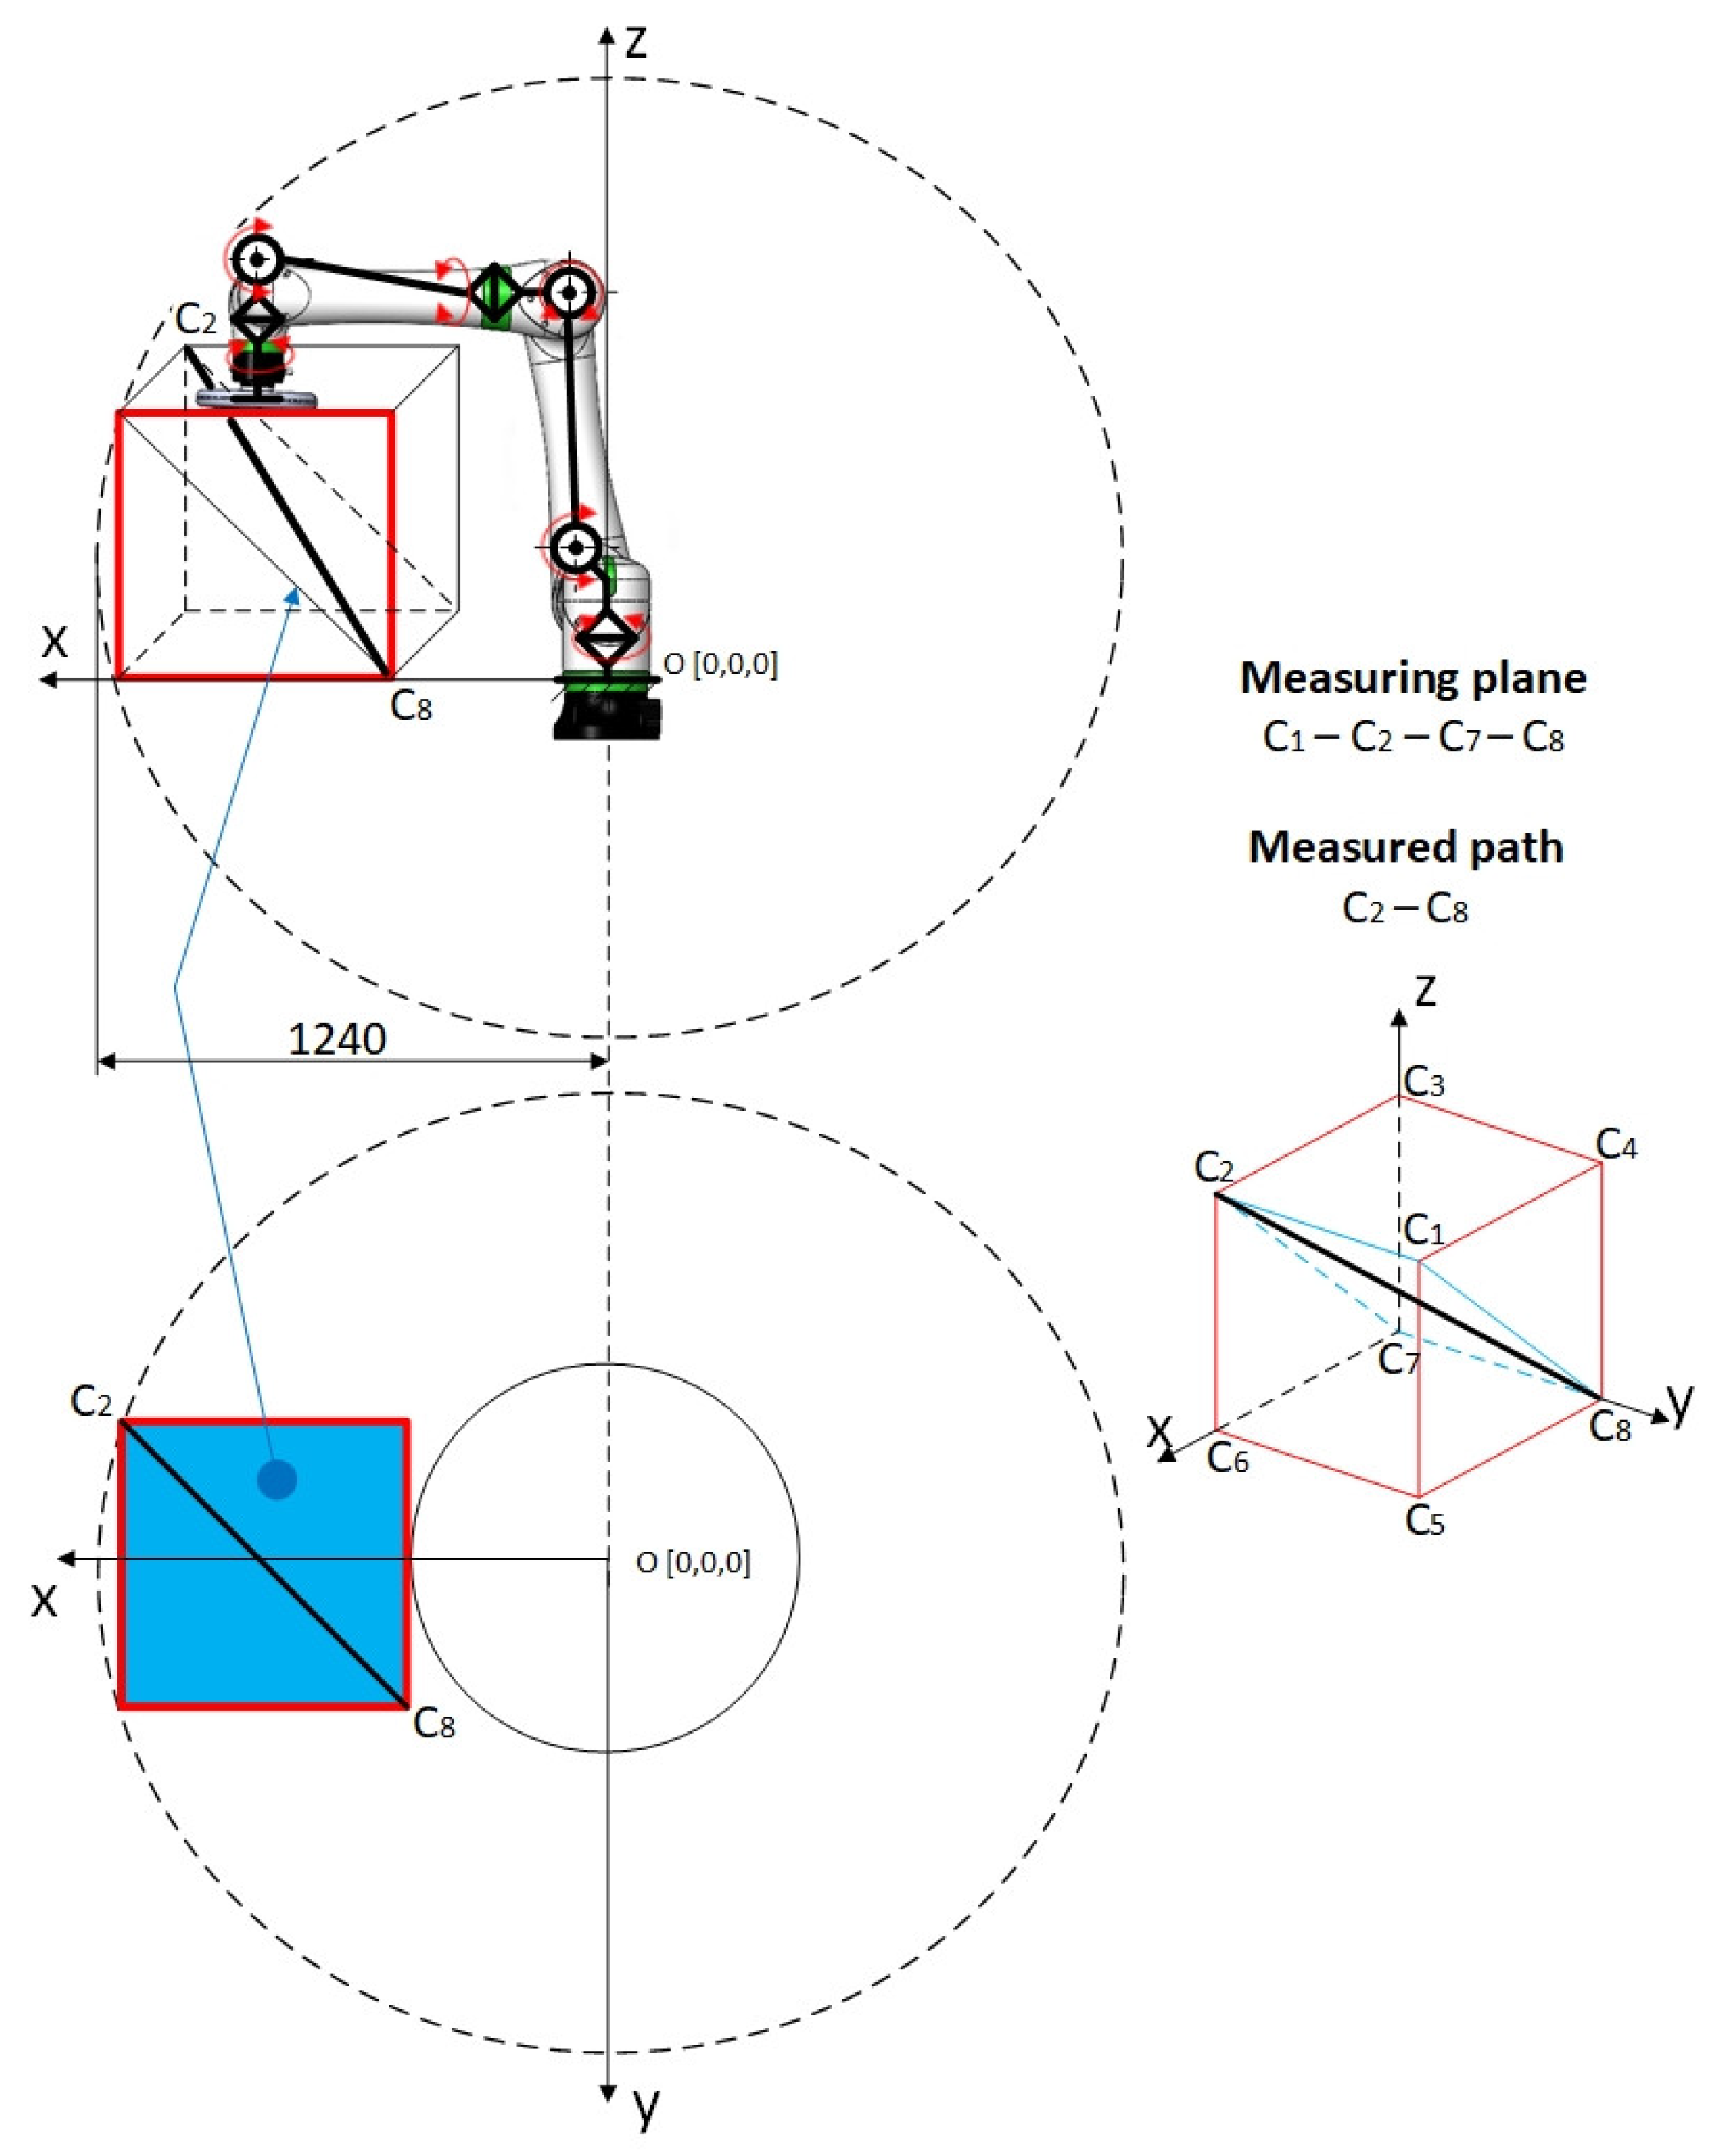
28]. Testing cycles complied with the standard. C1 to C8 denote the apexes of a simple cube lying in a section of the workspace where the use of robots is expected to be most frequent. The testing plane and testing path are shown in
Figure 6.
3.1. Robot Fanuc CRX-10iA
The collaborative robot CRX-10iA is heavily guarded against dust or oil leaks in the industrial setting, and it fully complies with the ISO 10218-1 safety standards [
6]. Thanks to its lightweight, CRX can be easily installed in a wide range of applications, for example, using automatically guided vehicles (AGV) [
29].
Typical for CRX are the same reliable functions that are common in other collaborative robots. Its sensors are sensitive and immediately actuate the emergency stop upon contact with a human body.
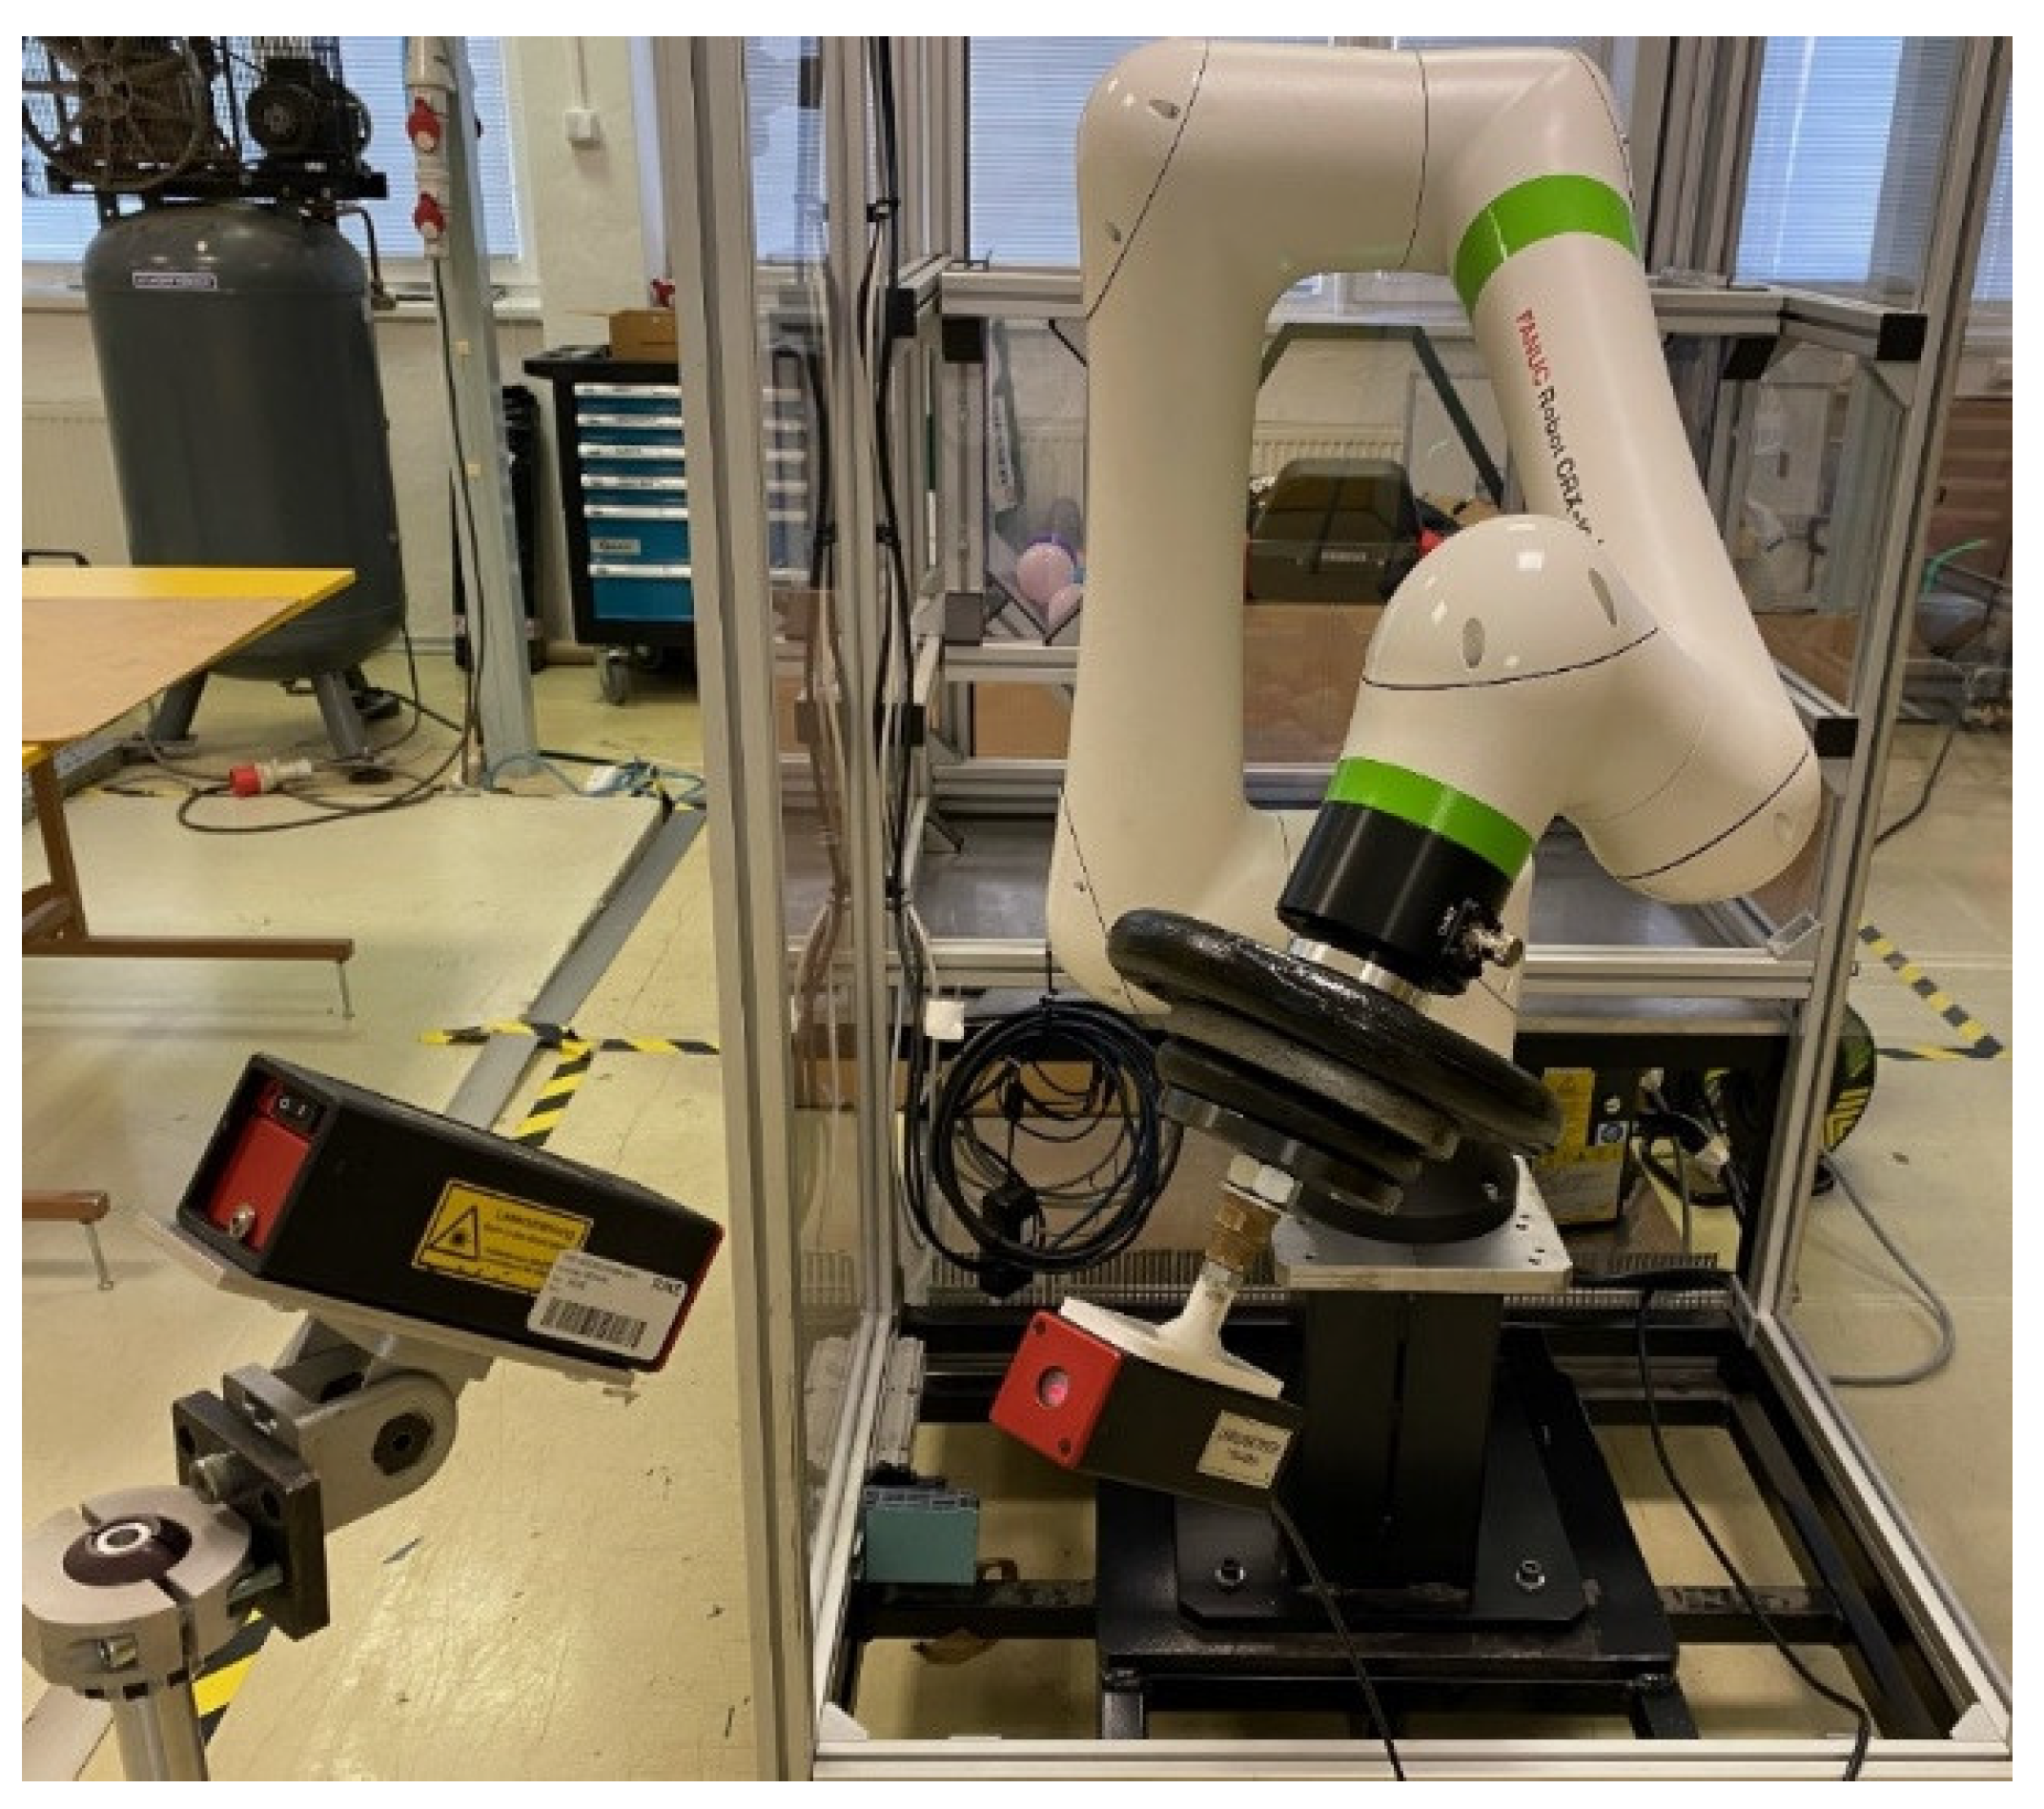
Figure 7 shows the robot, the payload, and also the transmitter and the receiver of the measuring system GEPARD.
Table 2 gives an overview of the basic parameters of the Fanuc CRX-10iA robot.
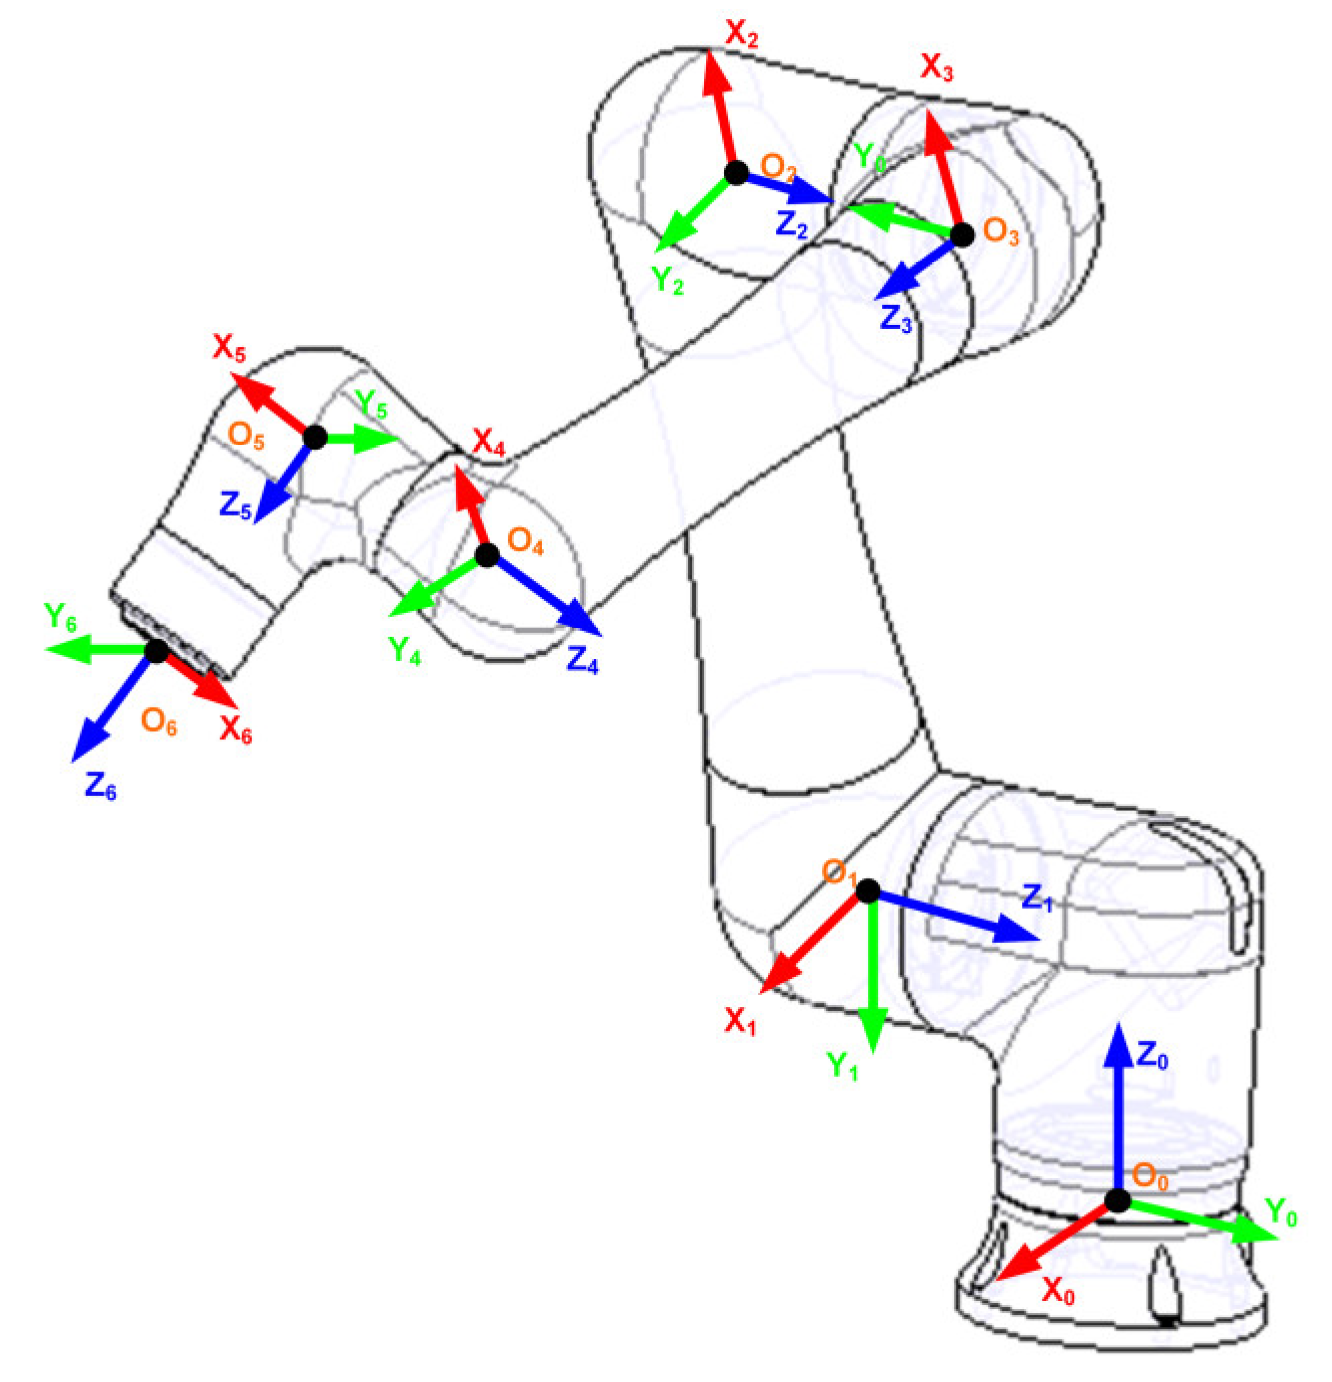
3.2. Mathematical Background of CRX-10iA
An important part of the robot analysis is a complete kinematic model of the mechanical system. It is a description of the position and orientation of the working end point in time and the corresponding course of position-taking by individual parts of the mechanism. The Fanuc CRX-10iA robot’s structure is a serial kinematic RRR. That is why the kinematics was described using the Denavit–Hartenberg convention, enabling the description of the robot’s kinematics using DH parameters. The kinematic model,
Figure 8, makes it possible to study the processes of the robot’s movement in time–space [
30].
The kinematic description using the Denavit–Hartenberg parameters is given in
Table 3.
Inverse transformation yielded the courses of position-taking by tilting drives that enabled measurement. The last part of the robot will move at a constant speed with linear approximation. The values of speed and acceleration of individual drives are obtained by its derivative.
The speed of each material point of the part, as well as that of its local coordinate system, can be calculated from the following equation:
where
ωi is the angular speed of the
ith coordinate system,
ωi − 1 is the angular speed of the previous coordinate system, and
is the relative angular speed of two adjacent coordinate systems, which can be expressed as follows:
The angular speed of the naught coordinate system is zero. In this way, velocities of all six local coordinate systems can be expressed, and thus, those of the robot parts from its base to its endpoint. The derivation of translational speed necessitates the derivation of the positional vector between two coordinate systems.
A robotic system enables setting the trajectory by setting individual points and then setting the type of movement. In our case, a linear movement at a constant speed is selected between the extreme points of the measuring cube.
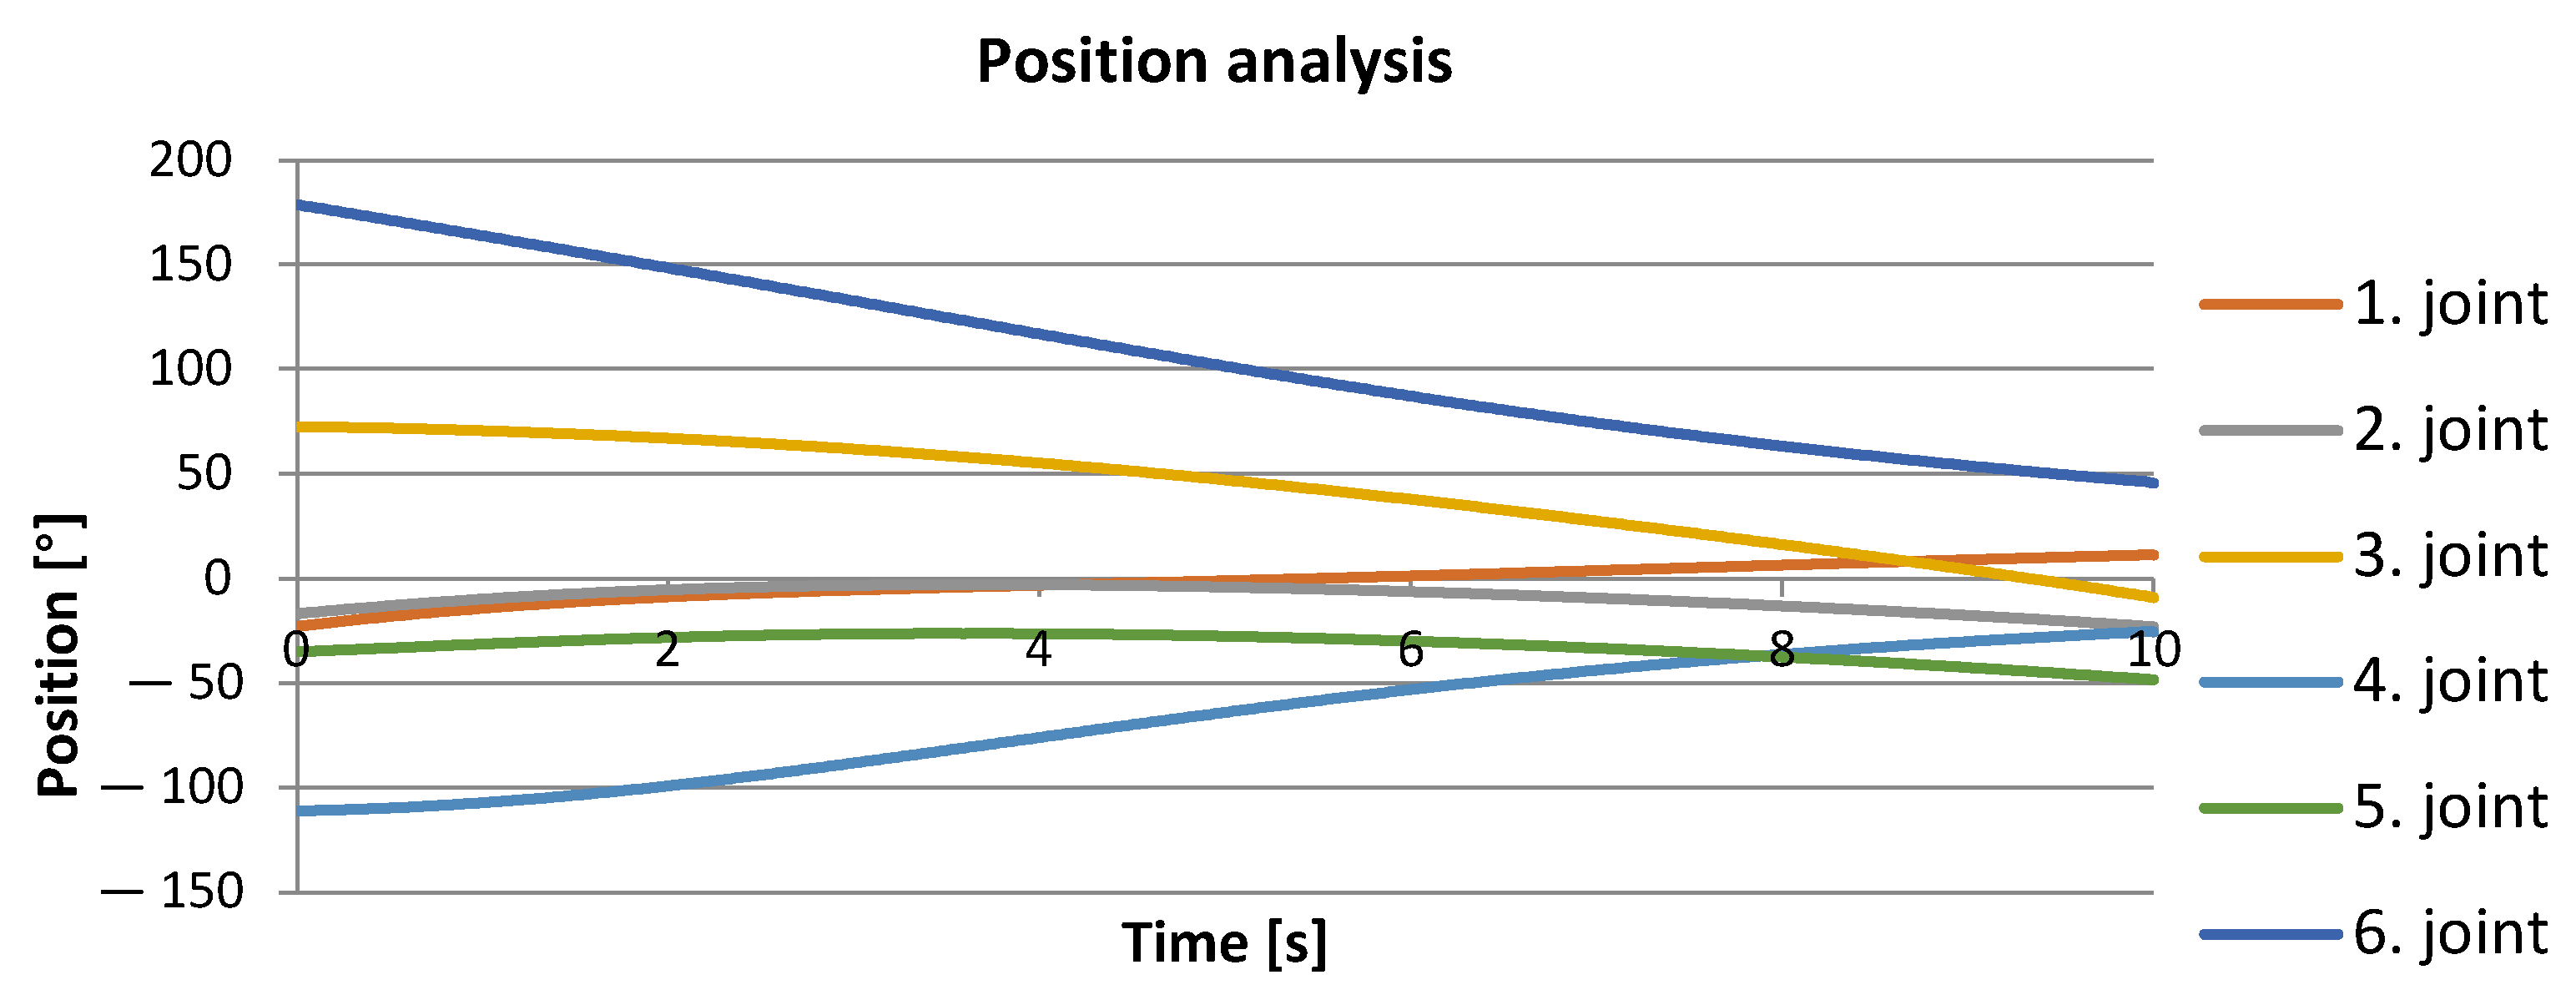
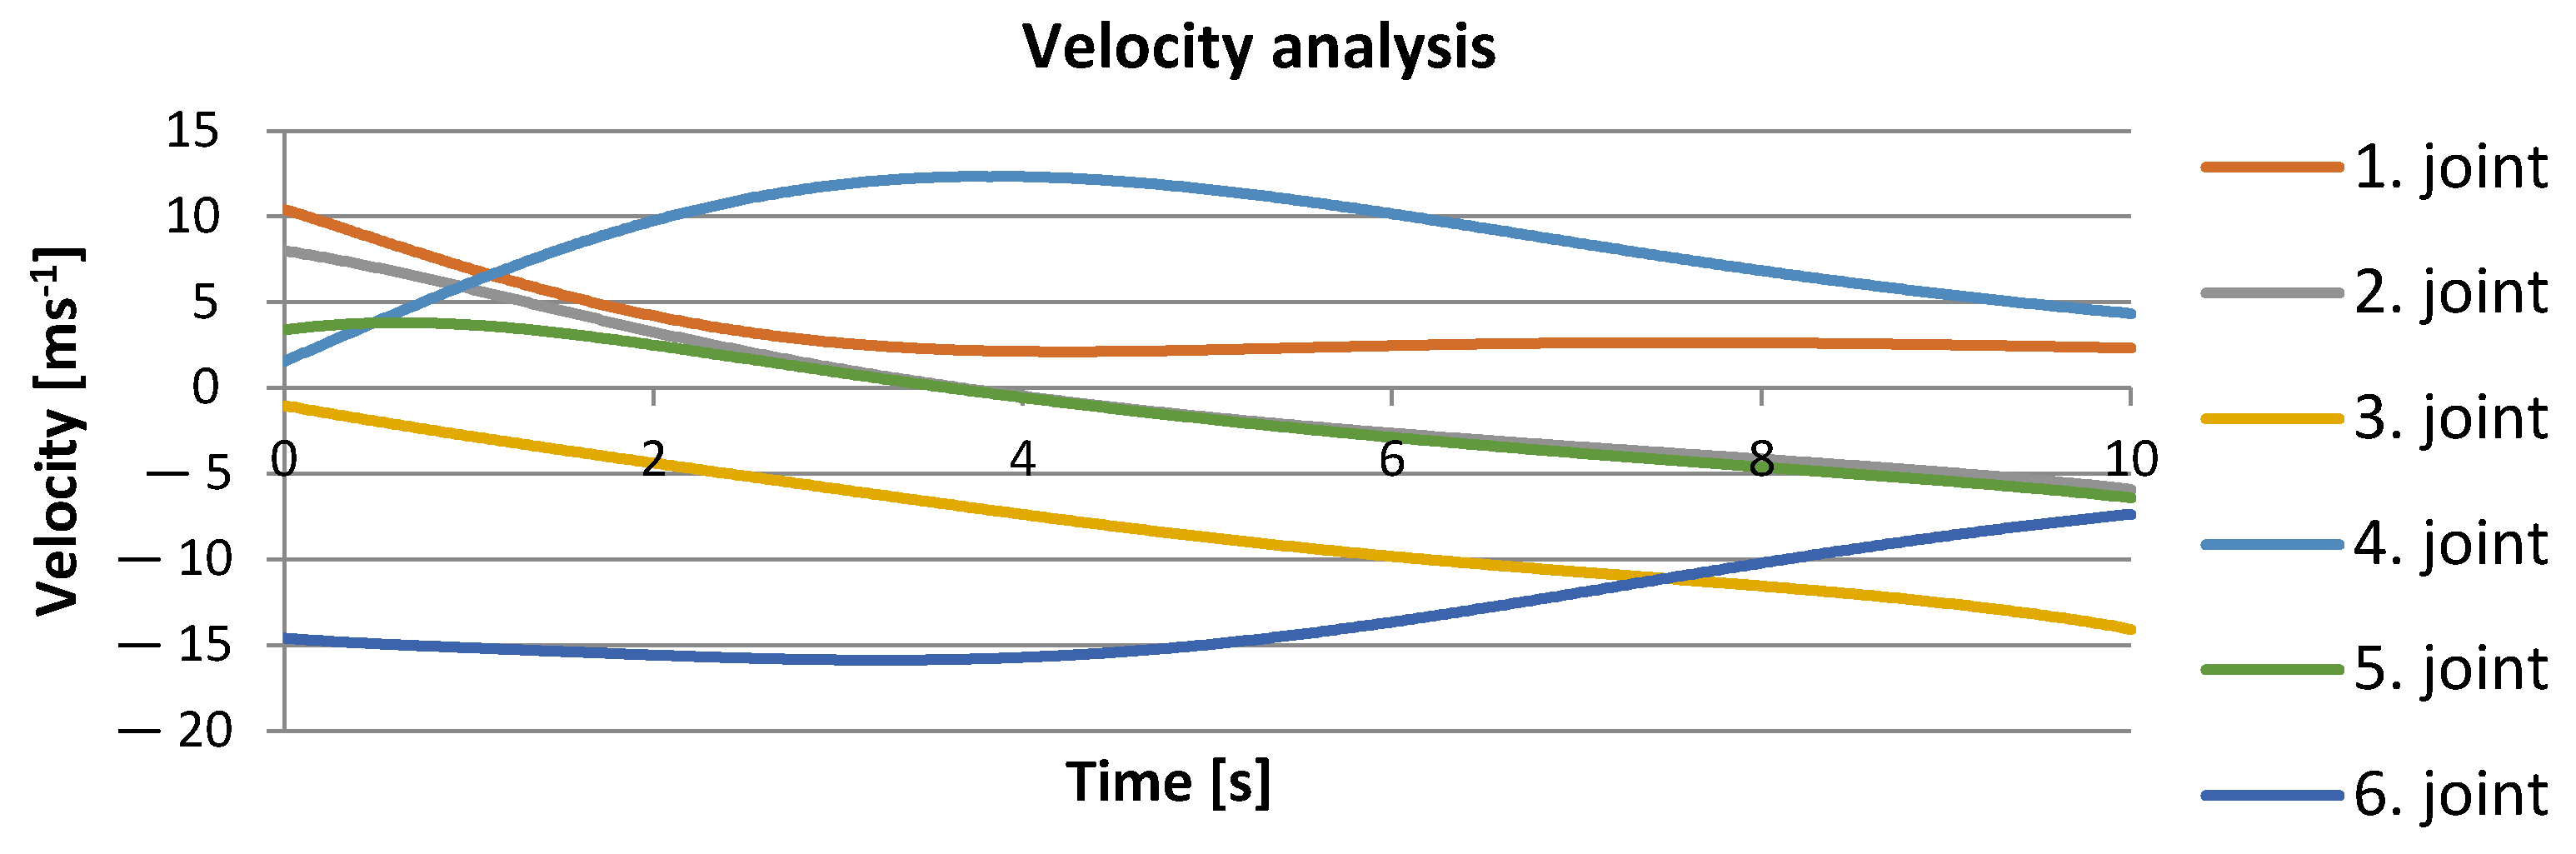
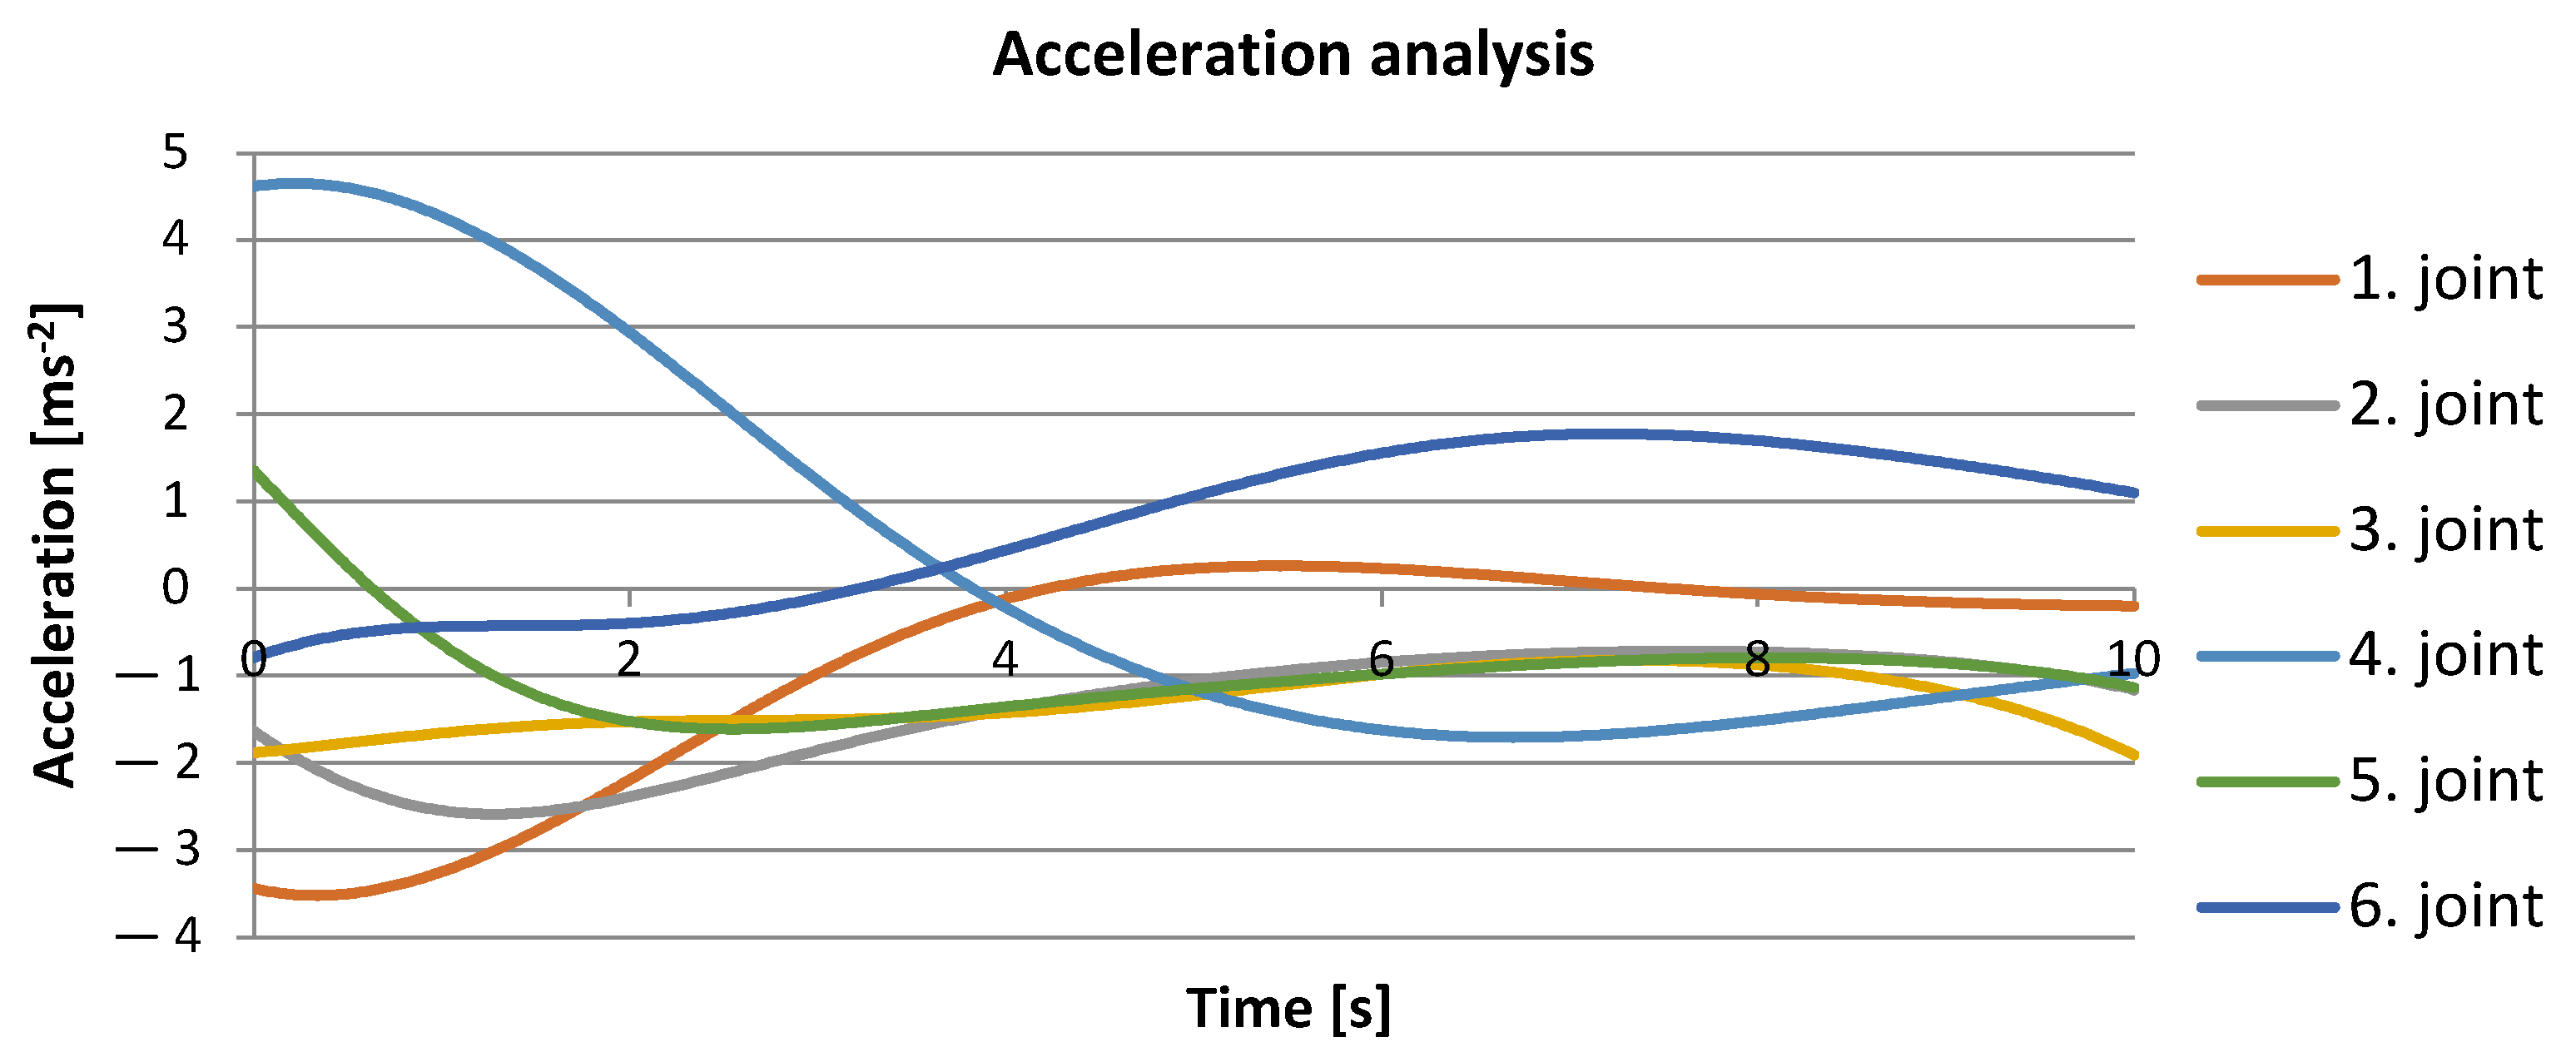
Dynamic parameters were simulated in Creo. The courses of position-taking, speed, and acceleration describing the movement of individual drives during linearity measurement are shown in
Figure 9,
Figure 10,
Figure 11. For the given collaborative robot model, a continuous linear path containing measuring points was simulated. The results of the position analysis of the course movement of individual joints are shown in
Figure 9. The individual trend lines justify a belief that all robot joints participated in the movement defined. The greatest change was noted in the sixth joint.
In planning the path, its calculation is sampled with a period defined by the speed of the inverse kinematic task calculation. In addition, path planning also accounts for sudden changes in movement so that permissible velocities and accelerations of individual drives are not exceeded. A path calculated in this way differs from the ideal one. Inaccuracy is influenced by several other factors, such as individual drives‘ positioning precision, robot rigidity etc., which have an effect on the resulting accuracy. Measurement can identify real deviation from the ideal path [
31].
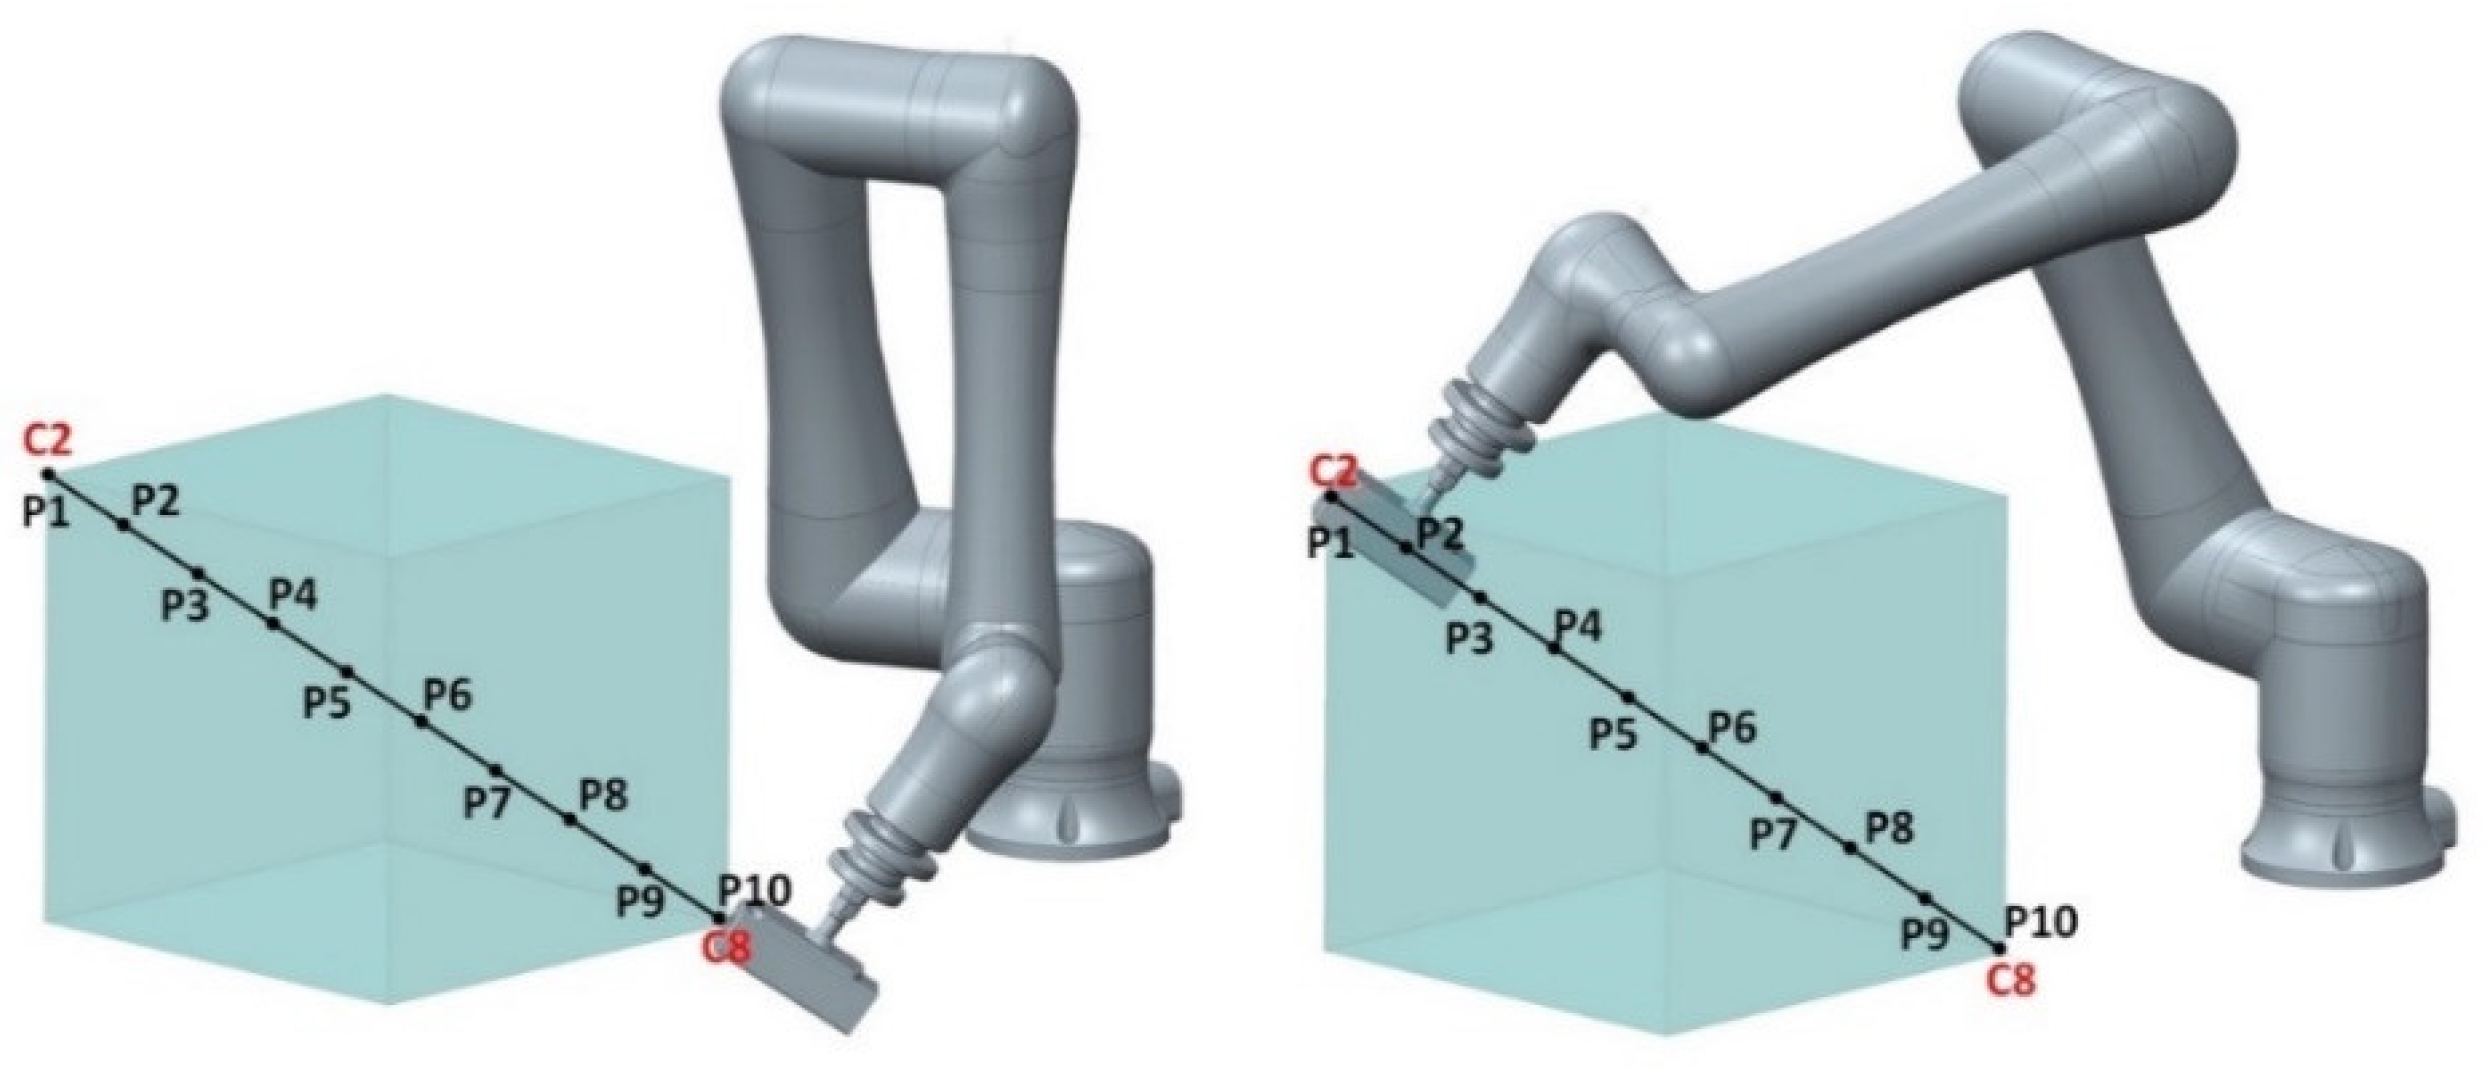
Of basic importance to the entire line of matrix methods of kinematic and dynamic analysis and synthesis are homogenous transformations that we use to describe the position and orientation of parts. Utilizing visual systems’ needs, homogenous transformations put the global position of parts into the context. The left-hand side of
Figure 12 shows the first point in the measuring cycle, C8, and the right-hand side shows the last measuring point, C2.
The resulting transformation matrix between adjacent coordinate systems is obtained by multiplying individual partial transformation matrices in the order in which the movements were made. The result of multiplication, describing the position of the first measuring point, is as follows:
The homogenous transformation matrix for the last point measured:
3.3. Implementation and Evaluation of Experimental Measuring
The object of path-accuracy measurement was the robotic arm of a collaborative robot by Fanuc designated as CRX-10iA. Overall, six types of measurements were performed. These were the measurements prescribed by the standard under a 100% nominal load and at 100, 50, and 10% speed. Furthermore, measurements under a 50% and 10% load, respectively, and the velocities of 100, 50%, and 10% were performed. The number of cycles for each measurement was 10.
Figure 13 shows the measuring plane, along which measurements took place from points C2 to C8. A total of 10 points, subject to deviation detection, lay on this programmed path [
32].
The measurements were performed according to the relevant standard. The measurement involved a weight installed on the robot’s end flange with the attached GEPARD device.
Figure 14 shows the measuring setup used in the measuring cycle. The testing cycle was bidirectional, i.e., the measuring started at point C2, from which the robot passed over to C8 and then returned back to point C2. This cycle was repeated 10 times under a 100% load at three velocities of 100, 50 and 10%, respectively. The initial point was outside the measuring cube, as prescribed by the standard.
Figure 15 represents the cycles of measurements. Each measurement involved every joint of the robot.
4. Results
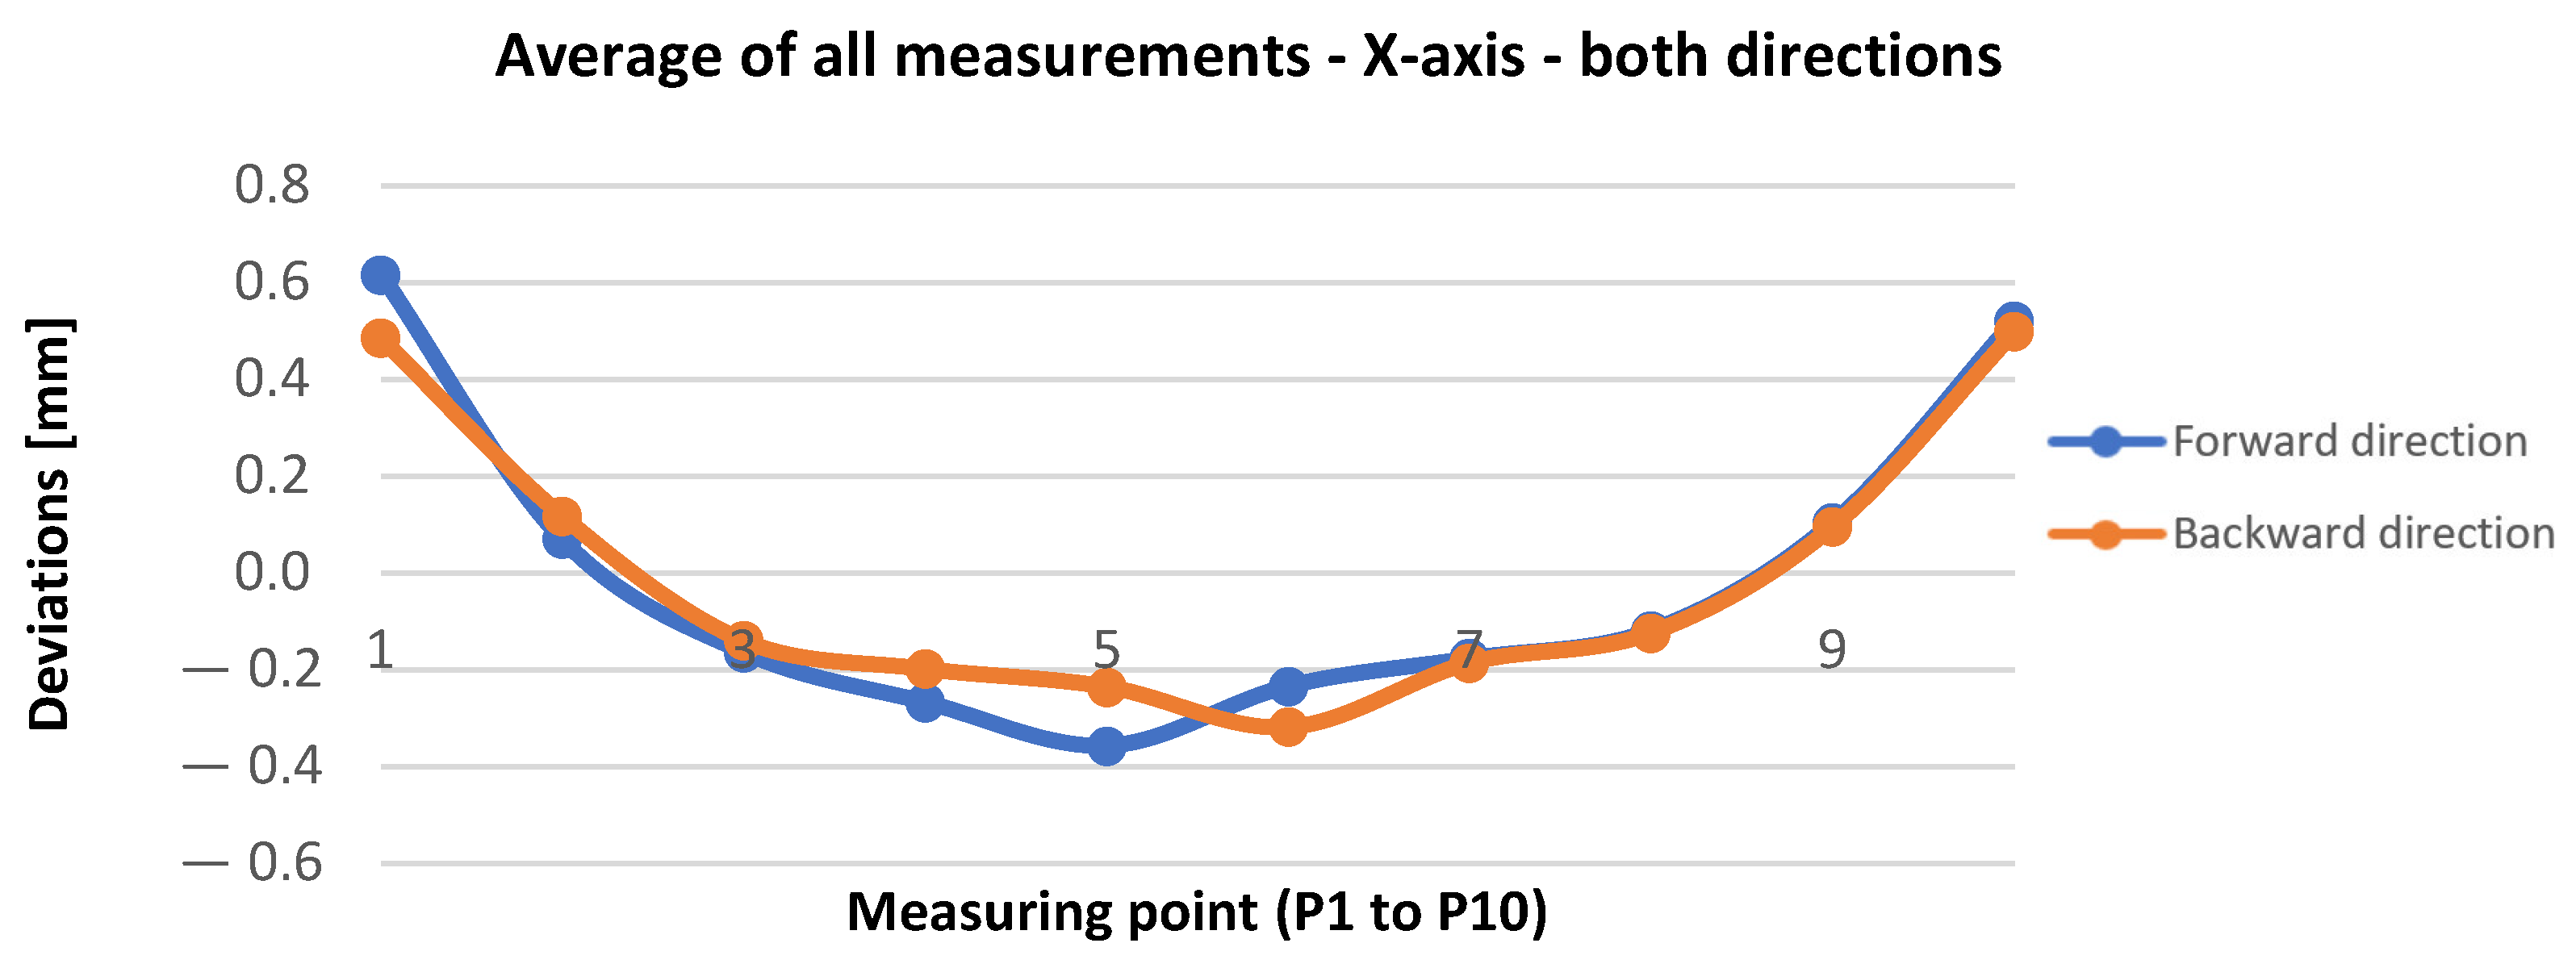
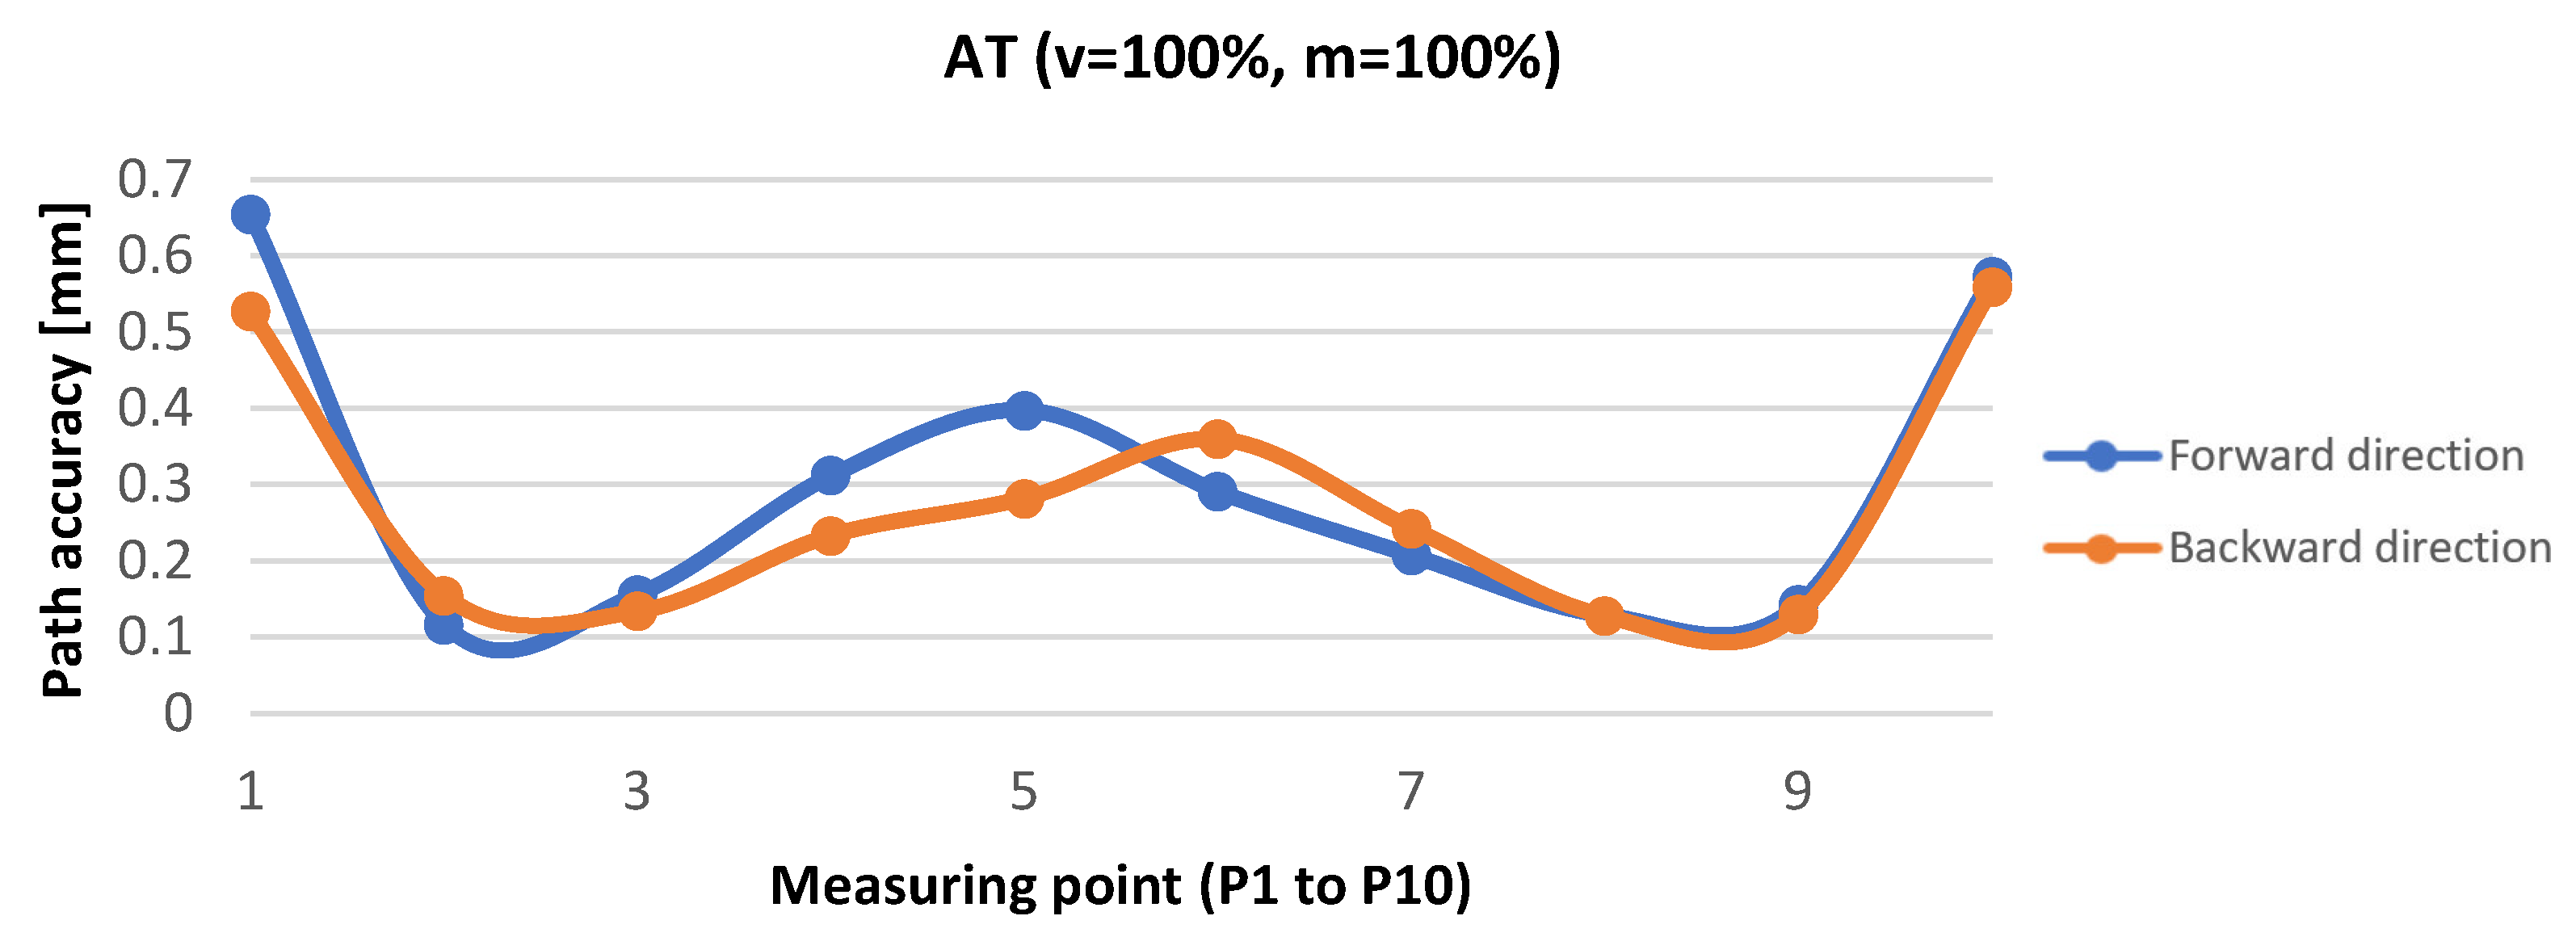
Table 4 lists averages of 10 measurements at 100% speed and under a 100% load. The table contains values recorded by GEPARD at measuring points P1 to P10, namely in both directions.
These obtained values were used for calculating path-deviation values resulting from positioning. Positioning accuracy was then calculated as the utmost distance between the programmed path and the barycenters Gi for n measurements at each of the number of measuring points along the path.
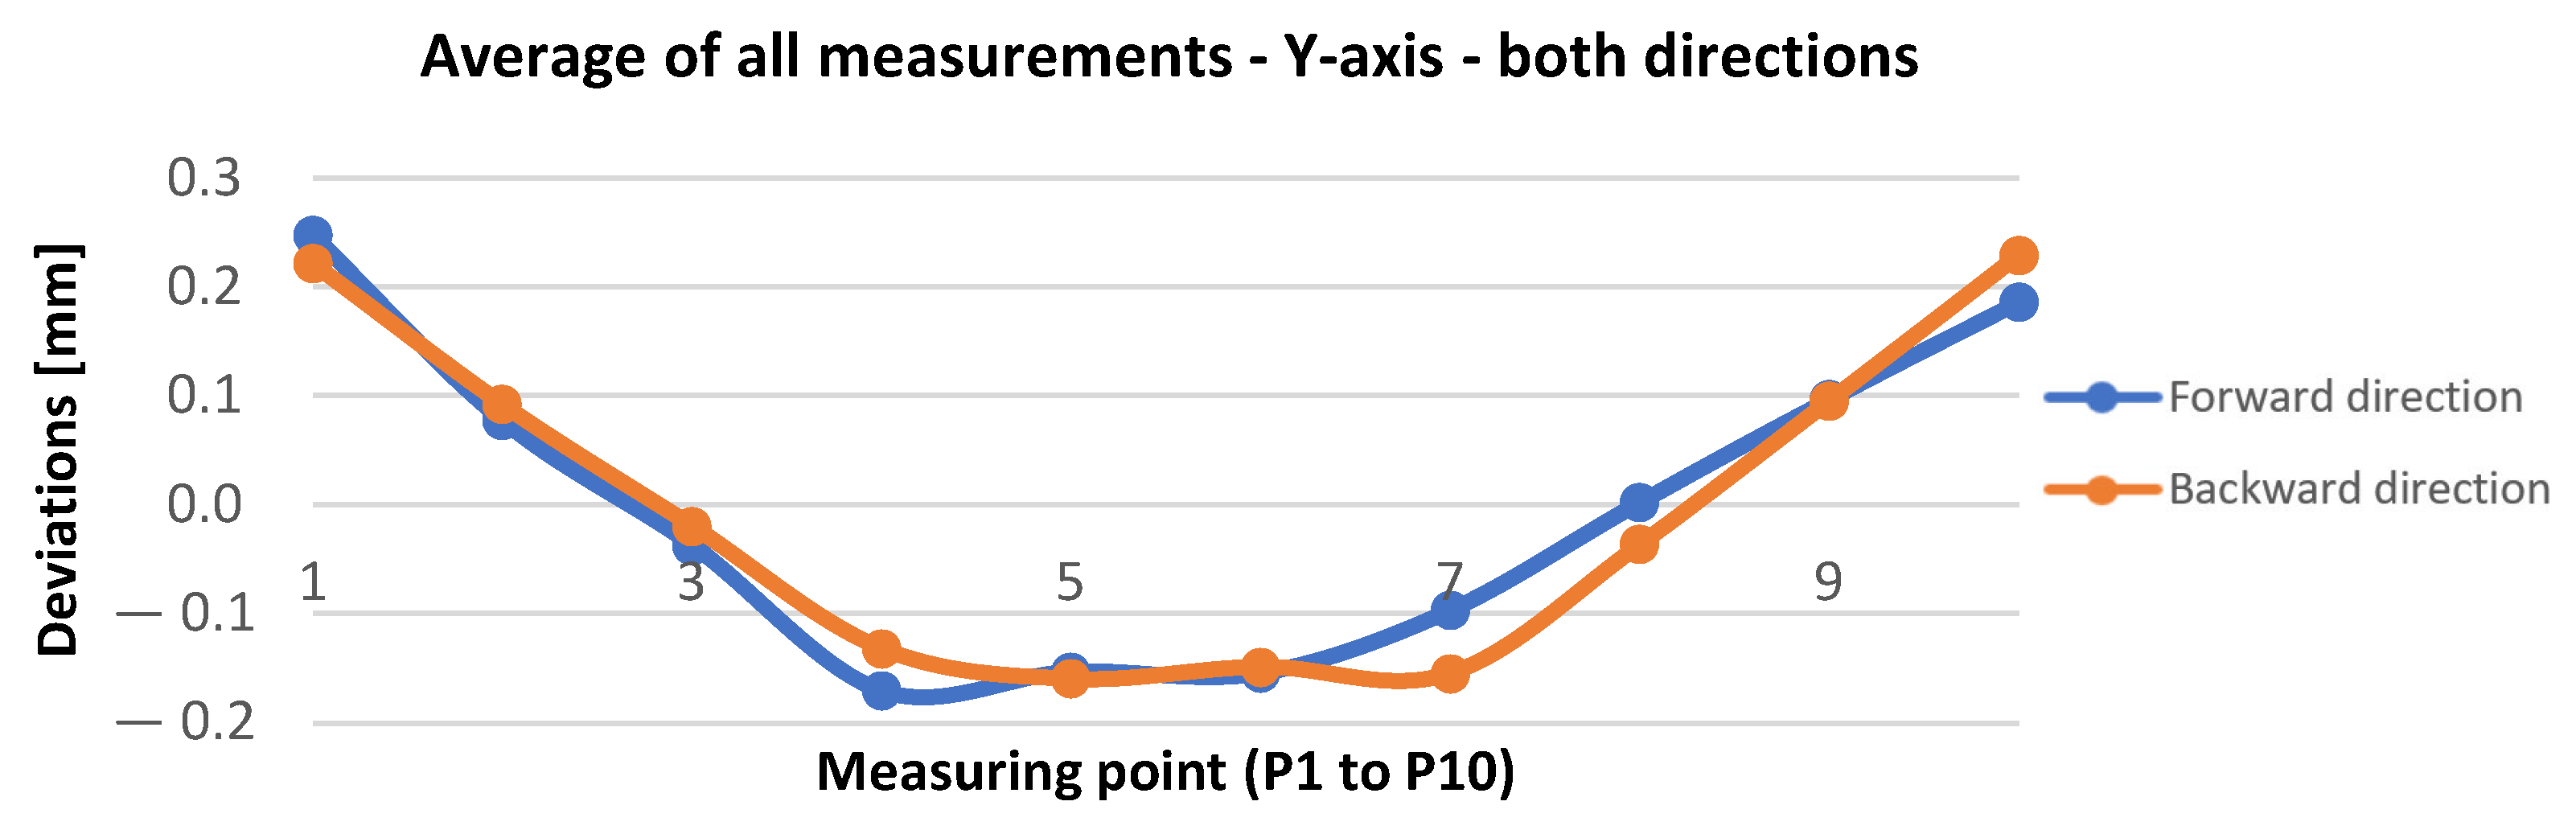
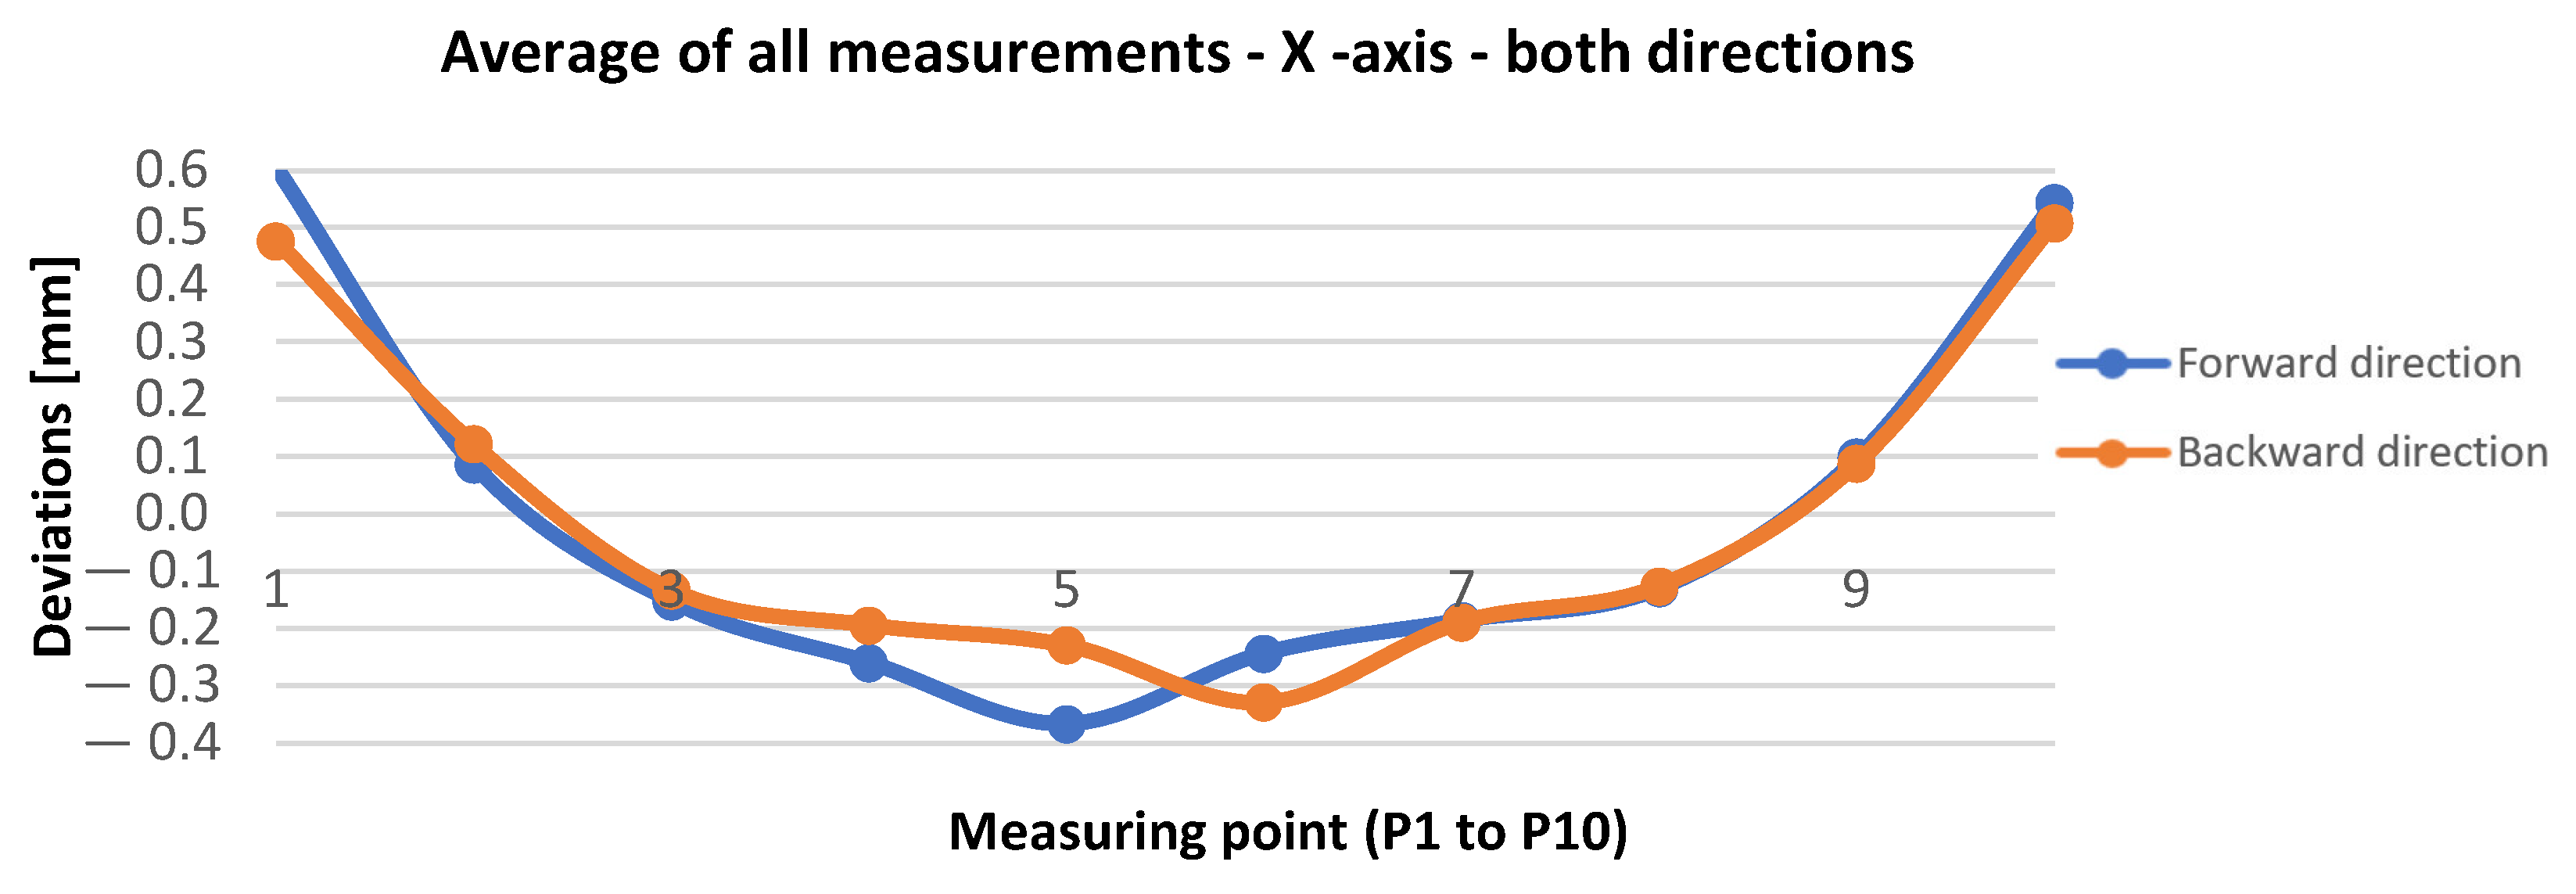
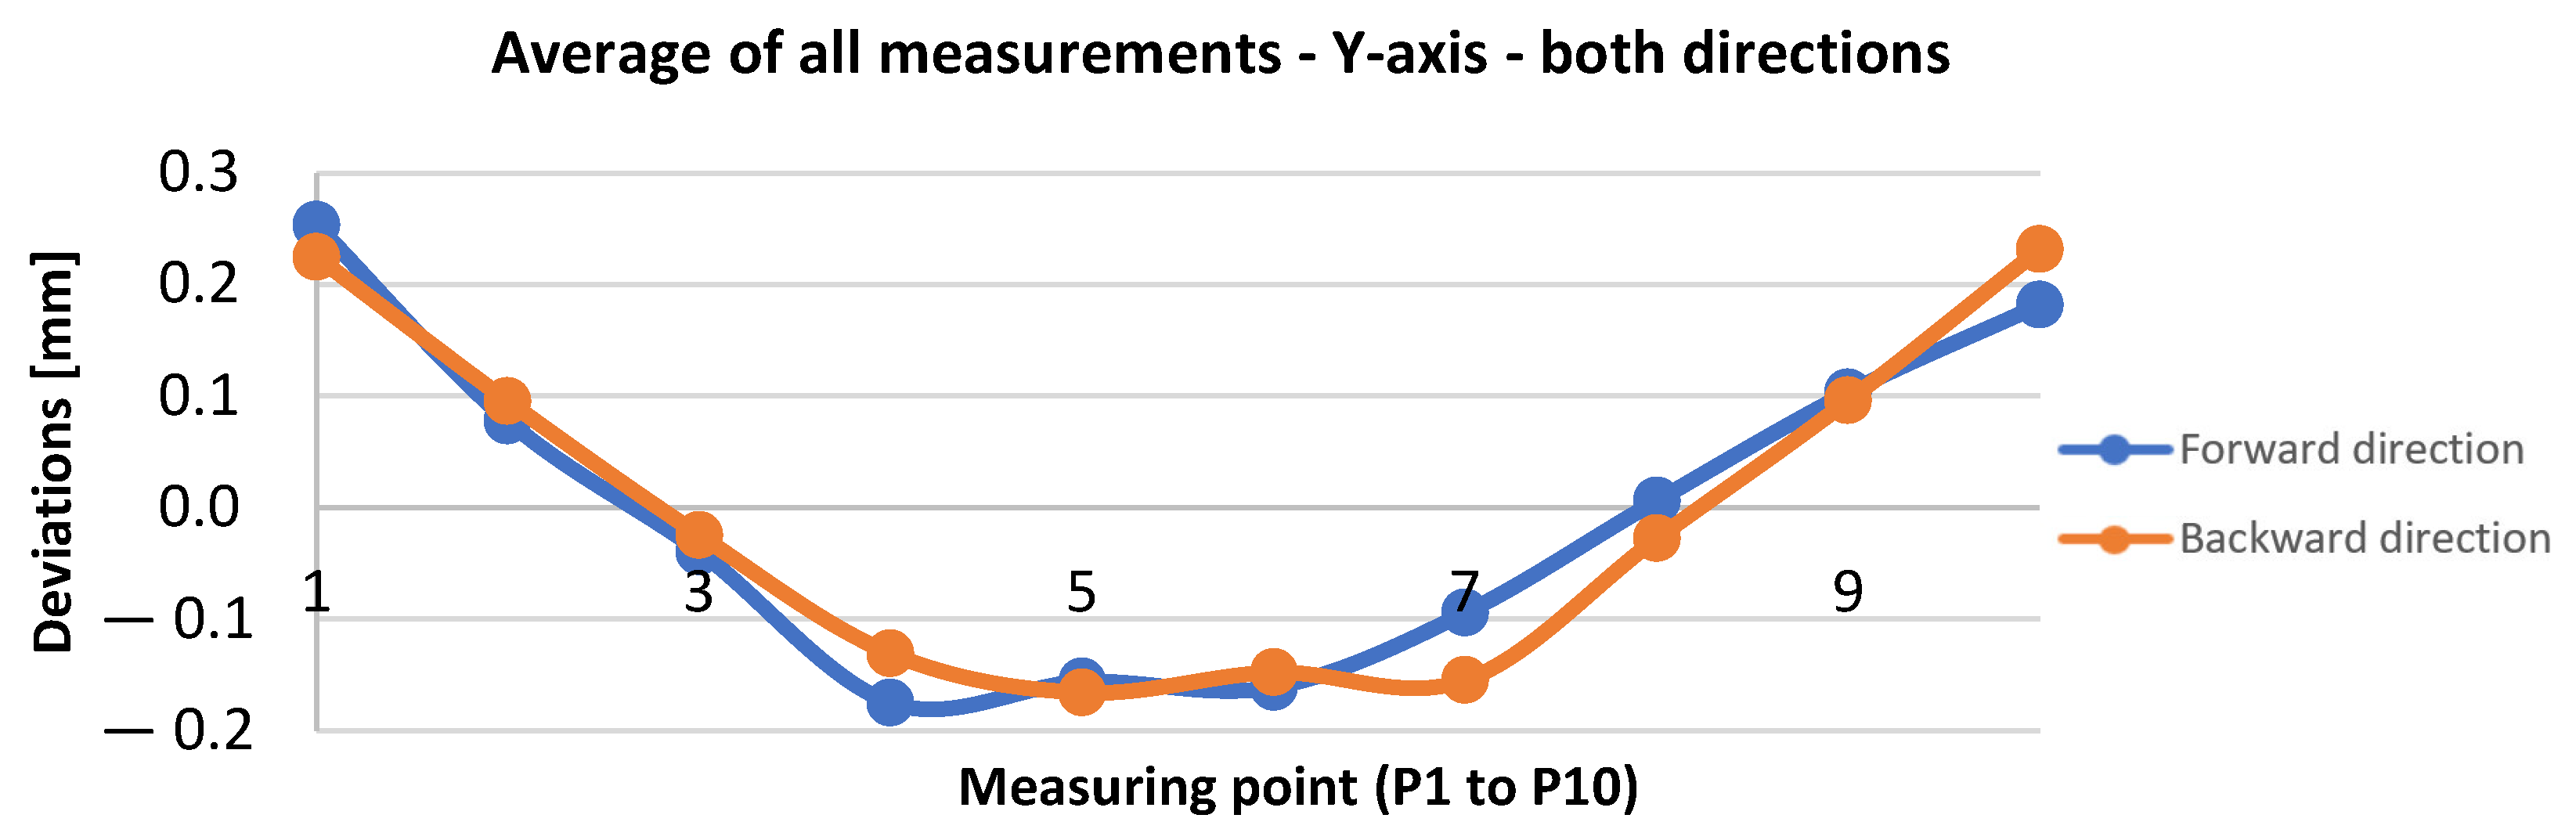
Figure 16 and
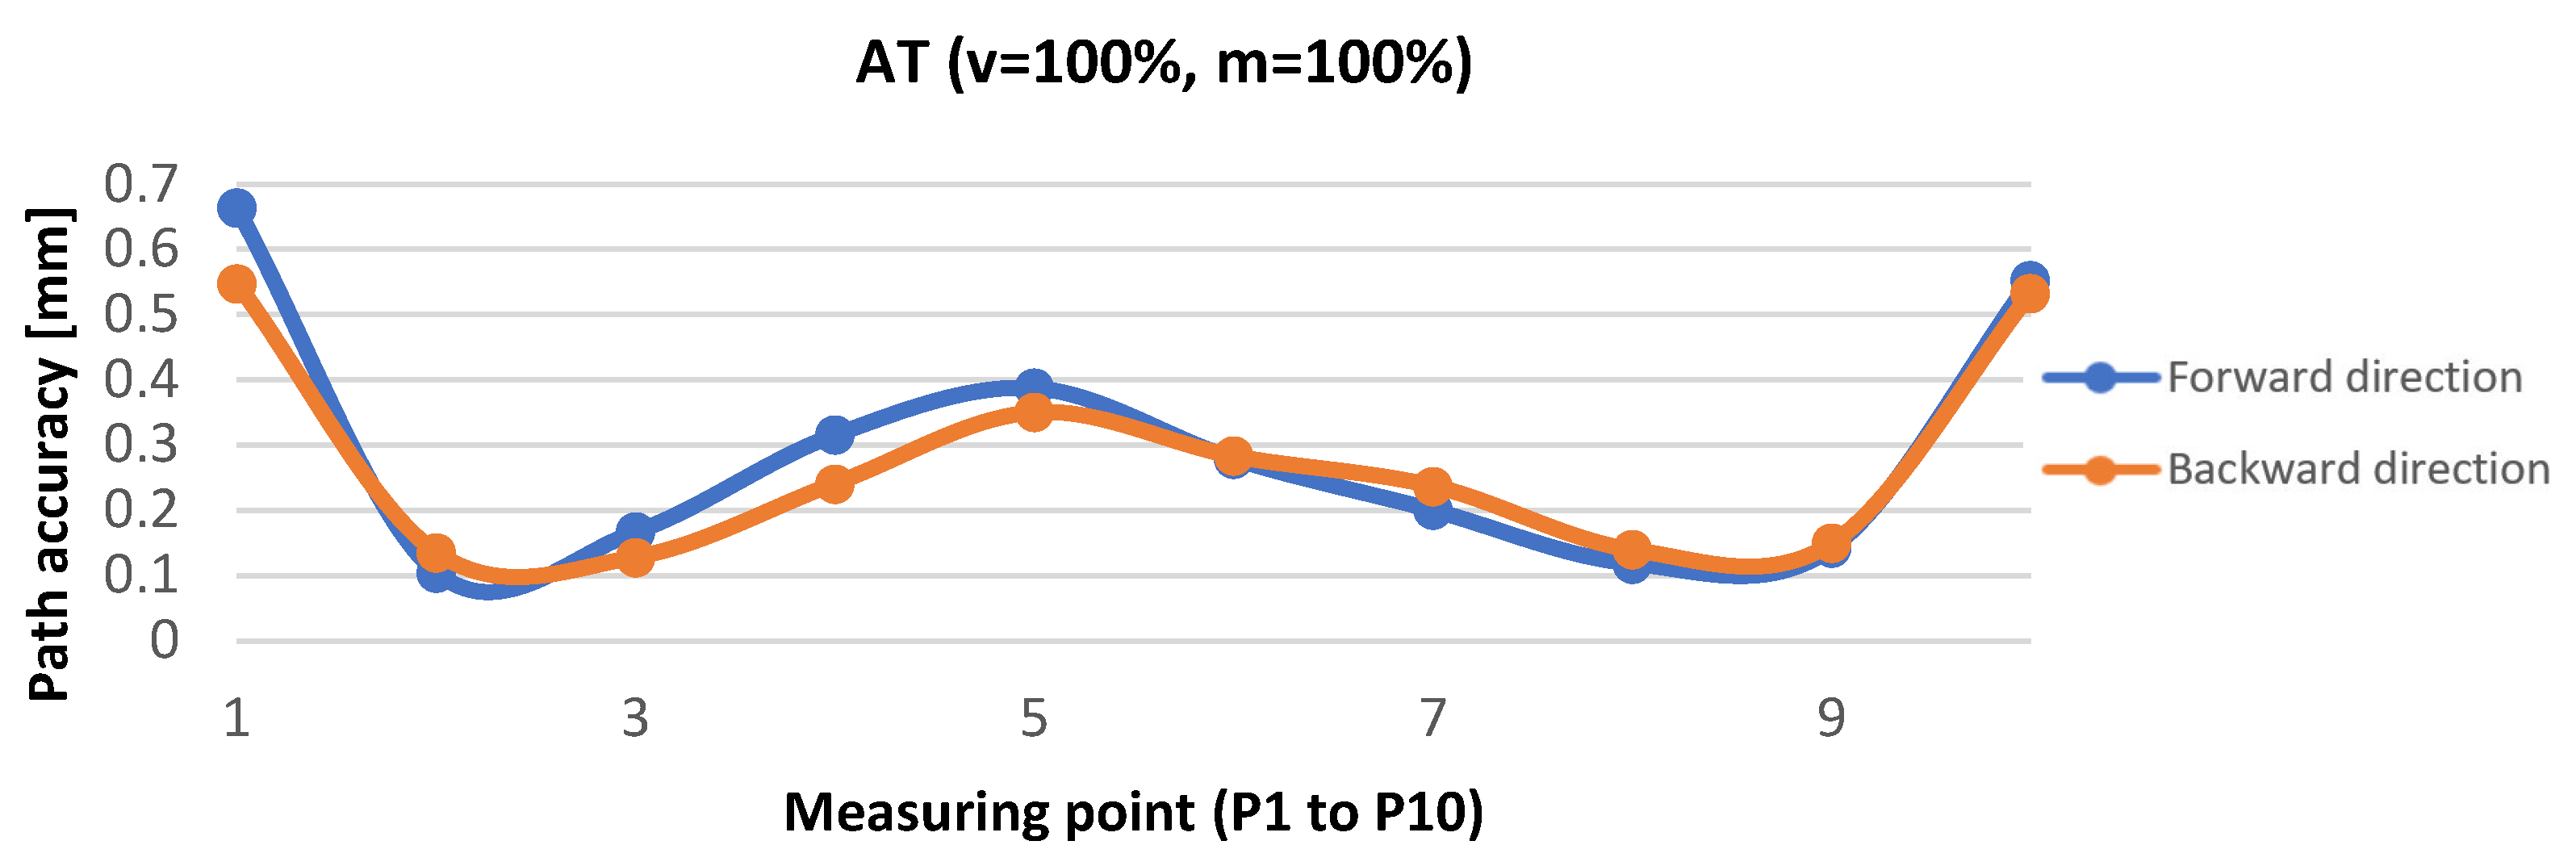
Figure 17 show the measured averages of all measurements. It can be said that the measurements were almost identical, and the robot did not manifest any abrupt deviations. These values served for the subsequent calculation of the path-accuracy values, and those are shown in
Figure 18. The manufacturer does not state path-accuracy values for this robot type, so these charts only aim to gain a better orientation in the topic.
Table 5 lists averages of 10 measurements at 50% speed and under a 100% load. The table shows values recorded using GEPARD at the measuring points P1 to P10, namely in both directions.
Figure 19 and
Figure 20 show measurements plotted at half the speed and maximum load for axes x and y. These measurements did not manifest any abrupt changes compared to previous measurements at maximum speed. The obtained values served as a basis for calculating the path-accuracy values shown in
Figure 21.
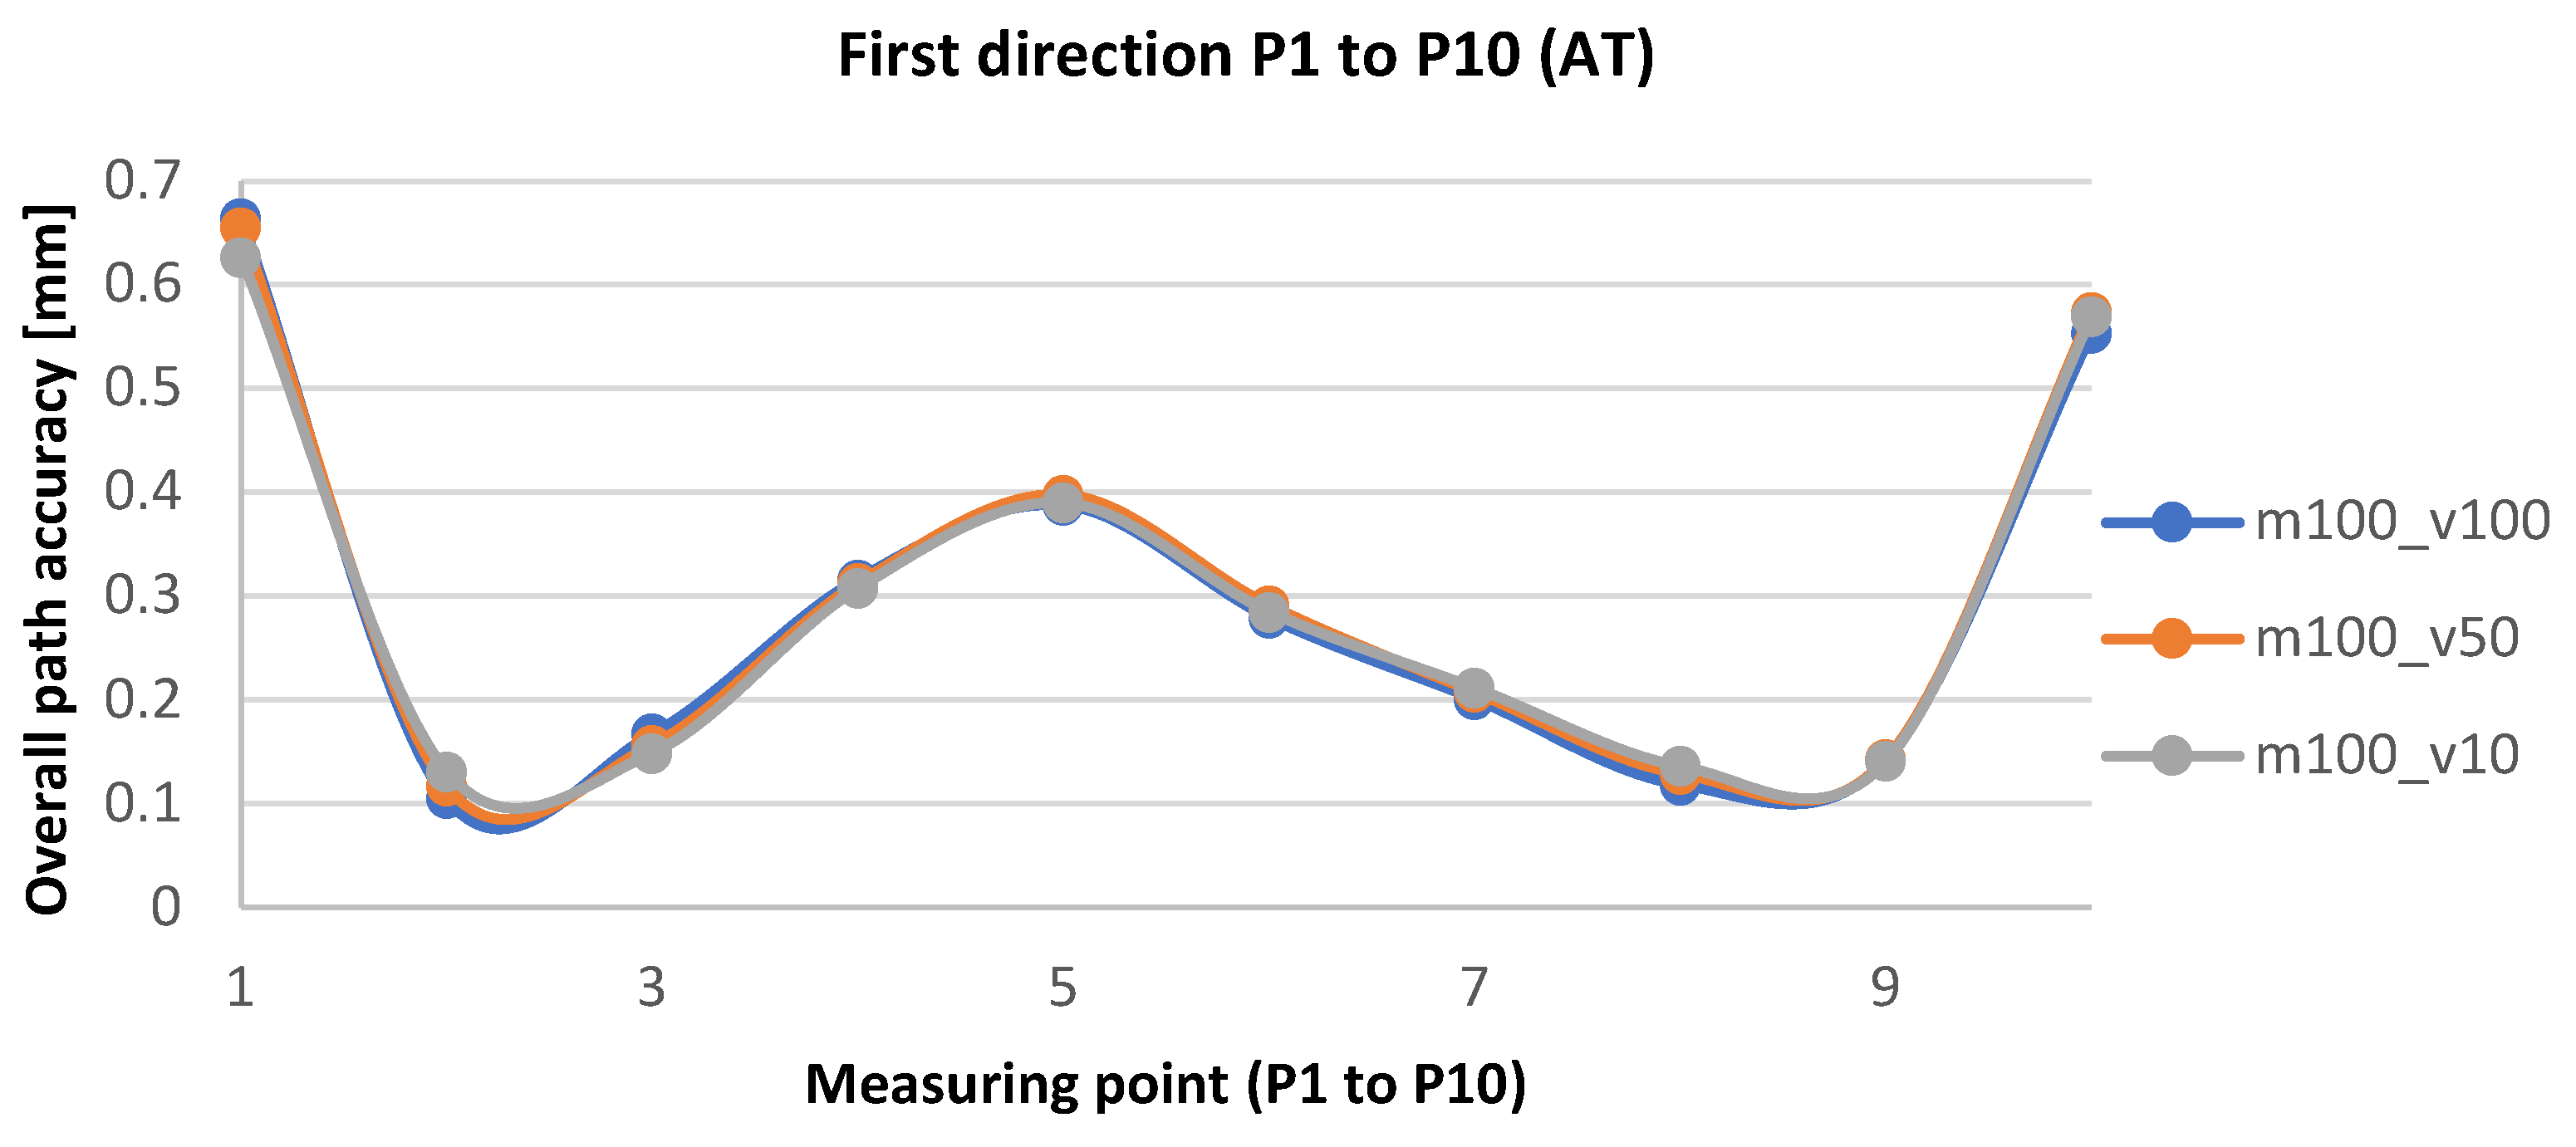
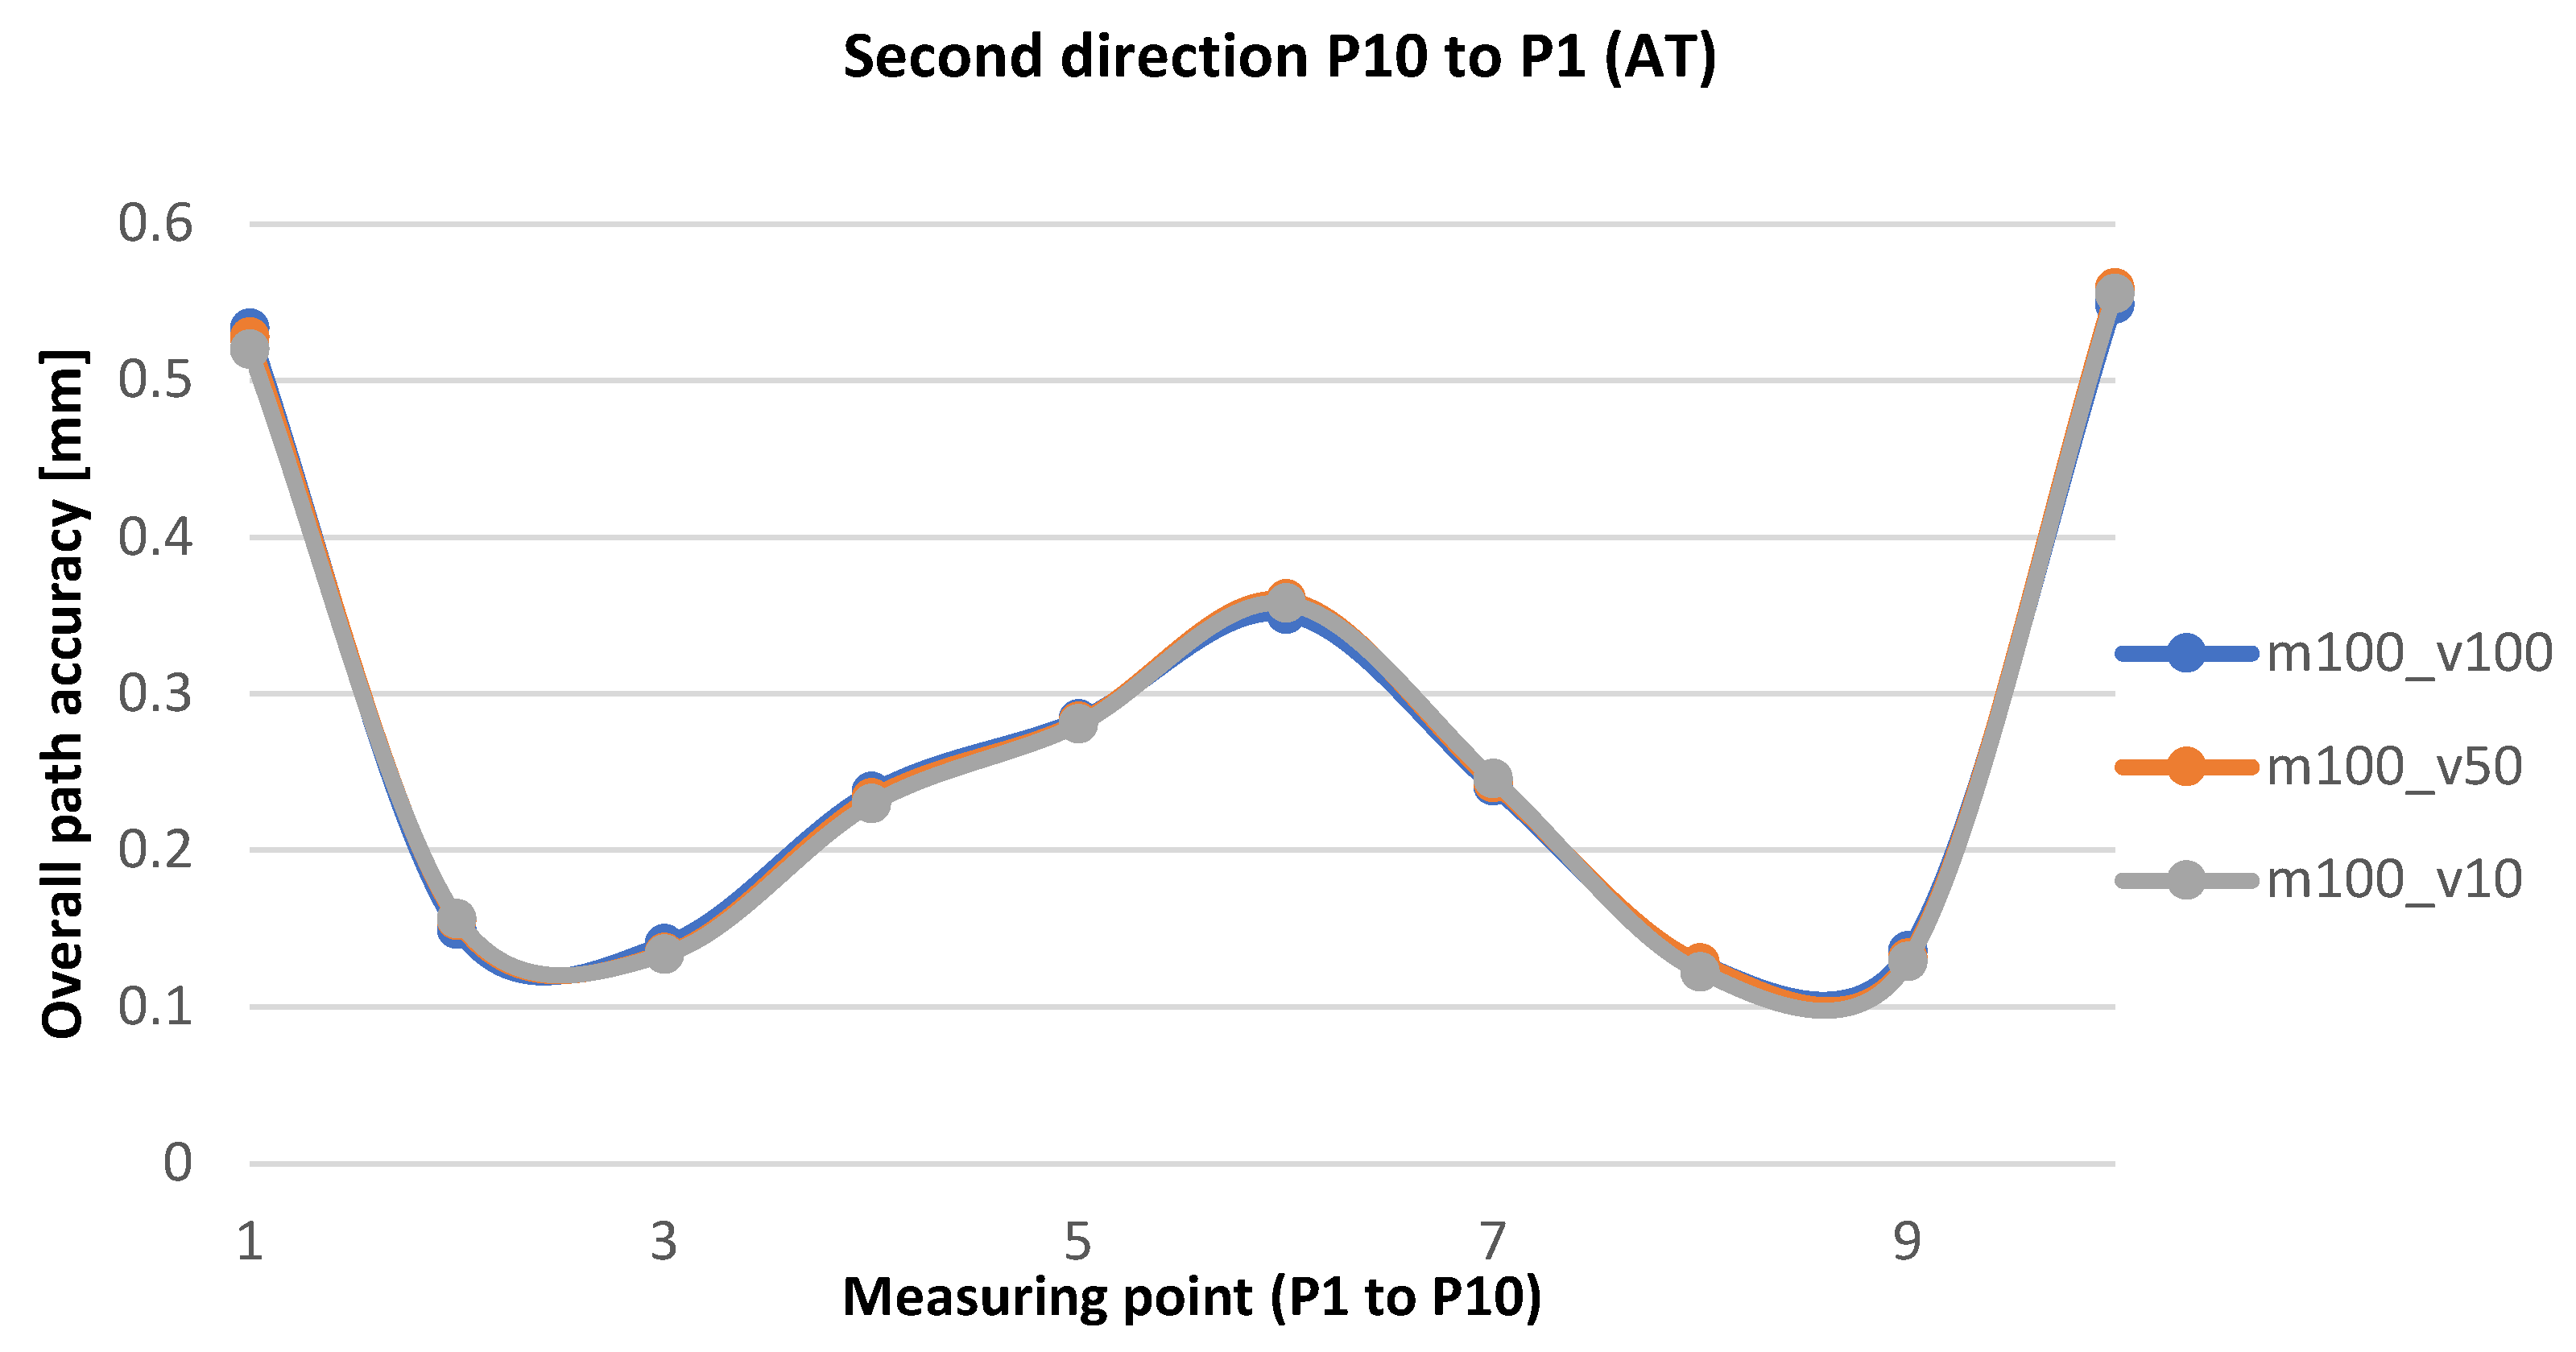
Overall measurements involving all three-speed options and the overall path accuracy are plotted in
Figure 22 and
Figure 23. For better clarity, each direction is shown separately.
Figure 22 and
Figure 23 present the total measurements performed and the path-accuracy results achieved at measuring points P1 to P10. In the ISO cube, these points are also referred to as points C2 to C8.
5. Discussion
The path accuracy of the robot is important in applications where it is necessary to follow the curve exactly. Currently, this parameter cannot be found in the robot parameters. The accuracy of this parameter depends not only on the mechanical accuracy of the robot but also on the control system, specifically, how exactly and with what frequency it determines individual positions.
The overall analysis of all the data measured and calculated has shown that a change in the nominal speed, namely from 10% to 50% or 100%, does not affect the overall path accuracy of the collaborative Fanuc robot. The ISO standard prescribes these measurements to be performed under a full nominal load, which, in our case, means 10 kg. The path-accuracy values remained at the same levels at changed speeds, or deviations were very small. Repeated measurements have manifested no abrupt deviations in the robot. As has been shown in the plotted overall path accuracy, it is clear that throughout its travel, the robot maintained a very stable path, and neither an increase nor a decrease in speed resulted in any errors.
The main advantage of the proposed experimental method is that the measuring system it has used, i.e., GEPARD, is highly precise. The uncertainty of measurement can be assessed from several points of view. The certainty of measurement is influenced by the measuring device, especially the PSD sensor, and the repeatability of aiming the center of the laser rays‘ beam at the PSD sensor. The manufacturer states the repeatability of measurement of the device itself is ±1 µm. Another effect influencing accuracy may be the situation of the receiver in the direction of the z-axis and the effect of the angle of the incident laser beam on the PSD sensor. This inaccuracy may be in the order of microns, yet precise positioning and aiming are capable of mostly eliminating it. The most important effect is the environment traversed by the laser beam. This impacts all measurements where the beam passes through the inhomogeneous environment, even those where measurement is performed using an autocollimator.
In addition, another advantage of this device compared to laser tracker technology is that it is several times cheaper. This experimental method is of a specific type, the main benefit of which is the lower price of the measuring chain, starting with the measuring system all the way up to making a flange with the weight. Further modification might yield automated data harvesting and rendering of the required charts that could serve the purpose of error detection, i.e., searching for significant deviations in the robot’s operation. The predictive power of these data should lead to the prevention of costly maintenance.
6. Conclusions
This study describes the results of measurements and a detailed analysis of the path accuracy of the Fanuc CRX-10iA robot. All measurements were performed using an imaginary cube defined by the ISO standard 9283, placed in the robot’s most frequently used workspace. The procedure for all measurements was created using this standard. Path accuracy was measured with a measuring device, GEPARD 5bt, with a suitable measuring setup. The results were then processed in their respective software. Measurements were performed under a 100% load on the robot‘s interface at three speed levels prescribed by the standard, namely at 10, 50, and 100% speed. The measurements were performed bidirectionally, from point P1 to point P10 and back. That is, a total of 20 data for axes x and y were processed with respect to each measurement. The study describes the experimental methodology of measuring path accuracy, which enabled the measuring of data, and using the ISO standard 9283, necessary data were further calculated and plotted in charts. Since the manufacturer does not provide the path-accuracy value for this robot type, the results are to inform further research.
Author Contributions
Conceptualization, J.S. (Ján Semjon) and R.J.; methodology, P.M.; software, M.S.; validation, Š.O.; data curation, P.M.; writing—review and editing, P.M.; visualization, J.S. (Ján Semjon); supervision, J.S. (Jozef Svetlík). All authors have read and agreed to the published version of the manuscript.
Funding
KEGA: 020TUKE-4/2022, KEGA: 043TUKE-4/2024, VEGA: 1/0215/23.
Institutional Review Board Statement
Not applicable.
Informed Consent Statement
Not applicable.
Data Availability Statement
The data presented in this study are available in the article.
Acknowledgments
This research was supported by project KEGA: 020TUKE-4/2022 Development and implementation of new approaches in teaching industrial and collaborative robotics, KEGA: 043TUKE-4/2024 Creation of prospective educational tools for the field of additive manufacturing with the implementation of progressive elements of virtual reality and VEGA: 1/0215/23 Research and development of robotic workplaces equipped with industrial and collaborative robots.
Conflicts of Interest
The authors declare no conflicts of interest.
References
- Peta, K.; Wlodarczyk, J.; Maniak, M. Analysis of trajectory and motion parameters of an industrial robot cooperating with a numerically controlled machine tools. J. Manuf. Process. 2023, 101, 1332–1342. [Google Scholar] [CrossRef]
- Shanmugasundar, G.; Kalita, K.; Čep, R.; Chohan, J.S. Decision Models for Selection of Industrial Robots—A Comprehensive Comparison of Multi-Criteria Decision Making. Processes 2023, 11, 1681. [Google Scholar] [CrossRef]
- Semjon, J.; Sukop, M.; Vagaš, M.; Jánoš, R.; Tuleja, P.; Koukolova, L.; Marcinko, P.; Juruš, O.; Varga, J. Comparison of the delta robot ABB IRB 360 properties after collisions. Commun. Sci. Lett. Univ. Zilina 2018, 20, 42–46. [Google Scholar] [CrossRef]
- Svetlík, J.; Demeč, P. Methods of Identifying the Workspace of Modular Serial Kinematic Structures. Appl. Mech. Mater. 2013, 309, 75–79. [Google Scholar] [CrossRef]
- ISO 9283: 1998; Manipulating Industrial Robots—Performance Criteria and Related Test Methods. International Organization for Standardization: Geneva, Switzerland, 1998; p. 60.
- ISO 10218-1:2011; Robots and Robotic Devices, Safety Requirements for Industrial Robots. International Organization for Standardization: Geneva, Switzerland, 2011; p. 43.
- ISO 13482:2014; Robots and Robotic Devices, Safety Requirements for Personal Care Robots. International Organization for Standardization: Geneva, Switzerland, 2014; p. 79.
- Nubiola, A.; Bonev, I. Absolute calibration of an ABB IRB 1600robot using a laser tracker. Robot. Comput.-Integr. Manuf. 2013, 29, 236–245. [Google Scholar] [CrossRef]
- Kuric, I.; Tlach, V.; Císar, M.; Sagova, Z.; Zajacko, I. Examination of industrial robot performance parameters utilizing machine tool diagnostic methods. Int. J. Adv. Robot. Syst. 2020, 17, 172988142090572. [Google Scholar] [CrossRef]
- Liu, Y.; Li, Y.; Zhuang, Z.; Song, T. Improvement of Robot Accuracy with an Optical Tracking System. Sensors 2020, 20, 6341. [Google Scholar] [CrossRef]
- Slamani, M.; Joubair, A.; Bonev, I. A comparative evaluation of three industrial robots using three reference measuring techniques. Ind. Robot. Int. J. 2015, 42, 572–585. [Google Scholar] [CrossRef]
- Nubiola, A.; Bonev, I.A. Absolute robot calibration with a single telescoping ballbar. Precis. Eng. 2014, 38, 472–480. [Google Scholar] [CrossRef]
- Józwik, J.; Jacniacka, E.; Ostrowski, D. Uncertainty measurement with the kinematic telescopic bar during industrial robot inaccuracy tests. In Proceedings of the ITM Web Conf. II International Conference of Computational Methods in Engineering Science (CMES’17), Lublin, Poland, 23–25 November 2017. [Google Scholar] [CrossRef]
- ISO 230-1:2012; Test Code for Machine Tools. International Organization for Standardization: Geneva, Switzerland, 2012; p. 160.
- Chachane, K.; Ohol, S.; Chiwande, S. Industrial robot performance analysis using low cost set-up. IOP Conf. Ser. Mater. Sci. Eng. 2021, 1012, 012010. [Google Scholar] [CrossRef]
- Cui, S.; Chen, Y.; Li, X. A Robust and Efficient UAV Path Planning Approach for Tracking Agile Targets in Complex Environments. Machines 2022, 10, 931. [Google Scholar] [CrossRef]
- Pollák, M.; Goryl, K. Simulation Design and Measurement of Welding Robot Repeatability Utilizing the Contact Measurement Method. Machines 2023, 11, 734. [Google Scholar] [CrossRef]
- Szybicki, D.; Obal, P.; Kurc, K.; Gierlak, P. Programming of Industrial Robots Using a Laser Tracker. Sensors 2022, 22, 6464. [Google Scholar] [CrossRef]
- Raytec Systems. Available online: https://www.raytec.ch/en/products/gepard-system.html (accessed on 20 August 2023).
- Ondočko, Š.; Svetlík, J.; Šašala, M.; Bobovský, Z.; Stejskal, T.; Dobránsky, J.; Demeč, P.; Hrivniak, L. Inverse Kinematics Data Adaptation to Non-Standard Modular Robotic Arm Consisting of Unique Rotational Modules. Appl. Sci. 2021, 11, 1203. [Google Scholar] [CrossRef]
- Semjon, J.; Janos, R.; Sukop, M.; Tuleja, P.; Hajduk, M.; Jurus, O.; Marcinko, P.; Virgala, I.; Vagas, M. Verification of the UR5 Robot’s Properties after a Crash Caused by a Fall of a Transfered Load from a Crane. Int. J. Adv. Robot. Syst. 2020, 17, 1729881420904209. [Google Scholar] [CrossRef]
- Hoffmann, C. Accuracy-Tests for Industrial Robots. IFAC Proc. Vol. 1988, 21, 103–108. [Google Scholar] [CrossRef]
- Simiński, P.; Kończak, J.; Przybysz, K. Analysis and Testing of Reliability Information Systems in Analysis of the Operation-Related Process in the Army. J. Konbin 2018, 47, 105–122. [Google Scholar] [CrossRef]
- Shu, T.; Gharaaty, S.; Xie, W.-F.; Joubair, A.; Bonev, I. Dynamic Path Tracking of Industrial Robots with High Accuracy Using Photogrammetry Sensor. IEEE/ASME Trans. Mechatron. 2018, 23, 1159–1170. [Google Scholar] [CrossRef]
- Fan, K.-C.; Wang, H.-Y.; Yang, H.-W.; Chen, L.-M. Techniques of multi-degree-of-freedom measurement on the linear motion errors of precision machines. Adv. Opt. Technol. 2014, 3, 375–386. [Google Scholar] [CrossRef]
- ISO. Available online: https://emanual.robotis.com/docs/en/dxl/mx/mx-28/ (accessed on 25 August 2022).
- Kuric, I.; Tlach, V.; Sagova, Z.; Císar, M.; Gritsuk, I. Measurement of industrial robot pose repeatability. MATEC Web Conf. 2018, 244, 01015. [Google Scholar] [CrossRef]
- Lin, Z.; Dai, H.; Wu, Z.; Zeng, Y.; Su, S.; Xia, X.; Lin, M.; Yu, P. Analysis of a Six-Axis Industrial Robot´s Dynamic Path Accuracy Based on an Optical Tracker. In Proceedings of the 2017 5th International Conference on Enterprise Systems (ES), Beijing, China, 22–24 September 2017; pp. 178–184. [Google Scholar] [CrossRef]
- Morozov, M.; Riise, J.; Summan, R.; Pierce, S.; Mineo, C.; MacLeod, C.; Brown, R. Assesing the Accuracy of Industrial Robots through Metrology for the Enhancement of Automated Non-Destructive Testing. In Proceedings of the 2016 IEEE International Conference on Multisensor Fusion and Integration for Intelligent Systems (MFI), Baden-Baden, Germany, 19–21 September 2016. [Google Scholar] [CrossRef]
- Breedon, P.; Sivayoganathan, L.; Balendran, V.; Al-Dabass, D. Multi-axis fuzzy control and performance analysis for an industrial robot. In Proceedings of the 2002 IEEE World Congress on Computational Intelligence. 2002 IEEE International Conference on Fuzzy Systems. FUZZ-IEEE’02. Proceedings (Cat. No.02CH37291), Honolulu, HI, USA, 12–17 May 2002; Volume 1, pp. 500–505. [Google Scholar] [CrossRef]
- Fanuc CRX-10iA. Available online: https://www.fanuc.eu/sk/sk/robots/robot-filter-page/spolupracuj%C3%BAce-roboty/crx-10ia (accessed on 5 September 2022).
- Slamani, M.; Nubiola, A.; Bonev, I. Assessment of the positioning performance of an industrial robot. Ind. Robot. Int. J. Robot. Res. Appl. 2012, 39, 57–68. [Google Scholar] [CrossRef]
Figure 1.
Laser receiver—transmitter with PSD.
Figure 1.
Laser receiver—transmitter with PSD.
Figure 2.
Software GEPARD, v 6.30.1.
Figure 2.
Software GEPARD, v 6.30.1.
Figure 3.
Representation of the measure taken via the ISO line.
Figure 3.
Representation of the measure taken via the ISO line.
Figure 4.
Path accuracy for the linear path.
Figure 4.
Path accuracy for the linear path.
Figure 5.
Path accuracy for the circular path.
Figure 5.
Path accuracy for the circular path.
Figure 6.
Measuring cube with measuring plane (C1–C2–C7–C8).
Figure 6.
Measuring cube with measuring plane (C1–C2–C7–C8).
Figure 7.
Measuring with GEPARD (receiver–transmitter).
Figure 7.
Measuring with GEPARD (receiver–transmitter).
Figure 8.
Kinematic model of CRX-10iA.
Figure 8.
Kinematic model of CRX-10iA.
Figure 9.
The course of position measurement is plotted on the graph.
Figure 9.
The course of position measurement is plotted on the graph.
Figure 10.
The course of velocity measurement is plotted on the graph.
Figure 10.
The course of velocity measurement is plotted on the graph.
Figure 11.
The course of acceleration analysis is plotted on the graph.
Figure 11.
The course of acceleration analysis is plotted on the graph.
Figure 12.
First and last measuring point in the ISO cube.
Figure 12.
First and last measuring point in the ISO cube.
Figure 13.
Location of the measuring cube, plane, and the path measured.
Figure 13.
Location of the measuring cube, plane, and the path measured.
Figure 14.
Measuring setup.
Figure 14.
Measuring setup.
Figure 15.
Cycles of measurements.
Figure 15.
Cycles of measurements.
Figure 16.
Plot of values for axis x with maximum speed 1000 mm/s.
Figure 16.
Plot of values for axis x with maximum speed 1000 mm/s.
Figure 17.
Plot of values for axis y with maximum speed 1000 mm/s.
Figure 17.
Plot of values for axis y with maximum speed 1000 mm/s.
Figure 18.
Path accuracy under a 100% load and at 100% speed.
Figure 18.
Path accuracy under a 100% load and at 100% speed.
Figure 19.
Plot of values for axis x at a maximum speed of 500 mm/s.
Figure 19.
Plot of values for axis x at a maximum speed of 500 mm/s.
Figure 20.
Plot of values for axis y at a maximum speed of 500 mm/s.
Figure 20.
Plot of values for axis y at a maximum speed of 500 mm/s.
Figure 21.
Path accuracy at 50% speed and under a 100% load.
Figure 21.
Path accuracy at 50% speed and under a 100% load.
Figure 22.
Overall path accuracy plotted under a 100% load and at 100%, 50%, and 10% speed, respectively, for points P1 to P10.
Figure 22.
Overall path accuracy plotted under a 100% load and at 100%, 50%, and 10% speed, respectively, for points P1 to P10.
Figure 23.
Overall path accuracy plotted under a 100% load and at 100%, 50%, and 10% speed, respectively, for points P10 to P1.
Figure 23.
Overall path accuracy plotted under a 100% load and at 100%, 50%, and 10% speed, respectively, for points P10 to P1.
Table 1.
Table of parameters GEPARD 5 bt system.
Table 1.
Table of parameters GEPARD 5 bt system.
| Laser Transmitter | GEPARD 5 bt | Laser Receiver | GEPARD 5 bt |
|---|
| Laser power | <1 mW | Measuring range | 15 × 15 mm |
| Laser class | 2 | Measurement resolution | 0.5 μm |
| Wavelength | 650 nm | Linearity | 0.04% |
| Beam cross-section | circle | Repeatability | ±0.25 μm |
| Power supply | Li-on 7.2 V | Power supply | Li-on 7.2 V |
| Dimensions | 142 × 50 × 50 mm | Dimensions | 142 × 50 × 50 mm |
| Weight | 730 g | Temperature range | 10–45 °C |
| Beam adjustment | Yes | Measuring distance | 0–15 m |
Table 2.
Parameters of robot Fanuc CRX-10iA.
Table 2.
Parameters of robot Fanuc CRX-10iA.
| Model | CRX-10iA |
|---|
| Type | 6 axes (J1, J2, J3, J4, J5, J6) |
| Reach | 1249 mm |
| Axis | Motion range (maximum speed) |
| Axis J1 | 380° (120°/s) |
| Axis J2 | 360° (120°/s) |
| Axis J3 | 570° (180°/s) |
| Axis J4 | 380° (180°/s) |
| Axis J5 | 360° (180°/s) |
| Axis J6 | 450° (180°/s) |
| Max. speed in collaborative mode | 1000 mm/s |
| Repeatability | ±0.04 mm |
Table 3.
D-H parameters Fanuc CRX-10iA.
Table 3.
D-H parameters Fanuc CRX-10iA.
| Link | αi | ai | ϕi | di |
|---|
| 1 | −π/2 | 0.218 | q1 | 0.159 |
| 2 | 0 | 0.540 | q2 | 0.000 |
| 3 | −π/2 | 0.000 | q3 | 0.218 |
| 4 | π/2 | 0.000 | q4 | 0.540 |
| 5 | −π/2 | 0.000 | q5 | 0.150 |
| 6 | 0 | 0.000 | q6 | 0.160 |
Table 4.
Measured averages for the x- and y-axes and the calculated AT values (m = 100% and v = 100%).
Table 4.
Measured averages for the x- and y-axes and the calculated AT values (m = 100% and v = 100%).
| Point | X | Y | AT |
|---|
| 1 | 0.617 | 0.248 | 0.6655 |
| 2 | 0.071 | 0.0777 | 0.1052 |
| 3 | −0.163 | −0.037 | 0.1676 |
| 4 | −0.266 | −0.170 | 0.3162 |
| 5 | −0.356 | −0.153 | 0.3879 |
| 6 | −0.233 | −0.154 | 0.2795 |
| 7 | −0.176 | −0.096 | 0.2007 |
| 8 | −0.118 | 0.002 | 0.1183 |
| 9 | 0.105 | 0.097 | 0.1429 |
| 10 | 0.521 | 0.186 | 0.5534 |
| 10 | 0.498 | 0.229 | 0.5489 |
| 9 | 0.096 | 0.095 | 0.1357 |
| 8 | −0.123 | −0.035 | 0.1283 |
| 7 | −0.185 | −0.154 | 0.2412 |
| 6 | −0.318 | −0.148 | 0.3509 |
| 5 | −0.235 | −0.159 | 0.2838 |
| 4 | −0.198 | −0.131 | 0.2376 |
| 3 | −0.139 | −0.019 | 0.1403 |
| 2 | 0.118 | 0.092 | 0.1499 |
| 1 | 0.485 | 0.221 | 0.5336 |
Table 5.
Contains measurements at 50% speed and under a full load (mm).
Table 5.
Contains measurements at 50% speed and under a full load (mm).
| P | X | Y | AT |
|---|
| 1 | 0.604 | 0.253 | 0.6552 |
| 2 | 0.087 | 0.078 | 0.1170 |
| 3 | −0.151 | −0.039 | 0.1567 |
| 4 | −0.259 | −0.174 | 0.3125 |
| 5 | −0.366 | −0.155 | 0.3977 |
| 6 | −0.243 | −0.160 | 0.2914 |
| 7 | −0.185 | −0.093 | 0.2078 |
| 8 | −0.128 | 0.007 | 0.1289 |
| 9 | 0.099 | 0.103 | 0.1432 |
| 10 | 0.540 | 0.181 | 0.5735 |
| 10 | 0.509 | 0.232 | 0.5593 |
| 9 | 0.088 | 0.096 | 0.1309 |
| 8 | −0.125 | −0.027 | 0.1282 |
| 7 | −0.188 | −0.154 | 0.2435 |
| 6 | −0.328 | −0.147 | 0.3604 |
| 5 | −0.228 | −0.166 | 0.2822 |
| 4 | −0.194 | −0.130 | 0.2337 |
| 3 | −0.132 | −0.024 | 0.1345 |
| 2 | 0.122 | 0.095 | 0.1553 |
| 1 | 0.477 | 0.224 | 0.5278 |
| Disclaimer/Publisher’s Note: The statements, opinions and data contained in all publications are solely those of the individual author(s) and contributor(s) and not of MDPI and/or the editor(s). MDPI and/or the editor(s) disclaim responsibility for any injury to people or property resulting from any ideas, methods, instructions or products referred to in the content. |
© 2024 by the authors. Licensee MDPI, Basel, Switzerland. This article is an open access article distributed under the terms and conditions of the Creative Commons Attribution (CC BY) license (https://creativecommons.org/licenses/by/4.0/).


