
Deciphering Autonomous Vehicle Regulations with Machine Learning


Abstract
1. Introduction
2. Literature Review
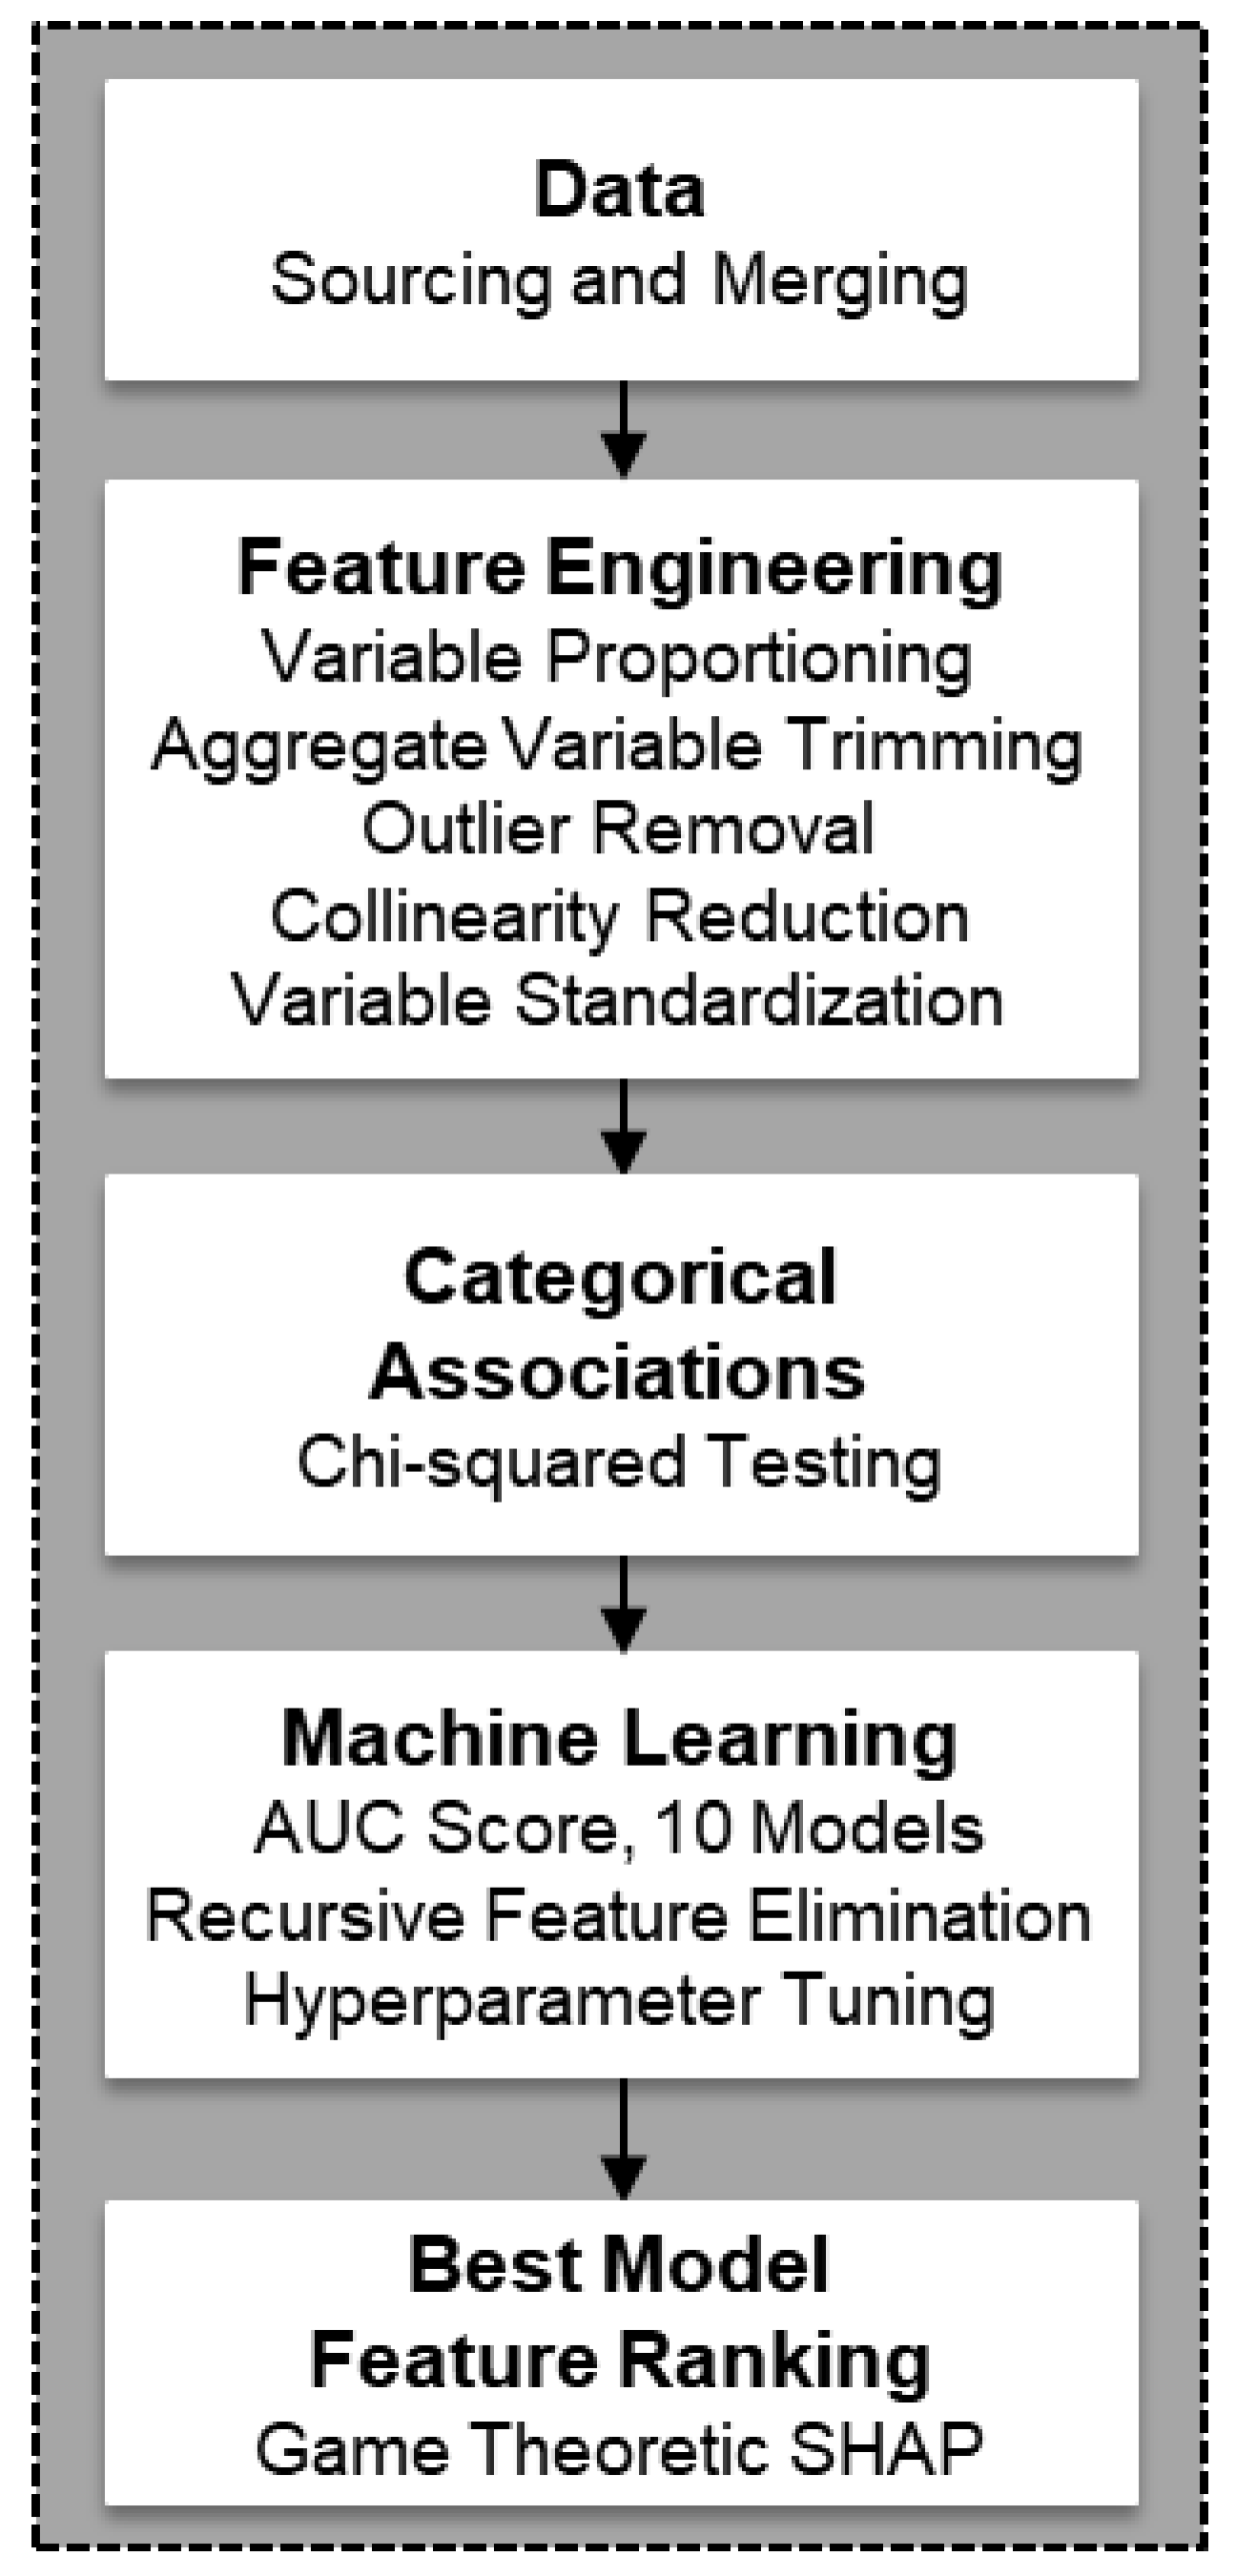
3. Methodology
3.1. Data and Feature Engineering
3.2. Categorical Associations
3.3. Machine Learning
3.3.1. Measure of Predictive Performance
3.3.2. Recursive Feature Elimination (RFE)
3.3.3. Hyperparameter Tuning
3.4. Feature Ranking
4. Results
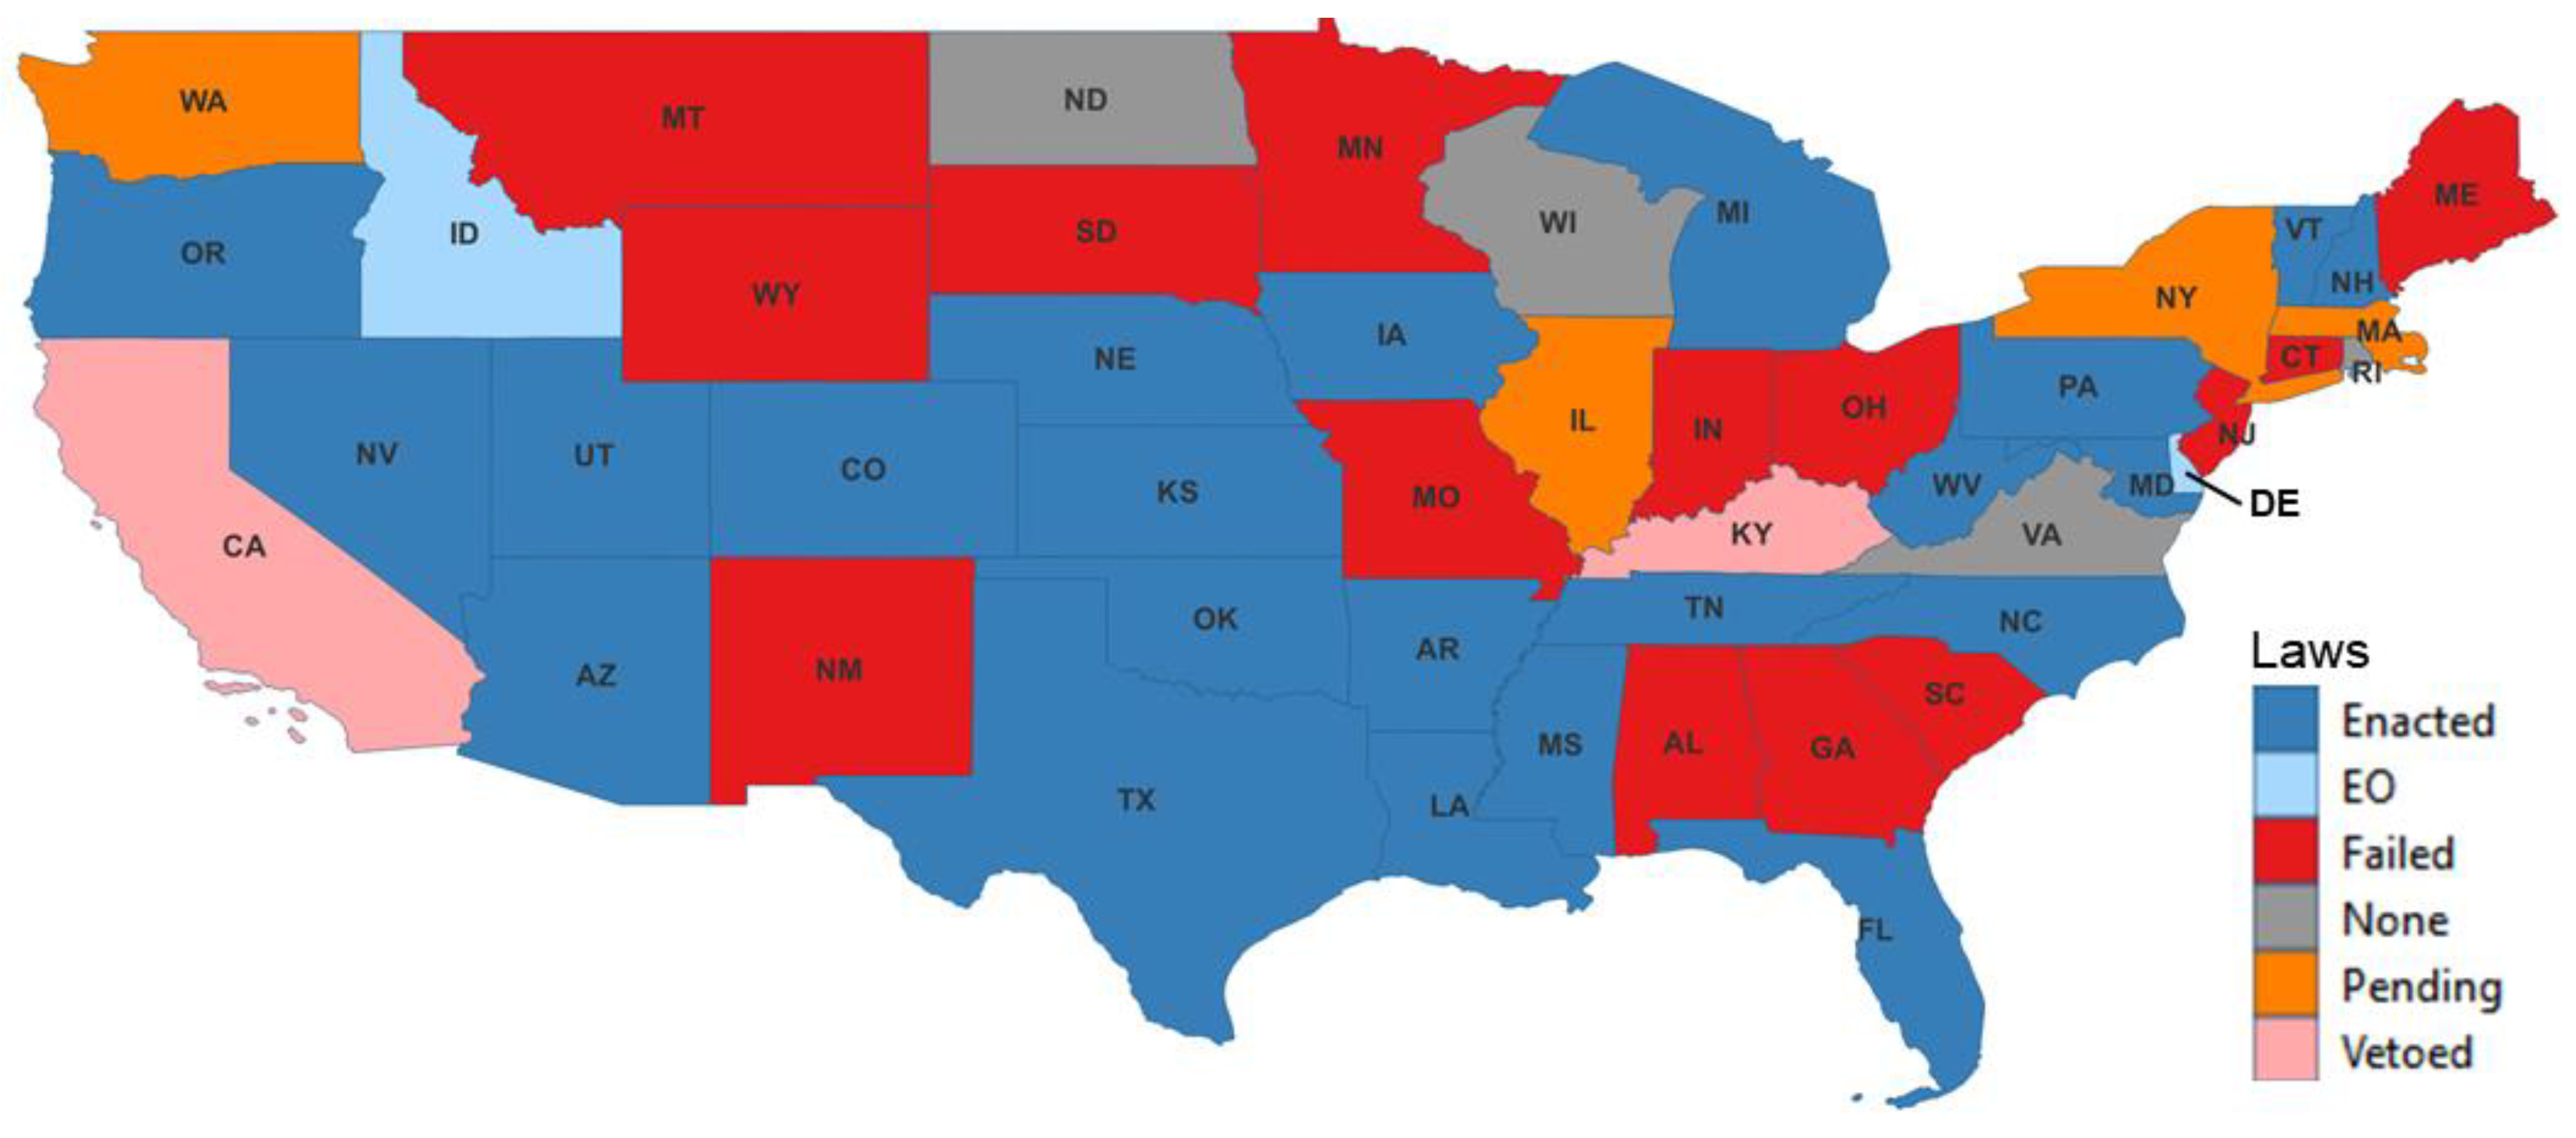
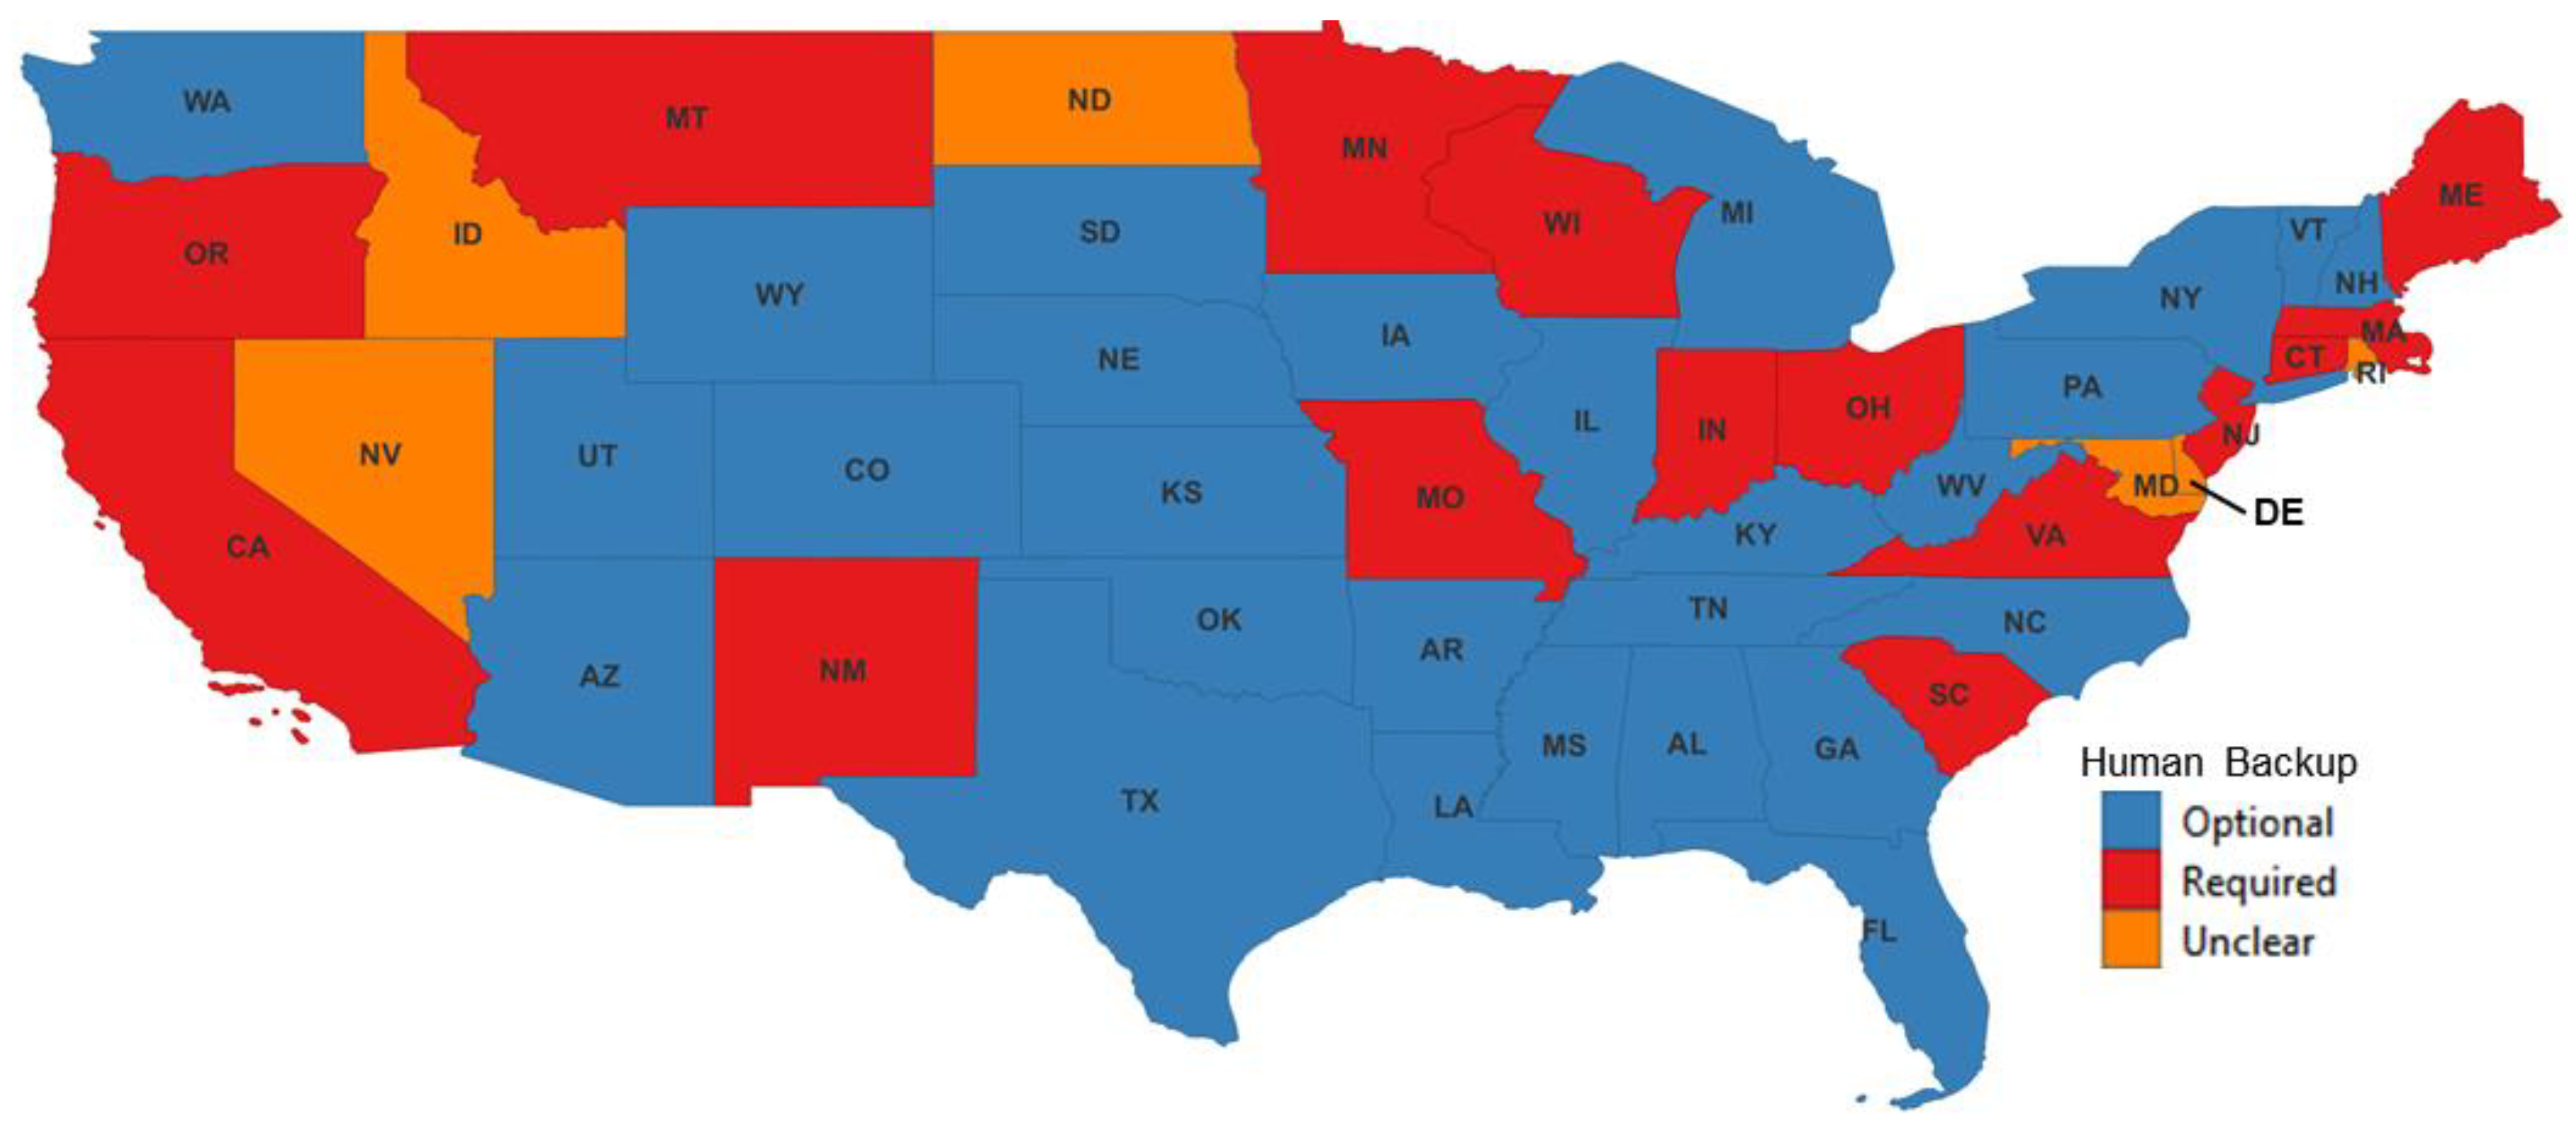
4.1. Legislative Status
- Vehicles must have obtained a title and have a valid manufacturer’s certificate.
- Vehicles must have registration and insurance.
- Vehicles must comply with all applicable state and federal regulations or have an exemption.
- Occupants must comply with safety belt and child passenger restraining system requirements.
- Operators must possess the proper class of driver’s license for the type of vehicle they operate unless specifically exempted by the law.
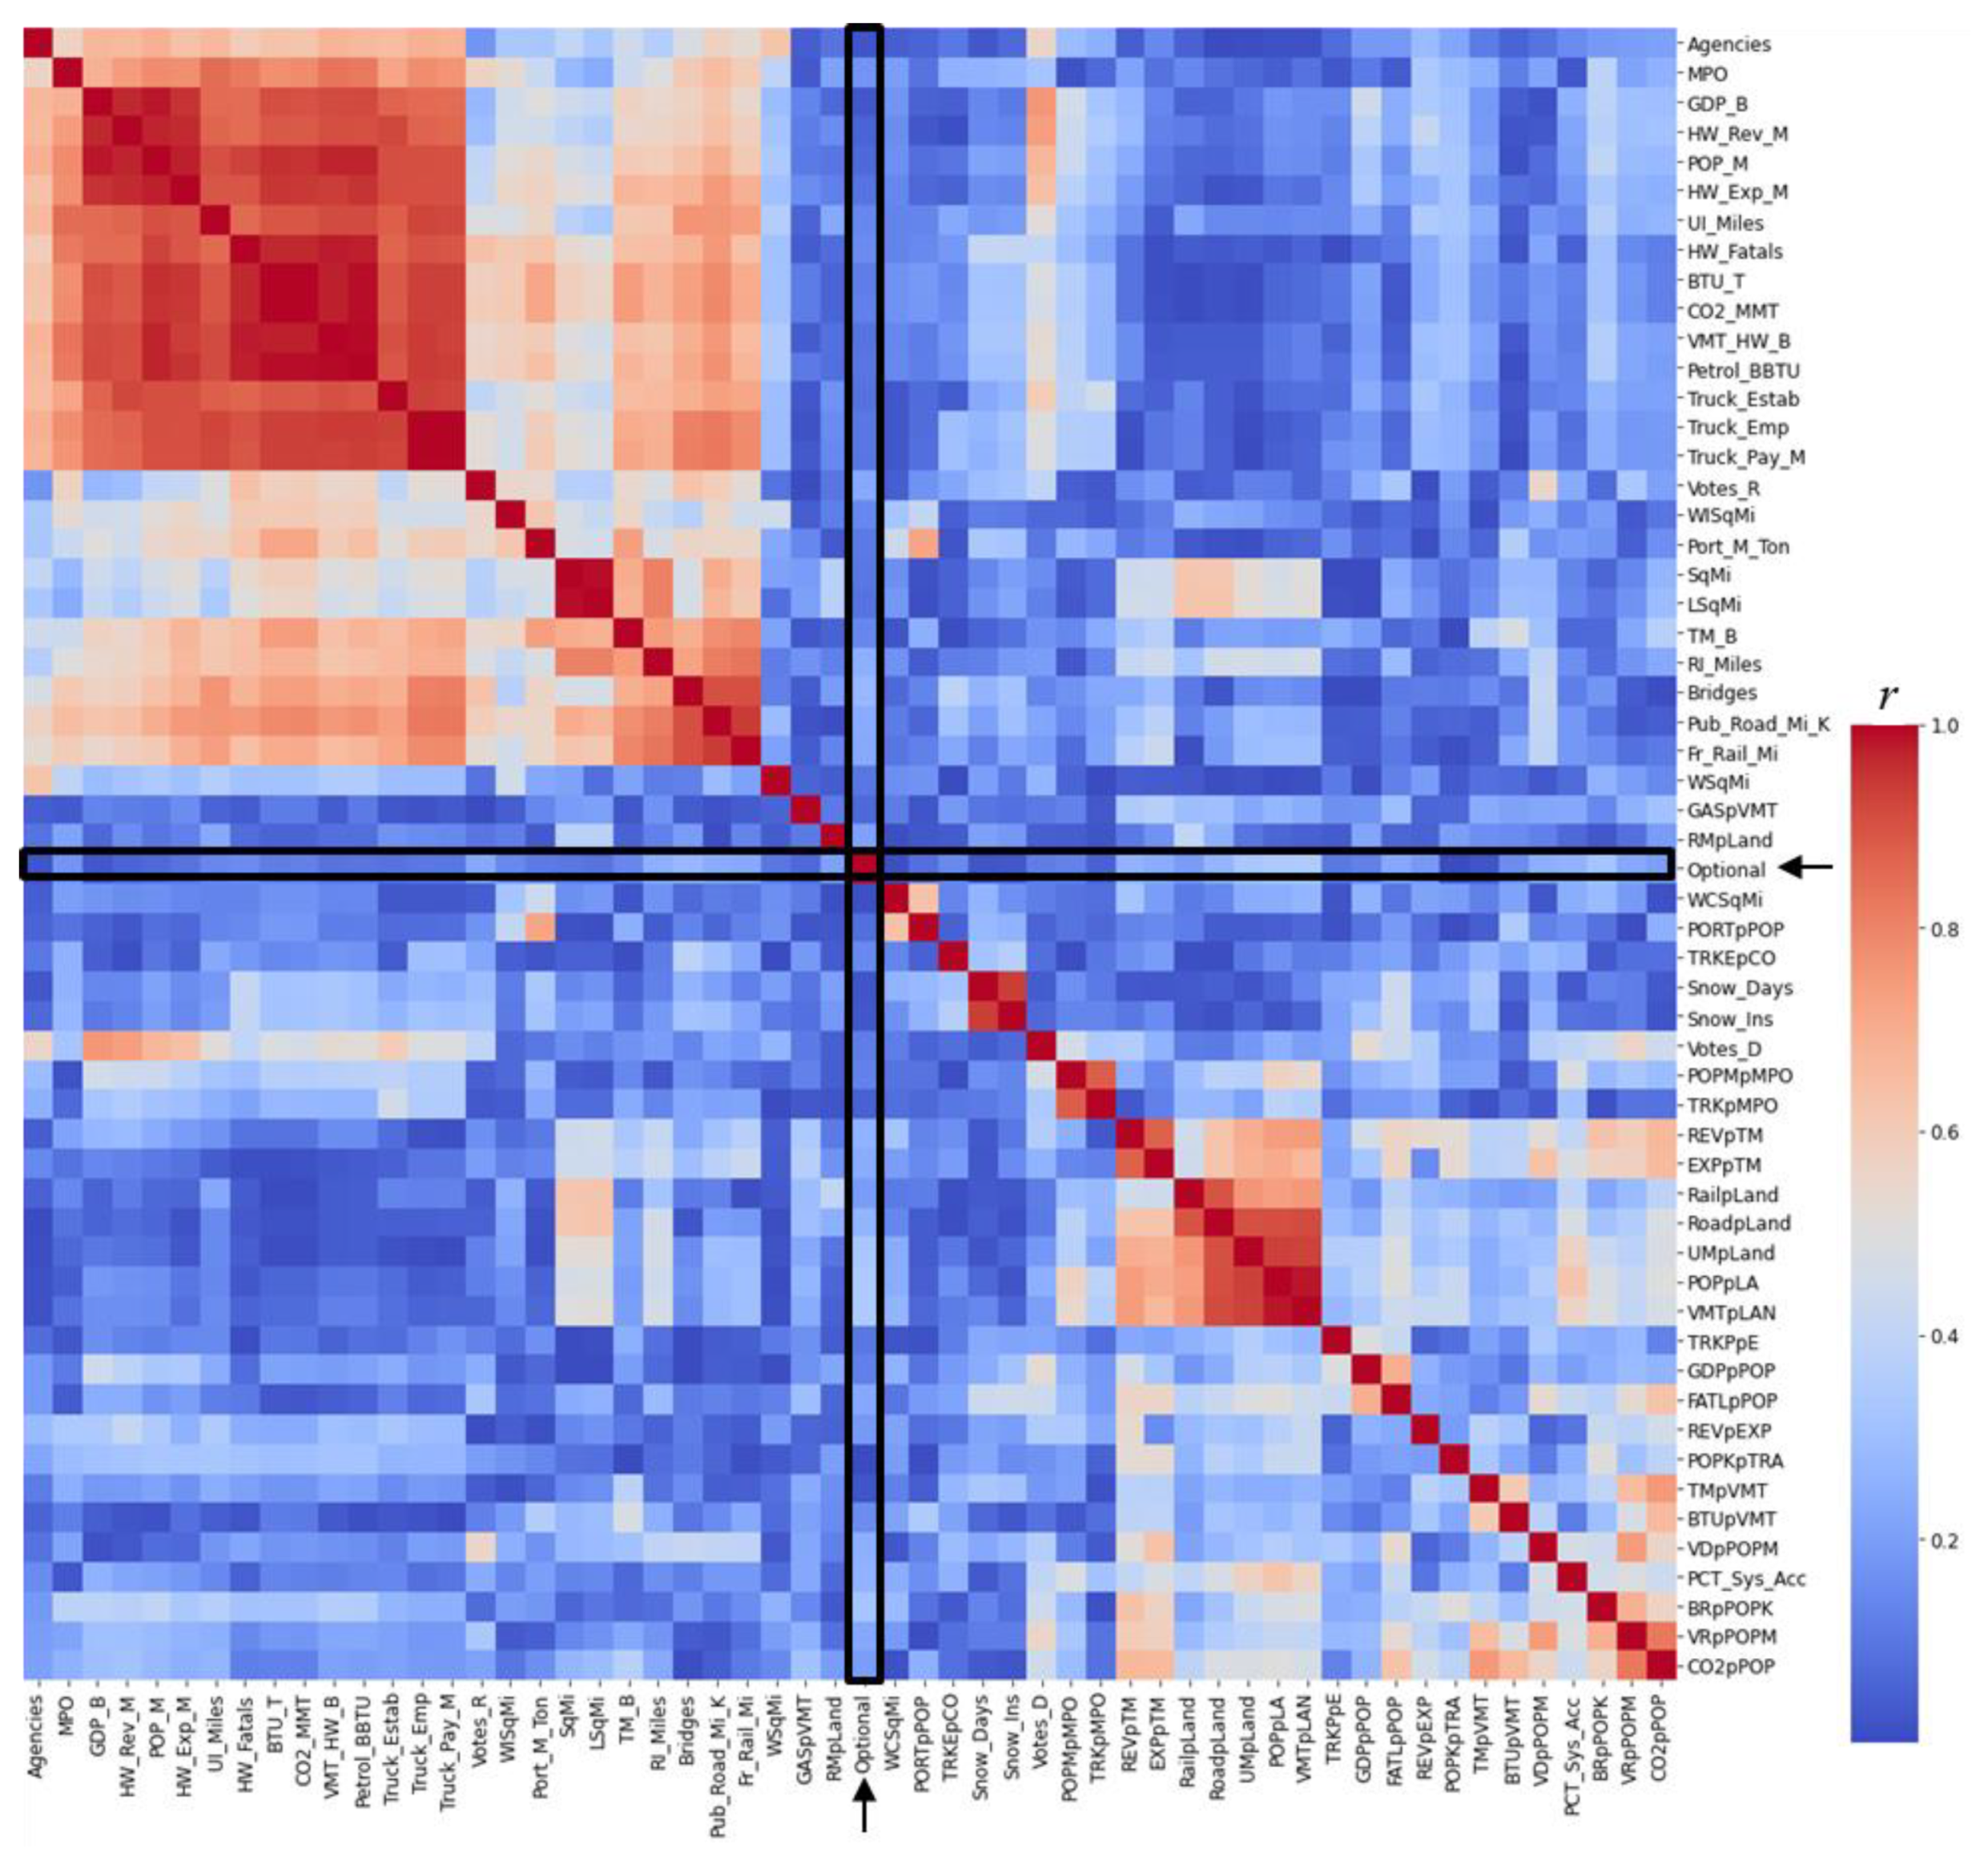
4.2. Feature Engineering
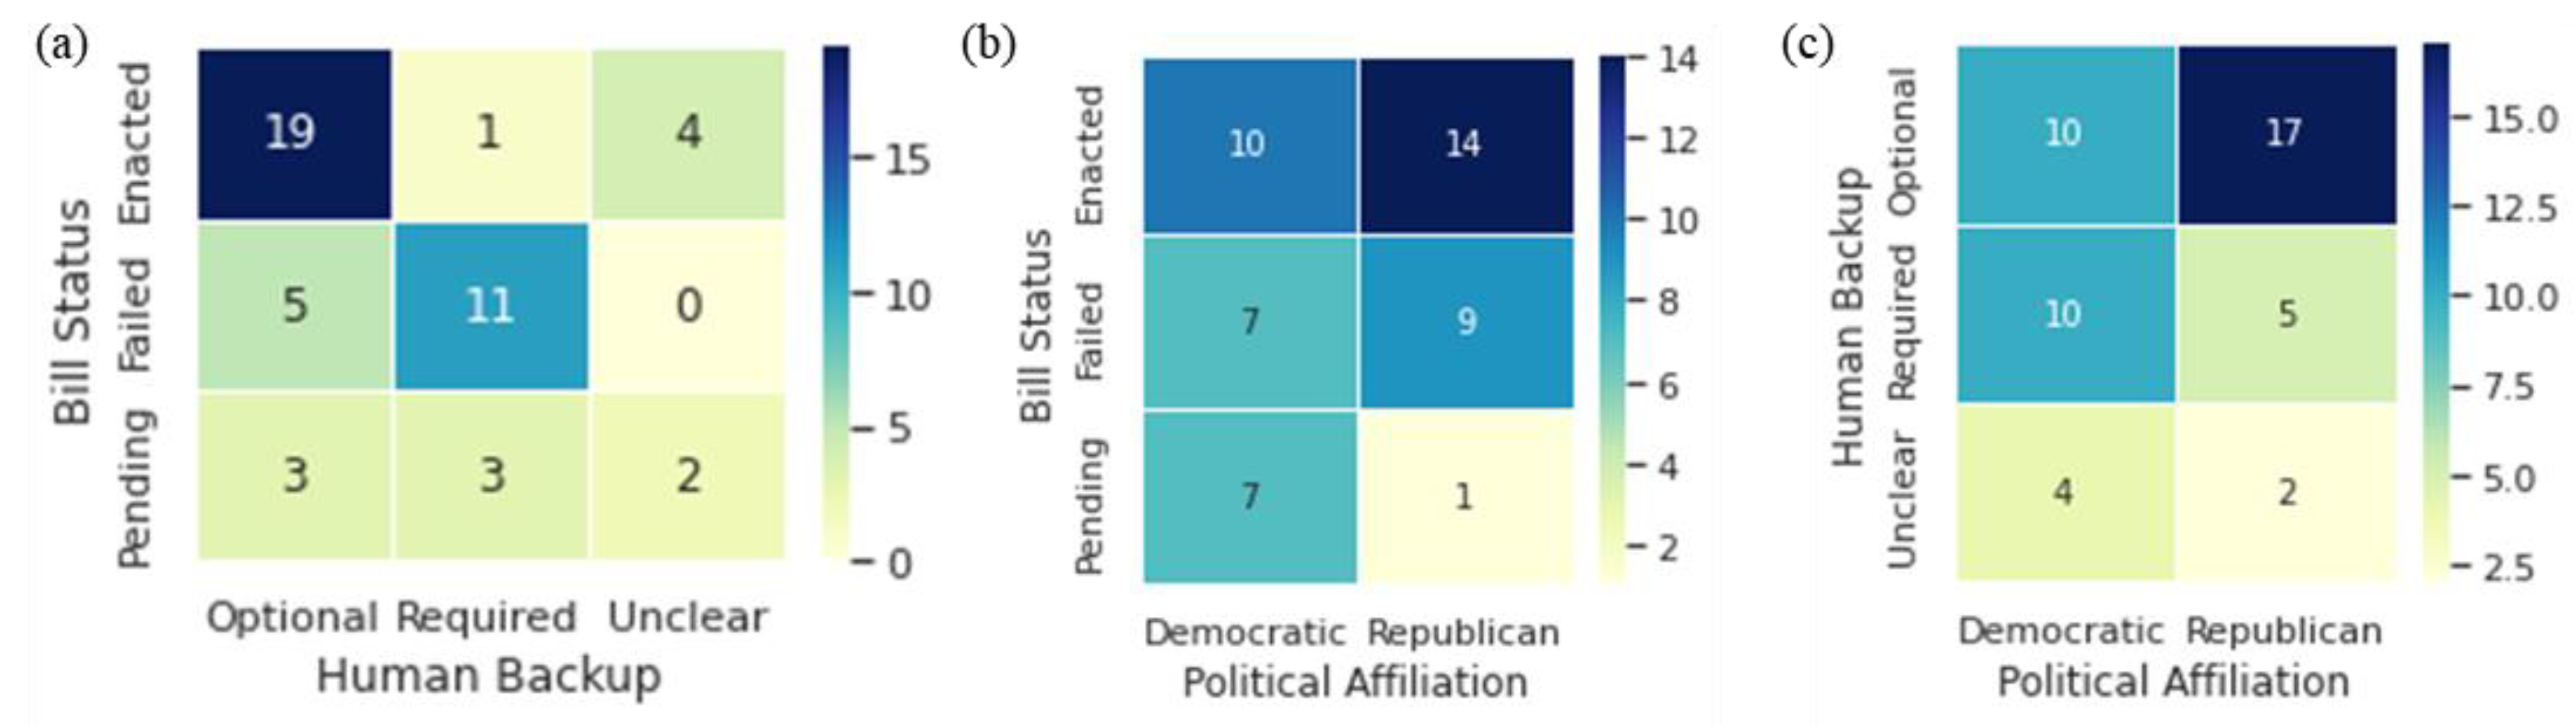
4.3. Categorical Associations
4.4. Machine Learning
4.5. Feature Ranking
5. Discussion
6. Conclusions
Author Contributions
Funding
Institutional Review Board Statement
Informed Consent Statement
Data Availability Statement
Conflicts of Interest
References
- Othman, K. Public acceptance and perception of autonomous vehicles: A comprehensive review. AI Ethics 2021, 1, 355–387. [Google Scholar] [CrossRef] [PubMed]
- Ahmed, H.U.; Huang, Y.; Lu, P.; Bridgelall, R. Technology Developments and Impacts of Connected and Autonomous Vehicles: An Overview. Smart Cities 2022, 5, 382–404. [Google Scholar] [CrossRef]
- Ziyan, C.; Shiguo, L. China’s self-driving car legislation study. Comput. Law Secur. Rev. 2021, 41, 105555. [Google Scholar] [CrossRef]
- Hemphill, T.A. Autonomous vehicles: US regulatory policy challenges. Technol. Soc. 2020, 61, 101232. [Google Scholar] [CrossRef]
- Dimitrakopoulos, G.; Tsakanikas, A.; Panagiotopoulos, E. Autonomous Vehicles: Technologies, Regulations, and Societal Impacts; Elsevier: Amsterdam, The Netherlands, 2021. [Google Scholar]
- Grindsted, T.S.; Christensen, T.H.; Freudendal-Pedersen, M.; Friis, F.; Hartmann-Petersen, K. The urban governance of autonomous vehicles–In love with AVs or critical sustainability risks to future mobility transitions. Cities 2022, 120, 103504. [Google Scholar] [CrossRef]
- Emory, K.; Douma, F.; Cao, J. Autonomous vehicle policies with equity implications: Patterns and gaps. Transp. Res. Interdiscip. Perspect. 2022, 13, 100521. [Google Scholar] [CrossRef]
- USLC. H.R.3711—SELF DRIVE Act. United States Library of Congress. 2022. Available online: https://www.congress.gov/bill/117th-congress/house-bill/3711 (accessed on 11 January 2024).
- Uhlemann, E. Legislation supports autonomous vehicles but not connected ones [connected and automated vehicles]. IEEE Veh. Technol. Mag. 2022, 17, 112–115. [Google Scholar] [CrossRef]
- Sjoberg, K. Activities on legislation for autonomous vehicles take off [Connected and Automated Vehicles]. IEEE Veh. Technol. Mag. 2021, 16, 149–152. [Google Scholar] [CrossRef]
- Alawadhi, M.; Almazrouie, J.; Kamil, M.; Khalil, K.A. Review and analysis of the importance of autonomous vehicles liability: A systematic literature review. Int. J. Syst. Assur. Eng. Manag. 2020, 11, 1227–1249. [Google Scholar] [CrossRef]
- Alnajjar, H.; Ozbay, K.; Iftekhar, L. An exploratory analysis on city characteristics likely to affect autonomous vehicle legislation enactment across the United States. Transp. Policy 2023, 142, 37–45. [Google Scholar] [CrossRef]
- Bezai, N.E.; Medjdoub, B.; Al-Habaibeh, A.; Chalal, M.L.; Fadli, F. Future cities and autonomous vehicles: Analysis of the barriers to full adoption. Energy Built Environ. 2021, 2, 65–81. [Google Scholar] [CrossRef]
- Freemark, Y.; Hudson, A.; Zhao, J. Policies for autonomy: How American cities envision regulating automated vehicles. Urban Sci. 2020, 4, 55. [Google Scholar] [CrossRef]
- Mack, E.A.; Miller, S.R.; Chang, C.-H.; Fossen, J.A.V.; Cotten, S.R.; Savolainen, P.T.; Mann, J. The politics of new driving technologies: Political ideology and autonomous vehicle adoption. Telemat. Inform. 2021, 61, 101604. [Google Scholar] [CrossRef]
- NARA. Electoral College. 2021. Available online: https://www.archives.gov/electoral-college/2020 (accessed on 6 January 2024).
- BTS. State Transportation Statistics; United States Department of Transportation: Washington, DC, USA, 2024. Available online: https://www.bts.gov/product/state-transportation-statistics (accessed on 7 January 2024).
- BEA. GDP by State. 2024. Available online: https://www.bea.gov/data/gdp/gdp-state (accessed on 7 January 2024).
- BTS. Freight Flows by State; United States Department of Transportation: Washington, DC, USA, 2024. Available online: https://www.bts.gov/browse-statistical-products-and-data/state-transportation-statistics/freight-flows-state (accessed on 7 January 2024).
- USCB. Selected Monthly State Tax Collections; United States Department of Commerce: Washington, DC, USA, 2024. Available online: https://www.census.gov/data/experimental-data-products/selected-monthly-state-sales-tax-collections.html (accessed on 7 January 2024).
- BTS. Energy Consumption and CO2 Emissions; United States Department of Transportation: Washington, DC, USA, 2024. Available online: https://www.bts.gov/browse-statistical-products-and-data/state-transportation-statistics/energy-consumption-and-co2. (accessed on 7 January 2024).
- USCB. State Population Totals and Components of Change: 2020–2023; United States Department of Commerce: Washington, DC, USA, 2023. Available online: https://www.census.gov/data/tables/time-series/demo/popest/2020s-state-total.html (accessed on 7 January 2024).
- USCB. State Area Measurements and Internal Point Coordinates; United States Department of Commerce: Washington, DC, USA, 2021. Available online: https://www.census.gov/geographies/reference-files/2010/geo/state-area.html (accessed on 7 January 2024).
- CRPL. Average Yearly Snowfall by American State. Current Results Publishing Ltd. (CRPL). 2024. Available online: https://www.currentresults.com/Weather/US/average-snowfall-by-state.php (accessed on 7 January 2024).
- BTS. State Highway Travel; United States Department of Transportation: Washington, DC, USA, 2024. Available online: https://www.bts.gov/browse-statistical-products-and-data/state-transportation-statistics/state-highway-travel (accessed on 7 January 2024).
- FTA. National Transit Database. 2021. Available online: https://www.transit.dot.gov/ntd/data-product/2021-database-files (accessed on 11 January 2024).
- Aggarwal, C.C. Data Mining; Springer International Publishing: New York, NY, USA, 2015; p. 734. [Google Scholar]
- Burkov, A. The Hundred-Page Machine Learning Book; Andriy Burkov: Quebec City, QC, Canada, 2019. [Google Scholar]
- RIDOT. Connected and Autonomous Vehicles and Other Innovative Transport System Technologies Framework for Implementation and Integration; Rhode Island Department of Transportation (RIDOT): Providence, RI, USA, 2017. [Google Scholar]
- VTTI. Virginia Automated Corridors; Virginia Tech Transportation Institute (VTTI): Blacksburg, VA, USA, 2024; Available online: https://www.vtti.vt.edu/facilities/vac.html (accessed on 10 January 2024).
- WAVPG. Automated Vehicles. 2024. Available online: https://wiscav.org/ (accessed on 10 January 2024).


| Category | Feature | Description | Source |
|---|---|---|---|
| Gov. | Votes_D | Democratic electoral college votes reported in 2021 | [16] |
| Votes_R | Republican electoral college votes reported in 2021 | [16] | |
| VDpPOPM | Democratic electoral college votes per million population | Derived | |
| VRpPOPM | Republican electoral college votes per million population | Derived | |
| MPO | Metropolitan planning organizations (MPOs) | [17] | |
| POPMpMPO | Million population per MPO | Derived | |
| Eco. | GDP_B | State gross domestic product (GDP) in billion dollars | [18] |
| GDPpPOP | GDP_B/POP_M or GDP (USD B) per million population (POP) | Derived | |
| TM_B | Billion ton-miles (TM) | [19] | |
| TMpVMT | TM_B/VMT_HW_B or TM per vehicle miles traveled (VMT) | Derived | |
| Port_M_Ton | Million tons moved by seaports | [17] | |
| HW_Rev_M | State and local highway (HW) revenue (millions) | [20] | |
| REVpTM | HW_Rev_M/TM_B or USD M revenue per B ton-miles | Derived | |
| HW_Exp_M | State and local highway expenditures (millions) | [20] | |
| EXPpTM | HW_Exp_M/TM_B or USD M expense per B ton-miles | Derived | |
| REVpEXP | HW_Rev_M/HW_Exp_M or highway revenue/expense ratio | Derived | |
| Energy | BTU_T | Trillion British thermal units (BTU) consumed by transport | [21] |
| BTUpVMT | BTU_T/VMT_HW_B or trillion BTU per billion VMT | Derived | |
| Petrol_BBTU | Gasoline consumed by transportation (billion BTUs) | [21] | |
| GASpVMT | Petrol_BBTU/VMT_HW_B or BTUs of gasoline per VMT | Derived | |
| Social | POP_M | State population (millions) | [22] |
| POPpLA | POP_M × 1E6/LSqMi or population per sq mi of land | Derived | |
| Env. | SqMi | State area in square miles | [23] |
| LSqMi | Land area in square miles | [23] | |
| WSqMi | Water area in square miles | [23] | |
| WISqMi | Inland water in square miles | [23] | |
| WCSqMi | Coastal water in square miles | [23] | |
| CO2_MMT | Million metric tons of CO2 emitted by transportation | [21] | |
| CO2pPOP | CO2_MMT/POP_M or annual CO2 ton per capita | Derived | |
| Snow_Days | Annual days of snow on average | [24] | |
| Snow_Ins | Annual inches of snow on average | [24] | |
| Infra. | Pub_Road_Mi_K | Miles (thousands) of public roads | [17] |
| UI_Miles | Urban interstate miles | [17] | |
| RI_Miles | Rural interstate miles | [17] | |
| RoadpLand | Pub_Road_Mi_K per LSqMi | Derived | |
| UIpLand | UI_Miles per LSqMi | Derived | |
| RIpLand | RI_Miles per LSqMi | Derived | |
| PCT_Sys_Acc | Percentage of system (overall) acceptable IRI | [17] | |
| Bridges | Number of bridges in 2021 | [17] | |
| BRpPOPK | Bridges/(POP_M × 1000) or bridges per thousand population | Derived | |
| Fr_Rail_Mi | Freight rail miles | [17] | |
| RailpLand | Freight rail miles per LSqMi | ||
| PORTpPOP | Port_M_Ton/POP_M or port tons per capita | Derived | |
| Transp. | VMT_HW_B | State VMT on highways (billion miles) | [25] |
| VMTpLAN | VMT_HW_B/(LSqMi/1000) or B VMT per thousand sq. mi. land | Derived | |
| HW_Fatals | Highway fatalities | [17] | |
| FATLpPOP | HW_Fatals/POP_M or fatalities per million population | Derived | |
| Truck_Estab | Trucking business establishments | [17] | |
| Truck_Emp | Trucking company employees | [17] | |
| TRKEpCO | Truck_Emp/Truck_Estab or employees per company | Derived | |
| Truck_Pay_M | Trucking company annual payroll in million dollars | [17] | |
| TRKPpE | Truck_Pay_M * 1E6/Truck_Emp or truck pay per employee | Derived | |
| TRKpMPO | Truck_Estab/MPO | Derived | |
| Agencies | Transit agencies | [26] | |
| POPKpTRA | Population (thousands) per transit agency | Derived |
| Model | Theory of Operations | Advantages | Disadvantages |
|---|---|---|---|
| DT | A flowchart-like structure in which each internal node represents a test on an attribute, each branch represents the outcome of the test, and each leaf node represents a class label. | Easy to interpret and visualize. Can handle both numerical and categorical data and requires little data preparation. | Prone to overfitting, especially with noisy or complex datasets. Can create biased trees if some classes dominate. |
| GB | Builds an additive model in a forward stage-wise fashion, allowing for the optimization of arbitrary differentiable loss functions. | Highly effective on various problems. Can handle mixed types of data, and often provides high predictive accuracy. | Requires careful tuning, is computationally expensive, and can overfit on small datasets. |
| XGB | Optimized distributed gradient boosting library utilizing decision trees with high performance and flexibility. | Handles sparse data well, provides built-in cross-validation, works well on large and complex datasets, and often outperforms other algorithms in predictive accuracy. | Computationally intensive, requires careful tuning of parameters, and may overfit if not properly regularized. |
| ADB | Short for adaptive boosting, is an ensemble boosting technique that adjusts the weights of weak classifiers to form a strong classifier. | Often achieves high accuracy, is less prone to overfitting, and improves the accuracy of weak classifiers. | Sensitive to noisy data and outliers, and performance can suffer if weak classifiers are too complex. |
| RF | An ensemble learning method that constructs multiple decision trees during training and outputs the mode of classes of the individual trees. | Effective in high-dimensional spaces, robust to overfitting, and handles both categorical and numerical data well. | Model interpretability can be challenging, and performance is dependent on the strength of individual trees. |
| NB | A simple probabilistic classifier based on applying Bayes’ theorem with strong (naive) independence assumptions between the features. | Simple, fast, and efficient with large datasets. Performs well with categorical input variables compared to numerical variables. | The assumption of independent predictors is rarely true. Has a notable limitation with data scarcity for a category of a categorical variable. |
| kNN | A non-parametric method that classifies a sample by a plurality vote of its neighbors, assigning the class most common among its k nearest neighbors. | Simple, intuitive, and effective in practice, especially for low-dimensional datasets. | Computationally expensive, especially as dataset size grows. Sensitive to irrelevant or redundant features. |
| SVM | Analyzes data for classification by maximizing the margin between decision boundaries and data points in high-dimensional feature space. | Effective in high-dimensional spaces, versatile with different kernel functions, and provides a unique solution since the optimization problem is convex. | Not suitable for large datasets, less effective on noisier datasets with overlapping classes, and requires a good kernel choice. |
| LR | Measures the relationship between a categorical dependent variable and independent variables by estimating probabilities using a logistic function. | Simple and efficient for binary classification problems. Outputs probabilities that are interpretable. | Assumes linearity between the dependent variable and the independent variables. Can struggle with complex relationships and is not flexible enough to capture more complex patterns. |
| ANN | Modeled loosely after the human brain to recognize patterns by interpreting sensory data through machine perception, labeling, and clustering. | Highly flexible and capable of learning nonlinear relationships. Performs well on a large variety of tasks and is scalable to large datasets. | Not appropriate for small datasets. Computationally intensive, prone to overfitting, and lacks interpretability. |
| Con. | The constant (Con.) model always predicts the same output regardless of the input. | Provides a baseline for model performance comparison. | Offers no real insight into data patterns. |
| State and Status | Special Conditions |
|---|---|
| Connecticut (CT) H 6486 (2021): Failed Human: Required | The operator must be an employee, a contractor, or trained personnel, holding a valid operator’s license. AV testers must register each vehicle with the Commissioner of Motor Vehicles. Requires proof of liability insurance or a surety bond of at least USD 5 million. No testing on limited access highways. If involved in a crash, the vehicle must achieve a minimal risk condition and remain at the crash scene. The owner or a representative must report the crash immediately, remain until law enforcement arrives, and provide necessary information. |
| Maine (ME) H 1222 (2019): Failed Human: Required | Providers must have a license and maintain at least USD 25 million in insurance coverage. Providers must consent to state authority and have a registered office in Maine. If involved in an accident, the AV shall remain on the scene and the provider shall inform law enforcement that the system was engaged. |
| Massachusetts (MA) S 2257 (2023): Pending Human: Required | Clearly marked to indicate that it is operating autonomously. Data capture and storage systems must comply with the department’s requirements. The registrar must certify manufacturers or operators. |
| New Hampshire (NH) S 216 (2020): Enacted Human: Optional | The AV must be capable of achieving a minimal risk condition if it malfunctions. The owner or manufacturer must submit proof of monetary responsibility. |
| New Jersey (NJ) A 1853 (2020): Failed Human: Required | Manufacturers must apply and receive commission approval. The operator must have the proper license for the vehicle type. Manufacturer’s designated personnel must operate the vehicle. Manufacturer must obtain USD 5 million insurance or surety bond. Manufacturer must provide a written disclosure of information collected by the technology. |
| New York (NY) A 539 (2023): Pending Human: Optional | The AV must be capable of achieving a minimal risk condition if it malfunctions. |
| Pennsylvania (PA) H 2398 (2022): Enacted Human: Optional | Obtain certificate of safety and performance compliance from the Department of Motor Vehicles. Clearly marked to indicate that it is operating autonomously. A manufacturer-designated entity must monitor the vehicle’s operation and be able to remotely intervene if necessary. Must operate within approved geofenced areas. |
| Rhode Island (RI) No bills Human: Unclear | No specific laws. However, the Rhode Island Department of Transportation (RIDOT) published a request for information in 2017 seeking advice relating to AV deployments [29]. |
| Vermont (VT) S 149 (2019): Enacted Human: Optional | Exempts AV tester from the requirement to hold a commercial driver’s license. AV tester must obtain a permit from the Commissioner of Motor Vehicles and notify the agency of any accidents involved. |
| State and Status | Special Conditions |
|---|---|
| Alabama (AL) SB311 (2023): Failed Human: Optional | Vehicle must be capable of achieving a minimal risk condition if it malfunctions. If involved in an accident, the AV shall remain on the scene, and the owner or representative must report. State, federal, or common law determines liability. |
| Arkansas (AR) H 1562 (2021): Enacted Human: Optional | Remote operators must have a valid driver’s license for the vehicle class. State or federal law determines liability for accidents. The original manufacturer of a vehicle converted into an AV by a third party is not liable in legal actions. |
| Delaware (DE) EO 14 (2017): EO Human: Unclear | Does not provide specific conditions related to AV operations on public roads. Primarily focuses on establishing an advisory council on AVs. |
| Florida (FL) H 1289 (2021): Enacted Human: Optional | Restrictions apply to the operation of AVs on roads with certain speed limits. |
| Georgia (GA) H 249 (2021): Failed Human: Optional | The AV must be capable of achieving a minimal risk condition if it malfunctions. |
| Kentucky (KY) H 135 (2023): Vetoed Human: Optional | Achieve a minimal risk condition upon a malfunction. If involved in an accident, the AV owner or a representative must notify law enforcement and file a written report within ten days of the occurrence. |
| Louisiana (LA) S 453 (2022): Enacted Human: Optional | Exempt AVs from state motor vehicle equipment laws or regulations that relate to or support operation by a human driver and are not relevant for an automated driving system. |
| Maryland (MD) S 685 (2023): Enacted Human: Unclear | Does not provide specific conditions related to AV operations on public roads. Primarily focuses on authorizing AV converters to sell or lease. |
| Mississippi (MS) H 1003 (2023): Enacted Human: Optional | The AV must be capable of achieving a minimal risk condition if it malfunctions. |
| North Carolina (NC) H 814 (2022): Enacted Human: Optional | Low speed AVs can operate on streets and highways where the posted speed limit is 45 mph or less. On a highway with two travel lanes, AVs must turn off the roadway to allow faster moving vehicles to pass when it is safe to do so. |
| Oklahoma (OK) S 1541 (2022): Enacted Human: Optional | The owner must submit a law enforcement interaction plan to the Department of Public Safety. The owner must provide proof of insurance coverage equal to at least USD 1 million. The owner must report an accident while the AV remains on the scene. |
| South Carolina (SC) H 4015 (2013): Failed Human: Required | Have a designated or remote operator to assume control if needed. Have a mechanism to capture and store data in case of an accident. |
| Tennessee (TN) S 0151 (2017): Enacted Human: Optional | The AV must be capable of achieving a minimal risk condition if it malfunctions. Owner maintains insurance providing of at least USD 5 million for death, bodily injury, and property damage. |
| Texas (TX) S 2205 (2017): Enacted Human: Optional | Clearly signal autonomous operation. Have a licensed entity monitor and remotely operate if needed. Should not operate when weather or road conditions pose unreasonable risks. Full deployment requires federal approval and a regulatory framework established by the Department of Public Safety. |
| Virginia (VA): No Bills Human: Required | No specific laws. However, Virginia Tech Transportation Institute (VTTI) leads an initiative aimed at supporting AV testing and certification [30]. |
| West Virginia (WV) H 4787 (2022): Enacted Human: Optional | Submit a law enforcement interaction plan to the department of motor vehicles. The AV must be capable of achieving a minimal risk condition if it malfunctions and request a human driver to intervene. |
| State and Status | Special Conditions |
|---|---|
| Illinois (IL) H 2913 (2023): Pending Human: Optional | The manufacturer must notify the Secretary of State and self-certify under certain conditions, define geographical boundaries for the operation, maintain incident records, and provide summaries to the Secretary of State and the National Highway Traffic Safety Administration. |
| Indiana (IN) S 141 (2023): Failed Human: Required | The human safety operator must meet all state and federal qualifications to operate both a motor vehicle and an automated vehicle. |
| Iowa (IA) S 302 (2019): Enacted Human: Optional | The AV must be capable of achieving a minimal risk condition if it malfunctions. If involved in an accident, the AV shall remain on the scene. The owner or a representative must promptly report any accident. |
| Kansas (KS) S 313 (2022): Enacted Human: Optional | The AV must be capable of achieving a minimal risk condition if it malfunctions. If involved in an accident, the AV shall remain on the scene. The owner or a representative must promptly report any accident. |
| Michigan (MI) S 706 (2022): Enacted Human: Optional | Must comply with user fee requirements on designated roadways or lanes. |
| Minnesota (MN) SF 0214 (2022): Failed Human: Required | Prohibits AV operation on Minnesota roads and highways. Requires a human operator to perform all dynamic driving tasks. |
| Missouri (MO) S 452 (2021): Failed Human: Required | Prohibits AVs from operating without a human driver and imposes a fine of up to USD 1000 if violated. AVs are subject to the same laws as conventional vehicles. |
| Nebraska (NE) LB 989 (2018): Enacted Human: Optional | The AV must be capable of achieving a minimal risk condition if it malfunctions. If involved in an accident, the AV shall remain on the scene. The owner or a designated person shall report any crash or collision. The AV must safely negotiate railroad crossings unless granted an exemption. |
| North Dakota (ND) No bills Human: Unclear | No specific laws about operating on public roads. However, HB 1519 allocated funding for grants and studies on multiple autonomous technologies, including uncrewed aircraft systems. |
| Ohio (OH) HB699 (2018): Failed Human: Required | A licensed commercial driver must be physically present in the vehicle, monitoring its operation and ready to take control in emergencies. Operator must maintain proof of monetary responsibility throughout the registration period. |
| South Dakota (SD) H 1120 (2023): Failed Human: Optional | Have a designated supervisor. Have a fallback plan for human takeover in case of system failure. Operate within a limited design domain. |
| Wisconsin (WI) No bills Human: Required | No specific laws. However, the state has an AV proving ground [31]. |
| State and Status | Special Conditions |
|---|---|
| Arizona (AZ) S 1333 (2022): Enacted Human: Optional | The AV owner or a representative must report accidents. The AV must stop at accident scenes or as close as possible. Liability determined by state or federal law. |
| California (CA) A 316 (2023): Vetoed Human: Required | AVs over 10,001 pounds must have a trained human safety operator to operate and shut off the vehicle. The operator must meet all federal and state qualifications for the vehicle type, in both automated and non-automated modes. Manufacturers must report collisions involving AVs to the Department of Motor Vehicles within 10 days. Owners must submit annual submission of disengagement reports. |
| Colorado (CO) S 213 (2017): Enacted Human: Optional | Human driver laws do not apply to automated driving systems, except those regulating the physical driving of a vehicle. Prohibits testing if the system cannot comply with laws, unless approved by the Colorado State Patrol and Colorado Department of Transportation. State, federal, or common law determines liability. |
| Hawaii (HI) S 1008 (2021): Pending Human: Unclear | Does not provide specific conditions related to AV operations on public roads. Primarily focuses on establishing an autonomous transportation task force within the Department of Transportation. |
| Idaho (ID) EO 2018-01 (2018): EO Human: Unclear | Does not provide specific conditions related to AV operations on public roads. Primarily focuses on creating a committee to study and support the testing and deployment of autonomous and connected vehicles. |
| Montana (MT) H 339 (2023): Failed Human: Required | AVs cannot operate on public highways until the Department of Transportation completes specific rulemaking. |
| Nevada (NV) S 182 (2023): Enacted Human: Unclear | Does not provide specific conditions related to AV operations on public roads. Primarily addresses regulatory aspects concerning the manufacturing and selling of AVs. |
| New Mexico (NM) H 378 (2023): Failed Human: Required | An operator must be able to monitor vehicle performance, intervene, operate the vehicle, and turn off the engine. |
| Oregon (OR) H 4063 (2018): Enacted Human: Required | The operator must possess the proper class of driver’s license for the type of vehicle. The owner must obtain a general liability insurance policy that covers no less than USD 5 million for death or bodily injury for each person covered and for property damage. |
| Utah (UT) H 101 (2019): Enacted Human: Optional | The AV must be capable of achieving a minimal risk condition if it malfunctions or it must request human intervention. Owner or operator must report accidents and provide registration and insurance information. |
| Washington (WA) S 5594 (2023): Pending Human: Optional | The AV must be capable of achieving a minimal risk condition if it malfunctions. If involved in an accident, the AV shall remain on the scene. The owner must report the accident. Municipalities can require crash data sharing. |
| Wyoming (WY) S 16 (2022): Failed Human: Optional | Clearly marked to indicate that it is operating autonomously. |
| Test Statistic | Status vs. Human | Status vs. Affiliation | Human vs. Affiliation |
|---|---|---|---|
| Chi-squared | 20.79 | 5.42 | 4.15 |
| DOF | 4 | 2 | 2 |
| p-value | 3.5 × 10⁻⁴ | 0.067 | 0.126 |
| Reject Independence | Yes | No | No |
| Model | AUC | Accuracy |
|---|---|---|
| GB | 0.757 | 0.688 |
| RF | 0.721 | 0.625 |
| XGB | 0.674 | 0.604 |
| DT | 0.631 | 0.604 |
| NB | 0.614 | 0.562 |
| ADB | 0.595 | 0.604 |
| LR | 0.578 | 0.583 |
| kNN | 0.550 | 0.542 |
| SVM | 0.540 | 0.646 |
| ANN | 0.501 | 0.479 |
| Constant | 0.500 | 0.562 |
Disclaimer/Publisher’s Note: The statements, opinions and data contained in all publications are solely those of the individual author(s) and contributor(s) and not of MDPI and/or the editor(s). MDPI and/or the editor(s) disclaim responsibility for any injury to people or property resulting from any ideas, methods, instructions or products referred to in the content. |
© 2024 by the authors. Licensee MDPI, Basel, Switzerland. This article is an open access article distributed under the terms and conditions of the Creative Commons Attribution (CC BY) license (https://creativecommons.org/licenses/by/4.0/).
Share and Cite
Bridgelall, R.; Tolliver, D. Deciphering Autonomous Vehicle Regulations with Machine Learning. Appl. Sci. 2024, 14, 1396. https://doi.org/10.3390/app14041396
Bridgelall R, Tolliver D. Deciphering Autonomous Vehicle Regulations with Machine Learning. Applied Sciences. 2024; 14(4):1396. https://doi.org/10.3390/app14041396
Chicago/Turabian StyleBridgelall, Raj, and Denver Tolliver. 2024. "Deciphering Autonomous Vehicle Regulations with Machine Learning" Applied Sciences 14, no. 4: 1396. https://doi.org/10.3390/app14041396
APA StyleBridgelall, R., & Tolliver, D. (2024). Deciphering Autonomous Vehicle Regulations with Machine Learning. Applied Sciences, 14(4), 1396. https://doi.org/10.3390/app14041396