
Bedding Slope Destabilization under Rainfall: A Case Study of Zhuquedong Slope in Hunan Province, China


Abstract
1. Introduction
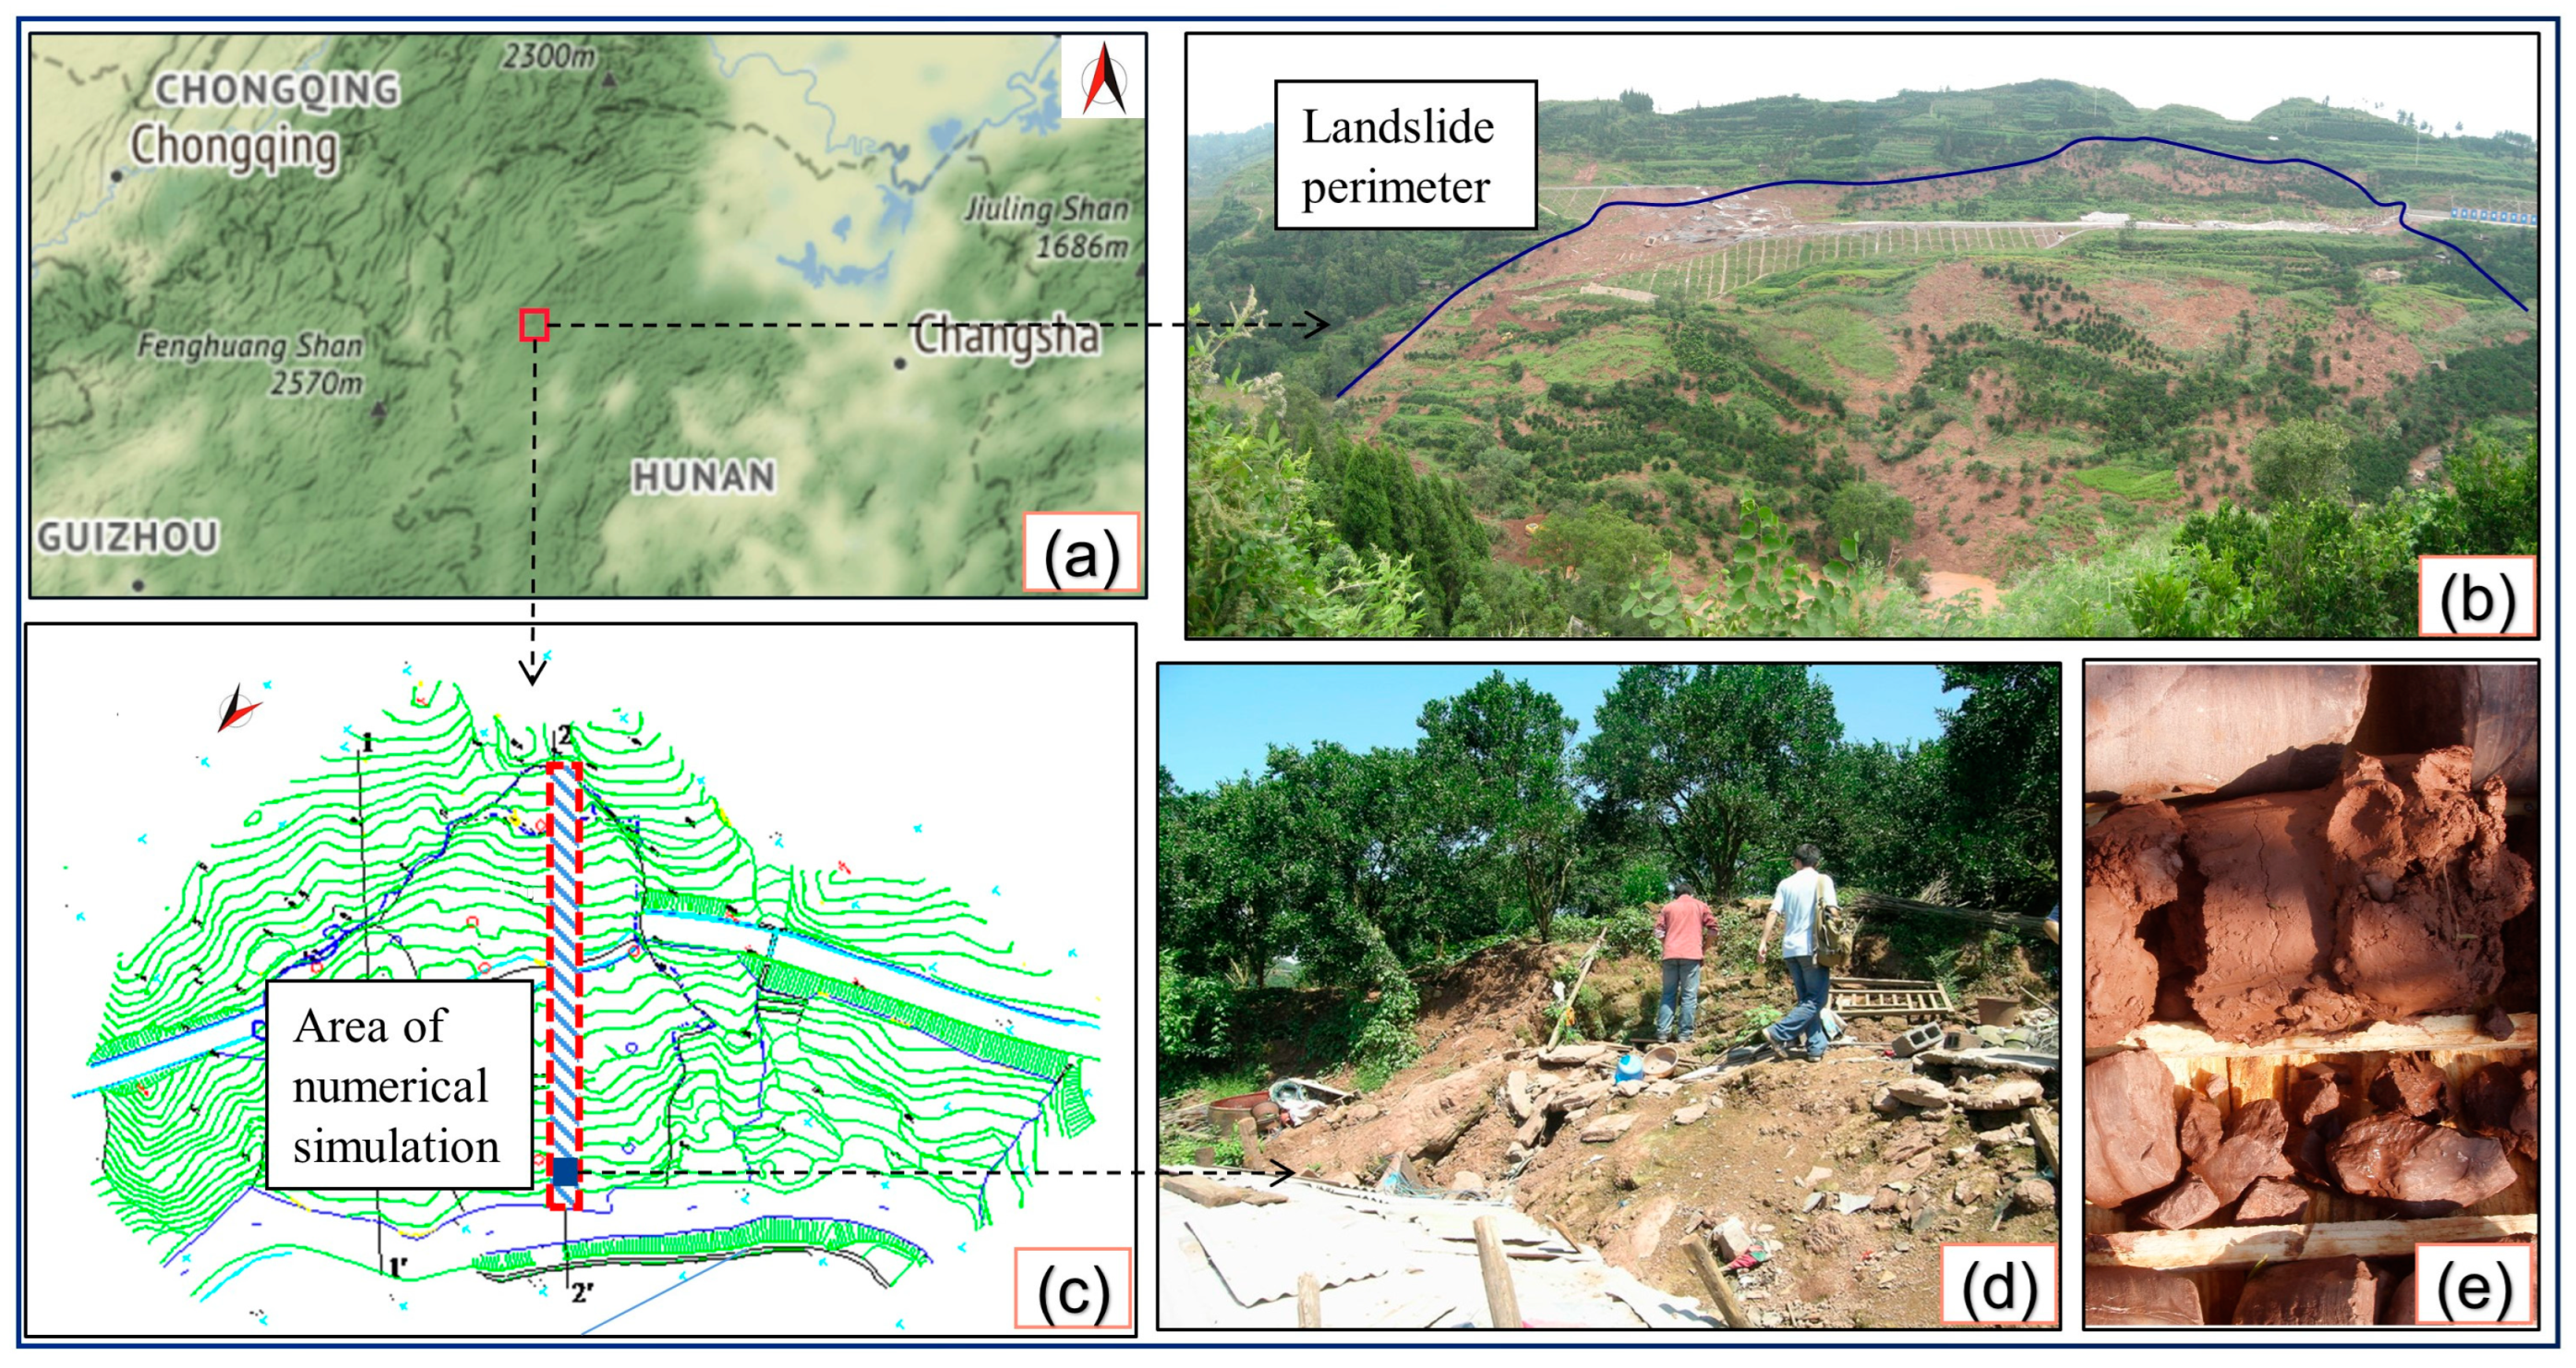
2. Engineering Background
3. Theoretical Model of Slope Seepage and Stability under Rainfall Conditions
3.1. Seepage Theory
3.2. Slope Stability Theory
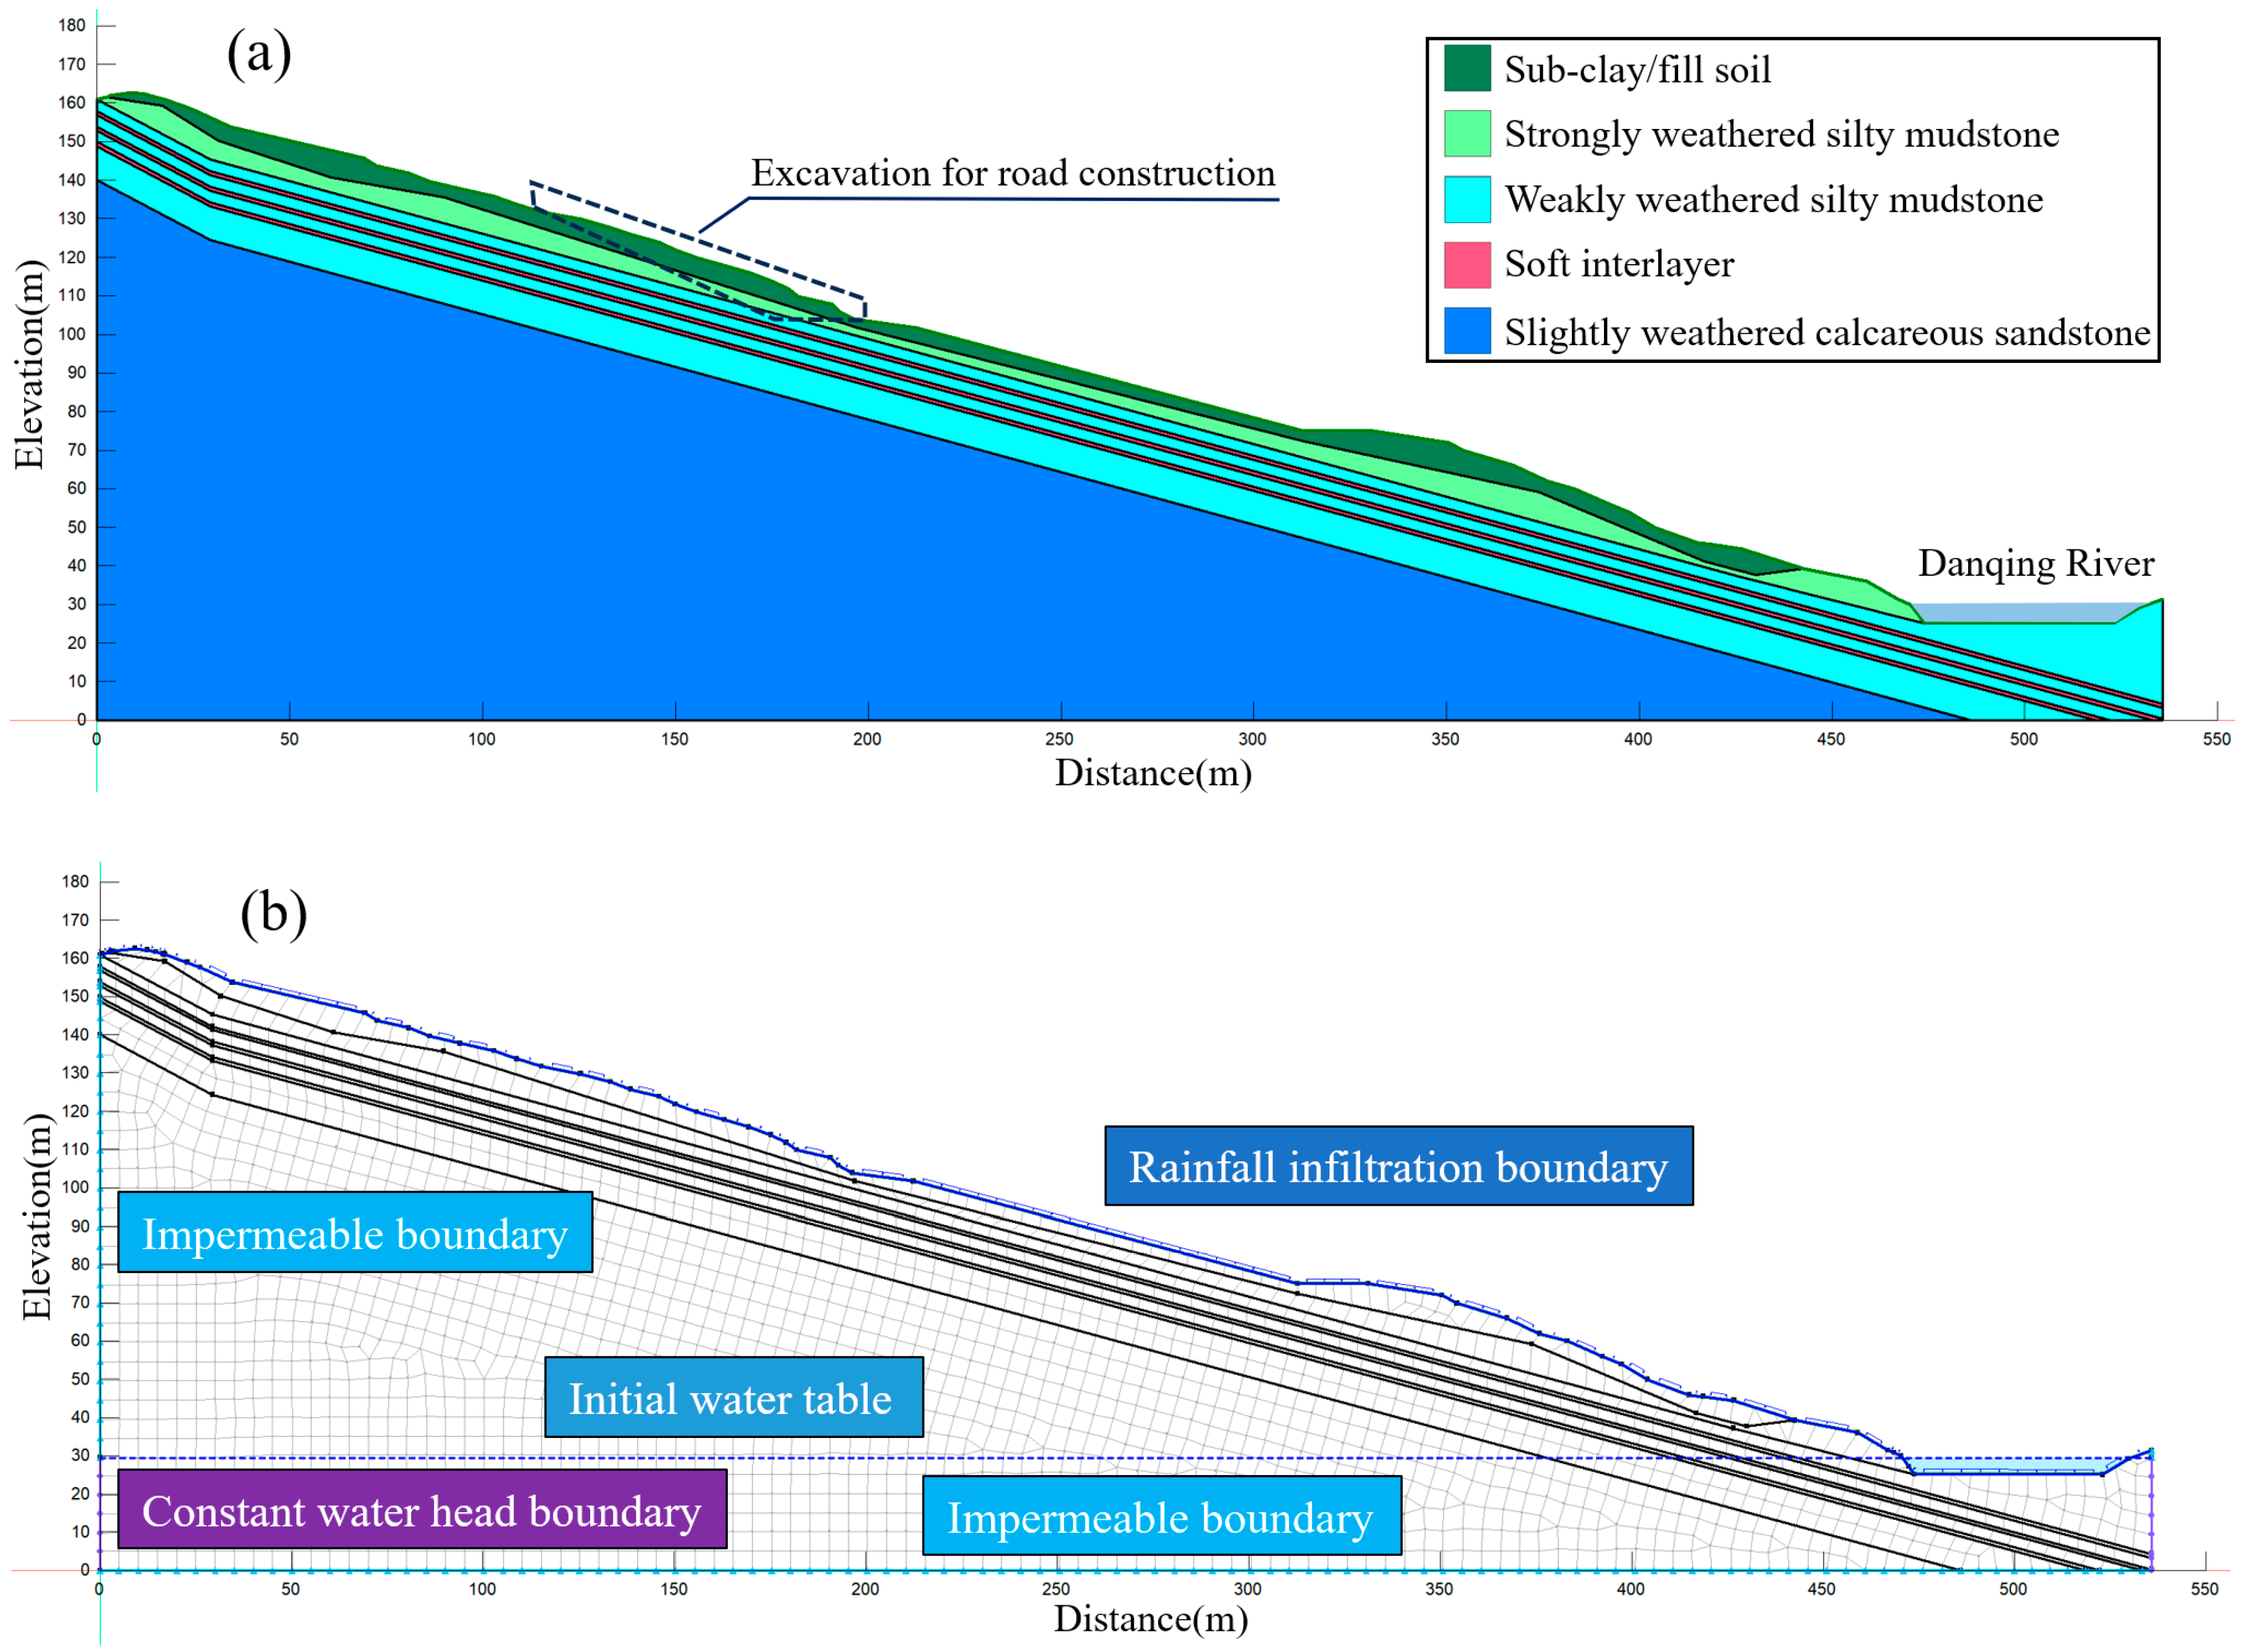
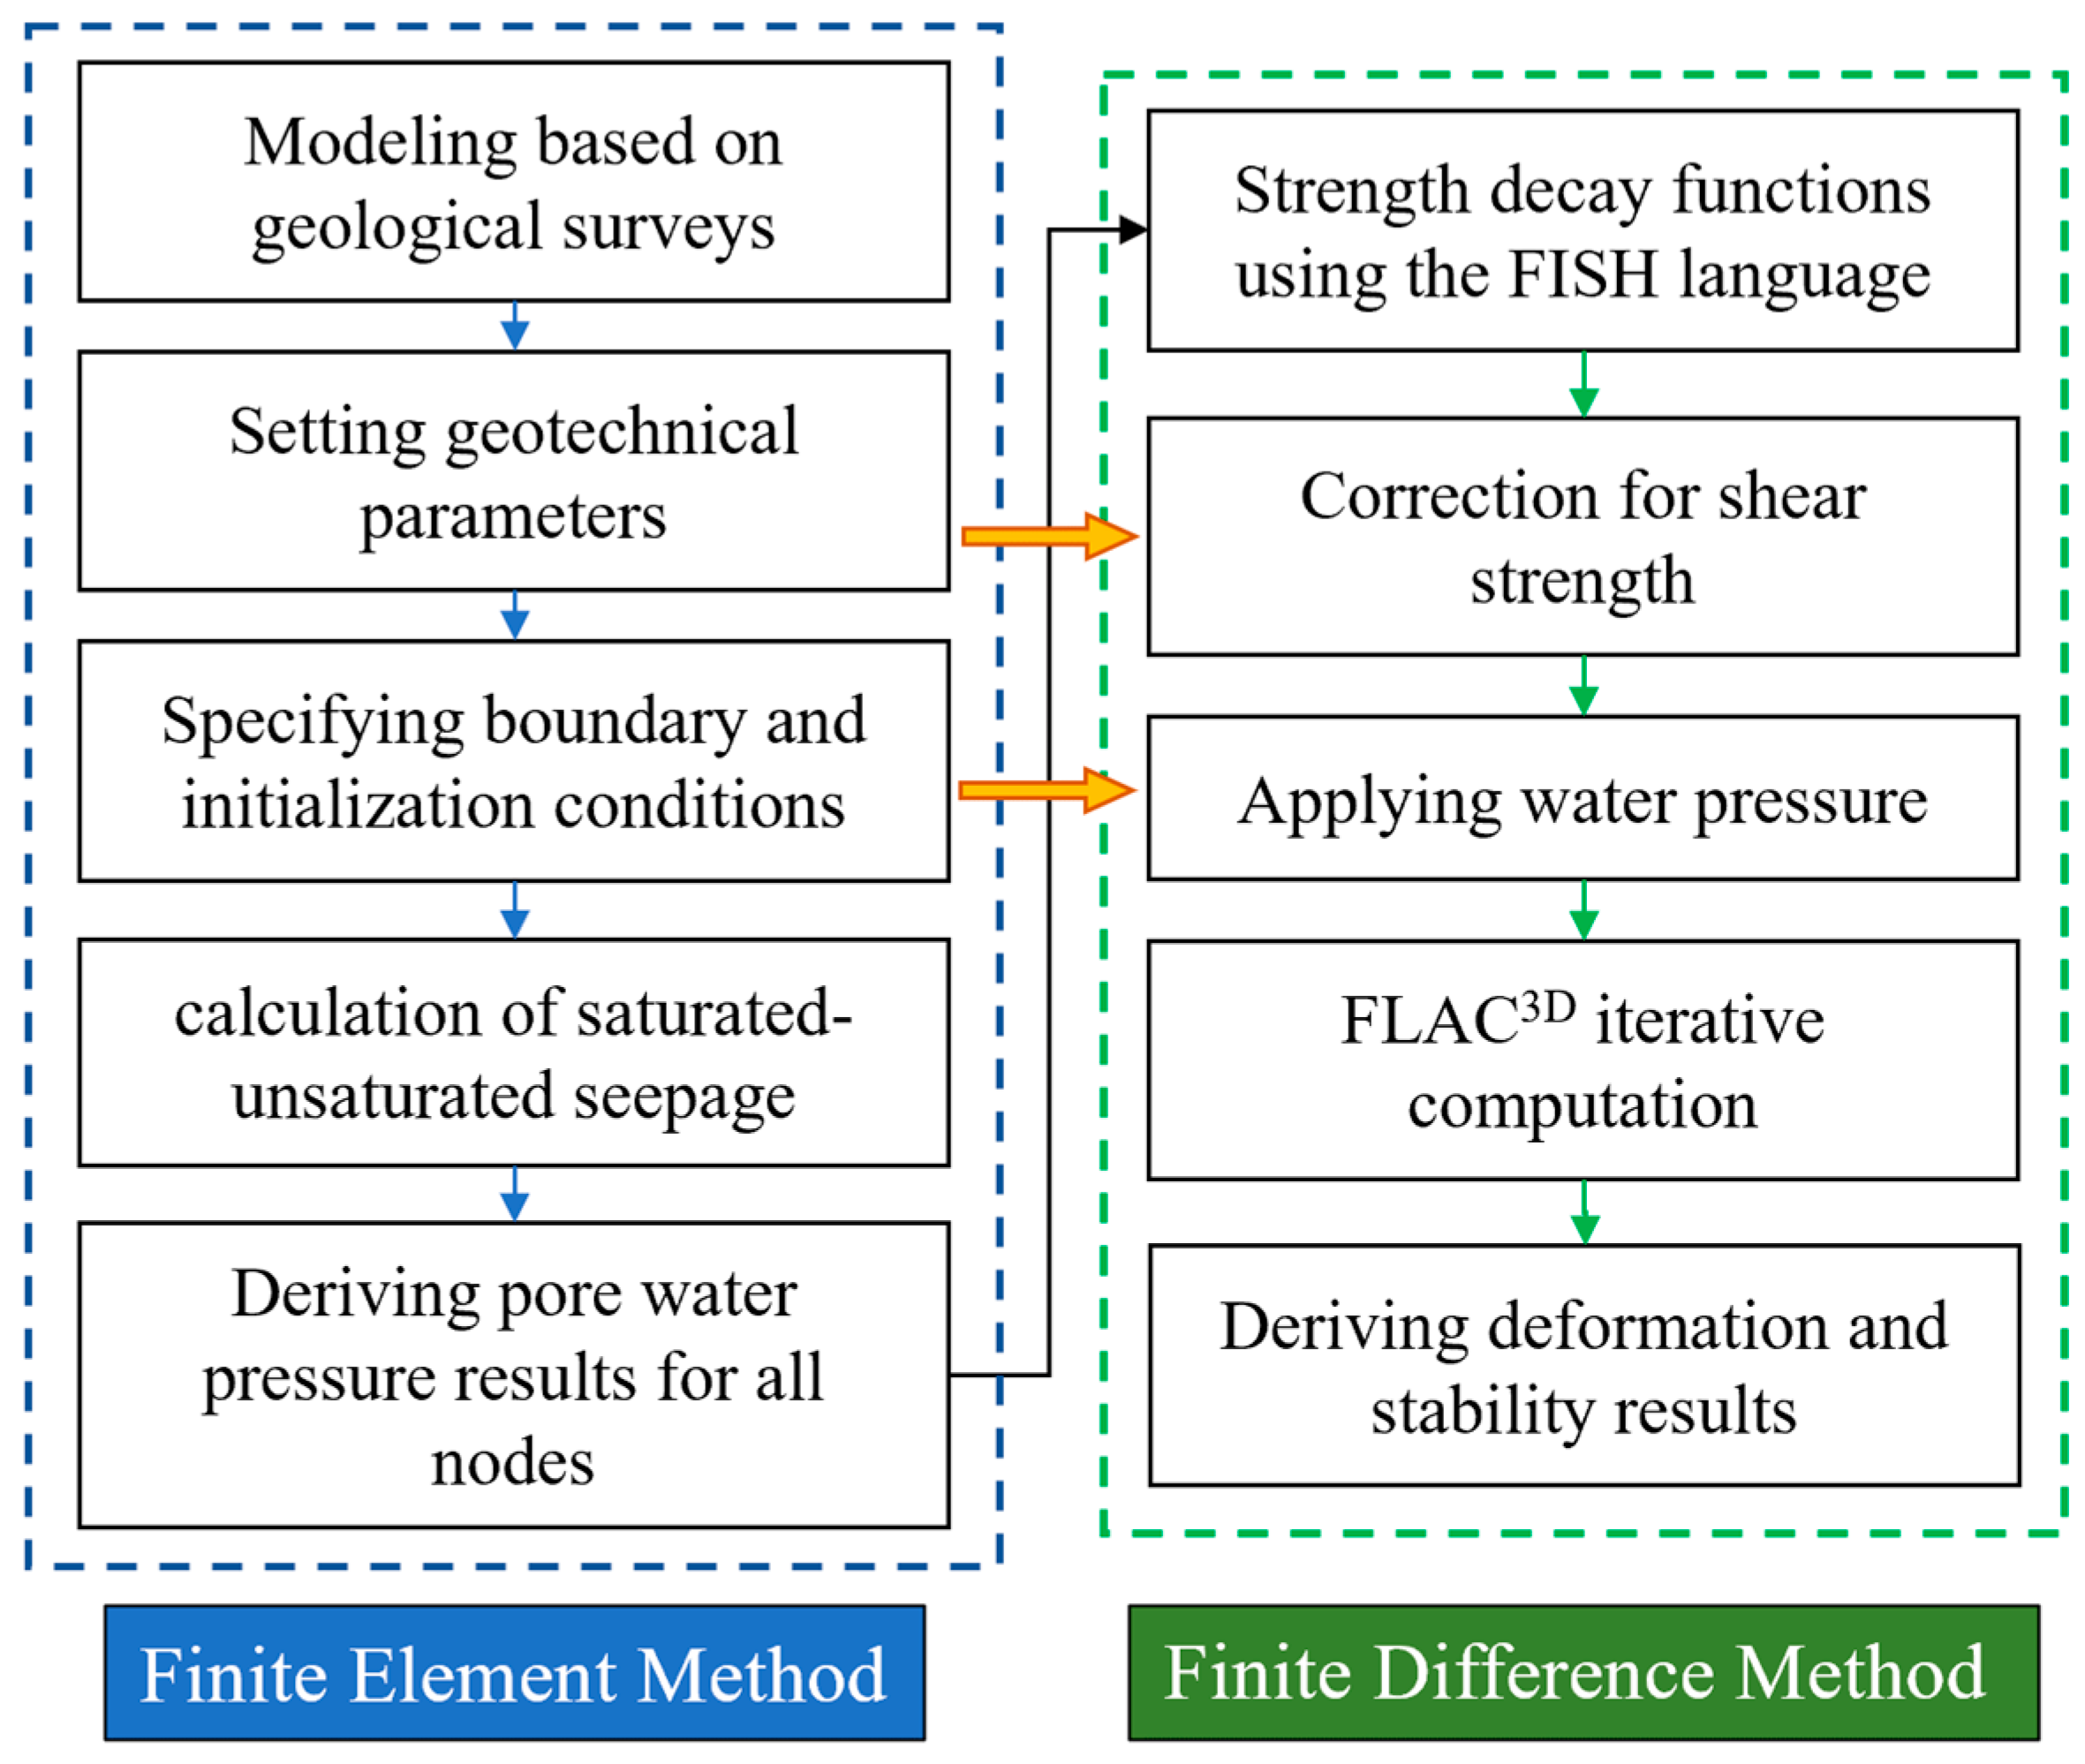
4. Numerical Model of Bedding Slope
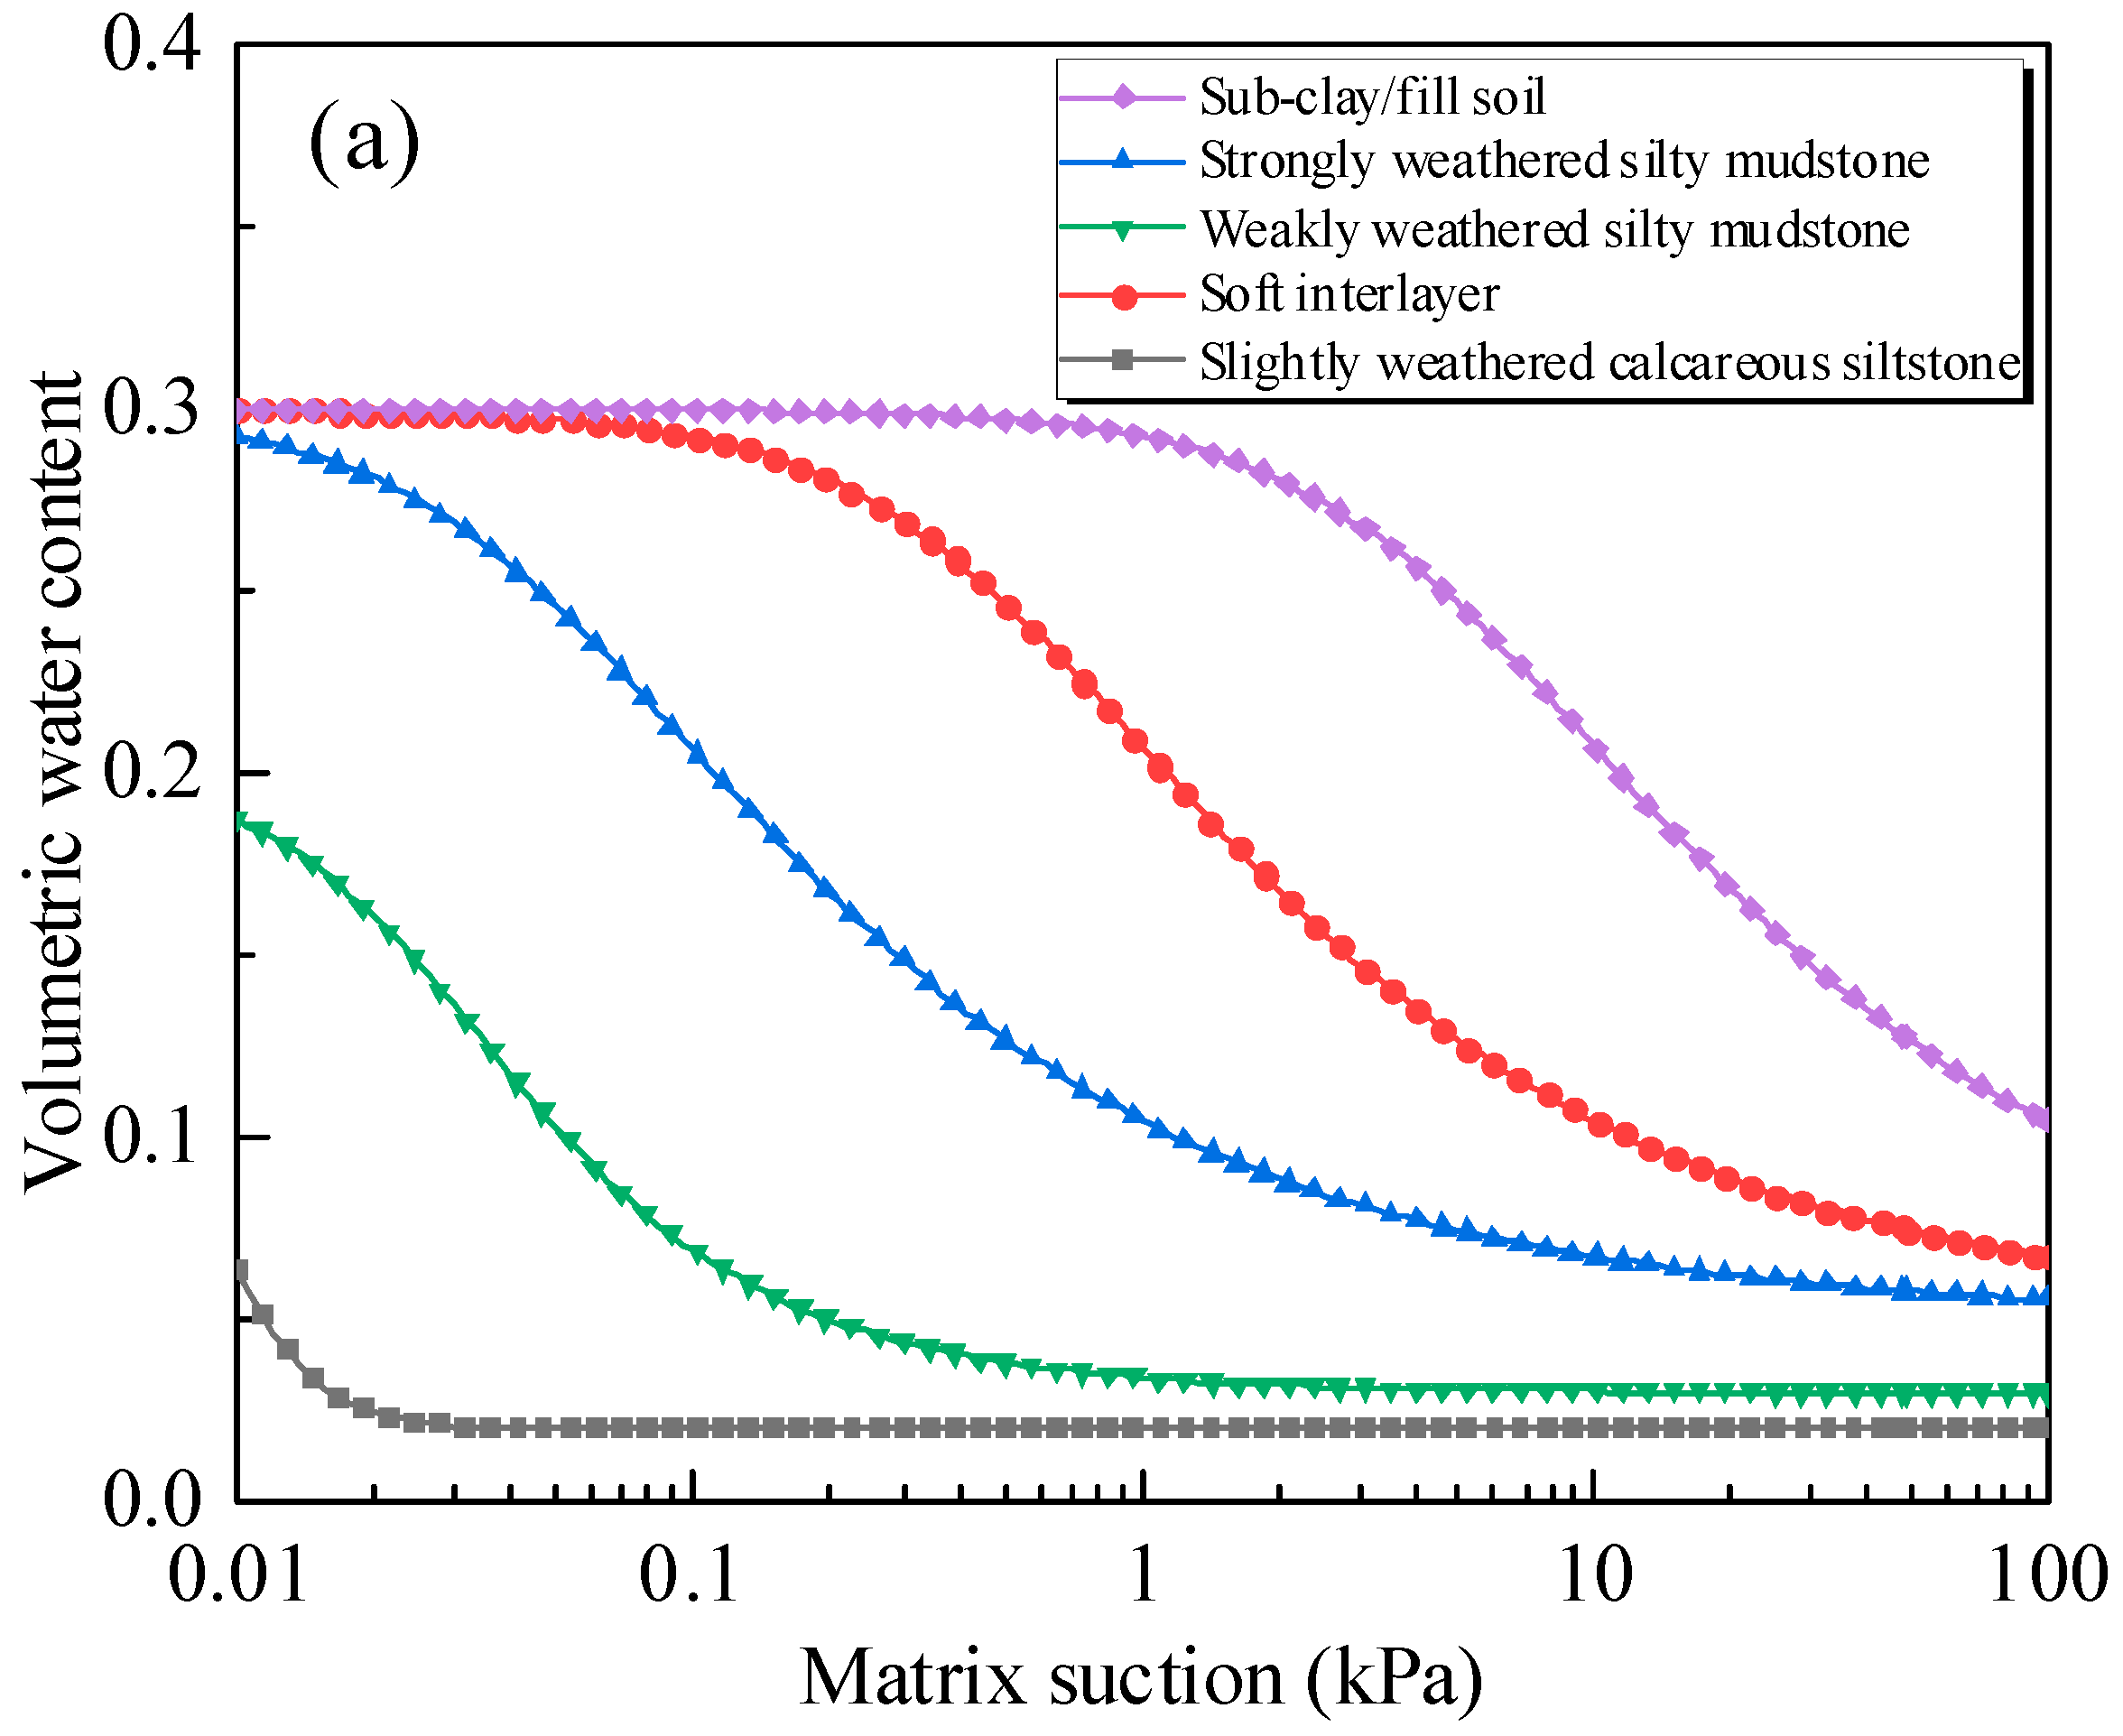
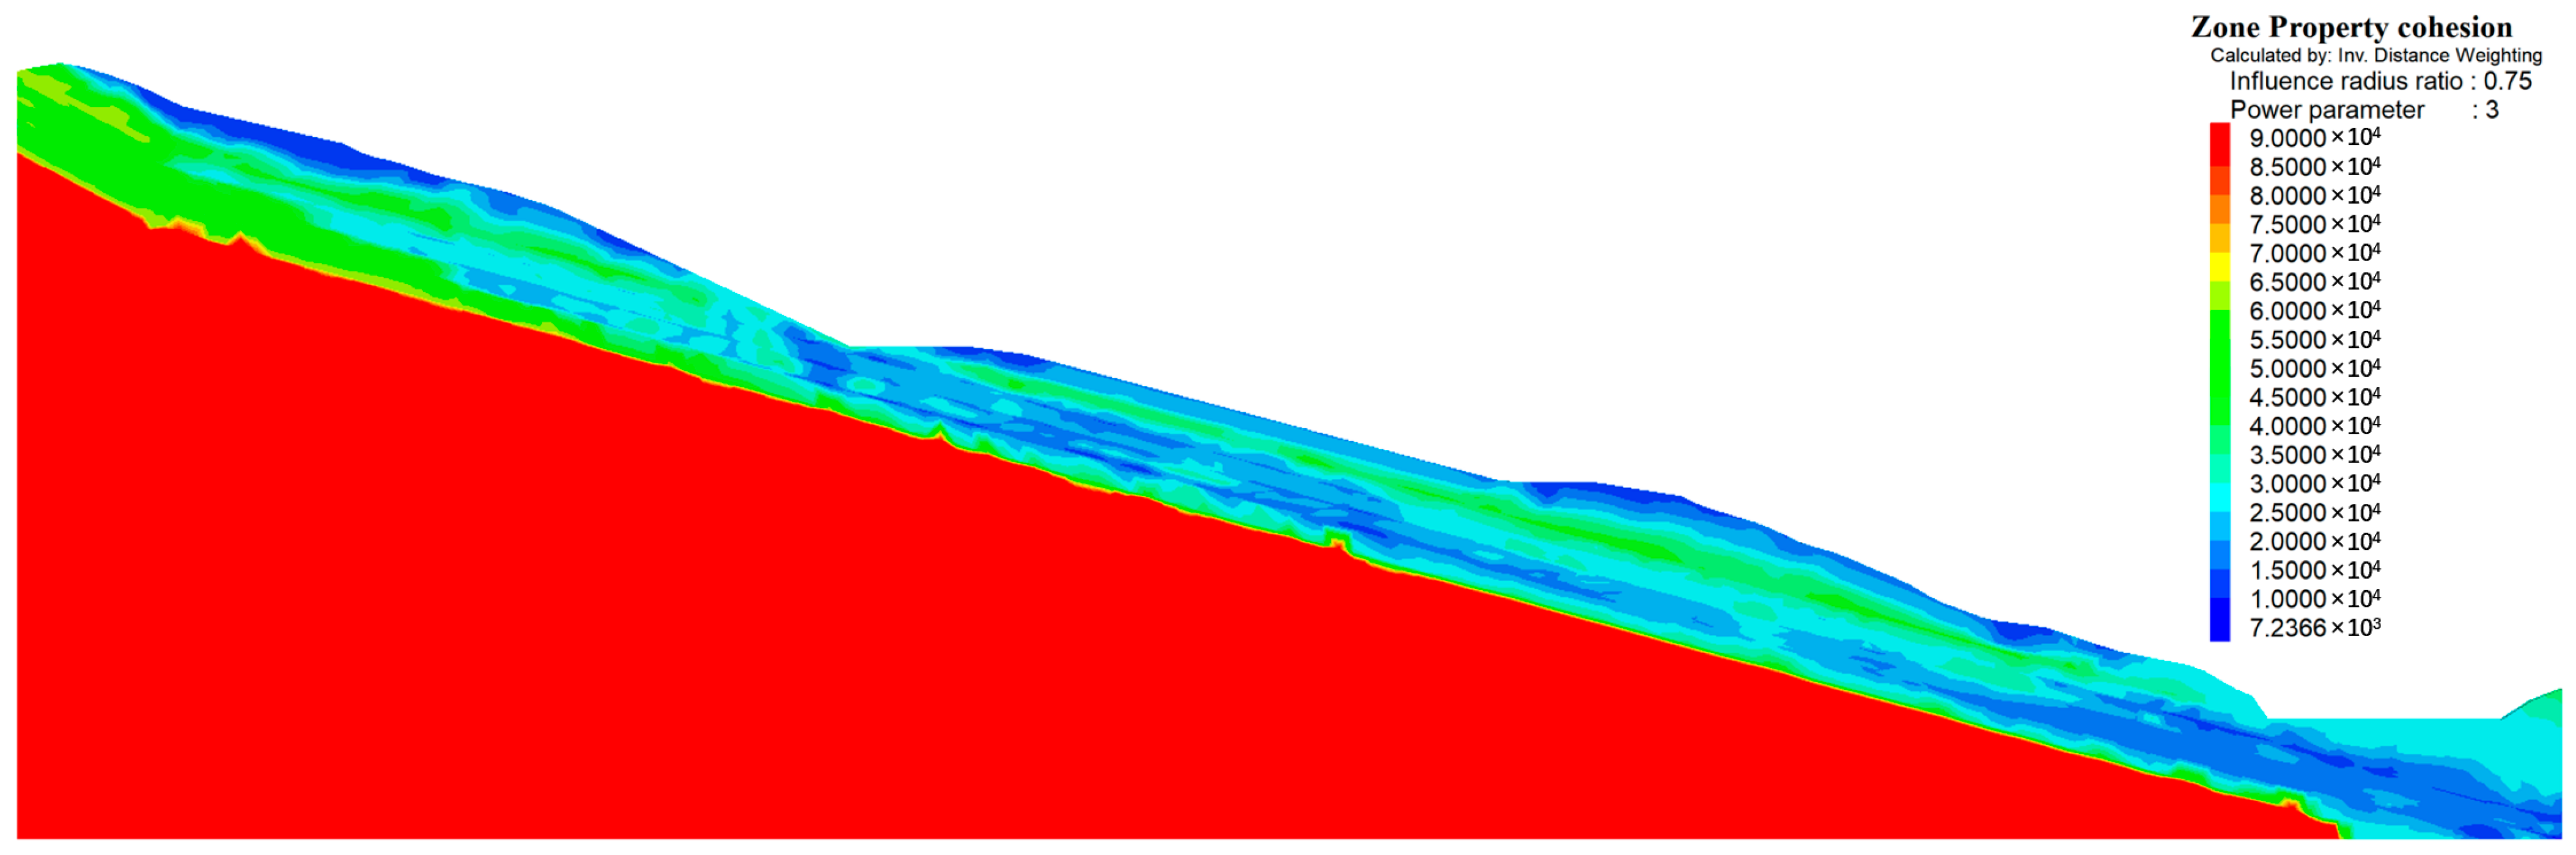
4.1. Parameterization
4.2. Numerical Modeling
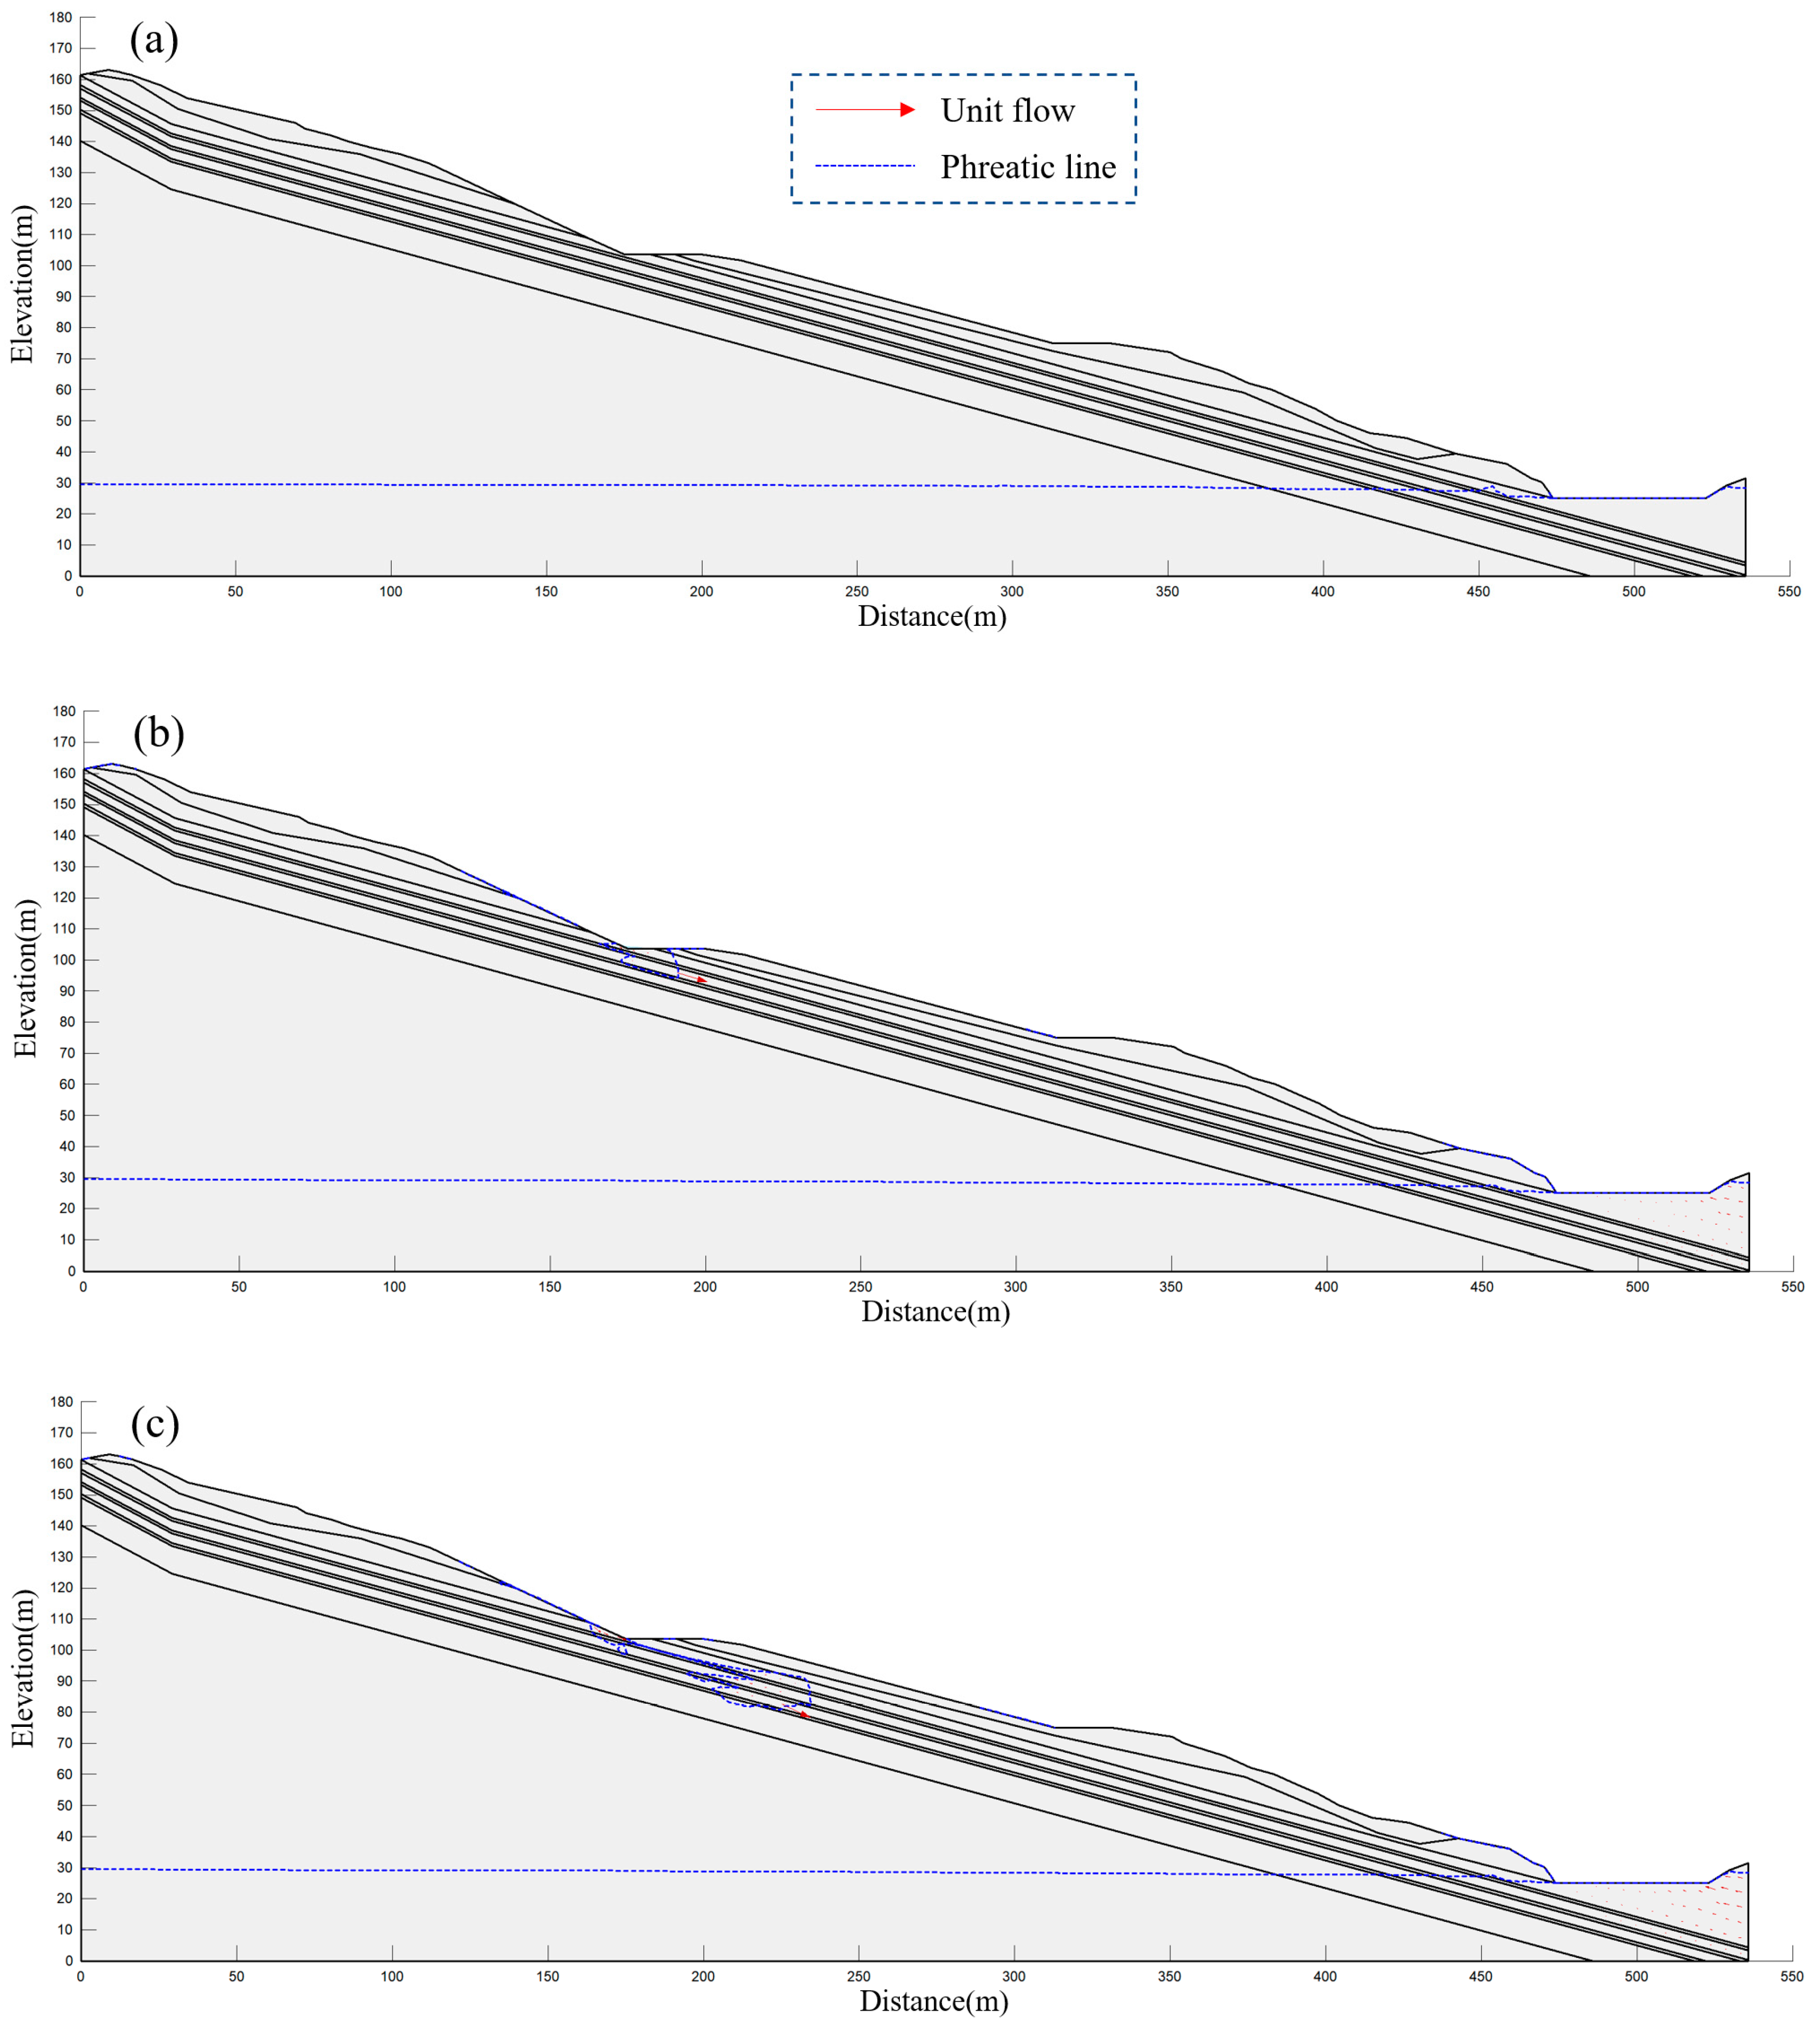
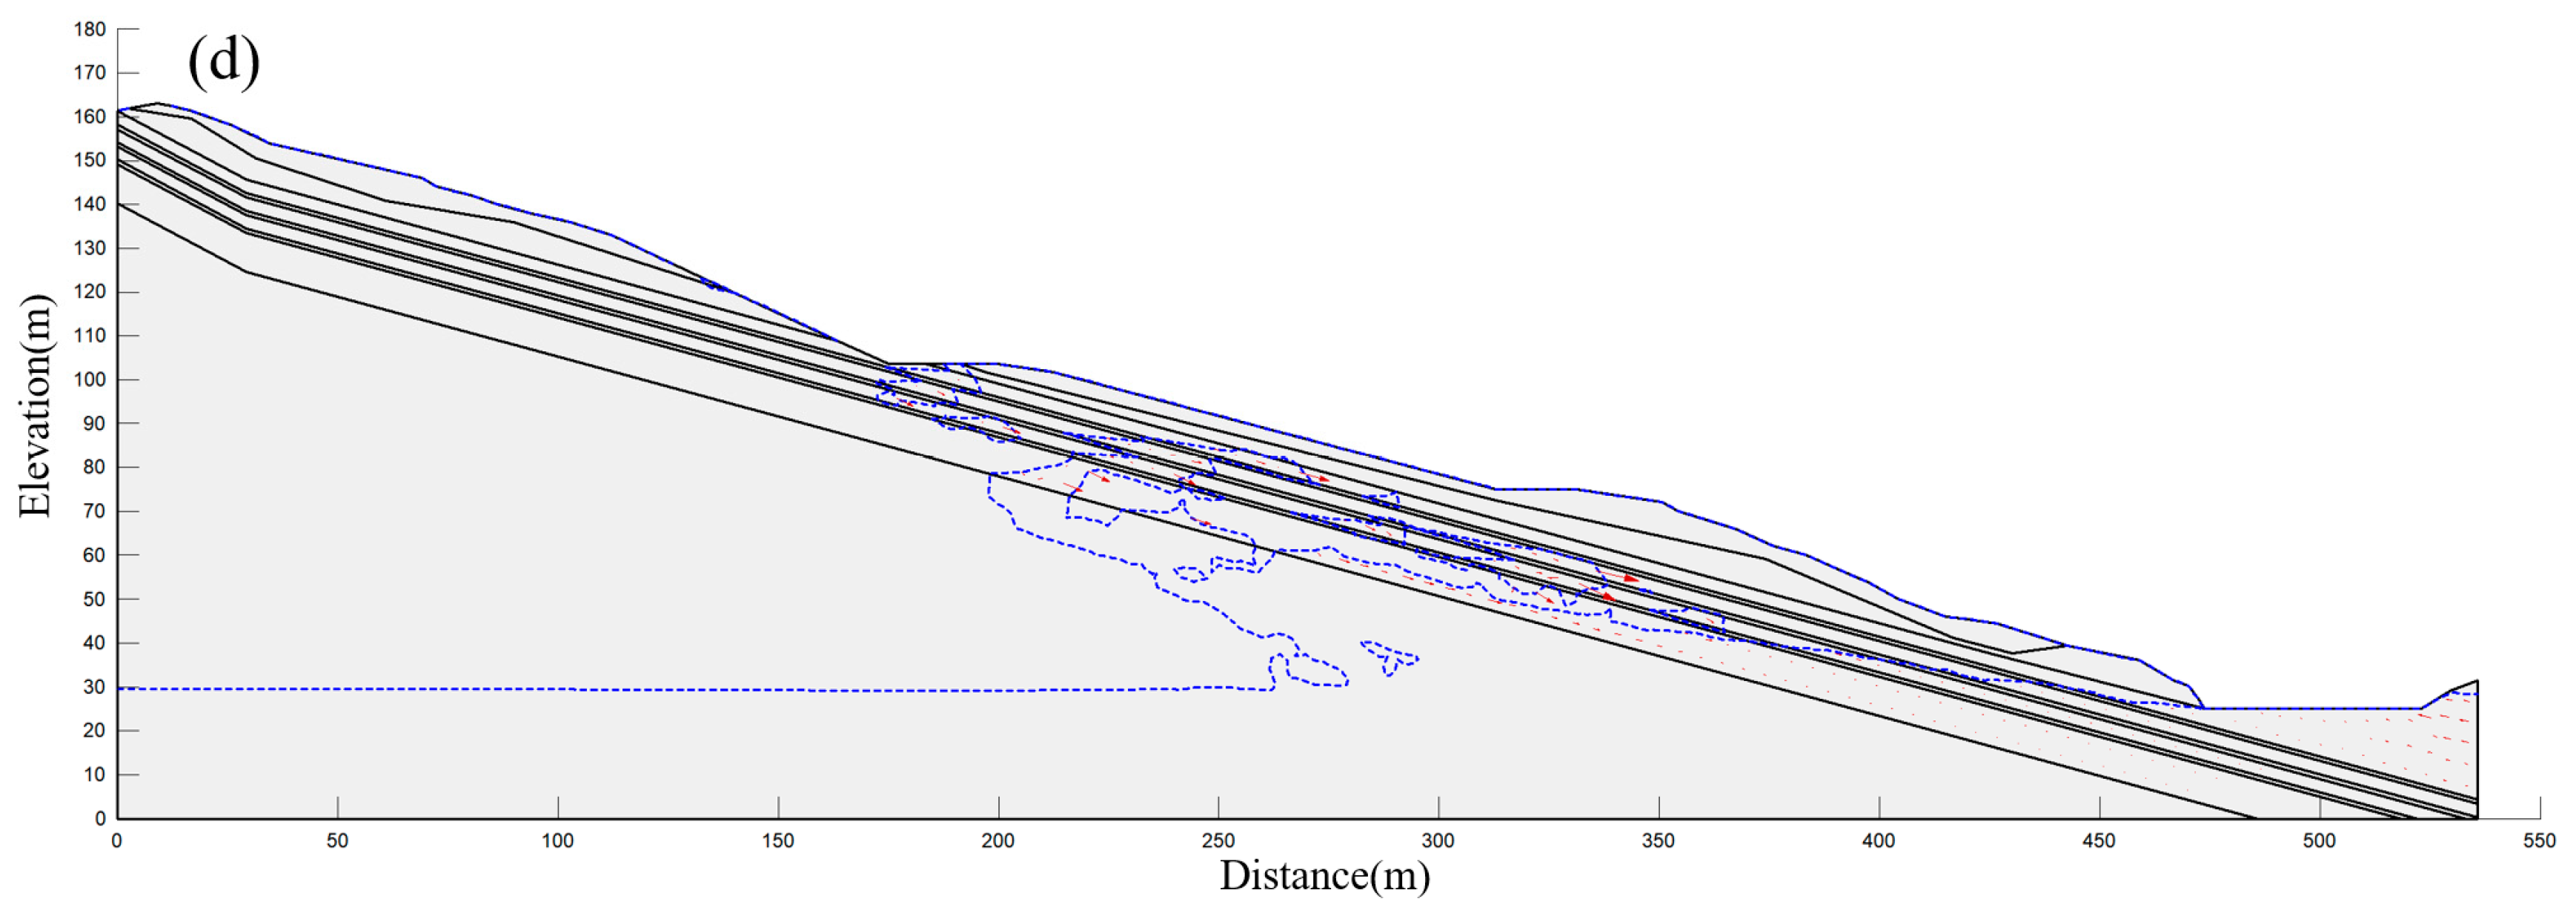
4.3. Analysis of Seepage Results
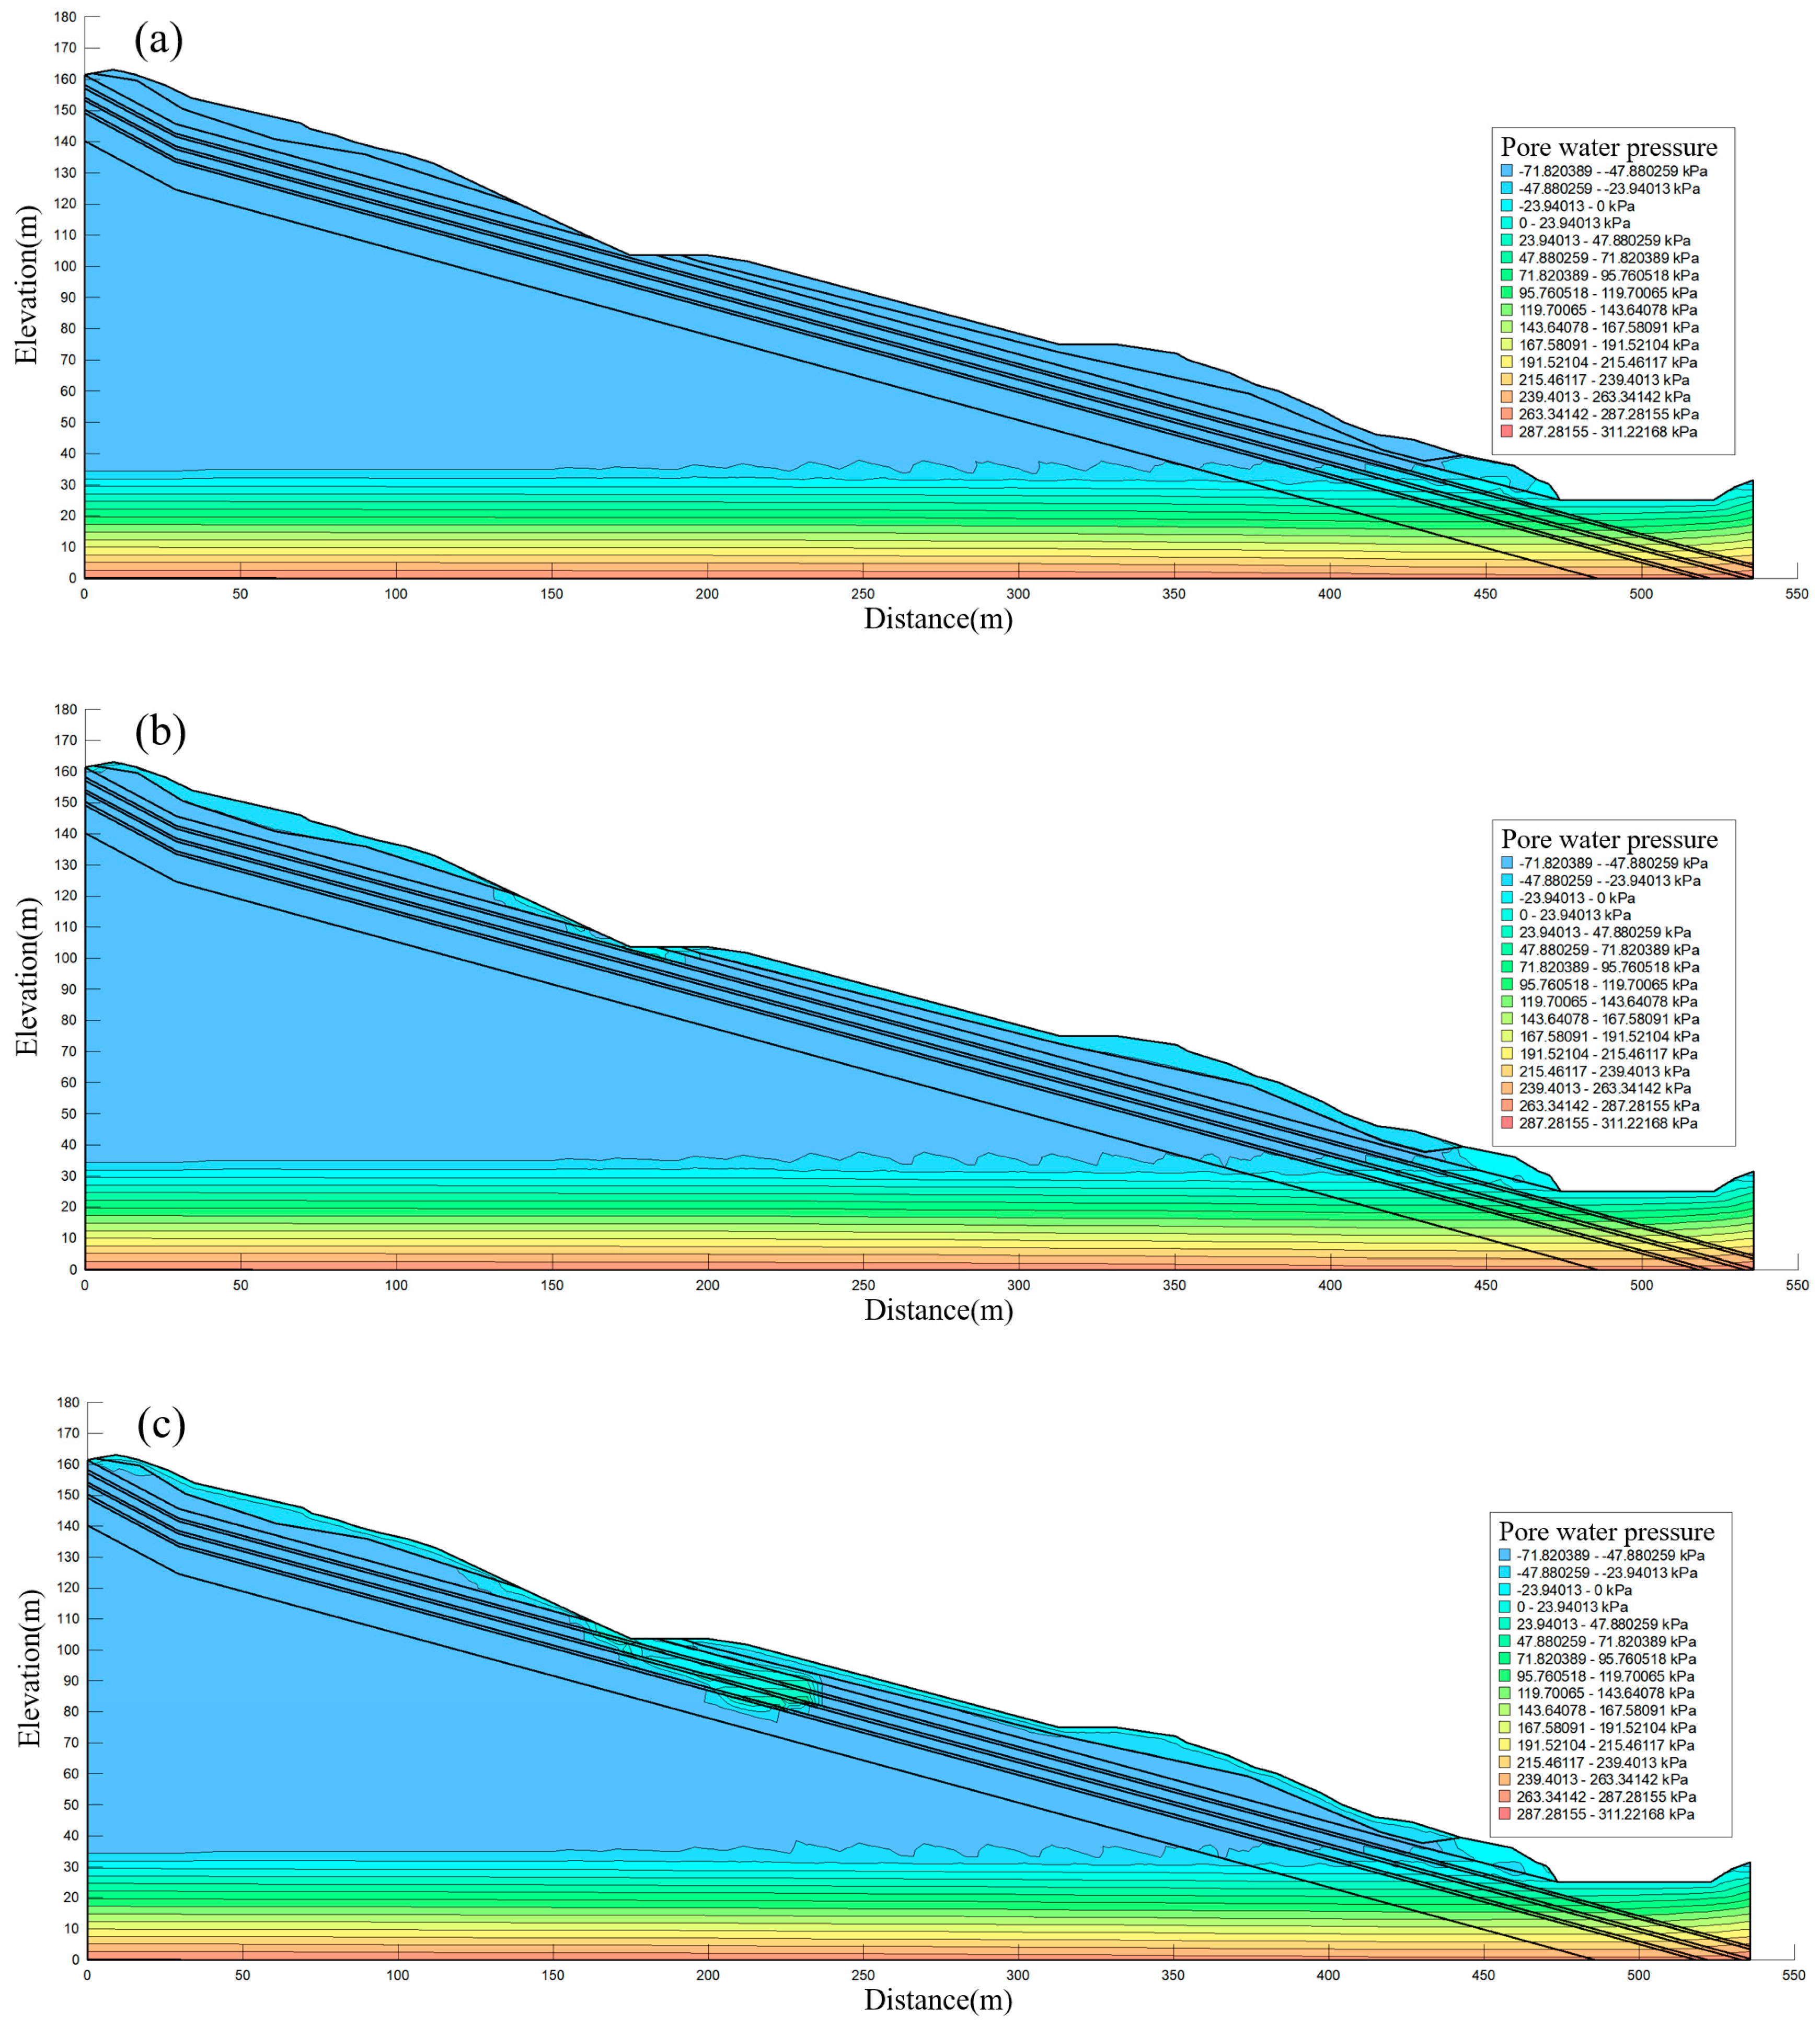
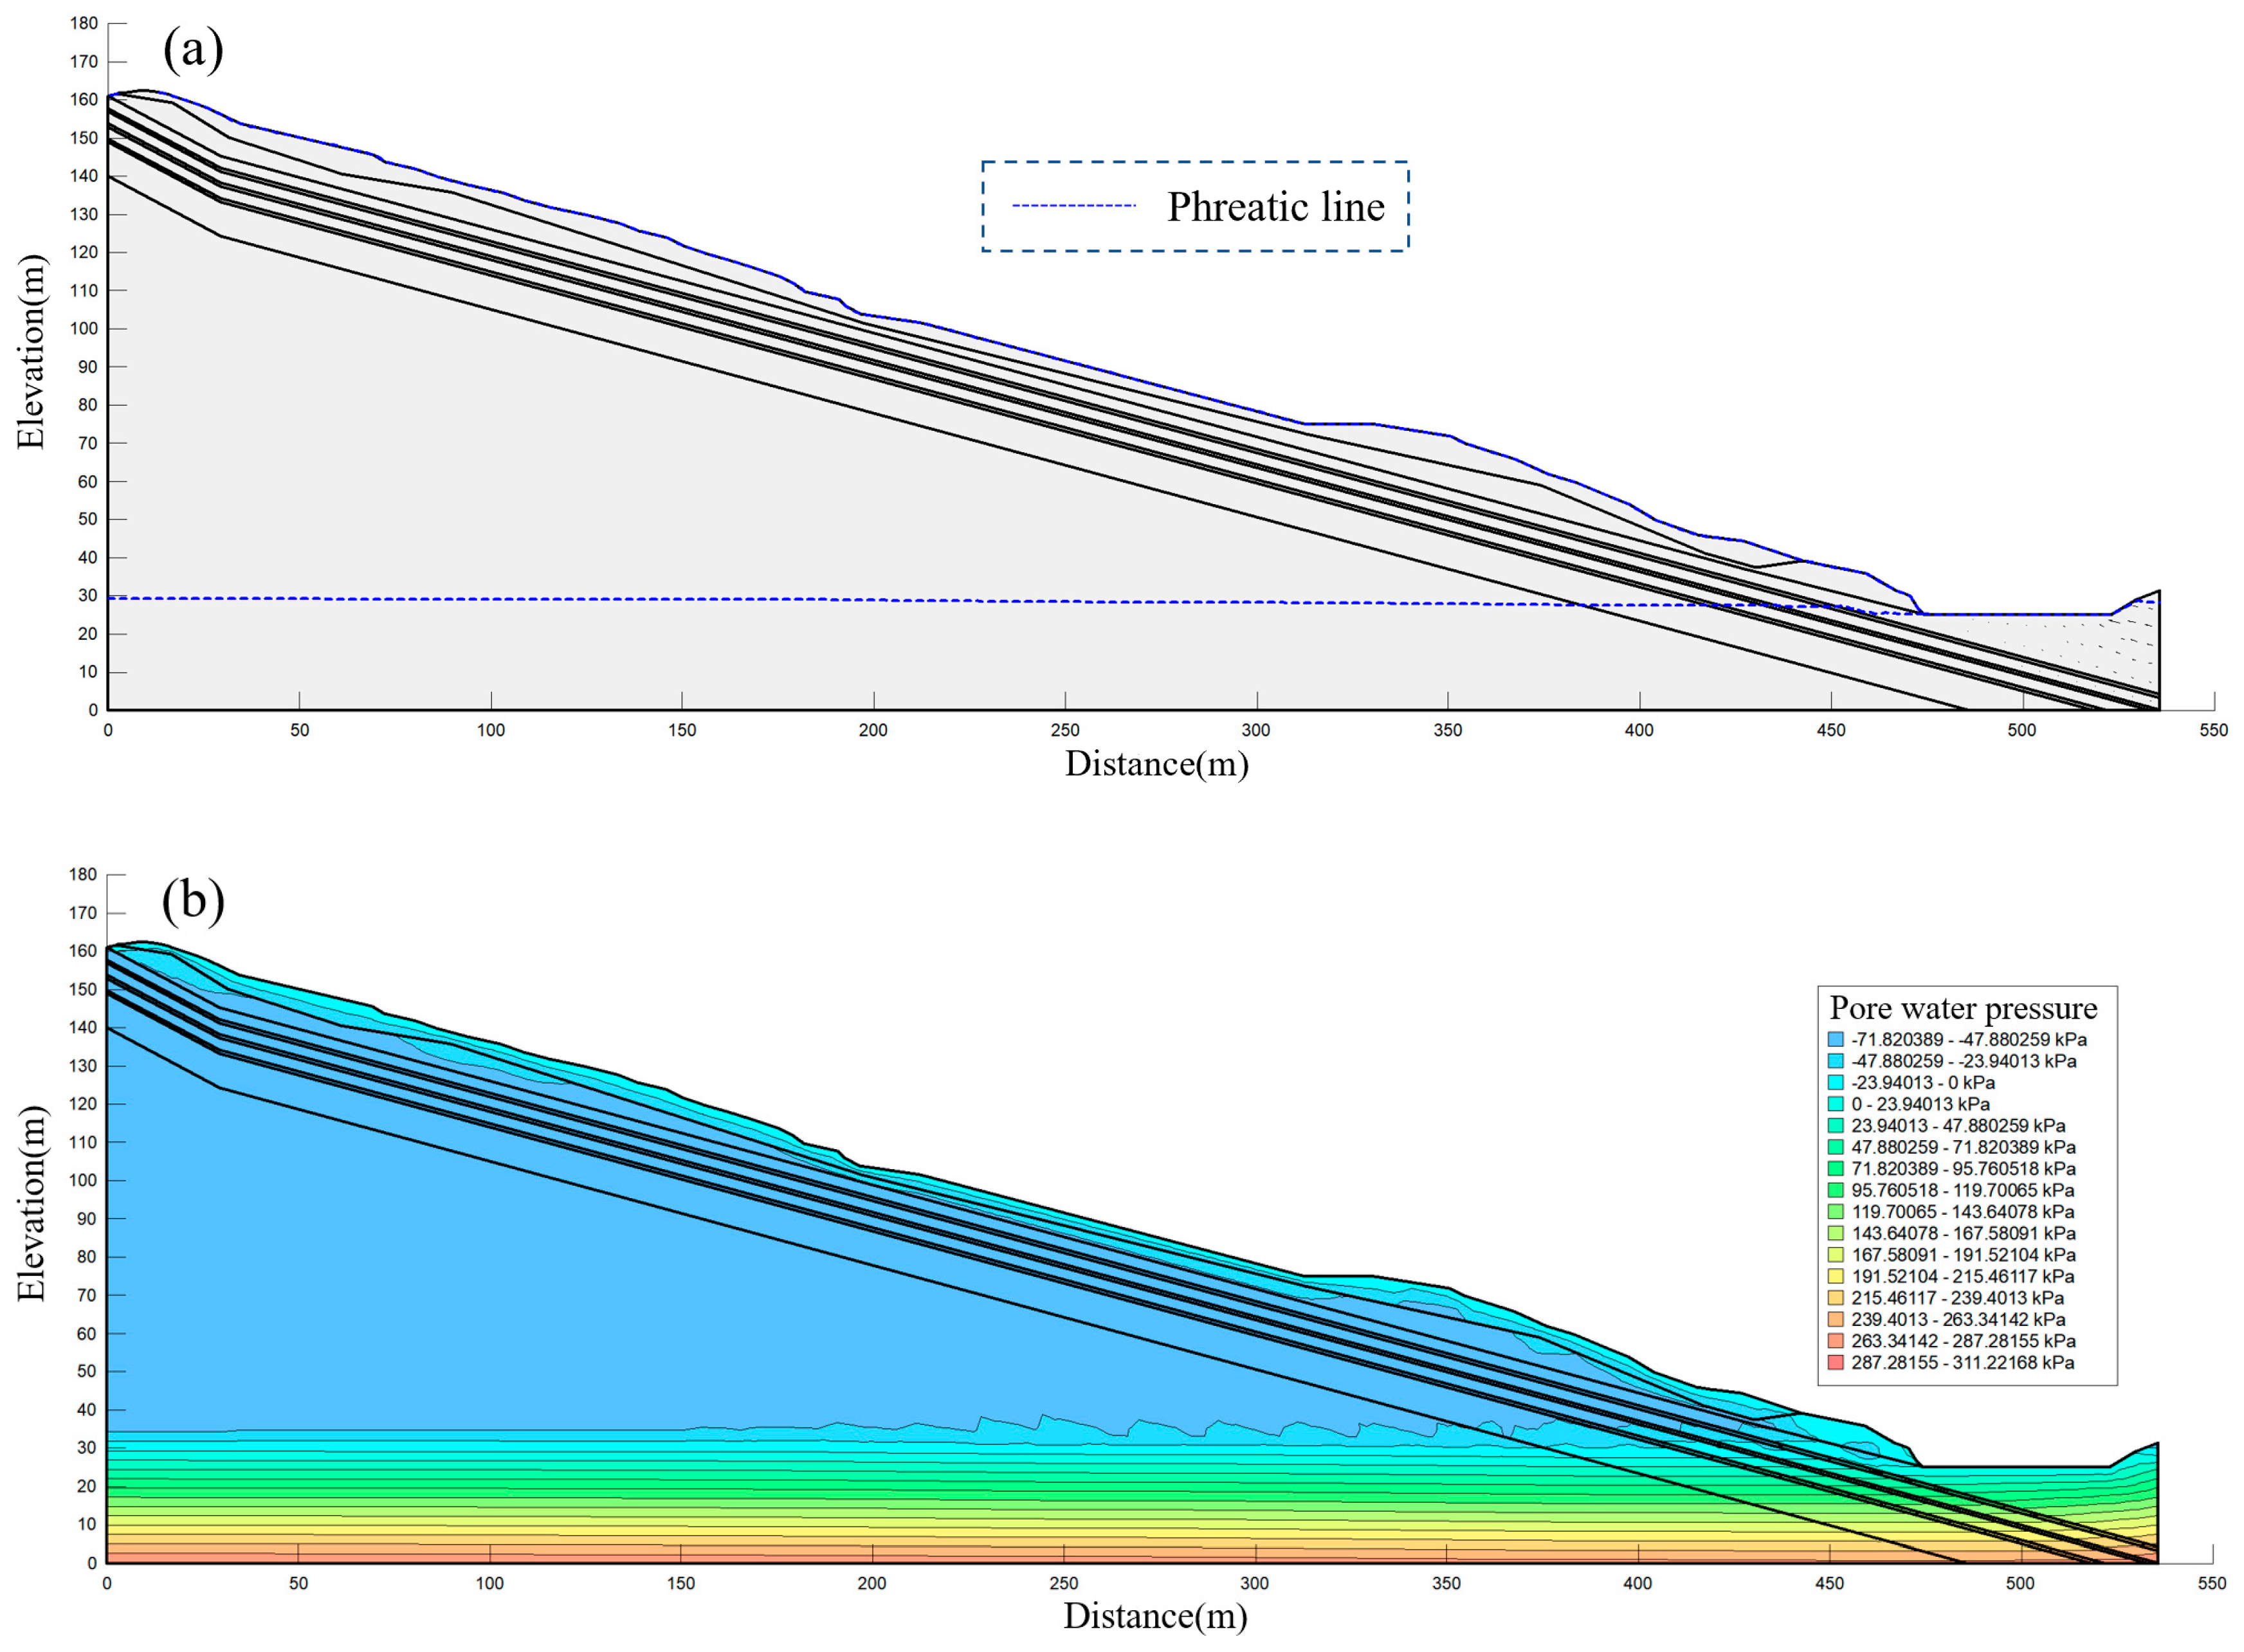
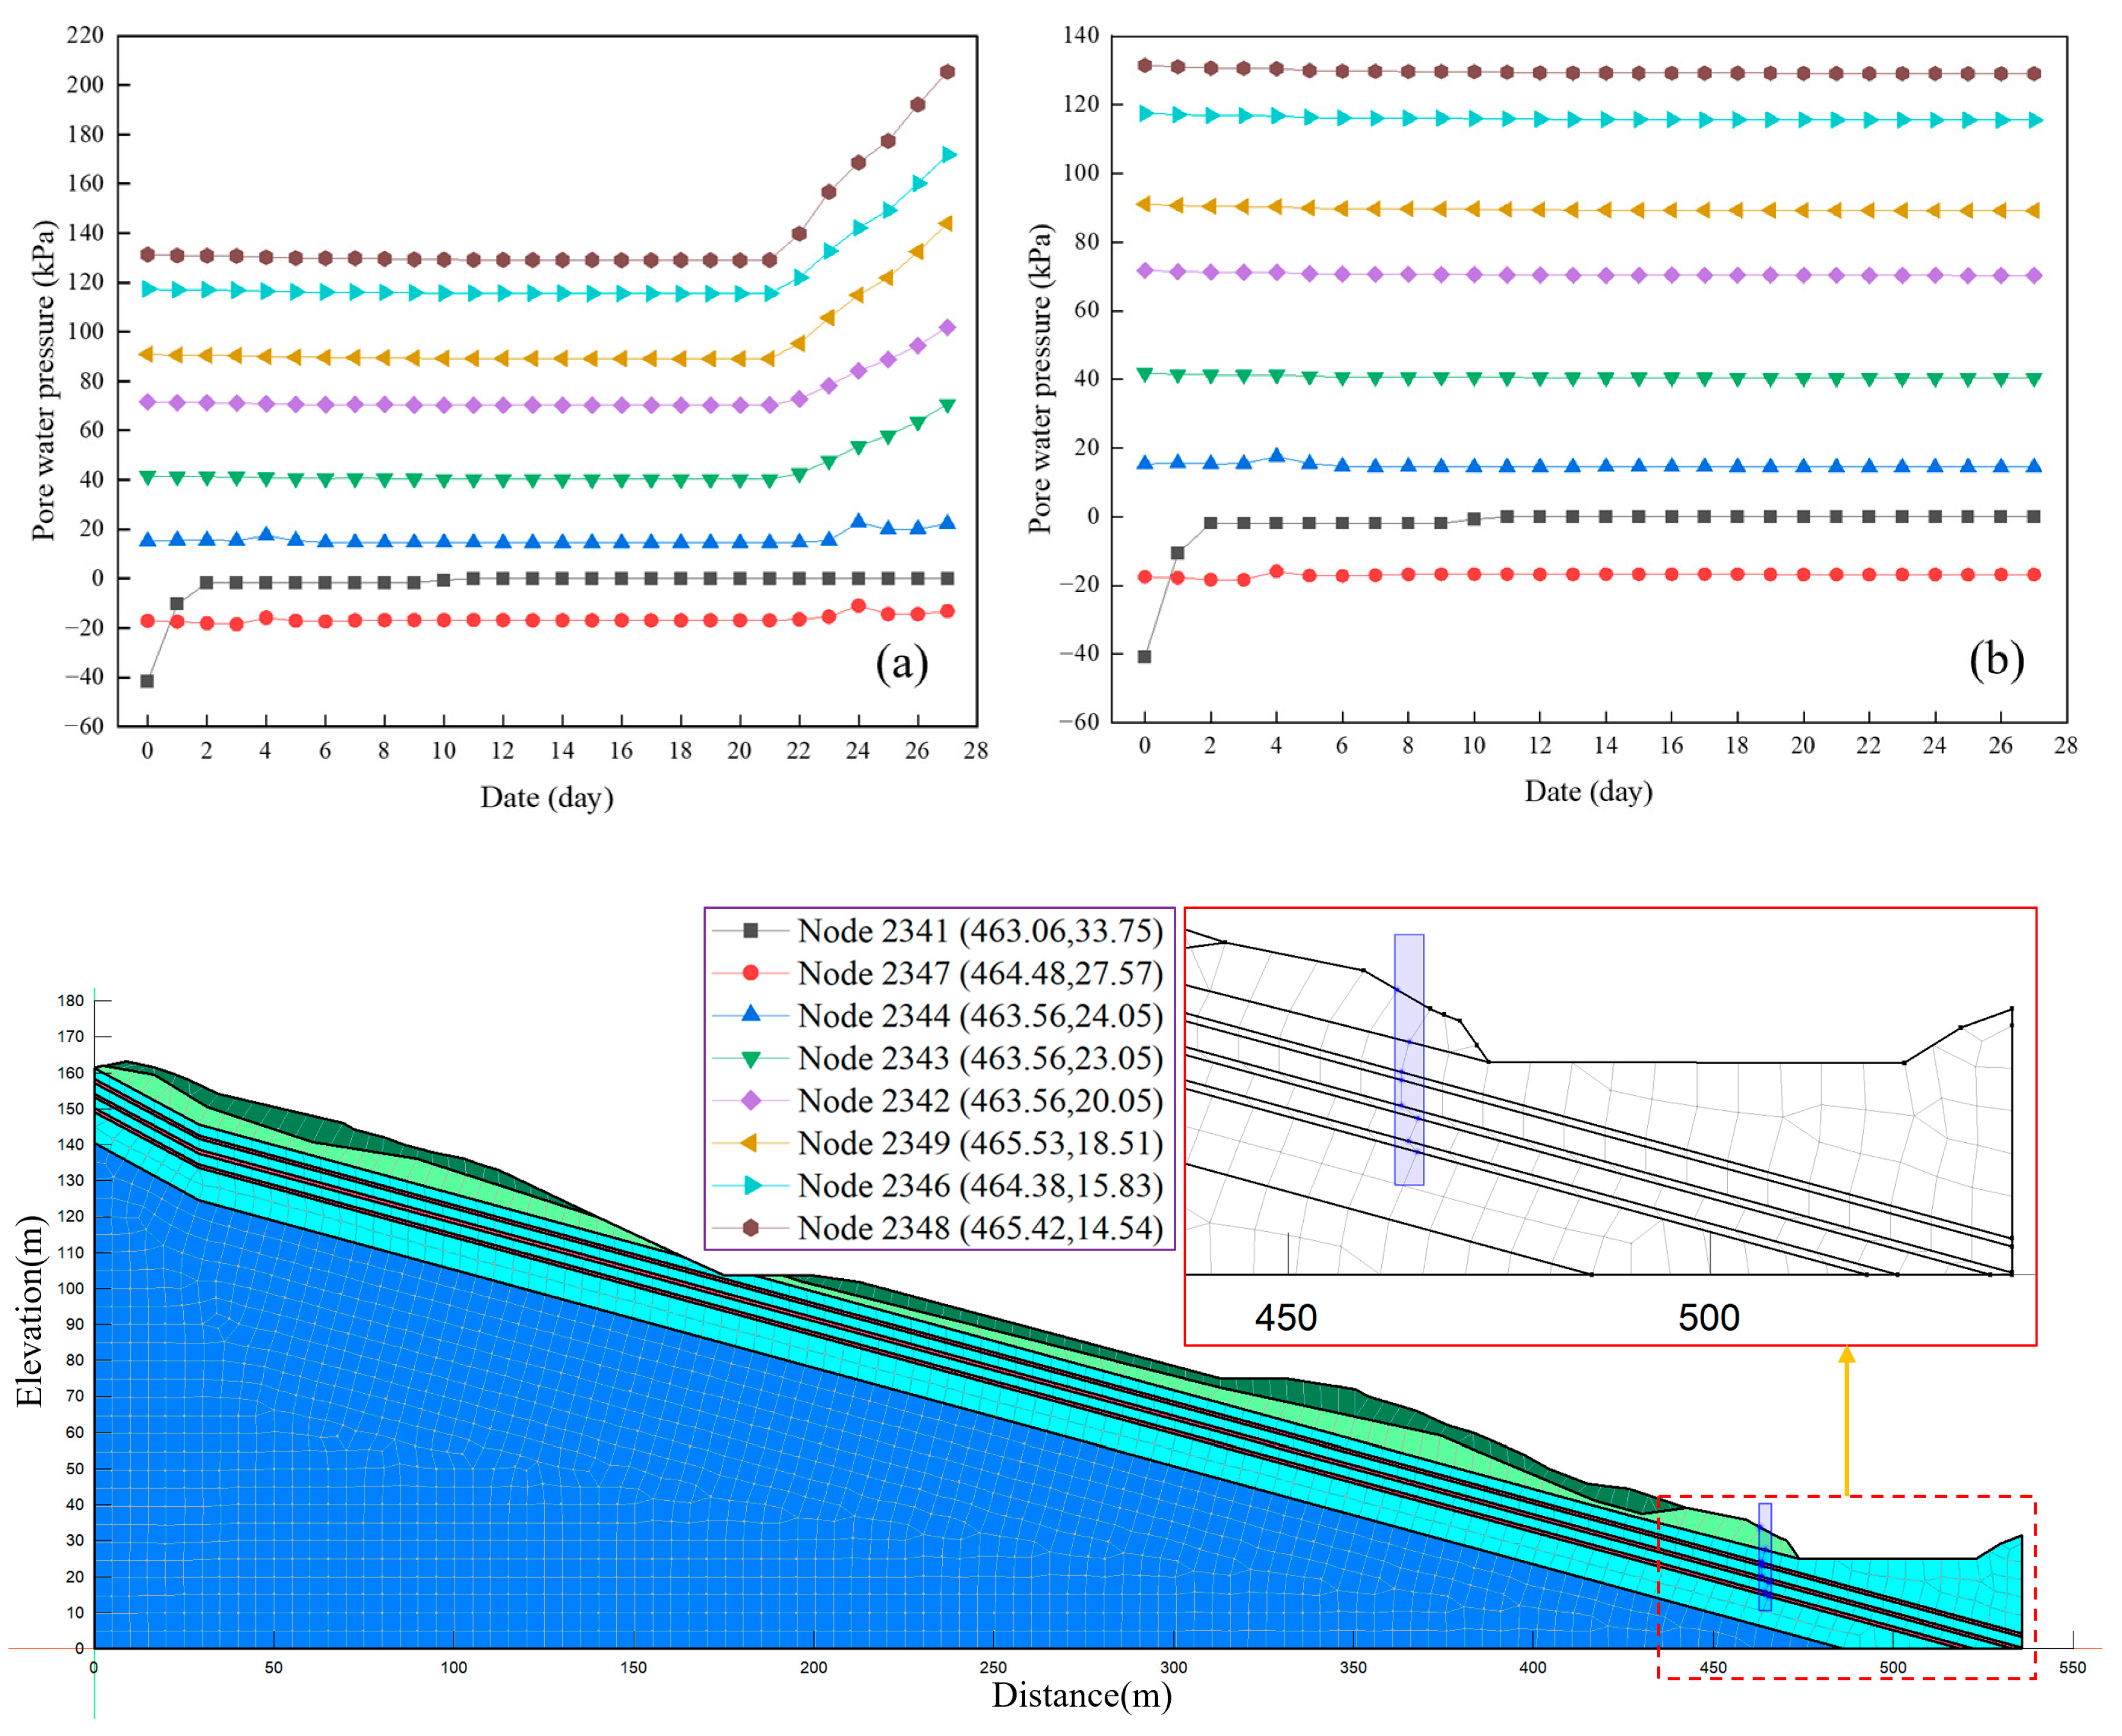
4.3.1. Highway Slope Seepage Analysis
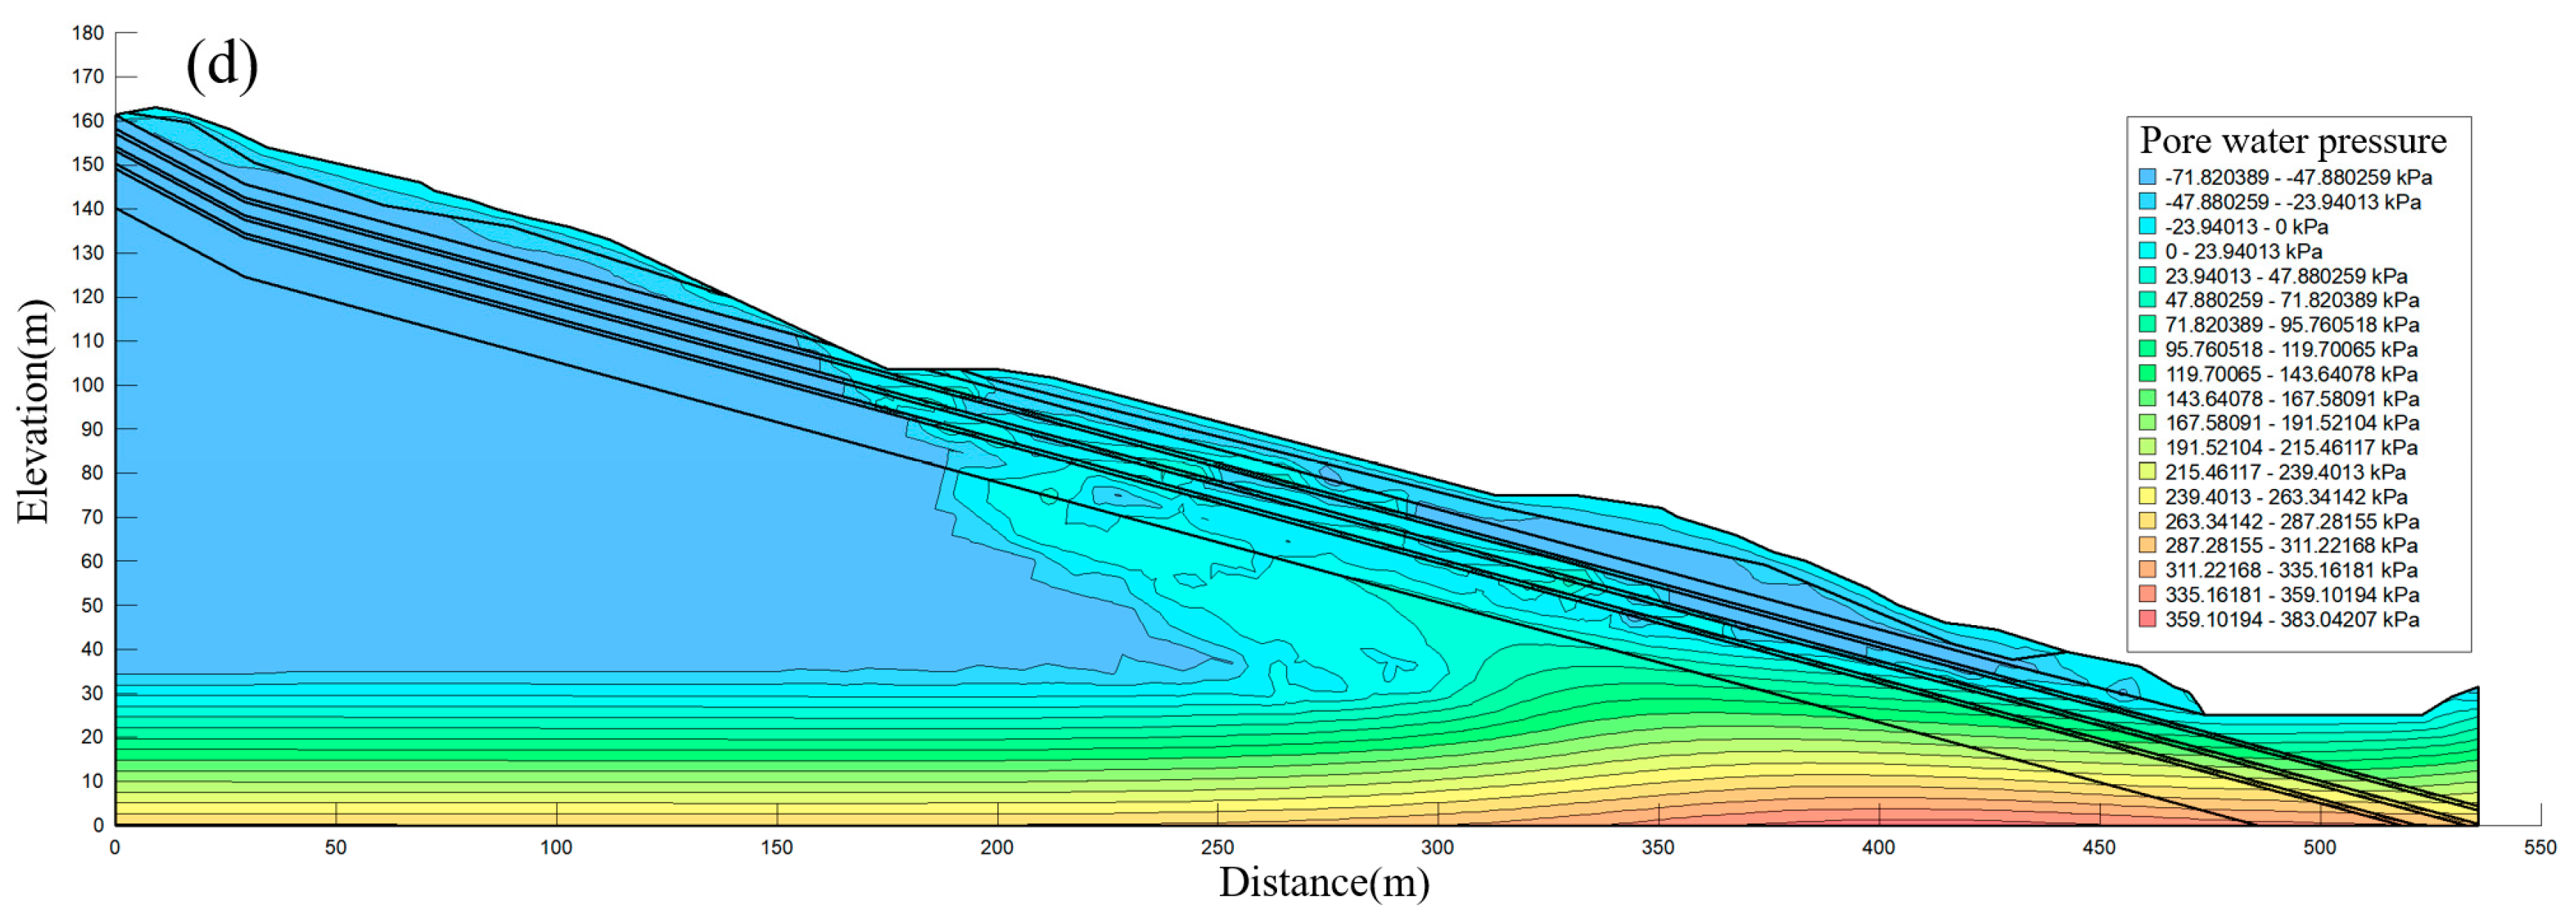
4.3.2. Natural Slope Seepage Analysis
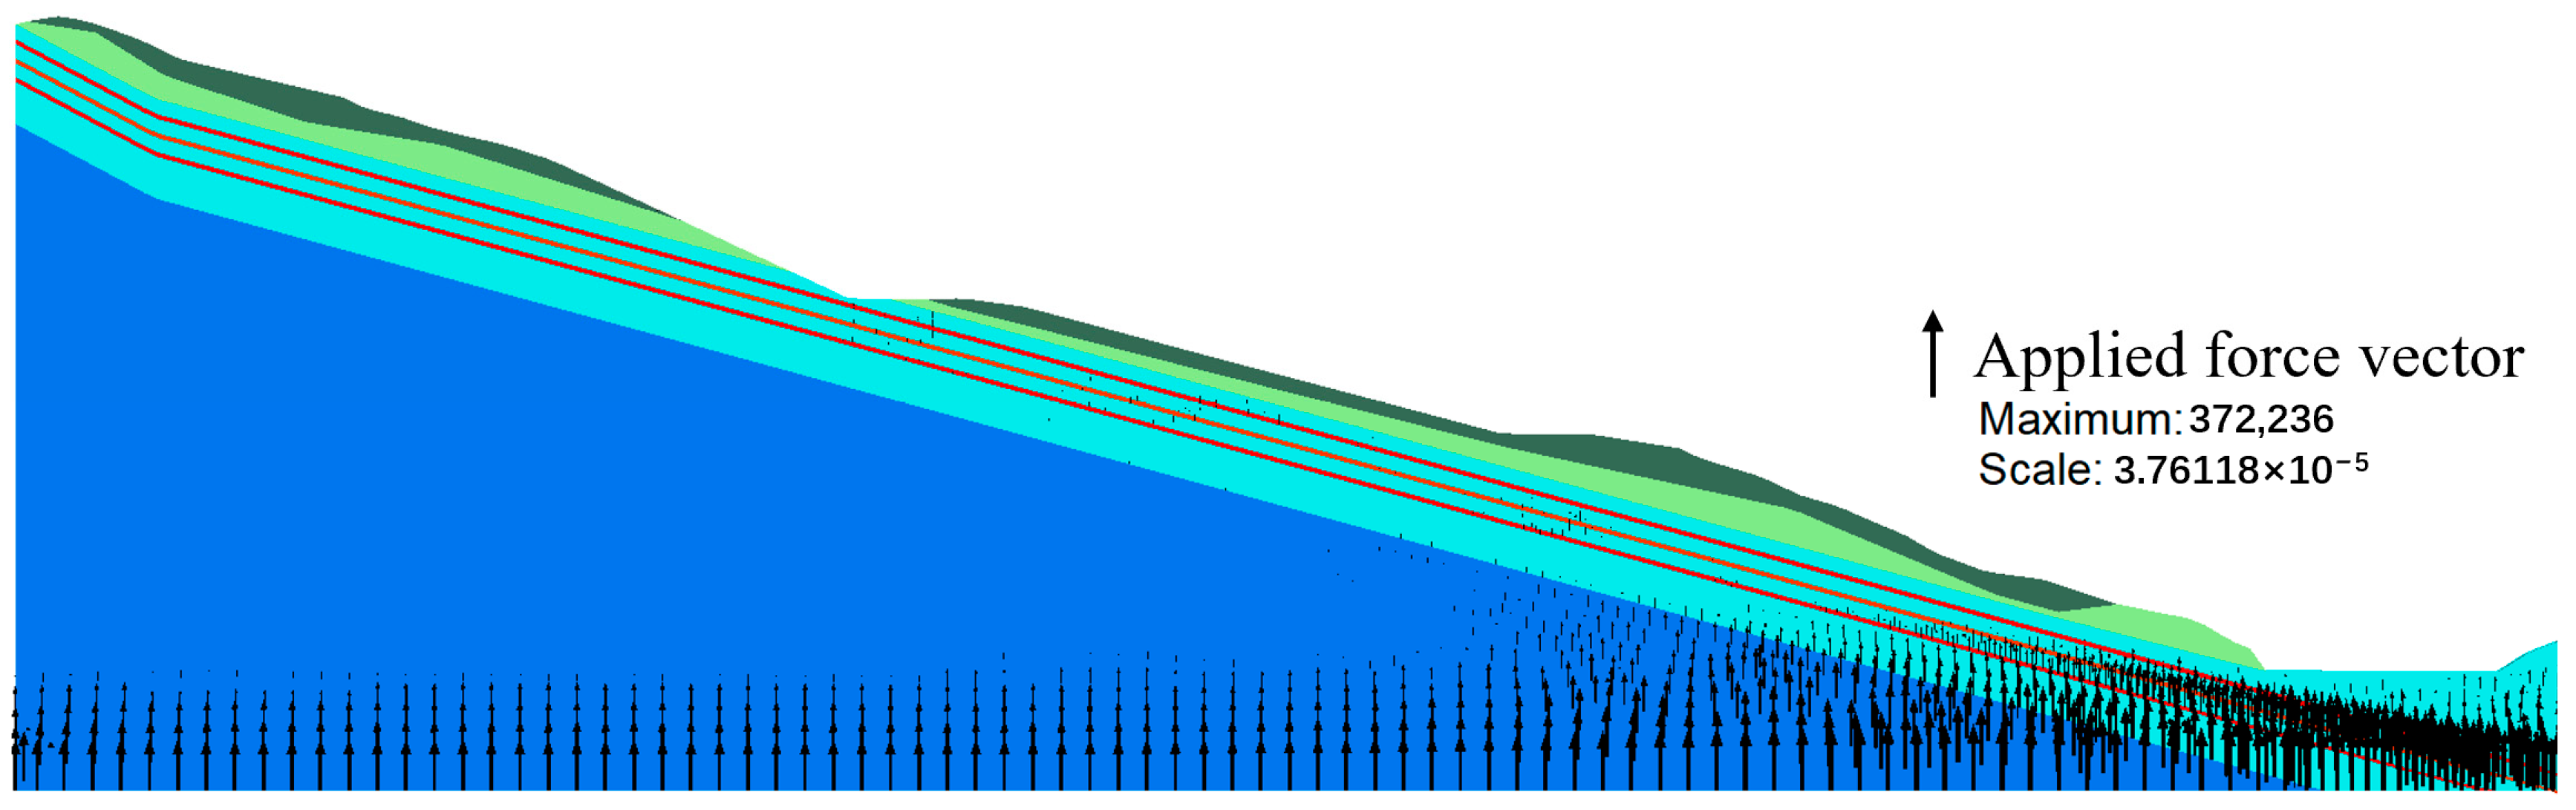
4.4. Slope Stability Analysis
4.5. Analysis of Highway Slope Destabilization Process
5. Conclusions
- (1)
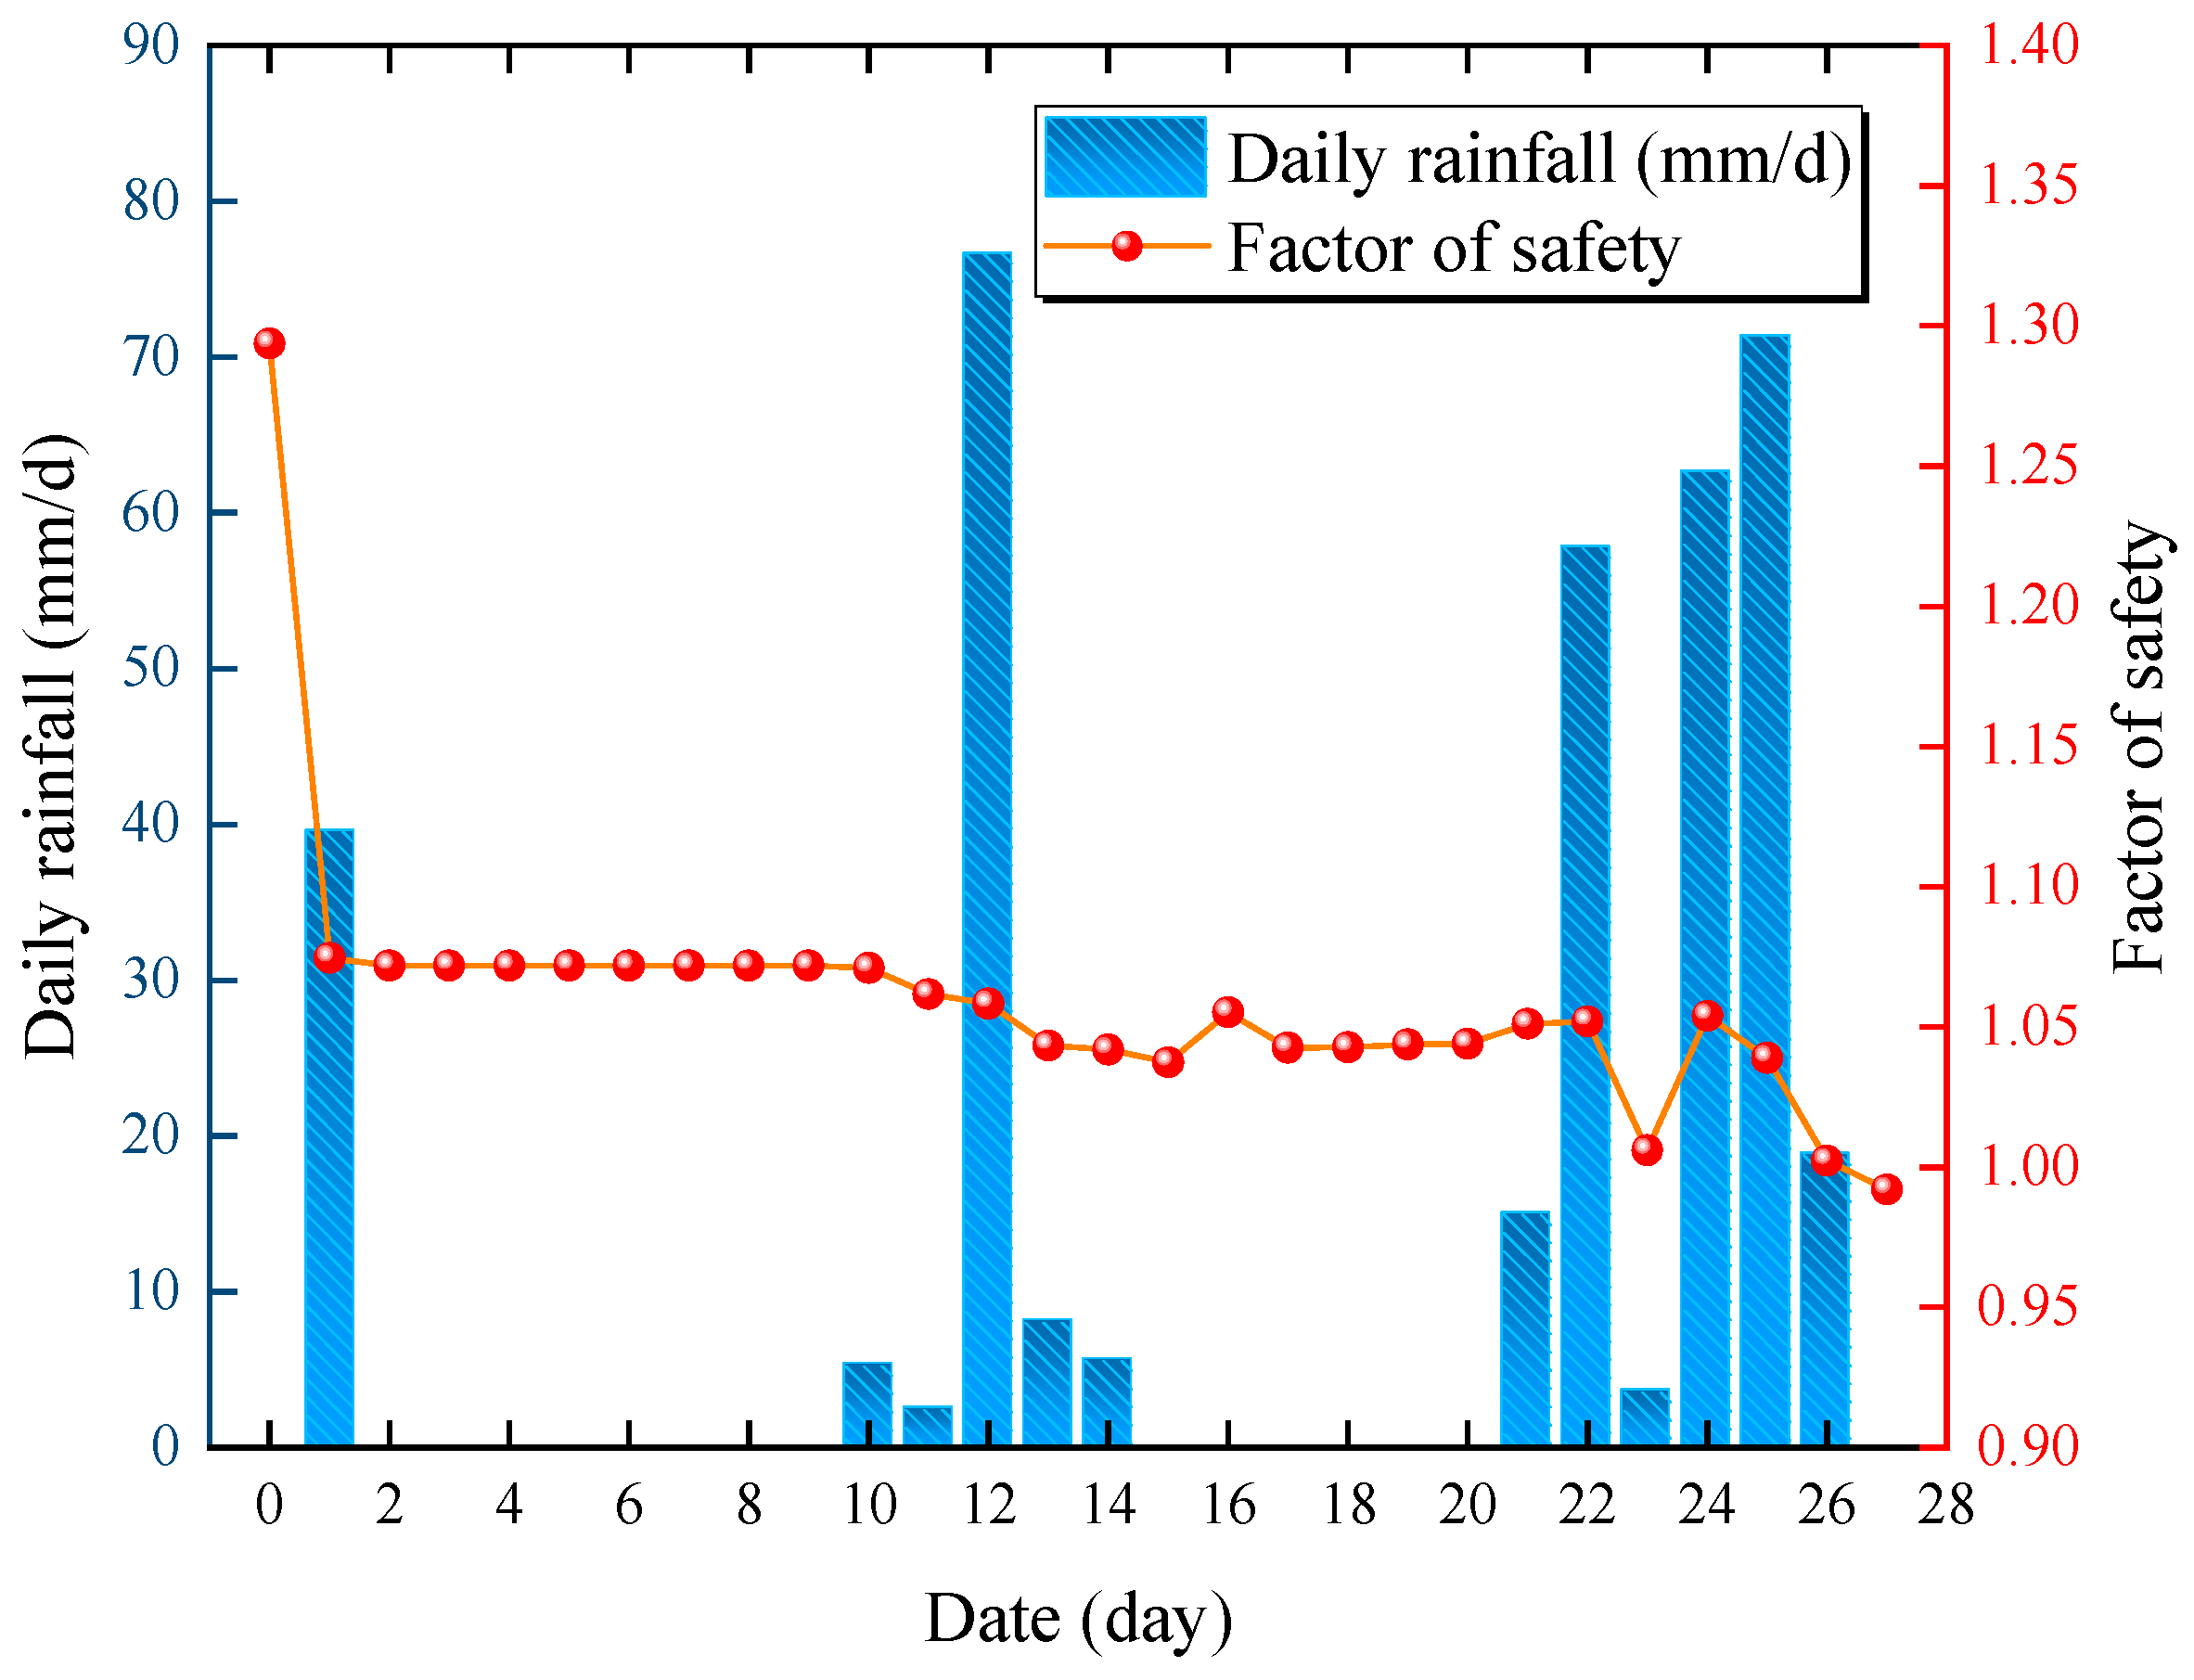
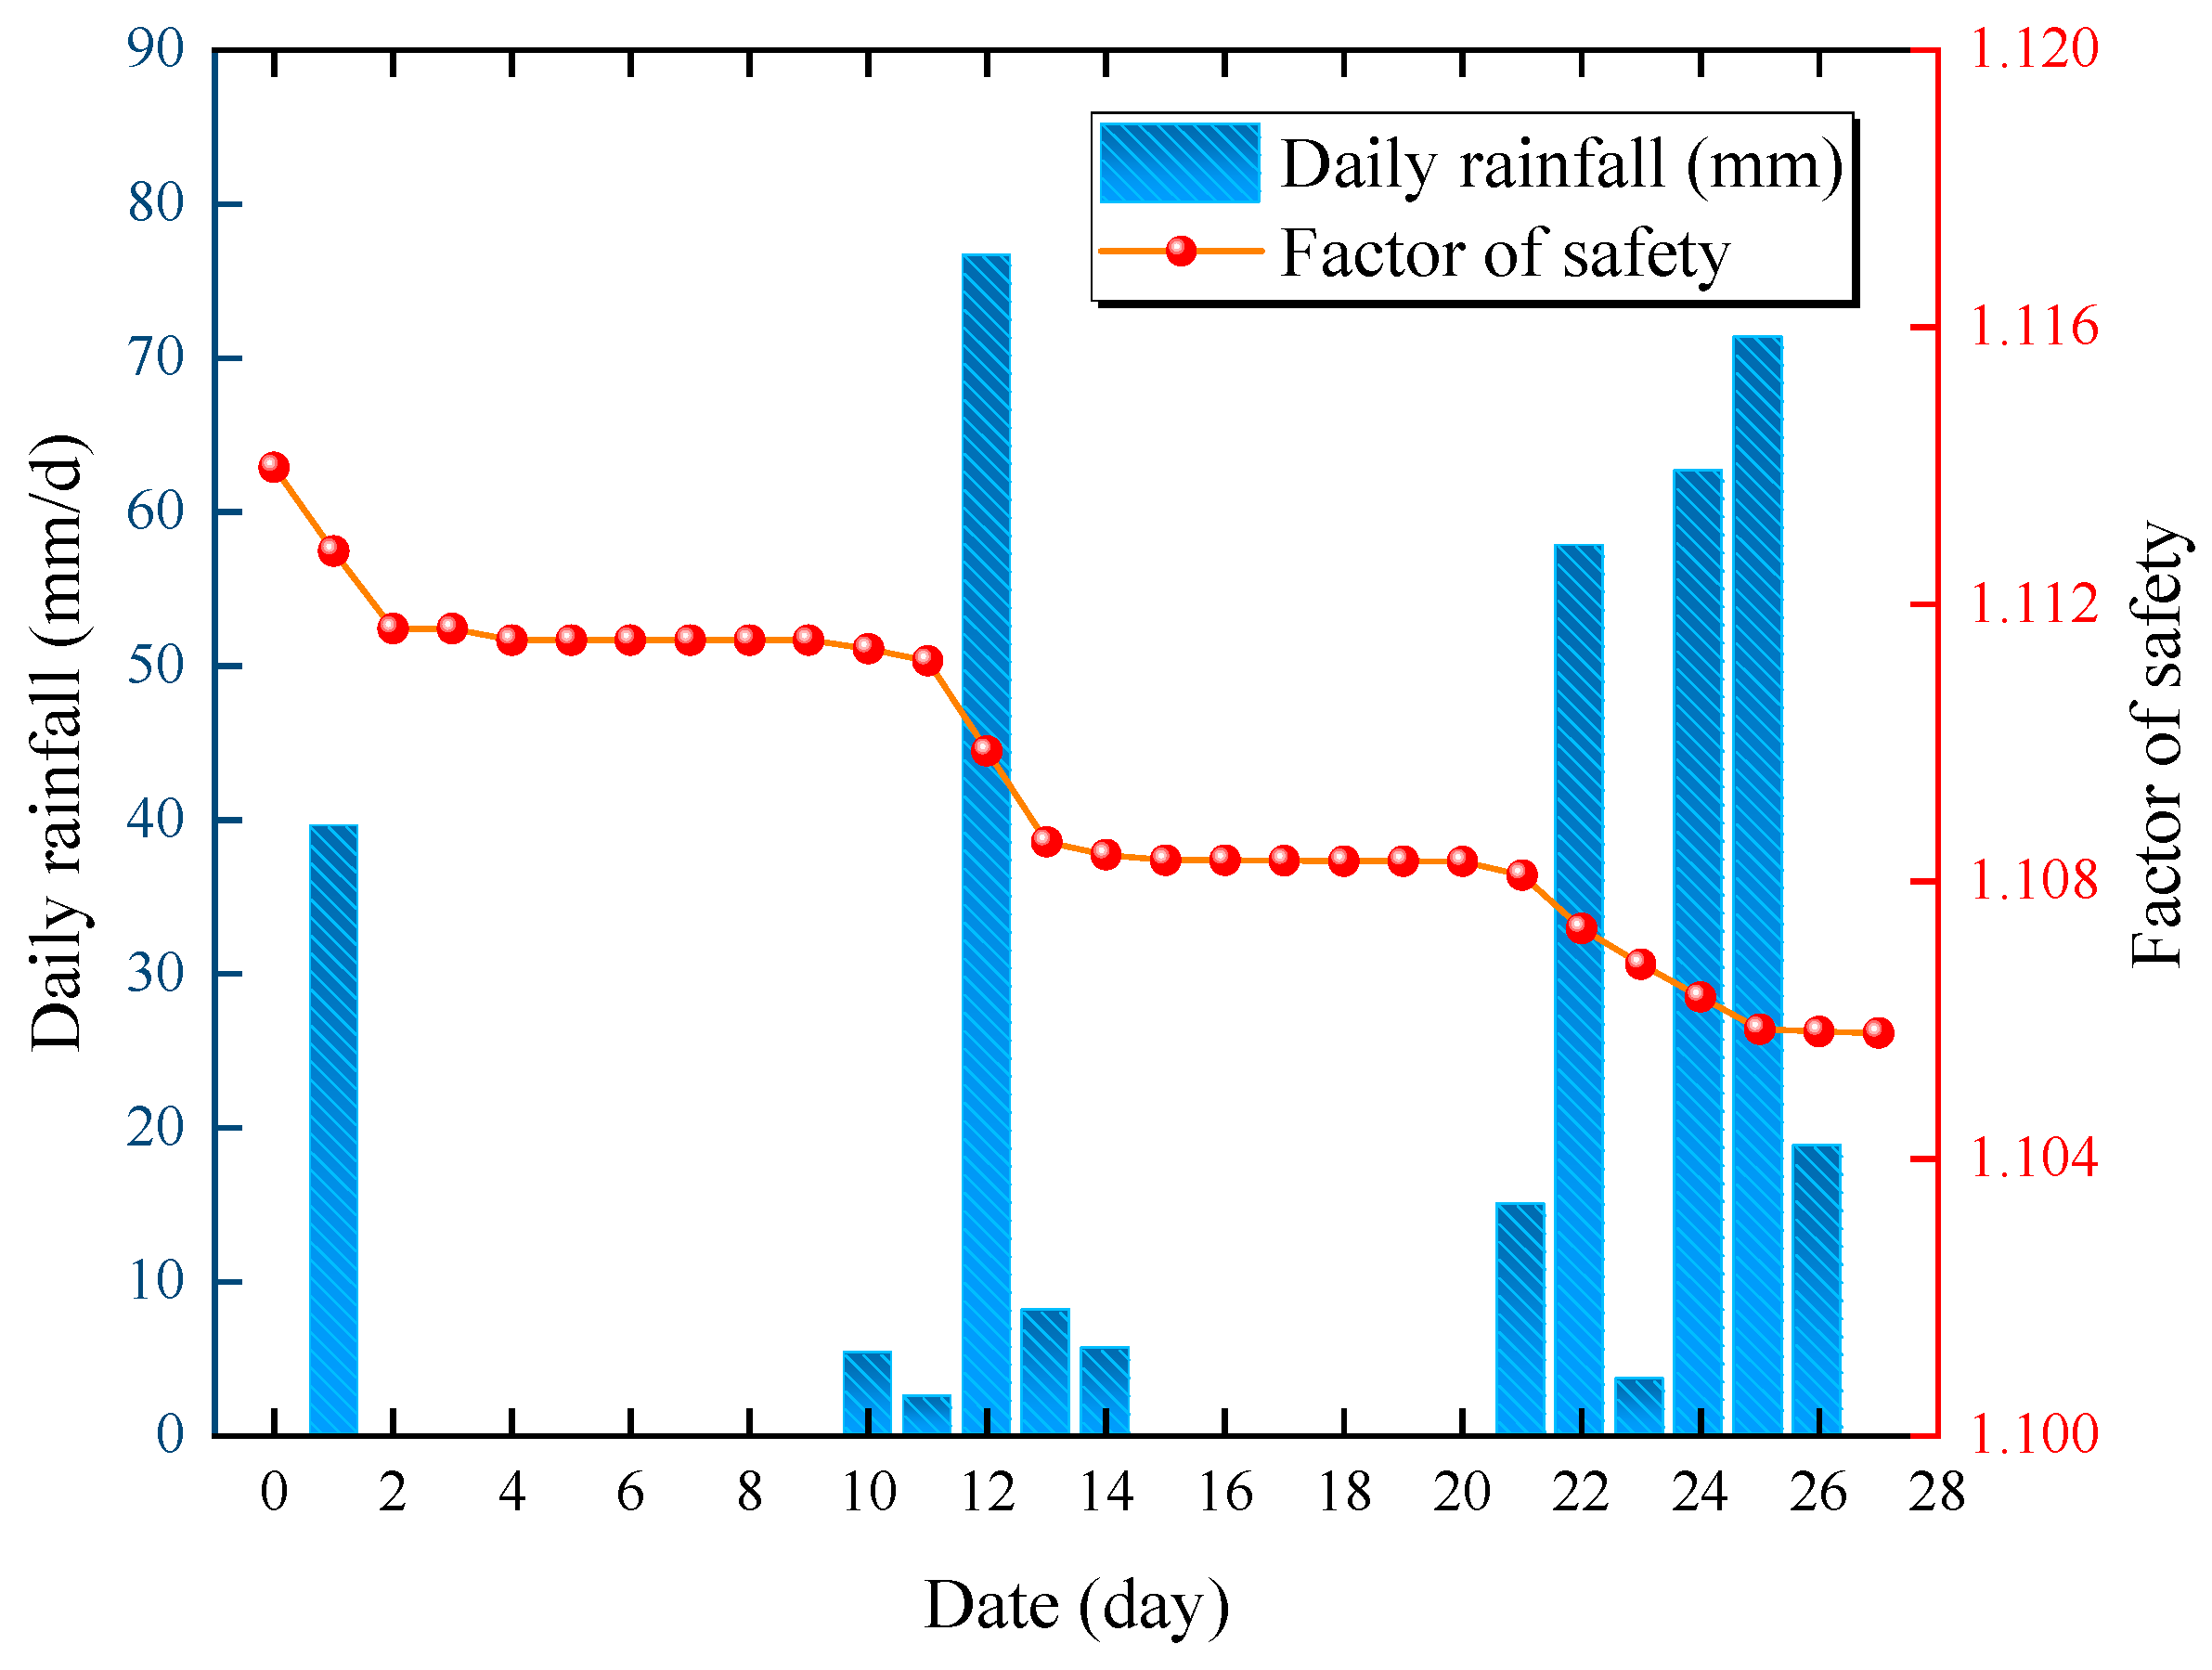
- The effect of heavy rainfall on the water distribution inside the highway slope is significant, while Fs decreases from 1.29 to 0.99, and the slope is in a state of instability. Due to the lack of rapid rainwater infiltration channels, the effect of heavy rainfall on the water distribution inside the natural slope is not significant, while Fs decreases from 1.114 to 1.106.
- (2)
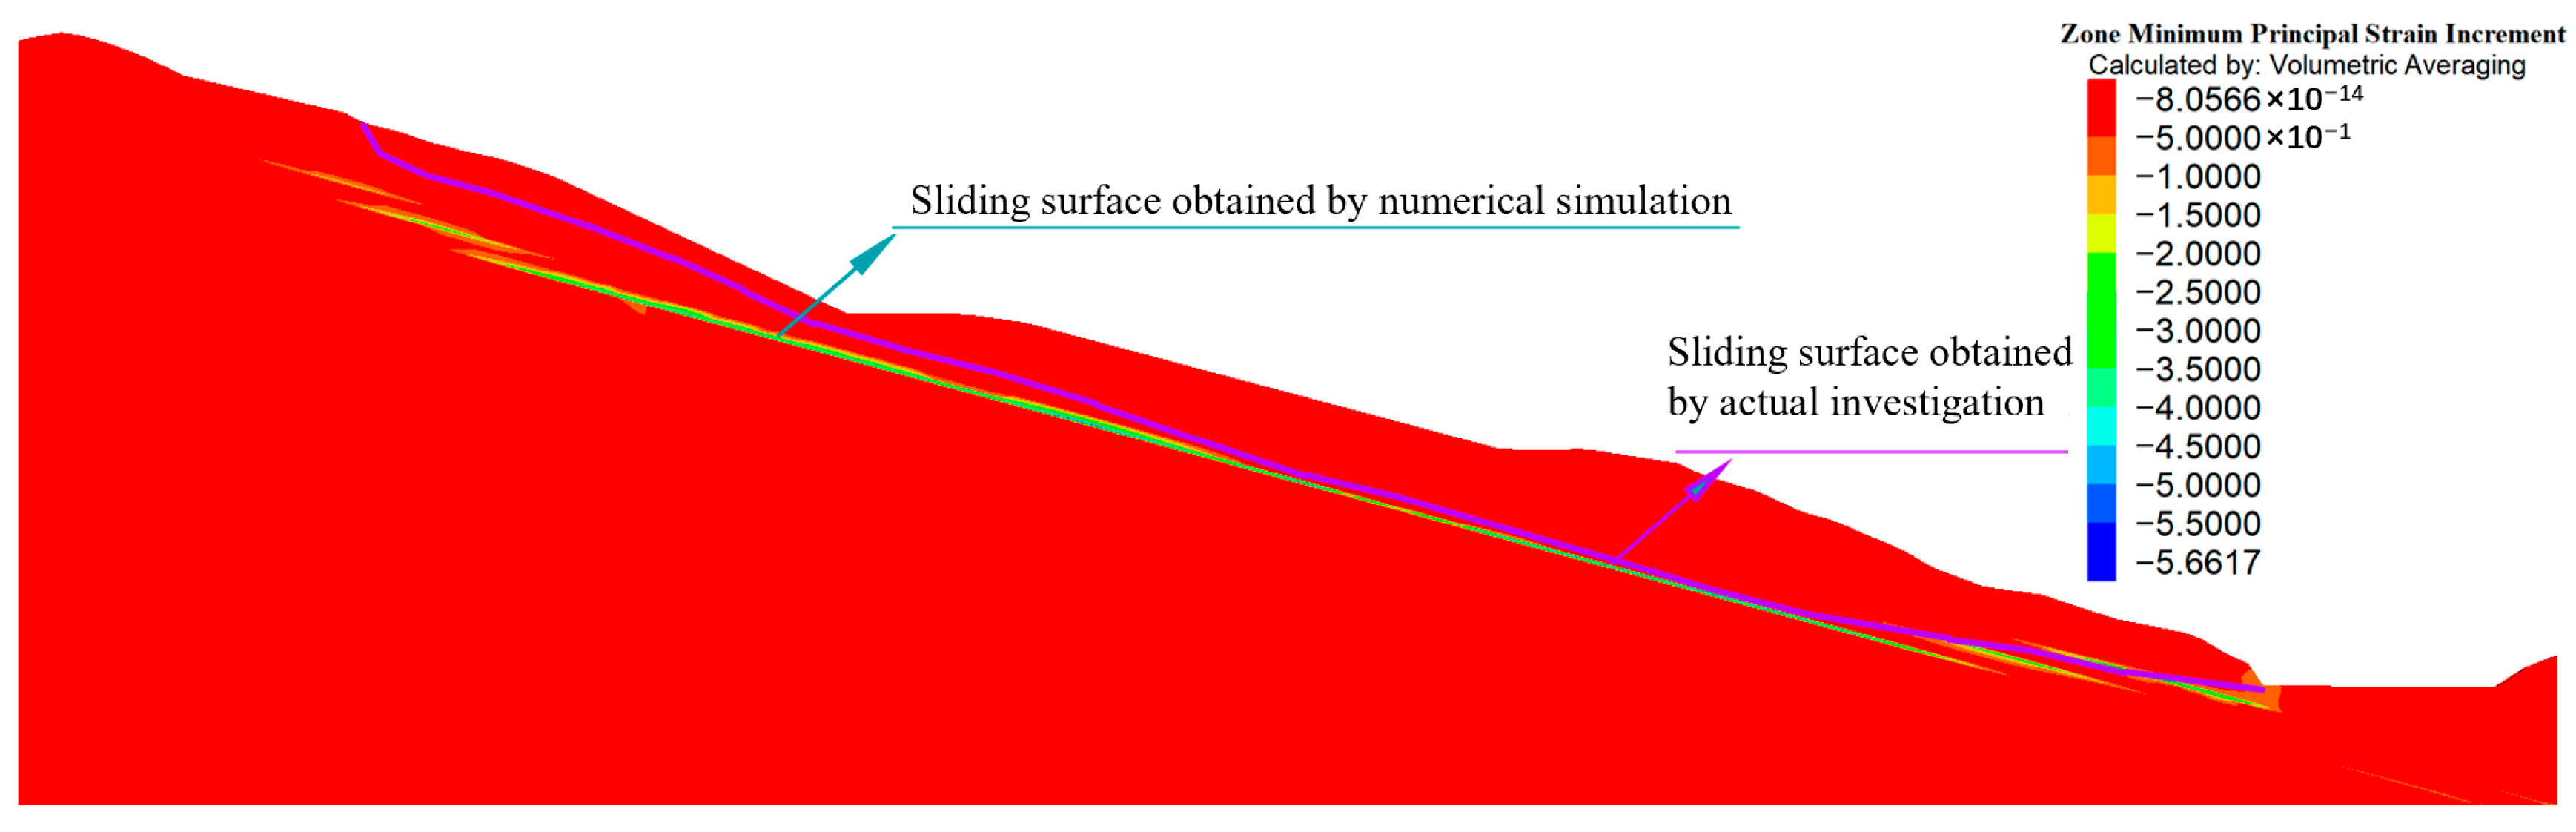
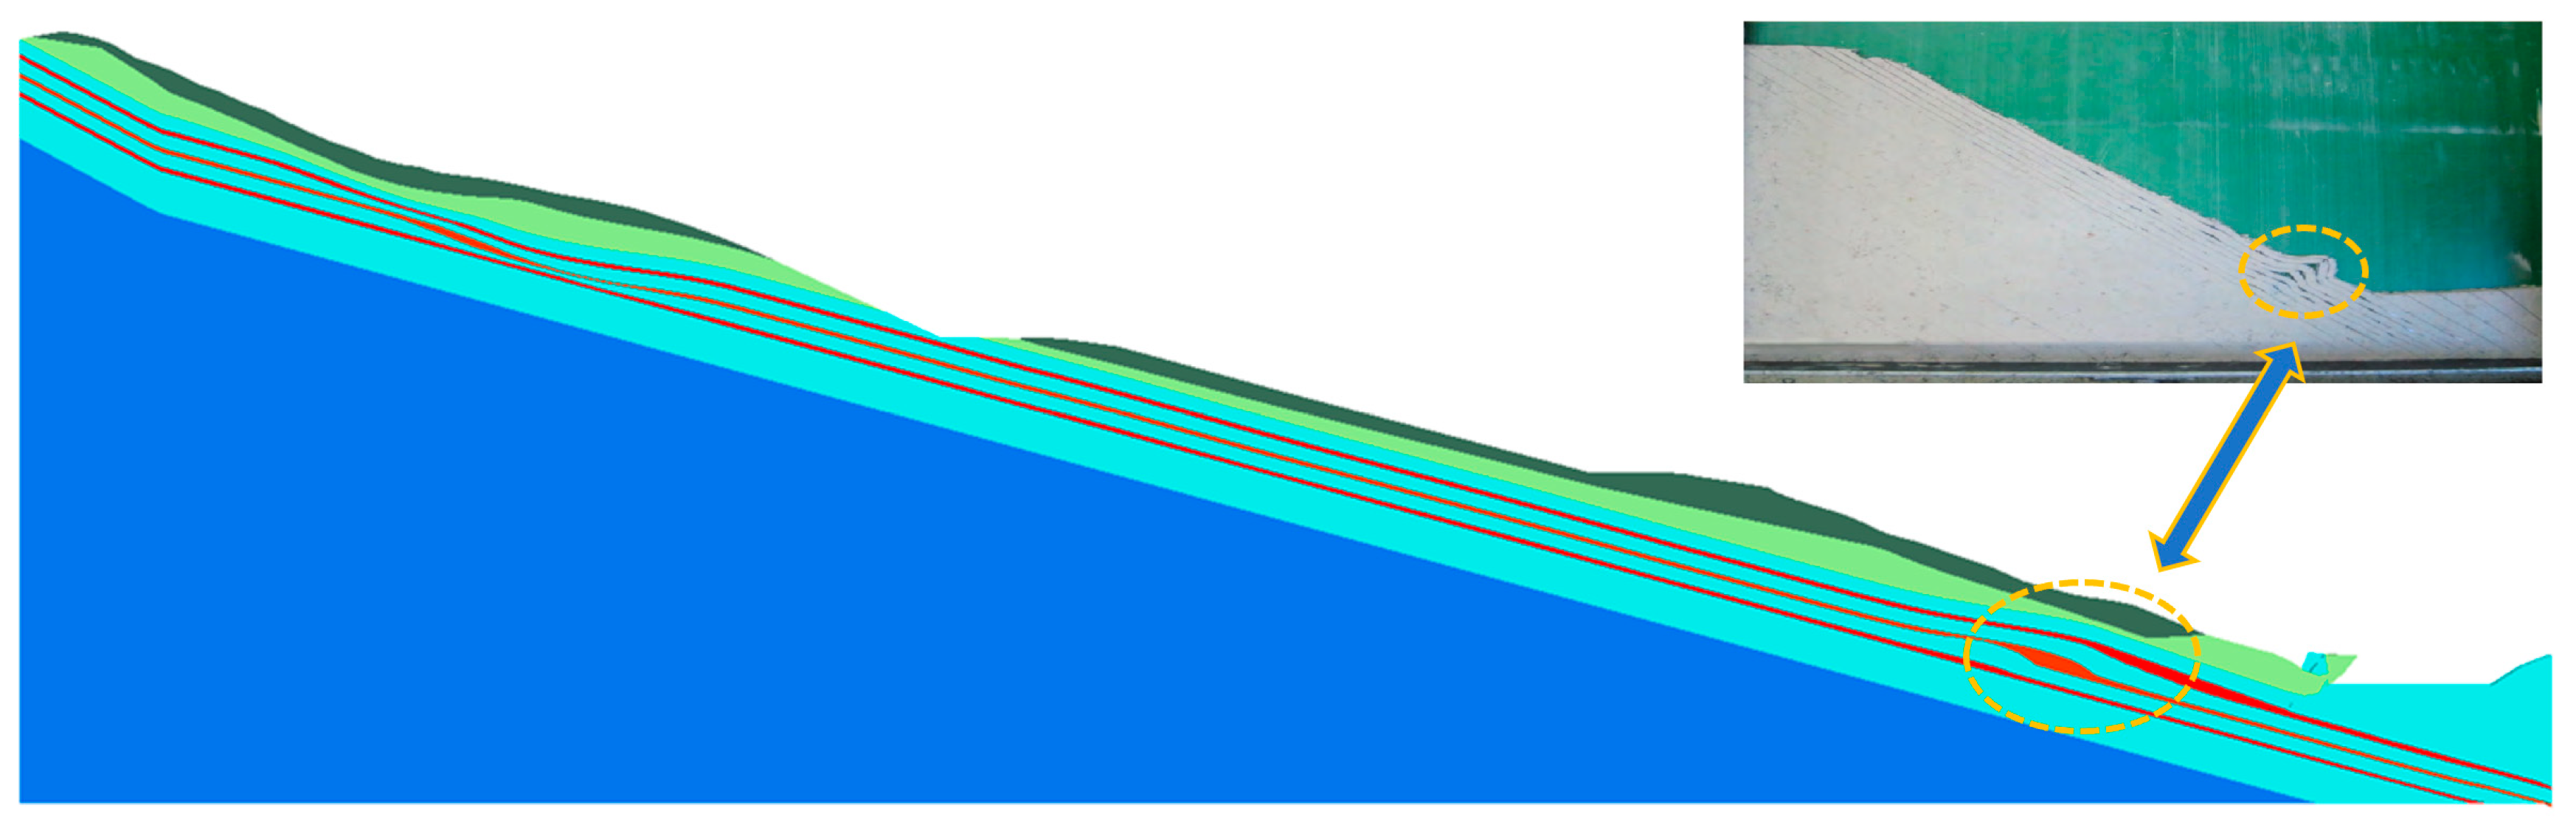
- The sliding surfaces obtained from numerical simulation and actual investigation are relatively close to each other, which reflects the reliability of the solution method based on the secondary development of FLAC3D considering the deterioration effect of rainwater on the geotechnical body and the buoyancy force.
- (3)
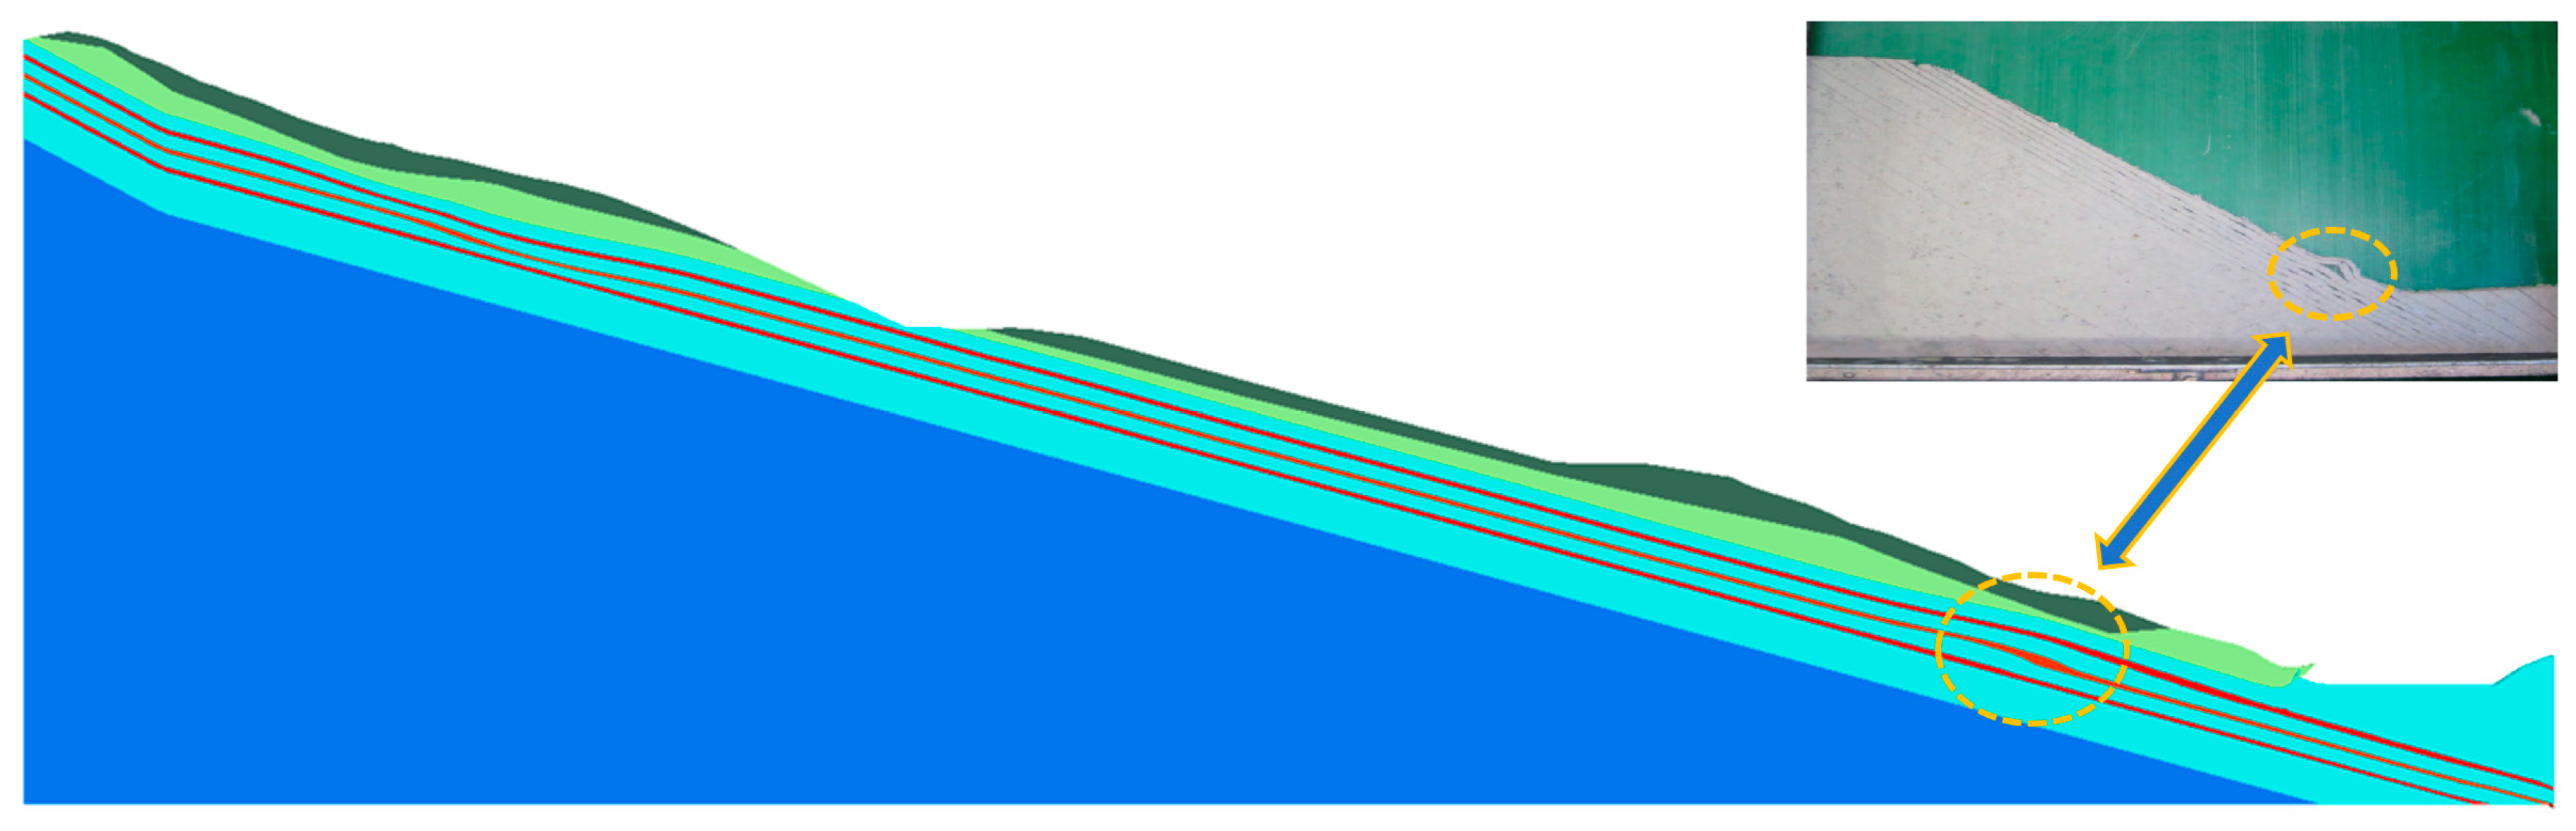
- Three phases of instability and failure of the rainfall-induced red-layered bedding slope are generalized: flexure and uplift state, deformation exacerbation state and shear failure state. The slope destabilization mechanism is a typical “sliding-bending-shearing” type.
Author Contributions
Funding
Institutional Review Board Statement
Informed Consent Statement
Data Availability Statement
Conflicts of Interest
References
- Chae, B.-G.; Park, H.-J.; Catani, F.; Simoni, A.; Berti, M. Landslide prediction, monitoring and early warning: A concise review of state-of-the-art. Geosci. J. 2017, 21, 1033–1070. [Google Scholar] [CrossRef]
- Tang, Y.; Xie, L.; Chen, Y.; Sun, S.; Zha, W.; Lin, H. Automatic recognition of slide mass and inversion analysis of landslide based on discrete element method. Comput. Geosci. 2023, 176, 105338. [Google Scholar] [CrossRef]
- Yang, H.-T.; Bai, B.; Lin, H. Seismic magnitude calculation based on rate- and state-dependent friction law. J. Cent. South Univ. 2023, 30, 2671–2685. [Google Scholar] [CrossRef]
- Jiang, X.; Zhu, H.; Yan, Z.; Zhang, F.; Ye, F.; Li, P.; Zhang, X.; Dai, Z.; Bai, Y.; Huang, B. A state-of-art review on development and progress of backfill grouting materials for shield tunneling. Dev. Built Environ. 2023, 16, 100250. [Google Scholar] [CrossRef]
- Zhu, X.; Xie, L.; Tang, Y.; Chen, Y.; Hu, H.; Lu, G.; Chen, C.; Lin, H. Progressive formation of retrogressive landslide and the lateral length of instability. Appl. Sci. 2023, 13, 799. [Google Scholar] [CrossRef]
- Kacimov, A.; Obnosov, Y.V.; Perret, J. Phreatic surface flow from a near-reservoir saturated tongue. J. Hydrol. 2004, 296, 271–281. [Google Scholar] [CrossRef]
- Qi, G.Q.; Huang, R.Q.; Su, B.Y.; Hu, Y.J.; Zhan, M.L. Numeric simulation on rainfall infiltration on rock slope. Chin. J. Rock Mech. Eng. 2003, 22, 625–629. [Google Scholar]
- Huat, B.B.; Ali, F.H.; Low, T. Water infiltration characteristics of unsaturated soil slope and its effect on suction and stability. Geotech. Geol. Eng. 2006, 24, 1293–1306. [Google Scholar] [CrossRef]
- Chen, H.K.; Zhou, X.H.; Tan, L. Experimental study on the influence for rainfall characteristics to pore water pressure in landslide. J. Chongqing Norm. Univ. 2017, 34, 49–54. [Google Scholar]
- Lian, J.F.; Luo, Q.; Jiang, L.W.; Liu, G.; Xie, T. Shallow stability analysis of soil slopes under seepage parallel to slope surface. Chin. J. Geotech. Eng. 2015, 37, 1440–1448. [Google Scholar]
- Conte, E.; Pugliese, L.; Troncone, A. A Simple Method for Predicting Rainfall-Induced Shallow Landslides. J. Geotech. Geoenvironmental Eng. 2022, 148, 04022079. [Google Scholar] [CrossRef]
- Liu, X.S.; Zhou, C.B. Study on discontinuous medium model for unsaturated hydro-mechanical coupling of fractured rock masses. Chin. J. Rock Mech. Eng. 2007, 26, 1485–1491. [Google Scholar]
- Robson, E.; Milledge, D.; Utili, S.; Dattola, G. A Computationally Efficient Method to Determine the Probability of Rainfall-Triggered Cut Slope Failure Accounting for Upslope Hydrological Conditions. Rock Mech. Rock Eng. 2023; ahead of print. [Google Scholar]
- Troncone, A.; Pugliese, L.; Parise, A.; Conte, E. A simple method to reduce mesh dependency in modelling landslides involving brittle soils. Géotechnique Lett. 2022, 12, 167–173. [Google Scholar] [CrossRef]
- Lin, H.Z.; Yu, Y.Z.; Li, G.X.; Peng, J.B. Influence of rainfall characteristics on soil slope failure. Chin. J. Rock Mech. Eng. 2009, 28, 198–204. [Google Scholar]
- Huang, R.Q.; Zhao, J.J.; Ju, N.P.; Deng, H.; Duan, H.P. Study on deformation mechanism and control method of bedding rock slope along tangtun expressway. Chin. J. Rock Mech. Eng. 2007, 26, 239–246. [Google Scholar]
- Liu, H.; Bodvarsson, G. Upscaling of constitutive relations in unsaturated heterogeneous tuff matrix. J. Hydrol. 2003, 276, 198–209. [Google Scholar] [CrossRef]
- Wu, Y.-S.; Liu, H.; Bodvarsson, G. A triple-continuum approach for modeling flow and transport processes in fractured rock. J. Contam. Hydrol. 2004, 73, 145–179. [Google Scholar] [CrossRef] [PubMed]
- Mualem, Y. A new model for predicting the hydraulic conductivity of unsaturated porous media. Water Resour. Res. 1976, 12, 513–522. [Google Scholar] [CrossRef]
- Fredlund, D.G.; Rahardjo, H. Soil Mechanics for Unsaturated Soils; John Wiley & Sons: Hoboken, NJ, USA, 1993. [Google Scholar]
- Huang, L.; Lin, H.; Cao, P.; Zhao, Q.; Pang, Y.; Yong, W. Investigation of the Degradation Mechanism of the Tensile Mechanical Properties of Sandstone under the Corrosion of Various pH Solutions. Materials 2023, 16, 6536. [Google Scholar] [CrossRef] [PubMed]
- Cheng, Y.M.; Lansivaara, T.; Wei, W. Two-dimensional slope stability analysis by limit equilibrium and strength reduction methods. Comput. Geotech. 2007, 34, 137–150. [Google Scholar] [CrossRef]
- Arvin, M.R.; Zakeri, A.; Bahmani Shoorijeh, M. Using finite element strength reduction method for stability analysis of geocell-reinforced slopes. Geotech. Geol. Eng. 2019, 37, 1453–1467. [Google Scholar] [CrossRef]
- Zhang, Y.; Xu, W.Y.; Zou, L.F.; Sun, H.K. Analysis of seepage stability of large-scale landslide under rainfall condition. Rock Soil Mech. 2013, 34, 833–841. [Google Scholar]
- He, C.M.; Deng, X.; Fu, H.Y.; Zeng, L. Influence of Seepage Force on Stability of Coarse Grained Soil High Embankment under Rainfall Condition. J. Highw. Transp. Res. Dev. 2017, 34, 9. [Google Scholar]
- Chen, C.Y.; Chen, H.W.; Wu, W.C. Numerical modeling of interactions of rainfall and earthquakes on slope stability analysis. Environ. Earth Sci. 2021, 80, 11. [Google Scholar] [CrossRef]
- Zhang, X.; Yan, C.H.; Guo, S.L.; Tan, J.Z.; Xu, C.H.; Yu, L.C.; Liu, Y. Derivation of stability formula of gentle slope affected by temporary confined water. J. Eng. Geol. 2021, 29, 1507–1514. [Google Scholar]
- Li, P.; Liu, X.; Jiang, X.; Zhang, X.; Wu, J.; Chen, P. Investigation of the first quasi-rectangular metro tunnel constructed by the 0-θ method. Front. Struct. Civ. Eng. 2023, 17, 1707–1722. [Google Scholar] [CrossRef]
- Chen, Q.M.; Fang, Q.; Luo, G.Z.; Wang, G.W. Failure conditions and mechanism of the gentle dip bedding slopes: A case study of the Zhuquedong Landslide. Chin. J. Geol. Hazard Control 2020, 31, 18–23+32. [Google Scholar]


| Symbol | Parameter Name | Units | Sub-Clay/Fill Soil | Strongly Weathered Silty Mudstone | Weakly Weathered Silty Mudstone | Soft Interlayer | Slightly Weathered Calcareous Sandstone |
|---|---|---|---|---|---|---|---|
| θs | Saturated water content | (–) | 0.3 | 0.3 | 0.2 | 0.3 | 0.1 |
| θr | Residual water content | (–) | 0.05 | 0.05 | 0.03 | 0.05 | 0.02 |
| ks | Saturated hydraulic conductivity | (m/s) | 1 × 10⁻⁶ | 1 × 10⁻⁶ | 5 × 10⁻⁴ | 1 × 10⁻⁶ | 1 × 10⁻⁵ |
| α | Van Genuchten fitting parameter | (kPa) | 100 | 1 | 0.5 | 10 | 0.2 |
| n | Van Genuchten fitting parameter | (–) | 1.5 | 1.5 | 2 | 1.5 | 5 |
| E | Young’s modulus | (MPa) | 10 | 1000 | 1500 | 20 | 1 × 10⁴ |
| v | Poisson’s ratio | (–) | 0.35 | 0.3 | 0.25 | 0.35 | 0.15 |
| Effective cohesion | (kPa) | 10 | 25 | 27 | 6 | 390 | |
| Effective friction angle | (°) | 14 | 19 | 24 | 12 | 40 | |
| Suction internal friction angle | (°) | 14 | 14 | 14 | 14 | 14 | |
| ρ | Density | (kg/m3) | 1900 | 2430 | 2500 | 1920 | 2600 |
Disclaimer/Publisher’s Note: The statements, opinions and data contained in all publications are solely those of the individual author(s) and contributor(s) and not of MDPI and/or the editor(s). MDPI and/or the editor(s) disclaim responsibility for any injury to people or property resulting from any ideas, methods, instructions or products referred to in the content. |
© 2024 by the authors. Licensee MDPI, Basel, Switzerland. This article is an open access article distributed under the terms and conditions of the Creative Commons Attribution (CC BY) license (https://creativecommons.org/licenses/by/4.0/).
Share and Cite
Xu, F.; Hu, H.; Lin, H.; Xie, L. Bedding Slope Destabilization under Rainfall: A Case Study of Zhuquedong Slope in Hunan Province, China. Appl. Sci. 2024, 14, 1394. https://doi.org/10.3390/app14041394
Xu F, Hu H, Lin H, Xie L. Bedding Slope Destabilization under Rainfall: A Case Study of Zhuquedong Slope in Hunan Province, China. Applied Sciences. 2024; 14(4):1394. https://doi.org/10.3390/app14041394
Chicago/Turabian StyleXu, Fan, Huihua Hu, Hang Lin, and Linglin Xie. 2024. "Bedding Slope Destabilization under Rainfall: A Case Study of Zhuquedong Slope in Hunan Province, China" Applied Sciences 14, no. 4: 1394. https://doi.org/10.3390/app14041394
APA StyleXu, F., Hu, H., Lin, H., & Xie, L. (2024). Bedding Slope Destabilization under Rainfall: A Case Study of Zhuquedong Slope in Hunan Province, China. Applied Sciences, 14(4), 1394. https://doi.org/10.3390/app14041394