Article

Effect of Pouring Time on the Integrity of Pulverized Fuel Ash Concrete

Key Laboratory for Resilient Infrastructures of Coastal Cities (MOE), College of Civil and Transportation Engineering, Shenzhen University, Shenzhen 518060, China
*
Author to whom correspondence should be addressed.
Appl. Sci. 2024, 14(4), 1332; https://doi.org/10.3390/app14041332
Submission received: 8 January 2024 / Revised: 30 January 2024 / Accepted: 2 February 2024 / Published: 6 February 2024

Abstract

:
The effects of pouring time intervals on the integrity of pulverized fuel ash (PFA) concrete were evaluated by measuring ultrasonic pulse velocity and compressive strength. Concrete was poured progressively at different time intervals (30 min, 45 min, and 60 min) under similar conditions after the first batch of concrete was vibrated. The effects of the water–cement ratio (w/c) on ultrasonic pulse velocity were also compared and analyzed. Both compressive strength and ultrasonic pulse velocity decreased as the pouring time interval increased. When the water–cement ratio was 0.55, the pouring time interval had little effect on compressive strength, but when the w/c was reduced to 0.45, improvements in the compressive strength of concrete with different pouring time intervals were as high as 10 MPa. Under the condition of the same w/c and the same pouring time interval, improvements in the compressive strength of the interface were as high as 15 MPa, and the prolongation of the aging period could reduce the difference in strength to 8 MPa. The formula F c = 0.63 e 0.95 V c was used to infer the compressive strength of fly ash concrete at different ages by ultrasonic pulse velocity.

1. Introduction

Pulverized fuel ash (PFA) is an industrial by-product collected from coal-fired power plants, and is used as a supplementary cementitious material (SCM) in the production of concrete [1]. Pulverized fuel ash exhibits pozzolanic activity, leading to a secondary hydration reaction with calcium hydroxide, a hydration product of cement, resulting in the formation of C-A-S-H gel [2]. Additionally, the small particle size of PFA enables it to serve as nucleation sites for the formation of C-S-H gel [3]. The filling effect of PFA particles, along with their pozzolanic activity and promotion of cement hydration, contribute to a denser concrete matrix. As a result, replacing a portion of cement with PFA significantly enhances the long-term strength of concrete, refines its pore structure, fills voids to improve its impermeability [4,5], reduces water loss during drying, and noticeably decreases drying shrinkage in PFA concrete [3,6]. In freshly mixed PFA concrete, fine particles of PFA can effectively envelop and lubricate aggregate particles, resulting in a significant improvement in both setting time and workability [7,8]. The full utilization of fly ash helps reduce cement consumption, save energy, reduce carbon dioxide emissions, and promote the development of green buildings [9,10].
For large concrete structures, such as bridges and tunnel structures, delayed placement can result in incomplete concrete structures when all concrete cannot be placed on the entire structural support or the process is interrupted part way through [11,12]. A cold joint is an undesirable discontinuity between layers of concrete that occurs when one layer of concrete hardens before the rest of the concrete is poured [13]. It has been reported that incomplete concrete structures such as cold joints not only cause a decrease in shear strength, but also accelerate the penetration rate of chloride ions and the rate of carbonization reactions, thereby reducing the durability of concrete [12,14,15]. In addition, in concrete structures with high seismic or impermeability requirements, incomplete structures can lead to brittle joints and permeable belts in concrete, which greatly increase maintenance costs in the long run [16,17].
Ultrasonic pulse velocity (UPV) technology is one of the efficient methods for evaluating concrete performance. As the ultrasonic pulse velocity technique is a non-destructive test method, it is often used during a project to predict the development of the compressive strength of the concrete. This estimation method is based on the empirical relationship between the compressive strength and ultrasonic pulse velocity of concrete. It is well known that many factors, such as mix proportion, aggregate type, water content, and the use of mineral admixtures, all affect the strength development of concrete, and these factors also affect ultrasonic pulse velocity [18]. Studies have shown that the content of aggregates affects ultrasonic pulse velocity. When the strength is the same, more aggregate content in the concrete may cause the ultrasonic pulse velocity to decrease [19]. Another factor affecting concrete strength is the water–cement ratio. It is well known that the higher the water–cement ratio, the lower the concrete strength [20]. However, studies have found that higher water content increases ultrasonic pulse velocity [20]. Therefore, the contradictory nature of this interaction leads to inaccurate results in the analysis of ultrasonic pulse velocity results of different types of concrete under different conditions. Hence, the evaluation method needs to be calibrated for different types of concrete.
In this study, PFA was used to replace a portion of the cement to improve concrete’s setting time and long-term strength development. In addition, a series of tests were conducted to investigate the effect of the pouring time interval on the integrity of the concrete, particularly the bond between the two concrete casting layers. A series of tests was conducted to investigate the quality of concrete. The compressive test was used to measure the compressive strength of concrete specimens, while the ultrasonic pulse velocity test was used to evaluate the compactness and integrity of the concrete. Due to the ambivalence of the effect of the water–cement ratio on ultrasonic pulse velocity and compressive strength, the relationship with ultrasonic pulse velocity needs to be corrected when predicting the compressive strength of different types of concrete for different conditions; so, in this study a new correlation has been established between the compressive strength and ultrasonic pulse velocity of concrete with PFA. The purpose of this study was to investigate the impact of pouring time intervals on concrete integrity while providing a useful reference for the construction industry and assessing the potential for using PFA in large-scale concrete structures.

2. Materials and Methods

The amount of PFA replacement in concrete varies widely depending on the properties, specification limits, and geographic location of the fly ash. Higher fly ash additions (from 30% to 50%) have been used in large concrete structures such as dams to control temperature increase and structural cracking [1]. As a cementitious material, PFA usually replaces 10% to 25% by mass of cement in concrete. In order to obtain guidance regarding the effect of PFA on concrete, 10% mass ratios of PFA were used to replace cement in this experiment. The mix proportions of PFA concrete are shown in Table 1.
The concrete was cast and cured according to the BS EN 12390-2 [21] to ensure the standard and quality of the specimens. In order to study the strength of different points in the concrete, the dimensions of the sample were designed to be 200 mm long, 100 mm wide, and 400 mm high. At the same time, two water–cement ratios (0.45 and 0.55) were used to explore the relationship between water content and the strength of PFA concrete. There were 3 time intervals for pouring two batches of concrete (30, 45, and 60 min). As the Pundits test is non-destructive, there was no need to prepare samples of different curing ages, and 6 groups of testing samples with three specimen blocks in each group were prepared.
Pulse velocity is related to strength and modulus of elasticity, and it can assess the quality of concrete by measuring the velocity of ultrasonic pulses travelling in a solid material. Ultrasound pulse testing was performed according to BS 1881-203:1986 [22] to generate data that could be used for comparison with results reported in the literature. The construction industry has been using this method to non-destructively check the quality of concrete structures. In this experiment, direct transmission was chosen because both sides of the concrete could be easily accessed, and it is the most accurate method. Direct transmission is performed by placing a transducer on one side of the concrete and a second transducer on the other side in the same position. The time it takes an ultrasonic pulse to reach the second transducer can be used to calculate the pulse velocity by dividing it by the thickness of the concrete. The test schematic is shown in Figure 1a. In this experiment, the thickness of the specimen was 100 mm. Figure 1b shows a schematic representation of five sampling locations for concrete samples. Among them, position 3 is at the junction of the first and second batch of concrete.
The compressive test is one of the effective destructive test methods used to indicate the compressive strength of hardened concrete specimens. The samples used for compressive testing in this study were taken from concrete slabs of 28 and 56 days curing ages at horizontal distances of 70 mm and 140 mm from the Pundits test point. Cylindrical specimens had diameters of 50 mm and heights of 100 mm. One day before the compressive test, plaster was applied to the testing surface to ensure that the testing surface was level. In this study, two compression tests (core and cube compression) were carried out. BS EN 12390-3 [23] was used in this study in order to compare data measured under the same standard in other studies.

3. Results

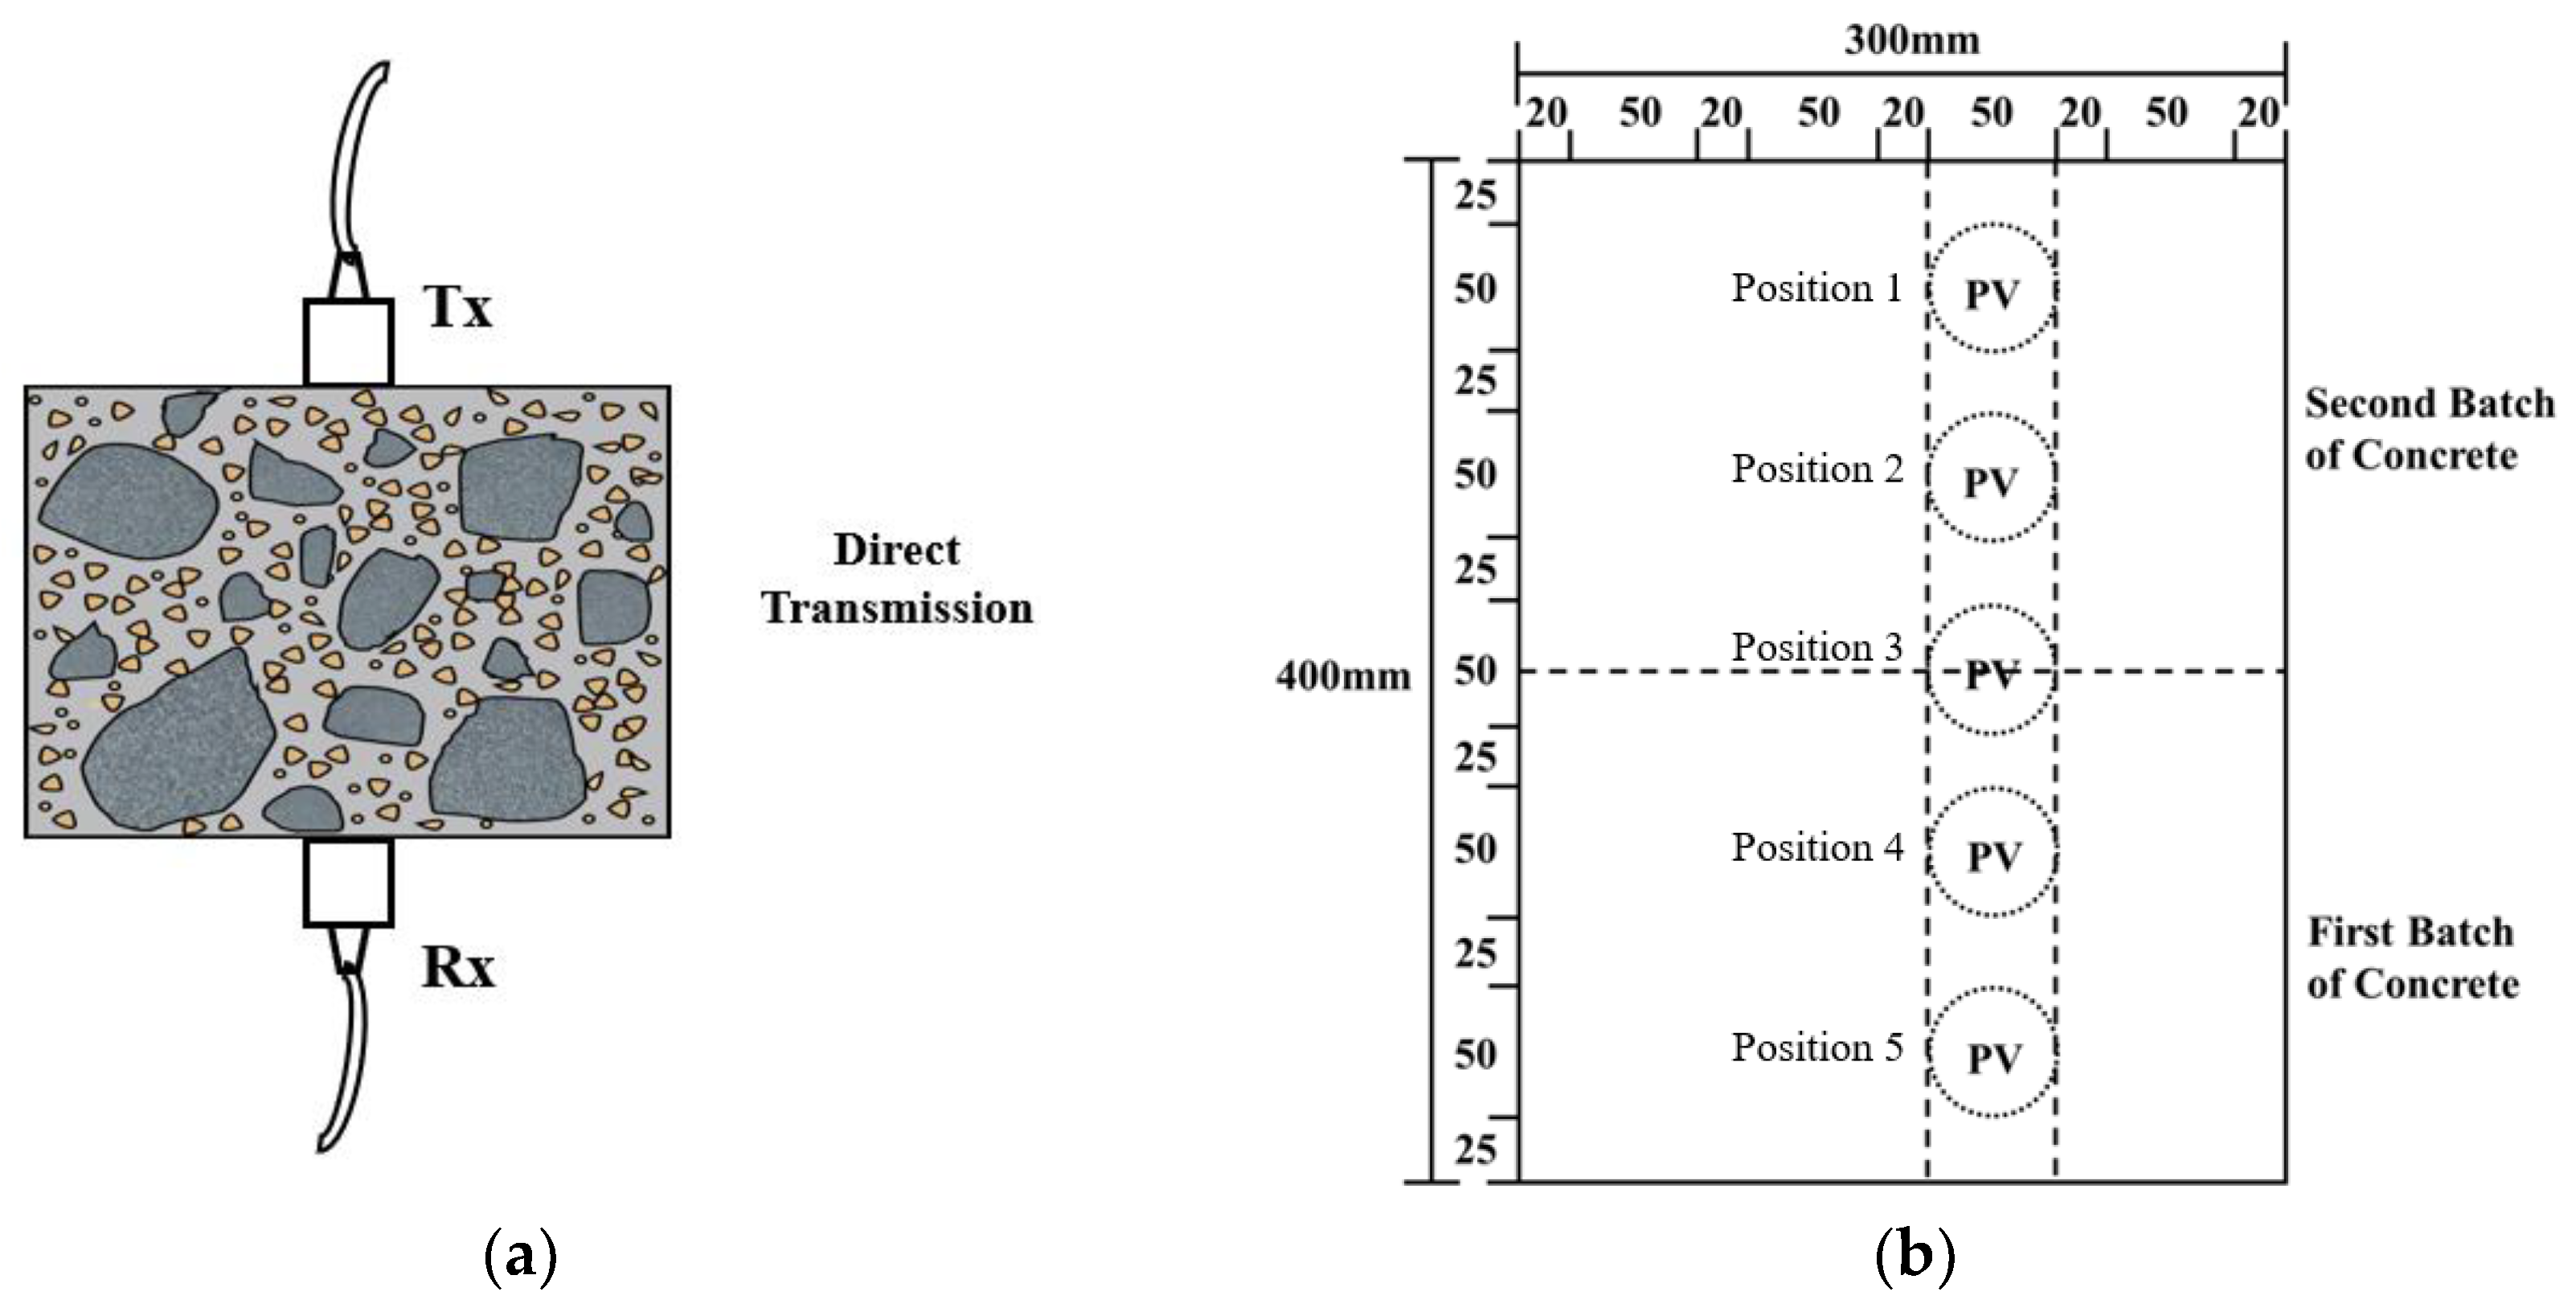
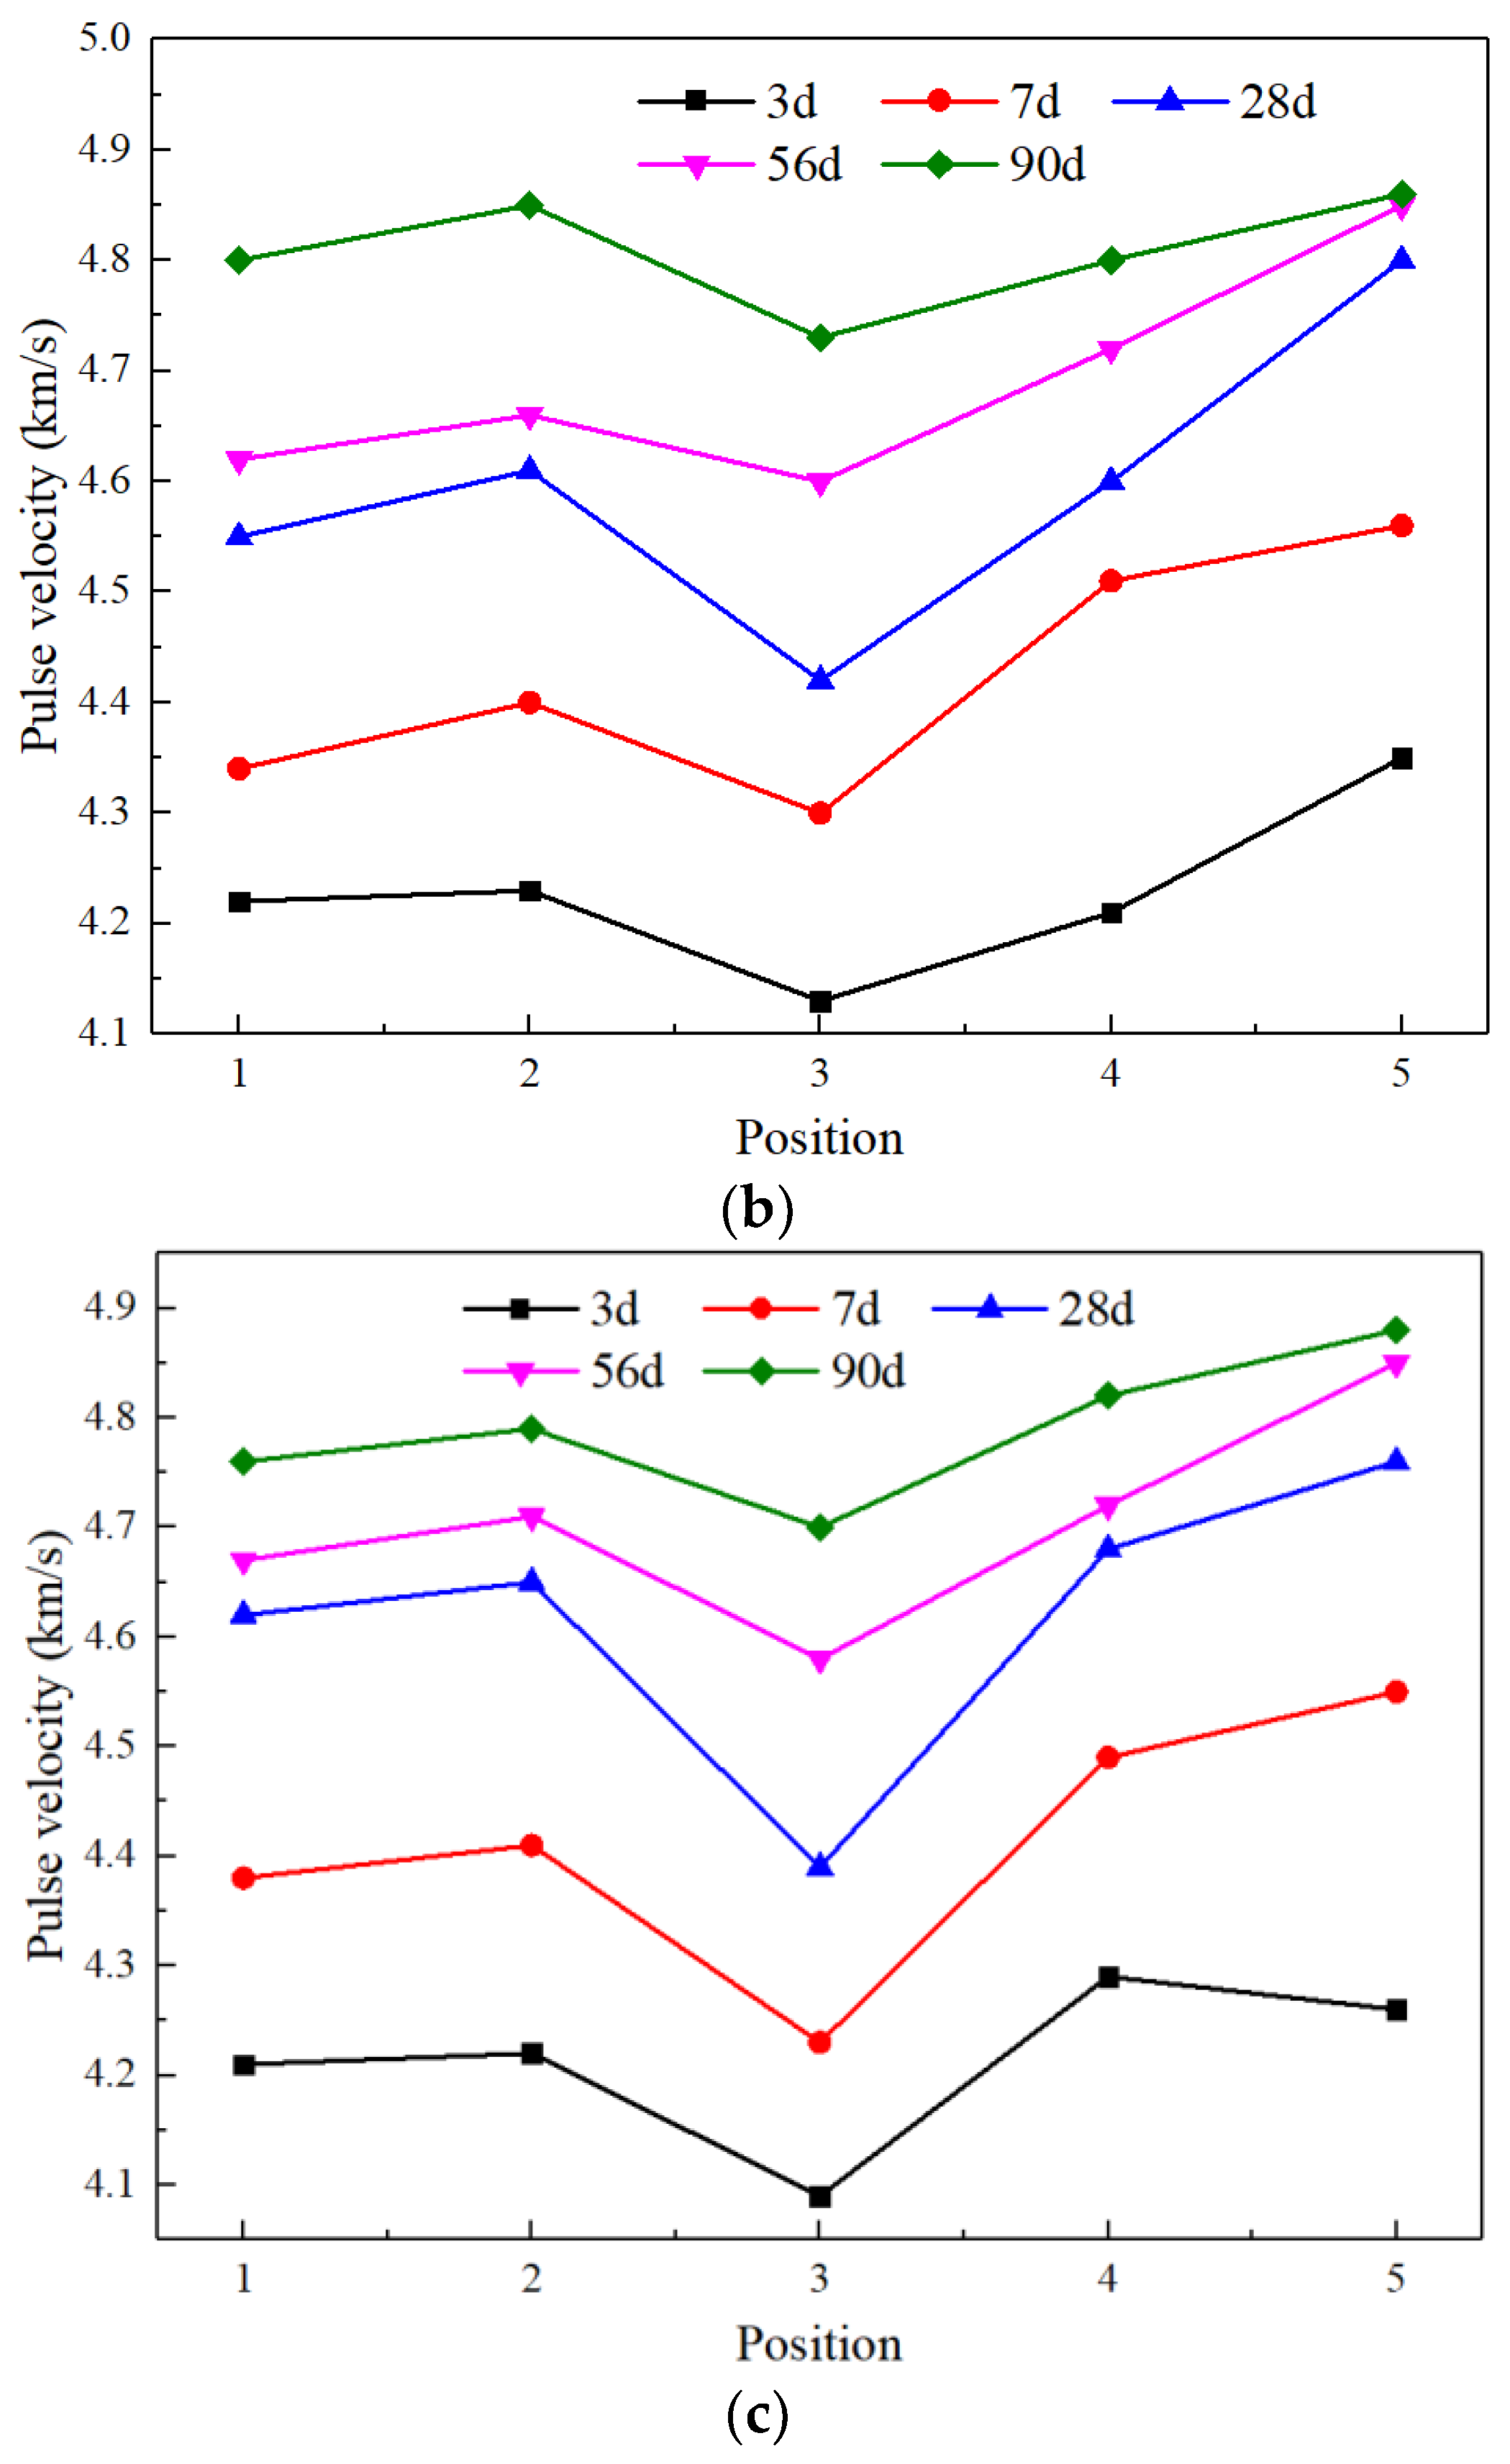
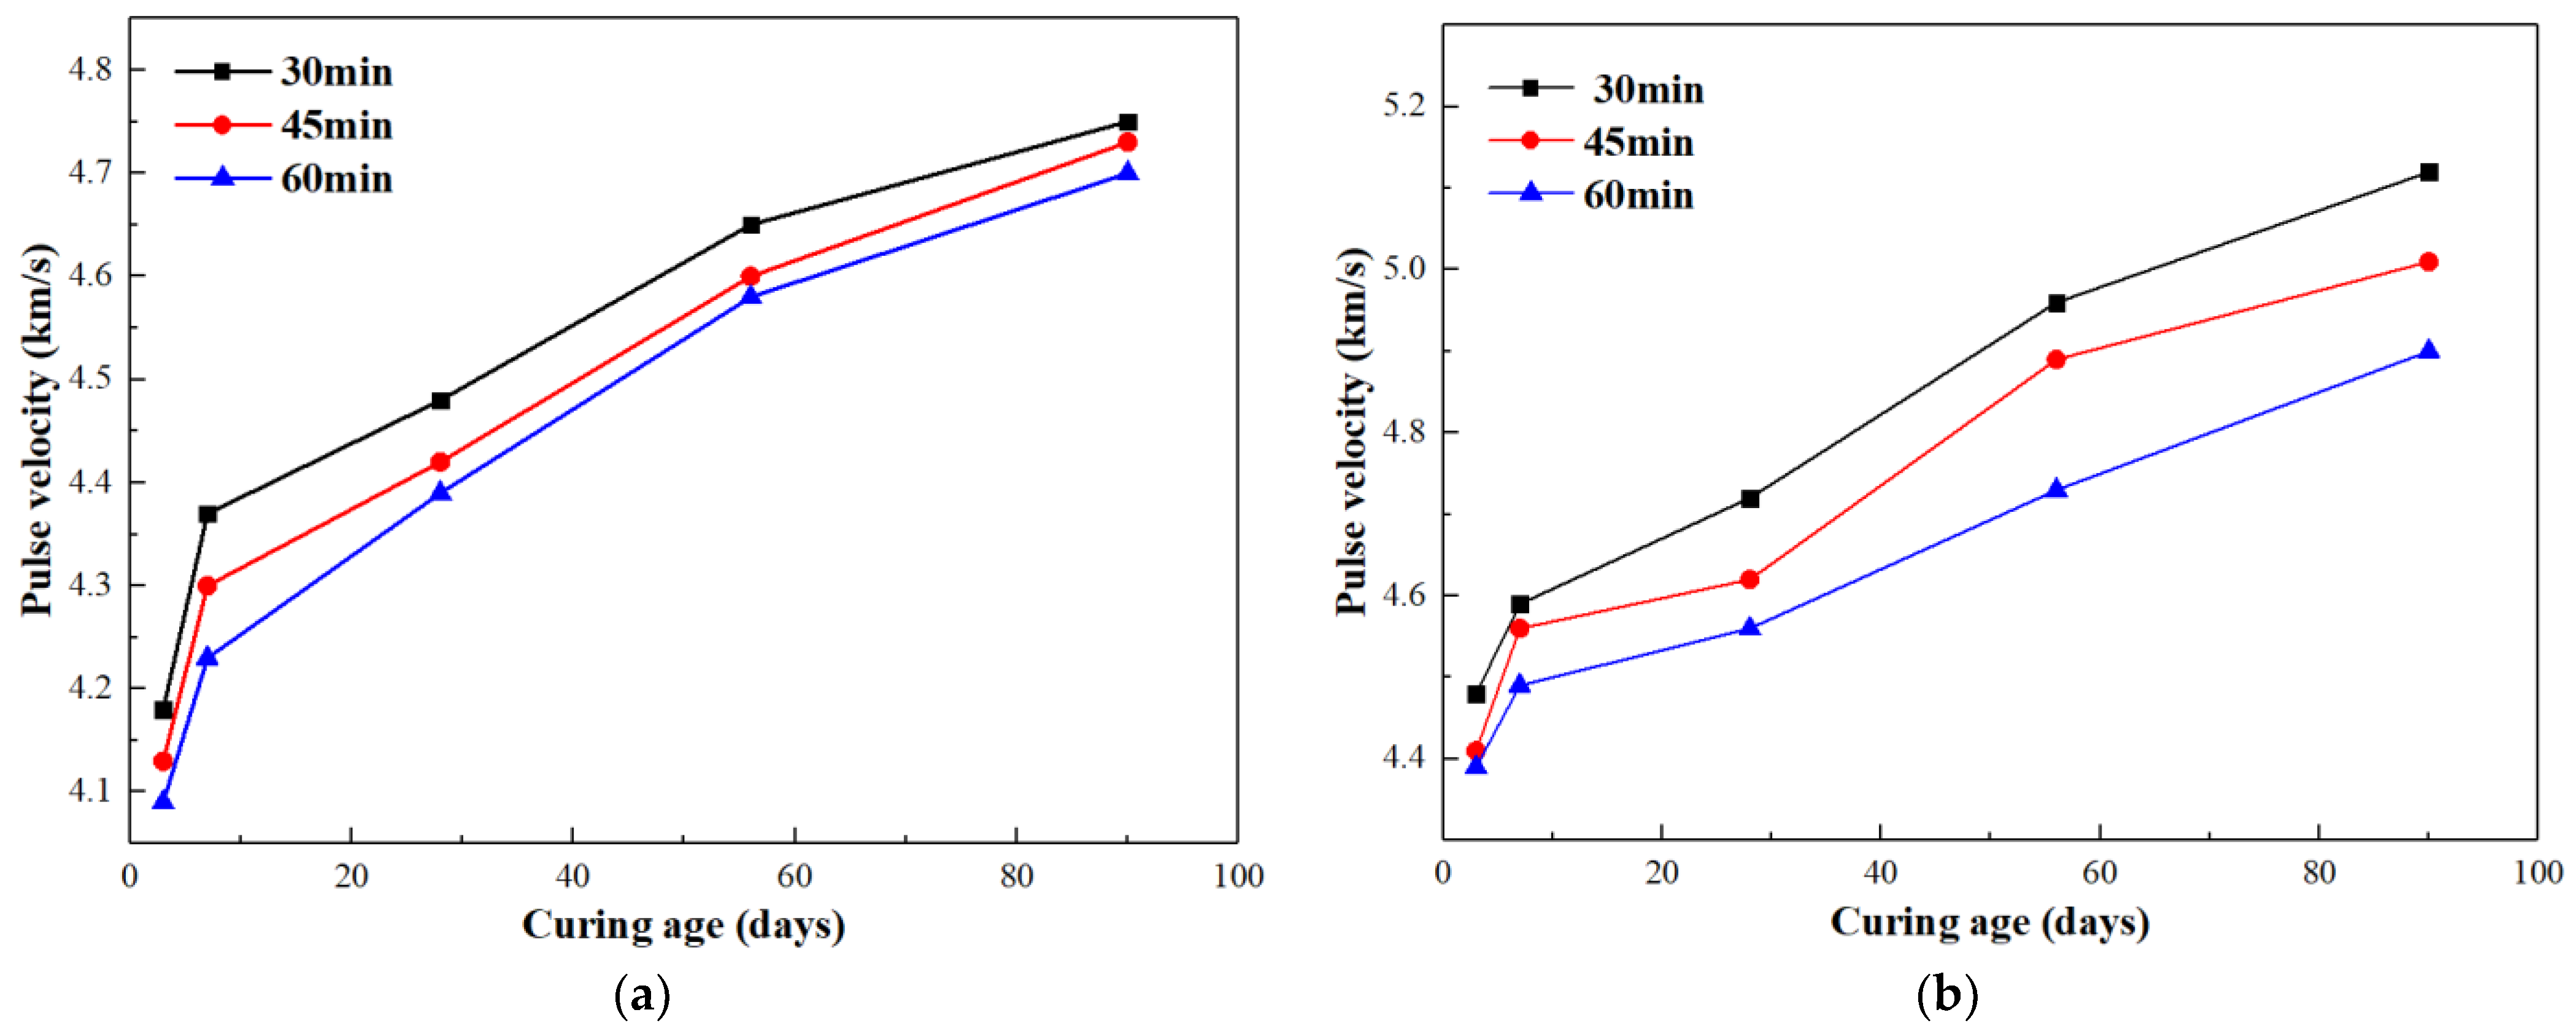
3.1. The Pundits Test

The Pundits test method is suitable for assessing the uniformity and relative quality of concrete, as it can indicate the presence of voids, cracks, and changes in the properties of concrete. In this experiment, the bond strength of slab samples was tested to identify if there was an effect of the pouring time on the integrity of PFA concrete. Concrete slabs with a water–cement ratio of 0.55 were selected as the main analytical object.
Figure 2 shows the pulse velocity comparison of the five selected positions in the concrete when the water–cement ratio was 0.55. It can be seen in Figure 2a–c that as the pouring time intervals progressed from 30 to 45 min, and then to 60 min, the sampling position decreased, and the pulse velocity of the PFA concrete sample showed a wave shape at different curing ages; the pulse velocity of position 3 was always the lowest among the five selected positions. This shows that the time interval between pouring the two layers of concrete had an adverse effect on the integrity of the concrete. The main reason for this was that position 3 was at the junction of the two layers of concrete, where there were more internal pores, which reduced the density of the concrete and led to a decrease in pulse velocity. More seriously, air and water could enter the pores between layers, which would accelerate the cracking of the concrete and the corrosion of the internal steel structure. In addition, another of the five positions with a lower pulse velocity was position 1. This was because position 1 was at the top of the concrete slab. After the vibration, the aggregate at the top of the concrete partially sank, resulting in more slurry at the top; therefore, the density of the concrete at the top was reduced, which made the pulse velocity slower. In addition, while pulse velocities at positions 2 and 4 were similar, it is worth noting that the concrete sample at position 5 had the fastest pulse velocity in most results. This may be due to the fact that after the vibration, the bottom of the concrete slab was denser and had fewer internal pores.
Figure 3 shows the variation in pulse velocity at position 3 with different curing times and pouring time intervals. Although the pulse velocity at position 3 increased with the increase in curing age under different water–cement ratio conditions, the length of the two-layer concrete pouring time had a significant impact on the integrity of the interface when the curing age was the same. It can be observed in Figure 3a,b that the pulse velocity at position 3 decreased with the increase in the pouring time interval of the PFA concrete under different water–cement ratio conditions. This result is consistent with the related research of Rathi et al. [24]. This phenomenon proves that, in consideration of the cost and difficulty of on-site construction, the pouring time interval of two-layer concrete should be shortened as much as possible to improve the integrity of the concrete. It is worth considering that the fresh concrete was stored in a large mixer before transfer. Also, the concrete did not have a wet cloth cover to simulate the actual cast-in conditions of delayed placement, such as a large placement area or lack of workers. Therefore, when the pouring time interval was long, the moisture in the fresh concrete evaporated because there was no protection. This resulted in a slight decrease in the w/c of the concrete and a slight increase in its strength, which compensated for a portion of the strength loss caused by the long pouring time interval [25]. In this experiment, this uncertainty was not taken into account.
Comparing Figure 3a,b, it can be seen that when the curing age was the same, the pulse velocity of the sample with a 0.45 w/c was always higher than that of the sample with a 0.55 w/c. This was due to the higher density and strength of concrete samples with a lower water–cement ratio. This result differs from the findings of Ohdaira et al. [20].

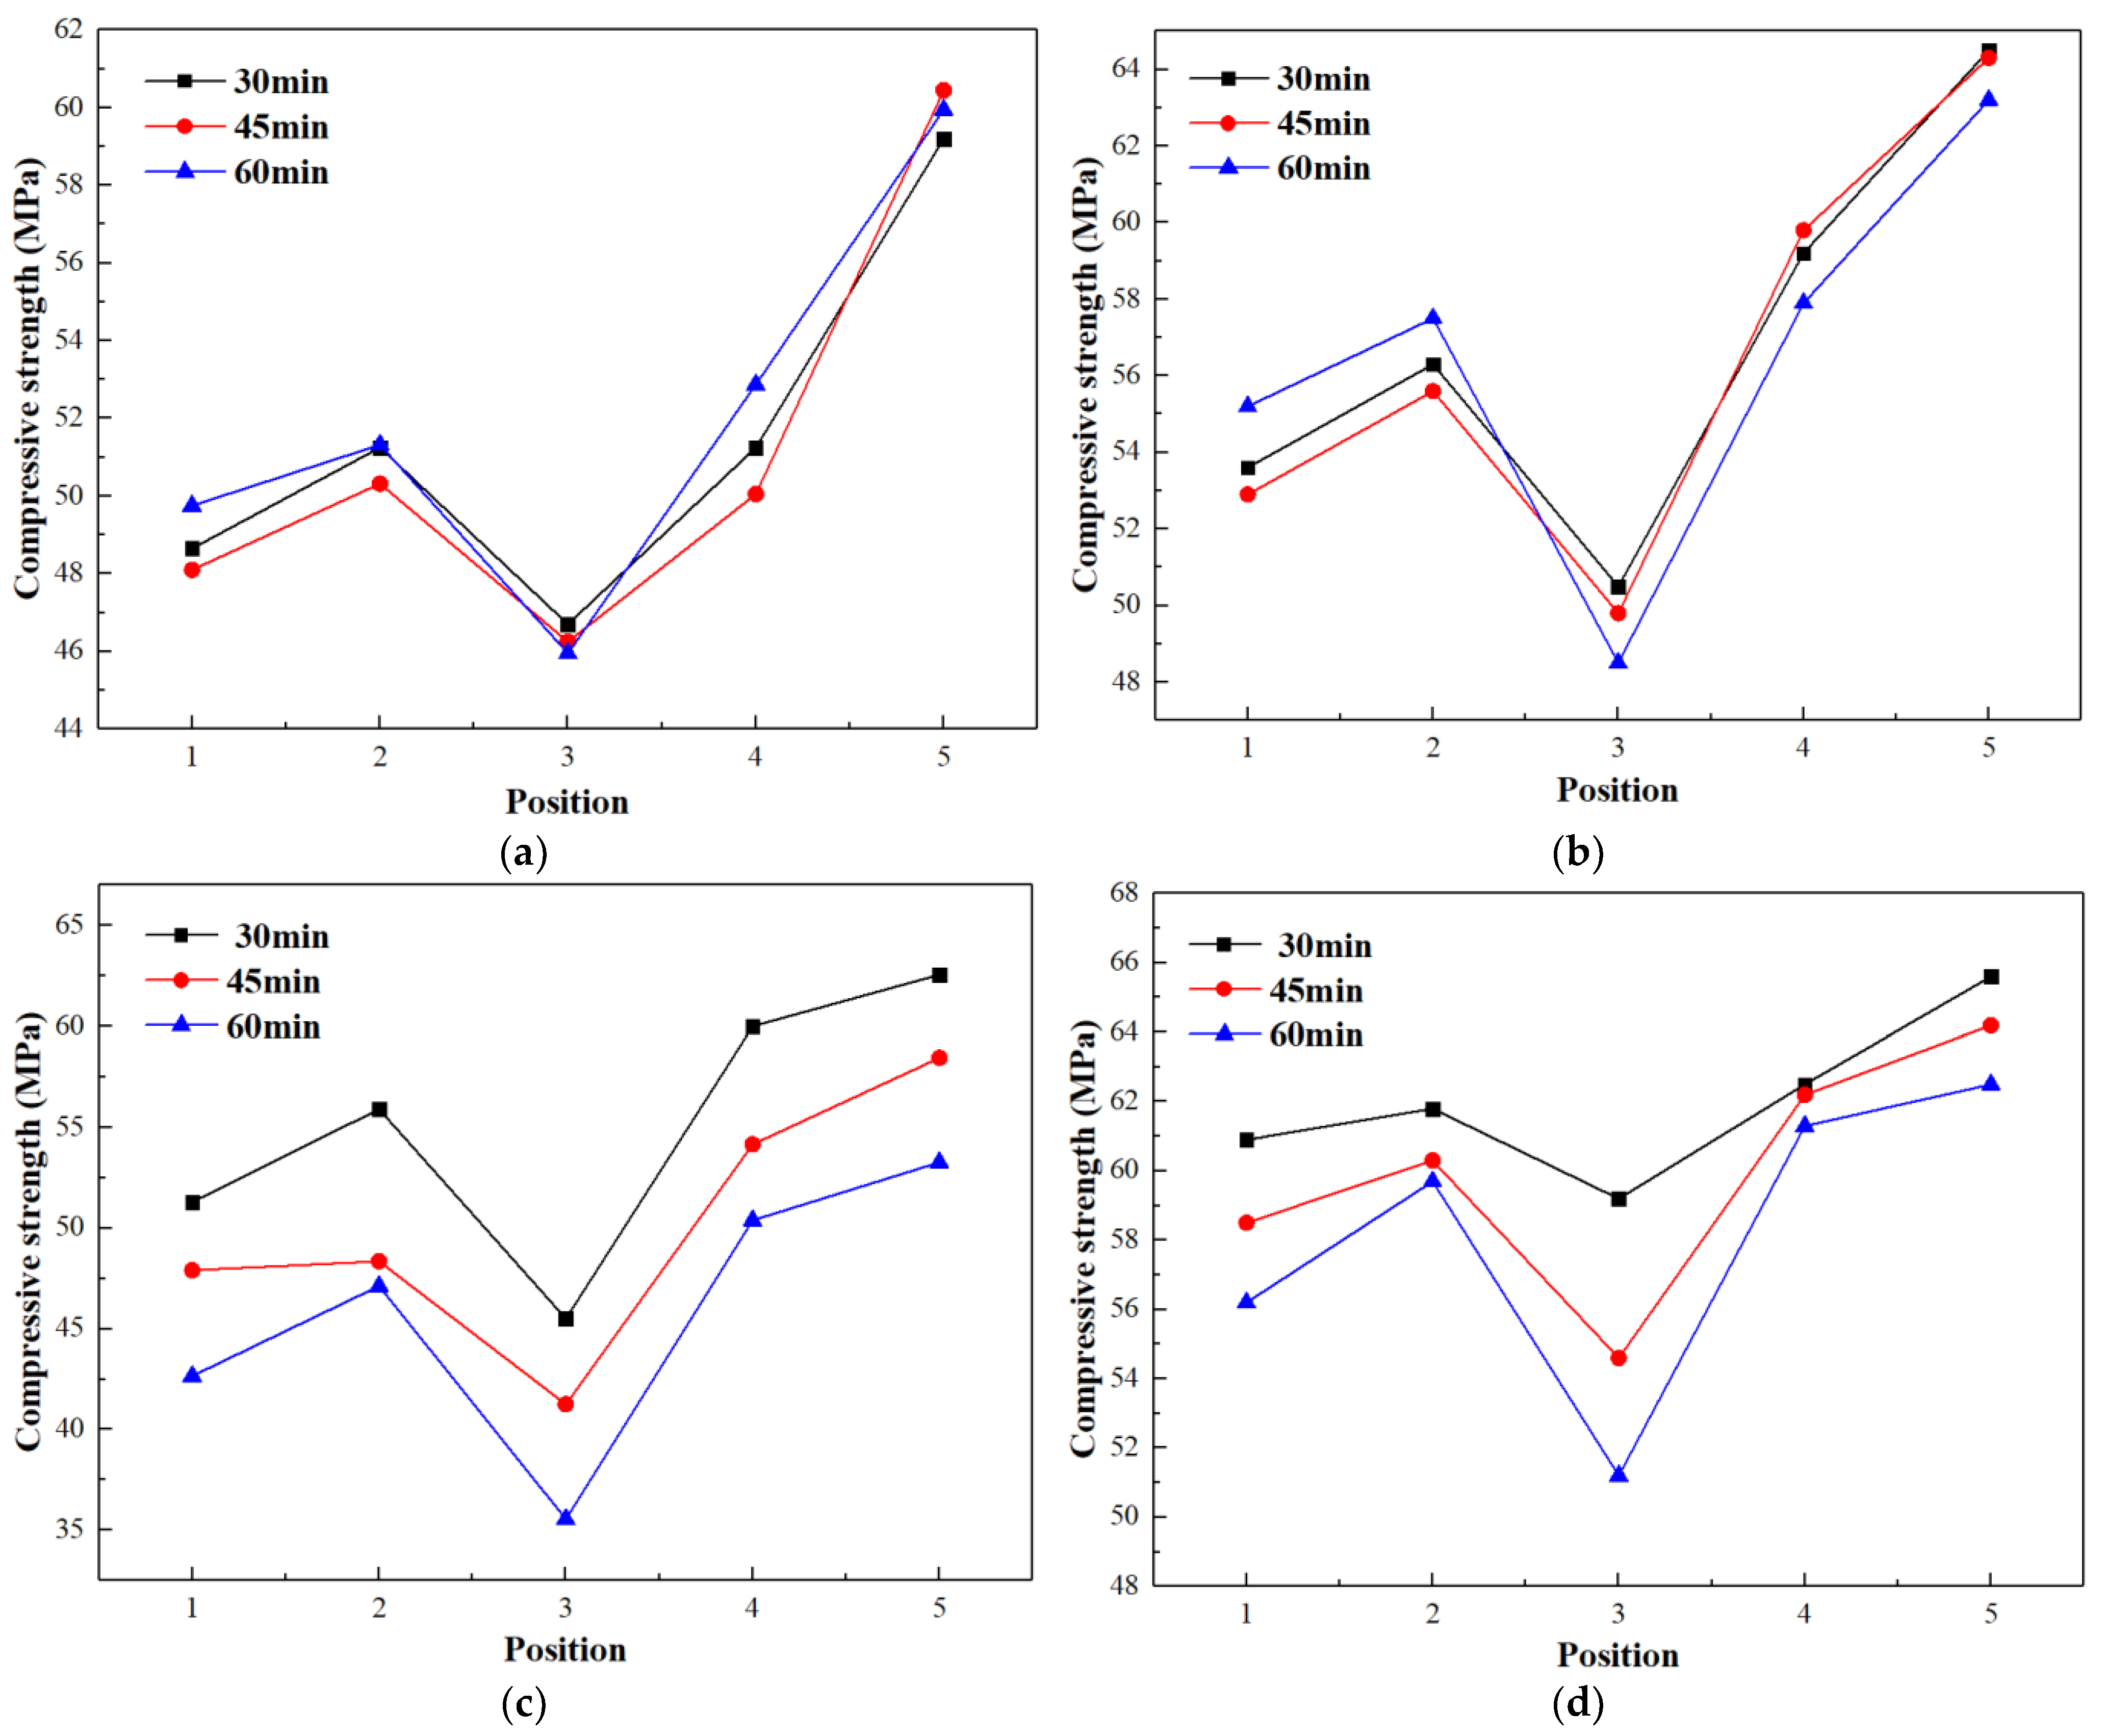
3.2. Compressive Strength

Studies have shown that faster pulse velocities represent higher densities and compressive strengths [26]. In order to further confirm the conclusion in Section 3.1, PFA concrete samples taken from different positions of the concrete slab were tested for compressive strength. Figure 4 shows the compressive strengths of concrete samples with 0.45 and 0.55 water–cement ratios at different positions after 28 and 56 days of curing, respectively. When the water–cement ratio was 0.55, after curing for 28 days and 56 days, the strengths of the concrete samples increased first, then decreased, and then increased again as the sampling position lowered. Among sampling positions, the lowest value of compressive strength appeared at position 3, the highest value was at position 5, and the maximum difference reached 15 MPa. The lowest value of compressive strength occurred at position 3, at approximately 46.5 MPa, the test block with the highest compressive strength (approximately 60 MPa) was from position 5, and the largest difference reached 15 MPa. This was because position 3 was at the junction of the two layers of concrete, where there were more pores, and the bonding of the two layers of concrete caused a weak area, thereby reducing the strength of the concrete. In addition, the compressive strength of position 1 was lower compared to the strengths of PFA concrete samples from the other four positions, while the sample from position 5 had higher compressive strength. This may be due to the fact that after the vibration, the concrete aggregate sank, so that the concrete at the top contained more paste, resulting in reduced strength, and the concrete at the bottom was more compact, resulting in increased strength. In addition, it can be clearly seen that under different curing times, the compressive strength at position 3 decreased as the pouring time interval between the two layers of concrete became longer. This shows that the pouring time had a significant impact on the integrity of the concrete. This result is consistent with results of the Pundits test.
When the water–cement ratio was 0.45, the compressive strength of concrete samples taken from different locations showed a similar development trend to samples with a water–cement ratio of 0.55. The concrete at position 3 exhibited the lowest compressive strength, and compressive strength decreased as the pouring time interval increased. It is worth noting that the pouring time interval had a more pronounced effect on the strength of PFA concrete samples with a 0.45 w/c compared to samples with a water–cement ratio of 0.55. When the curing age was 28 d and the pouring time interval was 60 min, the compressive strength of position 3 was reduced by approximately 10 MPa compared with concrete samples with a 30 min interval time. When the curing age increased to 56 days, the difference in compressive strength decreased slightly, but still reached 8 MPa. This shows that when the water–cement ratio of concrete was relatively low, the pouring time interval had a greater impact on the integrity of the concrete.
In addition, according to the results of compressive strength and pulse velocity tests, when the concrete pouring time interval was less than 1 h, although the two-layer concrete interface had a lower strength, it did not have characteristics of the cold joint described in the literature [14]. Therefore, subsequent experiments are required, with testing over a longer period to determine if the junction will become a cold joint in a few years.

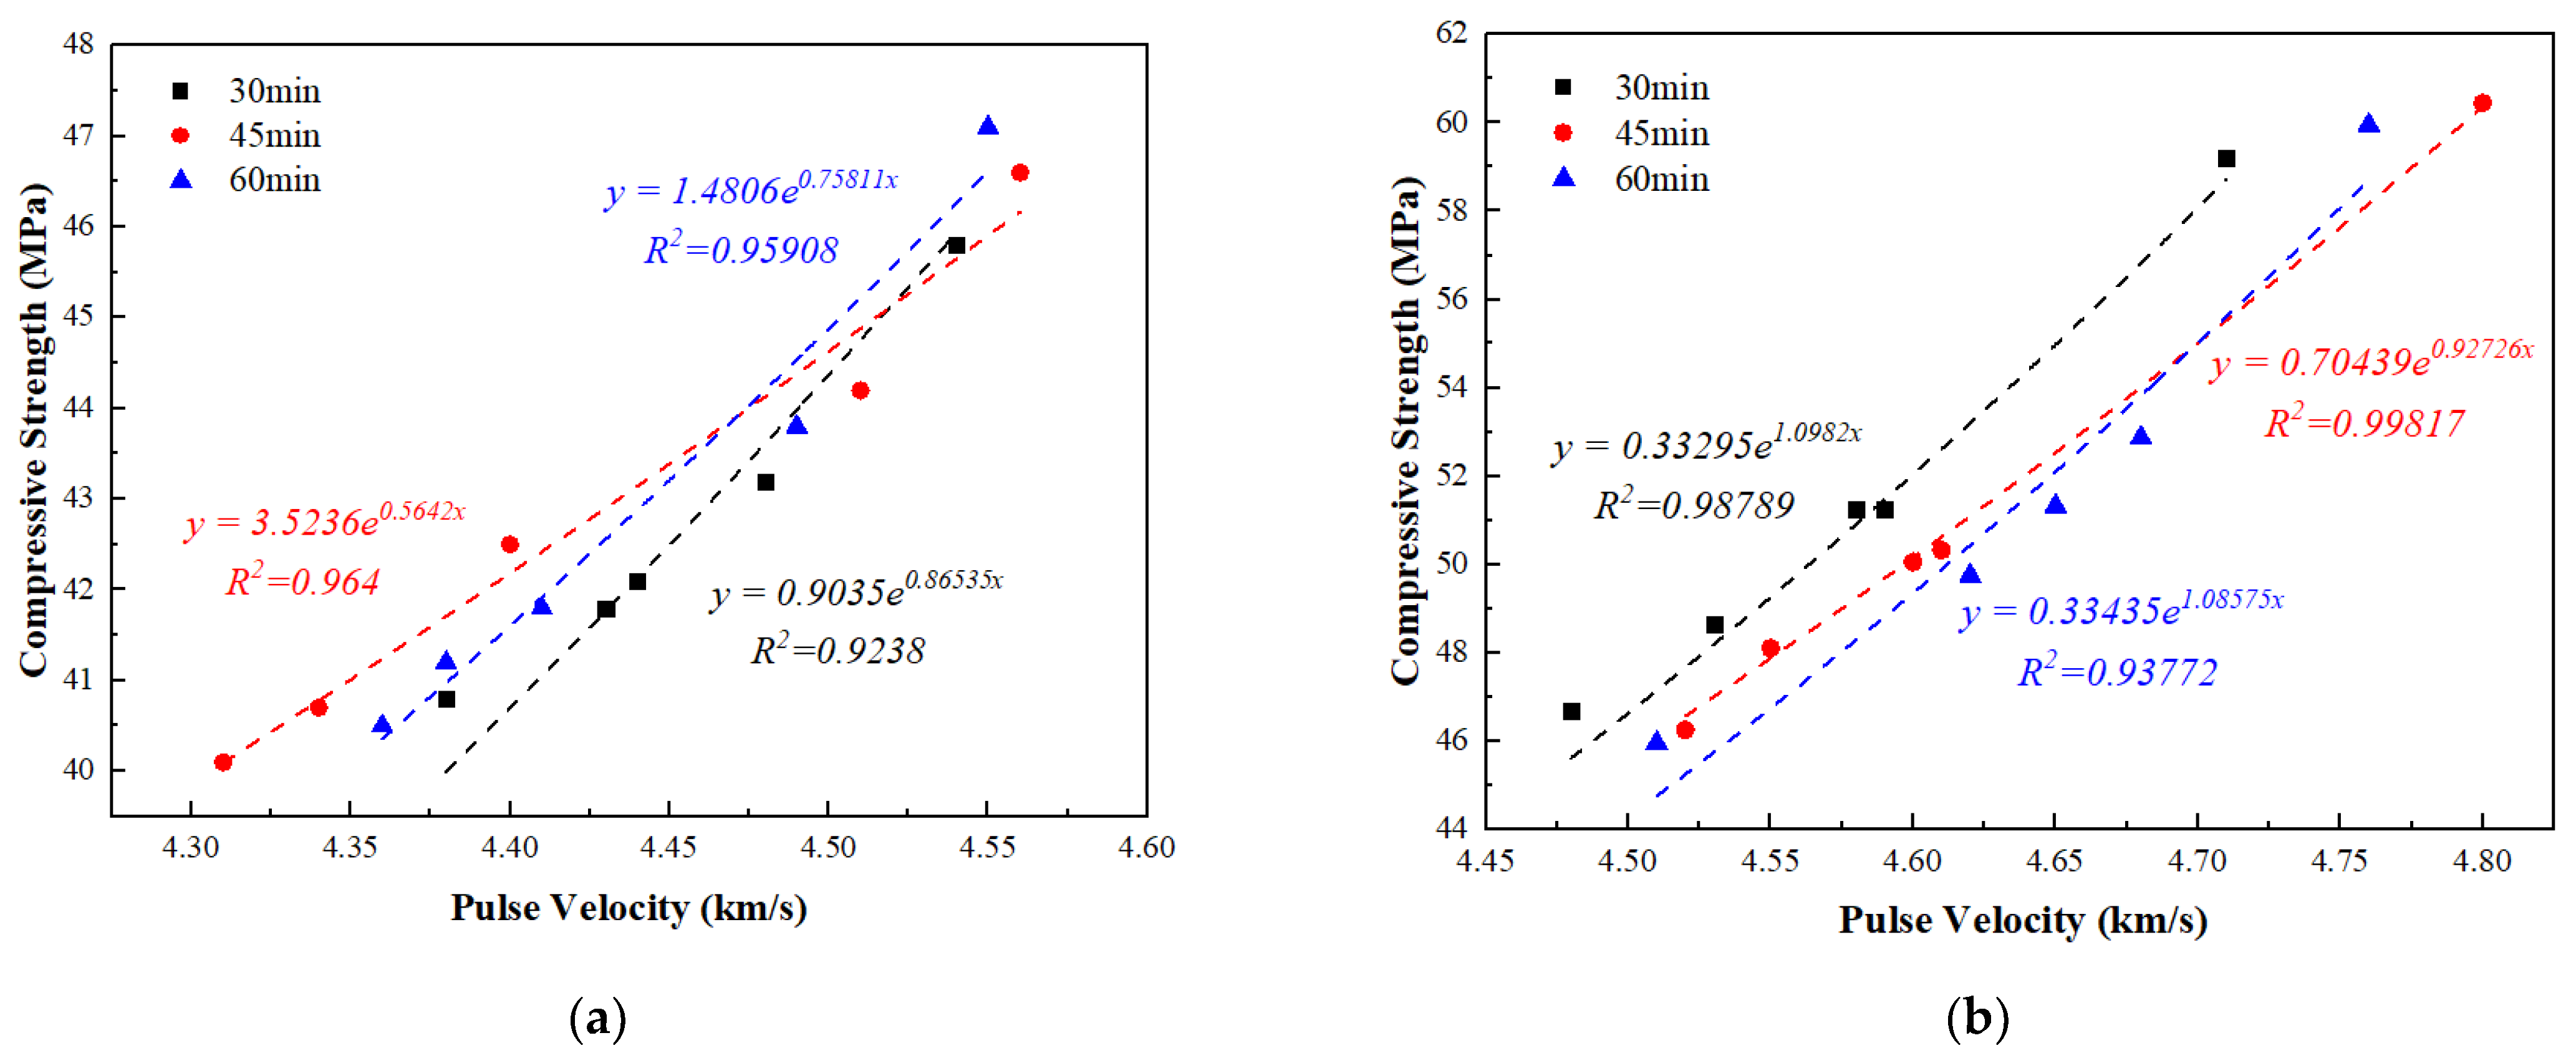
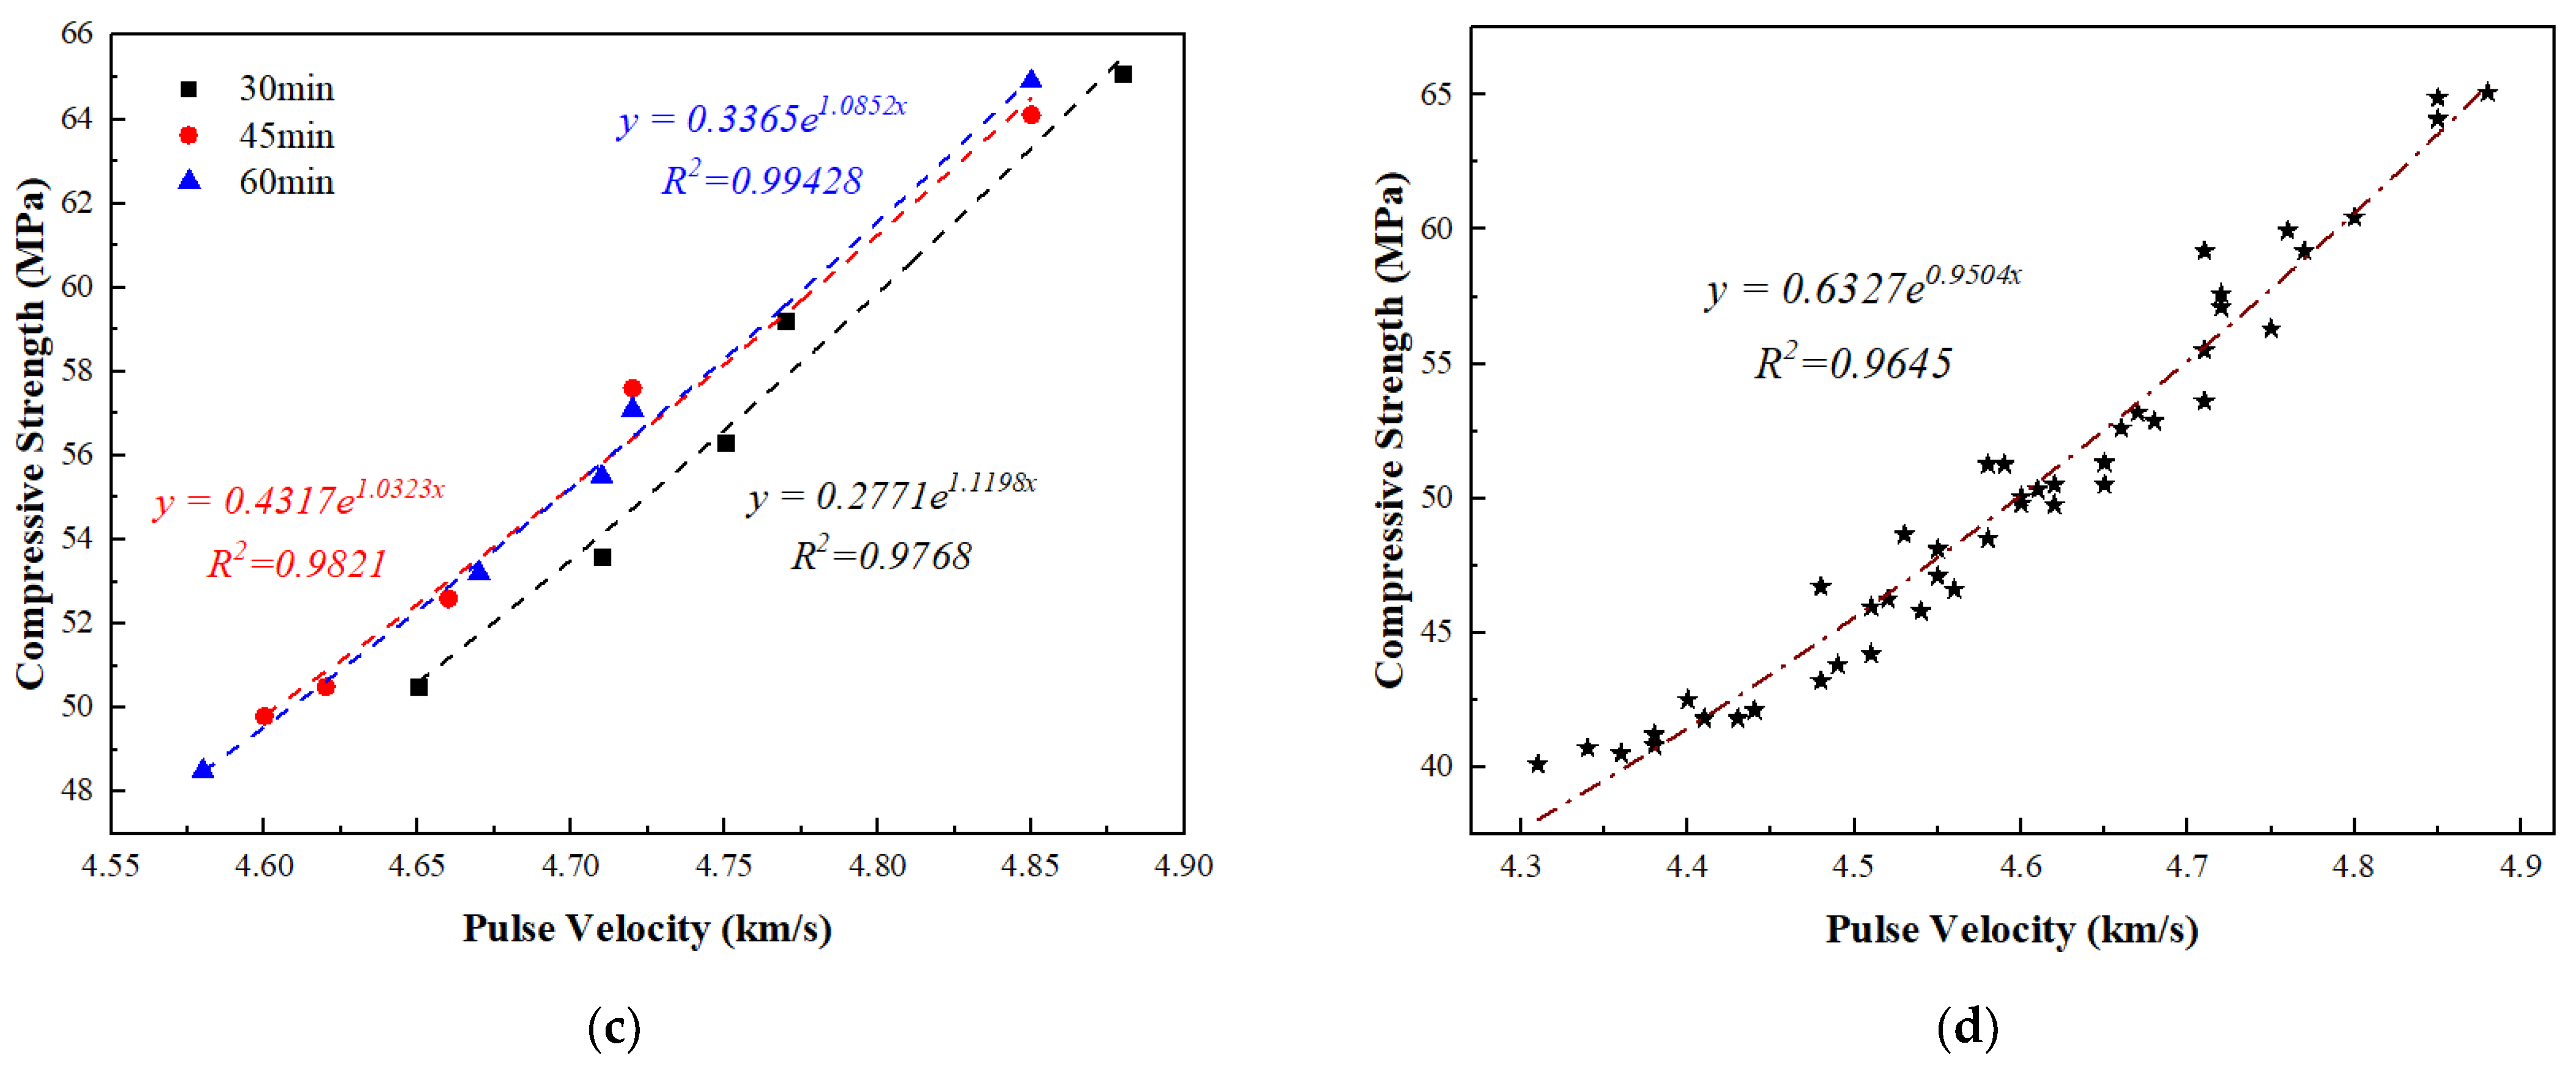
3.3. Relationship between Compressive Strength and Pulse Velocity

Analysis of experimental results presented in Section 3.1 and Section 3.2 showed that the compressive strength of concrete had a positive correlation with ultrasonic pulse velocity. In this regard, many researchers use the model shown in Equation (1) to estimate the relationship between the compressive strength and pulse velocity of concrete samples.
Where a and b are empirical parameters obtained by the least squares method, it is worth noting that different researchers have obtained different parameters [26,27,28,29]. This shows that factors affecting the performance of concrete also affect the relationship between its compressive strength and ultrasonic pulse velocity. It is well known that when PFA is added to concrete, its workability, compactness, and degree of hydration change. Therefore, in this experiment, a new fitting and analysis of the relationship between the compressive strength and ultrasonic pulse velocity of PFA concrete were made.
y = a e b x
According to experimental results presented in Section 3.1 and Section 3.2, the relationship between the compressive strength and pulse velocity of concrete with different pouring time intervals at different curing ages was plotted. Resulting data for concrete samples with a 0.55 w/c were selected and analyzed, as shown in Figure 5. It can be seen in Figure 5 that the relationship between the compressive strength and pulse velocity of concrete samples conformed to the law of Equation (1) after 14, 28, and 56 days of curing. Moreover, the correlation coefficient R2 of all fitting equations was high (greater than 90%). This shows that Equation (2) can be used with pulse velocity data to estimate the strength at different locations in the concrete. However, it is worth noting that when the pouring time interval and the curing age were different, constants of the fitting formula were not consistent. Moreover, by comparison with research presented in the literature, it was found that there were also differences from constants in the results of this study when the coefficient a was in the range of 0.3–3.5 and the coefficient b was in the range of 0.5–1.1. This may have been due to a number of factors, including concrete types, ratios, curing environments, etc. In order to reduce the error and improve the accuracy of the fitting equation, all data in Figure 5a–c were integrated and fitted by Equation (1); results are shown in Figure 5d, while the fitting formula is shown in Equation (2). It can be seen in Figure 5d that the coefficient a was 0.63, b was 0.95, and the fitting degree R2 was higher than 95%, indicating that the fitting formula was consistent with the development relationships of compressive strength and pulse velocity of PFA concrete when the water–cement ratio was 0.55.
F c = 0.63 e 0.95 V c

4. Conclusions

In this study, the effects of the pouring time interval on the integrity of PFA concrete were studied by testing compressive strength and ultrasonic pulse velocity, and the relationship between the compressive strength of PFA concrete and ultrasonic pulse velocity was examined. The results provide an important guideline for the pouring process of PFA concrete in practical engineering. The main conclusions are listed below.
The duration of the two-layer concrete pouring time has a significant impact on the integrity of the concrete. Both the compressive strength and the ultrasonic pulse velocity decrease as the pouring time interval increases.
The pouring time interval has a greater impact on the integrity of the concrete when the water–cement ratio of the concrete is relatively low. When the curing age was 28 d and the pouring time interval was 60 min, the compressive strength of the concrete sample with a 0.45 w/c from the junction of two layers was reduced by approximately 10 MPa compared with that of concrete samples with a 30 min pouring time interval.
The formula F c = 0.63 e 0.95 V c can be used to infer the compressive strength of PFA concrete at different ages by ultrasonic pulse velocity.
For future research, the pouring time interval can be refined and the most recommended pouring time interval can be identified to ensure that concrete strength does not decrease. Secondly, the relationship between ultrasonic pulse velocity and concrete under more diversified admixture conditions can be investigated.

Author Contributions

L.N. performed experiments and data analysis and wrote a portion of this paper. Weiwei Yang performed data analysis and wrote a portion of this paper. D.Z. performed data analysis. H.Y. performed experiments and data analysis. X.D. provided original ideas and performed data analysis. All authors have read and agreed to the published version of the manuscript.

Funding

We sincerely appreciate funding support from the National Key Research and Development Program of China (No. 2022YFC3800903) and the Shenzhen Metro Group Co., Ltd. (No. SZDT-JSZX-ZC-2020-0022).

Institutional Review Board Statement

Not applicable.

Informed Consent Statement

Not applicable.

Data Availability Statement

Data is contained within the article.

Conflicts of Interest

The authors declare that this study received funding from Shenzhen Metro Group Co., Ltd. The funder was not involved in the study design, collection, analysis, interpretation of data, the writing of this article or the decision to submit it for publication.

References

  1. Hemalatha, T.; Ramaswamy, A. A review on fly ash characteristics—Towards promoting high volume utilization in developing sustainable concrete. J. Clean. Prod. 2017, 147, 546–559. [Google Scholar] [CrossRef]
  2. Ban, C.C.; Yaw, C.K.; Ramli, M.; Keat, L.G. The engineering properties and microstructure development of cement mortar containing high volume of inter-grinded GGBS and PFA cured at ambient temperature. Constr. Build. Mater. 2016, 122, 683–693. [Google Scholar] [CrossRef]
  3. Man, C.K.; Yeung, H.S. The effects of using pulverized fuel ash as partial substitute for cement in concrete. Sci. Total Environ. 1997, 196, 171–176. [Google Scholar] [CrossRef]
  4. De Weerdt, K.; Haha, M.B.; Le Saout, G.; Kjellsen, K.O.; Justnes, H.; Lothenbach, B. Hydration mechanisms of ternary Portland cements containing limestone powder and fly ash. Cem. Concr. Res. 2011, 41, 279–291. [Google Scholar] [CrossRef]
  5. Ismail, I.; Bernal, S.A.; Provis, J.L.; San Nicolas, R.; Hamdan, S.; van Deventer, J.S.J. Modification of phase evolution in alkali-activated blast furnace slag by the incorporation of fly ash. Cem. Concr. Compos. 2014, 45, 125–135. [Google Scholar] [CrossRef]
  6. Samad, S.; Shah, A.; Lambachiya, M.C.; Desai, S.B. Strength development of binary cement concrete, using Pulverized Fly Ash (PFA) under various curing conditions. Sci. Iran. 2019, 26, 615–624. [Google Scholar] [CrossRef]
  7. Bai, J.; Wild, S.; Sabir, B.B.; Kinuthia, J.M. Workability of concrete incorporating pulverized fuel ash and metakaolin. Mag. Concr. Res. 1999, 51, 207–216. [Google Scholar] [CrossRef]
  8. Zhou, X.M.; Slater, J.R.; Wavell, S.E.; Oladiran, O. Effects of PFA and GGBS on Early-Ages Engineering Properties of Portland Cement Systems. J. Adv. Concr. Technol. 2012, 10, 74–85. [Google Scholar] [CrossRef]
  9. Ukwattage, N.L.; Ranjith, P.G.; Yellishetty, M.; Bui, H.H.; Xu, T. A laboratory-scale study of the aqueous mineral carbonation of coal fly ash for CO2 sequestration. J. Clean. Prod. 2015, 103, 665–674. [Google Scholar] [CrossRef]
  10. Şahmaran, M.; Li, V.C. Durability properties of micro-cracked ECC containing high volumes fly ash. Cem. Concr. Res. 2009, 39, 1033–1043. [Google Scholar] [CrossRef]
  11. Yang, H.-M.; Lee, H.-S.; Yang, K.-H.; Ismail, M.A.; Kwon, S.-J. Time and cold joint effect on chloride diffusion in concrete containing GGBFS under various loading conditions. Constr. Build. Mater. 2018, 167, 739–748. [Google Scholar] [CrossRef]
  12. Kwon, S.-J.; Na, U.-J. Prediction of Durability for RC Columns with Crack and Joint under Carbonation Based on Probabilistic Approach. Int. J. Concr. Struct. Mater. 2011, 5, 11–18. [Google Scholar] [CrossRef]
  13. Xiao, J.; Sun, C.; Lange, D.A. Effect of joint interface conditions on shear transfer behavior of recycled aggregate concrete. Constr. Build. Mater. 2016, 105, 343–355. [Google Scholar] [CrossRef]
  14. Yoo, S.-W.; Kwon, S.-J. Effects of cold joint and loading conditions on chloride diffusion in concrete containing GGBFS. Constr. Build. Mater. 2016, 115, 247–255. [Google Scholar] [CrossRef]
  15. Banthia, N.; Biparva, A.; Mindess, S. Permeability of concrete under stress. Cem. Concr. Res. 2005, 35, 1651–1655. [Google Scholar] [CrossRef]
  16. Roy, B.; Laskar, A.I. Cyclic behavior of in-situ exterior beam-column subassemblies with cold joint in column. Eng. Struct. 2017, 132, 822–833. [Google Scholar] [CrossRef]
  17. Choinska, M.; Khelidj, A.; Chatzigeorgiou, G.; Pijaudier-Cabot, G. Effects and interactions of temperature and stress-level related damage on permeability of concrete. Cem. Concr. Res. 2007, 37, 79–88. [Google Scholar] [CrossRef]
  18. Kewalramani, M.A.; Gupta, R. Concrete compressive strength prediction using ultrasonic pulse velocity through artificial neural networks. Autom. Constr. 2006, 15, 374–379. [Google Scholar] [CrossRef]
  19. Berriman, J.; Purnell, P.; Hutchins, D.A.; Neild, A. Humidity and aggregate content correction factors for air-coupled ultrasonic evaluation of concrete. Ultrasonics 2005, 43, 211–217. [Google Scholar] [CrossRef] [PubMed]
  20. Ohdaira, E.; Masuzawa, N. Water content and its effect on ultrasound propagation in concrete—The possibility of NDE. Ultrasonics 2000, 38, 546–552. [Google Scholar] [CrossRef]
  21. BS EN 12390-2; Testing of Hardened Concrete. British Standards Institution: London, UK, 2019.
  22. BS 1881-203:1986; Testing Concrete—Part 203: Recommendations for Measurement of Velocity of Ultrasonic Pulses in Concrete. British Standards Institution: London, UK, 1986.
  23. BS EN 12390-3; Testing of Hardened Concrete—Part 3: Testing Hardened Concrete. Compressive Strength of Test Specimens. British Standards Institution: London, UK, 2019.
  24. Rathi, V.R.; Kolase, P.K. Effect of Cold Joint on Strength of Concrete. Int. J. Innov. Res. Sci. Eng. Technol. 2013, 2, 4671–4679. [Google Scholar]
  25. Kırca, Ö.; Turanlı, L.; Erdoğan, T.Y. Effects of retempering on consistency and compressive strength of concrete subjected to prolonged mixing. Cem. Concr. Res. 2002, 32, 441–445. [Google Scholar] [CrossRef]
  26. Gül, R.; Demirboğa, R.; Güvercin, T. Compressive strength and ultrasound pulse velocity of mineral admixtured mortars. Indian J. Eng. Mater. Sci. 2006, 13, 18–24. [Google Scholar]
  27. del Rio, L.M.; Jimenez, A.; Lopez, F.; Rosa, F.J.; Rufo, M.M.; Paniagua, J.M. Characterization and hardening of concrete with ultrasonic testing. Ultrasonics 2004, 42, 527–530. [Google Scholar] [CrossRef]
  28. Lin, Y.; Shih-Fang, K.; Hsiao, C.; Chao-Peng, L. Investigation of pulse velocity-strength relationship of hardened concrete. ACI Mater. J. 2007, 104, 344–350. [Google Scholar]
  29. Yılmaz, T.; Ercikdi, B. Predicting the uniaxial compressive strength of cemented paste backfill from ultrasonic pulse velocity test. Nondestruct. Test. Eval. 2015, 31, 247–266. [Google Scholar] [CrossRef]
Figure 1. (a) Schematic diagrams of ultrasound pulse test; (b) concrete sampling positions.
Applsci 14 01332 g001
Figure 2. Pulse velocity against curing ages: (a) 30 min interval, (b) 45 min interval, and (c) 60 min interval.
Applsci 14 01332 g002aApplsci 14 01332 g002b
Figure 3. Pulse velocities of position 3 with different pouring time intervals at different curing ages: (a) w/c = 0.55 and (b) w/c = 0.45.
Applsci 14 01332 g003
Figure 4. Compressive strengths of concrete samples at different positions: (a) 0.55 w/c, 28 d; (b) 0.55 w/c, 56 d; (c) 0.45 w/c, 28 d; and (d) 0.45 w/c, 56 d.
Applsci 14 01332 g004
Figure 5. Relationships between compressive strength and pulse velocity of concrete with a 0.55 w/c after curing (a) 14 d; (b) 28 d; and (c) 56 d; and (d) fitting equation for all data.
Applsci 14 01332 g005aApplsci 14 01332 g005b
Table 1. Mix proportions of PFA concrete (mass in kg/m3).
w/cCement20 mm Gravel10 mm GravelFine AggregatePFAWater
Mix 10.5536068029080040220
Mix 20.4536068029080040180
Disclaimer/Publisher’s Note: The statements, opinions and data contained in all publications are solely those of the individual author(s) and contributor(s) and not of MDPI and/or the editor(s). MDPI and/or the editor(s) disclaim responsibility for any injury to people or property resulting from any ideas, methods, instructions or products referred to in the content.

