Article

Physical and Numerical Models of Mechanically Stabilized Earth Walls Using Self-Fabricated Steel Reinforcement Grids Applied to Cohesive Soil in Vietnam

Faculty of Bridge and Road Engineering, The University of Danang—University of Science and Technology, 54 Nguyen Luong Bang Street, Danang City 550000, Vietnam
*
Authors to whom correspondence should be addressed.
Appl. Sci. 2024, 14(3), 1283; https://doi.org/10.3390/app14031283
Submission received: 23 November 2023 / Revised: 12 January 2024 / Accepted: 19 January 2024 / Published: 3 February 2024
(This article belongs to the Special Issue Slope Stability and Earth Retaining Structures)

Abstract

:
Mechanically stabilized earth (MSE) walls have been widely applied in construction to maintain the stability of high embankments. In Vietnam, imported reinforcement materials are expensive; thus, finding locally available materials for MSE walls is beneficial. This study examines the behavior of an MSE wall using local reinforcement materials in Danang, Vietnam. The MSE was reinforced by self-fabricated galvanized steel grids using CB300V steel with 3 cm ribs. The backfill soil was sandy clay soil from the local area with a low cohesion. A full-scale model with full instrumentation was installed to investigate the distribution of tensile forces along the reinforcement layers. The highest load that caused the wall to collapse due to internal instability (reinforcement rupture) was 302 kN/m2, which is 15 times greater than the design load of 20 kN/m2. The failure surface within the reinforced soil had a parabolic sliding shape that was similar to the theoretical studies. At the failure load level, the maximum lateral displacement at the top of the wall facing was small (3.9 mm), significantly lower than the allowable displacement for a retaining wall. Furthermore, a numerical model using FLAC software 7.0 was applied to simulate the performance of the MSE wall. The modeling results were in good agreement with the physical model. Thus, self-fabricated galvanized steel grids could confidently be used in combination with the local backfill soil for MSE walls.

1. Introduction

Mechanically stabilized earth (MSE) walls are one of the types of retaining walls constructed to maintain the stability of soil in bridge abutments or high embankments. This technique was used in France in the 1960s and has since been widely applied in construction in many countries all over the world [1,2]. The structure of MSE walls includes the backfill material (e.g., natural soil, fly ash, sand, and geofoam), the reinforcement (e.g., geogrids, geotextiles, steel strips, and steel grids), and the wall-facing elements (e.g., rigid concrete panels, metal sheets, and wood panels). MSE retaining walls can resist earth pressure, service loads, and seismic loads with high stability and with a construction cost approximately 25–50% lower than conventional concrete or steel walls [1,3].
The MSE walls’ behavior is complicated. The MSE walls’ performance is established by the interactions between the soil and the reinforcement as well as the soil and the facing elements [4]. The stability of MSE walls depends on several factors, including the type and the size of reinforcement, the properties of the backfill material, the construction techniques, and the type of facing elements [3,5,6].
The mechanical behavior of MSE walls has been investigated using physical models by several researchers such as Murray and Farrar [7], Chang et al. [2], Lee et al. [8], Richards et al. [9], and Ahmadi et al. [10]. These studies found that the failure surface of the wall had a parabolic shape, passing through locations with the highest tensile forces within the reinforcement layers [2,7,8,10,11]. The failure surface of the wall aligned with the horizontal direction at an angle of (45° + φ/2) at the toe of the wall [10]. Currently, according to the design rules and standards [12,13,14], the failure surface of an MSE wall closely resembles the failure surfaces observed in the studies [2,7,8,10,11].
Khan et al. [4], Ahmadi and Bezuijen [5], Kibria et al. [15], Roscoe and Twine [16], Jensen [17], and Weldu [18] conducted full-scale and physical models to examine the behavior of MSE walls, including the maximum tensile forces in the reinforcement, the connection between the reinforcement and the wall, horizontal pressure, and vertical pressure on the backfill. The results showed that the length of reinforcement and the reinforcement strength are the two most influential factors on the lateral displacement of the wall [15,17,18]. In addition, the tensile forces and deformation of the reinforcement depend on the uniformity coefficient (Cu) of the backfill soil [18].
On the other hand, Khan et al. [4], Ho and Rowe [19], Yu et al. [20], Weerasekara [21], Sadat et al. [22], Powrie et al. [23], and Zhang et al. [24] investigated the stability of MSE walls through numerical models using FLAC software. The research results showed that the L/H ratio (where H is the wall’s height and L is the length of the reinforcement) significantly influences the internal stability of the wall and the optimal length of the reinforcement was suggested to be L = 0.7 H [19].
Furthermore, the elastic modulus of the foundation layer and backfill material, the shear resistance of the backfill material, and the tensile strength of the reinforcement all affect the tensile forces within the reinforcement layers [20,21]. The failure surface of the wall is similar to a Rankine failure surface [24].
The mentioned studies analyzed the stress–strain relationship within MSE wall structures, including determining the failure surface of the wall, the ultimate tensile rupture limit, the maximum wall displacement, the optimal length of reinforcement, reasonable spacing for reinforcement placement within the wall for different wall heights, the backfill materials, and the specific reinforcement materials. The primary factors influencing the internal stability and overall stability of MSE walls are the backfill material (whether it is cohesive or granular and its properties), the type of reinforcement (rigid or flexible, strength, size, shape, and arrangement within the reinforced soil mass), and the foundation layer below the wall system.
In Vietnam, reinforcement elements such as steel strips or polymeric strips are usually imported from foreign suppliers, with some critical issues. According to a design report by the Transportation and Transport Infrastructure Design Consultancy Company [25], the use of imported reinforcement materials can be up to 20–30% more expensive compared with using a self-fabricated steel grid as a reinforcement for MSE walls [3]. Thus, it is beneficial to investigate the applicability of self-fabricated steel reinforcement grids (e.g., CB300V steel with a diameter of 10 mm) as the reinforcement for MSE walls.
In addition, the backfill materials should meet the criteria of grain-size distribution, low plasticity, and low fine content [26]. It is a fact that most natural backfill materials from the Central Coast of Vietnam are cohesive soils [3,27]. Hence, it is necessary to investigate the performance of MSE walls (the stability of the MSE wall structure and the durability of the reinforcement) utilizing locally available backfill materials.
Moreover, in Vietnam, there has been very limited research on the stability of MSE wall structures using local reinforcements. Therefore, this study was conducted to investigate the performance of an instrumented MSE retaining using self-fabricated ribbed steel. This research aimed to observe the mechanical behavior of the MSE wall, including the maximum tensile force and the load distribution in the reinforcement bars, the wall-facing displacement, and the stability of the wall. To evaluate the global and compound features (the internal and external stability of the MSE wall), a full-scale model and a numerical model were applied in this study. The research results provide an effective reference for engineers using local reinforcements for MSE structures applied to low-cohesive soil in Vietnam. A self-fabricated galvanized steel grid could confidently be used in practice to reduce the cost of construction.

2. Full-Scale Experimental Model

2.1. Model Design

The properties of the backfill material, the steel reinforcement, and the structural dimensions were chosen following the design rules and standards from Berg et al. [1], BSI [13], AFNOR [12], and TCVN [14]. According to the AFNOR NF P94-270:2020 standard [12], the design load was 20 kN/m2 and the experimental load was applied until the MSE wall collapsed, which included reinforcement rupture.
The full-scale MSE wall was designed using self-fabricated ribbed steel grids as the reinforcement. The dimensions of the MSE wall are shown in Figure 1. Within the scope of this study, the MSE wall was built on a rigid foundation with the assumption that the settlement was zero. Additionally, three lateral faces of the wall were fixed to restrict the expansion of the soil mass.

2.1.1. Wall-Facing Panels

The wall facing was a rigid wall type consisting of four precast reinforced concrete with steel (RCWS) panels with a concrete strength of B22.5. Concrete facing panels with dimensions of 1.5 × 0.75 × 0.14 m were used. The total height of the wall was 3 m.

2.1.2. Backfill Material

Currently, most types of locally available backfill material in Danang City, Vietnam, are cohesive soil and they do not meet the requirements of the mechanical, physical, and chemical properties of reinforced backfill materials according to the standards [26,28].
In Danang City, the hillside soil from the Hoa Ninh area is the most suitable source of backfill material, based on current standards [3]. Table 1 shows the mechanical, physical, and chemical properties of the local backfill material. The soil chosen was sandy clay soil according to the standards from AASHTO [26], AFNOR [12], and TCVN [14]. The particle size distribution and results of the standard Proctor compaction test are shown in Figure 2. The grain sizes of D60, D30, and D10 were 0.09, 0.65, and 4.1 mm, respectively. The uniformity coefficient Cu was determined to be 45.6. The friction angle and the unit cohesion were 34.3° and 5.1 kN/m2, respectively. The maximum dry density was 18.16 kN/m3 when the optimum moisture content was 12.5%. The properties of the selected backfill material met the requirements of reinforced soil according to the standards from AFNOR [12], AASHTO [26], and TCVN [14] for MSE wall constructions.
However, the cohesion of 5.1 kN/m2 in the backfill soil could affect the interaction between the steel reinforcement and the reinforced soil. In addition, this soil contained a remarkable amount of sulfate ion (SO42− = 0.497 mg/g); thus, it could affect the long-term durability of the reinforcement due to corrosion. Therefore, to efficiently utilize the available local backfill material, the reinforcement used in the wall was galvanized to prevent corrosion and the soil–reinforcement interaction was enhanced by arranging steel ribs on the reinforcement mesh.
The backfill soil was compacted using a light tamping rammer (Niki NK55 from China) to ensure the soil had the same density. Each soil layer of 0.12 m in height was compacted until a relative density of 95% of the maximum dry density was achieved.

2.1.3. Reinforcement

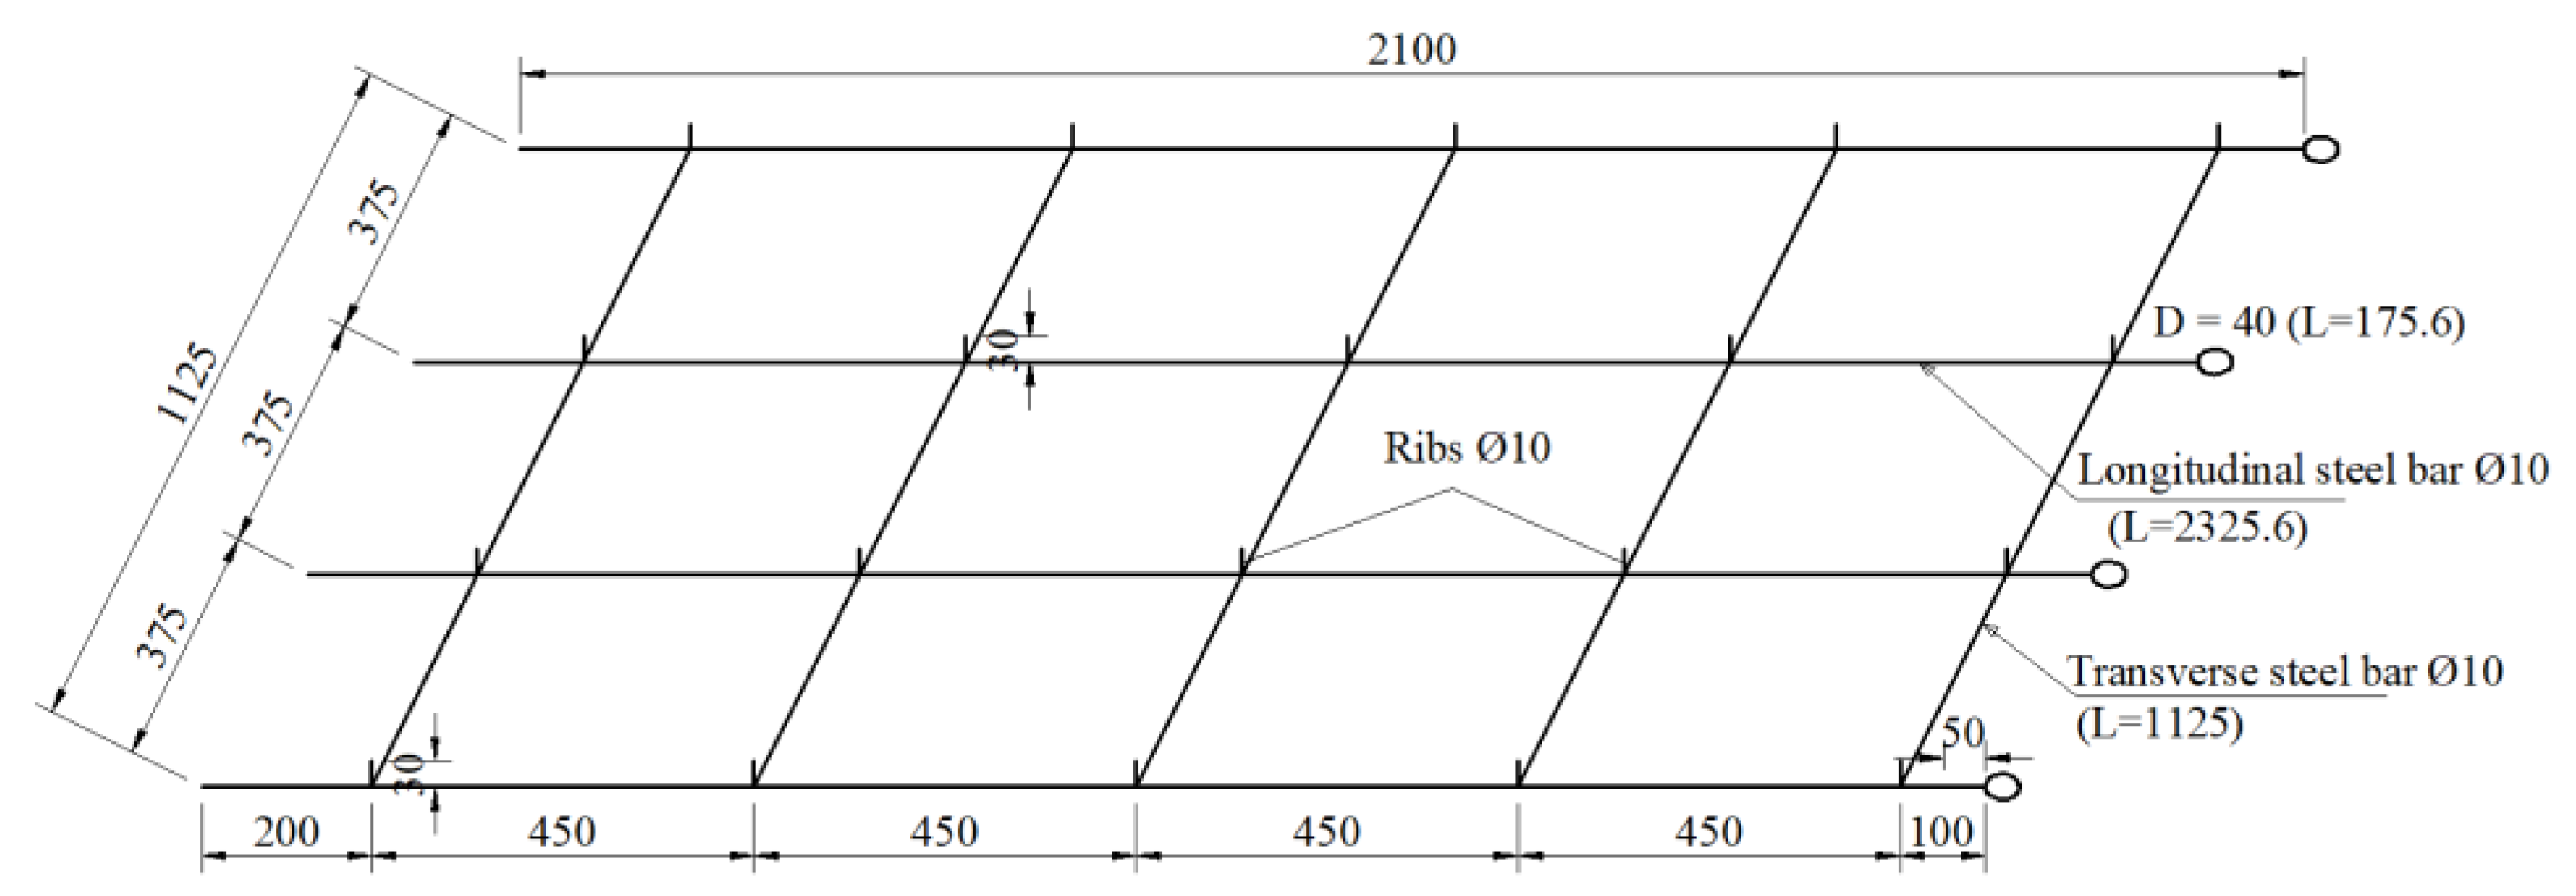
In this study, a self-fabricated galvanized steel grid (GSG) of CB300V steel with a diameter of 10 mm was used, provided by the Viet Nhat Steel Joint Stock Company. The CB300V steel type has been widely used in Vietnam, and the Φ 10 mm steel reinforcement met the requirements for the mechanical, physical, and chemical properties as well as the design strength when used as the reinforcement in the MSE walls. The steel grid had ribs that were 3 cm high at the interaction between the longitudinal and transverse directions to increase the backfill-soil–reinforcement interactions.
The tensile strength of the steel reinforcement (yield strength), F0, was 49,000 N. However, we also considered the effect of the backfill soil, the service life of the wall, corrosion due to sulfate ions, and metal loss during the 100-year design life of the MSE wall. Regarding the service life of the wall, Haiun et al. [29] recommended that an MSE structure needs to be monitored and repaired when the values of the remaining tensile strength within the reinforcement are equal to 65% F0, with F0 being the initial tensile strength of the reinforcement. Thus, in this study, the tensile strength of the reinforcement was 31,850 N at the initial stage, as illustrated in Table 2.
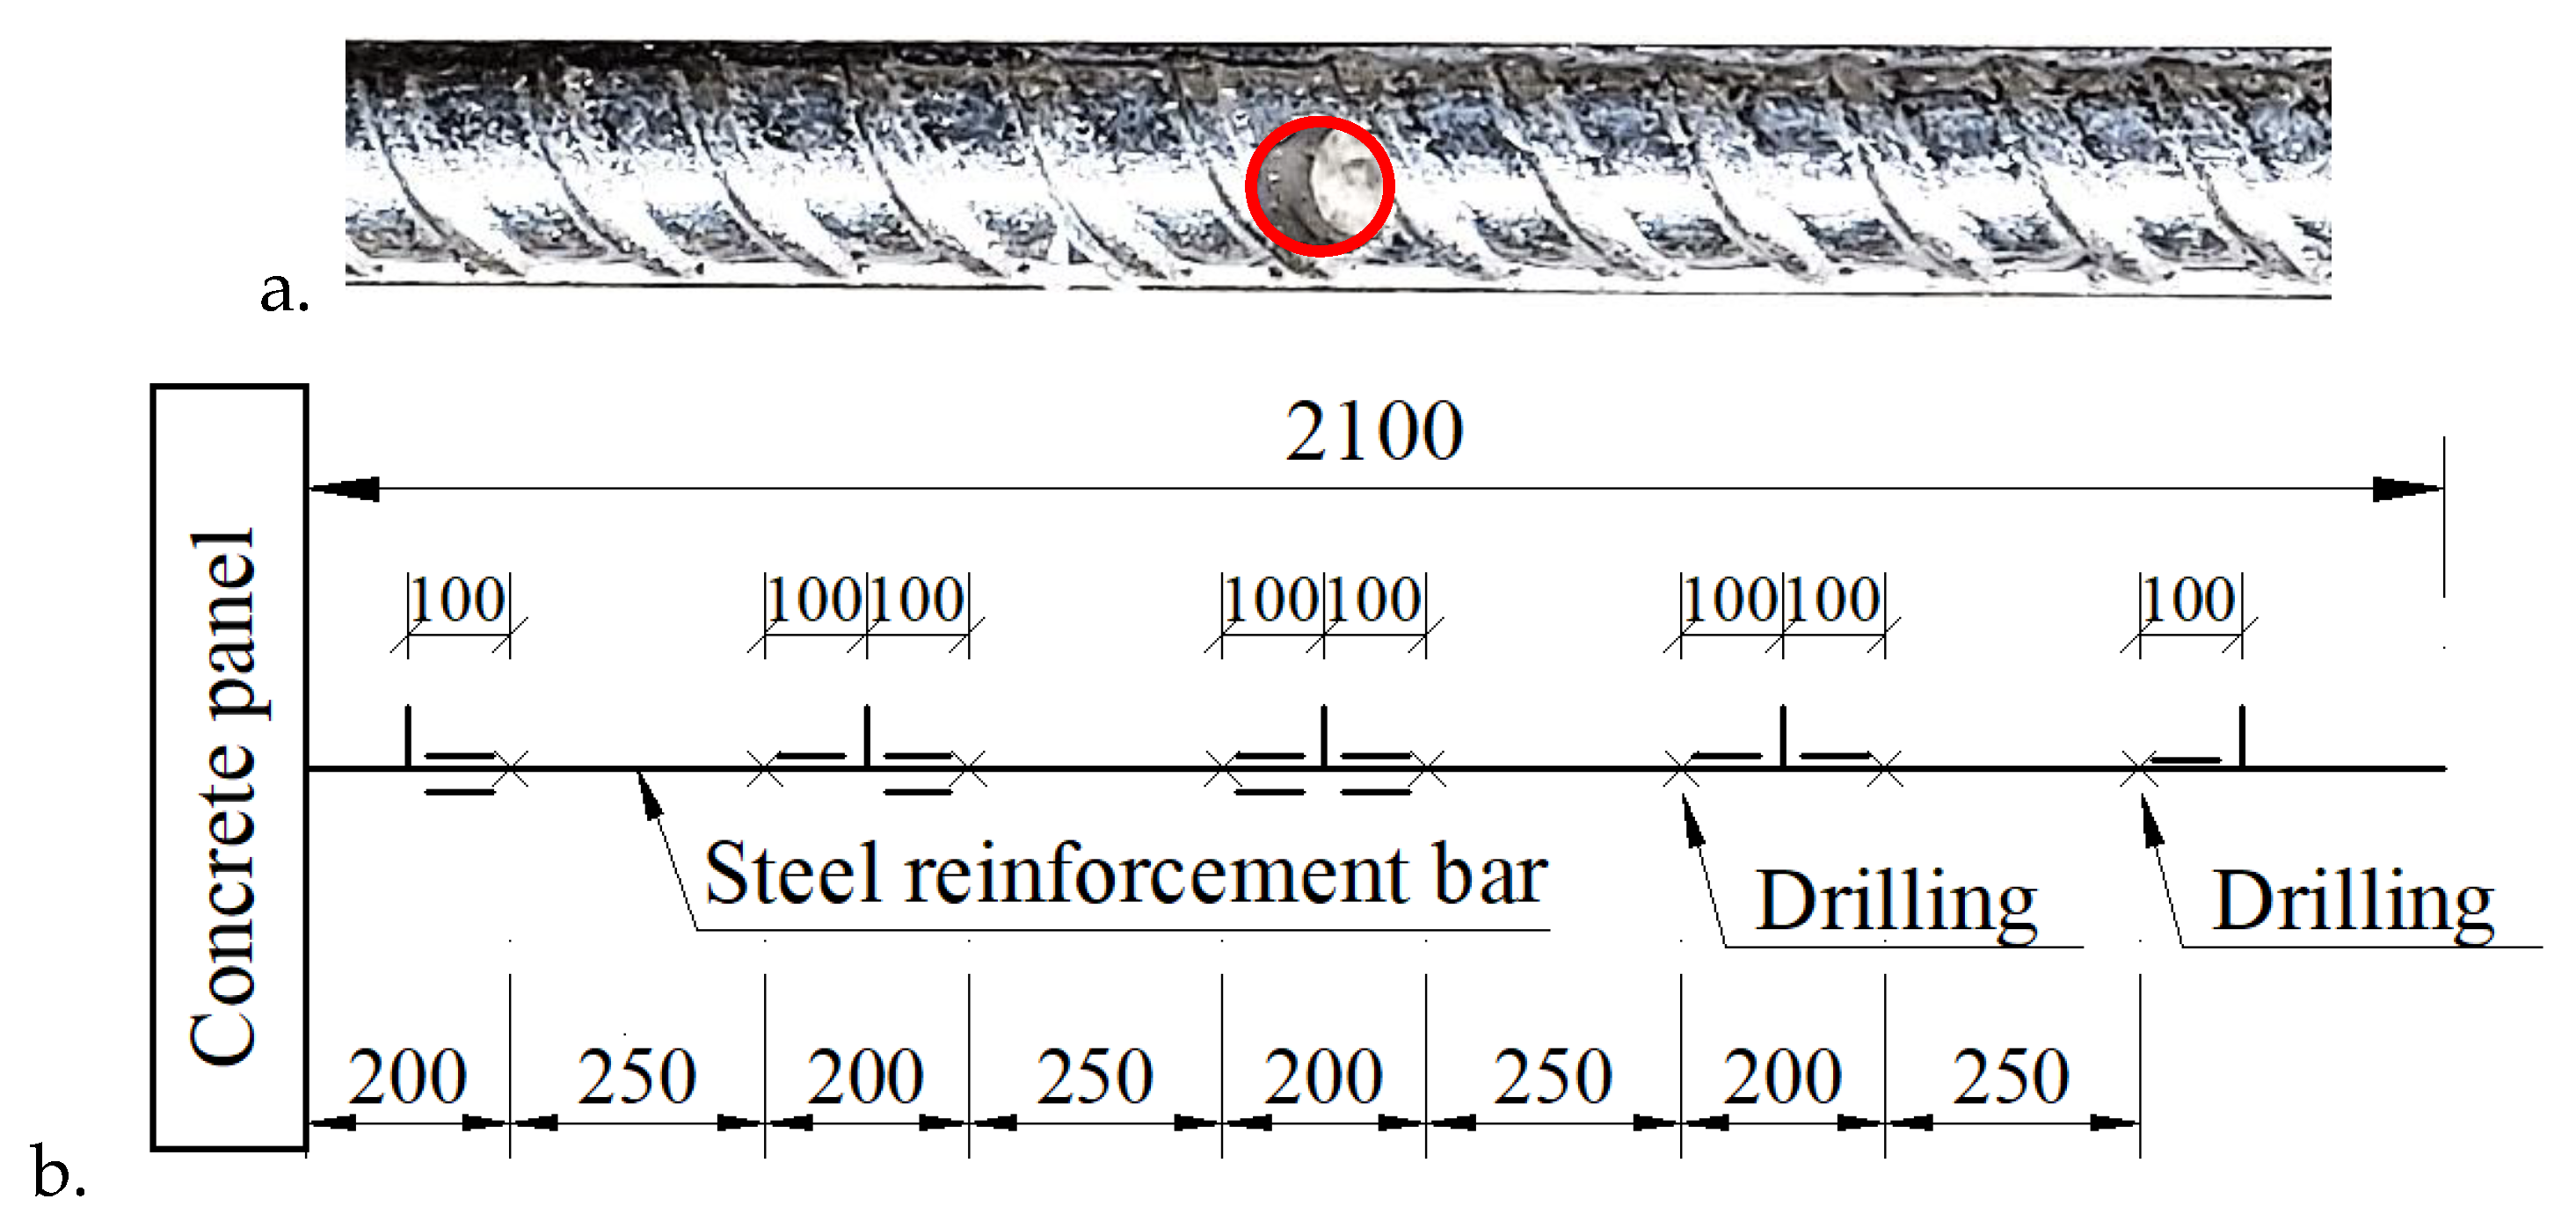
To consider the reduction in the tensile strength of the reinforcement, Haiun et al. [29] drilled the reinforcement bars to reduce their cross-sectional area. This method is also recommended in the design rules and calculation process for MSE walls in AFNOR NF P94-270:2020 [12]. Therefore, this study also carried out drilling to reduce the cross-sectional area of the reinforcement (as shown in Figure 3) with a proportional loss of tensile strength (ΔF) equal to 35% F0, as indicated in Table 2.
Furthermore, to the enhance corrosion resistance of the reinforcement, the steel bars were galvanized with a zinc layer of 70 µm thickness. The length of the reinforcement bars was L = 2.1 m. The vertical spacing between the reinforcement layers was Sv = 0.75 m (4 reinforcement layers along the height of the wall, H = 3 m). In each layer, 4 longitudinal steel reinforcement bars were installed with a space of 0.375 m. In addition, the horizontal spacing between the reinforcement bars (the transverse direction) was 0.45 m. Ribs that were 3 cm high were bonded to the reinforcement mesh to enhance the soil–reinforcement interaction, as shown in Figure 4. The steel reinforcement grids were rigidly connected to the facing panels.
Longitudinal steel reinforcement bars were installed at symmetrical locations. The initial test indicated that the deformation of all longitudinal steel reinforcement bars in the same layer was similar. In the following section, the behavior of one longitudinal steel reinforcement bar is presented.

2.1.4. Ground Foundation

The MSE wall model was prepared and tested at the University of Danang, University of Science and Technology, Vietnam. The subgrade layer was compacted to achieve 95% of its relative density. On the top of this layer, a layer of reinforced concrete that was 20 cm thick with dimensions of 1.5 × 2.4 m was installed. This foundation was designed to ensure that the foundation remained stable without settlement during the construction and loading of the MSE wall.

2.1.5. Loading System

On the top of the retaining wall, concrete plates that were 14 cm thick were installed to transfer the load test from the loading system to the reinforced soil mass and the retaining wall. Three load plates with dimensions of 1.5 × 0.75 × 0.14 m were used.
The load increment system included two anchor cables with a design load-bearing capacity of 1000 kN. In addition, the test loads were controlled using 200-ton hydraulic jacks (TLP HHYG, 200150).
The boundary of the MSE wall model was fixed using steel sheet piles (Larsen IV) with dimensions of 400 × 170 × 15.5 mm. The steel sheet piles were driven to a depth of 2.8 m. The top of the wall was fixed using bracing beams on three sides. This steel wall system was considered to be a rigid boundary and prevented displacement to the sides and the rear of the MSE wall.

2.2. Construction and Instrumentation of the MSE Wall

The MSE walls were constructed from the bottom up. The foundation soil was compacted and a concrete slab 20 cm thick was installed. The steel sheet piles were driven to create a steel wall on three sides of the model. The concrete facing panels, backfill soil that was 15 cm thick, and the steel reinforcement layers were installed in the correct order with full instrumentation. Finally, the loading system was constructed using a concrete slab, steel frame, and anchor cables.
Figure 5 illustrates the layout of the model construction on the site before applying the test loads. The MSE wall was fully instrumented to observe the stress and strain distribution along the longitudinal reinforcement bars, the failure surface within the reinforced soil mass, the lateral displacement of the concrete wall facing, and the deformation of the boundary steel sheet wall.
The strain gauges (NIE-SG-CFA; 120–5 cm long with 6 coils) were manufactured in India and were equipped to measure deformations in the reinforcement and backfill material. The maximum deformation on the sensor was 2% (6 mm). These strain gauges were bonded to the steel reinforcement bars at distances of 15, 50, 60, 95, 105, 140, 150, and 185 cm from the facing panel.
The lateral displacement of the steel sheet wall system, the anchor cables, and the wall panels were monitored using Linear Variable Differential Transformers (LVDTs) and WYDC, with signal reading provided by a TDS 303 data logger from Japan. LVDTs were installed at the top of concrete panels 2, 3, and 4, as shown in Figure 5a.
Vibrating-wire earth pressure cells (model 1910), manufactured by ACE Instrument in South Korea, were installed to measure the vertical and horizontal earth pressure at the top and the toe of the MSE wall. A Geokon 403 signal reader from the United States was used to read the signals from the VW earth pressure cell device during the testing process.
Temperature measurements within the wall were obtained using a metal thermometer with a range of up to 100 °C (used to calibrate readings from the resistive sensors and foundation surface pressure cell).
All instruments were calibrated before installation to ensure accurate measurements. In addition, the instruments were connected to a TDS 303 data logger and a Geokon 403 signal reader for the data collection.

3. Numerical Modelling

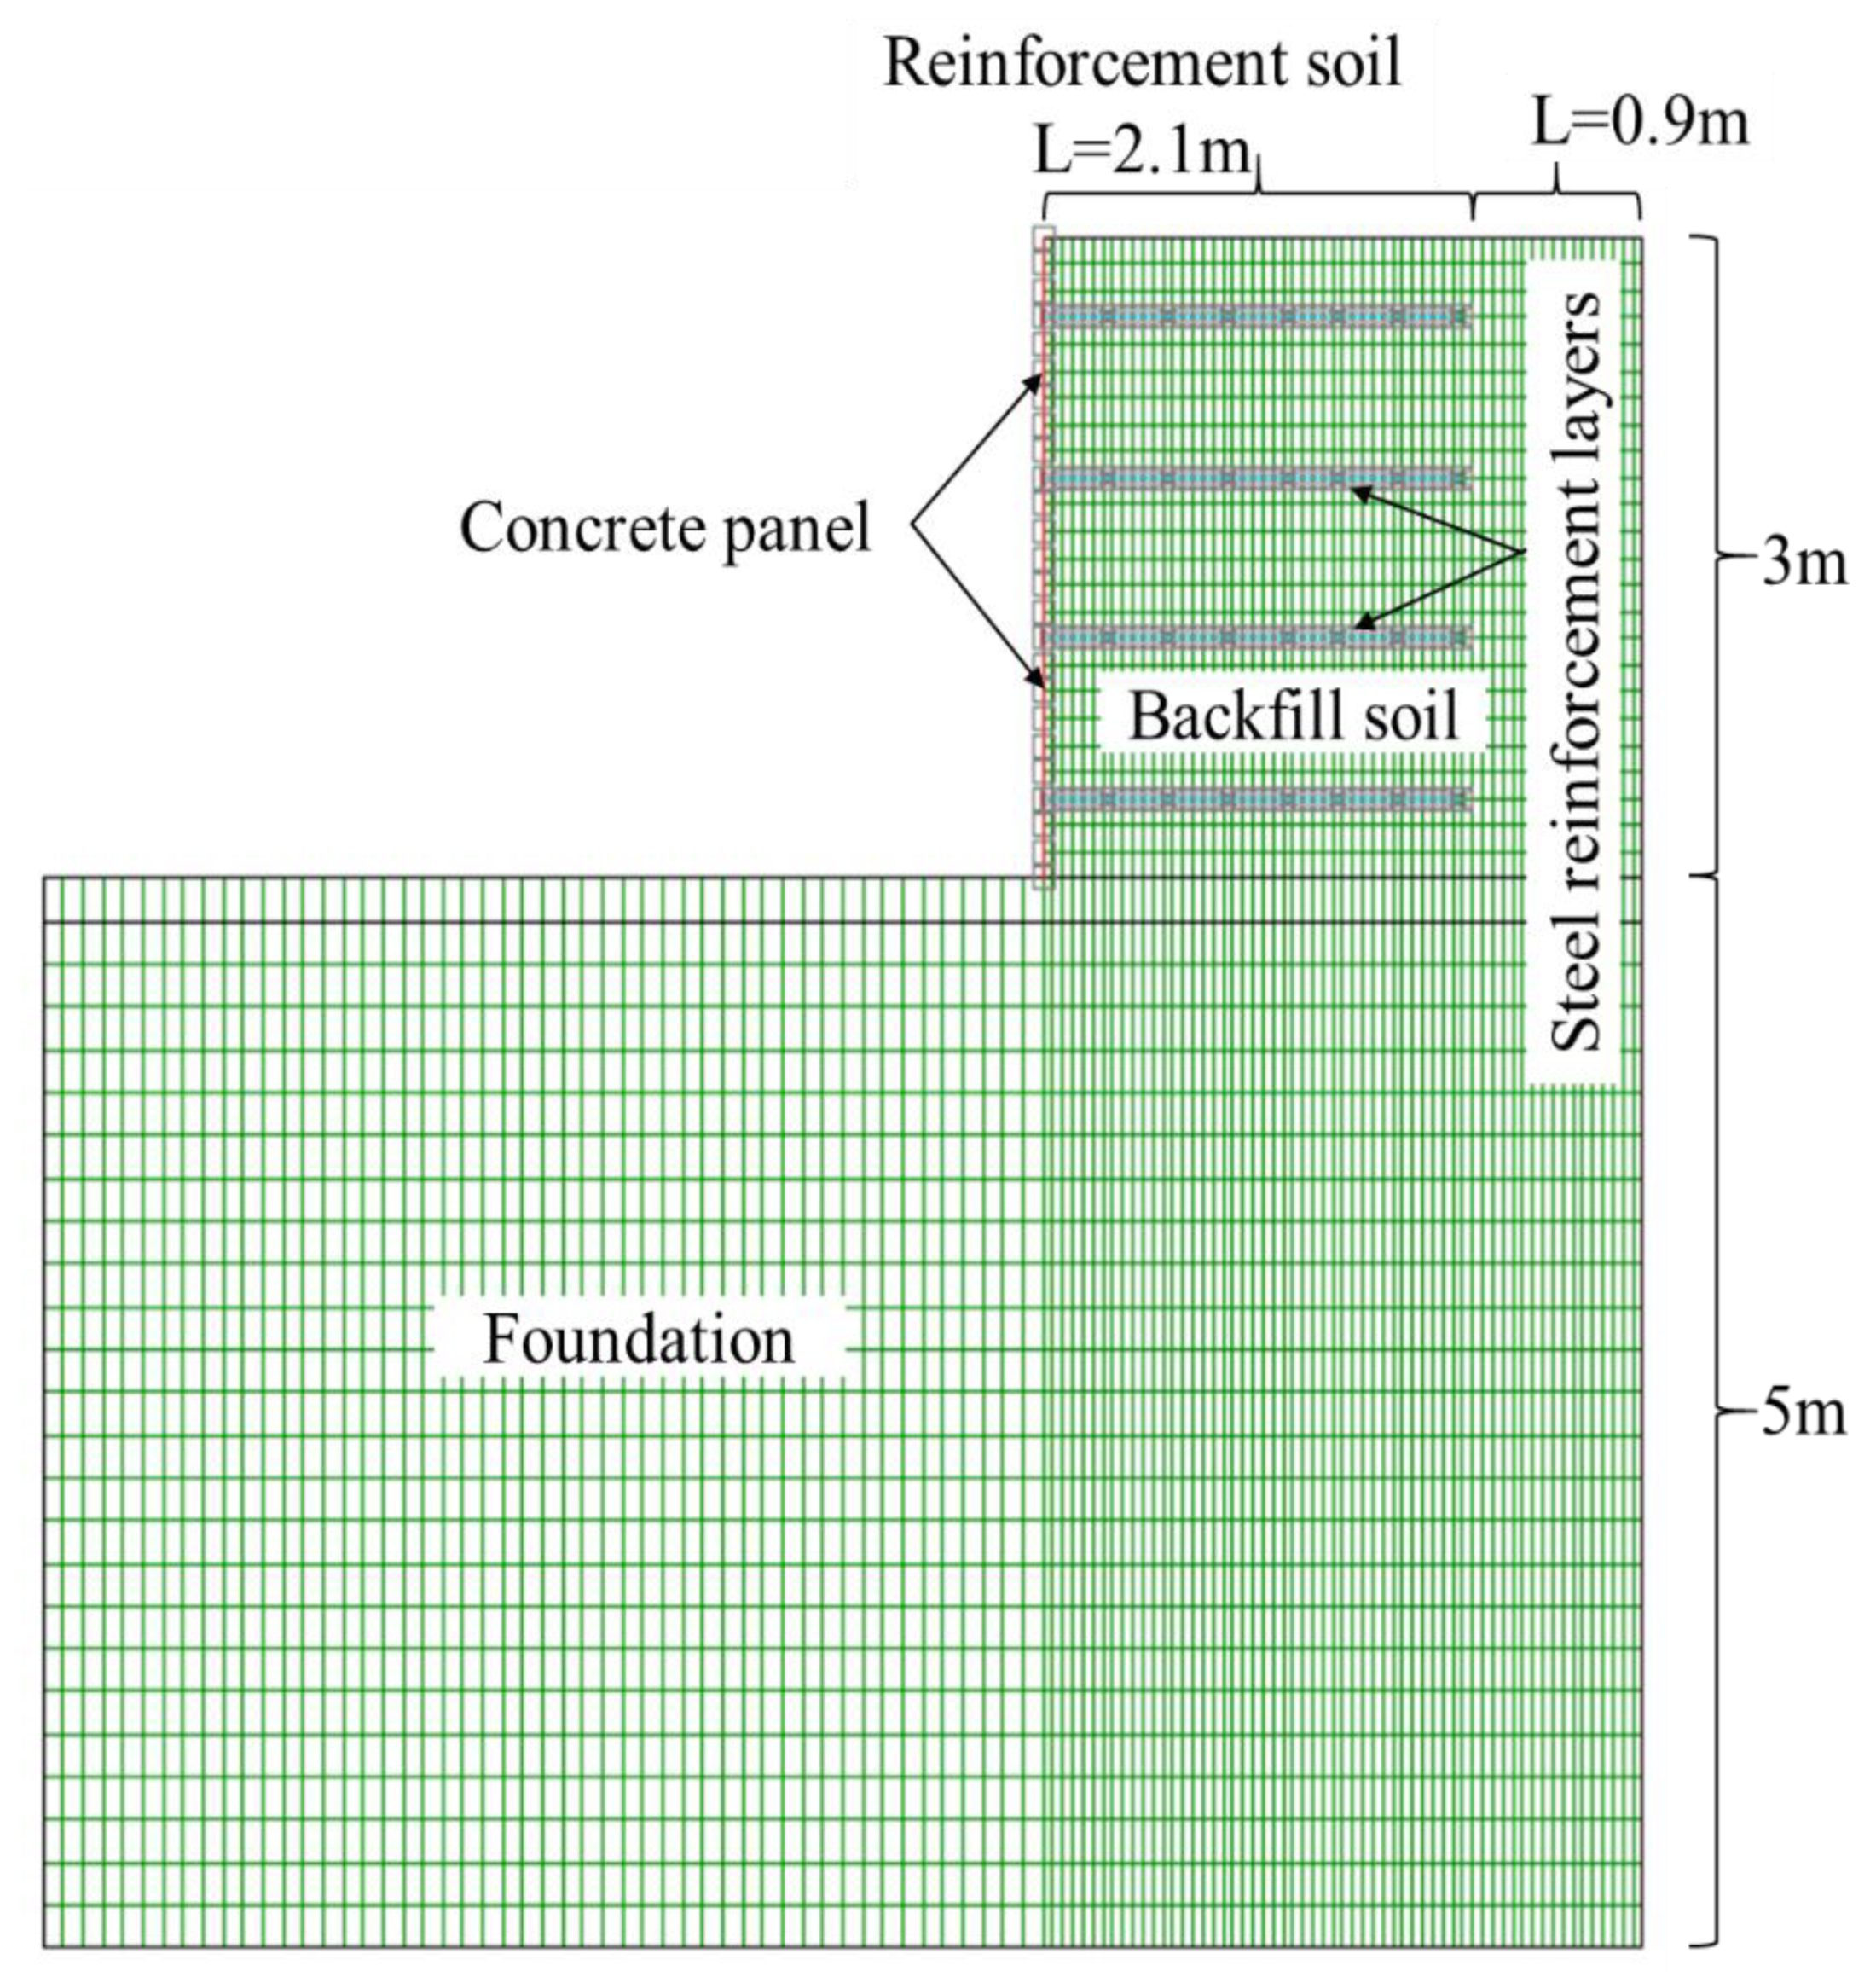
The finite difference program FLAC [30] was used to simulate the performance of an MSE wall with the same dimensions as the full-scale model described in Section 2. The wall’s height was 3 m and the length of the reinforcement bars was 2.1 m. The geometric details of the MSE wall in FLAC are shown in Figure 6.
Foundation soil was considered to be a rigid material with a high cohesion value (c = 55.1 MPa; φ = 51°) and was 5 m deep below the wall system. A linear–elastic model using the Mohr–Coulomb failure criterion was used to simulate the backfill soil and the foundation soil. The backfill soil properties were modeled based on the experimental results, as shown in Table 1. The concrete facing panels were simulated using beam elements and were modeled as elastic materials with the modulus E = 200 Gpa. The strip elements in FLAC were used to model a steel reinforcement grid with a tensile strength of 31,850 N/m and tensile stiffness of 20,000 kN/m. Table 3 illustrates the properties of the concrete facing panel, backfill soil, and foundation materials.
The interface between the backfill soil and concrete facing panel was modeled using the values suggested by Huang et al. [31] and Huang et al. [32]. In detail, the friction angle between the soil and concrete panel was 26°, the interface normal stiffness was 2.4 Mpa/m, and the shear stiffness was 2.4 Mpa/m.
The apparent friction coefficients for the steel reinforcement and backfill interfaces were calculated based on the suggestions of the current standards [8,12,13,33]:
  • If z > z0 = 6 m;
f* = tan φ
  • If z ≤ z0 = 6 m;
f* = f0*(1 − z/z0) + (z/z0)tan φ
f0* = 1.2 + log10(Cu);
where f* and f0* are the apparent friction coefficients for the steel reinforcement and backfill interfaces; Cu is the coefficient of uniformity of the backfill soil; z is the depth of the reinforcement layers from the top of the wall, where z0 = 6 m; and φ is the friction angle of the backfill soil. Table 4 illustrates the properties of the backfill–reinforcement interactions and facing-panel–backfill interactions.

4. Results and Discussion

4.1. Full-Scale Model Results

4.1.1. MSE Wall Loading

The fully instrumented model was completed and incrementally loaded until failure occurred in the MSE wall structure (either fast displacement occurred or a steel bar ruptured). For each interval, the load increment was maintained for 30 min. The total dead loads for the steel beams and concrete slab were both 12 kN/m2. The design load of the model was 20 kN/m2 [12]. The maximum load (when the steel reinforcement bars were ruptured) was 302 kN/m2, approximately 15 times greater than the normal traffic loading of 20 kN/m2. The stress, strain, and displacement of the wall, the longitudinal reinforcement bars, and the reinforced soil mass were recorded at load levels of 12, 20, 50, 75, 100, 150, 200, 250, 275, 300, and 302 kN/m2.

4.1.2. Tensile Forces in the Reinforcement Bars

The tensile force F was calculated using Equation (4):
F = Δ l · E · A L
where Δl is the measured deformation on the reinforcement bars; E is the elastic modulus of the reinforcement material, where E = 210,000 Mpa for the CB300V steel; A is the cross-sectional area of the reinforcement bars, with A = 78.5 mm2; and L is the length of the longitudinal reinforcement bars, with L = 2.1 m.
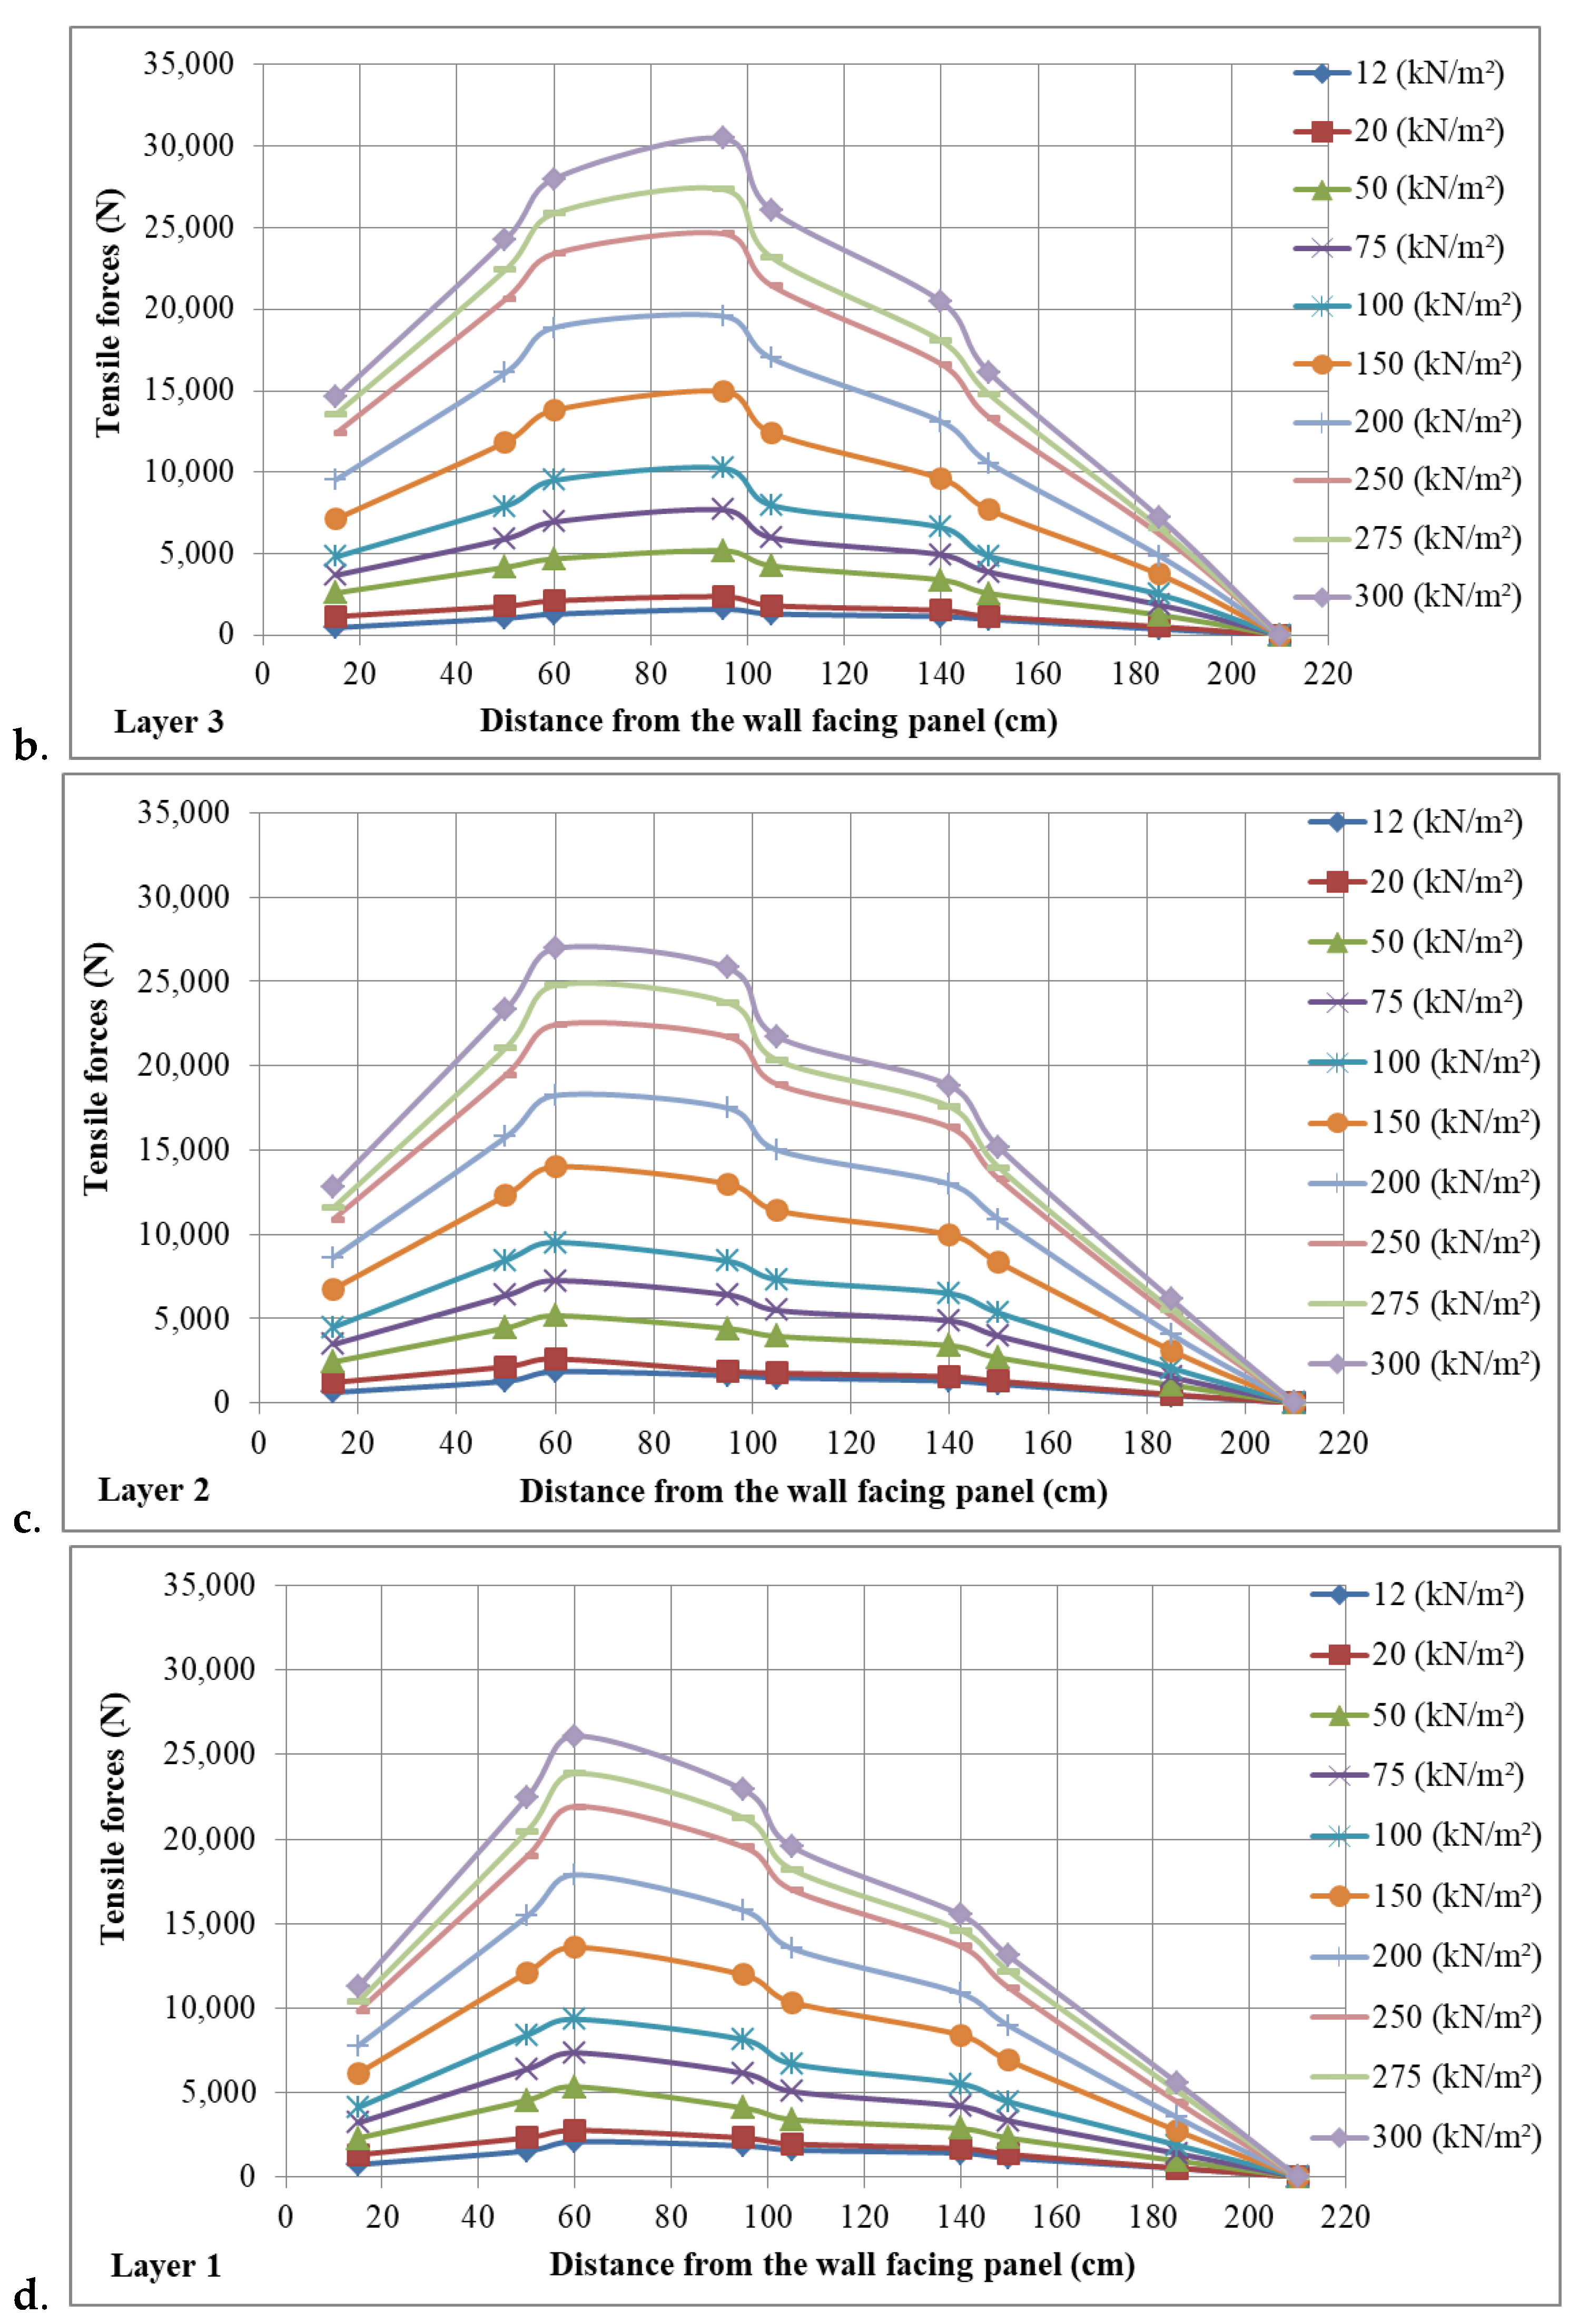
The distribution of tensile forces in each reinforcement layer is shown in Figure 7. It can be seen that when the test load increased from 12 kN/m2 to 302 kN/m2, the tensile forces in the reinforcement bars increased and created a sliding surface within the reinforced soil.
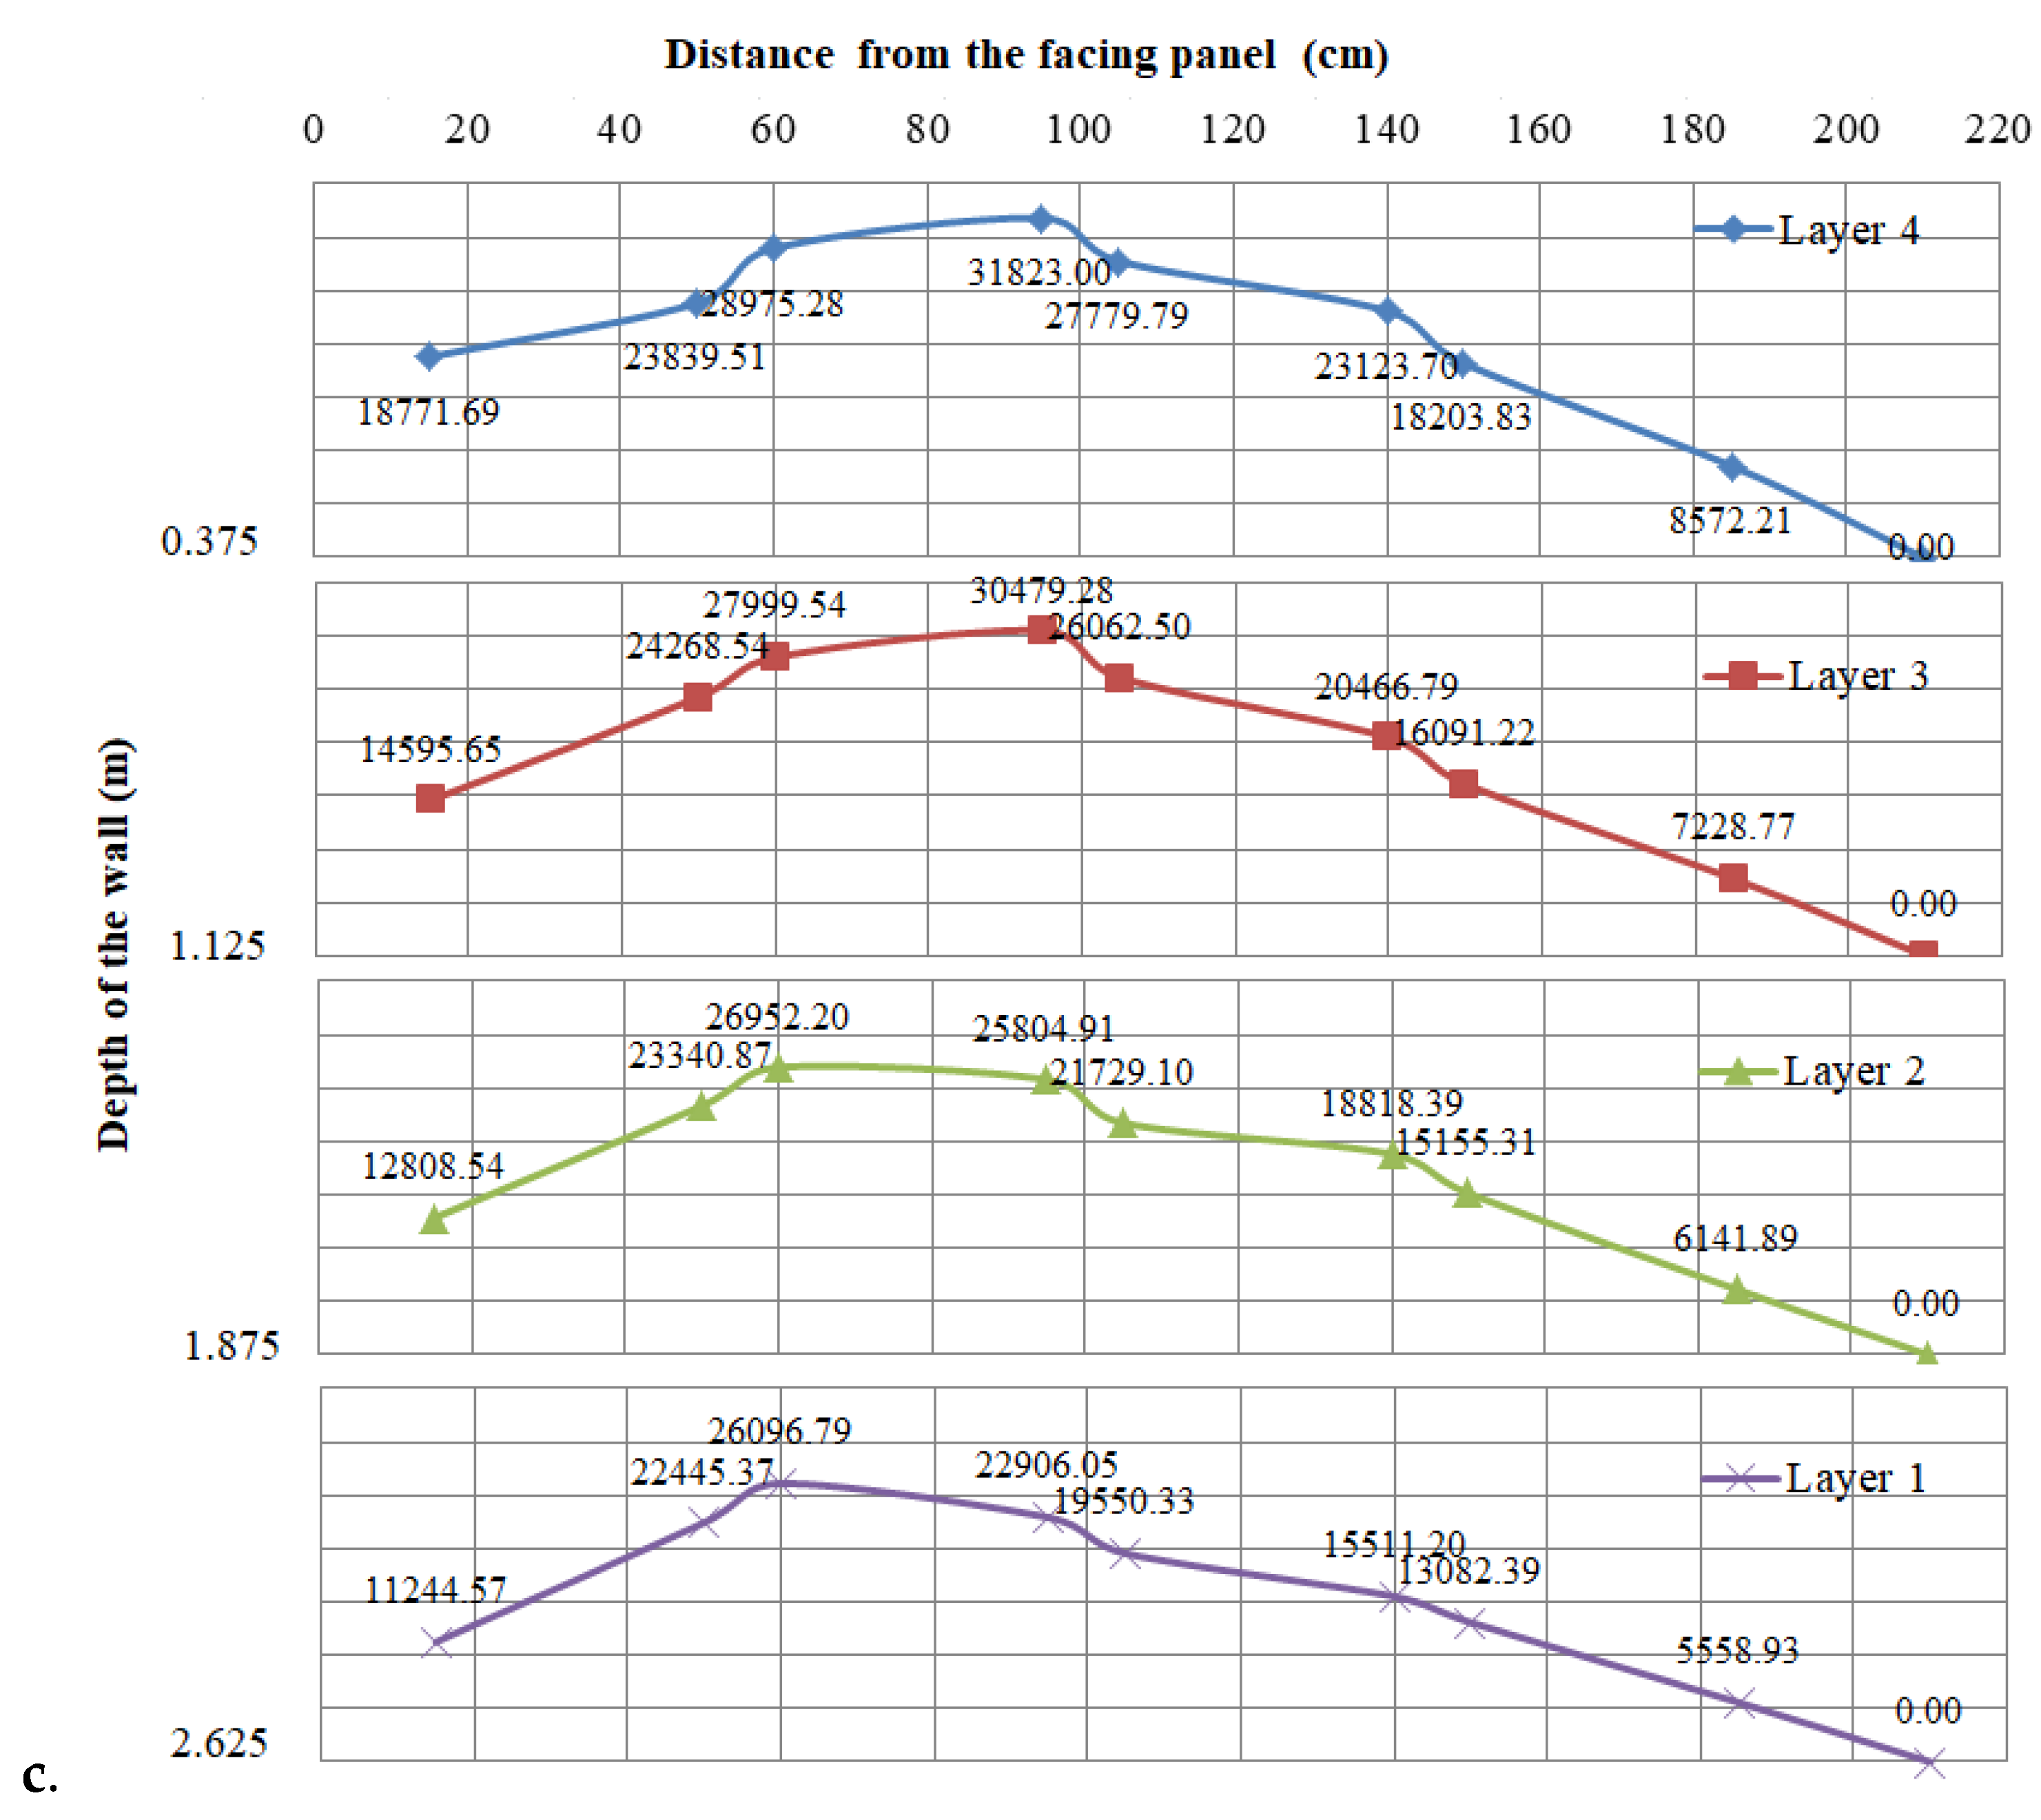
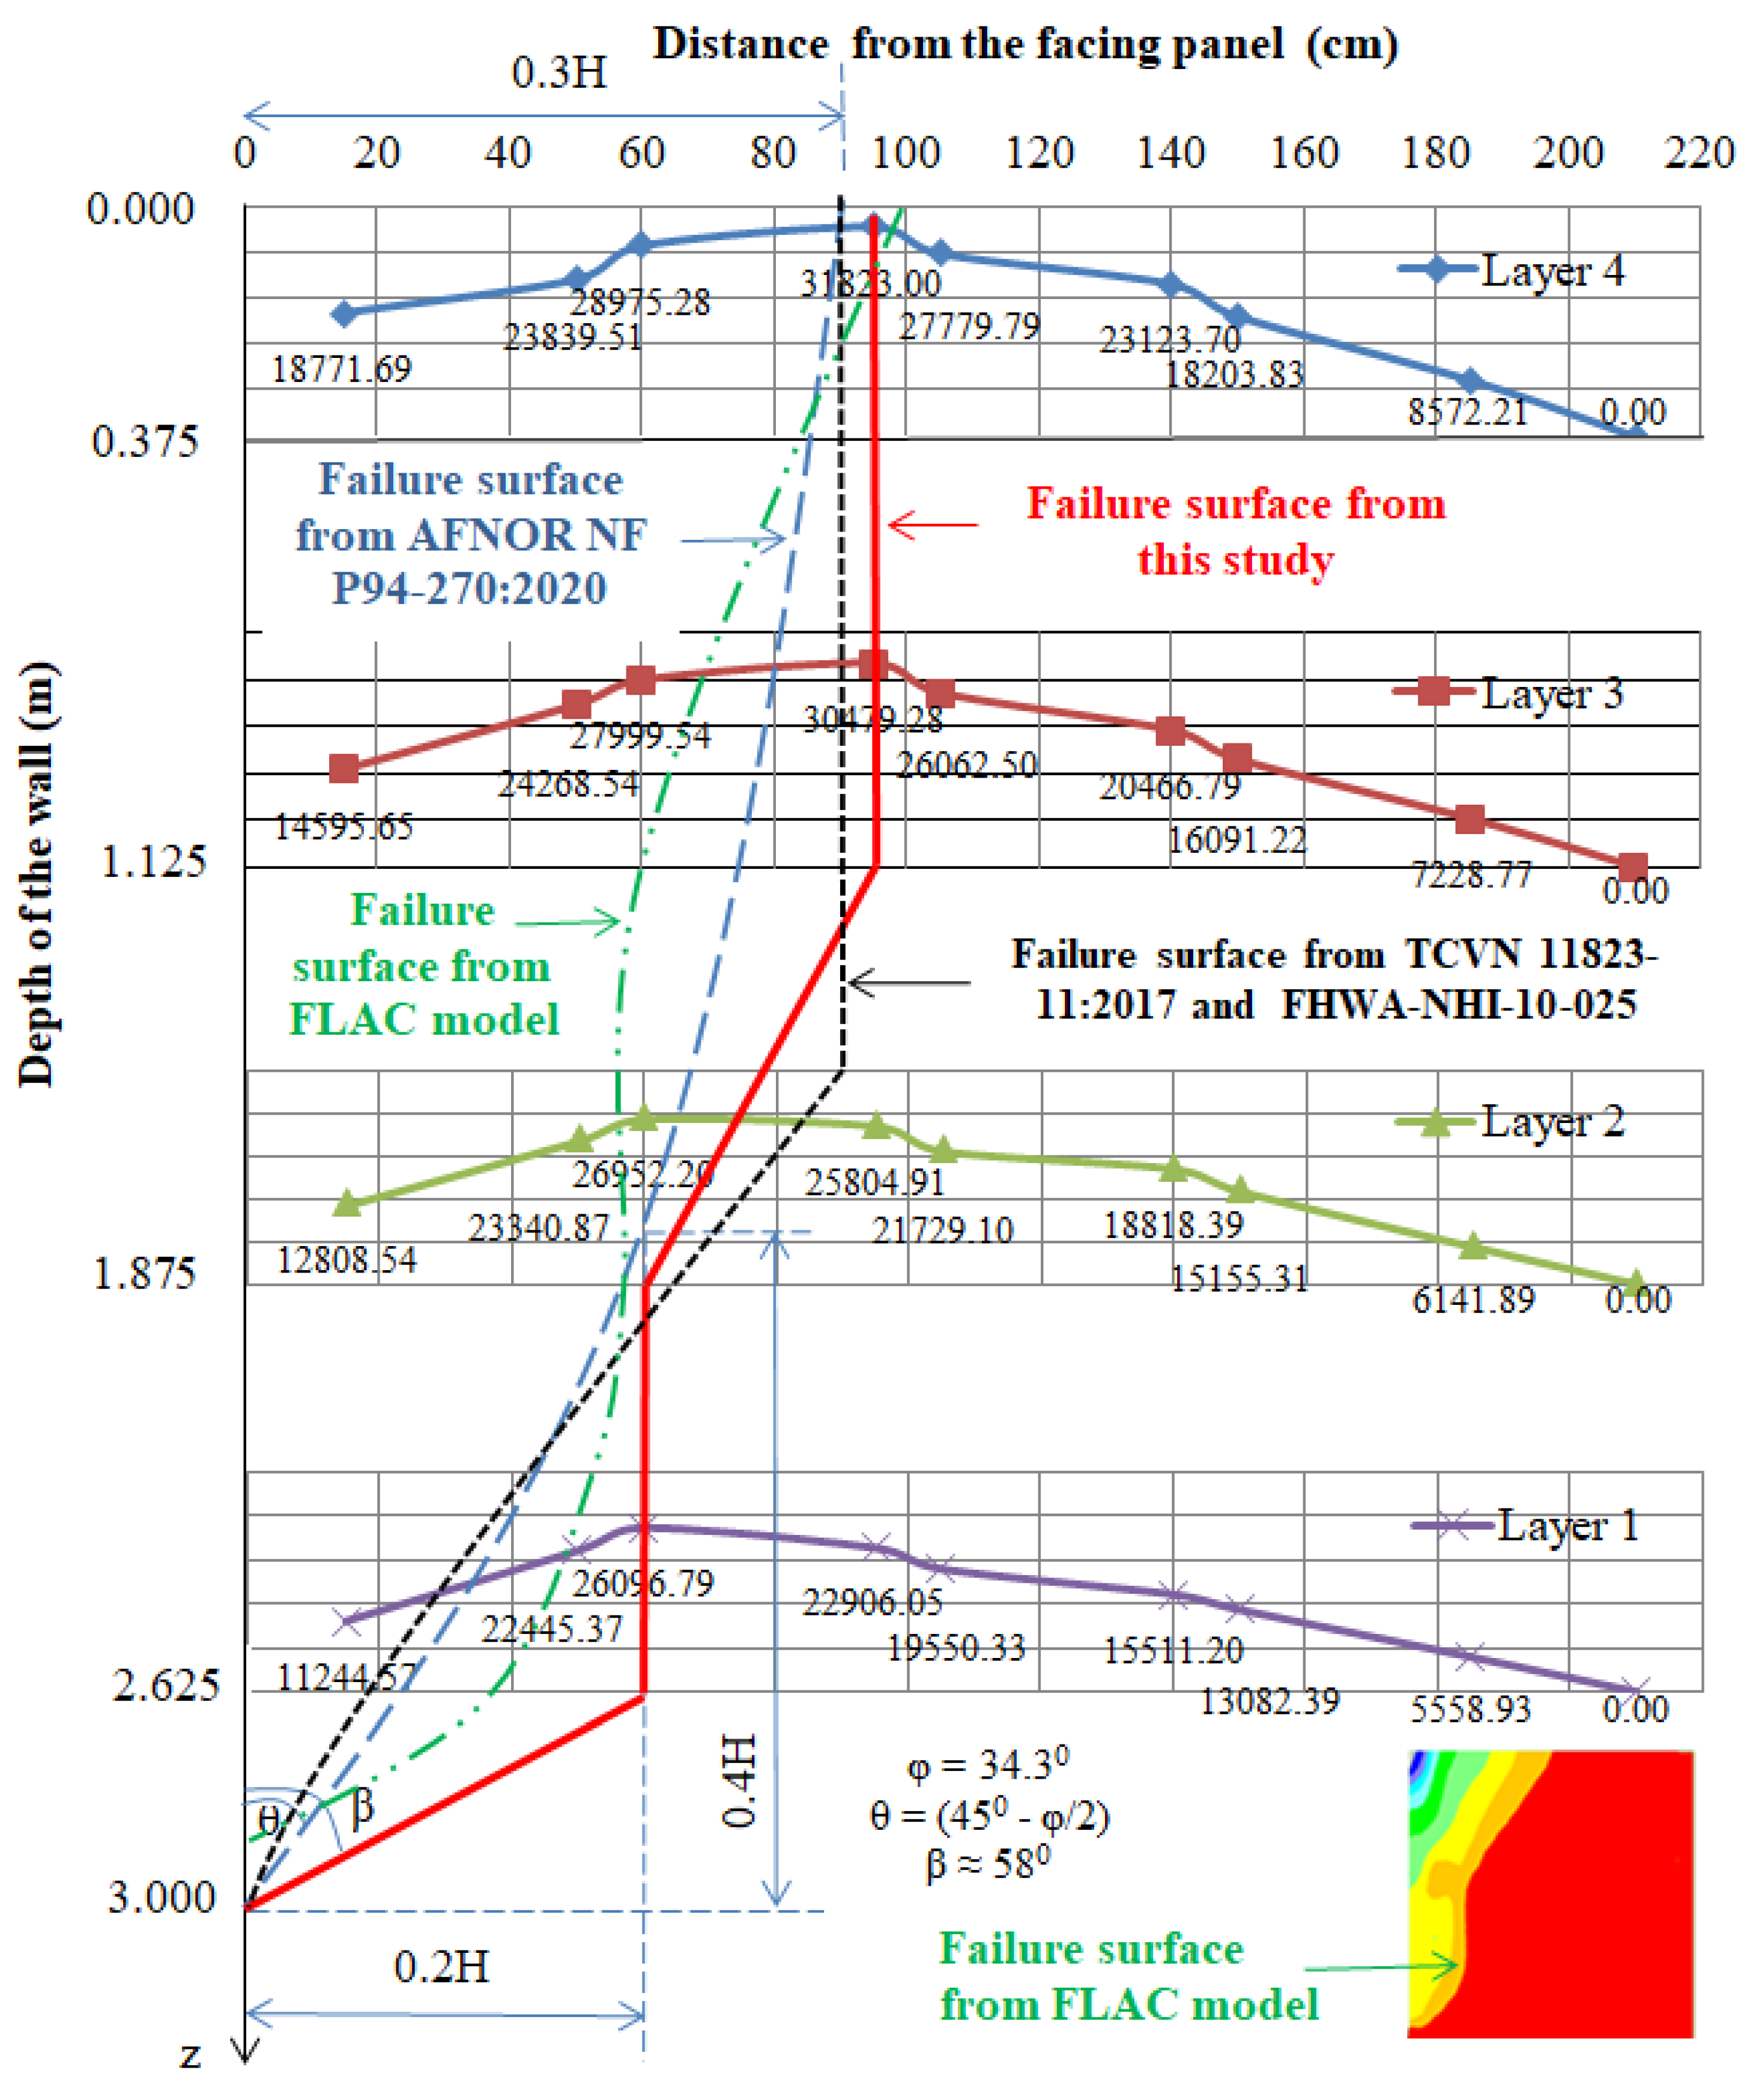
The maximum tensile force values were found 95 cm further away from the facing panel in reinforcement layers 3 and 4, and 60 cm (near the facing panel) in reinforcement layers 2 and 1 (the reinforcement layers in deeper positions).
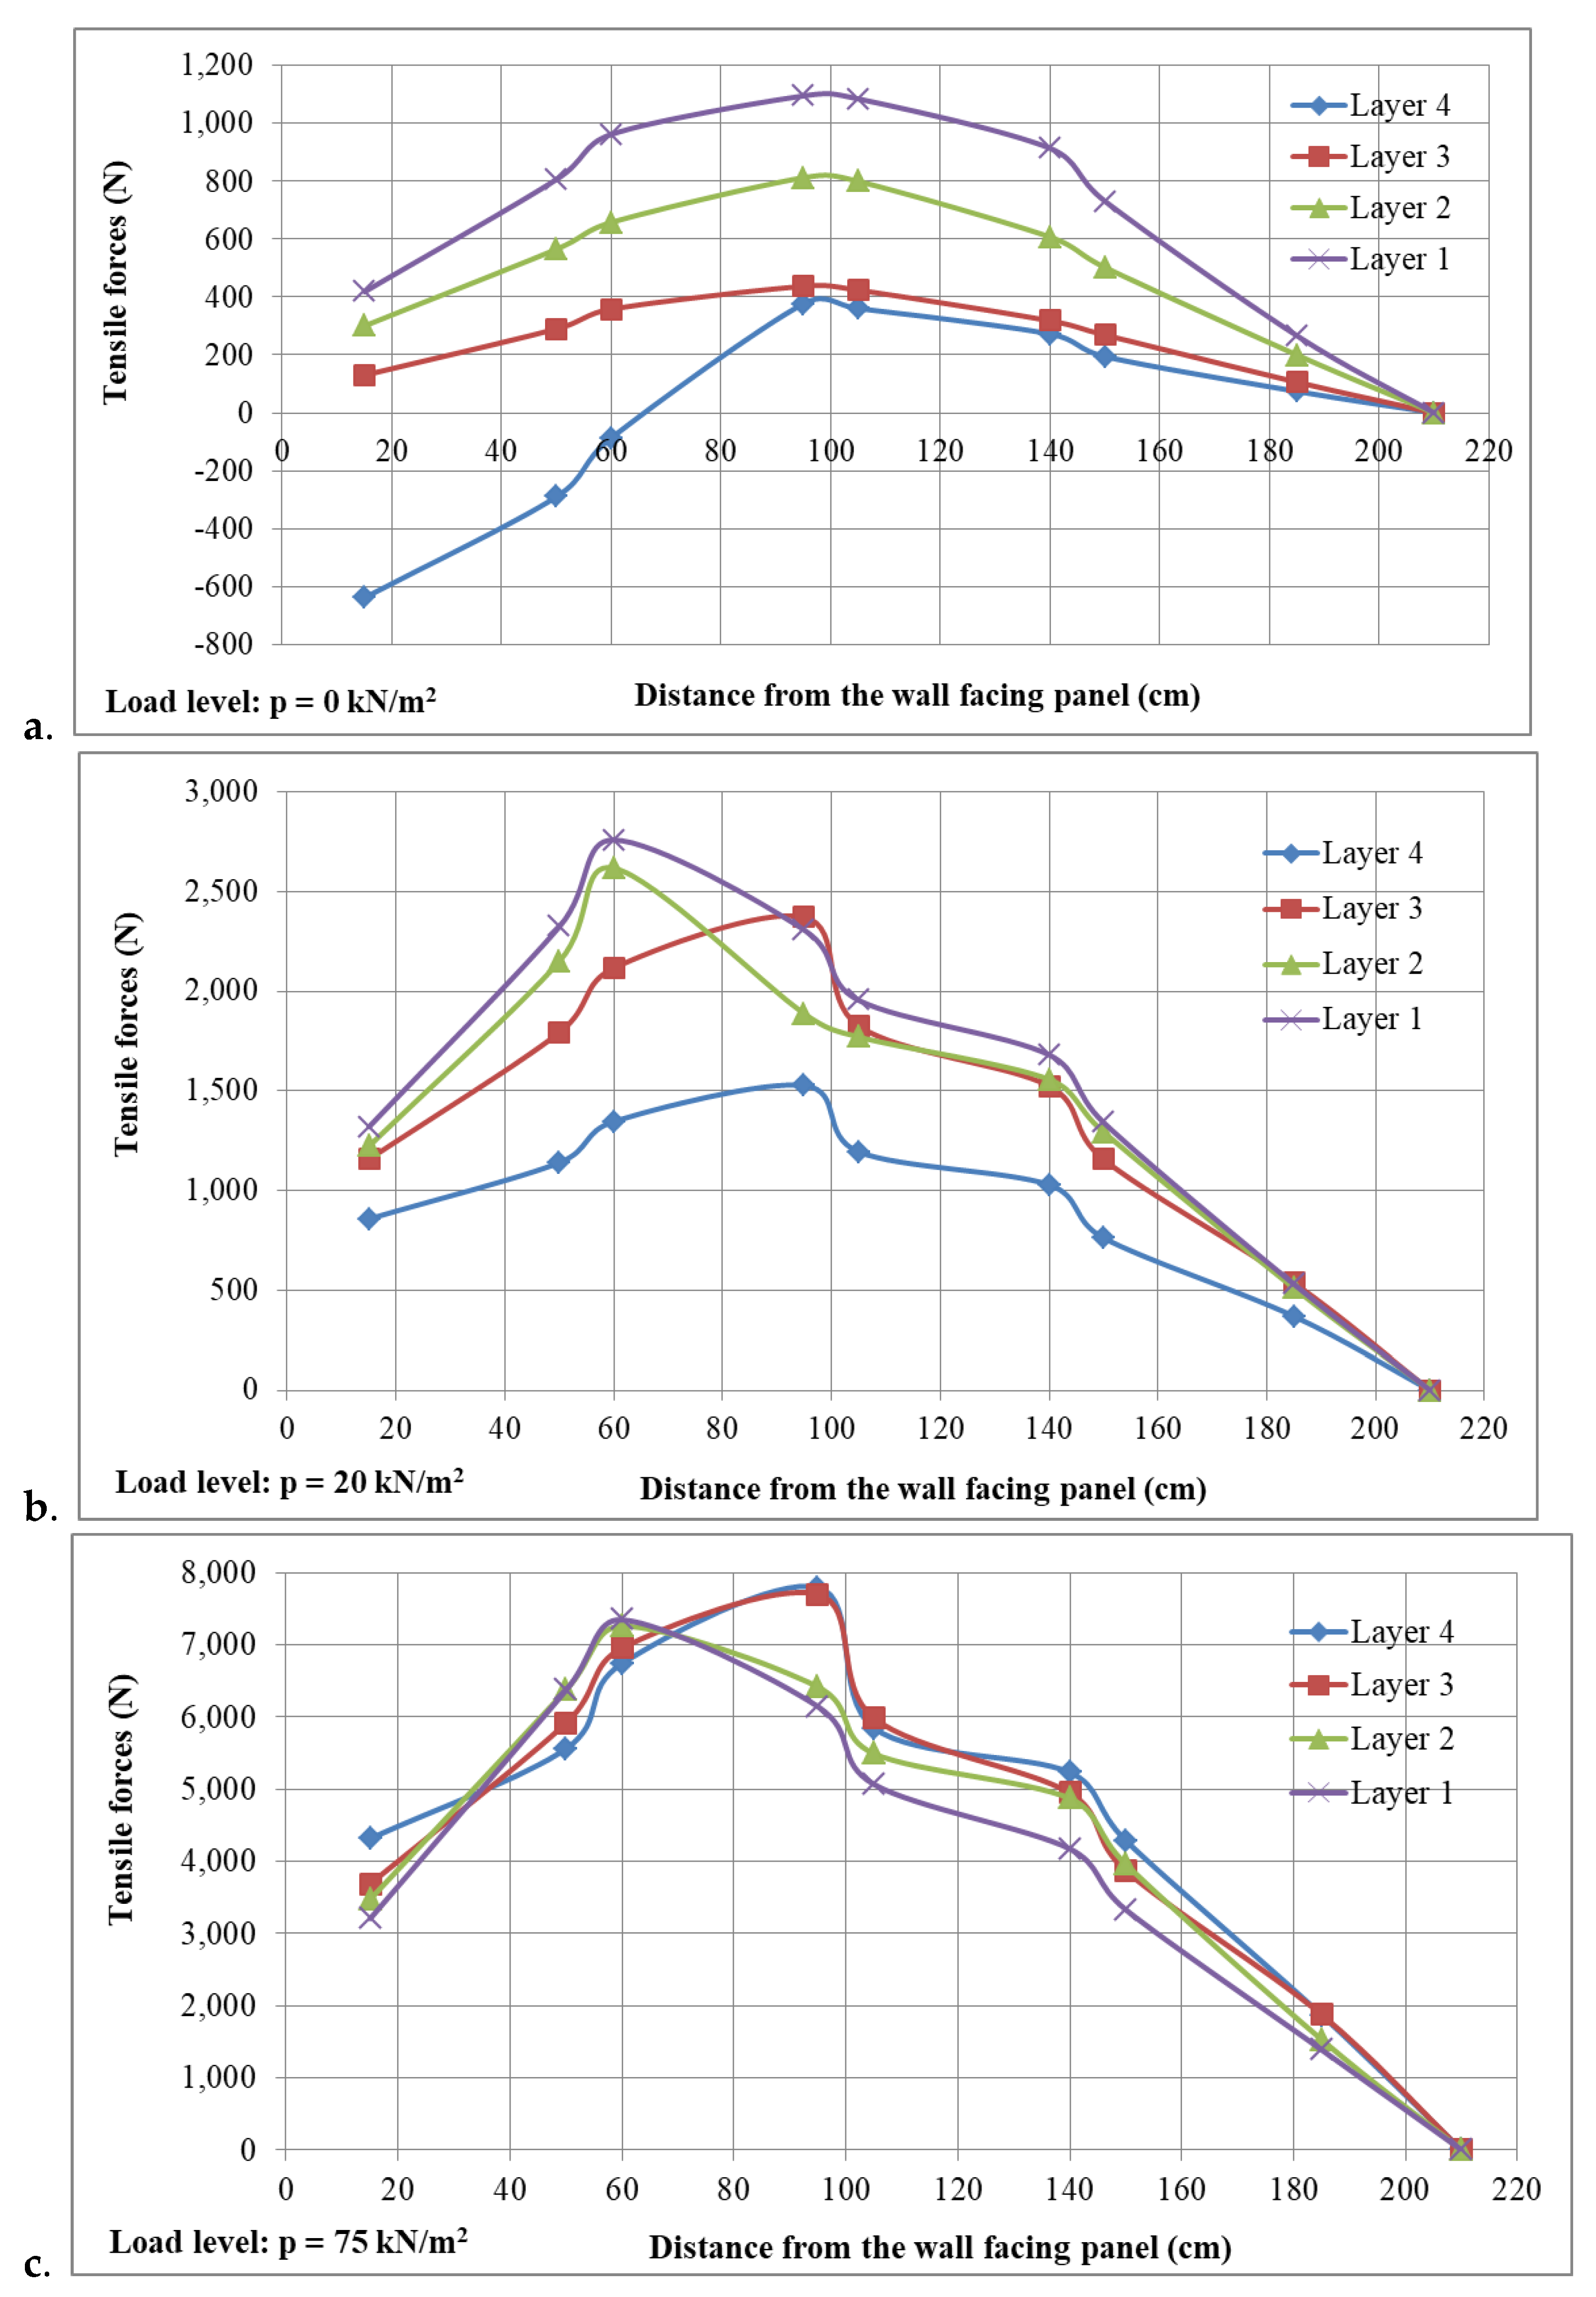
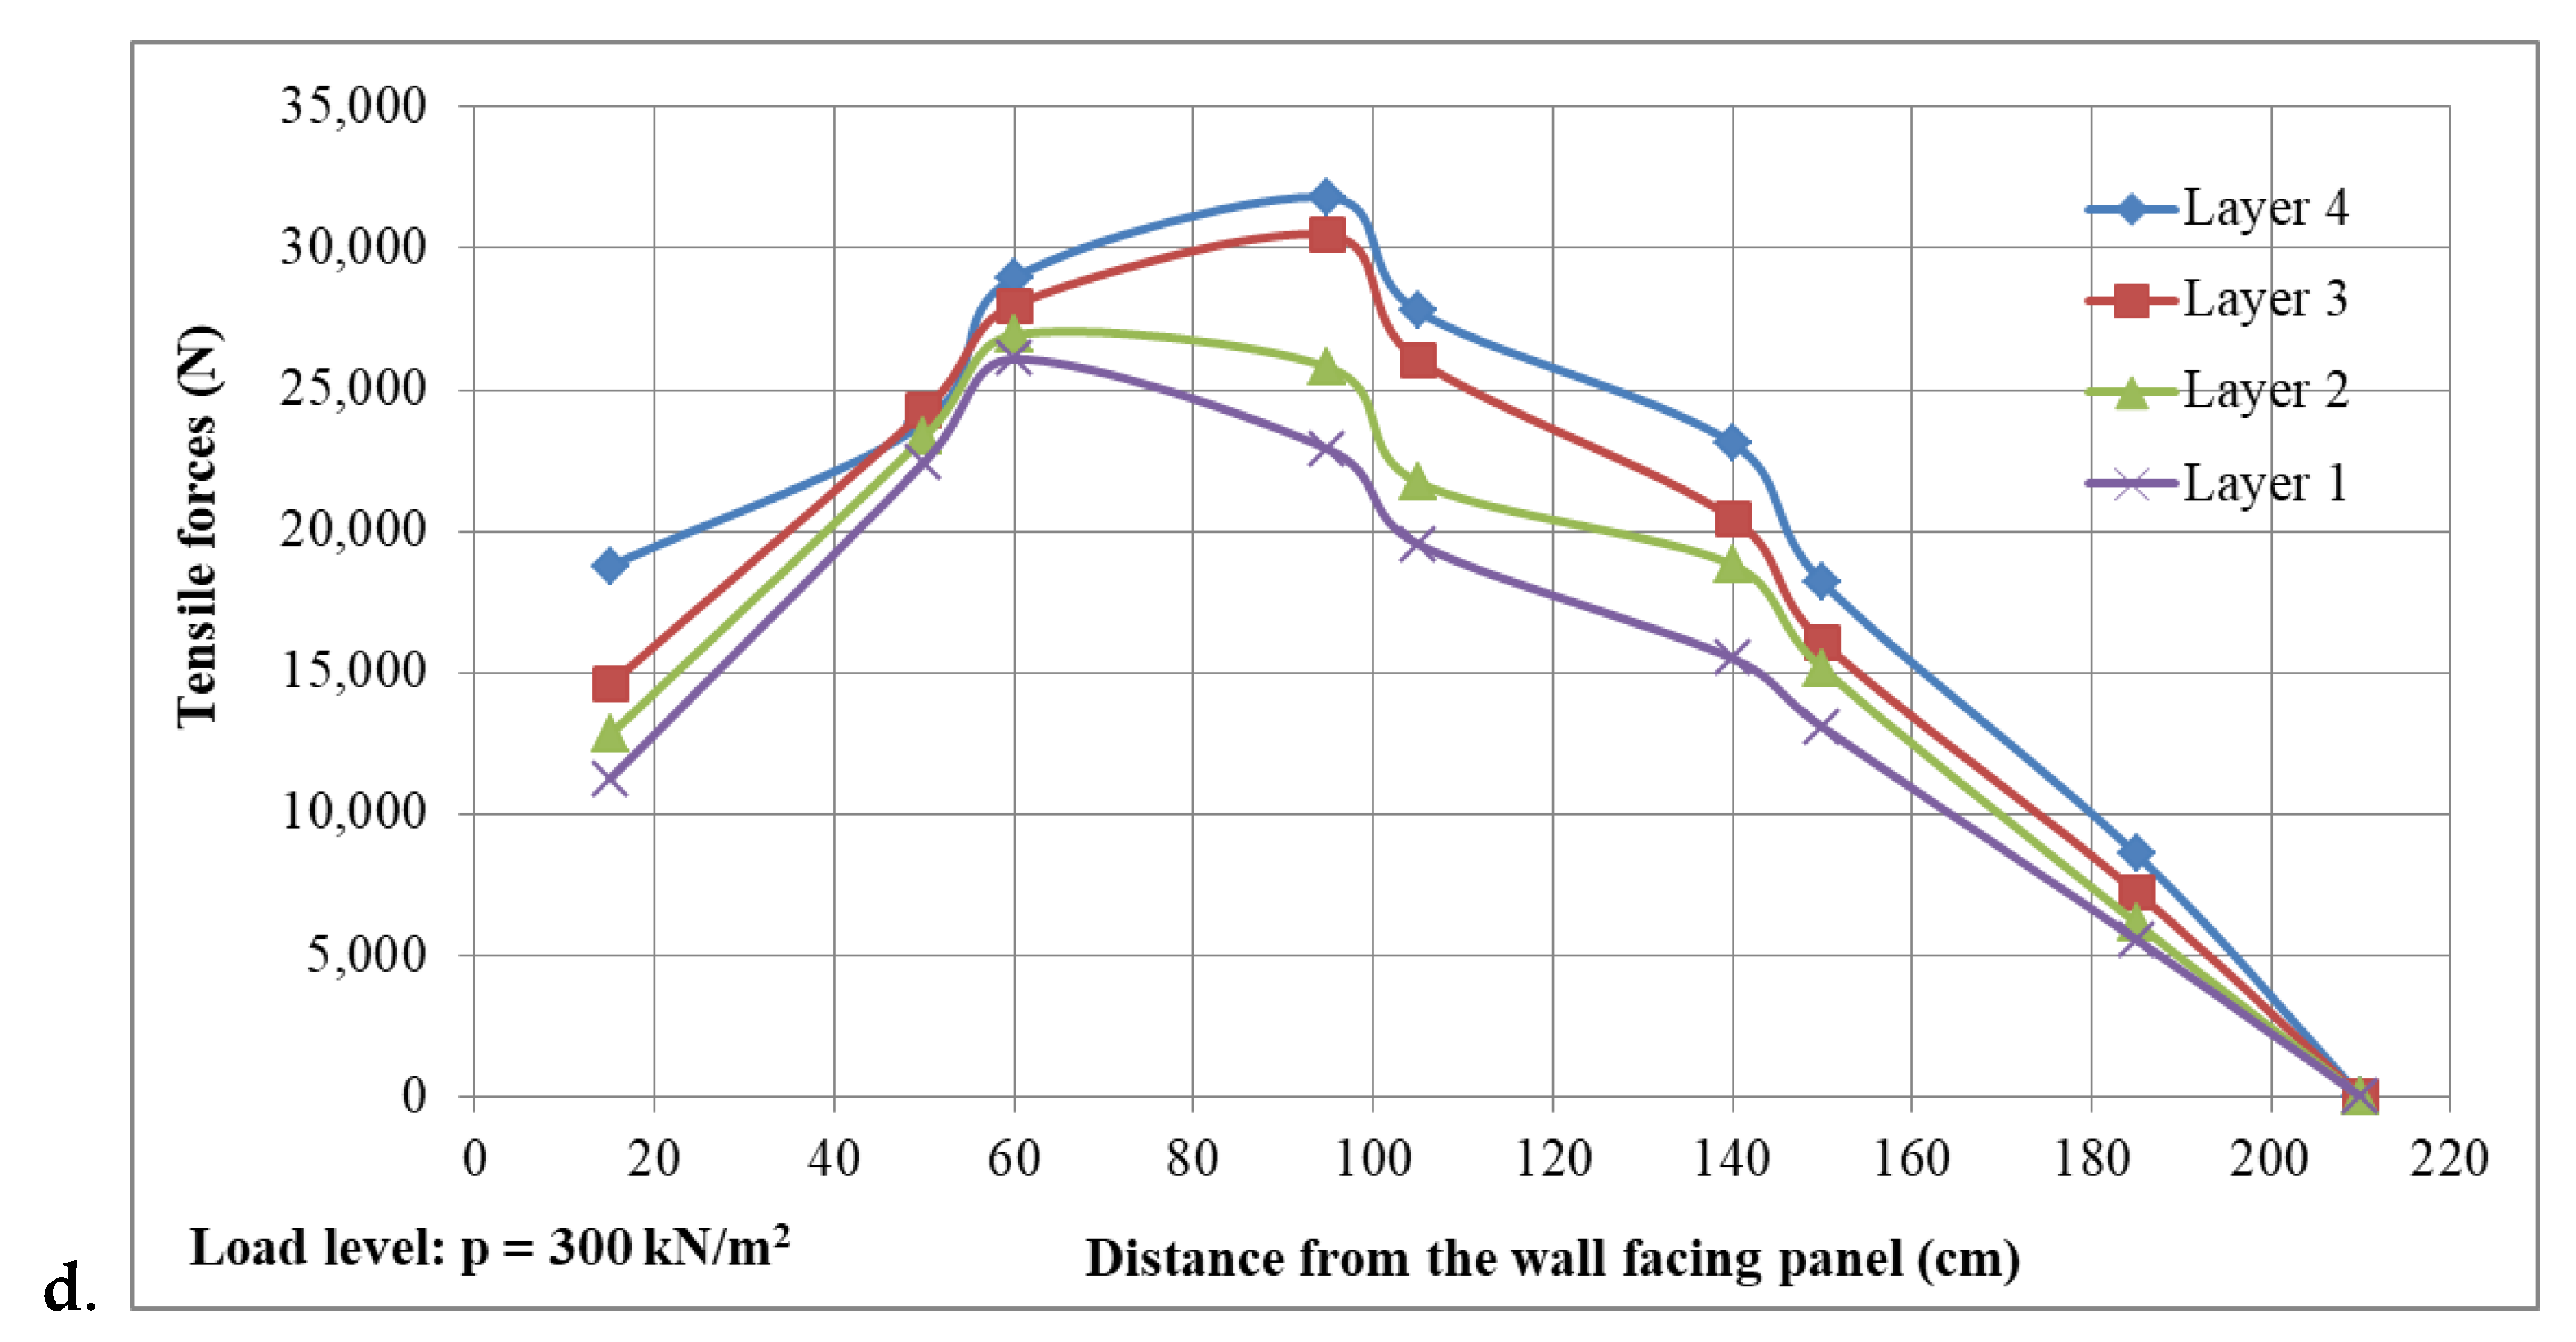
Figure 8 indicates that when the test load was lower than the design load (<20 kN/m2), the tensile forces in the deeper reinforcement layers were greater than the upper ones. However, when the test load was higher than 75 kN/m2, the tensile forces in reinforcement layers 3 and 4 were higher than layers 1 and 2. It is a fact that at a low load level, the total load (including the earth pressure, dead loads, and surcharge load) increases with the depth of the wall. Thus, the deeper reinforcement layers absorbed a greater load than the upper layers. Conversely, when the load test was high, reinforcement layer 4 achieved the highest tensile forces and this value decreased along the wall depth. In addition, the increasing tensile force distribution when the surcharge load increased indicated that the failure surface expanded in the passive area.
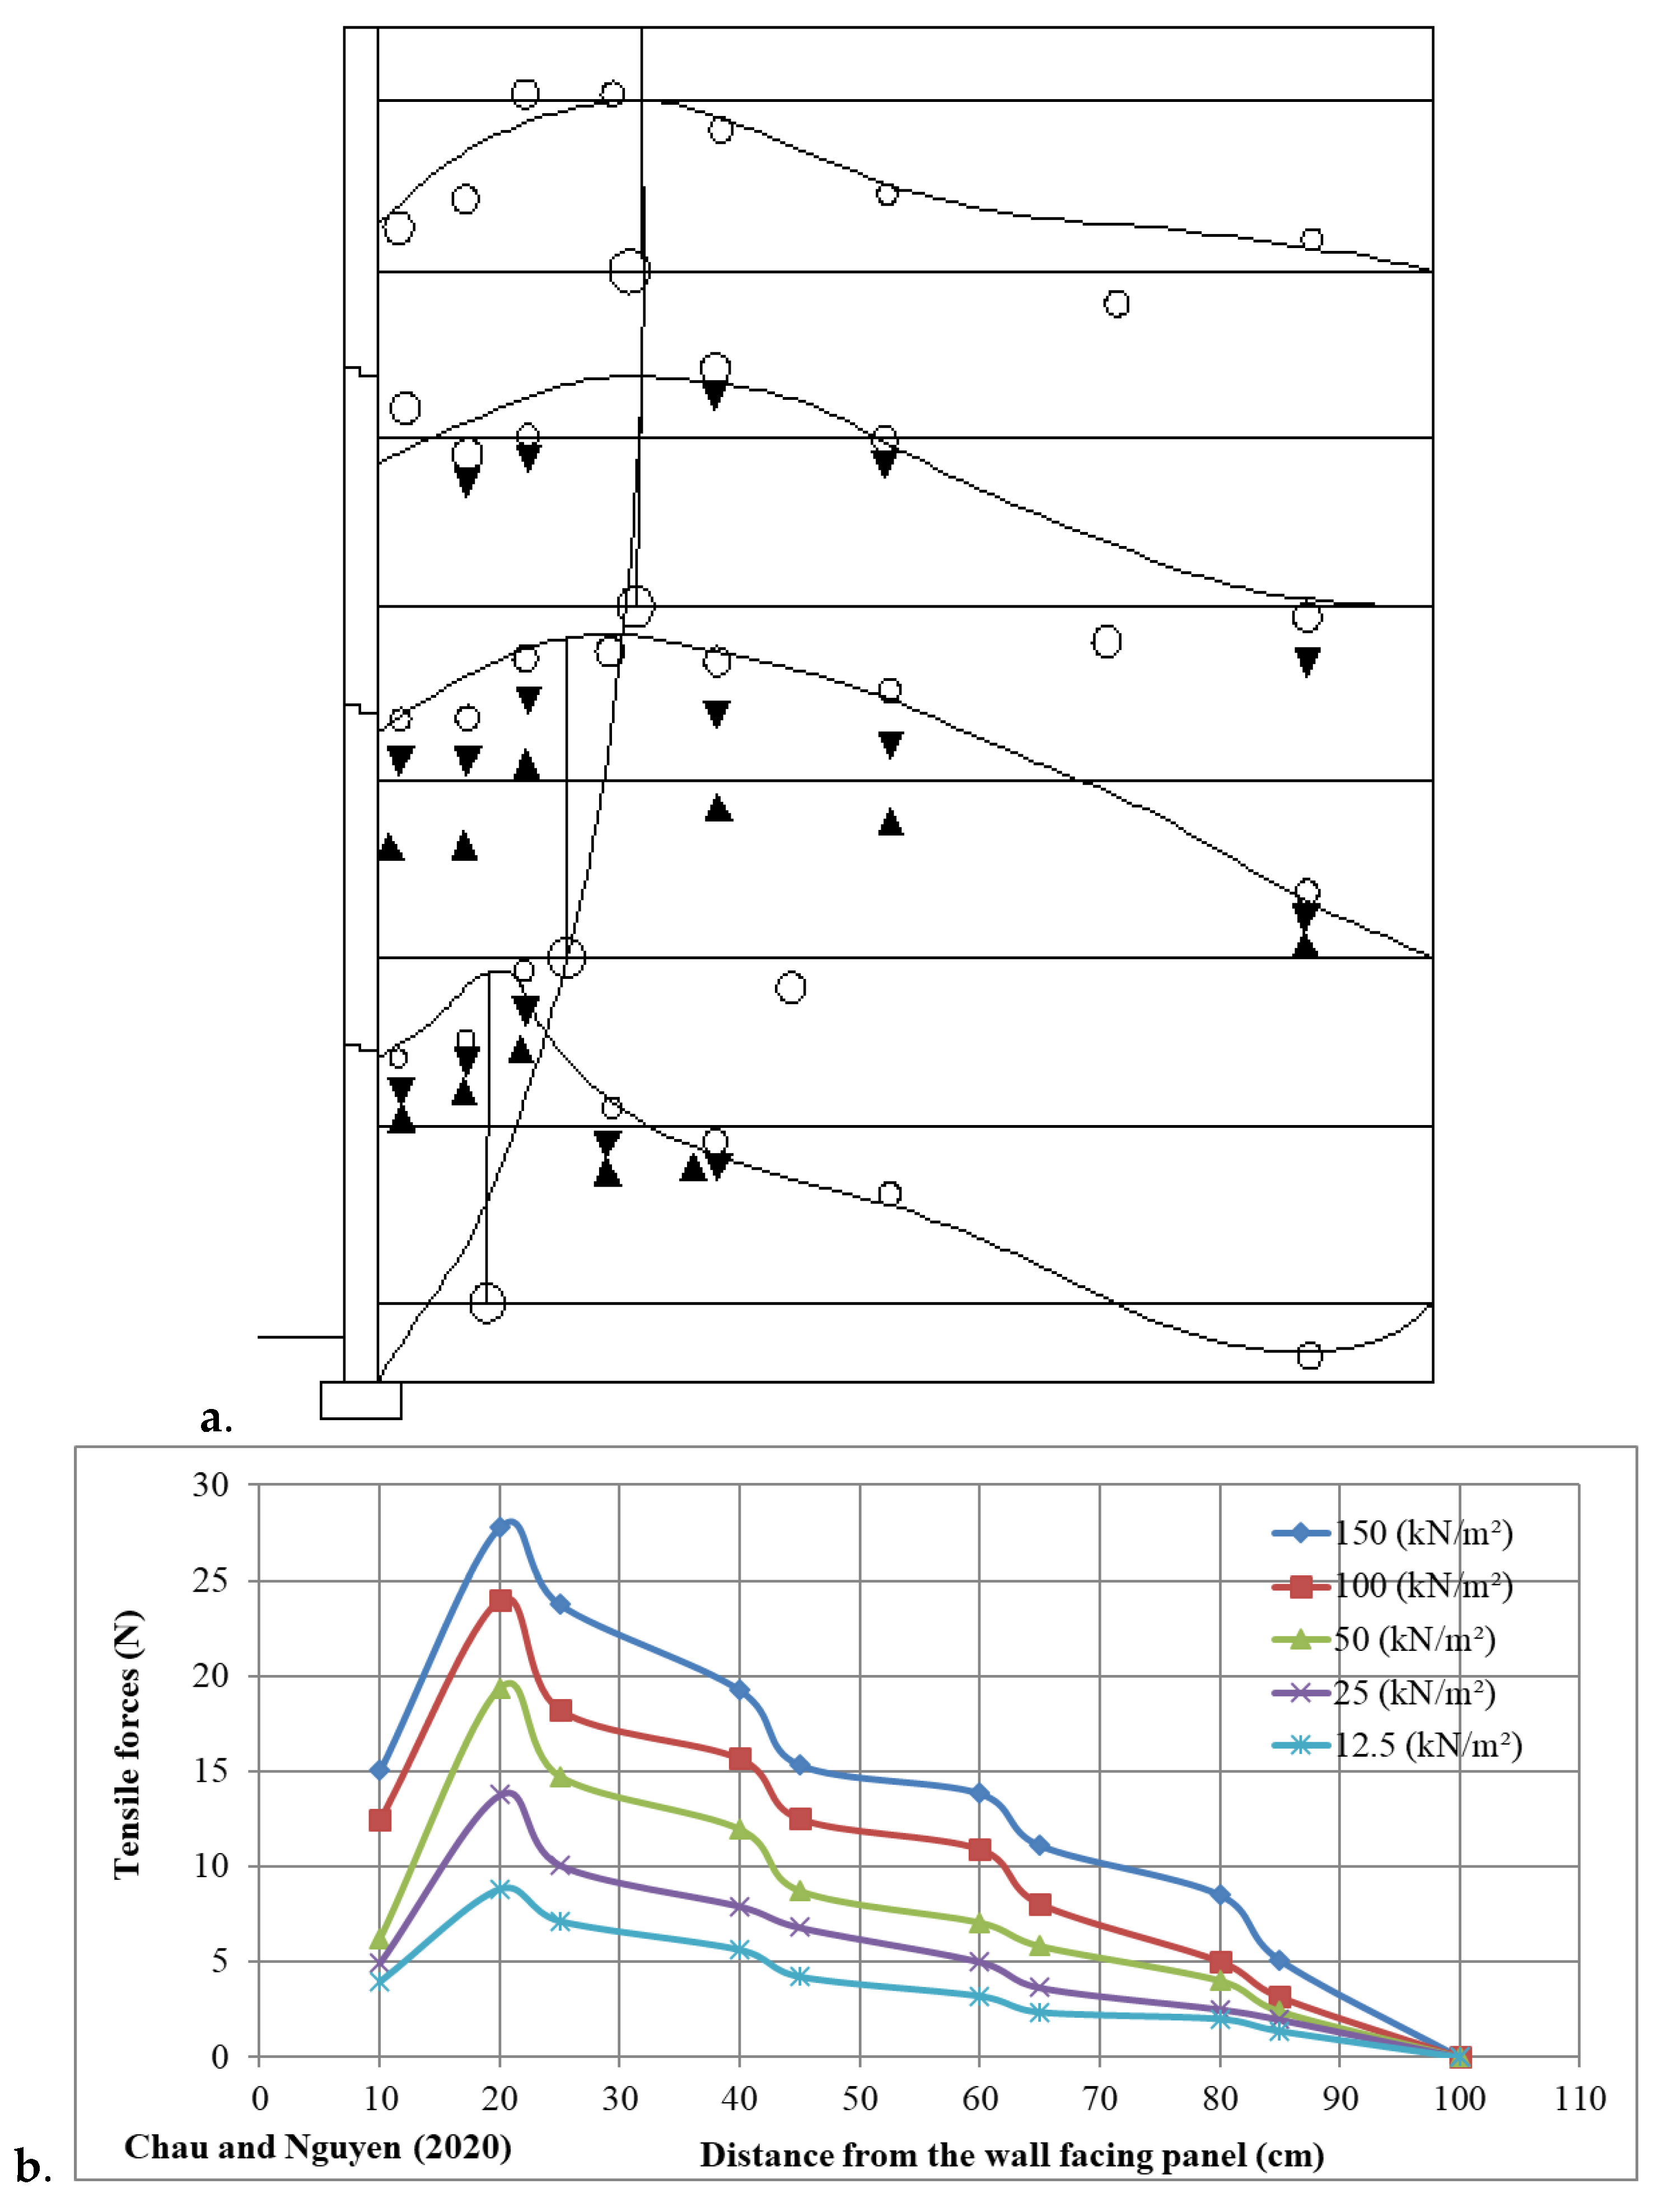
The distribution of the tensile force in the reinforcement layers from this study was similar to the reports of Schlosser [33], Wichter et al. [34], Murray and Farrar [7], Chau et al. [35], and Chau and Nguyen [28] as well as design procedures [12,13,14]. However, the steel ribs included in the reinforcement grids caused a step in the tensile force distribution curve in front of and behind the ribs. This result was reasonable and similar to previous research results [36,37]. It indicated that the experimental results from this full-scale model were reliable and could be used in practice.

4.1.3. Failure Load

As presented in Figure 9, the maximum tensile force in the reinforcement bars was 31,823 N at a test load of 300 kN/m2. When the load level was 302 kN/m2, the maximum tensile force in the reinforcement layers was 31,881 N, which was higher than the ultimate tensile force of 31,850 N. Thus, at that moment, failure occurred in the MSE wall. The longitudinal steel bars suddenly ruptured at the drilled cross-sectional area where the tensile force reached its maximum value in the reinforcement bars.
The failure load was determined to be 302 kN/m2, which was 15 times greater than the design load. In terms of the load-bearing capacity, the MSE wall structure in the experimental model could resist very high surcharge loads. However, in terms of long-term serviceability, the selected steel bars would be appropriate for the structure durability during a service life of 100 years under a design load of 20 kN/m2 [3].
At a failure load level of 302 kN/m2, the failure surface in the reinforced soil could be determined by connecting the maximum tensile force points in each reinforcement layer. Figure 10 demonstrates that the failure surface in this study was similar to the Rankine theory [2]. In detail, in the first half of the wall, the failure surface started from the top of the wall and further away from the wall face at approximately 0.3 H. In deeper positions, the failure surface stopped at the toe of the wall (wall base). This failure pattern was similar to the reports of Chang et al. [2], Lee et al. [8], Murray and Farrar [7], Schlosser and Guilloux [36], and Murray [11]. However, the failure surface at the toe of the wall was far from the wall facing (0.2 H). Murray and Farrar [7] explained that friction between the rigid foundation of an MSE wall and the soil reinforcement affects the failure surface of the reinforced soil mass.
Table 5 illustrates the length of the reinforcement bars in the failure zone La in this study and the values calculated from the standards from AFNOR [12]. The La values in reinforcement layers 4, 3, and 2 were close to the theoretically estimated values. The failure surface of the lowest layer was slightly different due to the strain gauge locations.
In summary, the failure surface in this full-scale MSE model using a cohesive backfill soil and self-fabricated steel reinforcement was in good agreement with other studies as well as most of the current standards [12,13,14,37]. Hence, a self-fabricated steel reinforcement and locally available backfill soil could be used as the reinforcement material for MSE walls applied in the conditions of Vietnam.
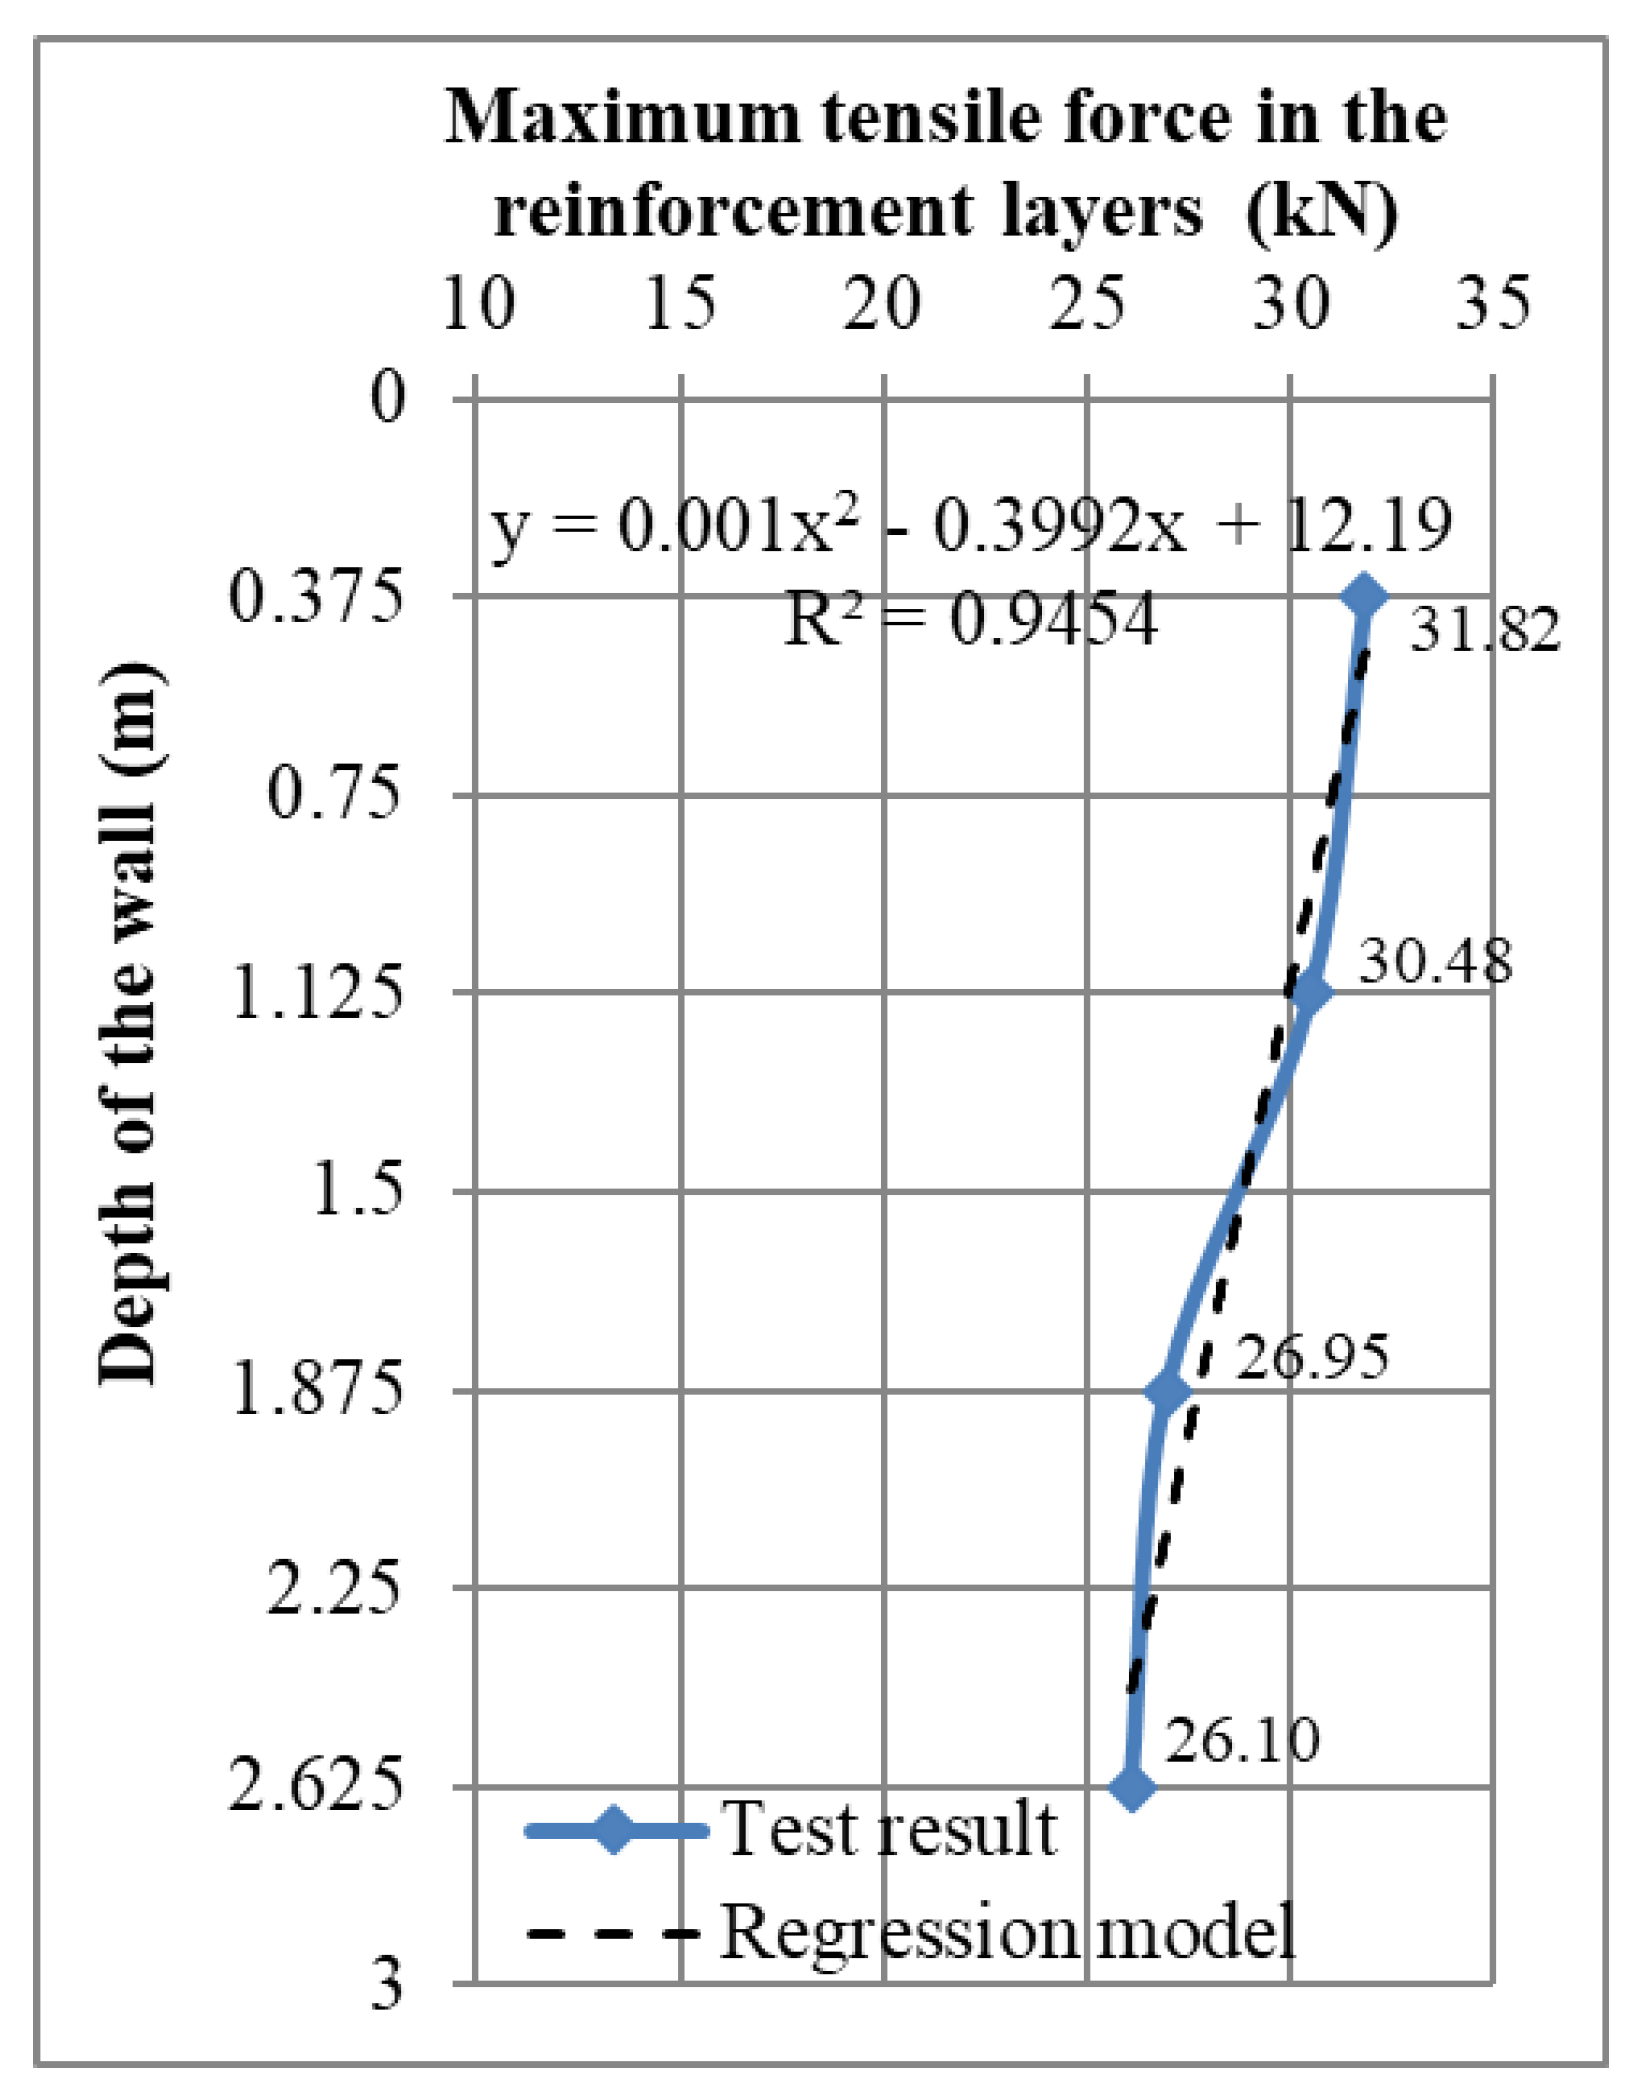
The correlation equation between the maximum tensile force in the reinforcement bars (F) and the depth (z) measured from the top of the wall is illustrated in Figure 11 and is shown in Equation (5). The parabolic shape of the failure surface in the reinforced soil in this study was similar to the reports of Murray and Farrar [7] and Chau et al. [35].
z = 0.001 F 2 0.3992 F + 12.19

4.1.4. Lateral Displacement of the Wall Facing

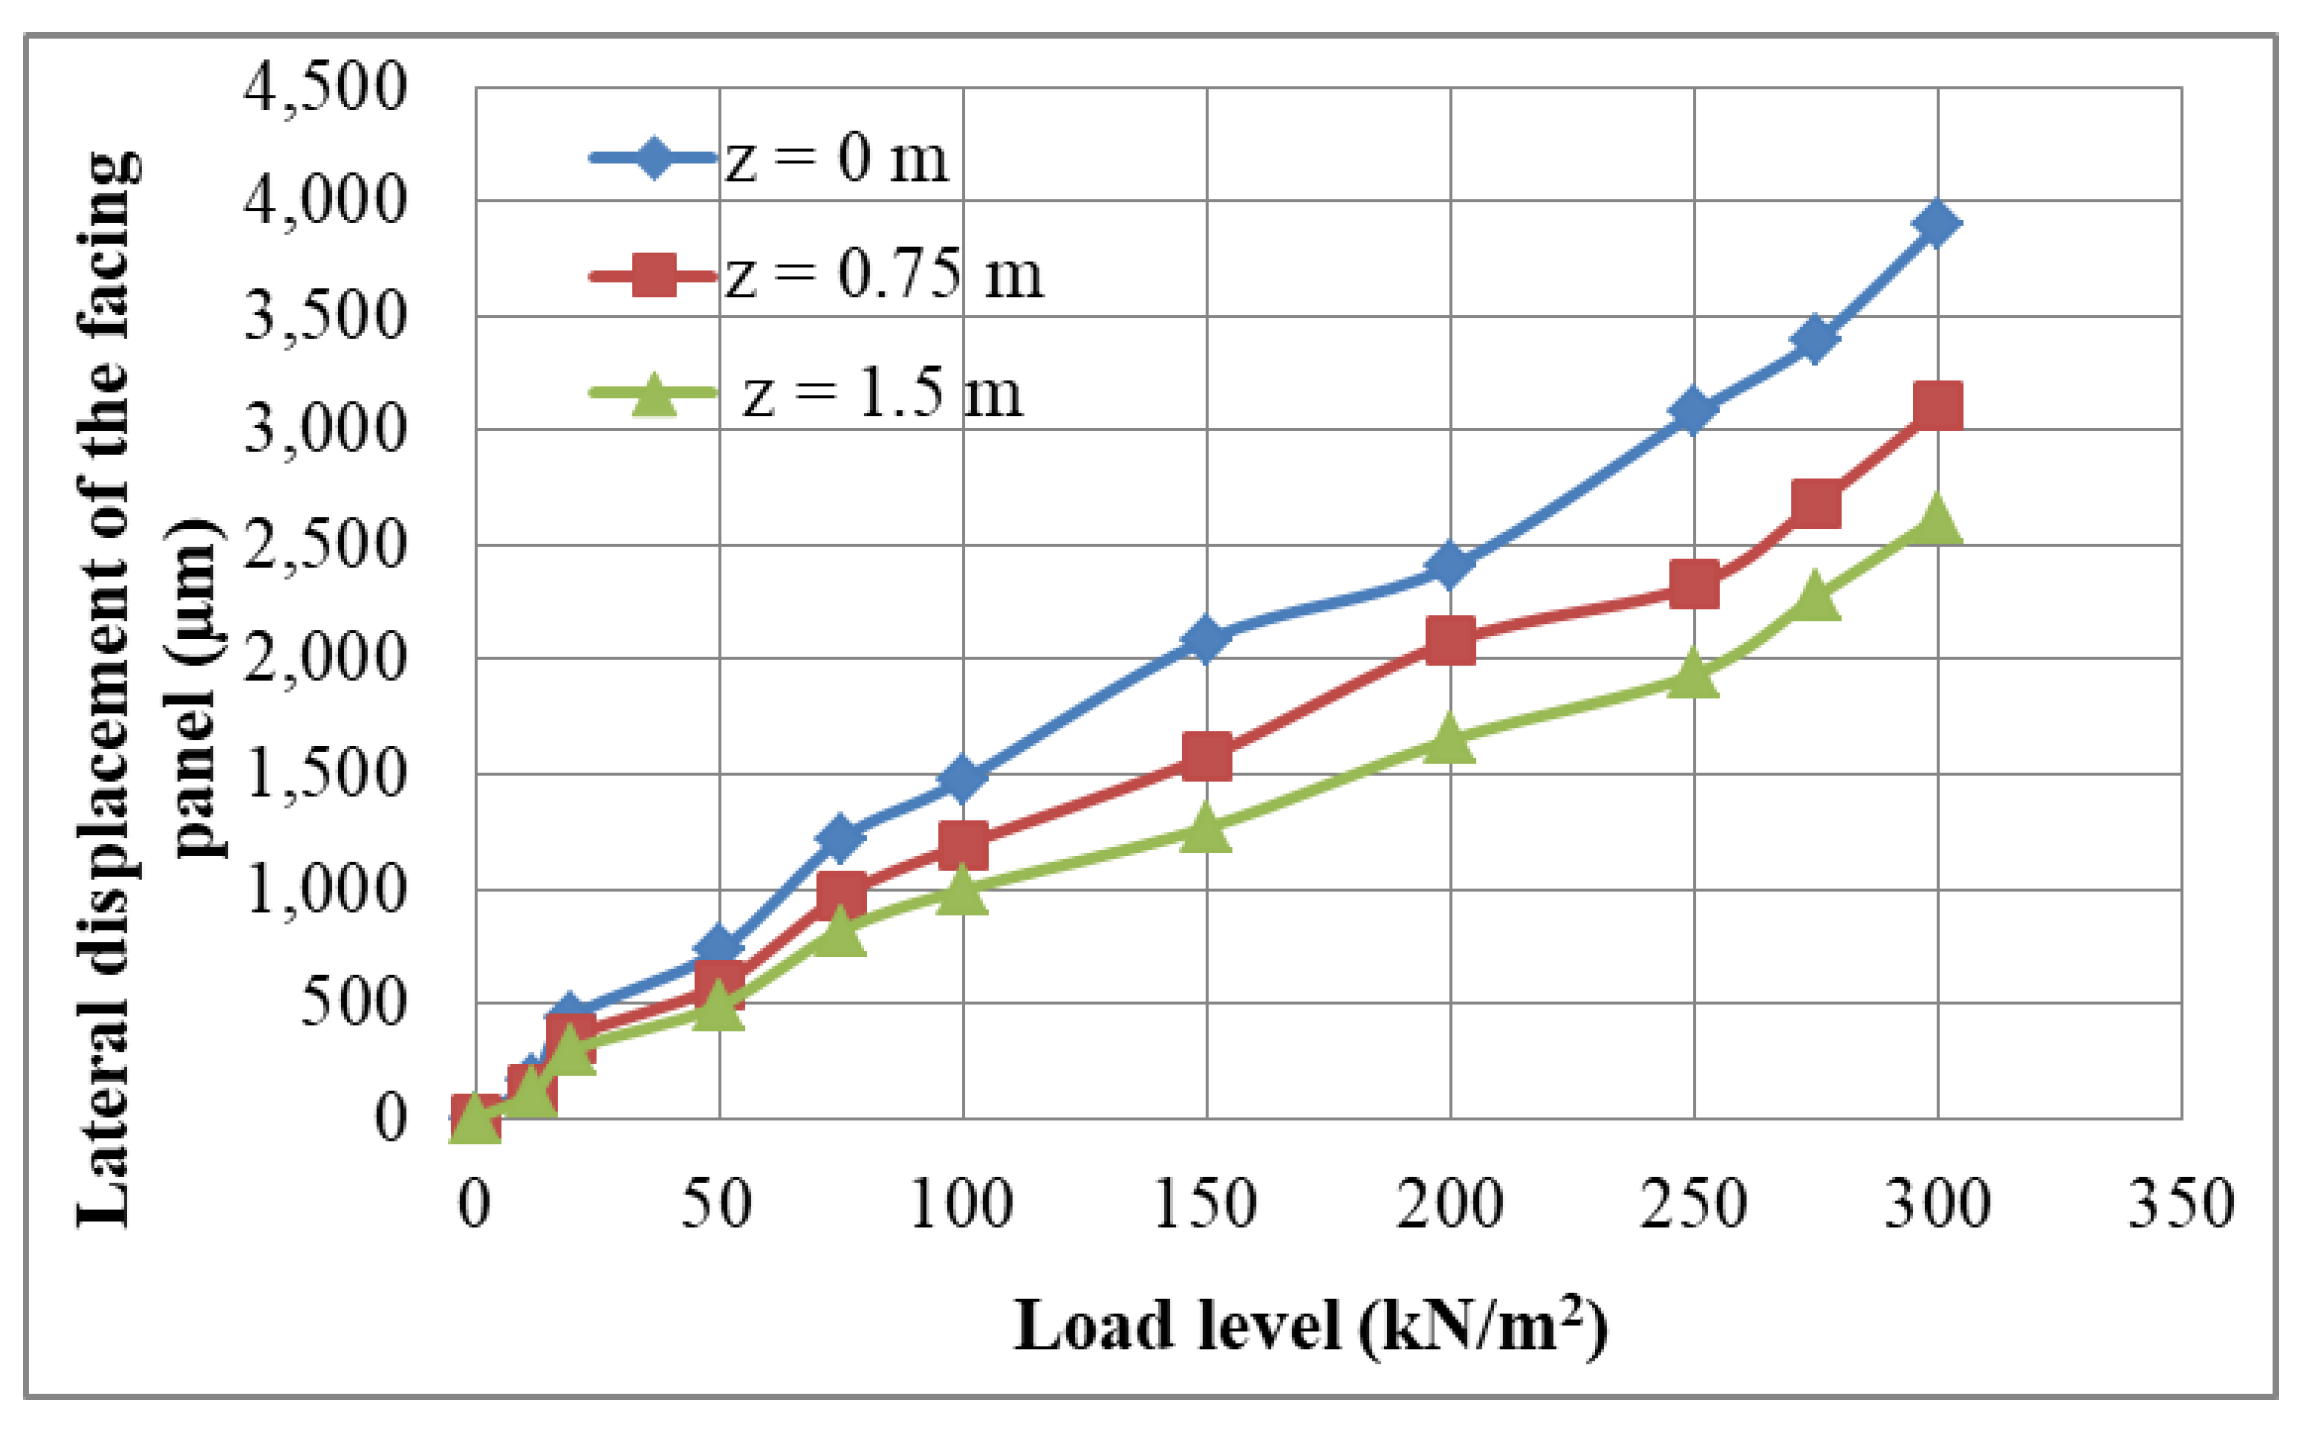
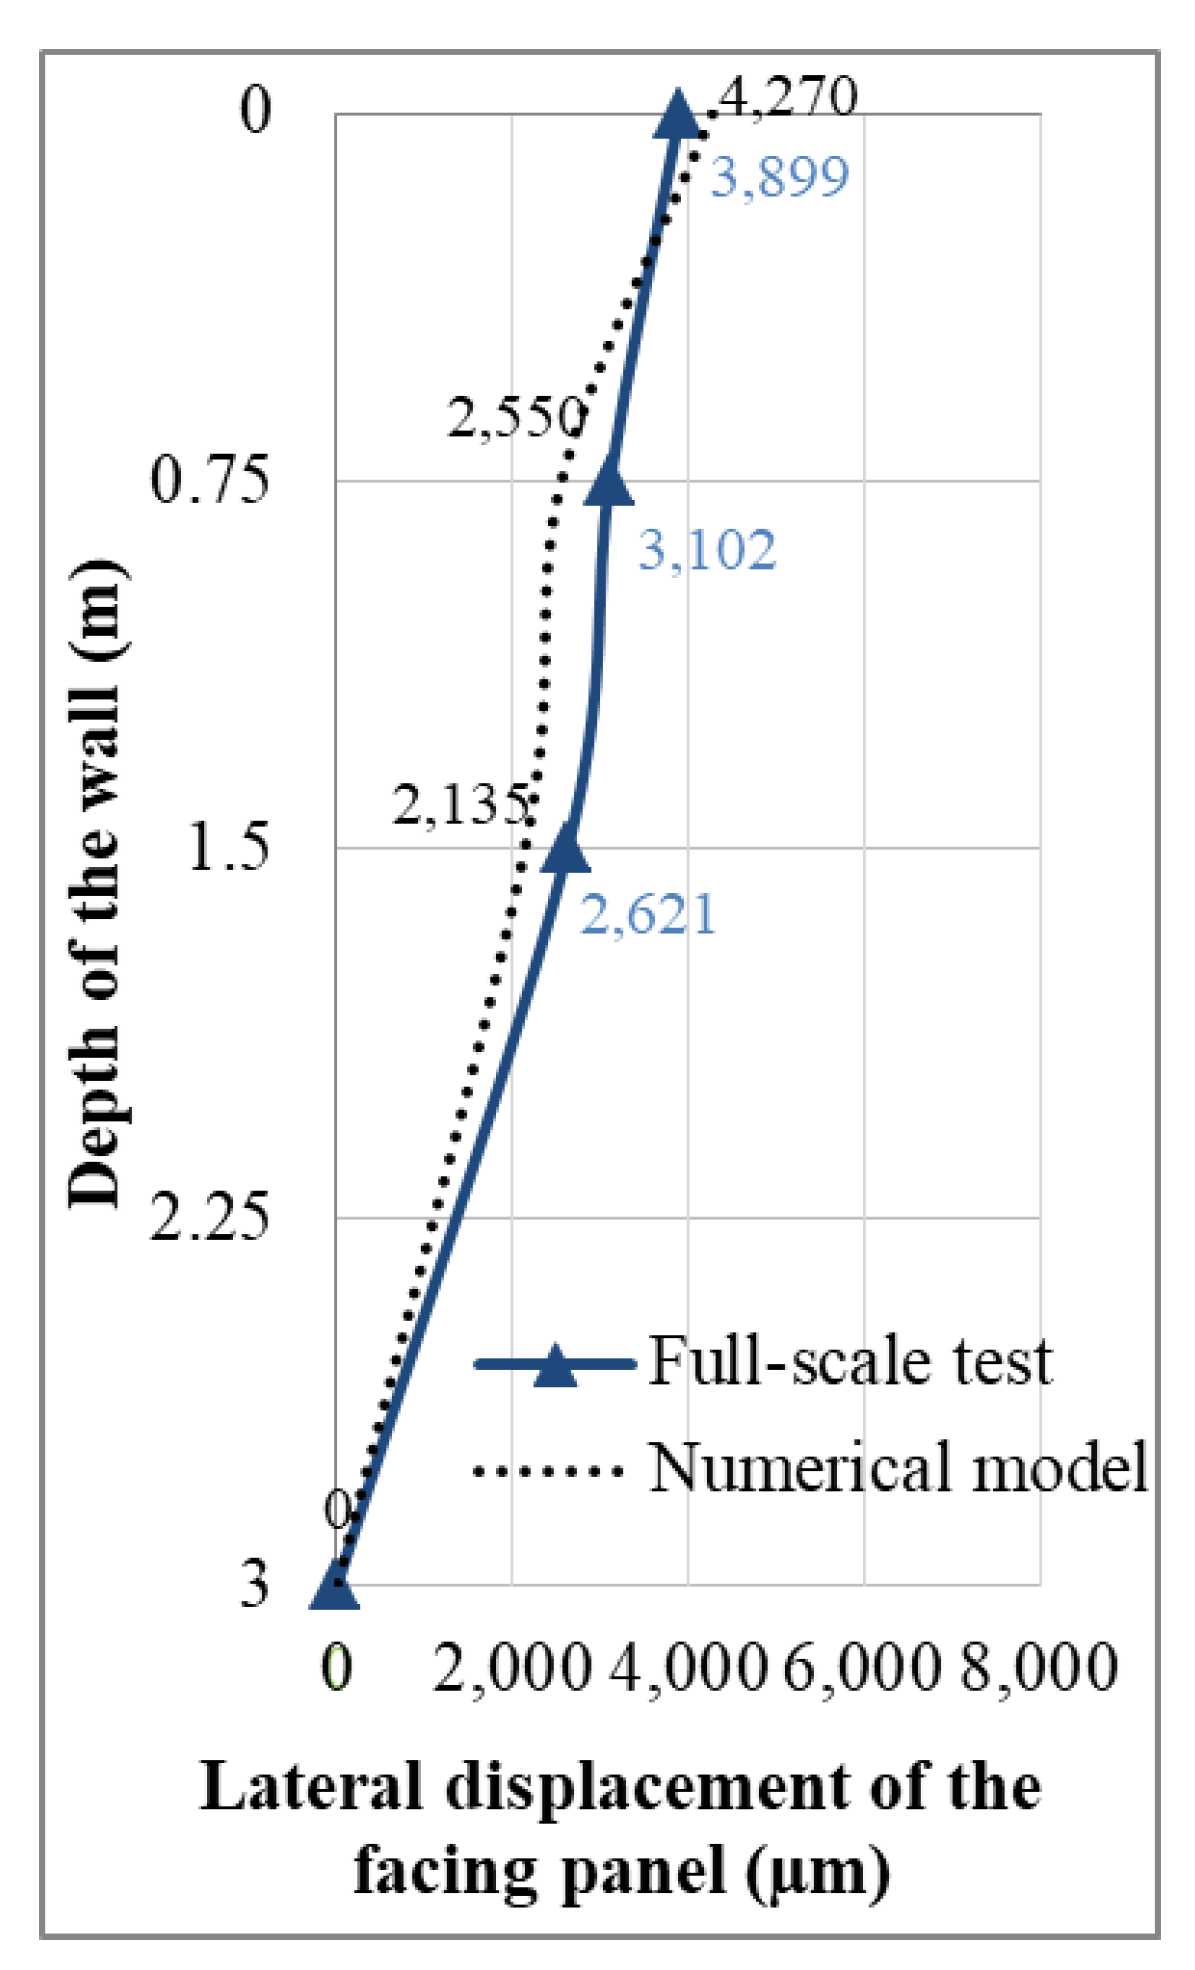
The experimental results indicated that the lateral displacement of the wall at the top of panel 2 (z = 1.5 m) was smaller than that at the top of panel 3 (z = 0.75 m), and the largest lateral displacement was observed at the top of panel 4 (top of the wall; z = 0 m) (as shown in Figure 12). At the failure load level (302 kN/m2), the maximum lateral displacement at the top of the wall was 3899 µm, which was much smaller than the allowable lateral displacement for the wall (Δ = H/100 = 3 cm) [8,10]. The lateral displacement of the wall in this study had a similar pattern to the displacement profiles in previous studies [36].

4.2. Numerical Model Results

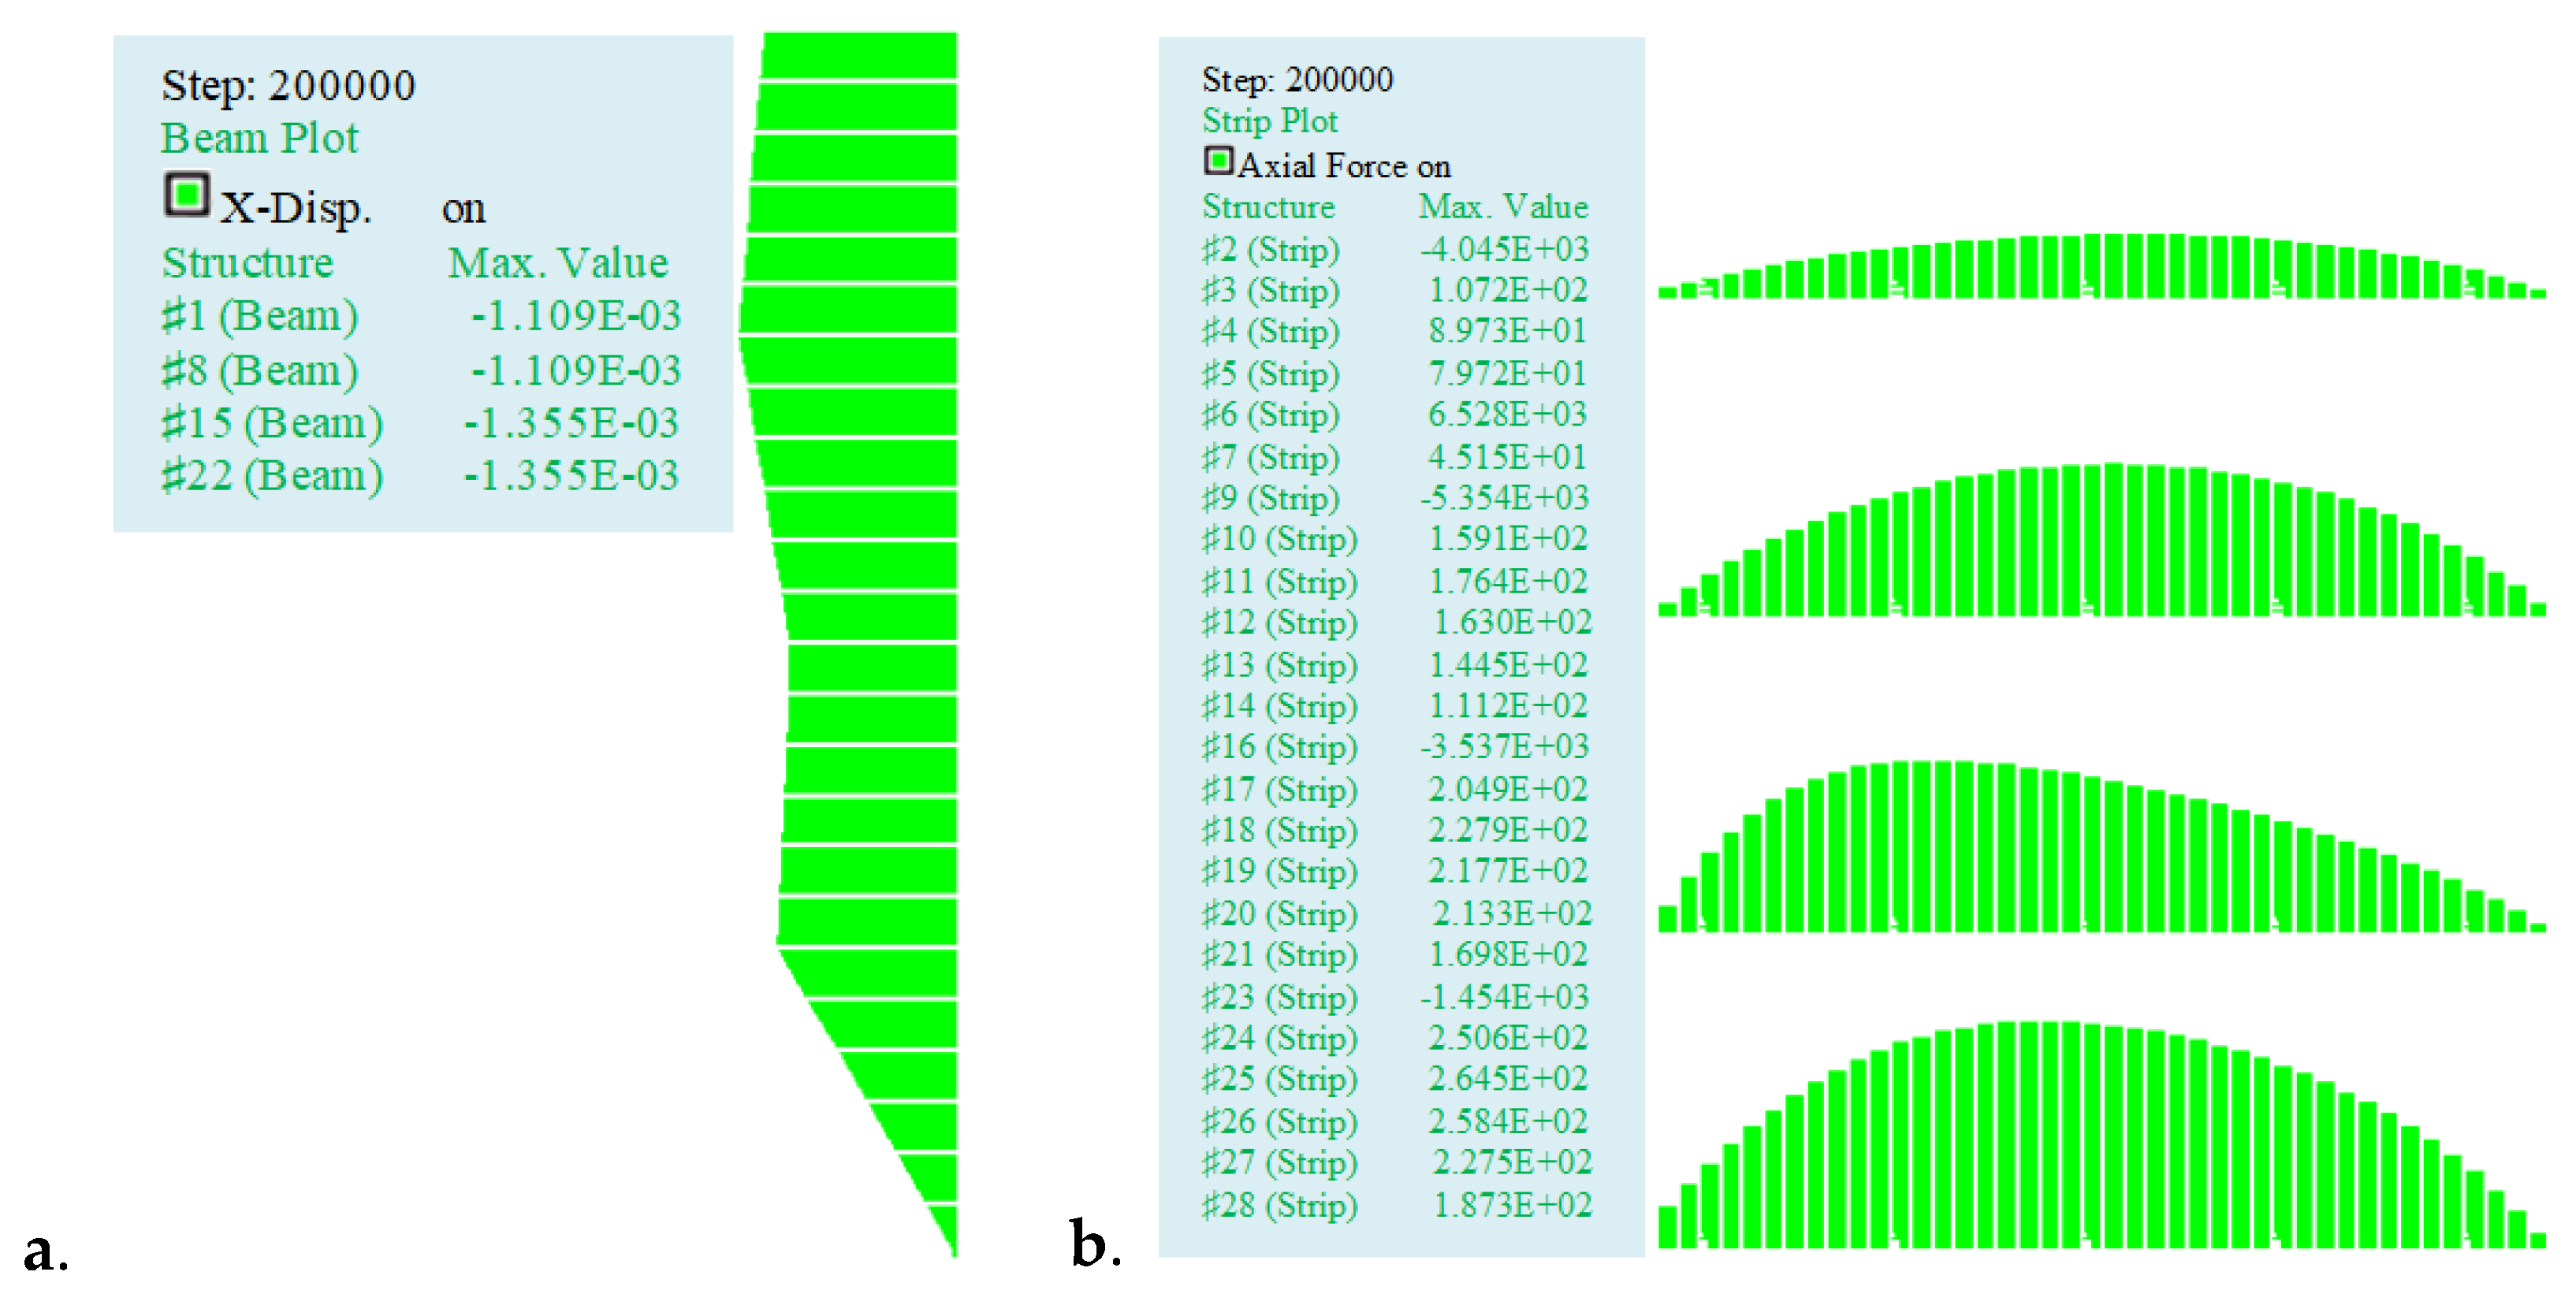
Figure 13 illustrates the lateral displacement of the wall facing and the tensile load distribution within the reinforcement layers during the construction of the wall (load level of 12 kN/m2). The numerical model results were similar to the report of Stuedlein et al. [38].
At a maximum load level of 300 kN/m2, the model results showed that the highest lateral displacement of the wall facing was 4270 mm, as shown in Figure 14. In addition, the maximum tensile load in the fourth reinforcement layer (near the top of the wall) was similar to the full-scale model and was located approximately 0.95 m further away from the facing panel. This value decreased close to the wall facing of the lower reinforcement layers, as shown in Figure 10.
Figure 15 and Figure 16 demonstrate that the simulation results were in good agreement with the measurements from the full-scale model. Thus, the findings from the study were reliable and could be used in practice. They also indicated that the local backfill material and self-fabricated steel reinforcements could widely be used in the Central Region of Vietnam.

5. Conclusions

This paper presents research results using a full-scale model and numerical model for a mechanically stabilized earth (MSE) retaining wall with a self-fabricated galvanized steel reinforcement grid applied to low-cohesion soil in the Danang area. The research results demonstrate that the self-fabricated galvanized steel reinforcement worked in conjunction with the MSE wall to resist high loads with small displacement, indicating that local reinforcement materials can confidently be used in MSE constructions.
There were some findings from the study:
  • The retaining wall suddenly collapsed due to internal instability (reinforcement rupture) at a load level of 302 kN/m2, which was 15 times greater than the design load. At that failure mode, the maximum lateral displacement at the top of the wall facing was 3899 µm, which was much less than the allowable displacement of the wall (3 cm). The failure surface within the reinforced soil block was similar to theoretical studies.
  • It was noted that when the test load was lower than the design load (<20 kN/m2) the tensile forces in the deepest reinforcement layer showed the highest value. However, the upper reinforcement layers achieved the highest tensile forces when the test load increased. Thus, it is essential to enhance the bearing capacity of the reinforcement layers near the ground surface in special constructions with a very high surcharge load.
  • The measured data from the full-scale model were validated by the numerical model using FLAC software. The tensile load distribution pattern in the reinforcement layer and the lateral displacement of the wall were similar to the research results from other studies and were in good agreement with the current standards.
  • The experimental results also demonstrated that when using a self-fabricated galvanized steel reinforcement (CB300V; Φ 10) for the MSE wall, the wall maintained its stability under the applied load considering a metal loss of 65% of the initial tensile strength. Deformations to the reinforcement were minimal, and the wall was capable of withstanding high surcharge loads. Therefore, self-fabricated galvanized steel reinforcement grids and the specific soil material in the Danang area could be used as the reinforcement material for MSE walls with high stability.

Author Contributions

Conceptualization: T.-H.N.; Data Collection: T.-L.C. and T.-H.N.; Methodology: T.-H.N. and T.-L.C.; Supervision: T.-L.C.; Writing—original draft: V.-N.P.; Writing—review and editing: V.-N.P. and T.-L.C. All authors have read and agreed to the published version of the manuscript.

Funding

This work was supported by the Ministry of Education and Training, The University of Danang, University of Science and Technology. The code number of the project was B2021-DNA-12.

Institutional Review Board Statement

Not applicable.

Informed Consent Statement

Not applicable.

Data Availability Statement

The raw data supporting the conclusions of this article will be made available by the authors on request.

Conflicts of Interest

The authors declare no conflicts of interest.

Nomenclature

The following symbols are used in this paper:
MSE wallsMechanically stabilized earth walls
GSGGalvanized steel grid
F0Initial tensile strength of the reinforcement
ΔFProportional loss of tensile strength of the reinforcement
LaLength of the reinforcement bars in the failure zone
LeLength of the reinforcement bars in the backfill zone
f*Apparent friction coefficient for the steel reinforcement and backfill interfaces
CuCoefficient of uniformity of the backfill soil

References

  1. Berg, R.; Christopher, B.; Samtani, N. Design of Mechanically Stabilized Earth Walls and Reinforced Soil Slopes; Federal Highway Administration (FHWA): Washington, DC, USA, 2009; Volume II.
  2. Chang, J.C.; Forsyth, R.; Smith, T. Reinforced Earth Highway Embankment-Road 39. Highw. Focus 1972, 4, 15–35. [Google Scholar]
  3. Chau, T.-L.; Nguyen, T.-H.; Vu, D.-P. A Study on the Main Factors Affecting the Reinforcement Corrosion in Mechanically Stabilised Earth Walls and Predict the Service Life of the Wall. In Proceedings of CIGOS 2021, Emerging Technologies and Applications for Green Infrastructure: Proceedings of the 6th International Conference on Geotechnics, Civil Engineering and Structures; Springer: Singapore, 2022; pp. 987–996. [Google Scholar] [CrossRef]
  4. Khan, B.J.; Ahmad, M.; Sabri, M.M.S.; Ahmad, I.; Zamin, B.; Niekurzak, M. Experimental and Numerical Evaluation of Mechanically Stabilized Earth Wall with Deformed Steel Bars Embedded in Tire Shred-Sand Mixture. Buildings 2022, 12, 548. [Google Scholar] [CrossRef]
  5. Ahmadi, H.; Bezuijen, A. Full-Scale Mechanically Stabilized Earth (MSE) Walls under Strip Footing Load. Geotext. Geomembr. 2018, 46, 297–311. [Google Scholar] [CrossRef]
  6. Mandloi, P.; Sarkar, S.; Hegde, A. Performance Assessment of Mechanically Stabilised Earth Walls with Sustainable Backfills. Proc. Inst. Civ. Eng. Eng. Sustain. 2022, 175, 302–318. [Google Scholar] [CrossRef]
  7. Murray, R.; Farrar, D. Temperature Distributions in Reinforced Soil Retaining Walls. Geotext. Geomembr. 1988, 7, 33–50. [Google Scholar] [CrossRef]
  8. Lee, K.L.; Adams, B.D.; Vagneron, J.-M.J. Reinforced Earth Retaining Walls. J. Soil Mech. Found. Div. 1973, 99, 745–764. [Google Scholar] [CrossRef]
  9. Richards, D.; Clayton, C.; Powrie, W.; Hayward, T. Geotechnical Analysis of a Retaining Wall in Weak Rock. Proc. Inst. Civ. Eng. Geotech. Eng. 2004, 157, 13–26. [Google Scholar] [CrossRef]
  10. Ahmadi, H.; Bezuijen, A.; Zornberg, J.G. Interaction Mechanisms in Small-Scale Model MSE Walls under the Strip Footing Load. Geosynth. Int. 2021, 28, 238–258. [Google Scholar] [CrossRef]
  11. Murray, R. The Development of Specifications for Soil Nailing. In Research Report; Transport Research Laboratory: Crowthorne, UK, 1993; Volume 380, pp. 1–25. [Google Scholar]
  12. AFNOR NF P94-270:2020; Calcul Géotechnique Ouvrages de Soutènement Remblais Renforcés et Massifs en sol Cloué. Association Française de Normalisation: Paris, France, 2020; p. 192.
  13. BS 8006-1: 2010; Code of Practice for Strengthened/Reinforced Soils and Other Fills. Bristish Standard: London, UK, 2010.
  14. TCVN 11823-11:2017; Highway Bridge Design Specification—Part 11: Abutments, Piers and Walls. Technical Standards: Hanoi, Vietnam, 2017.
  15. Kibria, G.; Hossain, M.S.; Khan, M.S. Influence of Soil Reinforcement on Horizontal Displacement o f MSE wall. Int. J. Geomech. 2014, 14, 130–141. [Google Scholar] [CrossRef]
  16. Roscoe, H.; Twine, D. Design and Performance of Retaining Walls. Proc. Inst. Civ. Eng. Geotech. Eng. 2010, 163, 279–290. [Google Scholar] [CrossRef]
  17. Jensen, J.A. Analysis of Full-Scale Mechanically Stabilized Earth (MSE) Wall Using Crimped Steel Wire Reinforcement; Utah State University: Logan, UT, USA, 2015. [Google Scholar]
  18. Weldu, M.T. Pullout Resistance of MSE Wall Steel Strip Reinforcement in Uniform Aggregate; University of Kansas: Lawrence, KS, USA, 2015. [Google Scholar]
  19. Ho, S.; Rowe, R.K. Effect of Wall Geometry on the Behaviour of Reinforced Soil Walls. Geotext. Geomembr. 1996, 14, 521–541. [Google Scholar] [CrossRef]
  20. Yu, Y.; Bathurst, R.J.; Miyata, Y. Numerical Analysis of a Mechanically Stabilized Earth Wall Reinforced with Steel Strips. Soils Found. 2015, 55, 536–547. [Google Scholar] [CrossRef]
  21. Weerasekara, L. Improvements to Pullout Failure Estimation in MSE Walls. In Proceedings of the 71st Canadian Geotechnical Conference, Edmonton, BC, Canada, 23–26 September 2018. [Google Scholar]
  22. Sadat, M.R.; Huang, J.; Bin-Shafique, S.; Rezaeimalek, S. Study of the Behavior of Mechanically Stabilized Earth (MSE) Walls Subjected to Differential Settlements. Geotext. Geomembr. 2018, 46, 77–90. [Google Scholar] [CrossRef]
  23. Powrie, W.; Chandler, R.; Carder, D.; Watson, G. Back-Analysis of an Embedded Retaining Wall with a Stabilizing Base Slab. Proc. Inst. Civ. Eng. Geotech. Eng. 1999, 137, 75–86. [Google Scholar] [CrossRef]
  24. Zhang, X.; Chen, J.; Liu, J. Failure mechanism of two-stage mechanically stabilized earth walls on soft ground. In Proceedings of the 8th International Congress on Environmental Geotechnics, ICEG 2018, Hangzhou, China, 28 October–1 November 2018; Springer: Singapore, 2018; Volume 2. [Google Scholar]
  25. Tecco-5. Effect of Reinforcement Types on the MSE Wall. In Research Report; Transportation and Transport Infrastructure Design Consultancy Company: Danang, Vietnam, 2020. [Google Scholar]
  26. M145-91; Standard Specification for Classification of Soils and Soil-Aggregate Mixtures for Highway Construction Purposes. AASHTO American Association of State and Highway Transportation Officials: Washington, DC, USA, 2012.
  27. Nguyen, T.-H.; Chau, T.-L.; Hoang, T.; Nguyen, T. Developing Artificial Neural Network Models to Predict Corrosion of Reinforcement in Mechanically Stabilized Earth Walls. Neural Comput. Appl. 2023, 35, 6787–6799. [Google Scholar] [CrossRef]
  28. Chau, T.-L.; Nguyen, T.-H. Study the influence of adherence edge to steel strip and soil interaction in Mechanically Stabilized Earth Wall with a self-made strip. In Proceedings of CIGOS 2019, Innovation for Sustainable Infrastructure: Proceedings of the 5th International Conference on Geotechnics, Civil Engineering Works and Structures; Springer: Singapore, 2020; pp. 757–762. [Google Scholar] [CrossRef]
  29. Haiun, G.; Heurtebis, C.; Renault, J. Les Ouvrages en Terre Armee-Guide Pour la Surveillance Specialisee et le Renforcement; Cerema: Paris, France, 1994. [Google Scholar]
  30. Itasca. FLAC-Fast Lagrangian Analysis of Continua, Version. 7.0; Itasca Consulting Group Inc.: Minneapolis, MN, USA, 2011. [Google Scholar]
  31. Huang, B.; Bathurst, R.J.; Hatami, K. Numerical Study of Reinforced Soil Segmental Walls Using Three Different Constitutive Soil Models. J. Geotech. Geoenviron. Eng. 2009, 135, 1486–1498. [Google Scholar] [CrossRef]
  32. Huang, B.; Bathurst, R.J.; Hatami, K.; Allen, T.M. Influence of Toe Restraint on Reinforced Soil Segmental Walls. Can. Geotech. J. 2010, 47, 885–904. [Google Scholar] [CrossRef]
  33. Schlosser, F. La terre armee. In Note D’Inf Tech; Institut Francais des Sciences et Technologies des Transports, de l’Aménagement et des Réseaux (IFSTTAR): Paris, France, 1973. [Google Scholar]
  34. Wichter, L.; Risseuw, P.; Guy, G. Grossversuch zurn Tragverhalten einer Steilwand aus Gewebe und Mergel. In Proceedings of the Third International Conference on Geotextiles, Vienna, Austria, 7–11 April 1986. [Google Scholar]
  35. Chau, T.; Corfdir, A.; Bourgeois, E. Corrosion Des Armatures Sur Le Comportement Des Murs En Terre Armée-Effect of Reinforcement Corrosion on the Behavior of Earth Walls Reinforced by Steel Elements (Soustitre: Scénarios De Corrosion Des Armatures Métalliques Et Les Dégradations Du Mur En Terre Armée); Éditions Universitaires Européennes (EUE): Paris, France, 2016. [Google Scholar]
  36. Schlosser, F.; Guilloux, A. Le frottement dans le renforcement des sols. In Revue Française de Géotechnique; EDP Sciences: Paris, France, 1981; pp. 65–77. [Google Scholar]
  37. Naresh, C.S.; Edward, A.N. Mechanically Stabilized Earth (MSE) Wall Fills—A Framework for Use of Local Available Sustainable Resources (LASR); Federal Highway Administration (FHWA): Washington, DC, USA, 2021.
  38. Stuedlein, A.W.; Bailey, M.; Lindquist, D.; Sankey, J.; Neely, W.J. Design and Performance of a 46-m-high MSE wall. J. Geotech. Geoenviron. Eng. 2010, 136, 786–796. [Google Scholar] [CrossRef]
Figure 1. The test layout of the full-scale MSE model.
Applsci 14 01283 g001
Figure 2. Properties of the backfill material: (a) local backfill soil; (b) grain-size distribution of the backfill soil; (c) Proctor compaction results.
Applsci 14 01283 g002
Figure 3. Drilling to reduce the cross-sectional area of the reinforcement bars: (a) drilling the steel bar; (b) drilling positions.
Applsci 14 01283 g003
Figure 4. Design of the steel reinforcement grid.
Applsci 14 01283 g004
Figure 5. Full-scale MSE model with full instrumentation: (a) MSE model with full instrumentation; (b) full-scale model after construction.
Applsci 14 01283 g005
Figure 6. The MSE wall model in FLAC.
Applsci 14 01283 g006
Figure 7. The tensile force distribution in the reinforcement layers at different test load levels: (a) the fourth layer; (b) the third layer; (c) the second layer; (d) the first layer.
Applsci 14 01283 g007aApplsci 14 01283 g007b
Figure 8. Tensile force distribution in different reinforcement layers: (a) load level of 0 kN/m2; (b) load level of 20 kN/m2; (c) load level of 75 kN/m2; (d) load level of 300 kN/m2.
Applsci 14 01283 g008aApplsci 14 01283 g008b
Figure 9. Tensile force distribution in different studies: (a) Murray and Farrar [7]; (b) Chau and Nguyen [28]; (c) this study.
Applsci 14 01283 g009aApplsci 14 01283 g009b
Figure 10. Failure surface in the reinforced soil mass.
Applsci 14 01283 g010
Figure 11. The trend line of the failure surface in the reinforced soil.
Applsci 14 01283 g011
Figure 12. Lateral displacement of the wall facing.
Applsci 14 01283 g012
Figure 13. The numerical model results during the construction of the wall: (a) displacement of the wall facing; (b) distribution of tensile force in the reinforcement layers.
Applsci 14 01283 g013
Figure 14. The numerical model results at a load level of 300 kN/m2: (a) stress distribution in the retaining wall; (b) displacement of the wall facing; (c) the distribution of the tensile force in the reinforcement layers.
Applsci 14 01283 g014
Figure 15. Tensile forces from the physical and numerical models.
Applsci 14 01283 g015
Figure 16. Lateral displacement of the wall facing from the physical and numerical models.
Applsci 14 01283 g016
Table 1. Properties of the local backfill soil.
ParameterUnitValue
Saturated density, γkN/m32.070
Dry density, γkkM/m31.816
Friction angle, φsoilDegrees34.3
Cohesion, csoilPa5100
Plasticity index, IP-8.55
Uniformity coefficient, Cu-45.6
pH-5.9
Ion, Clmg/g0.094
Ion, SO42−mg/g0.497
Table 2. Reducing the cross-sectional area of the reinforcement bars.
ParameterUnitValue
Initial tensile strength of the steel reinforcementN49,000
Loss of tensile strengthN17,150
Remaining tensile strength within the reinforcementN31,850
Drilling the reinforcement bars to reduce their cross-sectional area%26.6
Drilling depth (Φ 5)mm8.1
Table 3. The MSE model parameters in FLAC.
ParameterUnitValue
Concrete panel
Width m0.75
Heightm0.15
Lengthm1.5
Young’s modulusPa2 × 1011
Compressive strength of concretePa35,000
Foundation soil
Unit weight, γFoundkg/m32700
Friction angle, φFoundDegrees51
Cohesion, cFoundPa5.51 × 107
Bulk modulusPa4.39 × 1010
Shear modulusPa3.02 × 1010
Backfill soil
Unit weight, γsoilkg/m32070
Friction angle, φsoilDegrees34.3
Cohesion, csoilPa5100
Bulk modulusPa1.5 × 107
Shear modulusPa6 × 106
Steel reinforcement
Lengthm2.1
Steel bar thicknessm0.010
Calculation widthm1.5
Number of longitudinal bars per calculation widthStrip4
Young’s modulusPa2 × 1011
Tensile strengthN/m31,850
Tensile failure strain%0.19
Shear stiffnessN/m22 × 107
Table 4. Interface properties.
ParameterUnitValue
Backfill soil: concrete panel
Normal stiffnessPa/m2.4 × 106
Shear stiffnessPa/m2.4 × 106
Friction angleDegrees26
Backfill soil: steel reinforcement
Shear stiffnessN/m22 × 107
CohesionN/m1 × 105
Initial apparent friction coefficient
Layer 4 1.917
Layer 3 1.751
Layer 2 1.586
Layer 1 1.420
Table 5. The length of reinforcement bars in the failure zone and backfill zone.
Depth (m)Reinforcement LayerFull-Scale Model ResultsCurrent Standards
TCVN [14]; AFNOR [12]
La (cm)Le (cm)La (cm)Le (cm)
0.37549511590120
1.12539511590120
1.87526015067.5142.5
2.62516015022.5187.5
Disclaimer/Publisher’s Note: The statements, opinions and data contained in all publications are solely those of the individual author(s) and contributor(s) and not of MDPI and/or the editor(s). MDPI and/or the editor(s) disclaim responsibility for any injury to people or property resulting from any ideas, methods, instructions or products referred to in the content.