
A Pavement Crack Detection and Evaluation Framework for a UAV Inspection System Based on Deep Learning


Abstract
1. Introduction
2. Framework of UAV Inspection System
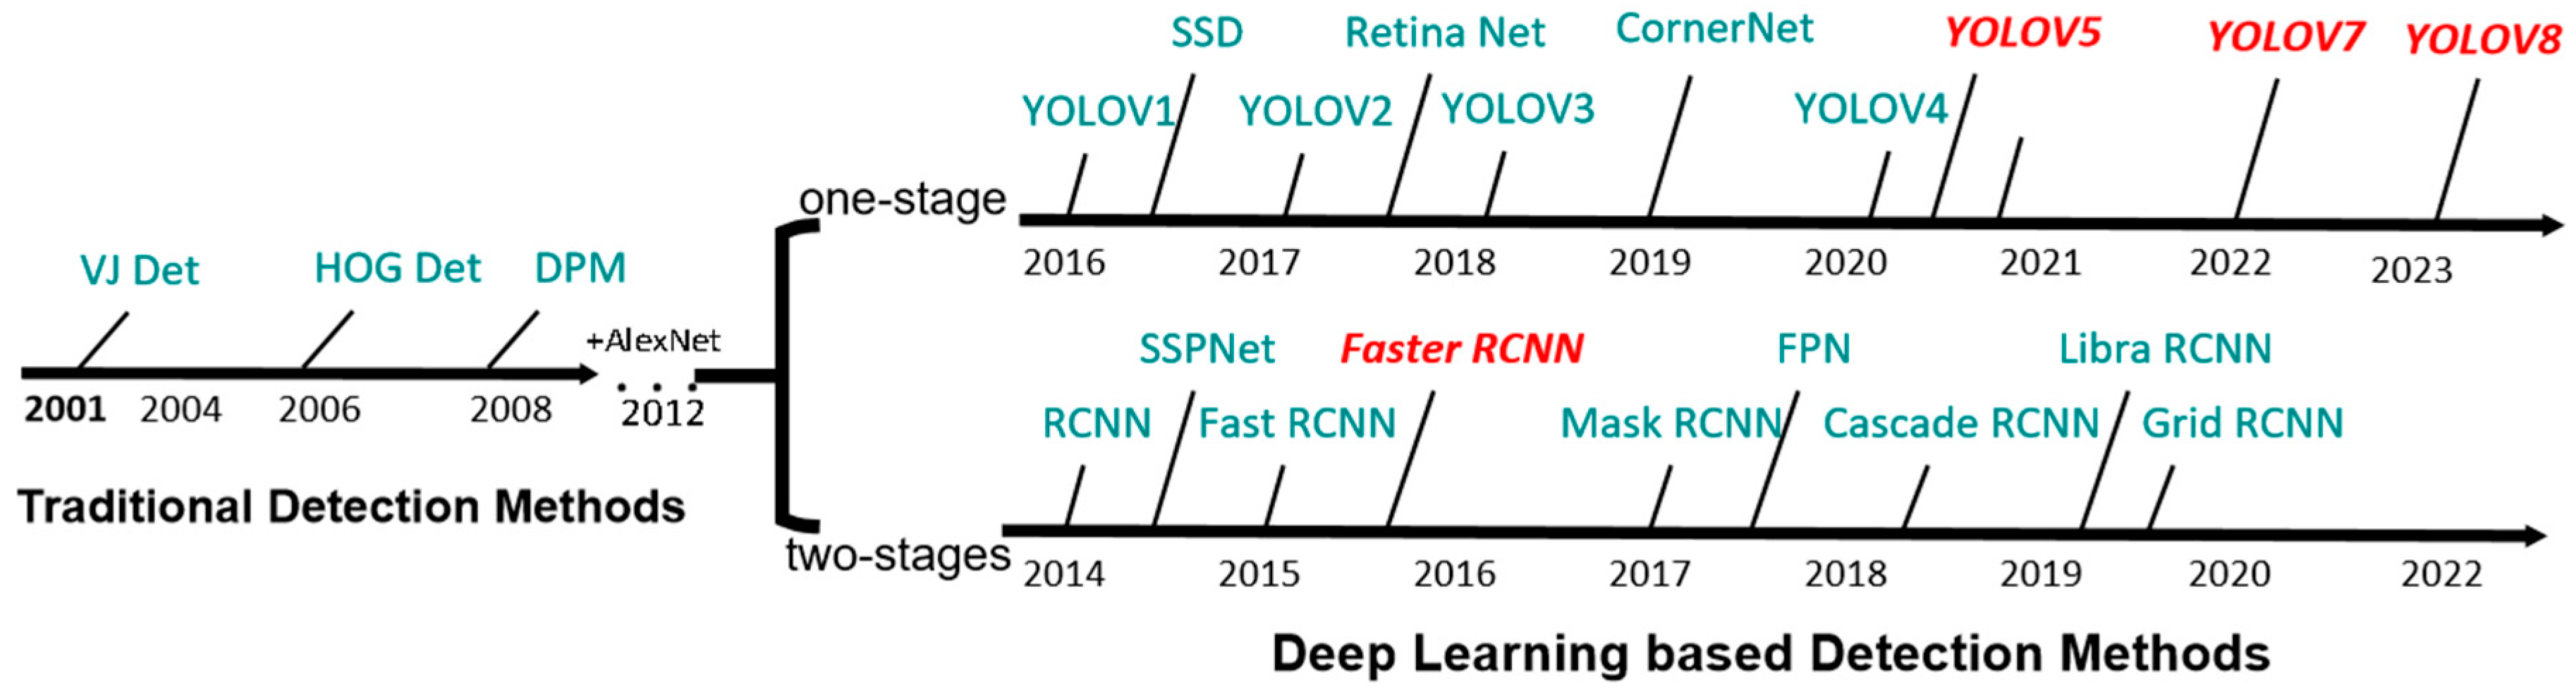
3. Deep Learning Algorithms
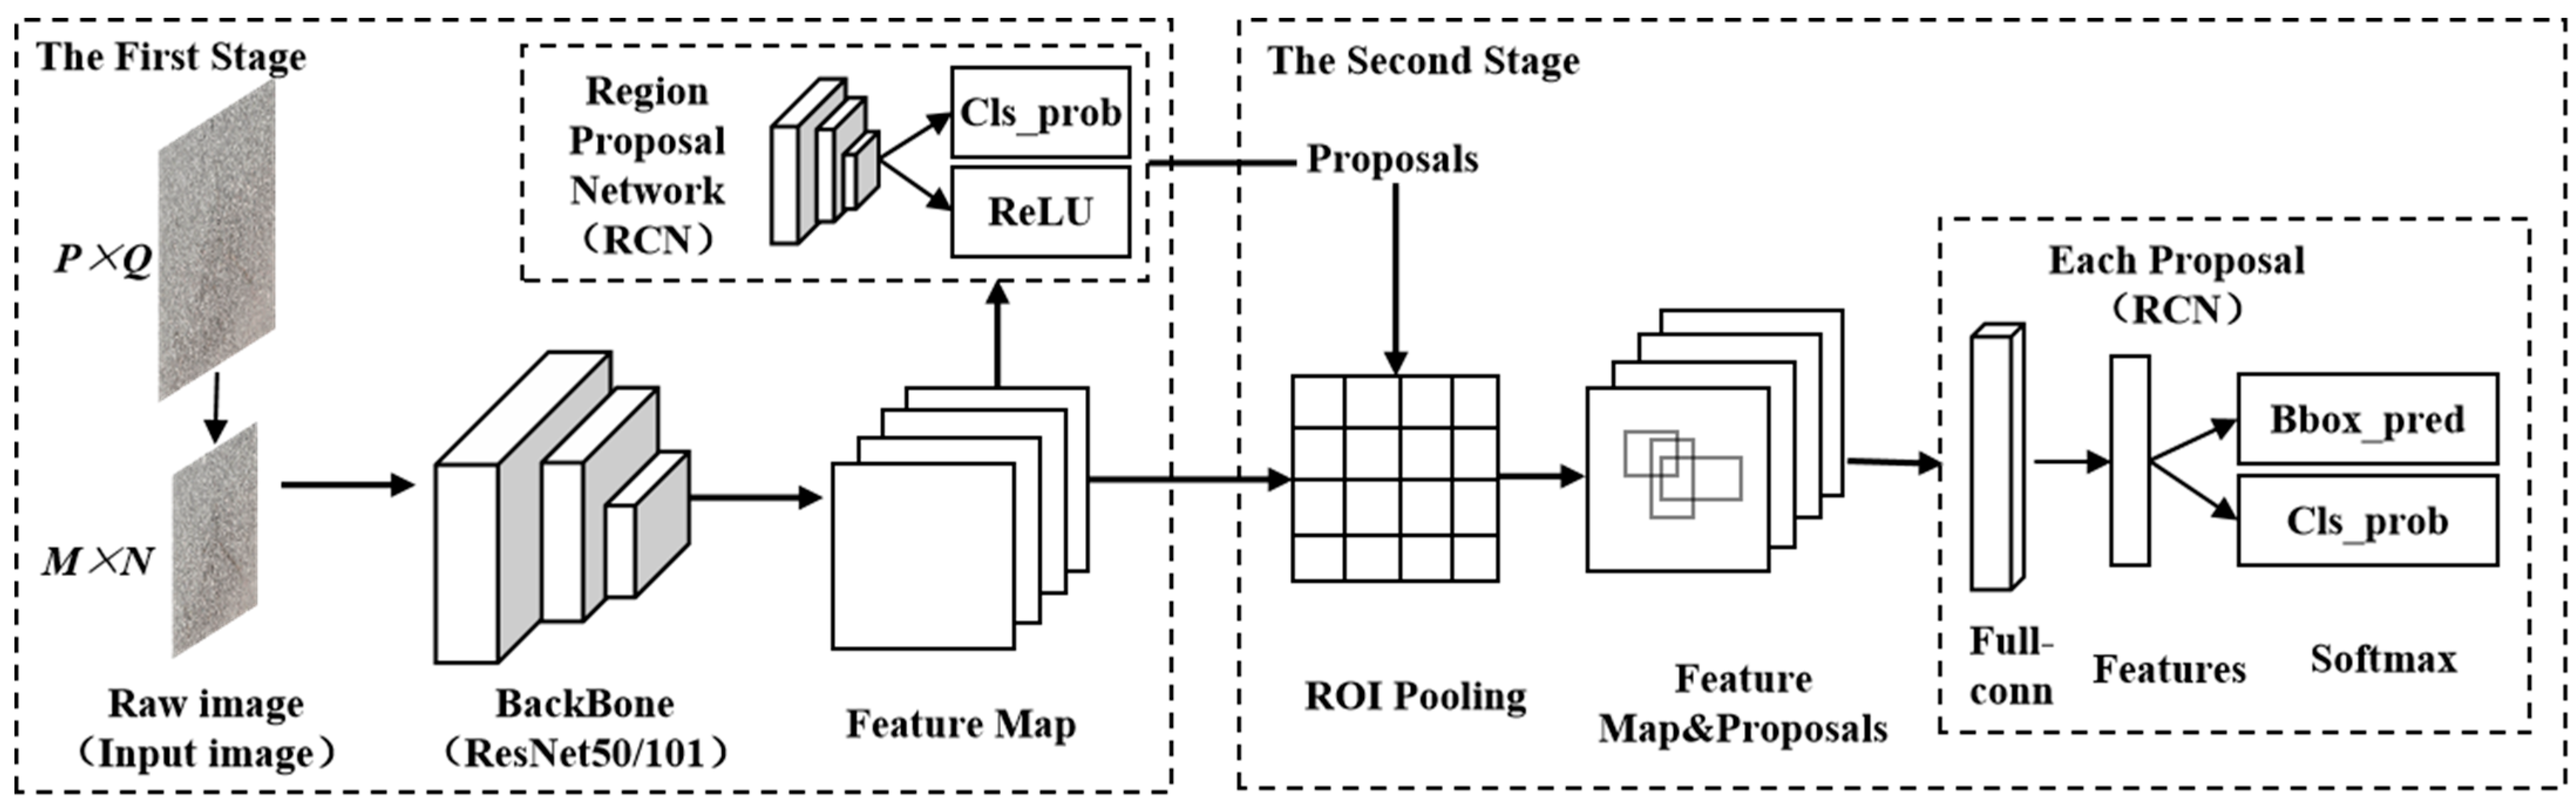
3.1. Faster-RCNN Algorithm
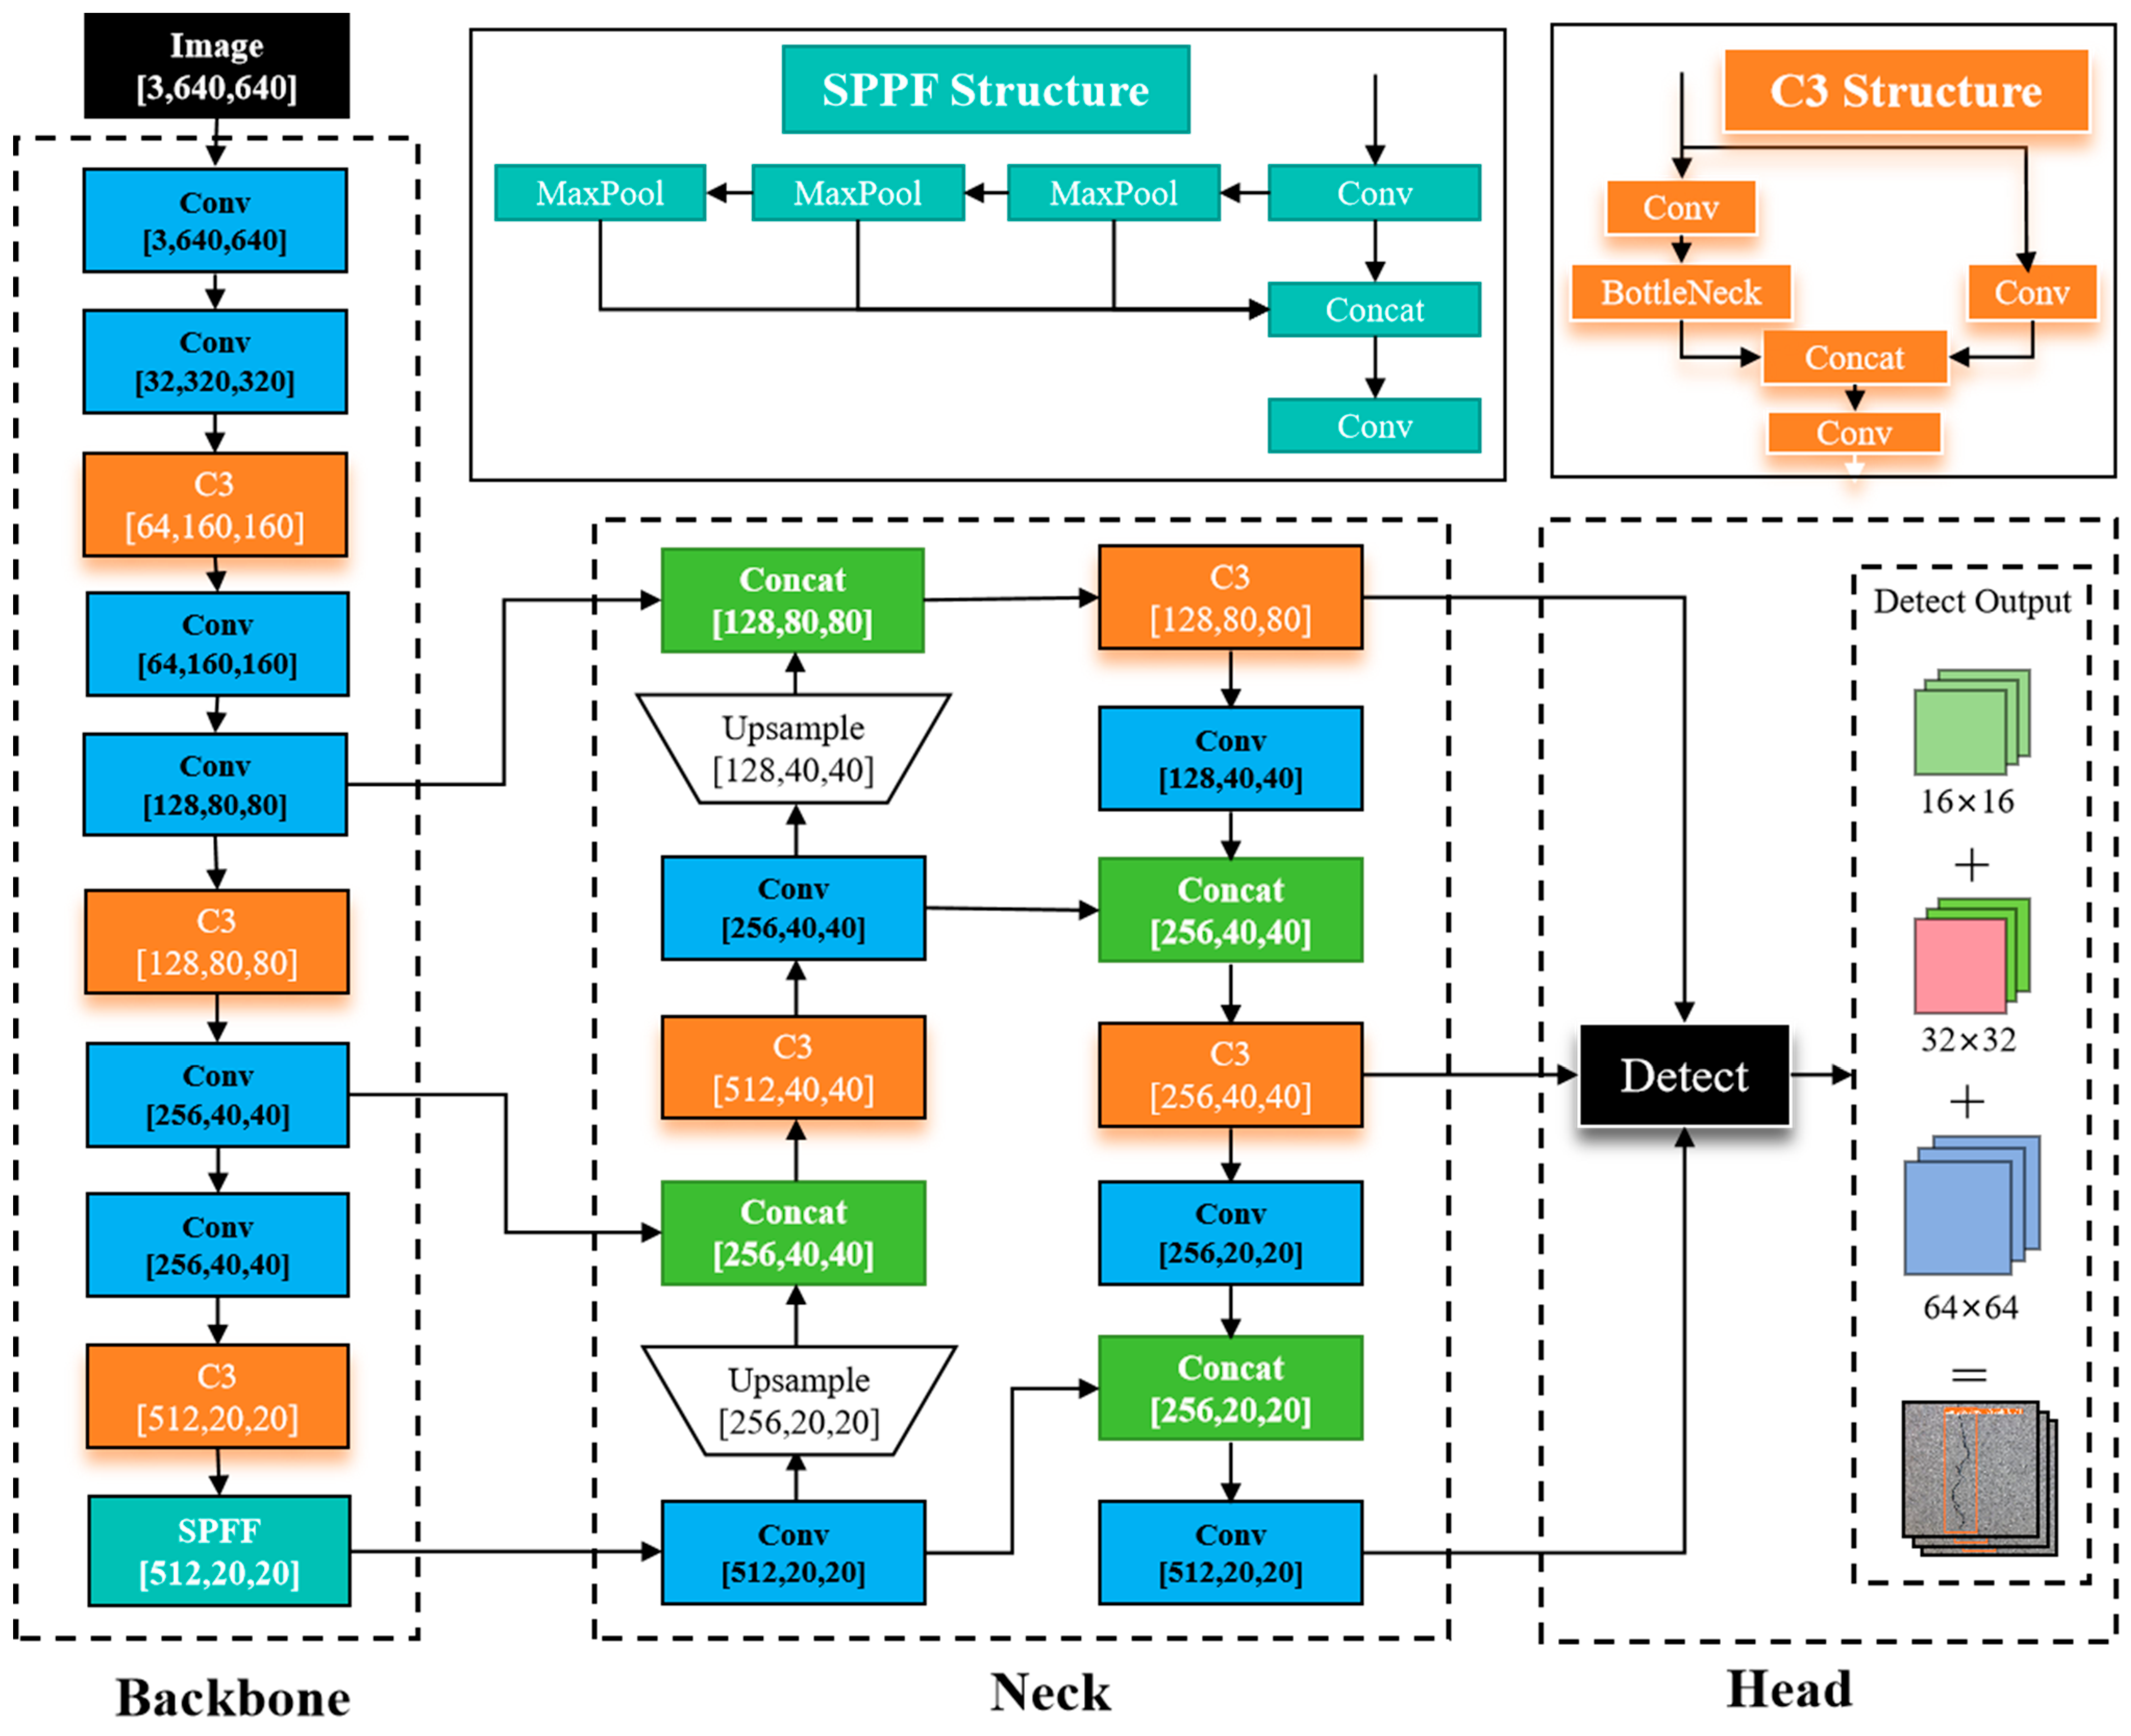
3.2. YOLO Series Algorithms
4. UAV Data Acquisition and Preprocessing
4.1. Flight Control Strategy
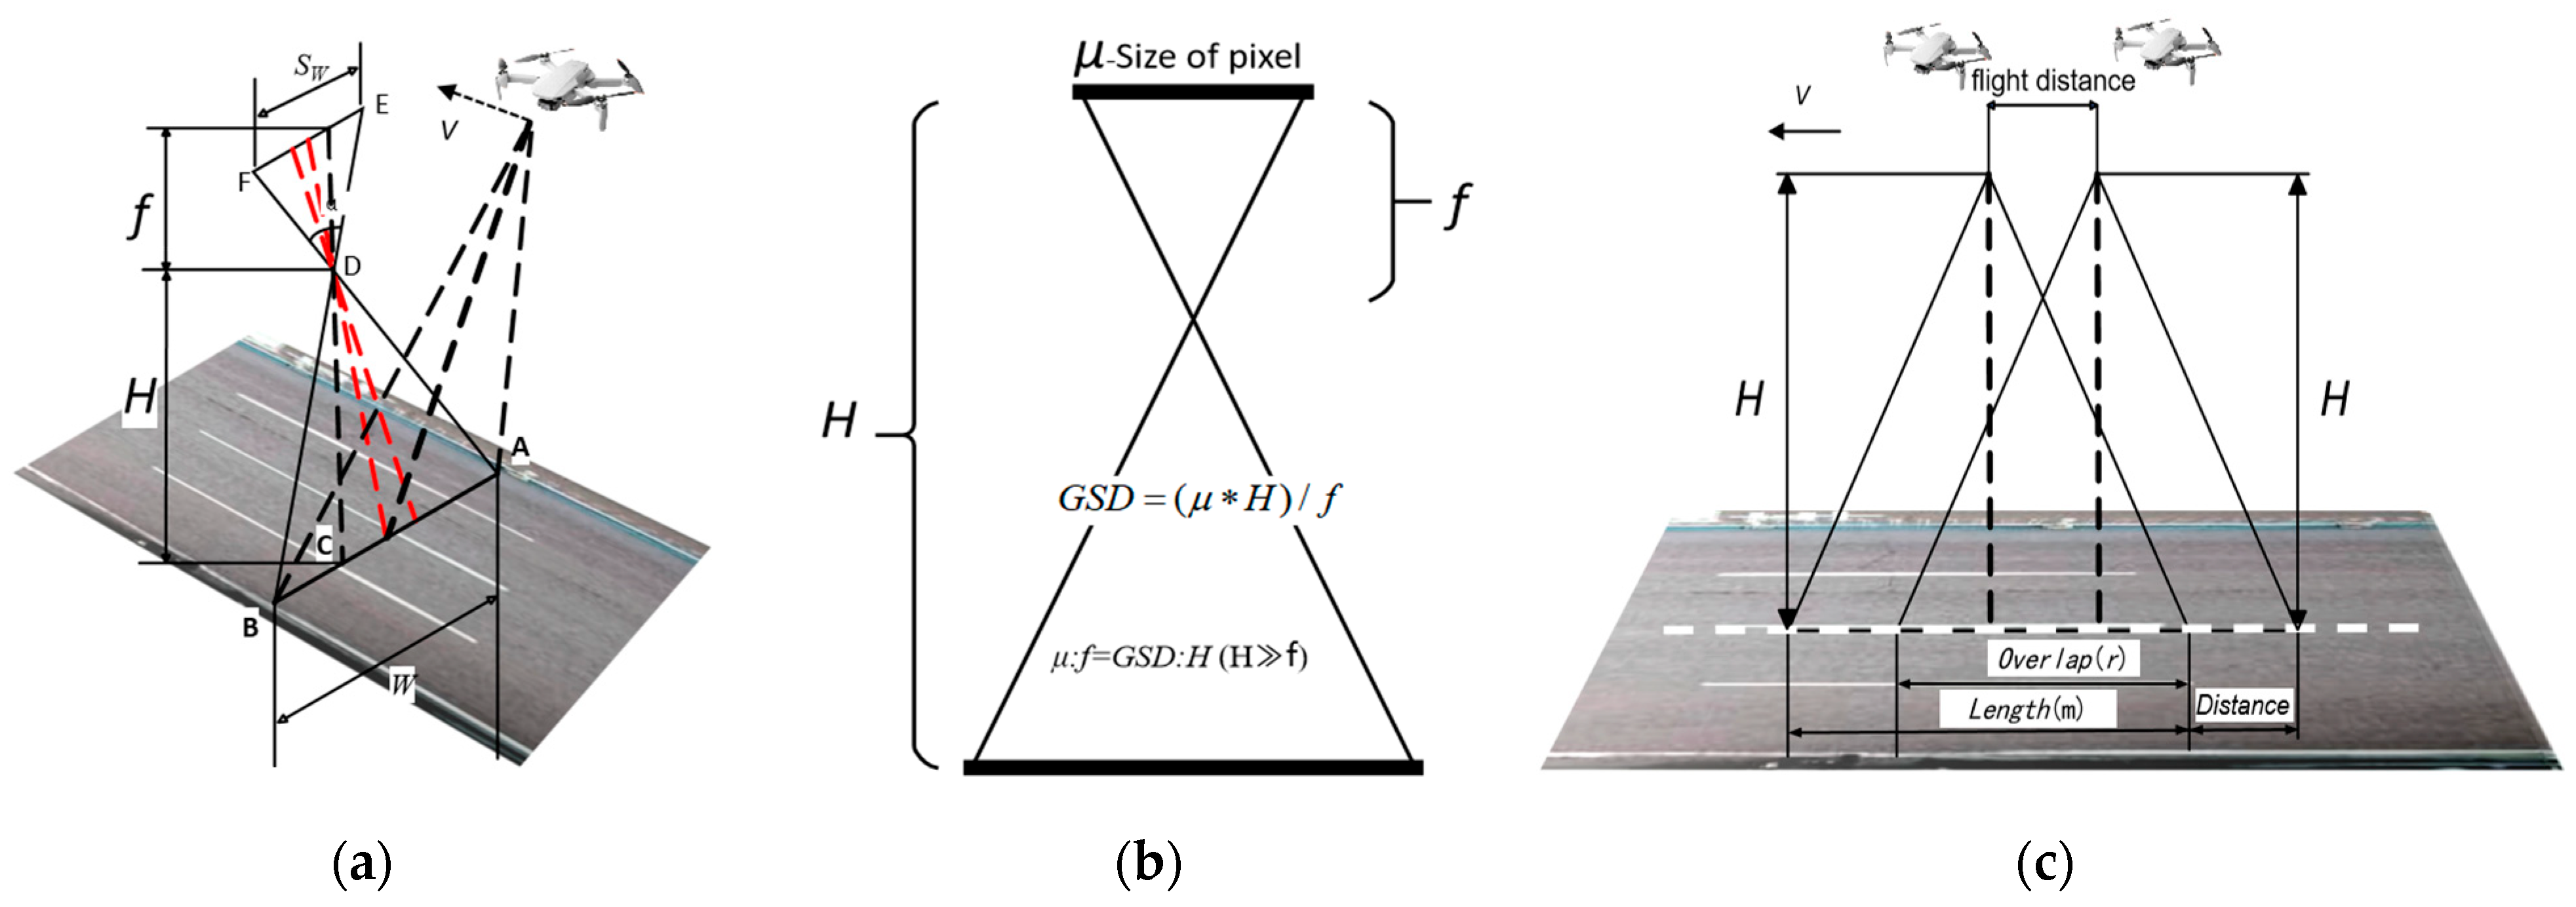
4.1.1. Flight Height
4.1.2. Ground Sampling
4.1.3. Flight Velocity
4.2. UAV Imagery Data Preprocessing
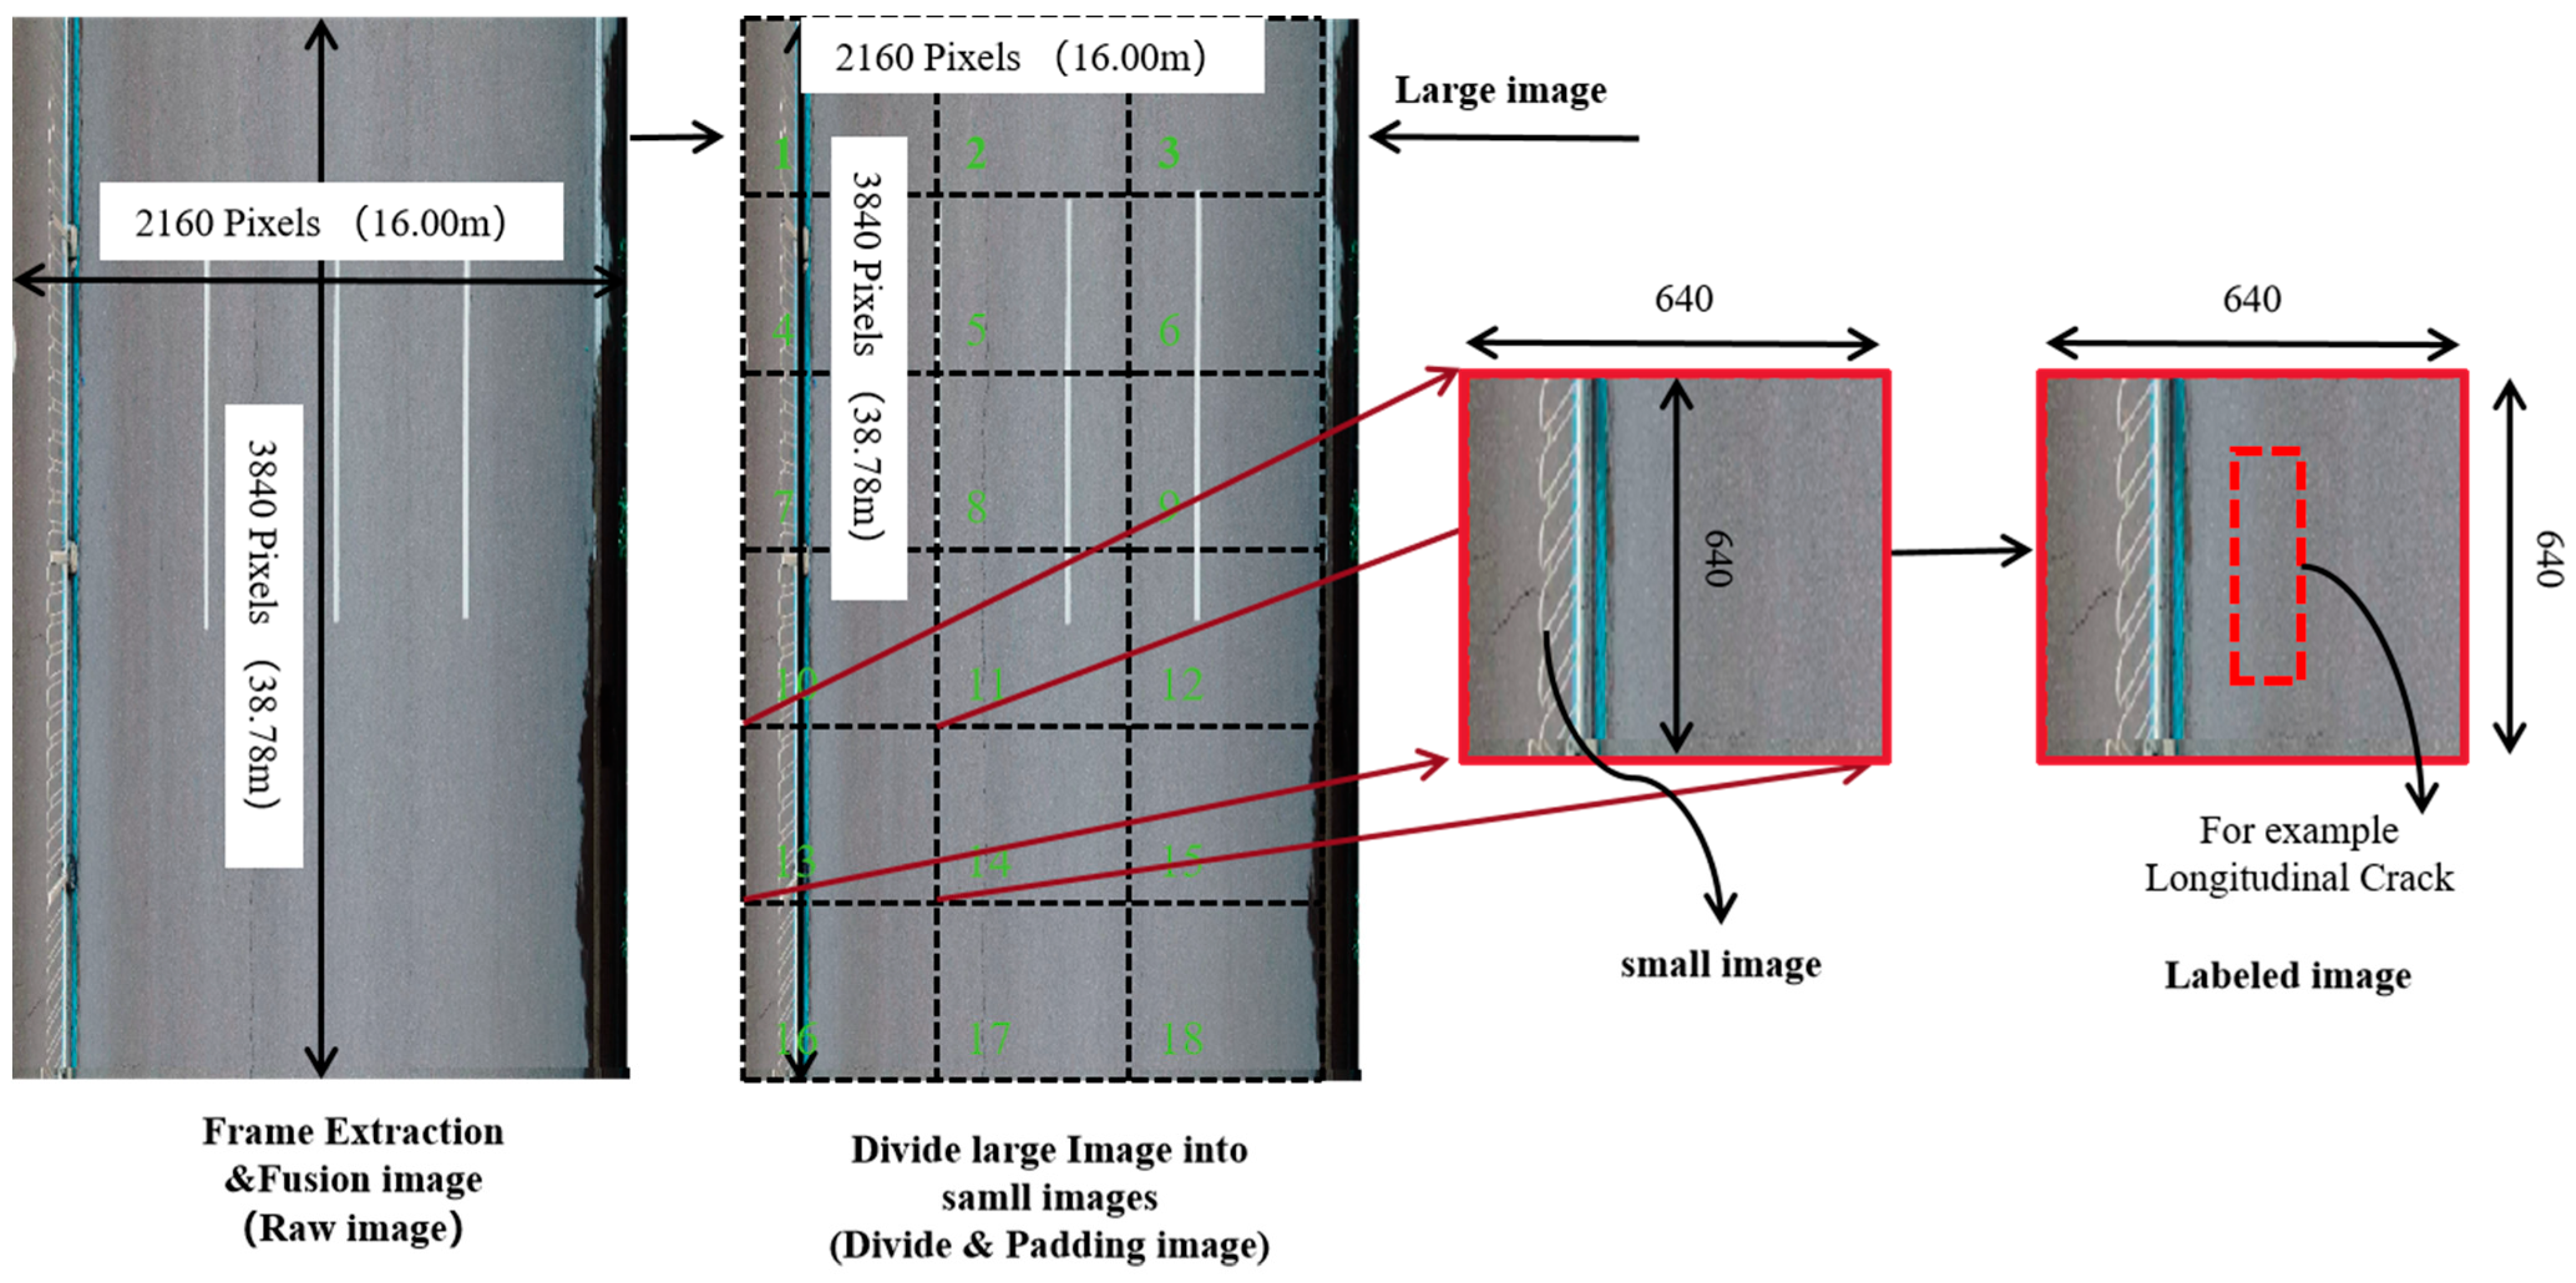
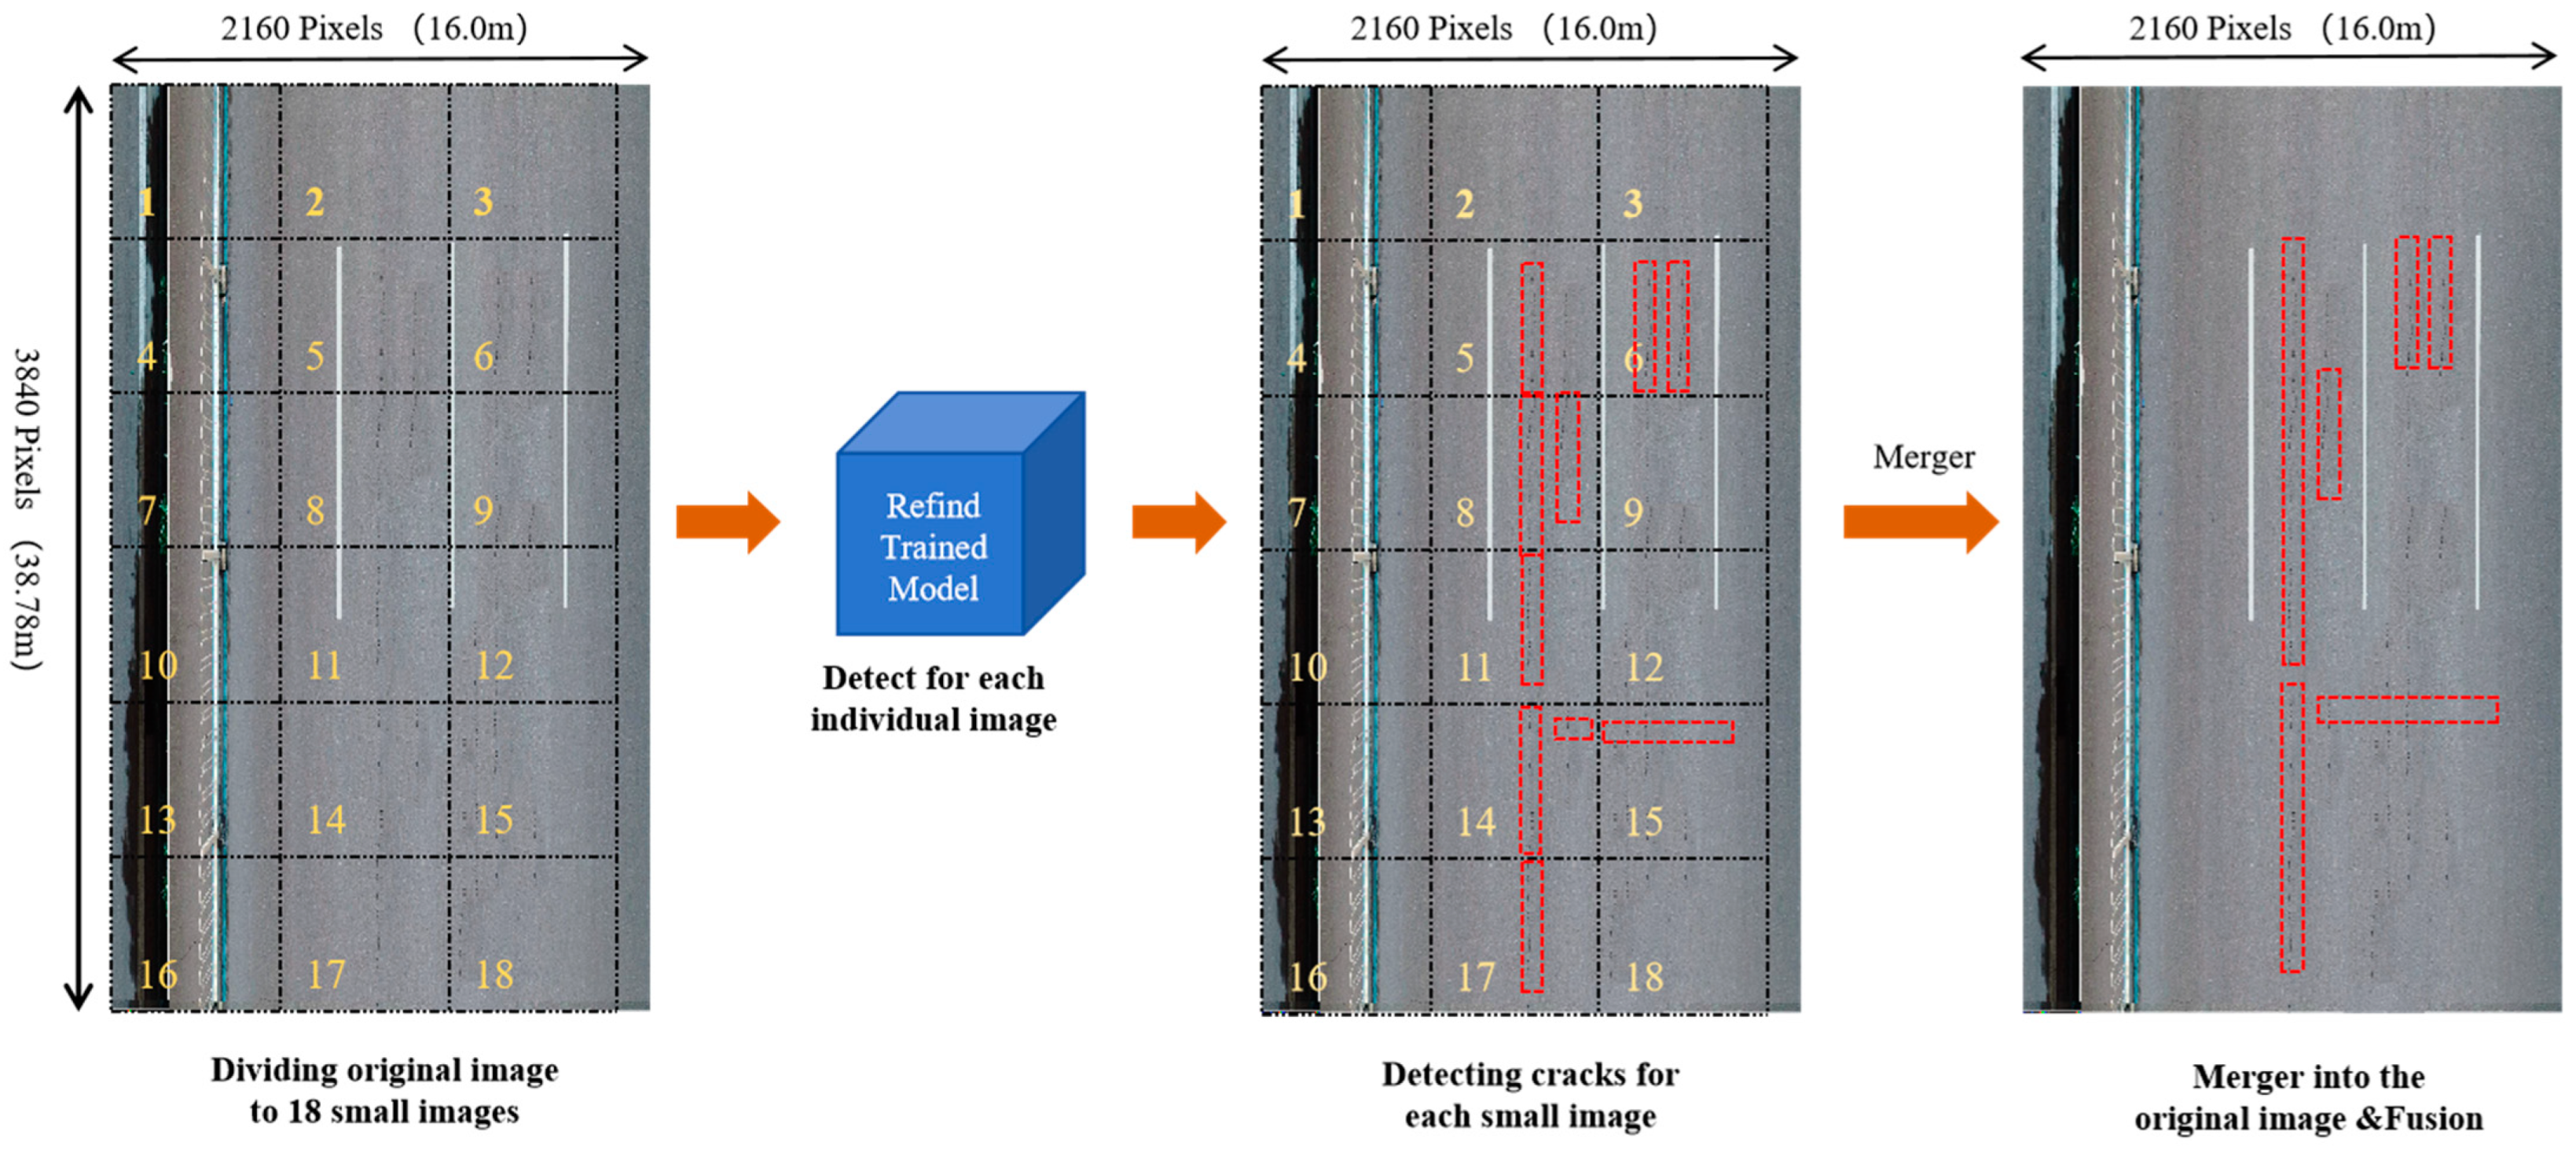
4.2.1. Frame Extraction and Fusion from UAV Imagery Video
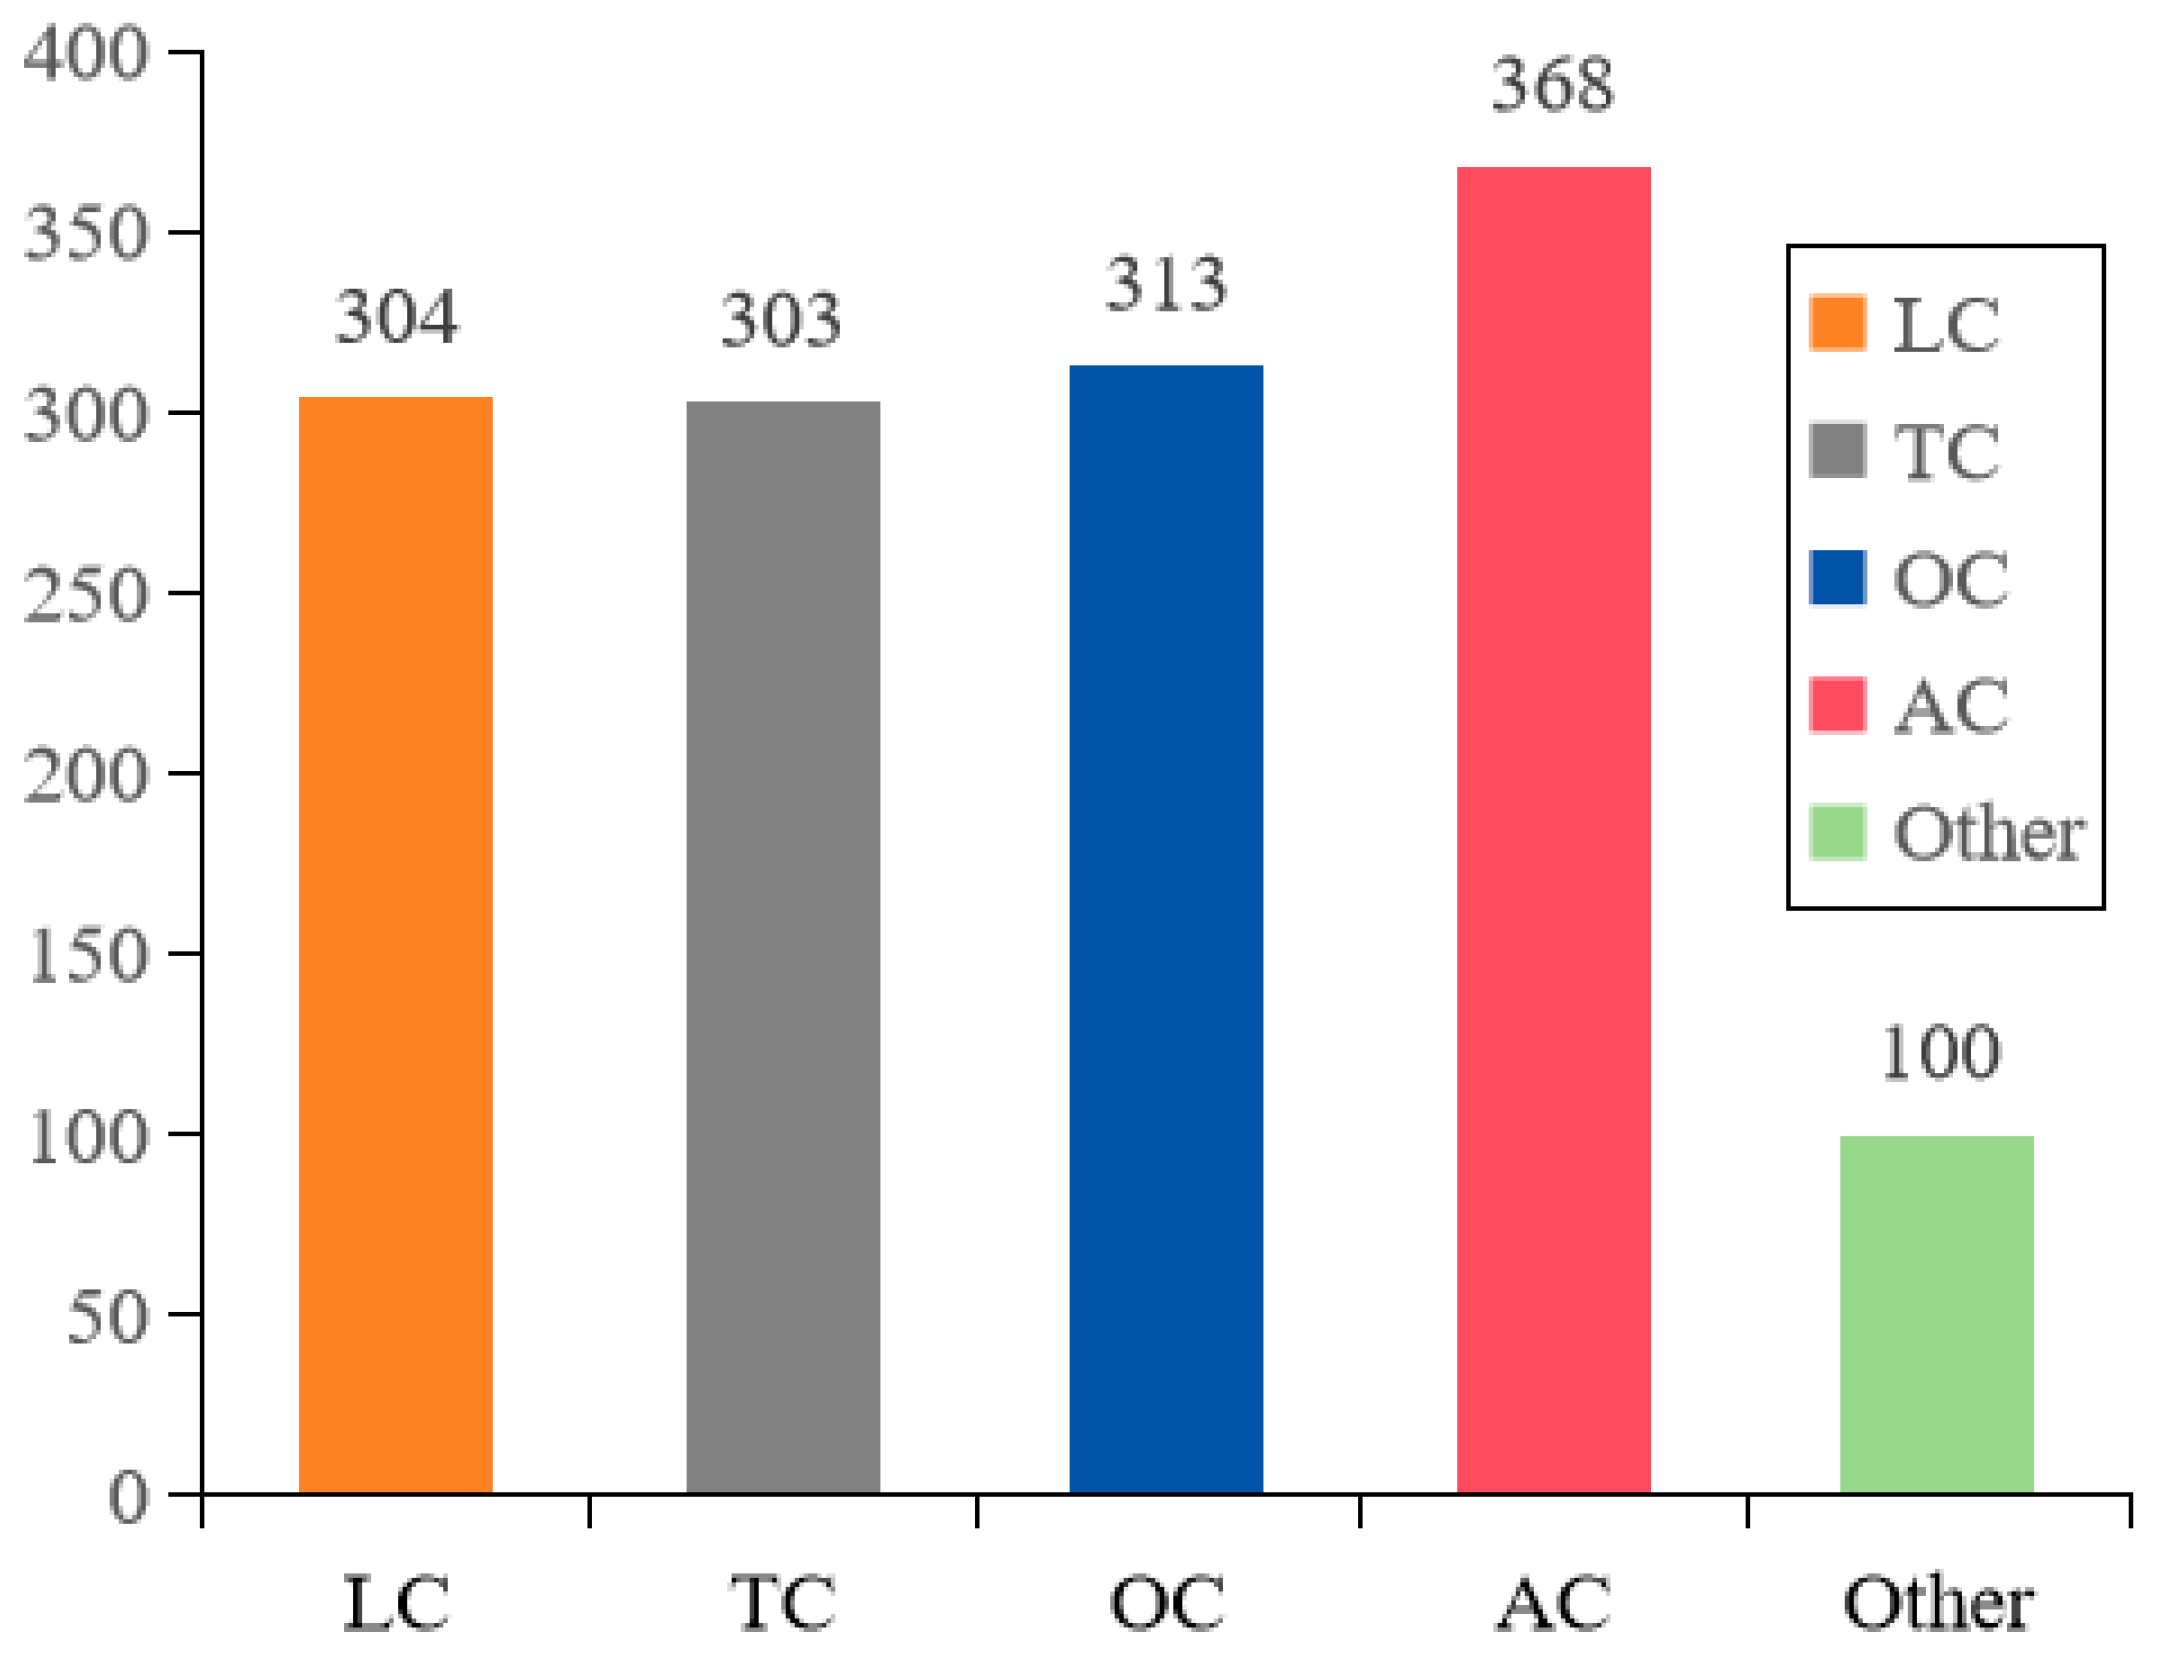
4.2.2. Pavement Cracks Datasets with GSD Information
5. Experiments and Results
5.1. Experimental Scenario
5.2. Experimental Configuration
5.3. Evaluation Metrics of Models
5.3.1. Running Performance
5.3.2. Accuracy Effectiveness
5.4. Experimental Results
5.4.1. Comparison Results of Running Performance
5.4.2. Comparison Results of Detection Accuracy
The Results of Overall Detection Accuracy
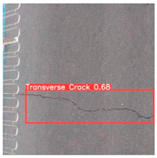
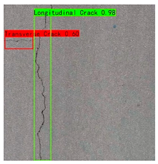
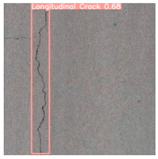
The Results of Detection Accuracy under Different Crack Types
- (i)
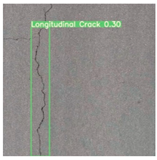
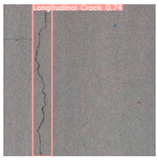
- Regarding the identification of longitudinal cracks (LC), the Faster-RCNN model exhibited the highest accuracy, with an average precision (AP) of 85.7% and the highest F1 value of 82.3%. In contrast, the YOLO series demonstrated a relatively inferior average precision, with YOLOv7-tiny exhibiting the lowest performance. Therefore, Faster-RCNN outperformed the other models in recognizing longitudinal cracks.
- (ii)
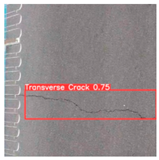
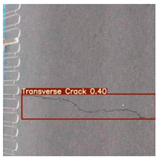
- For transverse cracks (TC), the YOLOv8s model achieved a superior recognition accuracy with an AP score of 89.5%, followed by YOLOv5s. Although there was a slight decrease in F1 score for YOLOv8s compared to YOLOv5s, their overall recognition accuracies did not significantly differ from each other; however, YOLOv7-tiny displayed a weaker recognition accuracy.
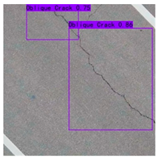
- (iii)
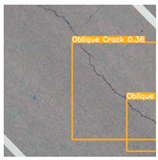
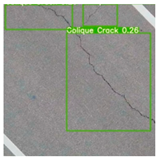
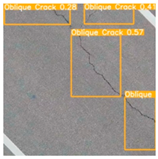
- All four algorithm models exhibit low recognition accuracy and F1 values for oblique cracks (OC) compared to the other types of cracks; however, among them, Faster-RCNN still maintained the highest level of recognition accuracy, while all models belonging to the YOLO series demonstrated lower levels of recognition accuracy—this explains why Faster-RCNN performed better overall.
- (iv)
- In terms of recognizing mesh cracks (AC), an outstanding performance was observed from the YOLOv8s model, which attained a remarkable recognition accuracy and F1 value at 91.0% and 90.6%, respectively; meanwhile, although slightly less effective than its counterpart, the YOLOv5s model also showcased a commendable performance, whereas a poor performance was exhibited by the YOLOv7-tiny model.
The Results of Detection Accuracy under Different Crack Datasets
The Results of Detection Effectiveness
6. Road Crack Measurements and Pavement Distress Evaluations
6.1. Measurement Methods of Pavement Cracks
- (i)
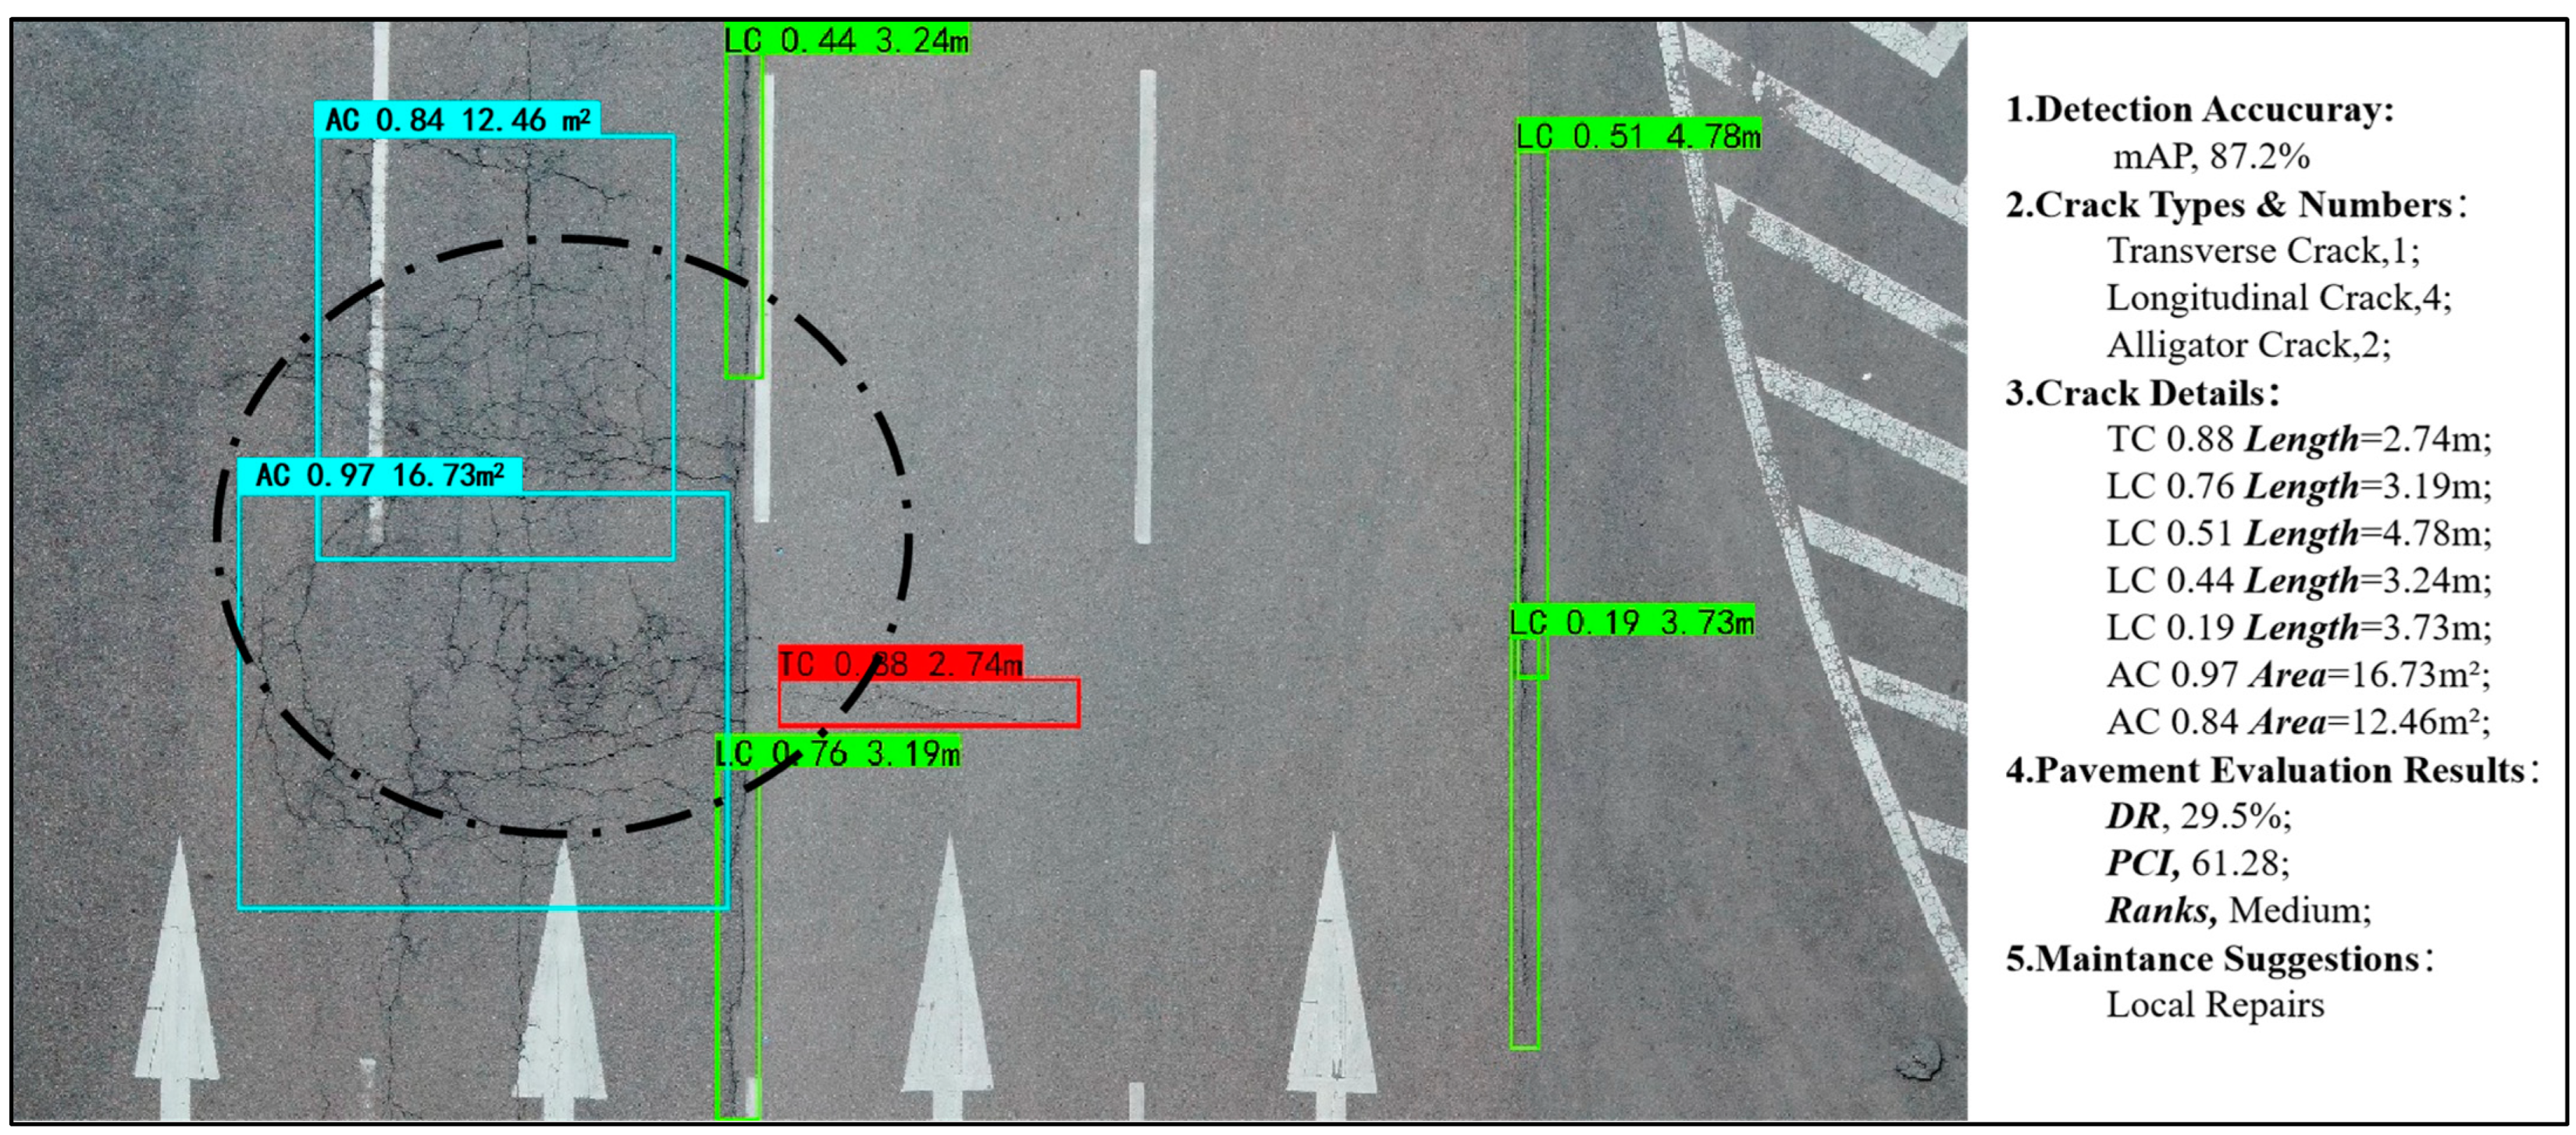
- Pavement Crack Location: The pixel position of the detected crack in the original UAV imagery can be determined based on the corresponding image number; meanwhile, the actual ground position can be inferred through GSD calculation.
- (ii)
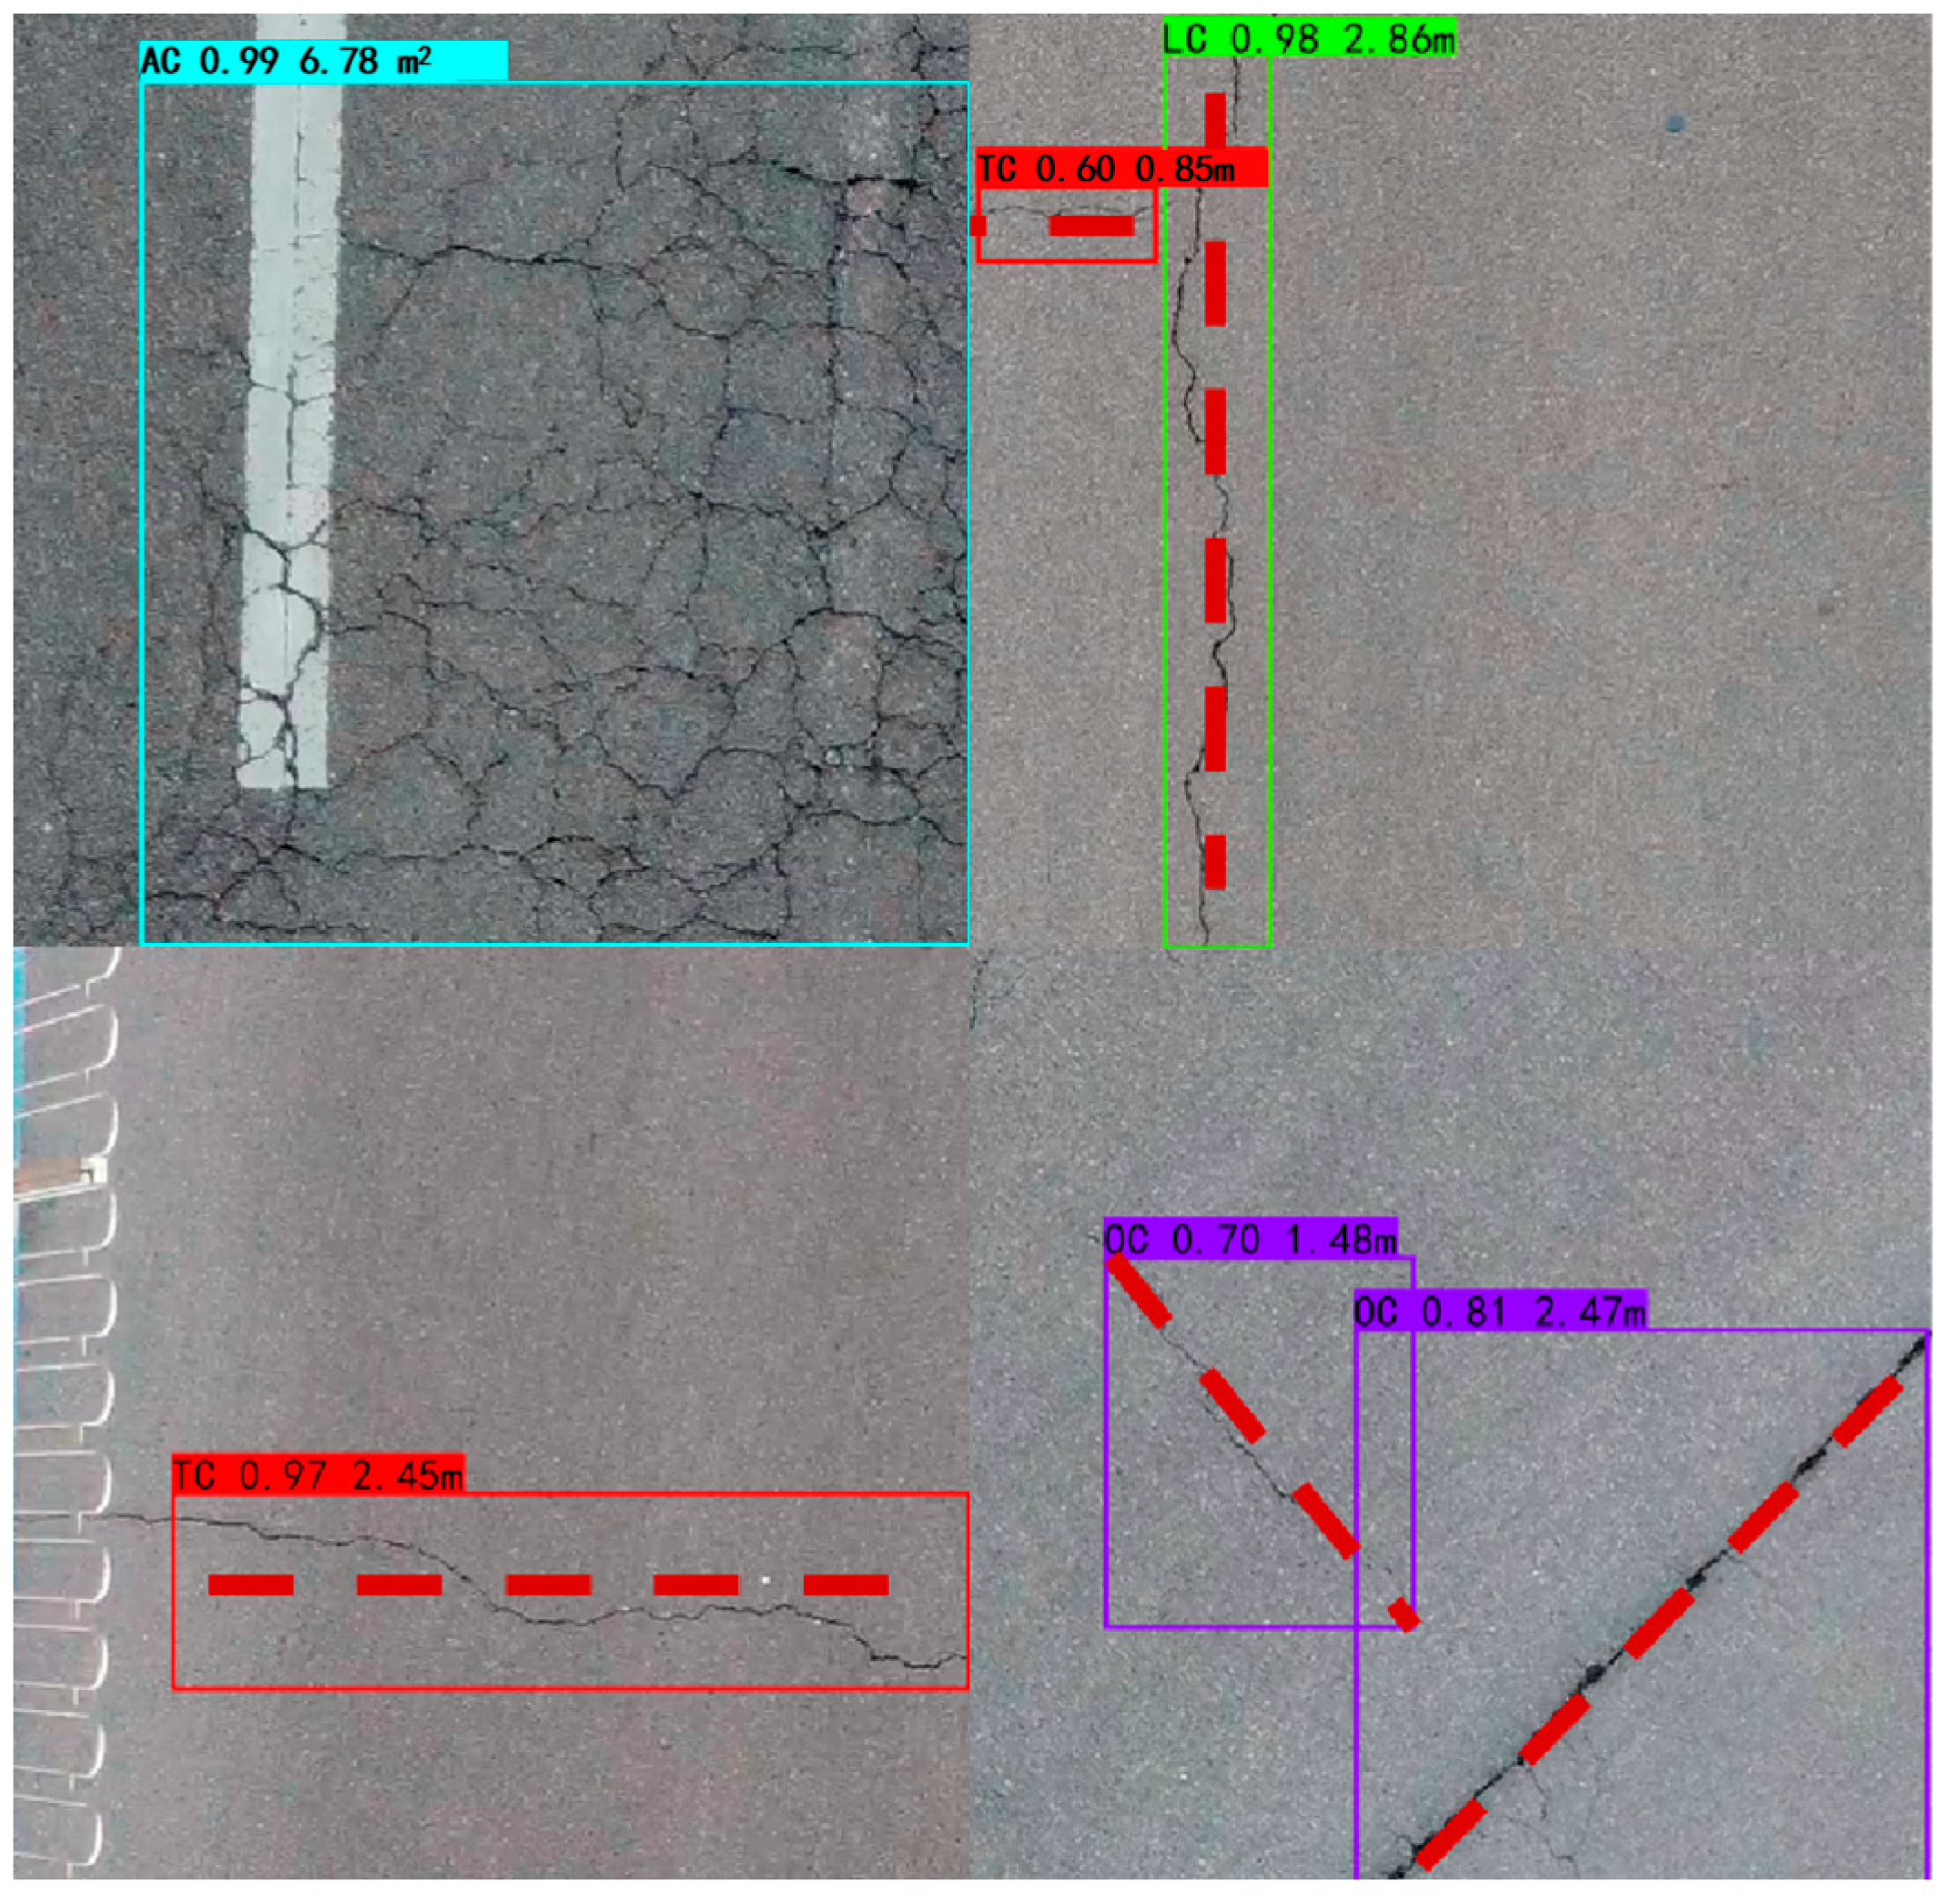
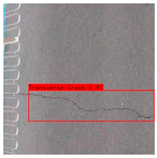
- Pavement Crack Length: This can be determined based on the pixel size of the confidence frame model, as illustrated in Figure 11. Horizontal cracks are measured by their horizontal border pixel lengths; vertical cracks by their vertical border pixel lengths; diagonal cracks by estimated border diagonal distance pixels; and mesh cracks primarily by measuring border pixel areas.
- (iii)
- Pavement Crack Width: The maximum width of a crack can be determined by identifying the region with the highest concentration of extracted crack pixels.
- (iv)
- Pavement Crack Area: This mainly aims at alligator cracks (AC), with a measurement of the crack area. It can be calculated by the pixels of AC based on the confidence frame model.
6.2. Evaluation Methods of Pavement Distress
6.3. Visualization Results of Pavement Distress
7. Discussion
8. Conclusions
Author Contributions
Funding
Institutional Review Board Statement
Informed Consent Statement
Data Availability Statement
Acknowledgments
Conflicts of Interest
References
- Samadzadegan, F.; Dadrass Javan, F.; Hasanlou, M.; Gholamshahi, M.; Ashtari Mahini, F. Automatic Road Crack Recognition Based on Deep Learning Networks from UAV Imagery. ISPRS Ann. Photogramm. Remote Sens. Spat. Inf. Sci. 2023, X-4/W1-2022, 685–690. [Google Scholar] [CrossRef]
- Zhu, J.; Zhong, J.; Ma, T.; Huang, X.; Zhang, W.; Zhou, Y. Pavement distress detection using convolutional neural networks with images captured via UAV. Autom. Constr. 2022, 133, 103991. [Google Scholar] [CrossRef]
- Cao, J.; Yang, G.T.; Yang, X.Y. Pavement Crack Detection with Deep Learning Based on Attention Mechanism. J. Comput. Aided Des. Comput. Graph. 2020, 32, 1324–1333. [Google Scholar]
- Qi, S.; Li, G.; Chen, D.; Chai, M.; Zhou, Y.; Du, Q.; Cao, Y.; Tang, L.; Jia, H. Damage Properties of the Block-Stone Embankment in the Qinghai–Tibet Highway Using Ground-Penetrating Radar Imagery. Remote Sens. 2022, 14, 2950. [Google Scholar] [CrossRef]
- Guo, S.; Xu, Z.; Li, X.; Zhu, P. Detection and Characterization of Cracks in Highway Pavement with the Amplitude Variation of GPR Diffracted Waves: Insights from Forward Modeling and Field Data. Remote Sens. 2022, 14, 976. [Google Scholar] [CrossRef]
- Salman, M.; Mathavan, S.; Kamal, K.; Rahman, M. Pavement crack detection using the Gabor filter. In Proceedings of the 16th international IEEE Conference on Intelligent Transportation Systems (ITSC 2013), The Hague, The Netherlands, 6–9 October 2013; pp. 2039–2044. [Google Scholar] [CrossRef]
- Ayenu-Prah, A.; Attoh-Okine, N. Evaluating pavement cracks with bidimensional empirical mode decomposition. EURASIP J. Adv. Signal Process. 2008, 2008, 861701. [Google Scholar] [CrossRef]
- Majidifard, H.; Adu-Gyamfi, Y.; Buttlar, W.G. Deep machine learning approach to develop a new asphalt pavement condition index. Constr. Build. Mater. 2020, 247, 118513. [Google Scholar] [CrossRef]
- Krizhevsky, A.; Sutskever, I.; Hinton, G.E. ImageNet classification with deep convolutional neural networks. Commun. ACM 2017, 60, 84–90. [Google Scholar] [CrossRef]
- Tran, V.P.; Tran, T.S.; Lee, H.J.; Kim, K.D.; Baek, J.; Nguyen, T.T. One stage detector (RetinaNet)-based crack detection for asphalt pavements considering pavement distresses and surface objects. J. Civ. Struct. Health Monit. 2021, 11, 205–222. [Google Scholar] [CrossRef]
- Xiao, L.Y.; Li, W.; Yuan, B.; Cui, Y.Q.; Gao, R.; Wang, W.Q. Pavement Crack Automatic Identification Method Based on Improved Mask R-CNN Model. Geomat. Inf. Sci. Wuhan Univ. 2022, 47, 623–631. [Google Scholar] [CrossRef]
- Xu, K.; Ma, R.G. Crack detection of asphalt pavement based on improved faster RCNN. Comput. Syst. Appl. 2022, 31, 341–348. [Google Scholar] [CrossRef]
- Xu, X.; Zhao, M.; Shi, P.; Ren, R.; He, X.; Wei, X.; Yang, H. Crack detection and comparison study based on faster R-CNN and mask R-CNN. Sensors 2022, 22, 1215. [Google Scholar] [CrossRef]
- Yan, K.; Zhang, Z. Automated asphalt highway pavement crack detection based on deformable single shot multi-box detector under a complex environment. IEEE Access 2021, 9, 150925–150938. [Google Scholar] [CrossRef]
- Yokoyama, S.; Matsumoto, T. Development of an automatic detector of cracks in concrete using machine learning. Procedia Eng. 2017, 171, 1250–1255. [Google Scholar] [CrossRef]
- Jiang, Y.T.; Yan, H.T.; Zhang, Y.R.; Wu, K.Q.; Liu, R.Y.; Lin, C.Y. RDD-YOLOv5: Road Defect Detection Algorithm with Self-Attention Based on Unmanned Aerial Vehicle Inspection. Sensors 2023, 23, 8241. [Google Scholar] [CrossRef] [PubMed]
- Zhang, Y.; Zuo, Z.; Xu, X.; Wu, J.; Zhu, J.; Zhang, H.; Wang, J.; Tian, Y. Road damage detection using UAV images based on multi-level attention mechanism. Autom. Constr. 2022, 144, 104613. [Google Scholar] [CrossRef]
- Zhou, Q.; Ding, S.; Qing, G.; Hu, J. UAV vision detection method for crane surface cracks based on Faster R-CNN and image segmentation. J. Civ. Struct. Health Monit. 2022, 12, 845–855. [Google Scholar] [CrossRef]
- Xiang, X.; Hu, H.; Ding, Y.; Zheng, Y.; Wu, S. GC-YOLOv5s: A Lightweight Detector for UAV Road Crack Detection. Appl. Sci. 2023, 13, 11030. [Google Scholar] [CrossRef]
- Wang, X.; Gao, H.; Jia, Z.; Li, Z. BL-YOLOv8: An Improved Road Defect Detection Model Based on YOLOv8. Sensors 2023, 23, 8361. [Google Scholar] [CrossRef] [PubMed]
- Omoebamije, O.; Omoniyi, T.M.; Musa, A.; Duna, S. An improved deep learning convolutional neural network for crack detection based on UAV images. Innov. Infrastruct. Solut. 2023, 8, 236. [Google Scholar] [CrossRef]
- Zhao, Y.; Zhou, L.; Wang, X.; Wang, F.; Shi, G. Highway Crack Detection and Classification Using UAV Remote Sensing Images Based on CrackNet and CrackClassification. Appl. Sci. 2023, 13, 7269. [Google Scholar] [CrossRef]
- Liu, K. Learning-based defect recognitions for autonomous uav inspections. arXiv 2023, arXiv:2302.06093v1. [Google Scholar]
- Zou, Z.; Chen, K.; Shi, Z.; Guo, Y.; Ye, J. Object detection in 20 years: A survey. Proc. IEEE 2023, 111, 257–276. [Google Scholar] [CrossRef]
- Bubbliiiing. Faster-RCNN-PyTorch[CP]. 2023. Available online: https://github.com/bubbliiiing/faster-rcnn-pytorch (accessed on 26 January 2024).
- UItralyics. YOLOv5[CP]. 2020. Available online: https://github.com/ultralytics/yolov5 (accessed on 26 January 2024).
- Wong, K.Y. YOLOv7[CP]. 2023. Available online: https://github.com/WongKinYiu/yolov7 (accessed on 26 January 2024).
- Ultralytics. YOLOv8[CP]. 2023. Available online: https://github.com/ultralytics/ultralytics (accessed on 26 January 2024).
- Ren, S.; He, K.; Girshick, R.; Sun, J. Faster r-cnn: Towards real-time object detection with region proposal networks. Adv. Neural Inf. Process. Syst. 2015, 28, 1137–1149. [Google Scholar] [CrossRef]
- Buda, M.; Maki, A.; Mazurowski, M.A. A systematic study of the class imbalance problem in convolutional neural networks. Neural Netw. 2018, 106, 249–259. [Google Scholar] [CrossRef]
- Sami, A.A.; Sakib, S.; Deb, K.; Sarker, I.H. Improved YOLOv5-Based Real-Time Road Pavement Damage Detection i-n Road Infrastructure Management. Algorithms 2023, 16, 452. [Google Scholar] [CrossRef]
- Faramarzi, M. Road damage detection and classification using deep neural networks (YOLOv4) with smartphone images. SSRN 2020. [Google Scholar] [CrossRef]
- CJJ36-2016; Technical Code of Maintenance for Urban Road. Ministry of Housing and Urban-Rural Development of the People’s Pepublic of China: Beijing, China, 2017. Available online: https://www.mohurd.gov.cn/gongkai/zhengce/zhengcefilelib/201702/20170228_231174.html (accessed on 10 May 2023).
- JTG 5210-2018; Highway Performance Assessment Standards. Ministry of Transport of the People’s Republic of China: Beijing, China, 2018. Available online: https://xxgk.mot.gov.cn/2020/jigou/glj/202006/t20200623_3313114.html (accessed on 10 May 2023).


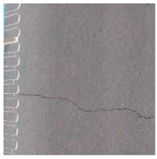
| Longitudinal Crack (LC) | Transverse Crack (TC) | Oblique Crack (OC) | Alligator Crack (AC) | No-Cracks (Other) |
|---|---|---|---|---|
 | 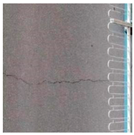 | 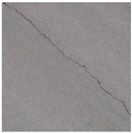 | 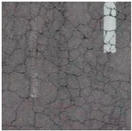 | 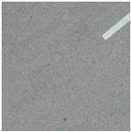 |
| Software | Configure | Matrix | Versions |
|---|---|---|---|
| Operating system | Windows10 | Python | 3.9 |
| CPU | Intel Core i5-9300H | PyTorch | 2.0 |
| GPU | NVIDIA GeoForce GTX 1660Ti 6G | CUDA | 11.8 |
| Models | Number of Parameters (×106) | Training Duration (h) | Memory Consumption (MB) | Video Memory Usage (GB) | FPS (f·s−1) |
|---|---|---|---|---|---|
| Faster-RCNN | 136.75 | 7.1 | 534.2 | 5.6 | 12.80 |
| YOLO v5s | 7.02 | 3.7 | 14.12 | 3.5 | 127.42 |
| YOLO v7-tiny | 6.01 | 3.8 | 12.01 | 1.9 | 82.56 |
| YOLO v8s | 11.13 | 3.1 | 21.98 | 3.6 | 125.74 |
| Models | Precision | Recall | F1-Score | mAP |
|---|---|---|---|---|
| Faster-RCNN | 75.6 | 76.4 | 75.3 | 79.3 |
| YOLO v5s | 75.1 | 71.0 | 72.6 | 74.0 |
| YOLO v7-tiny | 66.9 | 66.5 | 66.7 | 65.5 |
| YOLO v8s | 74.4 | 75.6 | 75.0 | 77.1 |
| Models | AP (%) | F1-Score | ||||||
|---|---|---|---|---|---|---|---|---|
| TC | LC | AC | OC | TC | LC | AC | OC | |
| Faster-RCNN | 85.7 | 83.4 | 60.2 | 87.8 | 82.3 | 78.0 | 58.1 | 82.9 |
| YOLO v5s | 75.5 | 87.4 | 43.8 | 89.1 | 72.3 | 86.5 | 43.5 | 88.0 |
| YOLO v7-tiny | 70.4 | 81.2 | 40.7 | 80.7 | 70.0 | 79.0 | 44.8 | 77.1 |
| YOLO v8s | 75.4 | 89.5 | 45.4 | 91.0 | 74.4 | 85.0 | 48.5 | 90.6 |
| Datasets | Faster-RCNN | YOLO v5s | YOLO v7-Tiny | YOLO v8s | ||||||||
|---|---|---|---|---|---|---|---|---|---|---|---|---|
| FPS (f.s−1) | F1 (%) | mAP (%) | FPS (f.s−1) | F1 (%) | mAP (%) | FPS (f.s−1) | F1 (%) | mAP (%) | FPS (f.s−1) | F1 (%) | mAP (%) | |
| UAPD [2] | 9.14 | 47.9 | 48.8 | 59.7 | 52.7 | 57.7 | 74.51 | 56.7 | 52.8 | 65.4 | 57.4 | 58.6 |
| RDD2022 [31] | 11.36 | 69.5 | 68.8 | 63.21 | 65.2 | 60.9 | 65.47 | 63.1 | 65.6 | 53.71 | 66.5 | 67.7 |
| UMSC [19] | 11.72 | 73.4 | 68.8 | 97.87 | 68.7 | 74.3 | 76.81 | 63.8 | 70.1 | 89.78 | 72.8 | 70.4 |
| UAVRoadCrack [21] | 10.57 | 68.9 | 68.5 | 108.6 | 77.8 | 75.7 | 75.39 | 62.5 | 65.3 | 69.36 | 71.0 | 68.8 |
| CrackForest [32] | / | 57.4 | 59.1 | / | 57.8 | 58.8 | 67.45 | 61.2 | 63.5 | 61.21 | 60.9 | 65.2 |
| Our Datasets | 12.80 | 75.3 | 79.3 | 127.4 | 72.6 | 74.0 | 82.56 | 66.7 | 65.5 | 125.7 | 75.0 | 77.1 |
| Input Images | Faster-RCNN | YOLOv5s | YOLOv7-Tiny | YOLOv8s |
|---|---|---|---|---|
 |  |  |  |  |
 |  |  |  |  |
 |  |  |  |  |
 | 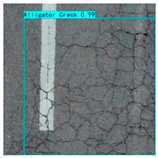 |  | 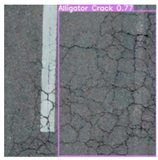 | 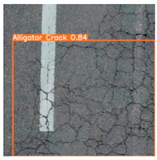 |
Disclaimer/Publisher’s Note: The statements, opinions and data contained in all publications are solely those of the individual author(s) and contributor(s) and not of MDPI and/or the editor(s). MDPI and/or the editor(s) disclaim responsibility for any injury to people or property resulting from any ideas, methods, instructions or products referred to in the content. |
© 2024 by the authors. Licensee MDPI, Basel, Switzerland. This article is an open access article distributed under the terms and conditions of the Creative Commons Attribution (CC BY) license (https://creativecommons.org/licenses/by/4.0/).
Share and Cite
Chen, X.; Liu, C.; Chen, L.; Zhu, X.; Zhang, Y.; Wang, C. A Pavement Crack Detection and Evaluation Framework for a UAV Inspection System Based on Deep Learning. Appl. Sci. 2024, 14, 1157. https://doi.org/10.3390/app14031157
Chen X, Liu C, Chen L, Zhu X, Zhang Y, Wang C. A Pavement Crack Detection and Evaluation Framework for a UAV Inspection System Based on Deep Learning. Applied Sciences. 2024; 14(3):1157. https://doi.org/10.3390/app14031157
Chicago/Turabian StyleChen, Xinbao, Chang Liu, Long Chen, Xiaodong Zhu, Yaohui Zhang, and Chenxi Wang. 2024. "A Pavement Crack Detection and Evaluation Framework for a UAV Inspection System Based on Deep Learning" Applied Sciences 14, no. 3: 1157. https://doi.org/10.3390/app14031157
APA StyleChen, X., Liu, C., Chen, L., Zhu, X., Zhang, Y., & Wang, C. (2024). A Pavement Crack Detection and Evaluation Framework for a UAV Inspection System Based on Deep Learning. Applied Sciences, 14(3), 1157. https://doi.org/10.3390/app14031157