1. Introduction
The FMEA is a method to describe the mode of effect and fails to quantify its impact [
1]. The FMEA is a preventive and detailed technique to describe failure modes in a system, evaluate its impact and plan corrective actions. Furthermore, the FMEA is a qualitative and quantitative risk assessment and depends mainly on the knowledge of specialists [
2]. The design of an FMEA involves the formation of a committee with members from all areas of an organization, with the objective of defining, describing, quantifying and planning the solutions of the risks of the system to achieve correct functionality. The quantification of the Risk Priority Number (RPN) integrates linguistic uncertainty through a qualitative analysis of the severity (s), occurrence (o) and detection (d) factors based on their knowledge and experience. A different proposal for the analysis of the RPN is that of the authors of [
3], where they developed an FMEA by analyzing only pairs of combinations of the evaluation factors o, s and d; that is to say, instead of evaluating them simultaneously, only the three possible combinations s and o, s and d, o and d were evaluated.
Fuzzy Inference Systems (FISs) emulate human reasoning and represent non-statistical uncertainty as one of their main advantages and capabilities [
4]. However, traditional FISs are not able to model randomness [
5,
6]. Moreover, theory and fuzzy sets are recognized as a powerful tool for modeling systems with inaccurate data entries, such as the conceptualization and interpretation of experts [
7]. In a general interpretation, an FIS behavior is described qualitatively using a natural language known as the expert-driven approach. From a specific interpretation, the FIS behavior is described quantitatively using fuzzy numbers.
Due to the presence of subjectivity when applying the FMEA method, numerous improved FIS versions have been presented; for example, the authors of [
8] introduced a fuzzy FMEA to adequately express non-stochastic uncertainty and provide a robust risk picture compared to the overestimated or underestimated crisp RPN values. Moreover, the work of [
9] proposed a new risk management approach known as the fuzzy rule base interface system in order to mitigate the failures. In the same way, the authors of [
10,
11,
12,
13,
14,
15,
16] used the FMEA in order to identify and evaluate possible modes of failure, their causes and their effects. The defined the FMEA as a systematic analysis tool for product design. In each of the investigations cited, the severity, occurrence and detection factors were not give any weighting, and neither did the authors take into consideration any mechanism that relates them to the objective of improving the accuracy of their results compared to the conventional FMEA. Additionally, ref. [
17] developed a diffuse FMEA in the aeronautical sector. They used triangular and trapezoidal membership functions. They compared it with a conventional FMEA, and the results were consistent among both. With the diffuse system, they obtained a more realistic representation of the risks analyzed.
Fuzzy systems research has shown that the concept of membership and the concept of probability are different [
18]. Moreover, studies have argued that fuzziness uncertainty and stochastic uncertainty are complementary and do not represent the same phenomenon [
4]. Furthermore, probabilistic fuzzy systems combine a linguistic description of the system behavior with the statistical properties of data [
19]. In this way, the fuzzy probabilistic set is designed to handle uncertainties with a blurred and stochastic nature, so the fuzzy probabilistic logic system has the ability to handle more complex uncertainties in the process [
20]. Generally, practical applications involve the conceptualization of the problem by integrating linguistic uncertainty and the use of data by integrating stochastic uncertainty. Therefore, it is needed to design a unified platform to process uncertainties that contain vague and stochastic characteristics using statistical analyses and linguistic interpretation [
21].
The use of Bayesian networks (BNs) has been integrated into improved FMEA versions integrating stochastic uncertainty and conditional probabilities into models. A BN has an advantage in dealing with uncertainty [
22]. Therefore, a good FMEA has the necessary features to build a good BN: a bottom–up (or top–down) analysis of all the components, subcomponents and cause–failure–effect chains [
23]. Moreover, the work of [
24] presented the use of a BN as a new methodology for encoding the design of FMEA models of mechatronic systems. In the same way, the authors of [
25] combined FMEA and Fault Tree Analysis based on a BN to form a fault diagnosis analysis model to conduct quantitative failure diagnoses based on the given priori probability and the specific posterior evidence. Additionally, the authors of [
26] developed a dynamic and comprehensive quantitative risk analysis approach for the accident scenario and risk modeling of natural gas stations based on a bow-tie diagram and a BN to model the worst-case accident scenario and to assess the risks. Likewise, the work of [
27] implemented a prototype of a hybrid expert system for the diagnosis of embedded software by integrating a case-based reasoning with a BN through FMEA-style case-based reasoning (F-CBR) with the corresponding failure spectra as the bridge. They used GeNIe 2.0 software to achieve dynamic reasoning results. Finally, BNs are used to identify the most critical failure causes in the transistor and metal-oxide semiconductor field-effect capacitor. As a result of BN analyses, high temperature and overvoltage are distinguished as the most crucial failure causes [
28].
In these works, multiple failure modes and effects are related in a BN, and the conditional probability of the network represents the output variable. In these cases, the linguistic uncertainty is not considered, unlike our research where linguistic uncertainty and stochastic uncertainty are used, in addition to the Bayesian theorem being used as a mechanism of attention to determine the posterior probabilistic of the input variables without making use of a BN as in the investigations cited.
Regarding the integration of FMEA with FIS and BN, there needs to be more document publications in the literature. The authors of [
29] compared the results of the FMEA and the subjective probability values of its improved proposal integrating the diffuse Bayesian network (FBN) and the best–worst diffuse method (FBWM) to evaluate failures in plastic production. In this research, they use fuzzy membership functions to analyze input variables to the system. They then use a method to weigh the best and worst factors, where the fuzzy domain is used as a probabilistic domain without theoretical support, unlike our proposed approach, where Gaussian Probabilistic Function is used to represent input variables and to give consistency to the use of the conditional probability theorem of Bayes as a mechanism of attention and relation or to weight the input variables to the system.
Additionally, the work of [
30] proposed a novel FMEA method by integrating the Bayesian Fuzzy Assessment Number (BFAN) and extended gray relational analysis–technique for order preference by similarity to the ideal solution (GRA-TOPSIS) method. In this research, they also use fuzzy membership functions to analyze input variables to the system. They then design a probability density function for each membership function and, finally, across the product between the estimated probability and the diffuse value, find the probabilistic fuzzy membership function. In contrast, in our proposed approach, GDF is used to represent input variables and give consistency to the use of the Bayes conditional probability theorem as a mechanism of attention and relationship or to weight input variables to the system.
Moreover, the authors of [
31] proposed the Probabilistic Fuzzy Naive Bayes classifier as a combination of probabilistic fuzzy systems and naive BN, which is also capable of simultaneously modeling both kinds of uncertainties. In this application, we can highlight that they did not develop a fuzzy system with a knowledge base; they only gave a linguistic interpretation to the GFD, and they used the Bayes theorem for the classifier’s output, obtaining better results than a conventional naïve Bayes classifier. Therefore, the work of [
32] configured the supply chain, described the structure of a Bayesian network, and then determined a subsequent probability distribution for pending orders using a stochastic simulation based on Markov blankets. In this application, they do not develop a knowledge base as a system inference. They only determine the posteriori outputs with Bayes’ theorem. Furthermore, ref. [
33] presented a robust methodology using the FMEA to detail the operational risks of the ballasting and de-ballasting process, reduced the subjectivity of RPN assessments with the evidence reasoning tool, and developed a Bayesian network to analyze the risk relationships of variables and quantify the power of the FMEA. In this paper, a Bayesian network was developed to conceptualize the risk system, unlike our proposal, which is conceptualized as a diffuse probabilistic system, where the Bayes theorem is used as a mechanism of attention to relate risk variables.
In summary, FIS establishes a set of If–Then fuzzy rules that relate an antecedent structure with a consequent structure with a high interpretation of the system but do not contribute to the accuracy of the results. Generally, the antecedents of fuzzy rules are established objectively as being a combinatorial problem. On the contrary, at the stage of defining the consequence, there is the presence of subjectivity and imprecision because the fuzzy numbers of the structures do not need a linguistic interpretation. Nevertheless, the experts make their respective interpretations. However, the importance of each input variable is irrelevant to the development of FIS, and the weighting of input variables needs to be considered. Therefore, this research is focused on maintaining the high interpretation of the model based on the expert-driven approach and improving the accuracy of the results by using probabilistic numbers, developing a mechanism of attention to relating their values to each probabilistic rule through the conditional probability of the Bayes theorem as a data-driven approach. Each input variable is assigned a priori weighting based on the importance of the variable. The developed attention mechanism determines a posteriori weighting of the input variable based on linguistic data domain behavior.
The significant contributions of this research are:
Using the Bayes theorem, an attention mechanism was developed to relate the input variables.
Proposal for a normalization stage to determine probabilities a posteriori.
GDF is used to determine probabilistic values to input variables.
A Bayesian classifier is proposed at the implication stage.
Integration of stochastic uncertainty using probability density functions and linguistic uncertainty when categorizing functions based on expert interpretation.
The rest of this manuscript is organized as follows.
Section 2 describes the proposed method.
Section 3 presents and discusses results of BLCS, and
Section 4 concludes the proposed method.
2. Materials and Methods
This article presents a methodology for developing the proposed BLCS as a novel attention mechanism. Initially, GDF is used. Additionally, the BLCS mechanism is presented to determine the probability of the linguistics rule given its allocation value in each of the input variables using the Bayes theorem. In addition, a normalization step is proposed to determine the a posteriori probability of each input variable. In the involvement stage, a Bayesian classifier is used to identify the linguistics rule with the highest value. Finally, a weighted evaluation uses the respective standardized probabilities of the fuzzy rule identified with the highest value.
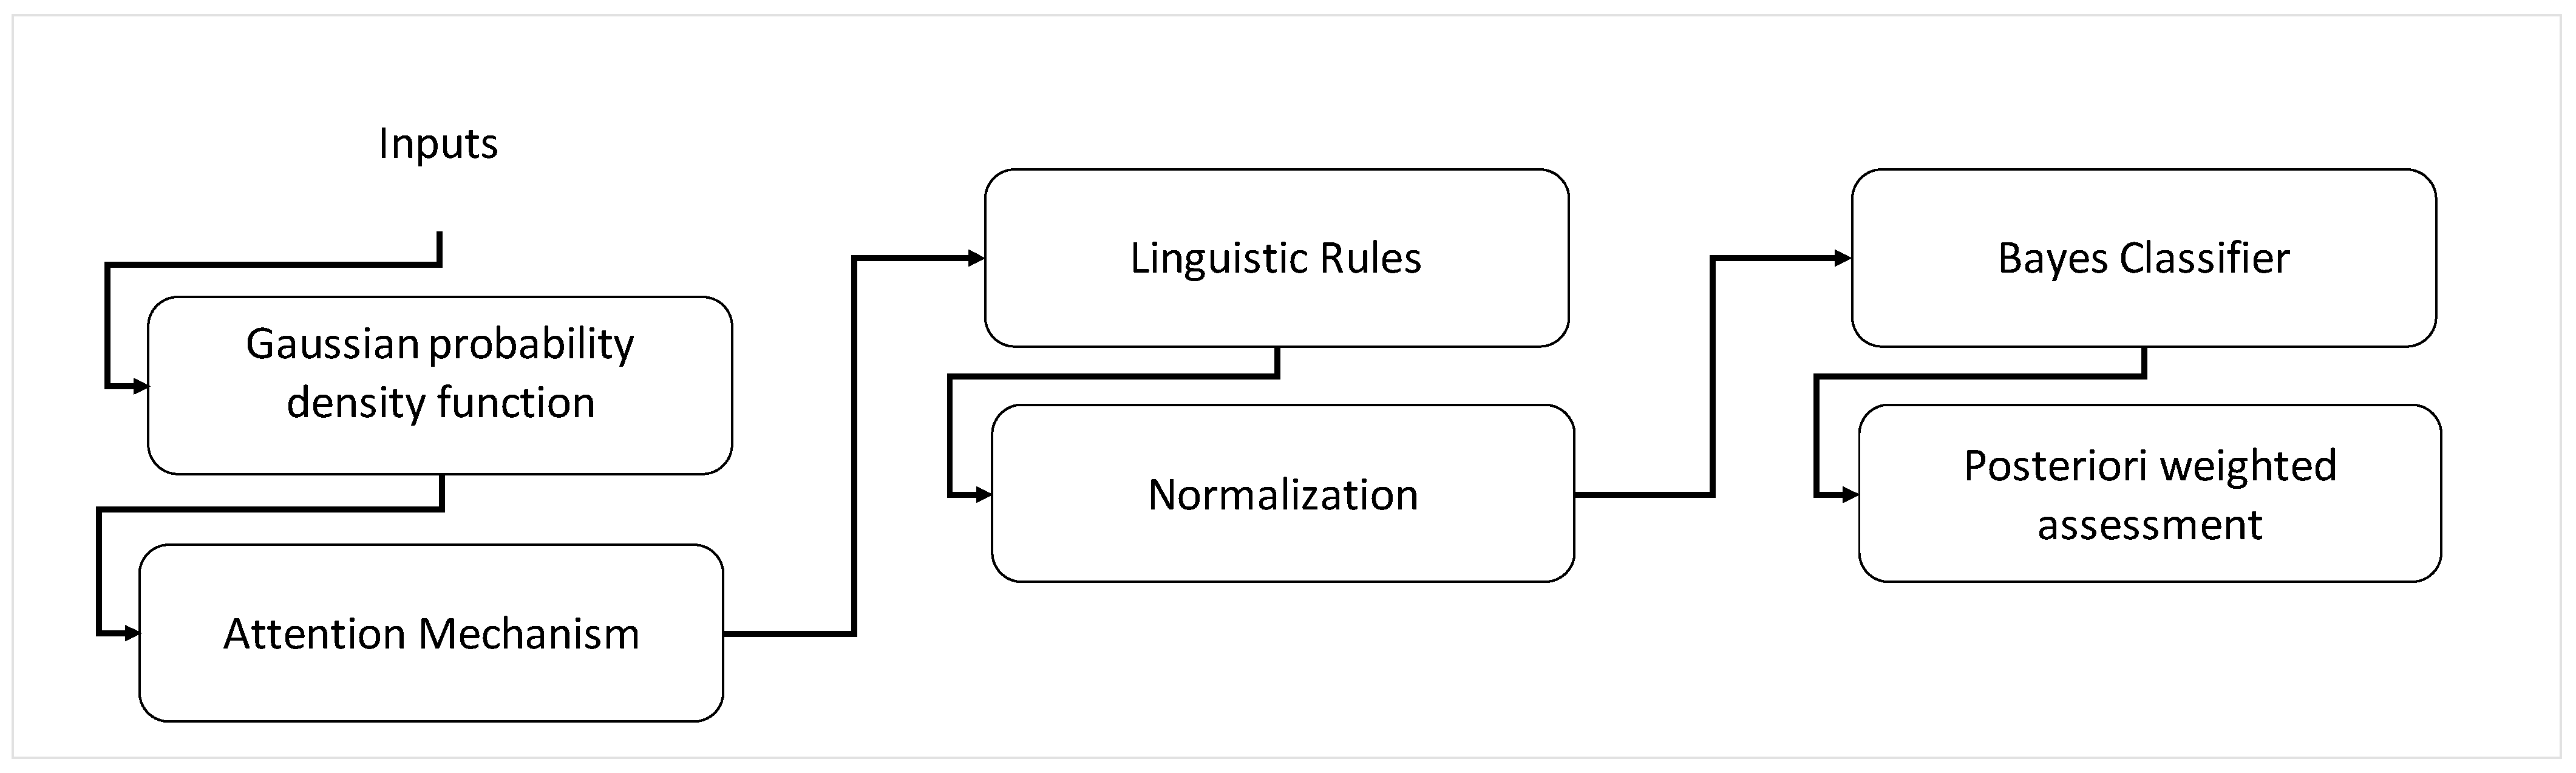
Figure 1 shows a flow chart of the methodology used. The linguistic interpretation of GDF integrates linguistic uncertainty with stochastic uncertainty in the proposed system, making the evaluation more robust, simple, and straightforward. A comparison is made with the conventional evaluation of the FMEA.
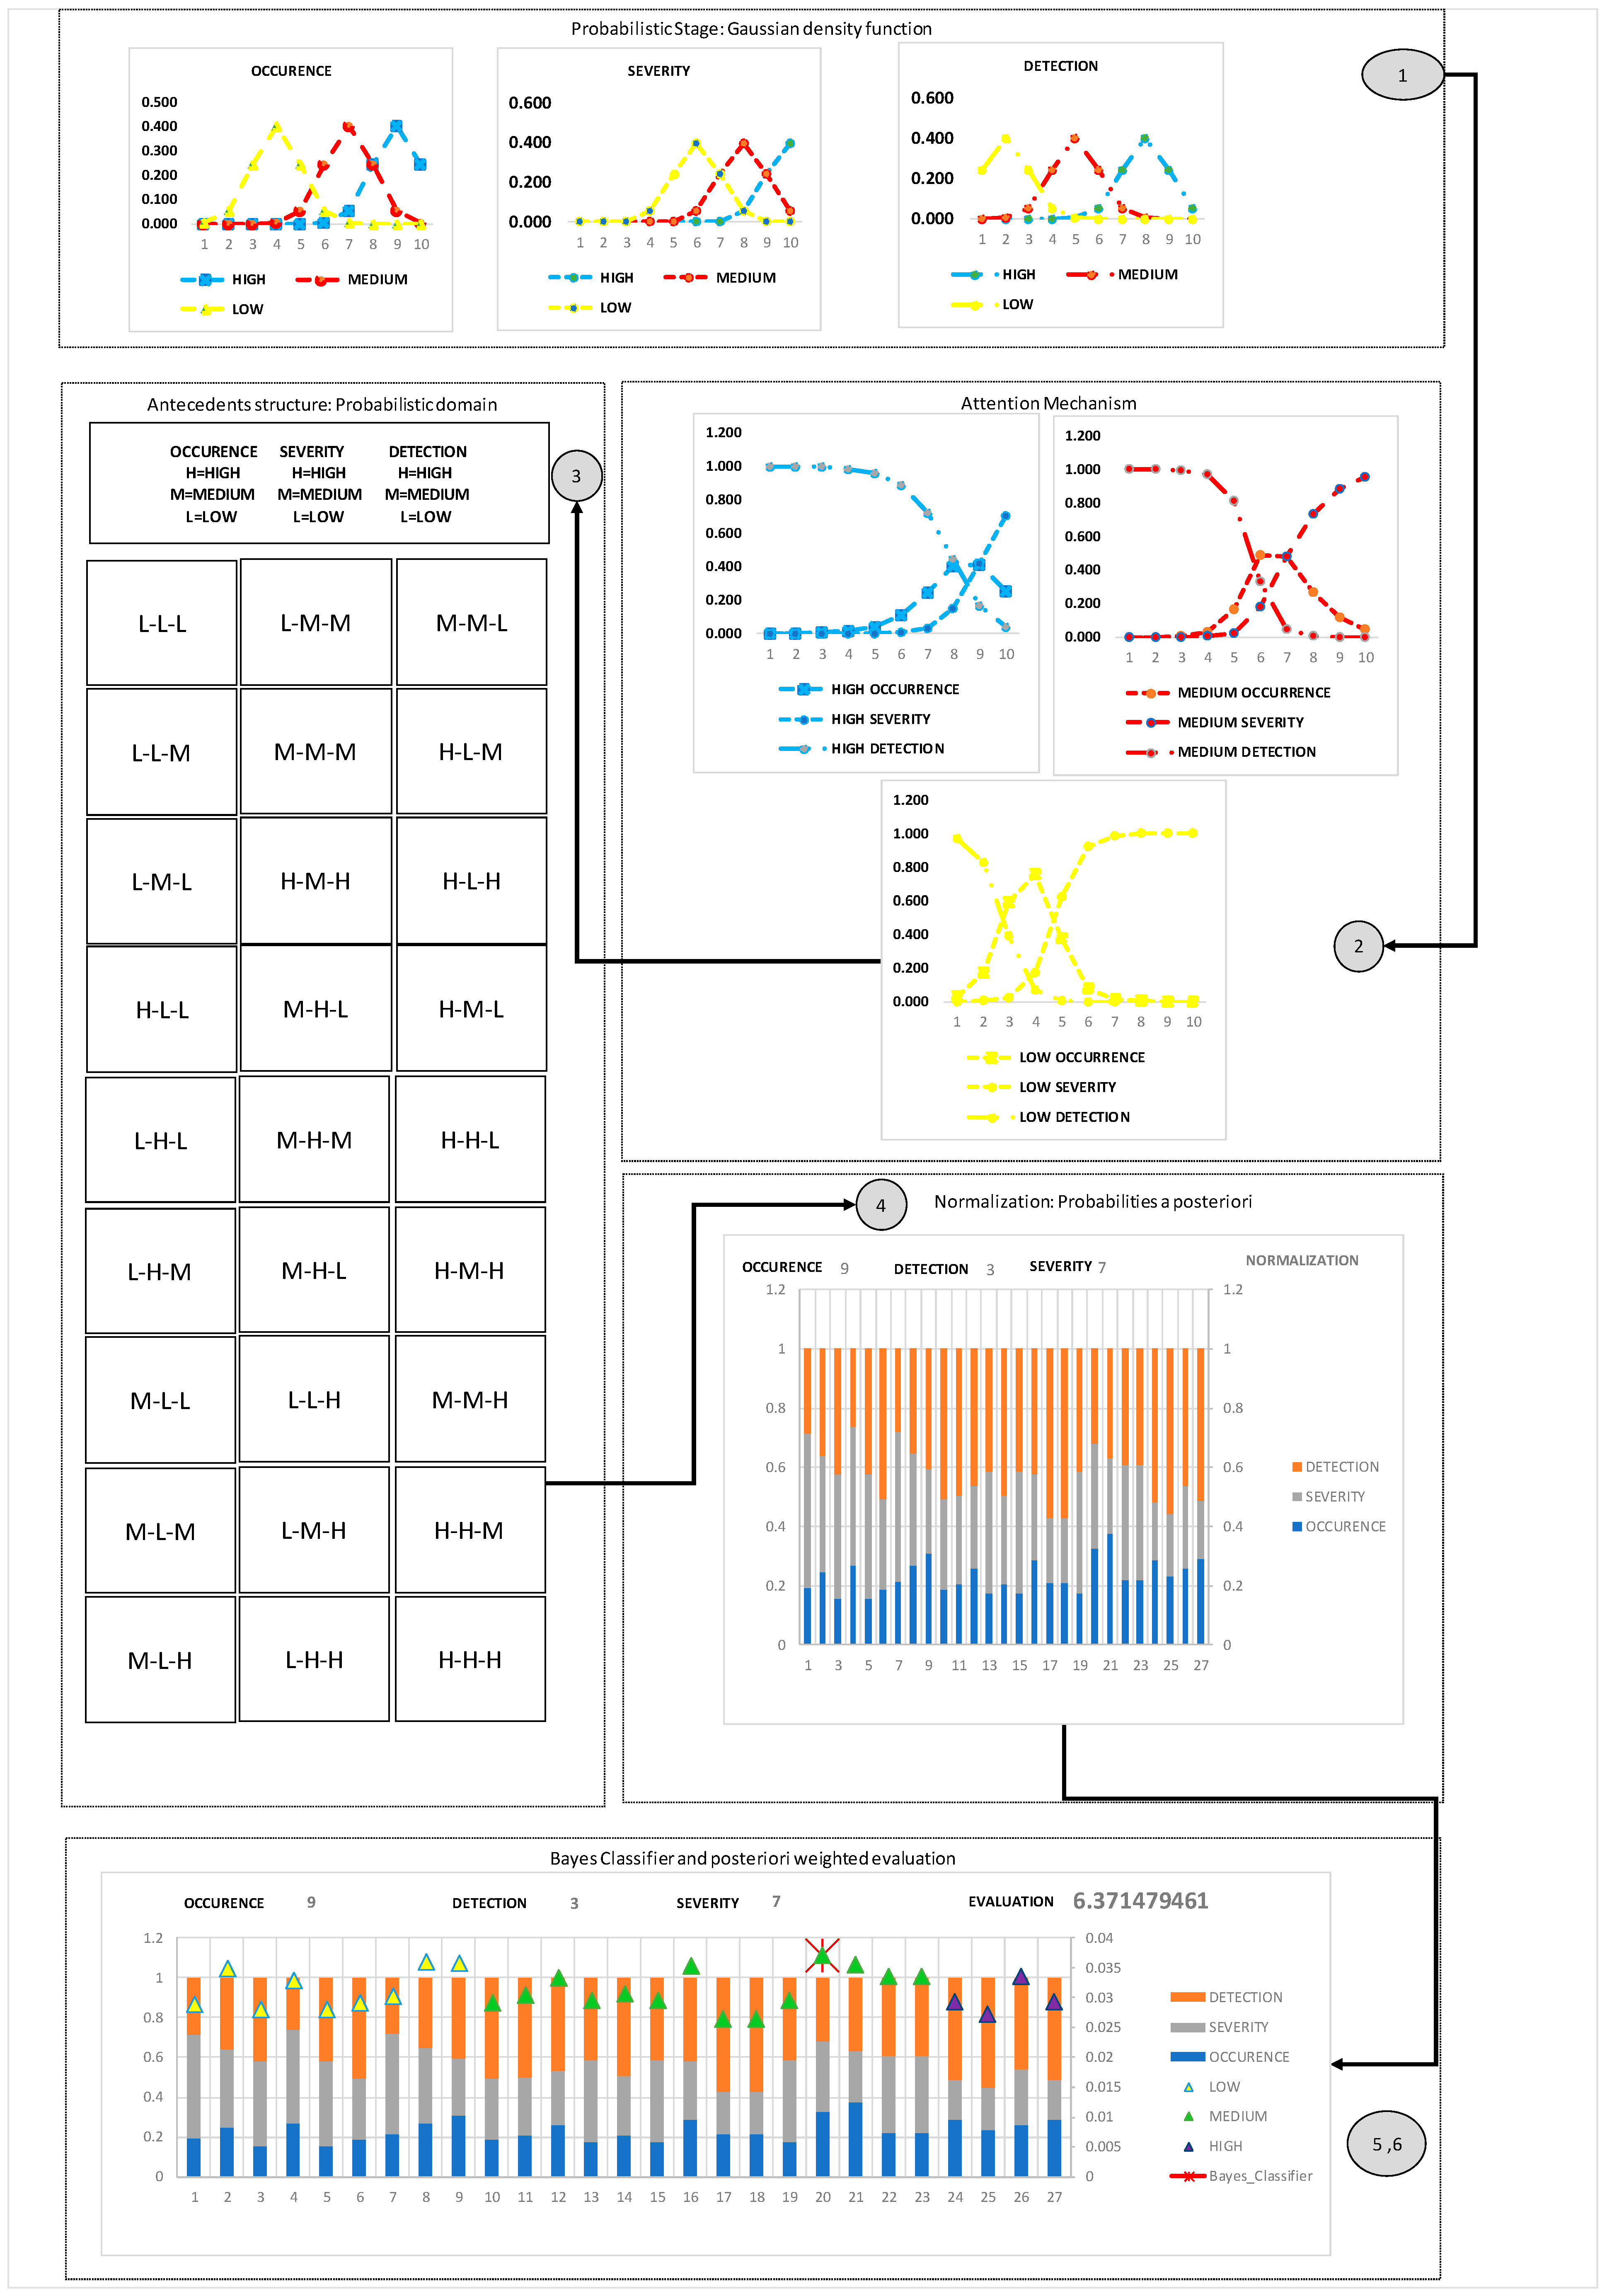
The proposed approach consists of six stages; see
Figure 2. It begins with the linguistical interpretation of GDF as stage 1. An attention mechanism is proposed to relate the linguistic labels of a variable concerning the other linguistic labels of the other variables as stage 2, determining a conditional probability for each rule and classifying the outputs of the fuzzy rule consequences as stage 3. In addition, a normalization stage is proposed in the knowledge base for each rule as stage 4. Finally, the probabilistic system is evaluated and compared with the conventional FMEA method in stages 5 and 6.
2.1. Criteria Definition by FMEA
RPN is an indicator to identify the importance of fault modes. The failure mode consists of describing the meaning of the fault. The effect is the result of the presence of the fault. It is critical to quantify the results of the fault using the subjective evaluation of the RPN. The indicator is a function of three factors: occurrence, severity, and detection; see Equation (1). The occurrence quantifies the frequency of occurrence of failures. Severity quantifies the result of system failures, and detection quantifies the tools available for fault control.
Conducting an FMEA requires a systematic five-step approach:
Conceptualize the objective of the FMEA and form a participation committee.
Describe failure modes.
Identify the effects and causes of failure modes.
Evaluate each factor in heuristic and subjective form.
Quantify RPN in each mode.
Comparative tables are used to evaluate the three factors and then determine the respective NPR. The evaluation is subjective and based on the assessor’s experience. Two evaluators may have different results for a specific fault mode due to the qualitative interpretation of the available information; see
Table 1.
Each opinion expressed presents a degree of subjectivity and imprecision and is determined by the experience of the expert. The evaluation of each of the factors is completed individually. Example: Severity level 10, occurrence level (7) and detection level (2).
In failure mode analysis, experts determine the criteria based on their reasoning, knowledge, and experience. The interpretation of these criteria varies from one expert to another.
Probabilities a Priori
In the proposed approach, each of the criteria has a priori weight based on the expert’s interpretation of the importance; see Equation (2).
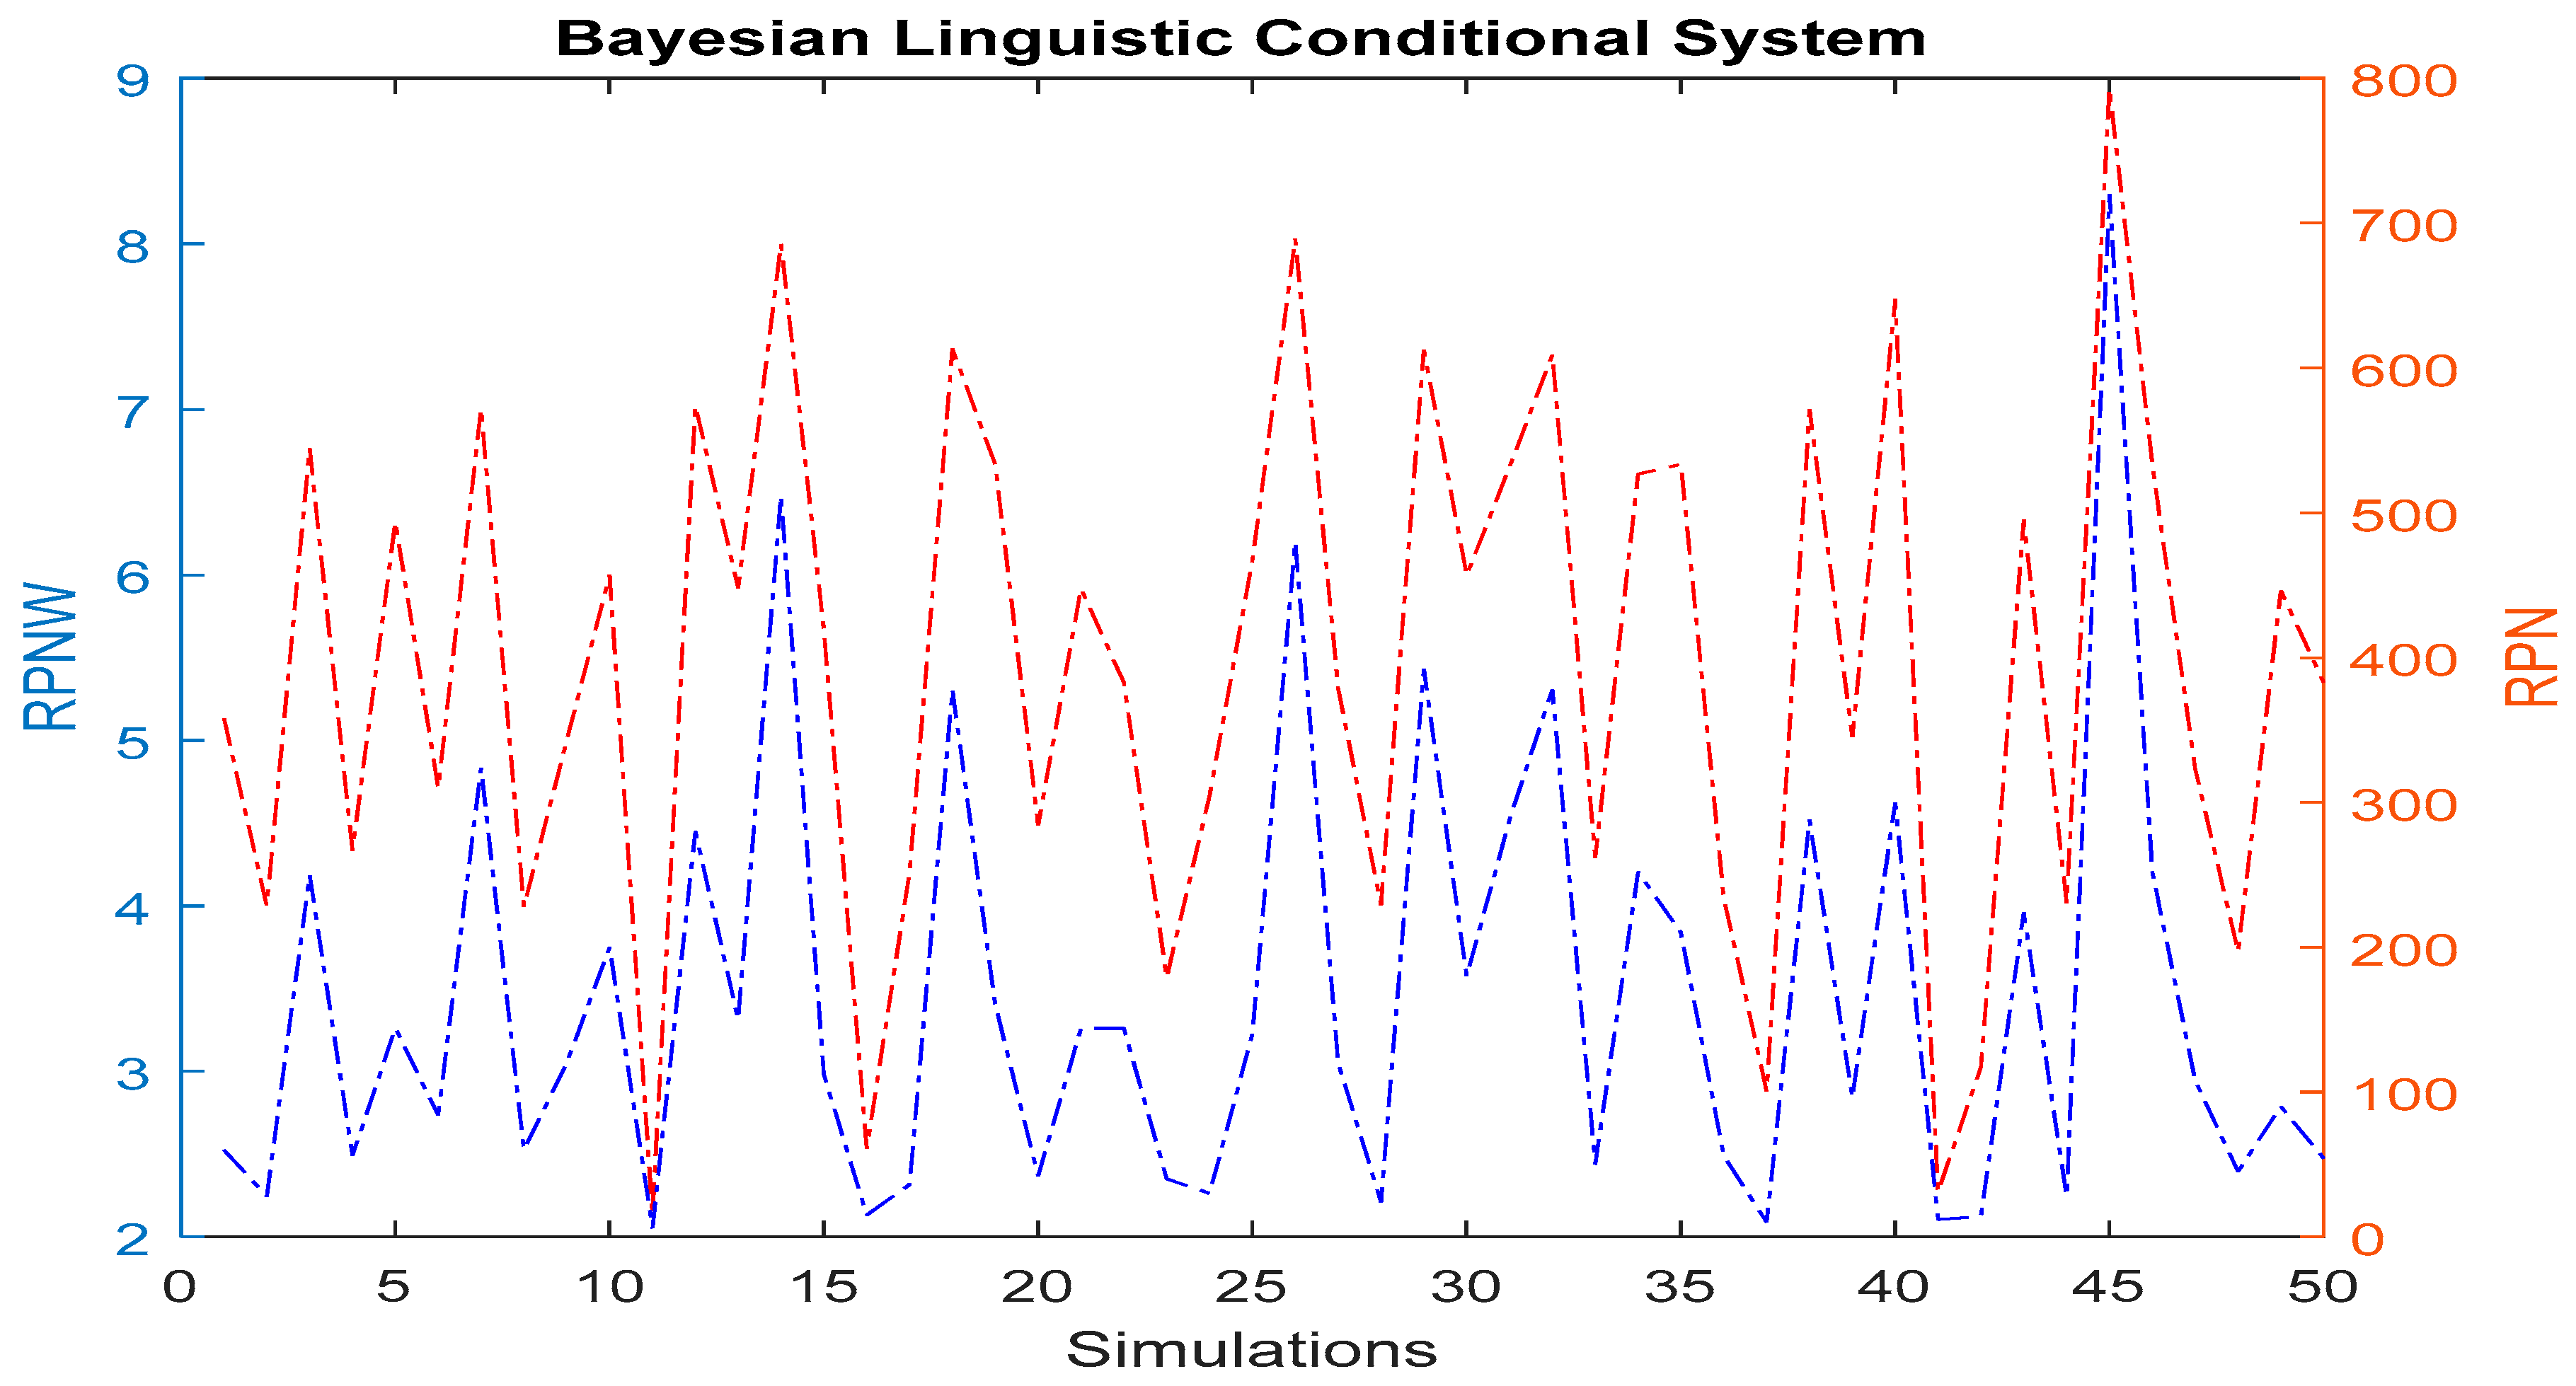
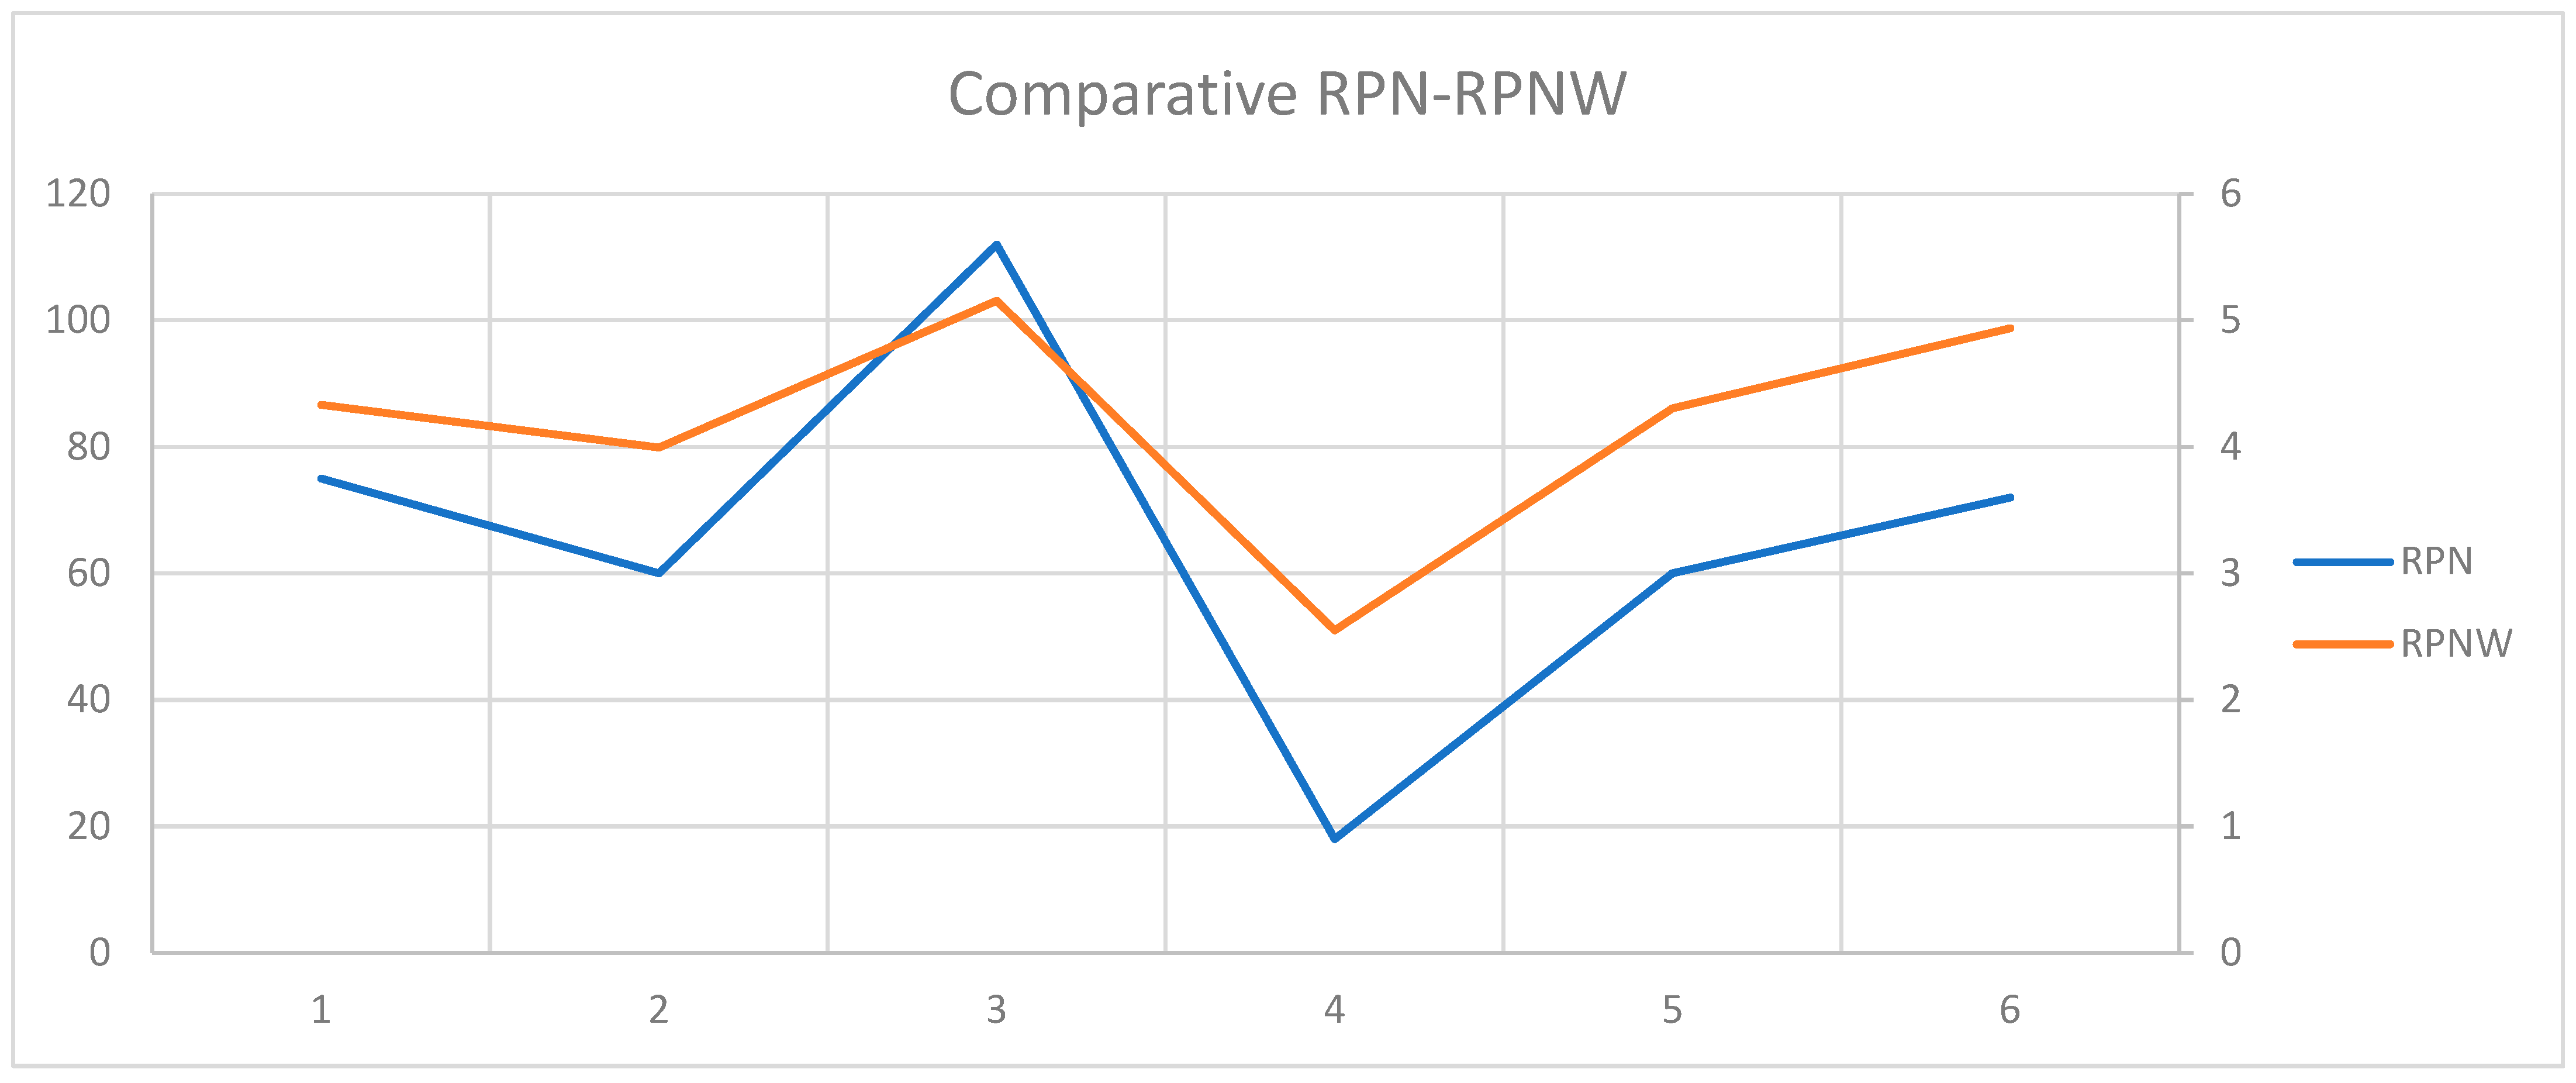
Based on the initial weights, the a posteriori weighted average is determined as an evaluation indicator weighted RPNW to be compared with the RPN on a simple scale from 1 to 10. The main objective of the present research is to develop a linguistic probabilistic system to obtain the probabilities a posteriori extracted from the database used to make a robust weighted evaluation simple and straightforward, which can be contrasted with the RPN indicator.
2.2. Gaussian Density Function
In mathematics, a GDF is often simply referred to as a Gaussian. The parametric extension is (3).
for arbitrary real constants
a,
b and non-zero
c. It is named after the mathematician Carl Friedrich Gauss. The graph of a Gaussian is a characteristic symmetric “bell curve“ shape. The parameter
a is the height of the curve’s peak,
b is the position of the center of the peak, and
c (the standard deviation, sometimes called the Gaussian RMS width) controls the width of the “bell”.
GDF are often used to represent the probability density function of a normally distributed random variable with values
a,
b and
c properly defined. In this case, the Gaussian is of the form in Equation (4).
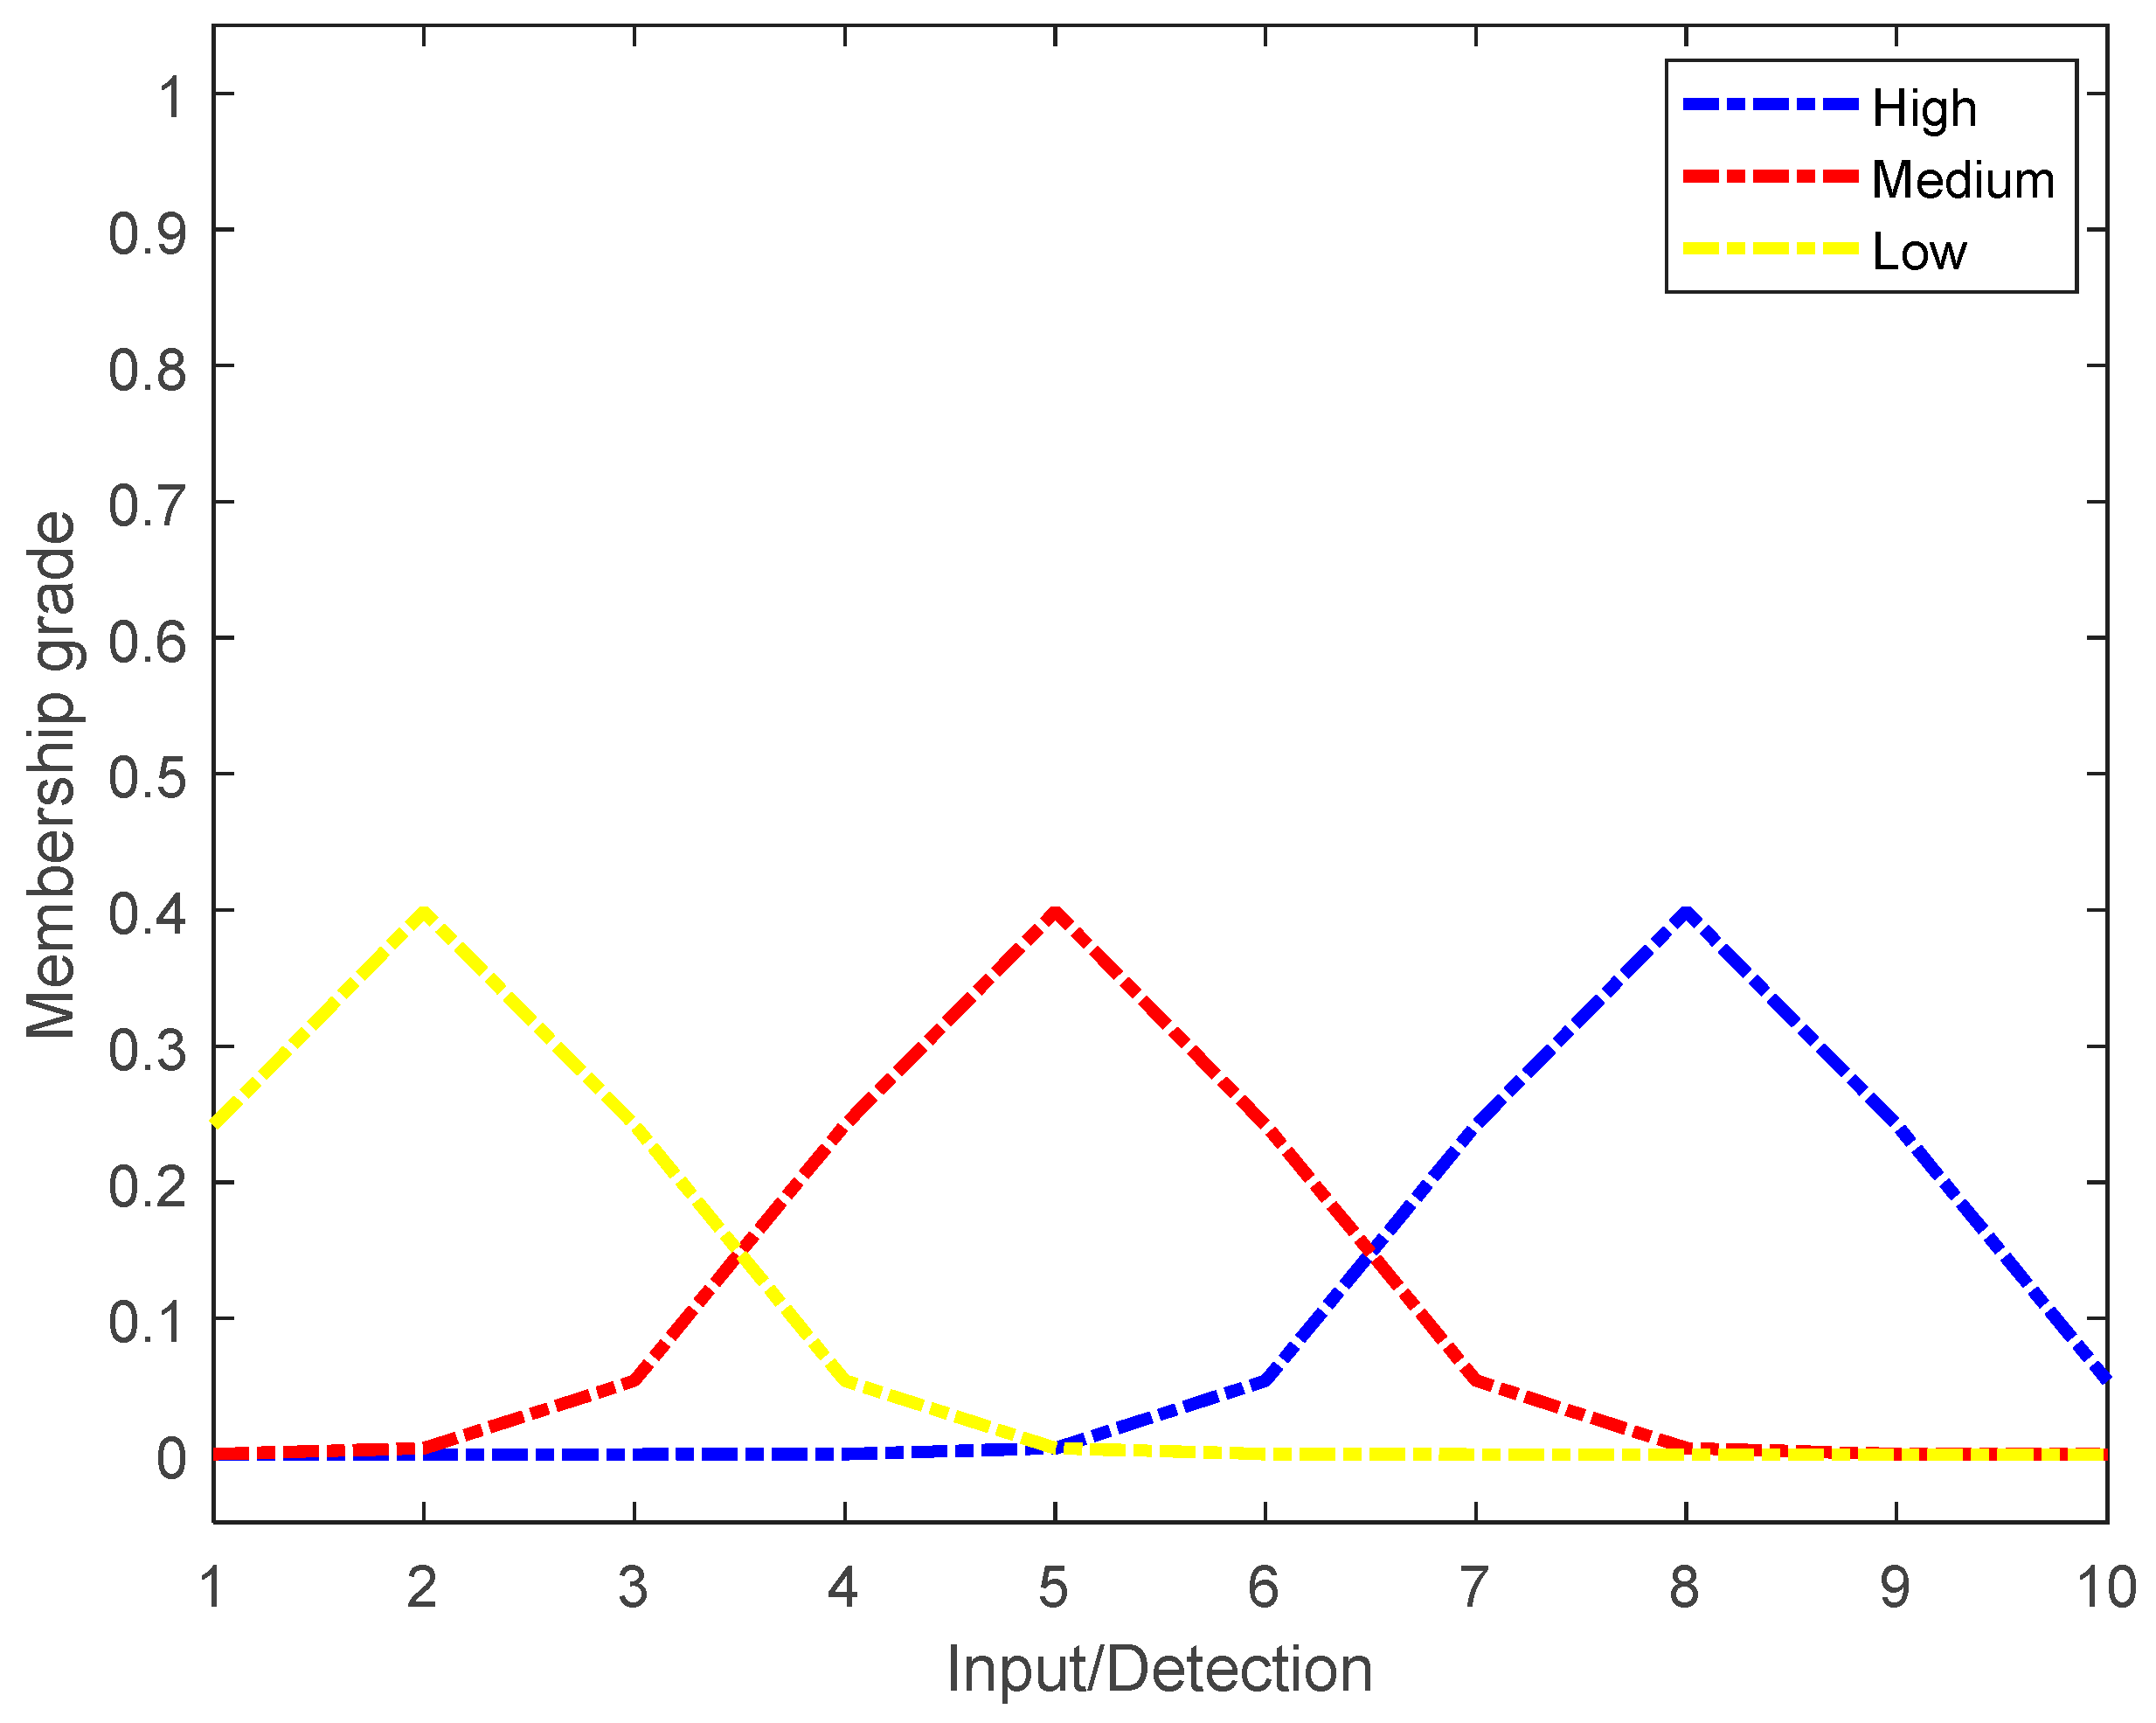
Each factor (
) corresponds to a linguistics variable in the proposed approach. Three linguistics labels called high (
, medium (
, and low (
) are established as membership grades for each of them. The parameters of the mean and standard deviation for each linguistic label can be seen in
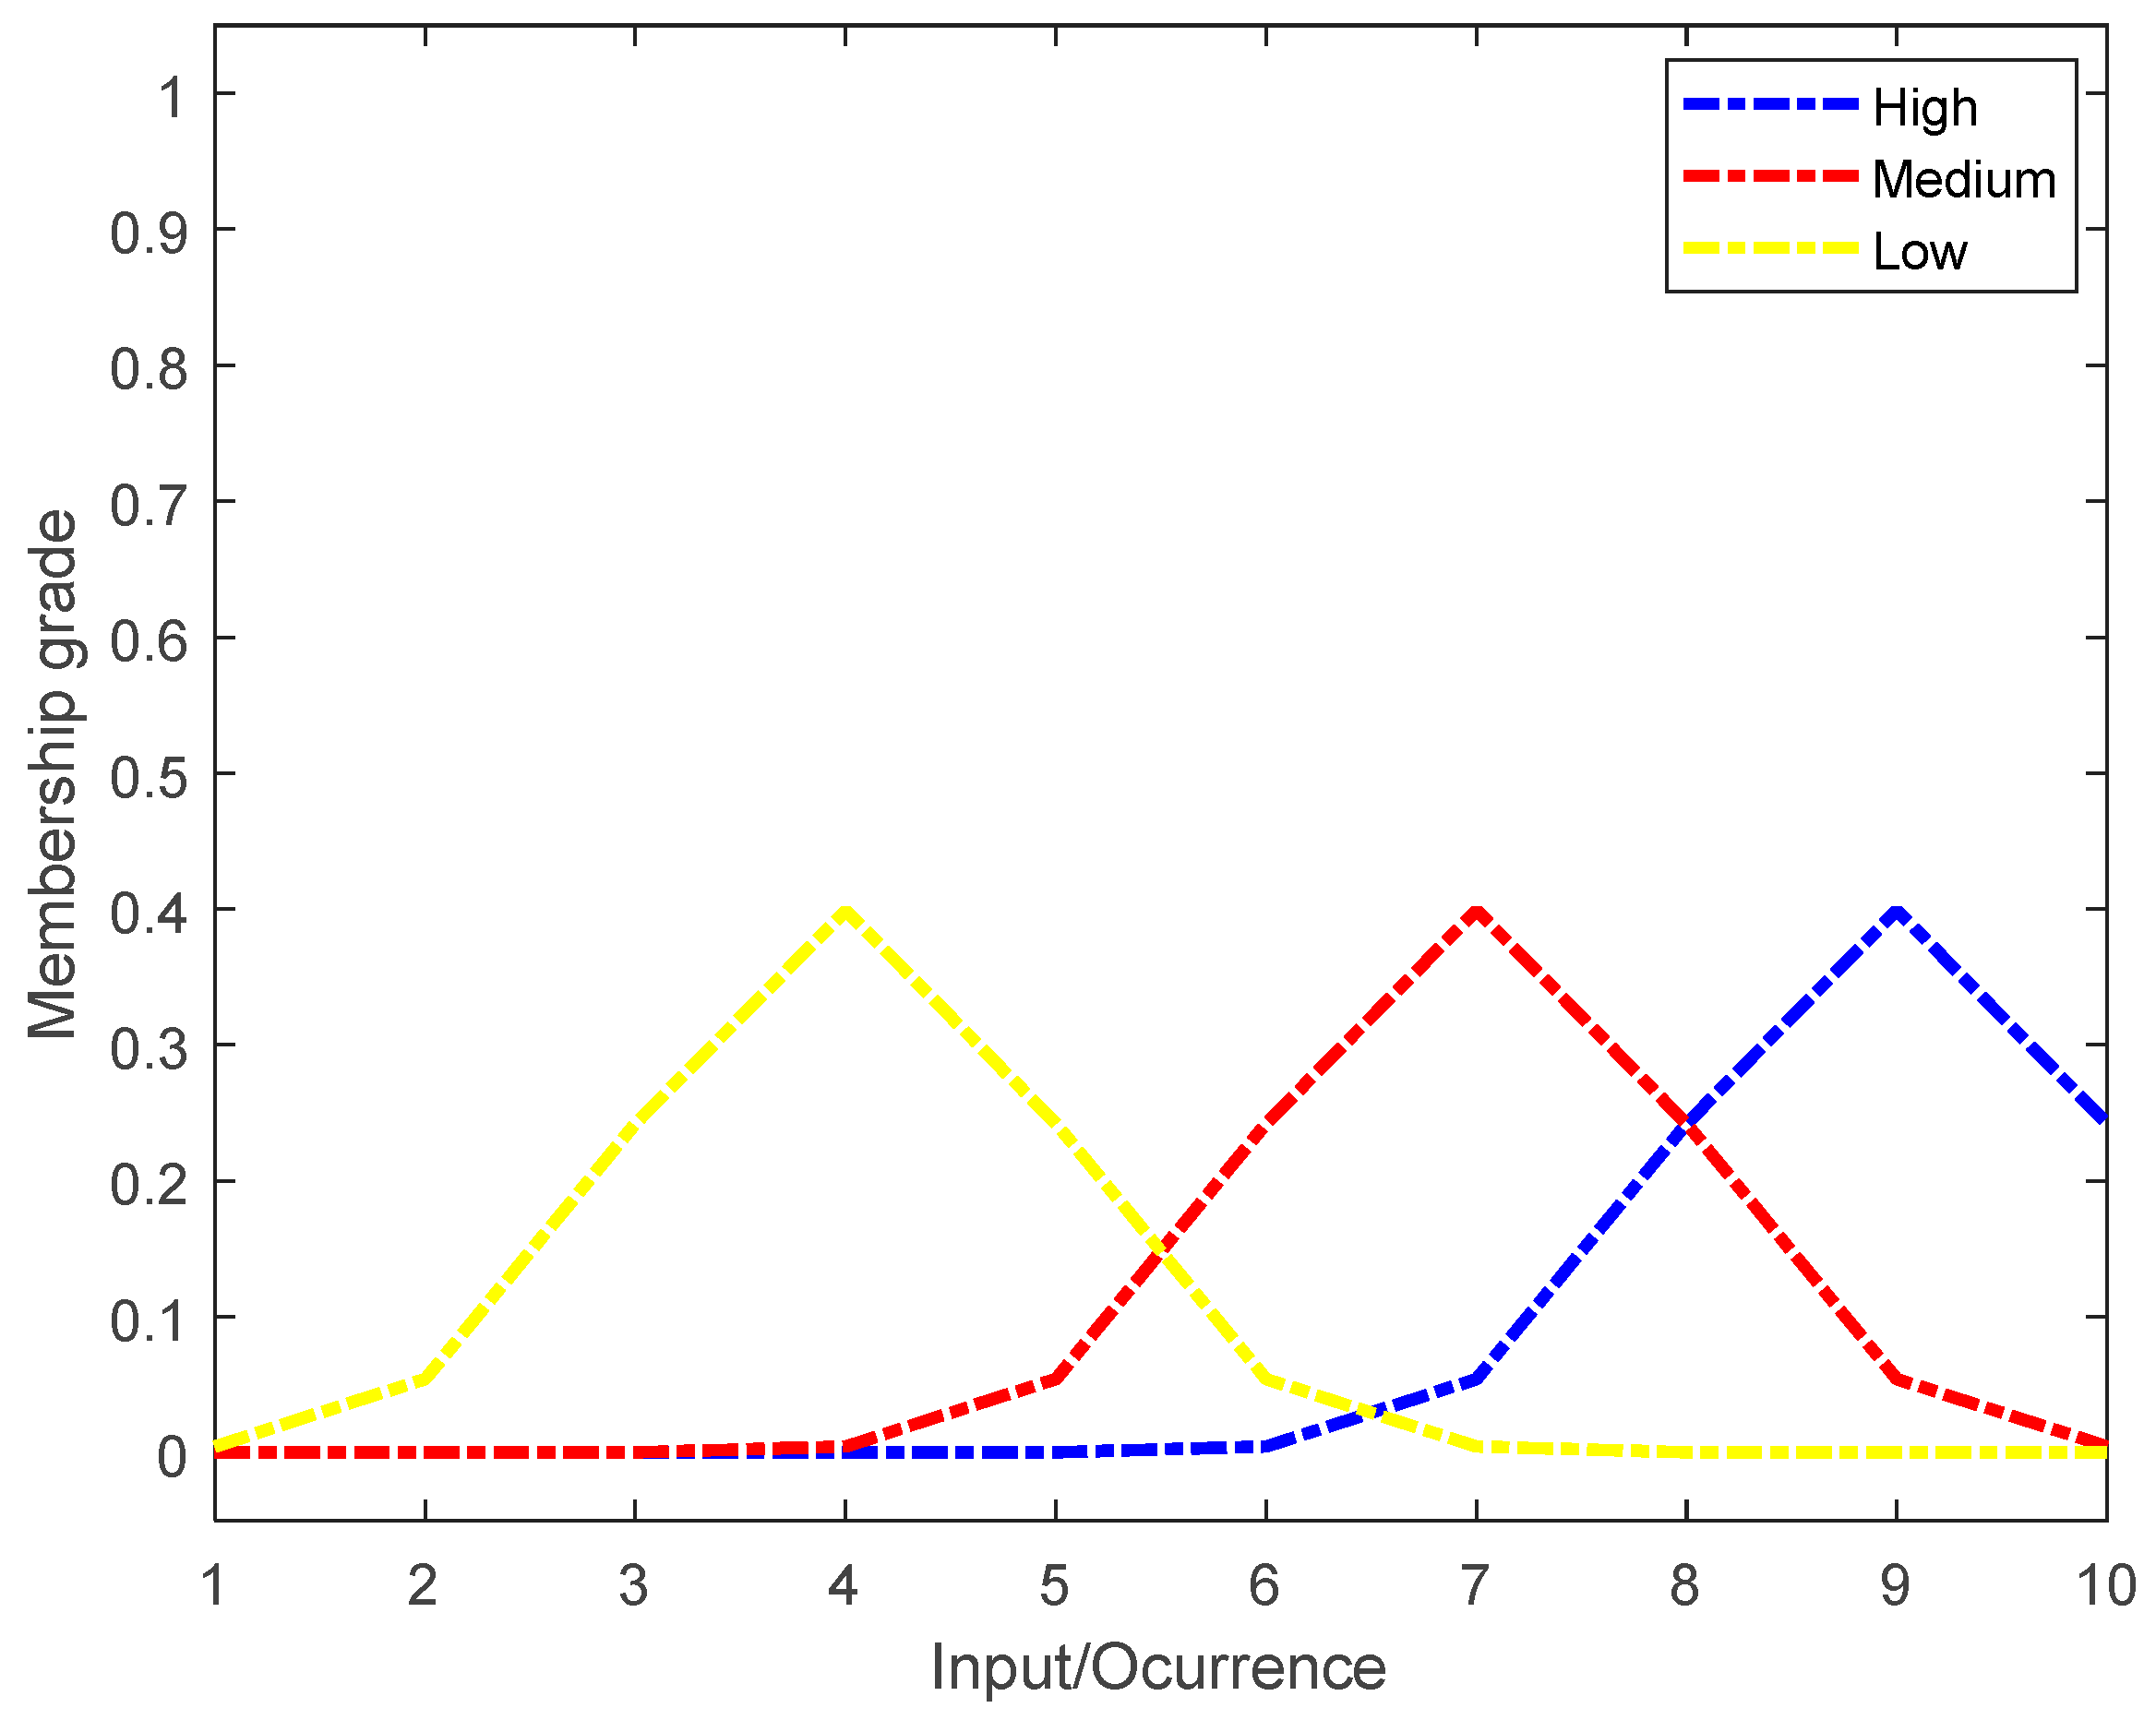
Table 2. The behavior of the GDF of each label for
is shown as a conditional probability of the
label given criterion
expressed as
; see
Figure 3.
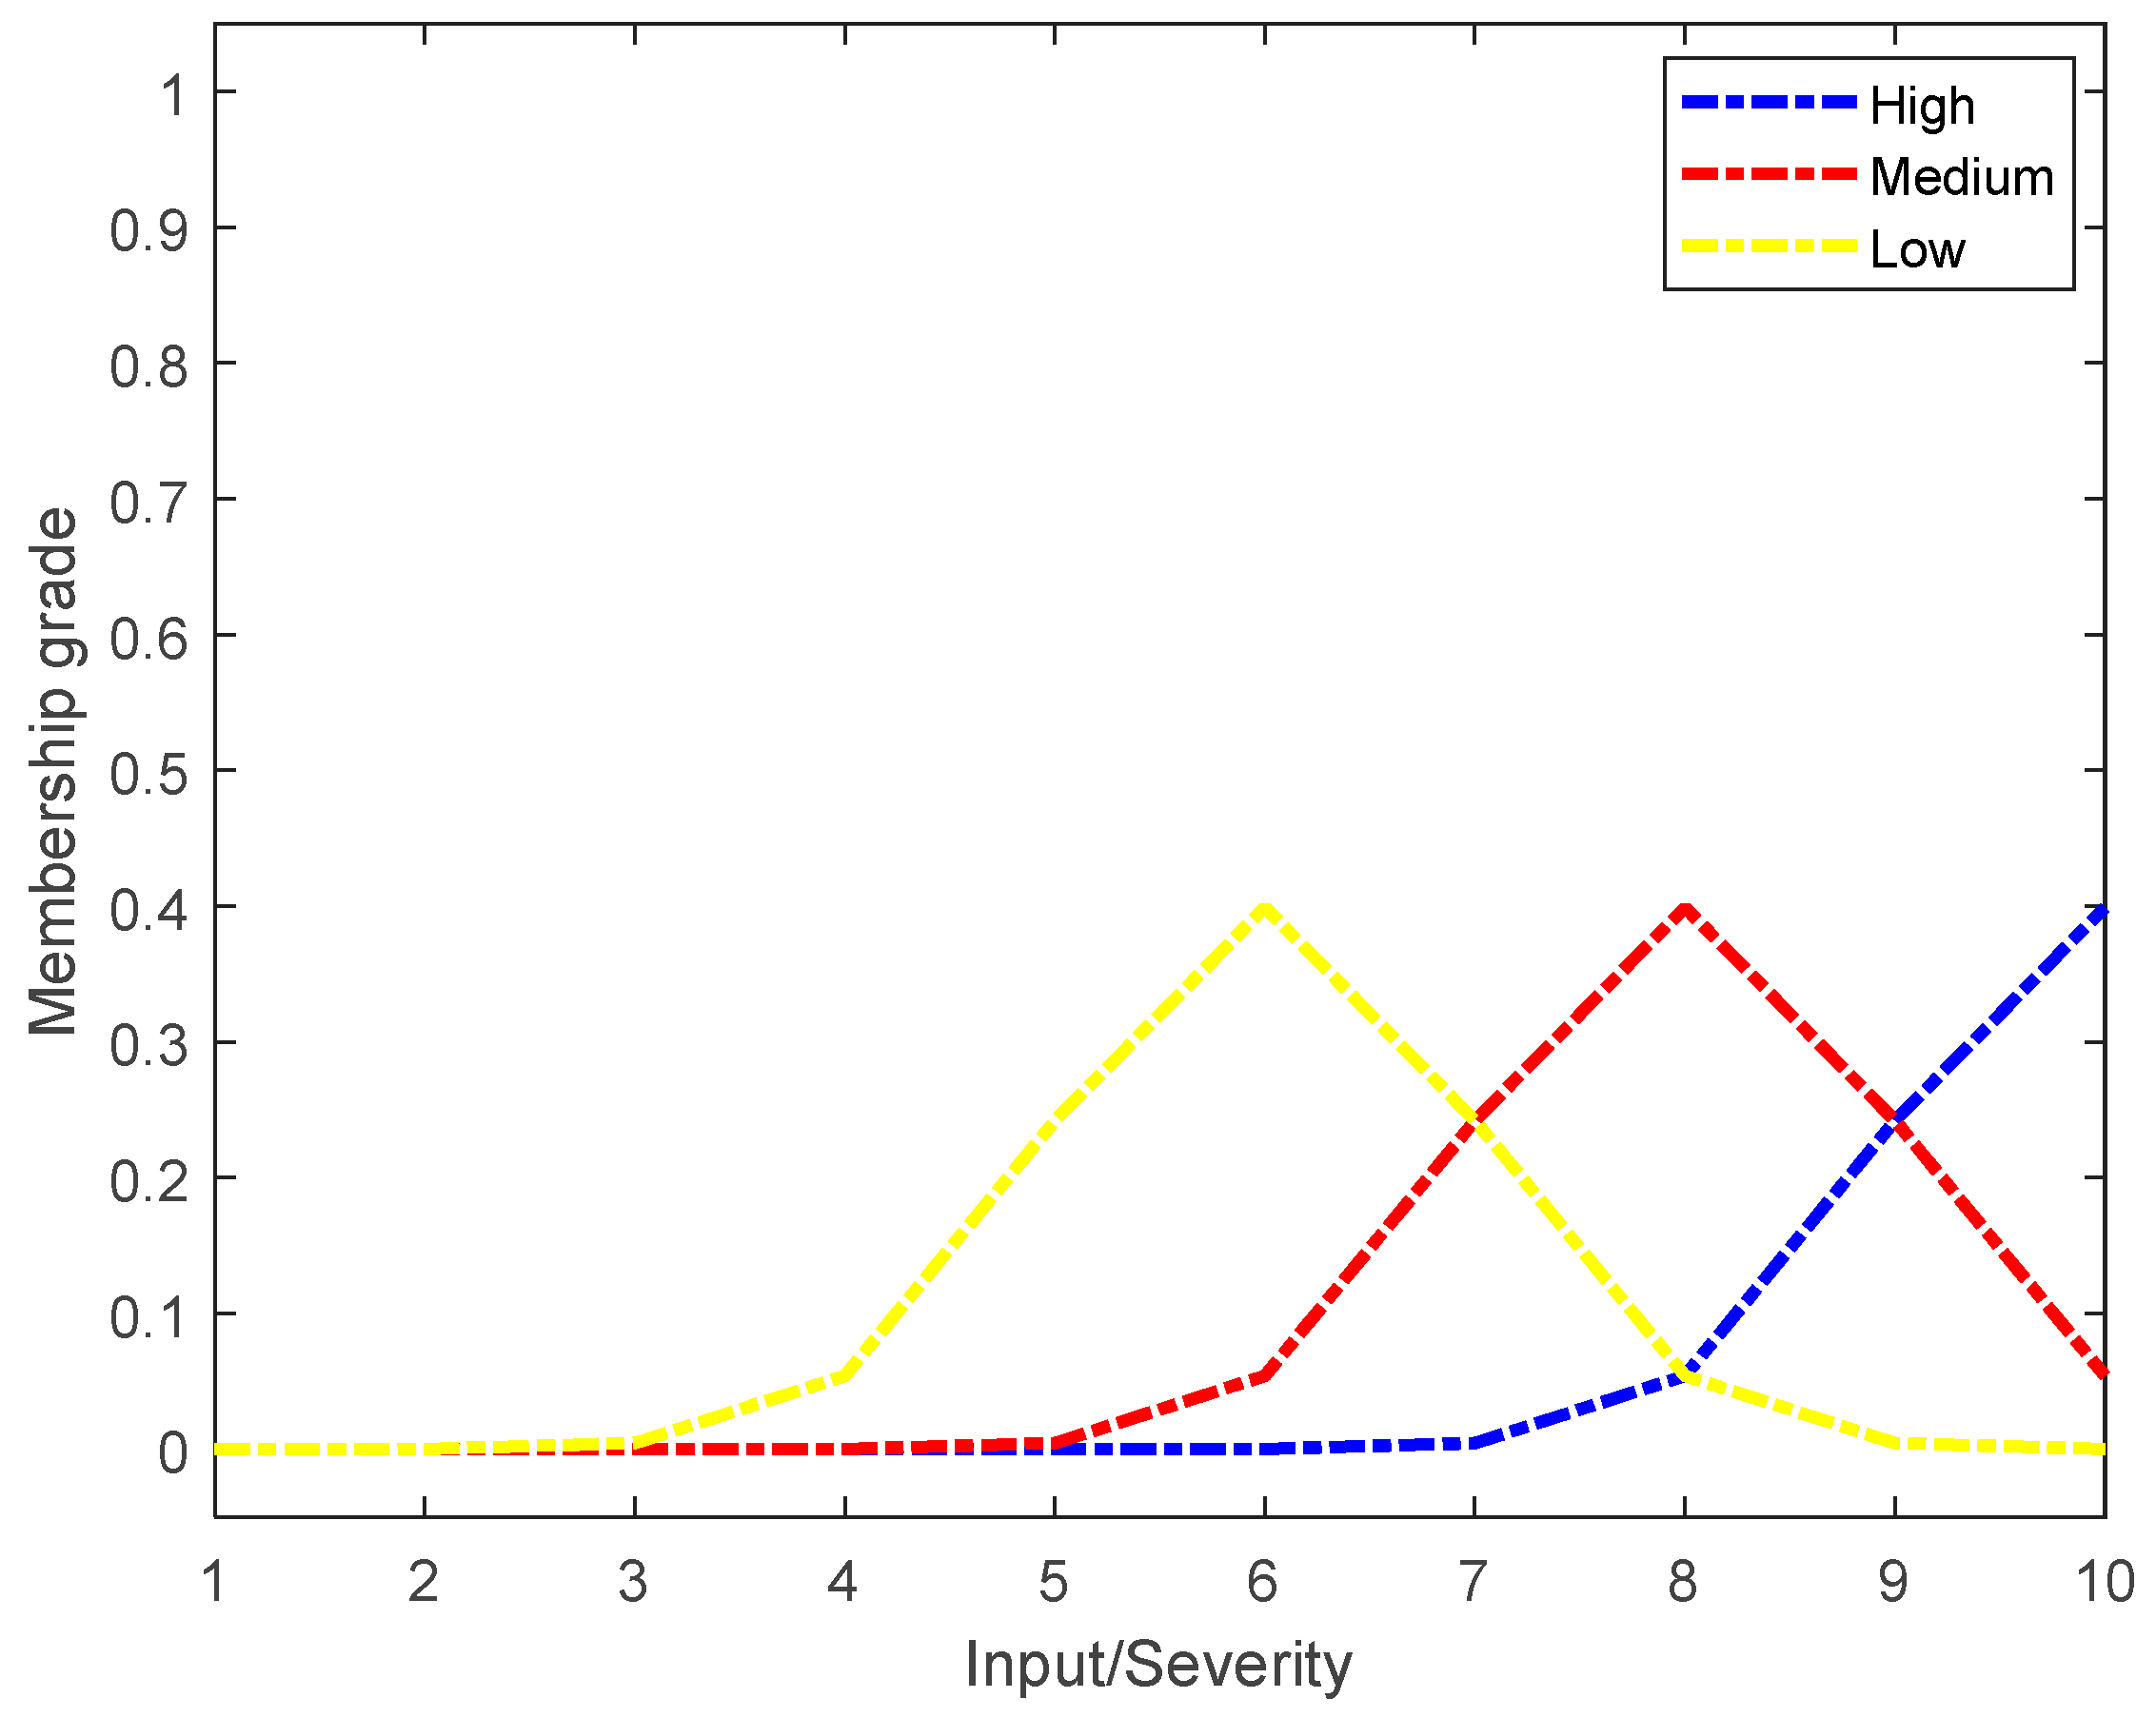
In this way, analyzing criterion
is expressed as a conditional probability of the type of label given in criterion
as
. The behavior of the GDF is shown in
Figure 4.
Criterion
is expressed as a conditional probability of the type of label
given in criterion
as
. The behavior of the GDF is shown in
Figure 5.
The Gaussian density functions assigned for each criterion and the main parameters for each linguistic label are shown in
Table 2.
2.3. Attention Mechanism
The most important contribution of the proposed approach is based on developing a care mechanism to relate the probabilities of the criteria under study. Generally, the criteria are analyzed in diffuse systems as independent events, and fuzzified values are unrelated to each fuzzified rule. Only a comparison of the values is made, and the maximum or minimum of the values is chosen to truncate the outputs of the consequences. The main objective of this research is to present a combined knowledge base, where each value used for each language label of each of the factors is related to those same labels of the other factors, forming a single criterion in each rule of knowledge, and a classification mechanism shall be used to identify the rule with the maximum value as element and inference of the system and obtain its probabilities a posteriori of each factor to make the weighted evaluation mode for the corresponding failure effect.
The care mechanism aims to determine the ex post probabilities of each criterion based on knowledge extraction from the evidence or individual probabilities of each label for each criterion. The Bayes theorem is used to determine the criterion’s probability posteriori given the known label’s probability; see Equations (5)–(7).
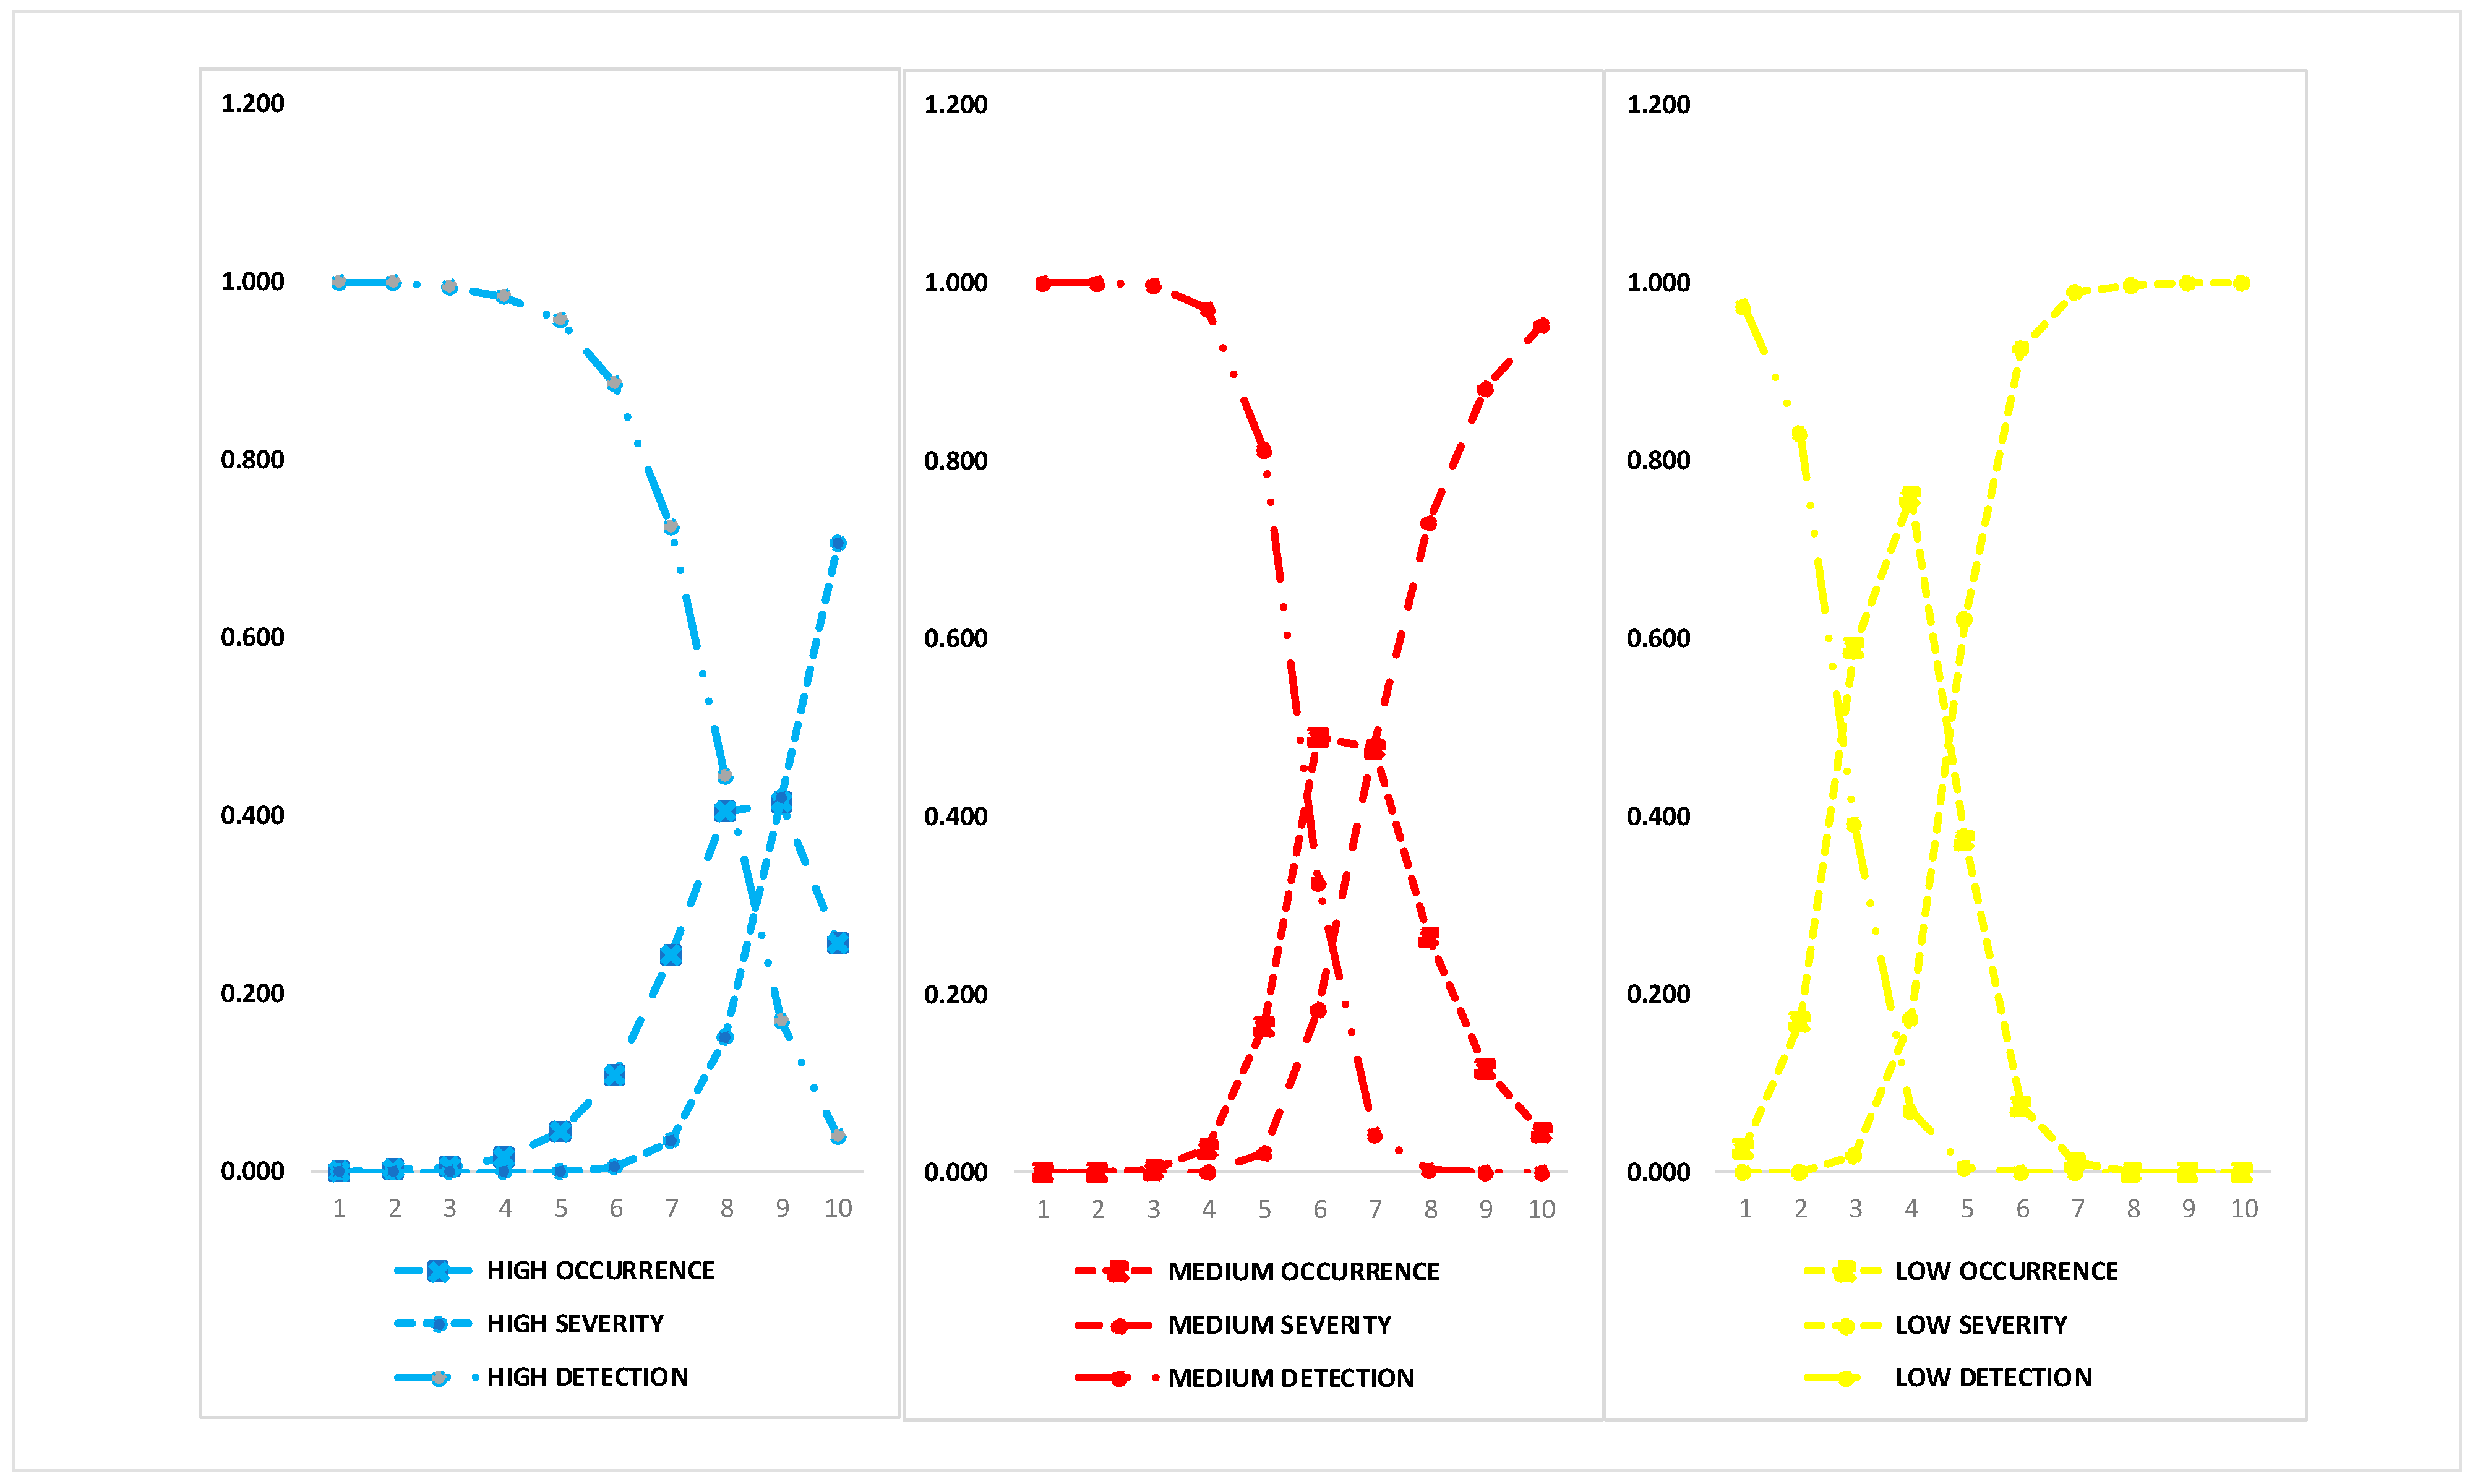
The behaviors of the combined conditional probabilities of the criteria are observed in
Figure 6.
According to (5)–(7), in
Figure 6, there are high, medium, and low levels of each criterion. Each element of the universe distributes the unit probability in each label of the different criteria. In this way, they merge each of the values used in the knowledge base and analyze their behavior in each of the rules as a single criterion in a Bayesian classifier.
2.4. Probabilistic Rule Base
The structure of a probabilistic rule base consists of a space of causes (X) and a space of consequences (Y). The collections of fuzzy sets of X and Y are denoted as P(X) and P(Y), respectively. Obviously, is the degree to which Y represents the output in the base rule for the input X.
The number of rules (
R) necessary for the operation of the system was defined in consideration of the number of input variables and linguistic labels on a combinatorial basis. Since there are three factors and three linguistic labels for each, 27 fuzzy rules constitute the knowledge base due to possible combinations; see Equation (8). The sentences of the type If–Then are established to cover all the possible scenarios concerning each criterion.
The defined rules are of the If–Then type, where “If” is the antecedent related to the input variables, and “Then” is a consequence associated with the output variable; each rule was operated as follows: .
The fuzzy system rules represent the experts’ knowledge when evaluating the factors in the FMEA.
Table 3 lists the rules.
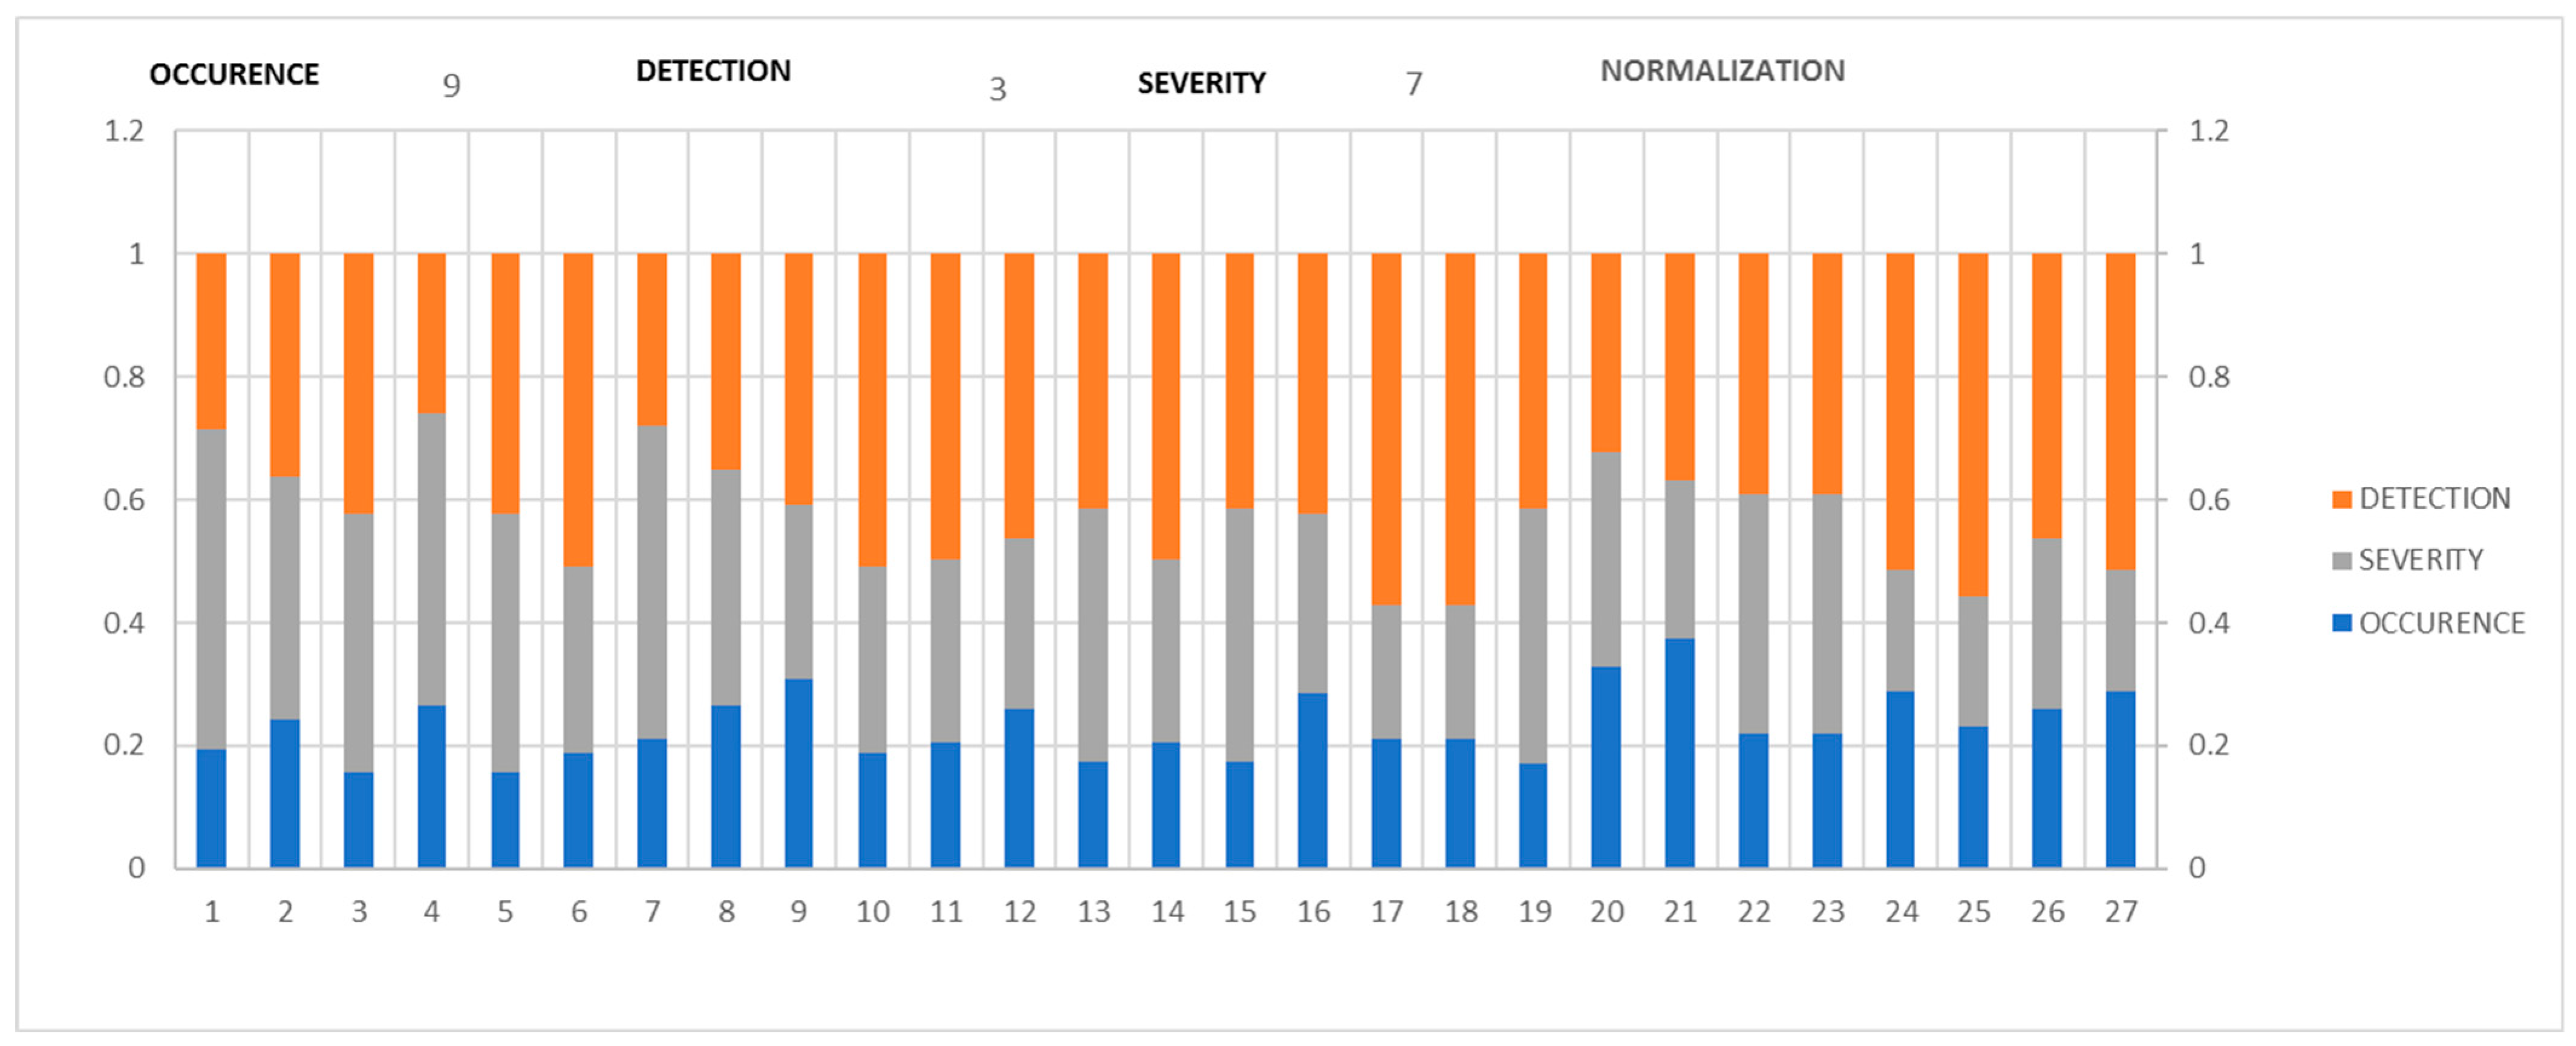
2.5. Normalization
At this stage, it is proposed to use the Softmax function to represent the probability distribution function for each diffuse rule to determine the probabilities a posteriori of each criterion and finally use them in a Bayesian classifier such as the departure of the consequences.
It is used to “compress” a
K-dimensional real values vector,
z, in a
K-dimensional vector,
, with components in the range [0, 1]. The function is given in Equation (9).
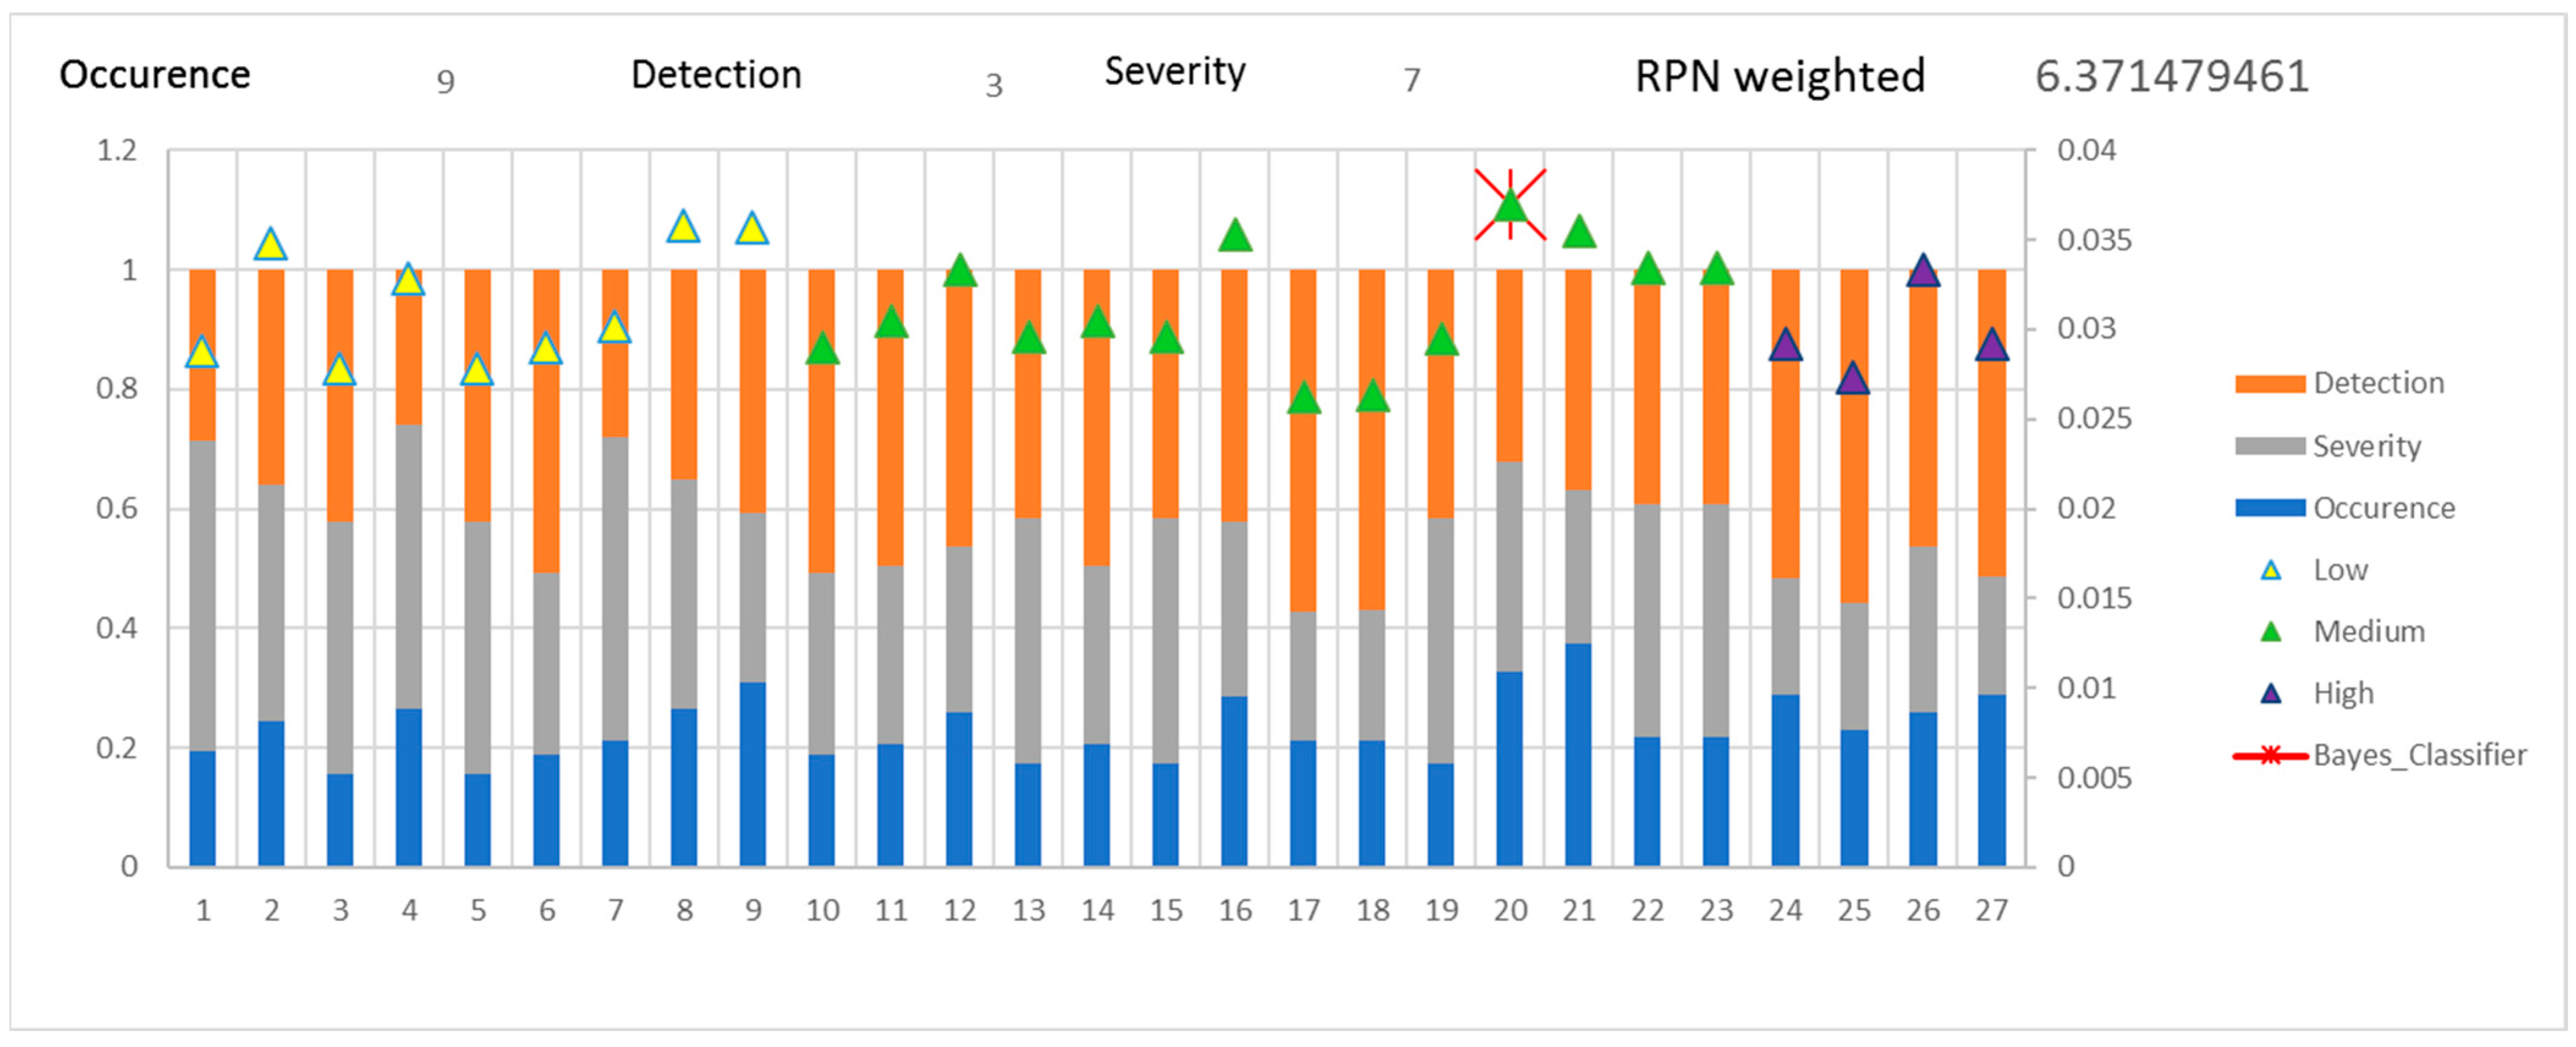
Figure 7 shows the normalization of each of the 27 probabilistic rules of the knowledge base. It can be seen how there is a variation of its probability distribution function based on an example where experts allocate criteria with the following assessments: Occurrence = 9, Detection = 3, and Severity = 7.
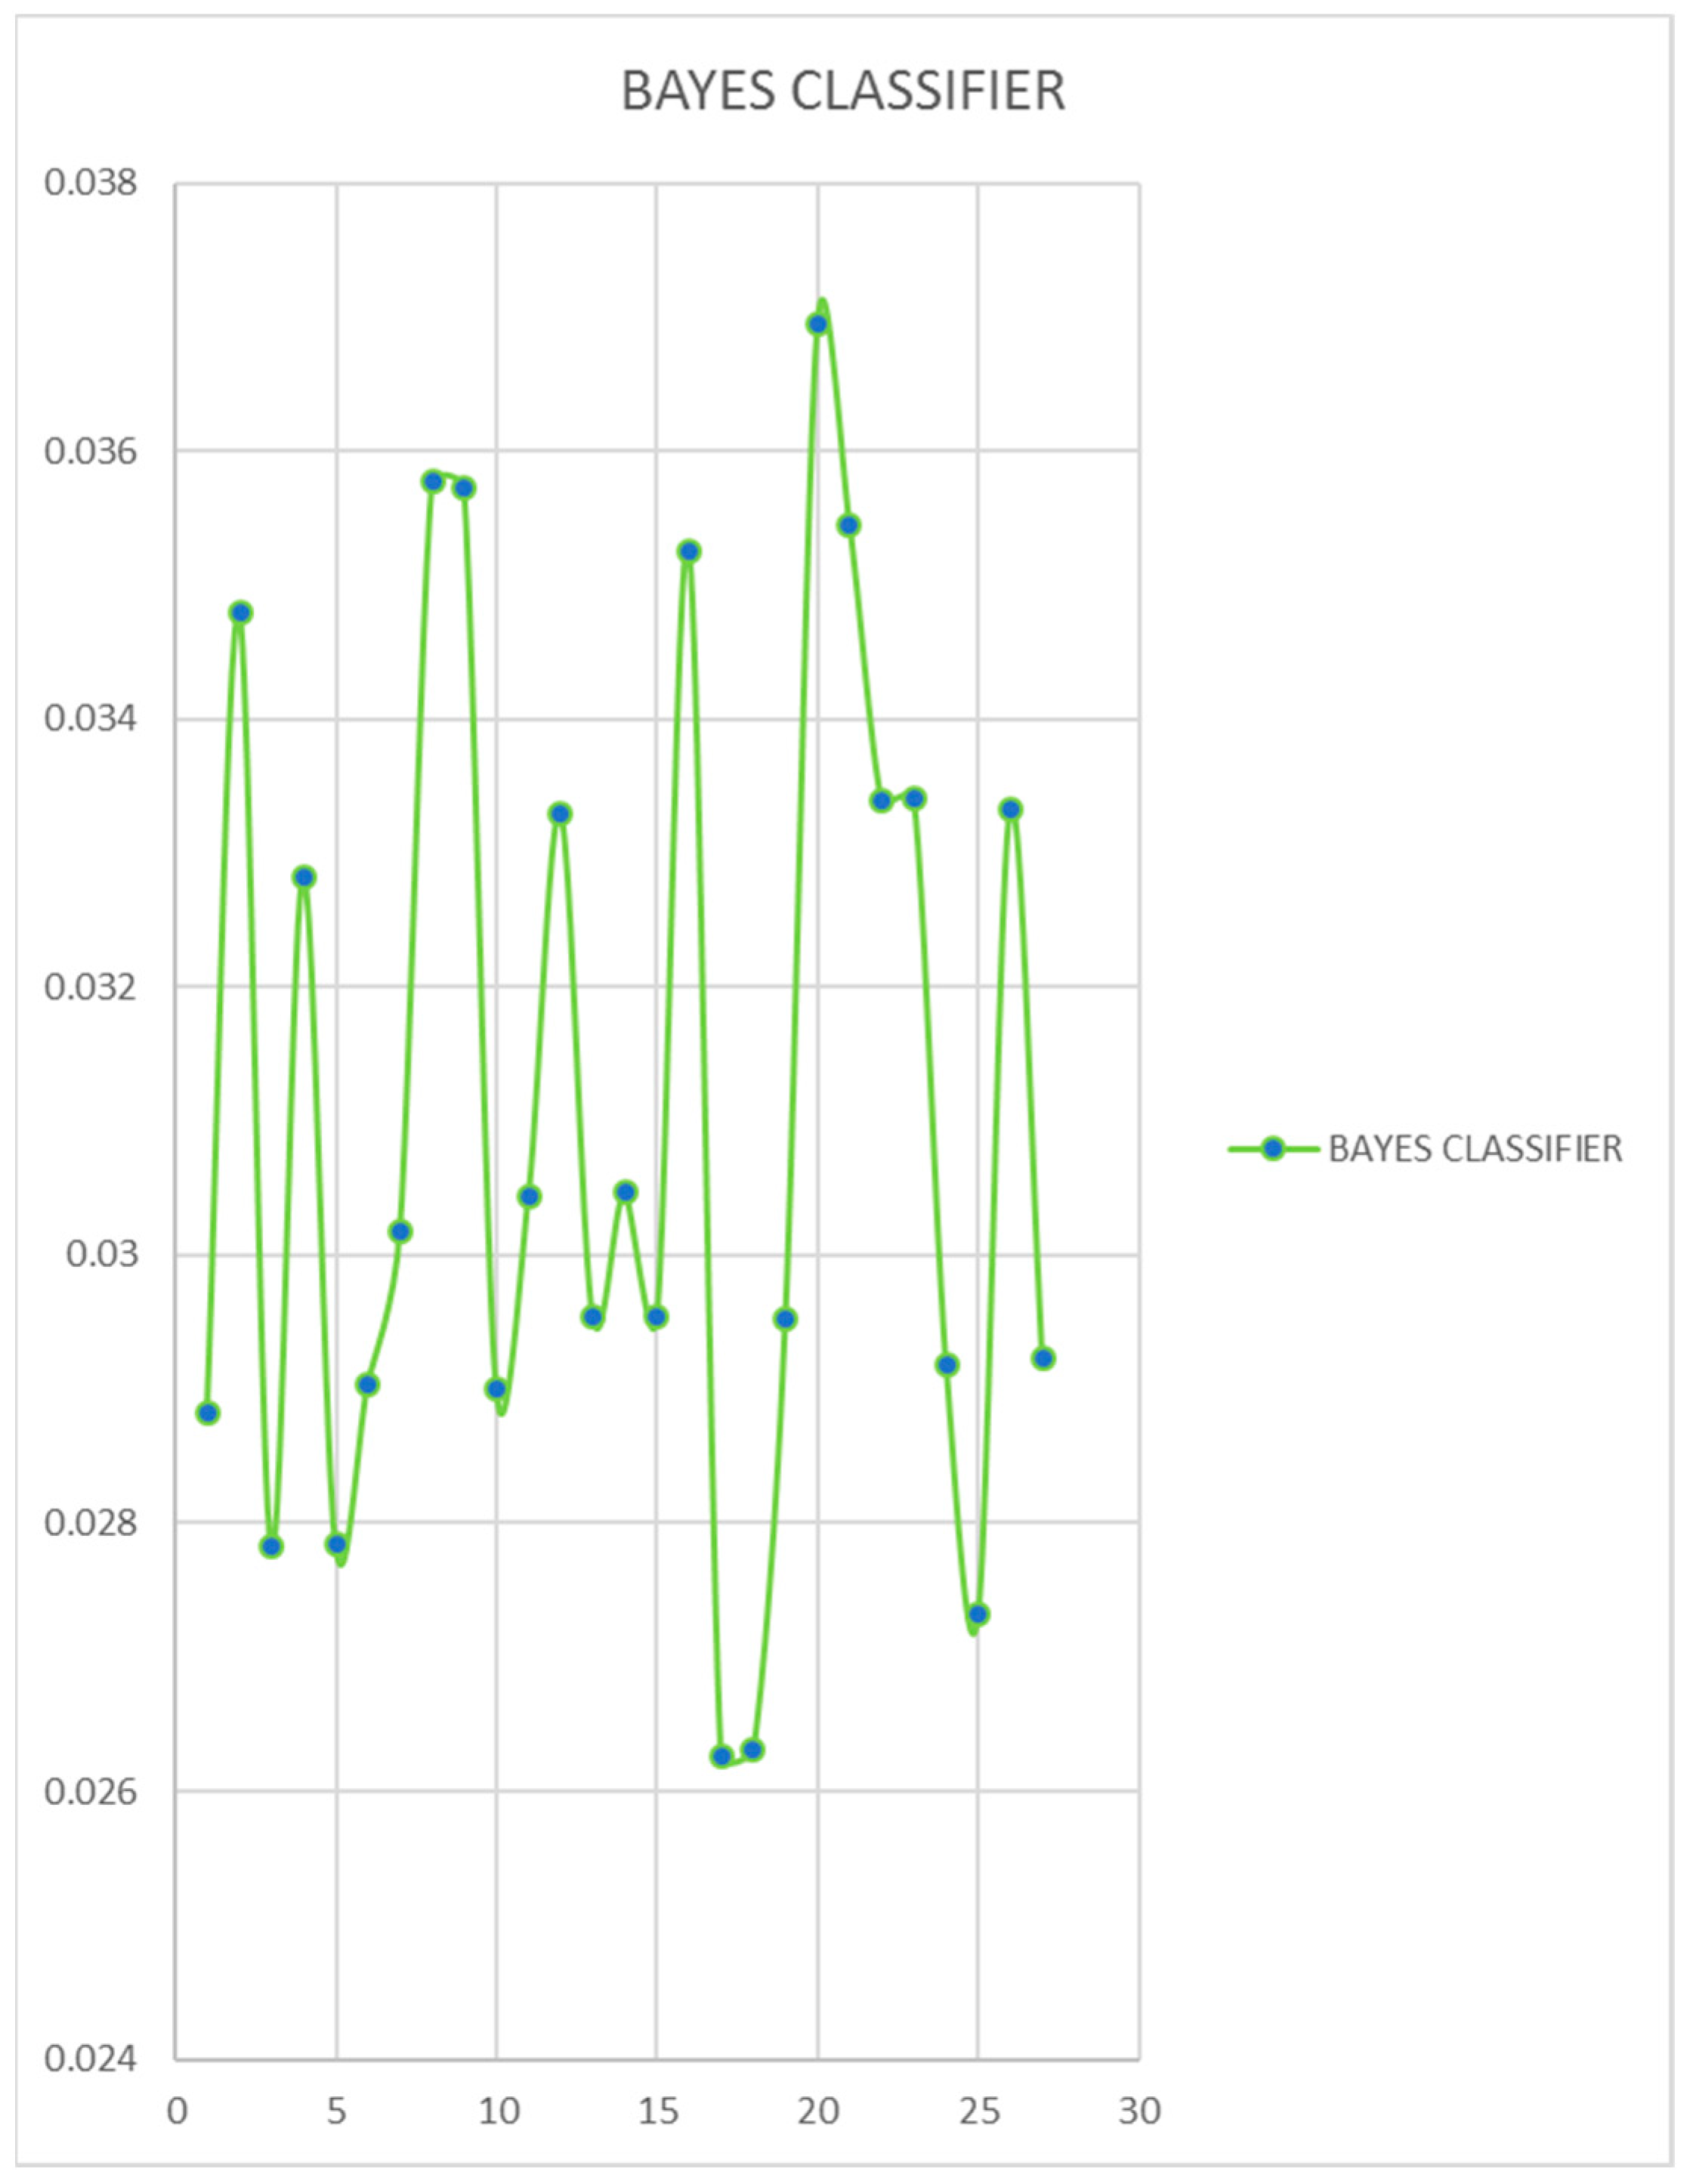
2.6. Bayesian Classifier
At this stage, a Bayesian classifier was established. Since all probabilistic values of diffuse rules are merged or related in the attention mechanism, each rule is analyzed as a single variable or criterion under study. It makes its algebraic product in each of the rules. It analyzes its behavior and identifies the maximum value corresponding to the rule that will provide posterior values to each criterion.
Thus, the joint model can be expressed in Equations (11) and (12).
Figure 8 shows the behavior of the probability product in each of the 27 fuzzy rules.
2.7. RPNW
Finally, the maximum value in the Bayesian classifier is identified in rule number 20; see
Figure 8 and
Figure 9. The probabilities of that rule are used to determine the proposed RPNW; see Equations (13) and (14).
The traditional indicator of the priority risk number is shown in Equation (15) multiplying the criteria assigned by the experts in the example that has been developed.
Figure 9 shows the normalization of each fuzzy rule, the identification with a cross of the maximum value, and the RPNW.
5. Conclusions and Future Work
The task of assessing risks is a significant activity with implications for the performance and competitiveness of organizations. On the contrary, developing an evaluation system based on qualitative and quantitative criteria is complex. The experts participate in the development of the evaluations, and each has its interpretation, making evident the subjectivity and imprecision in their partitions.
Generally, the behavior of a fuzzy system is described using a natural language. Otherwise, the behavior of a system is described with fuzzy quantities.
An expert-driven approach is used to design and develop systems with high interpretability but low accuracy, given that fuzzy quantities need no interpretation. In diffuse systems, there is no prior weighting of system criteria, and system outputs are based on truncating membership functions. In the proposed approach, a priori weights are used for each criterion, and the steps to determine the ex post weights are determined in weighted RPN. They are also known as data-based approaches.
Gaussian density functions are used to integrate stochastic uncertainty into the system. In addition, probability functions were categorized by integrating linguistic uncertainty to make the system more robust.
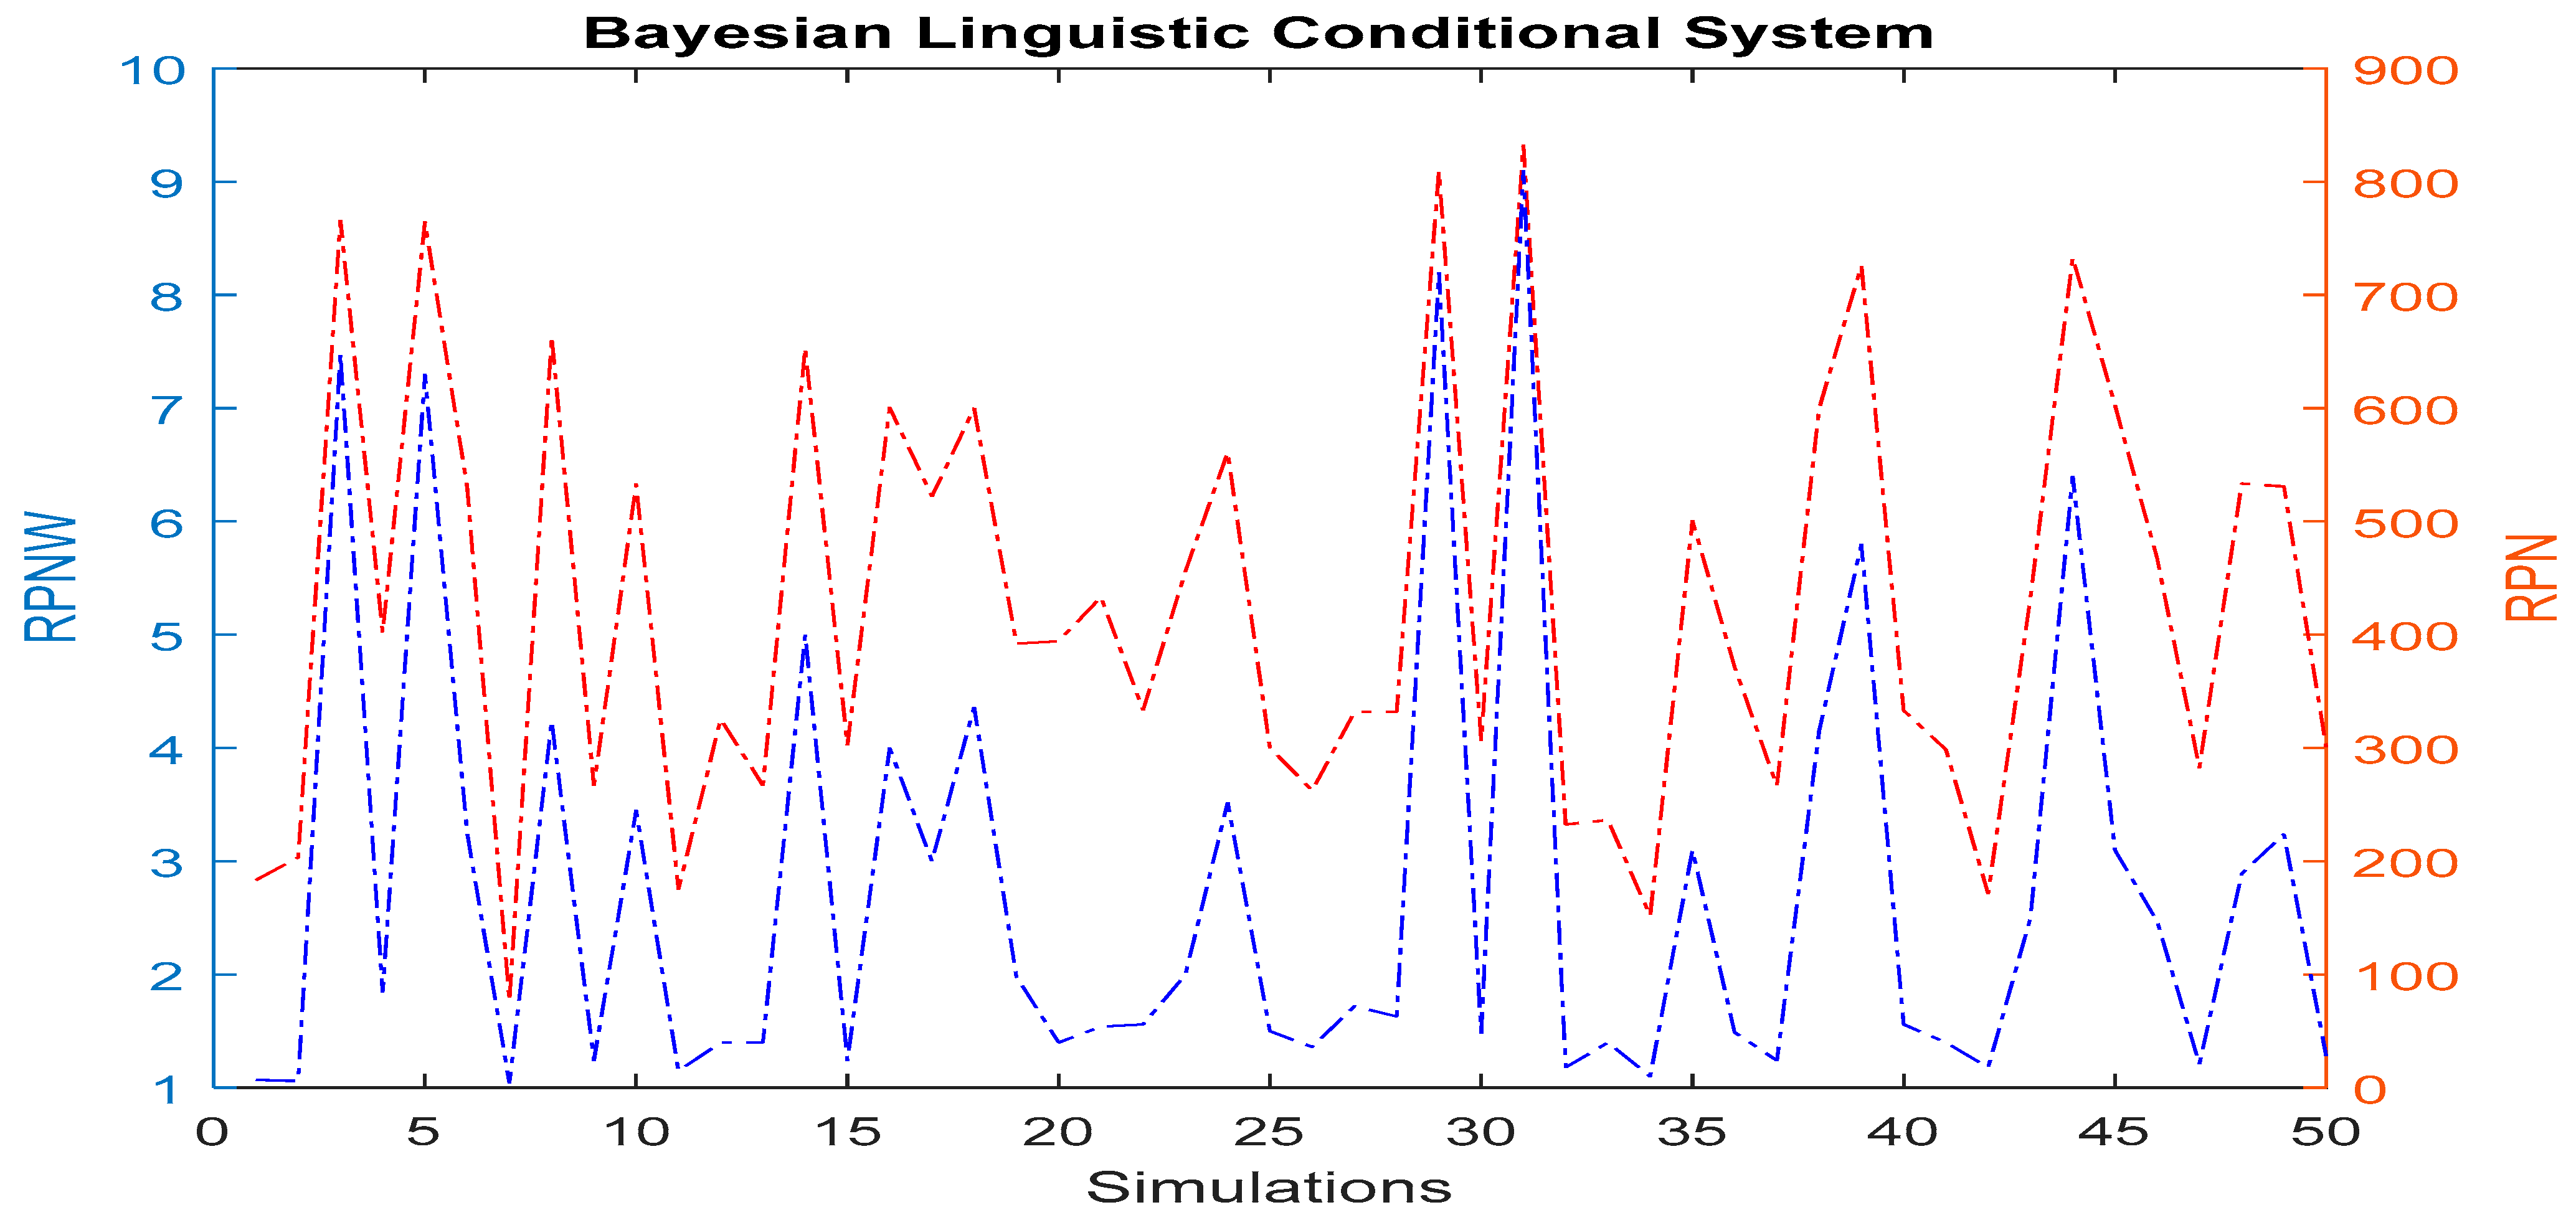
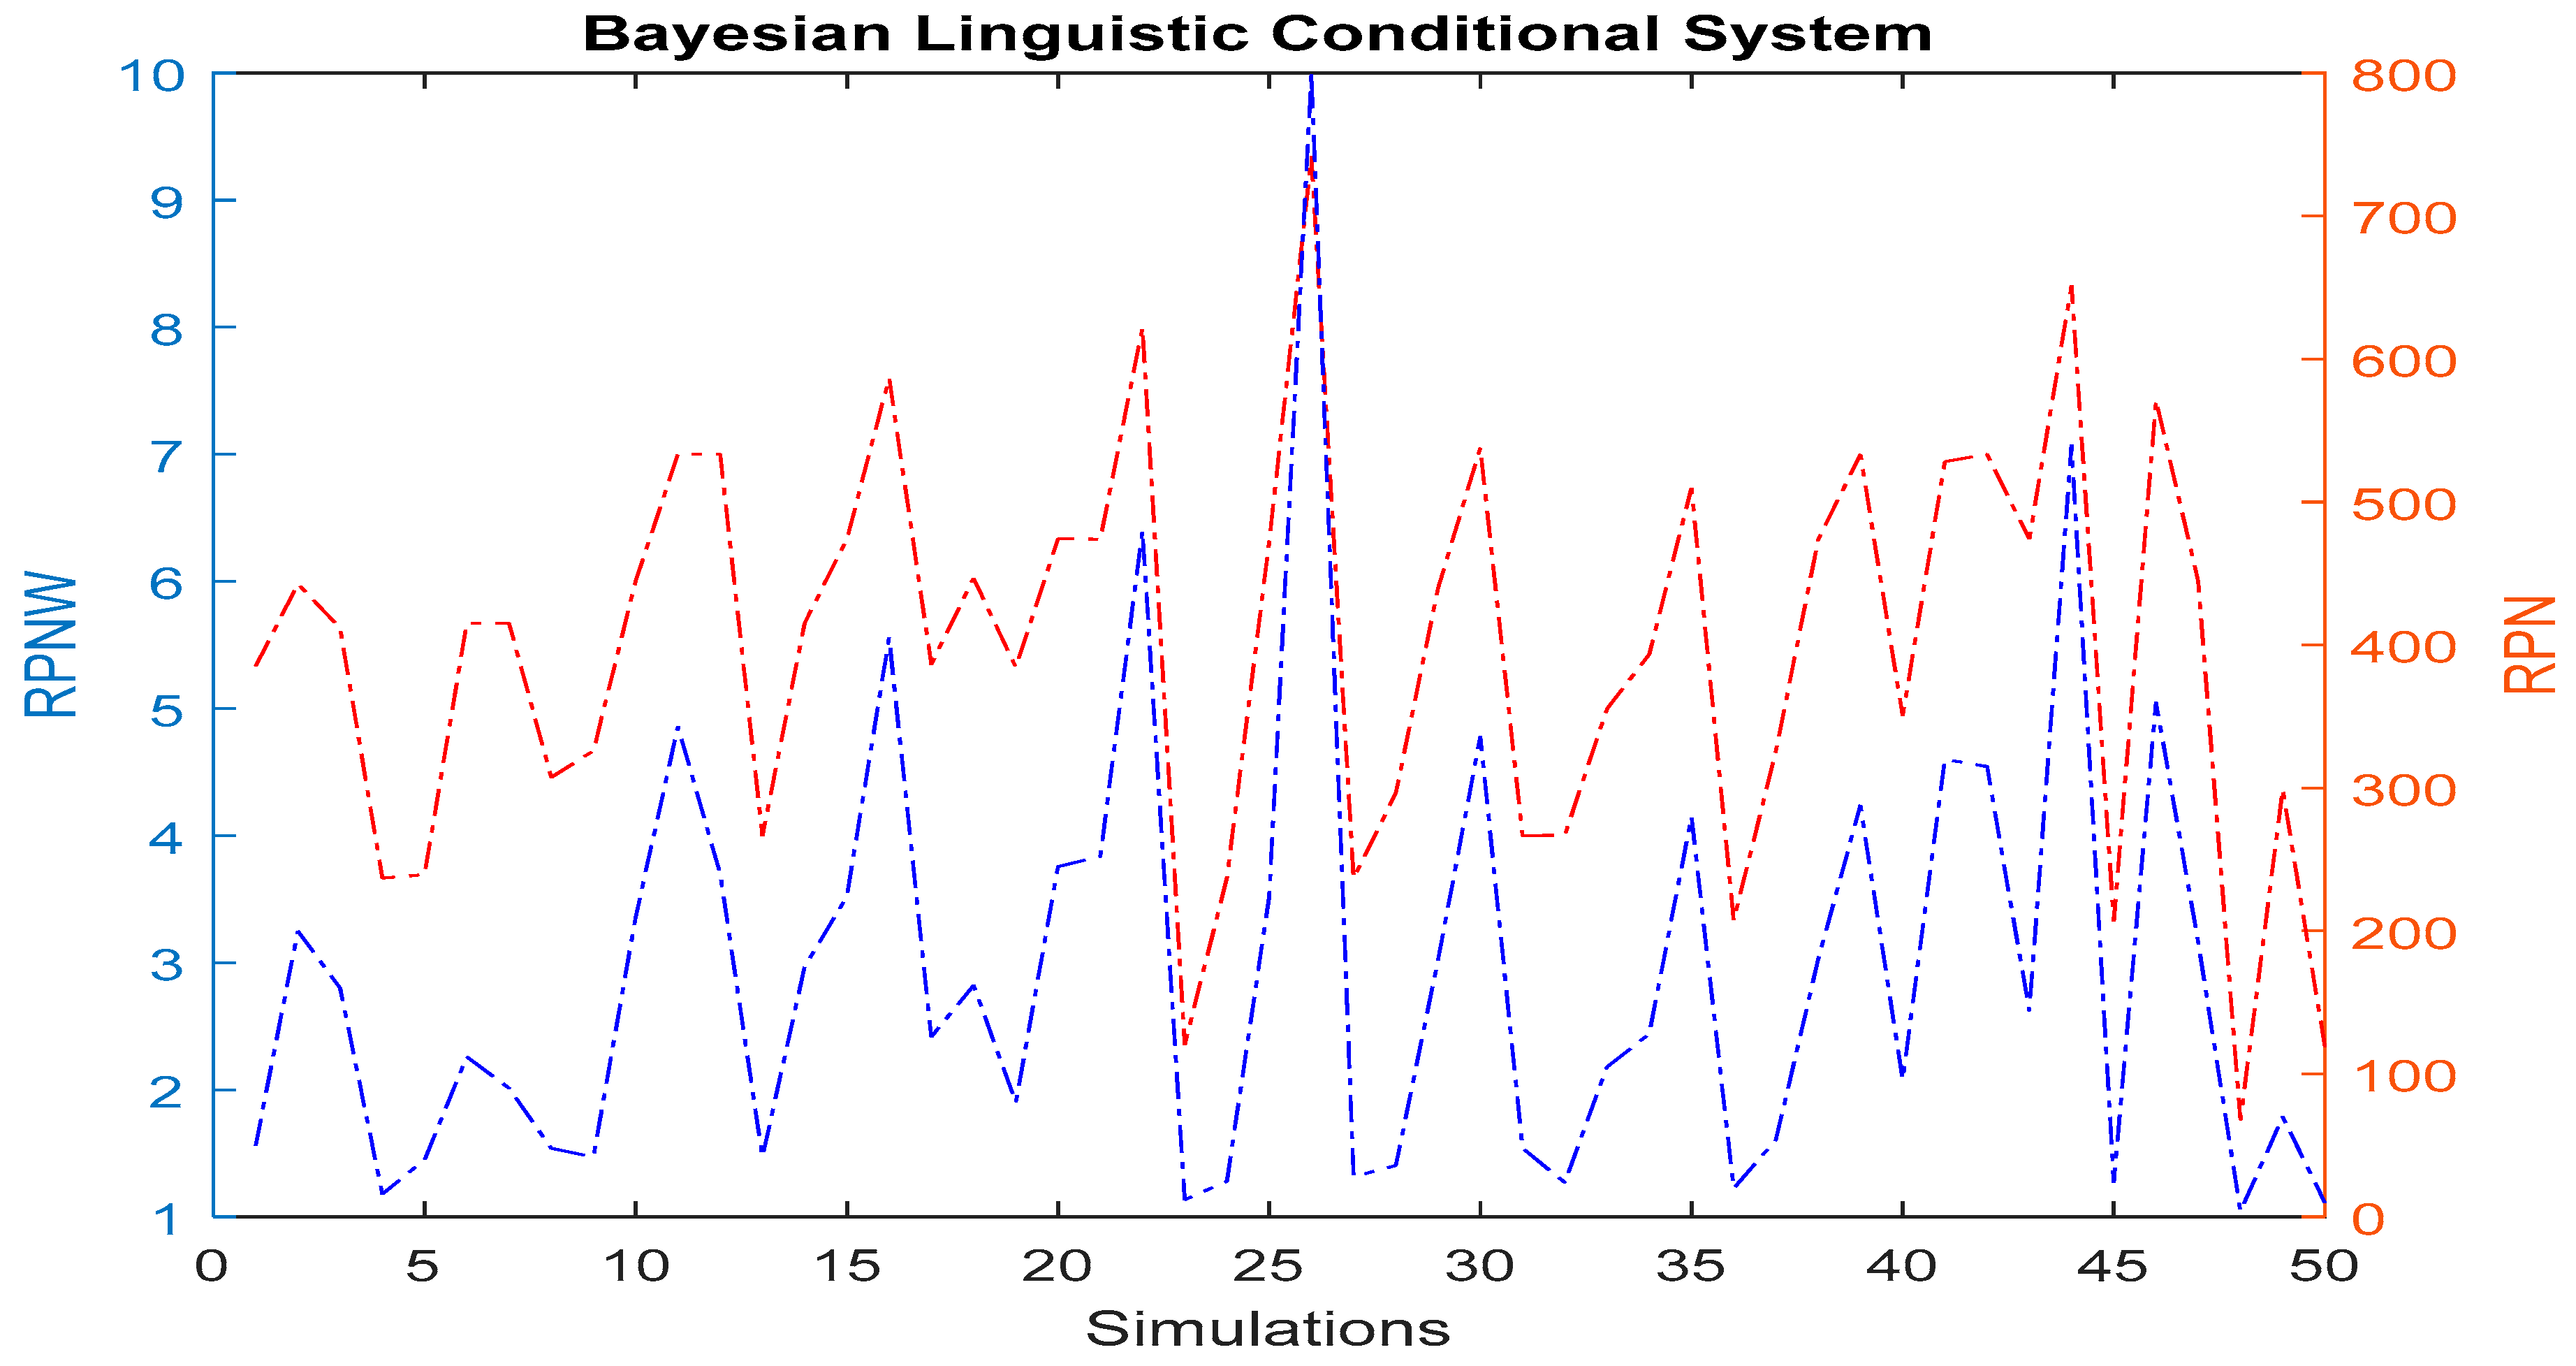
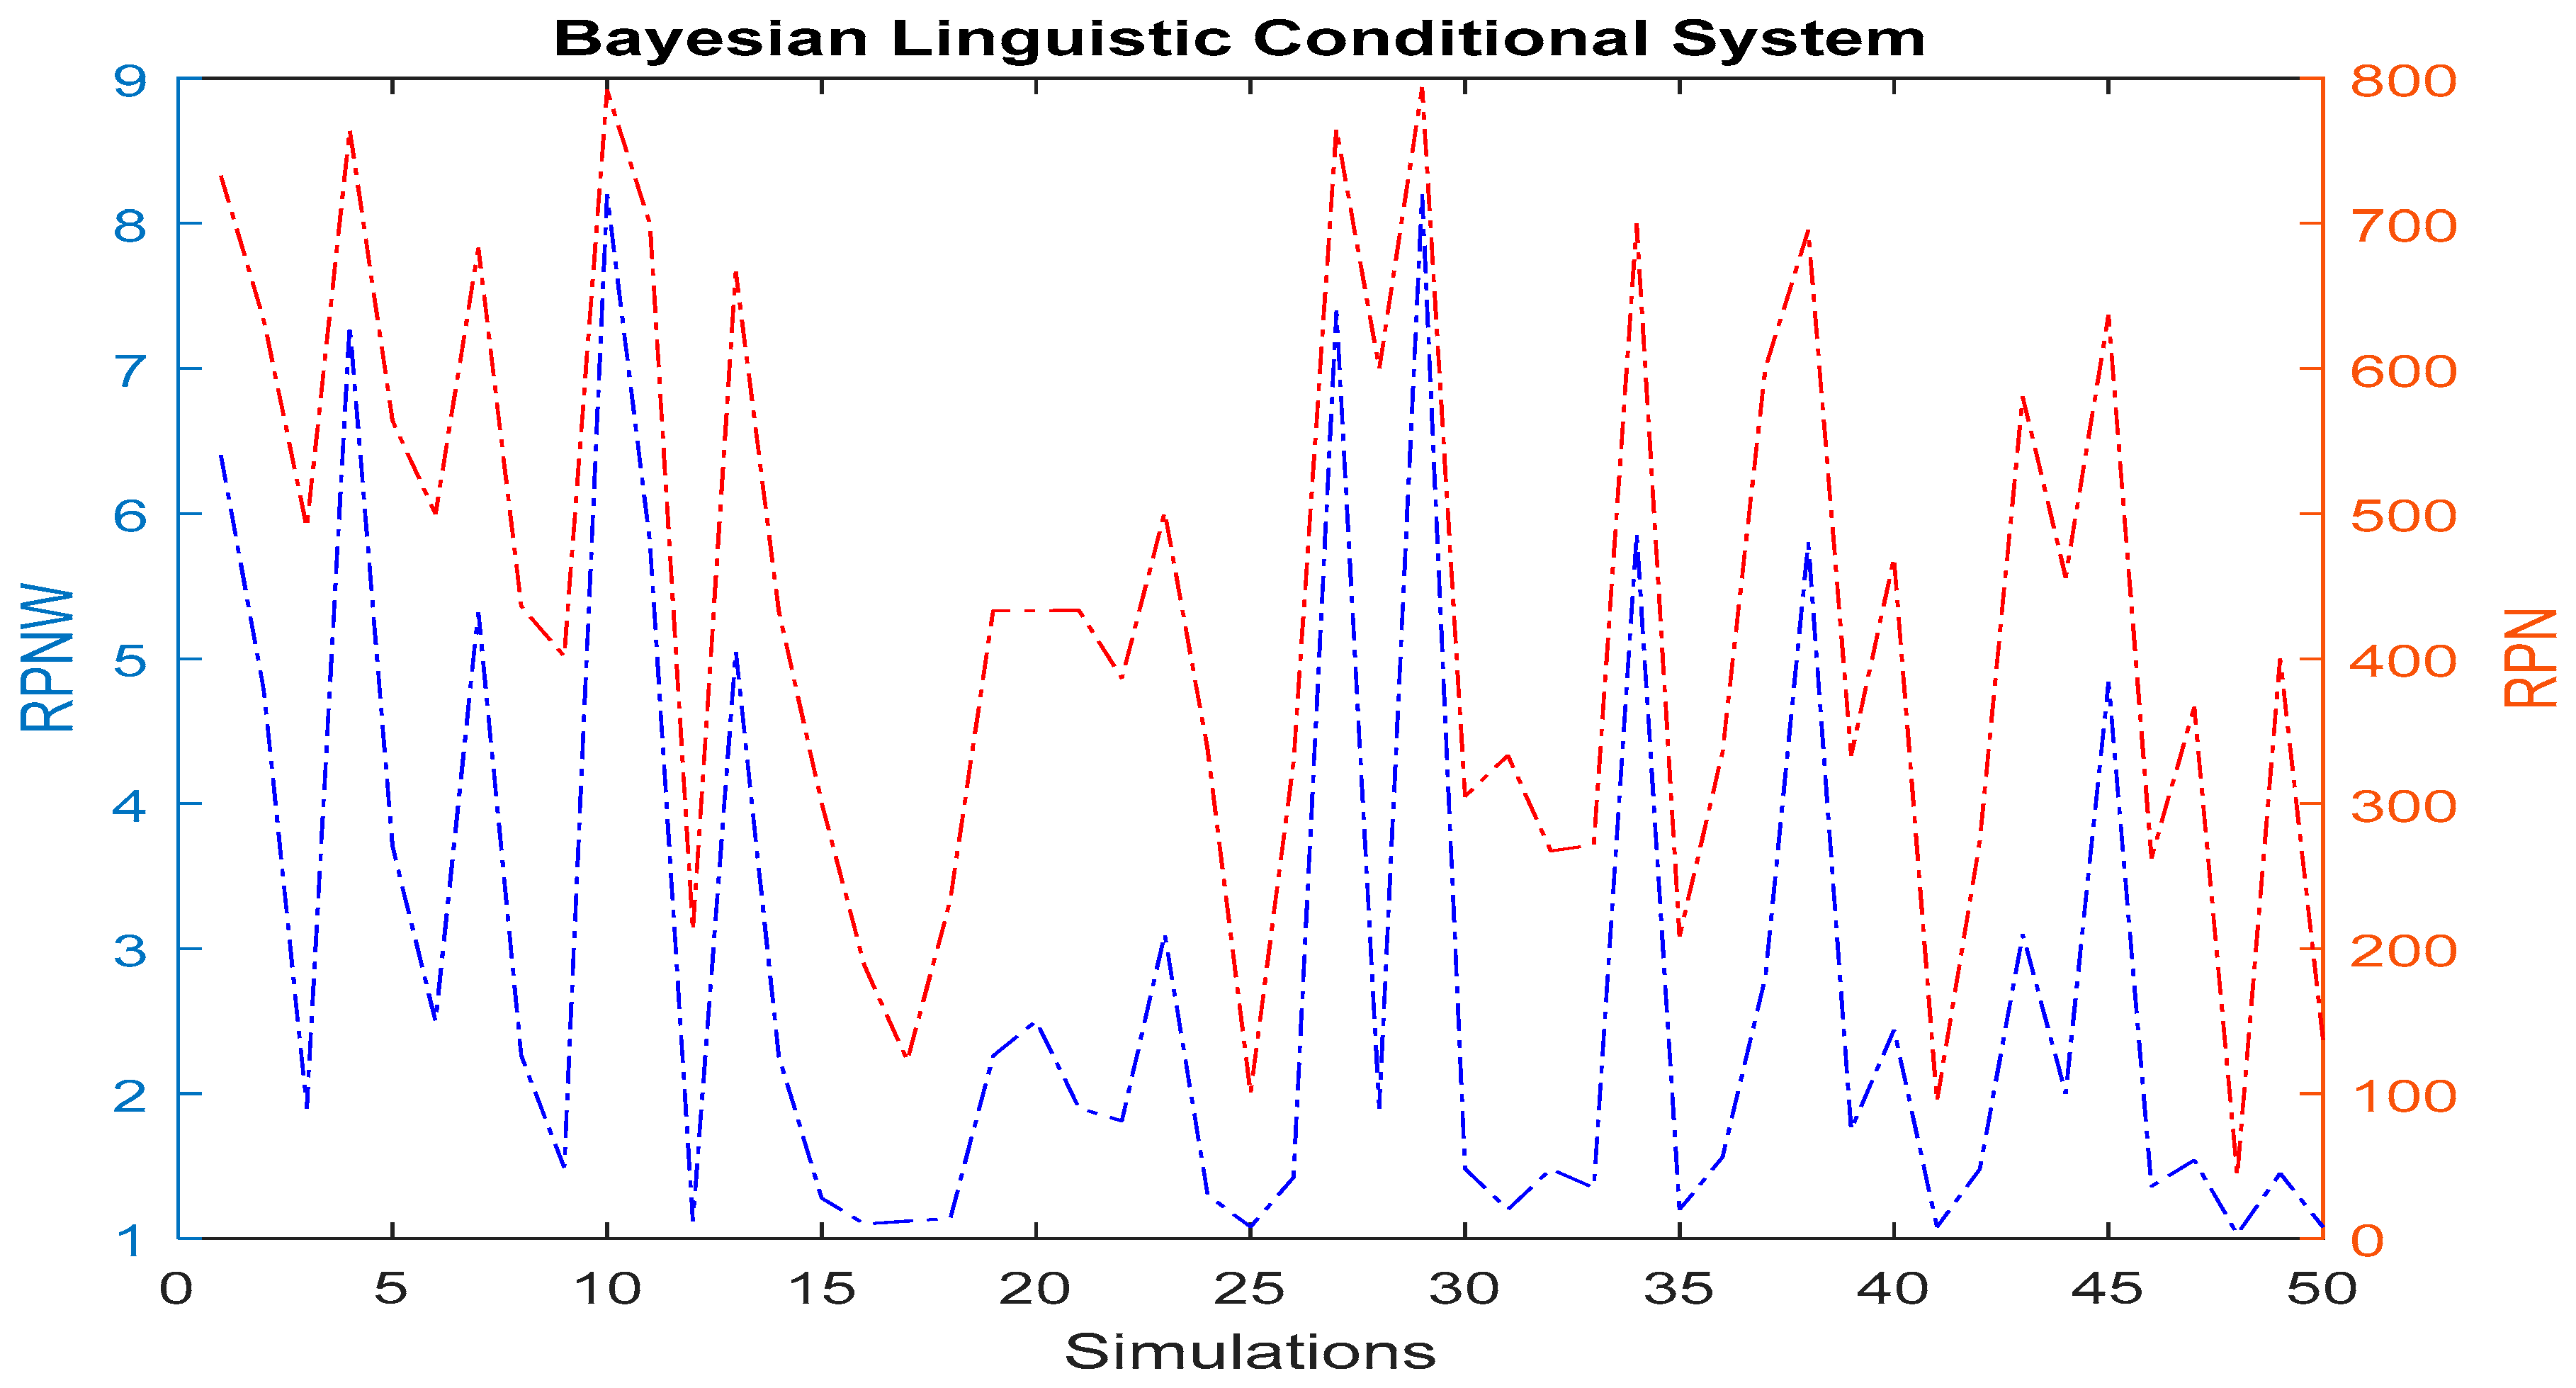
The most crucial stage of the system was to develop a care mechanism that merges the probabilities of different criteria based on the same level of language category. The results obtained gather the information and are analyzed as a single criterion. The values are normalized through the Softmax function by obtaining the posterior probabilities. Once the values are merged, a Bayesian classifier is used to identify the appropriate rule, and finally, a weighted RPN is determined. The system has a straightforward scale and is easily interpreted by the company’s entire staff. Compared with traditional RPN, they show similar behaviors, highlighting the two different scales for each. In short, the proposed system is robust, reliable, and easy to interpret with behaviors similar to those used conventionally.
Future work will integrate an iterative learning algorithm to increase the model’s accuracy.


