1. Introduction
In recent years, there has been a significant and rapid increase in the volume of digital content, incorporating a diverse array of fonts. The selection of a font that complements the content is crucial for design, readability, and effective communication [
1,
2,
3]. However, many users face challenges in the font selection process, often resulting in the use of inappropriate fonts.
Recent research has explored the use of deep learning and machine learning algorithms to recommend and predict optimal fonts for designers [
4,
5]. Nevertheless, studies focusing on technology that suggest fonts based on the emotions and atmosphere conveyed by the fonts are relatively limited. Fonts have the ability to evoke various moods and emotions through their shapes and forms, allowing people to perceive emotions from them.
To tackle this issue, our study is dedicated to designing and implementing a font recommendation system that suggests fonts based on the emotional context of input content. In our endeavor to recommend fonts that align with the emotional tone of the content, we conducted an analysis of font emotions using emotion keywords.
Recommending fonts based on the abstract concept of emotions is not straightforward. However, implementing a system that reflects emotions or feelings commonly perceived by many users is achievable. To do this, defining and mapping emotions felt within content and fonts is crucial.
In our previous research [
6], the initial step involved measuring the typical impressions and emotions conveyed by Korean fonts. To achieve this, users were prompted to directly select the emotions perceived from the fonts. In this paper, we aim to recommend fonts based on the impression data collected from previous research on fonts.
Ultimately, we successfully implemented a font recommendation system that suggests fonts aligned with the emotional context of the content. Given the distinct classification criteria of content emotion and font keywords, we needed a mapping model that could enable comparisons between different emotional classification standards. To achieve this, we designed two mapping methods: one that converts content and font emotions into PAD (Pleasure, Arousal, Dominance) values for comparison, and the other that relies on correlation analysis between content emotion classification standards and font keywords. We compared the effectiveness of these two mapping methods, presenting font recommendation lists for content using each calculation model. The results allowed us to evaluate and choose the model deemed most suitable for the task, confirming that the correlation analysis-based mapping method was more effective. This paper makes the following contributions:
Design and Implementation of a Font Recommendation System: The research focused on designing and implementing a font recommendation system based on emotional context. This system enables designers to quickly and accurately receive font suggestions that align with the emotional tone of the input content.
Development of Mapping Models for Font and Content Emotions: The study introduced two mapping models to bridge the gap between different emotional classification standards for content and font keywords. These models allow for comparisons between various emotional classification standards, laying the foundation for tailored recommendations.
Implementation of a Font Recommendation Interface: Using a correlation analysis-based mapping method, the research implemented a font recommendation interface. This interface actualizes font suggestions based on content emotion to enhance the user experience. Usability evaluations were conducted to validate the effectiveness of the system.
Our study proposes a font recommendation system based on content emotion, enabling users with limited design experience to quickly and accurately receive font suggestions tailored to the context. The approach we have presented can find applications in various digital content fields, including video production, electronic publishing, and social networks.
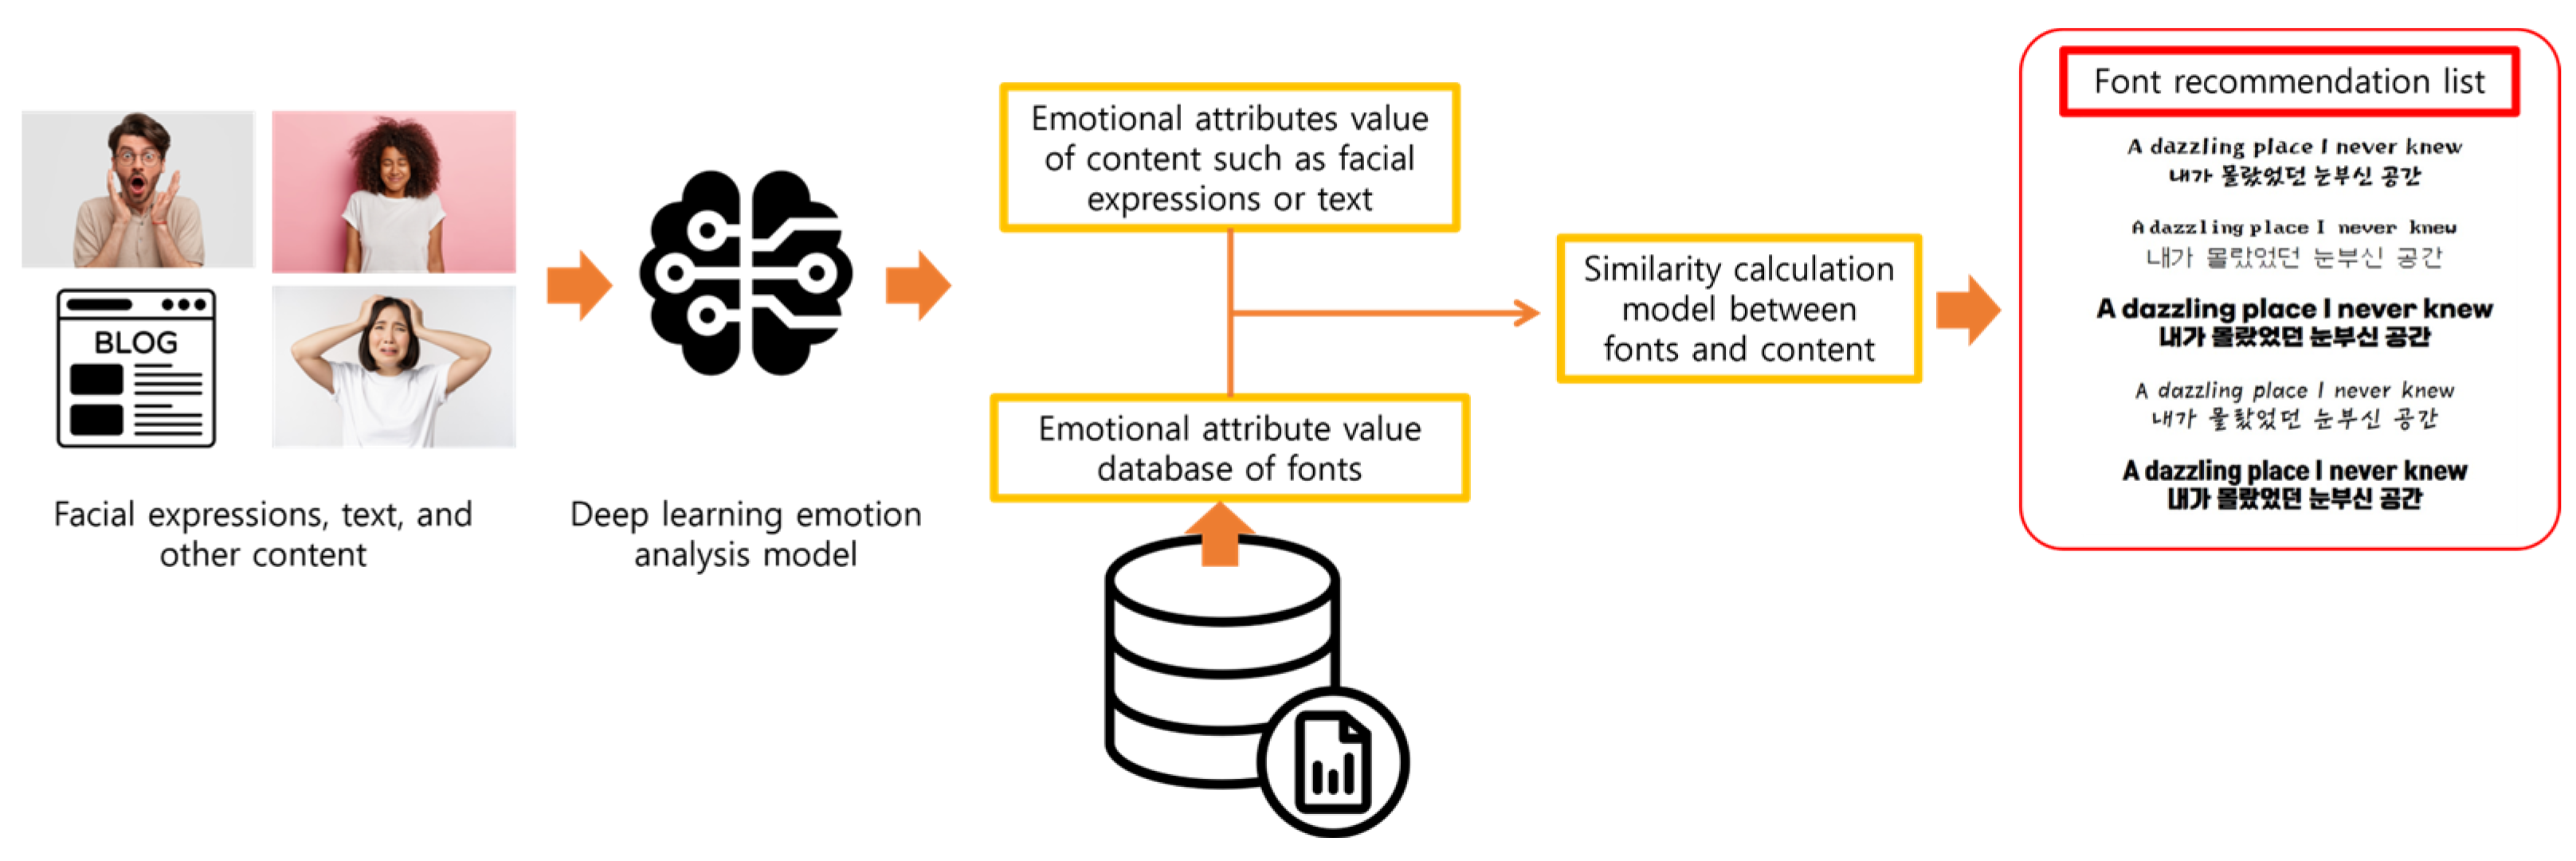
Figure 1 represents the entire process of our font recommendation system.
The structure of this paper is as follows: In
Section 2, various studies related to font recommendation systems and emotion analysis are discussed.
Section 3 presents the research findings regarding emotional keywords associated with fonts, including the selection of keywords to express font impressions and the calculation of keyword attribute values for each font. This research was conducted in-depth in previous studies.
Section 4 explains the font recommendation system based on content emotion analysis, including the comparison and selection of calculation models.
Section 5 covers the usability evaluation of the implemented system. Finally, in
Section 6, the conclusion is provided.
2. Related Works
The exploration of mapping fonts to context and emotions has been a recurring area of investigation, underscoring the significance of font selection in various aspects of communication and user perception. In one study [
7], researchers delved into the connections between the visual attributes of fonts and the linguistic context of the text. This research is expected to have a substantial impact on our understanding of how text and fonts interact. Additionally, current research [
8] is concentrated on unraveling the emotional nuances conveyed by Chinese character fonts. This research promises to bring new insights into how fonts can evoke emotions, further enhancing our comprehension of the link between font choice and emotional expression. As highlighted by these studies, the selection of an appropriate font holds great significance for communication and the way users perceive information. Previous research, such as the exploration of font importance in email communication [
9] and the emphasis on the scientific principles of font selection in academic writing [
10], has demonstrated that specific fonts can influence the overall aesthetic appeal of text and the message’s impact. Moreover, these studies have established methods for choosing fonts that improve text quality and readability.
Furthermore, research focusing on the psychological aspects of fonts and readability [
11] has revealed that design elements like font style, thickness, spacing, and color can shape a reader’s aesthetic sensibility and comprehension. Certain fonts can either emphasize or tone down the emotional undertones of the text, contributing to a more comprehensive understanding of the message. In this context, the importance of font selection in various digital media, such as blogs, cannot be overstated. It is a critical factor in effective communication and message reception in today’s digital age.
In line with the importance of font selection, recent research has been actively utilizing state-of-the-art deep learning algorithms to recommend fonts [
4,
5]. These studies underscore the significance of context-specific font selection and employ deep learning and machine learning algorithms to assist font selectors in making more appropriate font choices.
To recommend fonts based on emotions, previous studies have measured and suggested the emotional attributes of fonts [
12,
13]. These studies conducted emotion analysis on both English and Korean fonts. Subsequently, after exploring fundamental attributes in the classification system of Korean fonts, emotional attribute values were acquired, leading to the implementation of an emotion-based recommendation system. Inspired by this research, our goal was to recommend fonts based on emotions perceived within the content.
Well-known commercial font recommendation systems include Adobe Fonts (Adobe Creative Cloud) [
14], Google Fonts [
15], and Canva (Font Space) [
16]. These platforms facilitate font searching and assist in making appropriate font selections through features like simple filters. Adobe Fonts, integrated with some of Adobe’s design tools, offers a vast array of fonts. Designers utilize Adobe Fonts to find fonts suitable for their projects, and the service provides recommendation features to assist users in selecting fitting fonts. Google Fonts provides a variety of free web fonts, allowing users to review detailed information about each font and search for fonts that suit their projects. However, users need to manually search using filters, and the service focuses more on selecting fonts based on their appearance than the mood of the context in which they will be used. Canva, a tool for video creation, social media posters, web design, and more, includes built-in font searching and recommendation features. Canva enables users to search for fonts based on style, using keywords like cool, cute, and fancy. However, some features are paid, and users need to manually search for fonts that match the desired mood. Our research aims to simplify this process by automatically mapping the emotions of content and fonts, eliminating the need for filters.
Existing font recommendation studies exist in various forms; however, they have certain limitations. Firstly, research related to the emotions conveyed by fonts has predominantly focused on measuring emotional values unique to fonts. This study takes a step further by implementing a system capable of matching fonts to content. Secondly, font recommendation studies often neglect the emotional aspect and predominantly center around image-based recommendations based on simple forms and shapes. Lastly, there is a scarcity of research that implements actual font recommendation systems and applies them in practical settings. In addressing these gaps, our research distinguishes itself.
3. Emotion Keywords Encapsulated in Fonts
To define the emotions associated with the images conveyed by fonts, we conducted crowdsourcing to classify the relevance of fonts and keywords among various individuals [
8]. This method was employed to confirm the general atmosphere or emotions expressed by fonts. The emotions defined for fonts were later used in emotion keyword-based font recommendations after quantification.
First, the selection of emotion keywords was based on O’Donovan’s research, which used various vocabulary to express the impressions of Korean fonts [
12]. O’Donovan’s study defined the impressions of fonts using 37 keywords for English fonts, as shown in
Table 1.
However, these keywords were originally defined for English fonts and merely represent form-based impressions of fonts, rather than human emotions. Therefore, some of the keywords that were difficult to apply to Korean fonts or those that only expressed the appearance of fonts were removed. Additionally, we included three distinctive keywords for Korean fonts, namely ‘determined’, ‘harmonious’, and ‘stiff’, resulting in an extended list of 41 keywords [
17].
This process was carried out through a questionnaire-based survey in two phases. In the first phase, respondents were asked to select all the keywords that suited fonts from the 41 available. As a result, 29 keywords were selected. In the second phase, respondents were asked to determine whether each of the 29 keywords was closer to shape representation or emotional expression. Eventually, 19 emotion keywords, including angular, attention-grabbing, boring, calm, delicate, disorderly, dramatic, formal, friendly, gentle, graceful, modern, playful, strong, technical, warm, determined, harmonious, and stiff, were identified as the emotions that can be perceived in fonts [
6].
To define the emotions associated with fonts, we had 61 users assess the impressions of each font based on the 19 emotion keywords. We measured the degree of each font’s association with the emotions in a pool of around 200 Korean fonts. For example, the survey results for the DOS Gothic font are shown in
Table 2. The impression of ‘angular’ for the DOS Gothic font was perceived as strong by 20 respondents, moderate by 32 respondents, and weak by 9 respondents.
Using the data collected in this manner, we determined the emotional attributes of fonts based on respondent numbers and weighed them accordingly. This process is illustrated in Equation (1). In this equation,
represents the font,
denotes the keyword, and
represents the keyword value of the font.
,
and
represent the number of respondents who rated the keyword as high, medium, and low for each font.
represents the total number of respondents [
6].
4. Font Recommendation System through Content Emotion Analysis
The emotional values of fonts measured in
Section 3 are ultimately utilized to implement a system that recommends fonts suitable for the extracted emotions of content based on user expressions and text content input. However, the emotional criteria for fonts and content differ. Therefore, two models for calculating the similarity between content emotions with different classification criteria and font keywords are designed. A comparison of the models is conducted to select the computational model, which, once chosen, can be applied to the implementation of the font recommendation system.
The “PAD model” [
18] is a framework often used to describe emotions and affective states. It breaks down emotions into three fundamental dimensions:
Pleasure: This dimension represents how pleasant or unpleasant an emotion is. Positive values indicate pleasurable emotions, while negative values indicate unpleasant ones.
Arousal: Arousal measures the intensity or excitement level of an emotion. High values indicate highly aroused emotions, while low values represent calm or low arousal emotions.
Dominance: This dimension reflects the sense of control or dominance associated with an emotion. Positive values represent emotions where the person feels in control or dominant, while negative values signify emotions where the person feels submissive or not in control.
The PAD model is commonly used in psychology and emotion recognition research. It is also applied in various fields, such as product design, advertising, and user experience design, to better understand and design for emotions and affective responses. By using this model, emotions can be described and analyzed in a more precise and structured manner, aiding in the improvement of products, services, and user interactions.
In this study, two calculation models were designed utilizing the emotional values derived from the PAD model, as described above. In
Section 4.1, the model is explained, which recommends fonts based on distance calculation after converting the emotions of content and fonts into PAD values. Additionally,
Section 4.2 elucidates the calculation model that determines similarity by calculating the correlation between the emotional classification criteria of content and font keywords using the Pearson correlation coefficient. Finally, in
Section 4.3, the font recommendation results obtained through each calculation model are evaluated, and the final calculation model to be applied to the content-font mapping model is selected.
Additionally, in the experiments in
Section 4.1 and
Section 4.2, using the maximum number of fonts could be effective. However, since the task involves classifying each font into 19 keywords, the workload increases with the growing number of fonts. This could potentially induce fatigue in evaluators, leading to reduced reliability in the results of the later stages of the evaluation. Therefore, in this study, we decided to select a representative minimum of fonts based on font classification for application in experiments. We collected over 200 fonts that are highly preferred by users and are available for free. After classifying them into general design attributes of Korean fonts, we categorized them into basic styles and modified styles within the classification system [
19]. The classification was based on general design attributes of Korean fonts, using the criteria of serif characters for Myeongjo-style, sans-serif characters for Gothic-style, and others. The selected fonts included four basic Myeongjo-style, four basic Gothic-style, six modified Myeongjo-style, five modified Gothic-style, and seven miscellaneous fonts. To ensure diversity in font thickness, we structured the selected fonts within the same category to include both bold and thin characters.
4.1. Font Recommendation Model Utilizing PAD Value Distance Calculation
When mapping the 19-font keywords derived from
Section 3 into a single PAD space, it becomes possible to calculate the distances between the PAD values of the content. To achieve this, the PAD values are used to multiply each keyword attribute value for each font and then calculate the average. However, this process led to an issue where the font’s PAD values were distributed near the mid-value of PAD, which is 0.5, due to repetitive decimal multiplications. To address this concern, a new formula was introduced using the Sigmoid function. Formula (2) calculates the
, applying the Sigmoid function to the total sum of the product of the font’s keyword values
. Here,
represents the keyword values of fonts, and the value −4.75 serves as the multiplication coefficient for the Sigmoid function.
This coefficient plays a role in determining the overall smoothness, or saturation, of the curve. The inflection point for the newly mapped font values in the PAD space is determined to be 4.75, considering the mid-value of the existing attribute values (0.5), the mid-value of the experiment (0.5), and the number of keywords, which is 19. Additionally, the multiplication coefficient for the Sigmoid function is set at 0.5, which plays a crucial role in determining the overall smoothness or saturation of the curve. Increasing this coefficient will distinctly differentiate the data clustered around the set mid-value, while more extreme values will result in less noticeable differences.
4.2. Font Recommendation Model Utilizing the Pearson Correlation Coefficient
The Pearson correlation coefficient is a statistical measure used to assess the strength and direction of a linear relationship between two variables. It ranges between −1 and 1, and its interpretation is as follows:
Close to 1: Indicates a strong positive linear correlation between the two variables. When one variable increases, the other tends to increase as well.
Close to 0: Suggests a weak or no linear correlation between the two variables. The relationship between them may be weak or non-existent.
Close to −1: Indicates a strong negative linear correlation between the two variables. When one variable increases, the other tends to decrease.
By utilizing the Pearson correlation coefficient, it is possible to calculate the correlation coefficient between the emotions of the content and the emotions of the font.
Table 3 below represents the correlation coefficients between the emotions of the content and the font keywords.
The emotion extracted from the content is transformed based on the font keyword using Pearson correlation coefficients as weights. Equation (3) represents the transformation formula, where the content keyword attribute value
is the sum of the product of the content’s emotion
and the Pearson correlation coefficient
, and
represents the number of categories for content emotion classification. The values derived from this calculation formula can be used to determine the degree of similarity between the font’s emotional values using a cosine similarity calculation method.
4.3. Comparison and Selection of Computational Models
To evaluate the two computational models presented in this paper, participants were provided with ranked lists of recommended fonts based on specific expressions and text using each calculation method, as conducted in previous studies [
6]. A total of 34 participants from diverse age groups, ranging from their twenties to their fifties, were involved in the evaluation. As a result, the model employing the Pearson correlation coefficient was assessed as the one that effectively recommends appropriate fonts based on the emotional content. Consequently, the font recommendation system proposed in this study is implemented using a computational model that utilizes the Pearson correlation coefficient.
4.4. Implementation of a Font Recommendation System
The font recommendation system, based on the emotions of the content, recommends fonts depending on the emotions extracted through deep learning emotion analysis APIs when content like images and text is input.
In the case of an image input, the DeepFace API [
20] was utilized to extract emotions based on facial expressions. The API employs a model to determine emotion values. The DeepFace API is an application programming interface that provides access to the DeepFace facial recognition technology. It is commonly employed for face recognition, face detection, and facial attribute analysis in machine learning and computer vision applications. Developed by Facebook AI Research, DeepFace is renowned for its deep neural network models that can identify and analyze faces in images and videos.
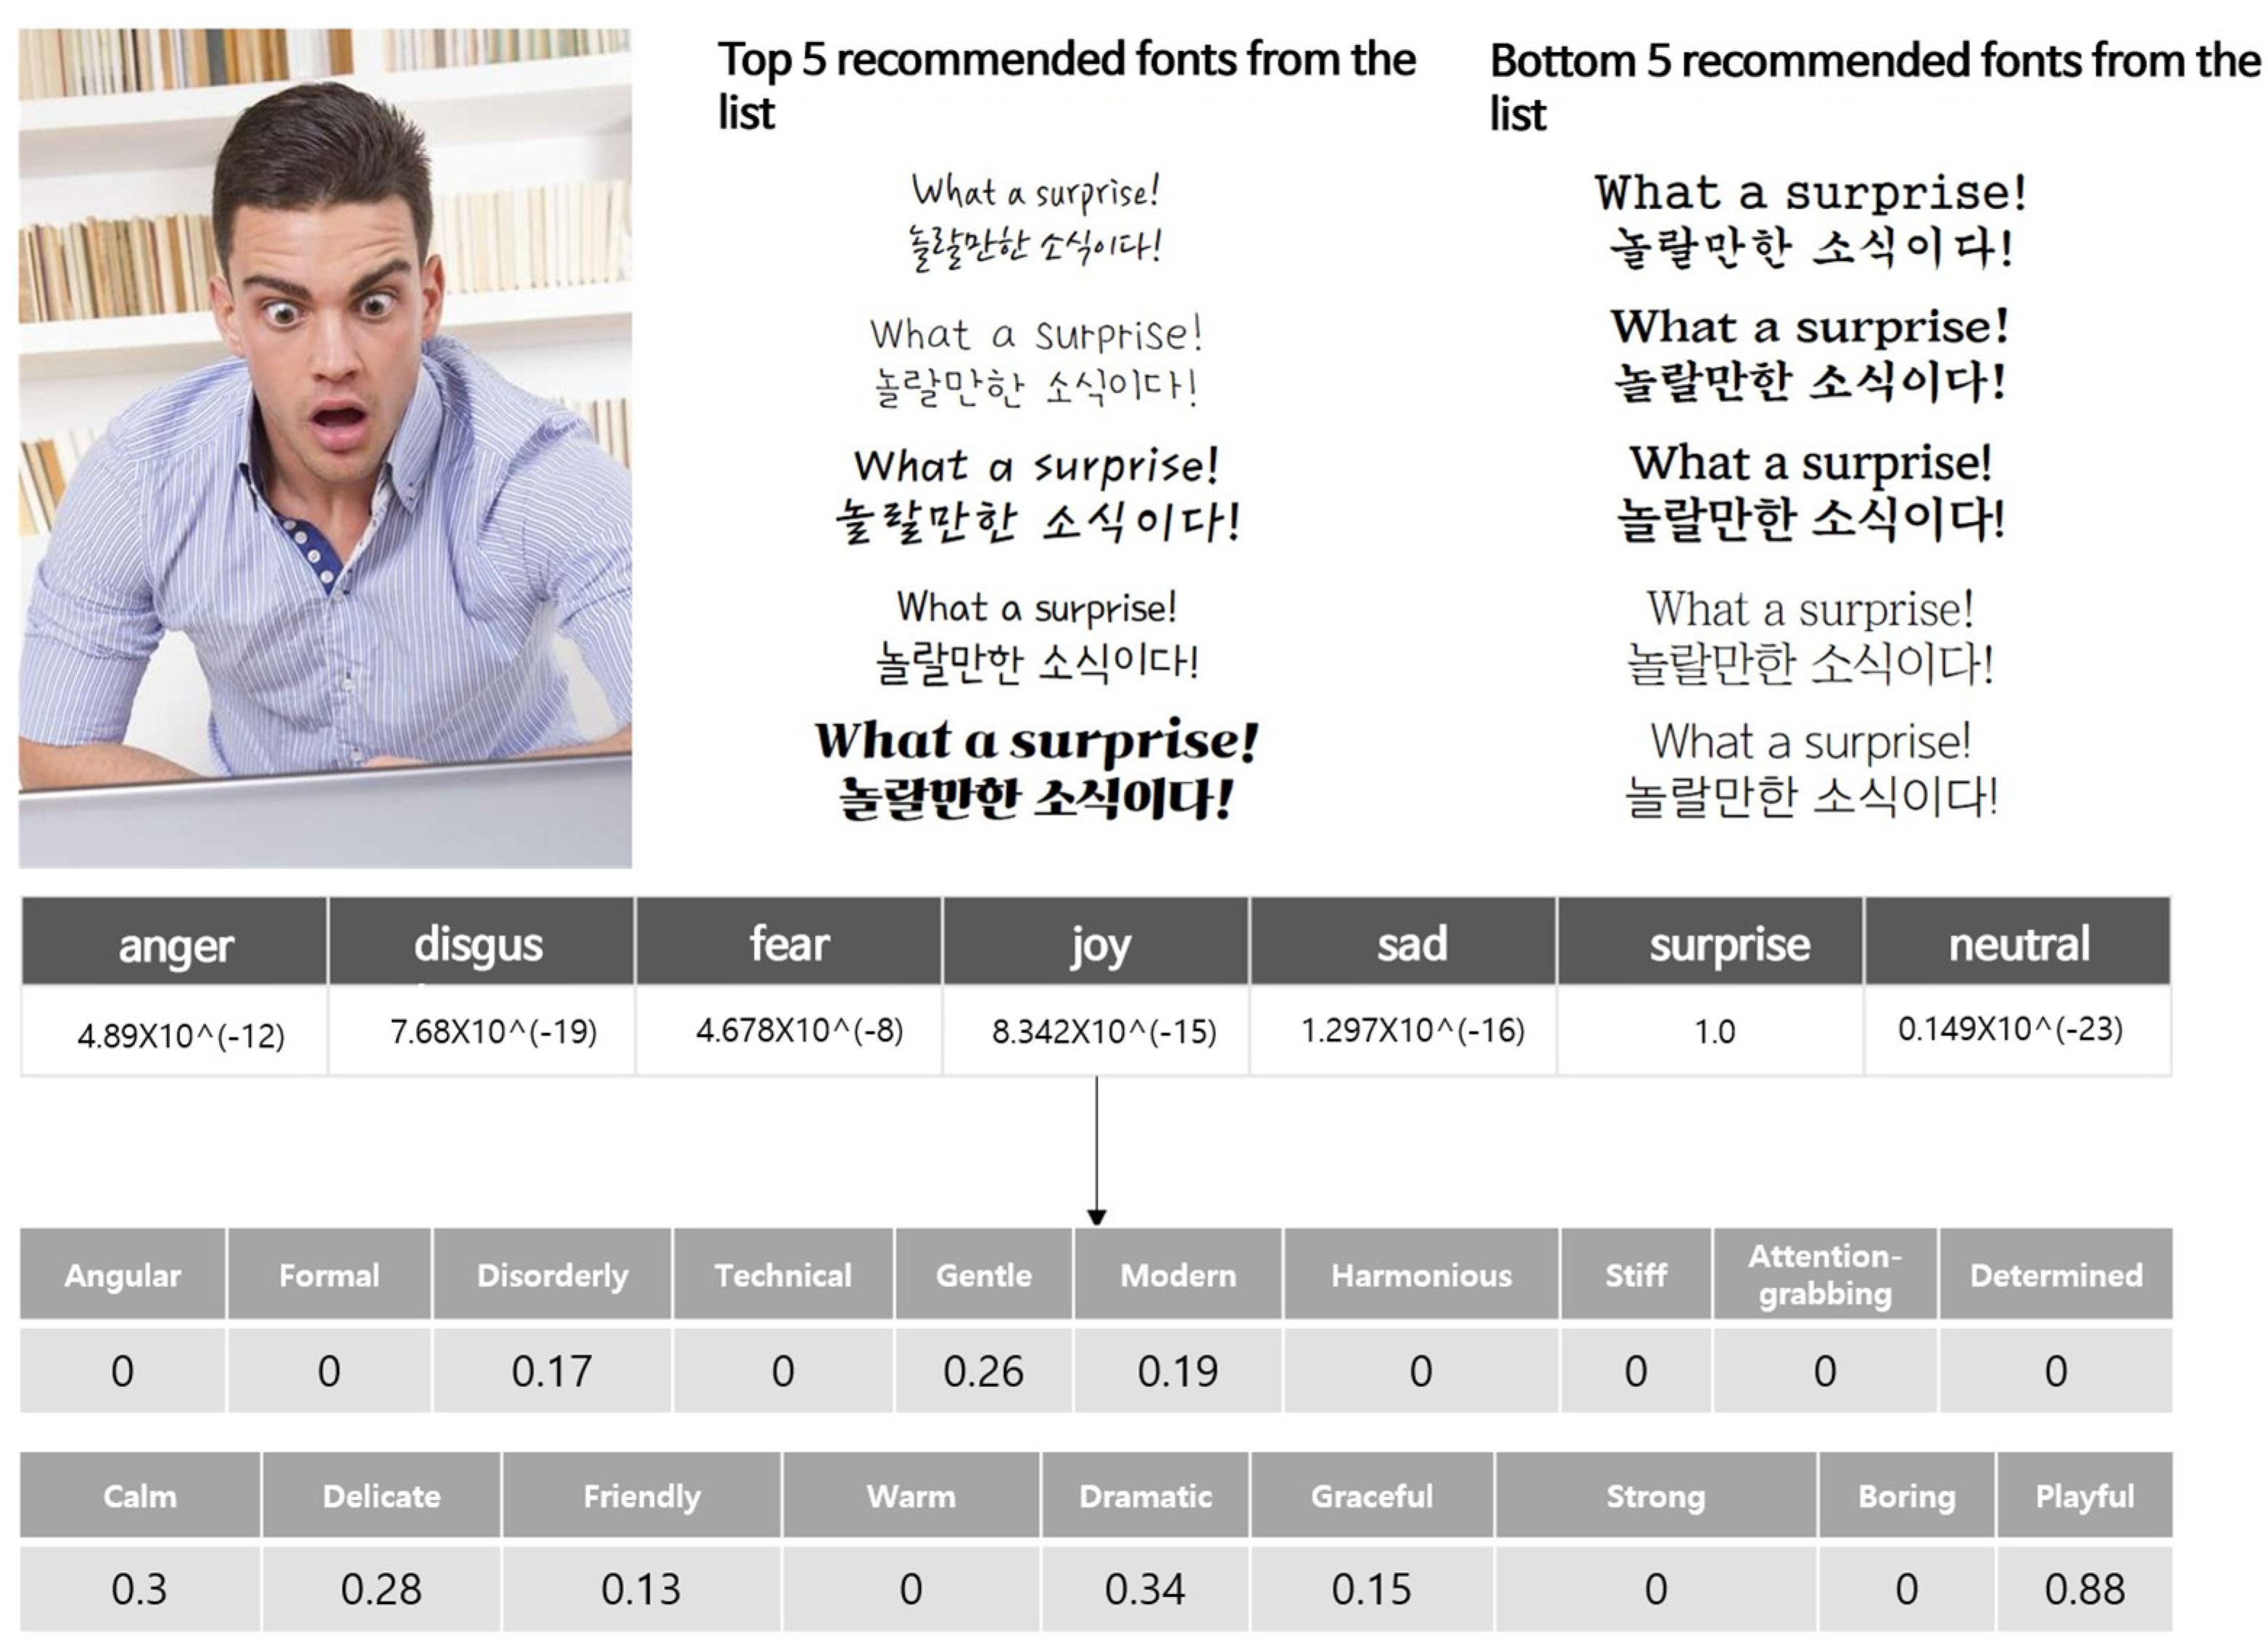
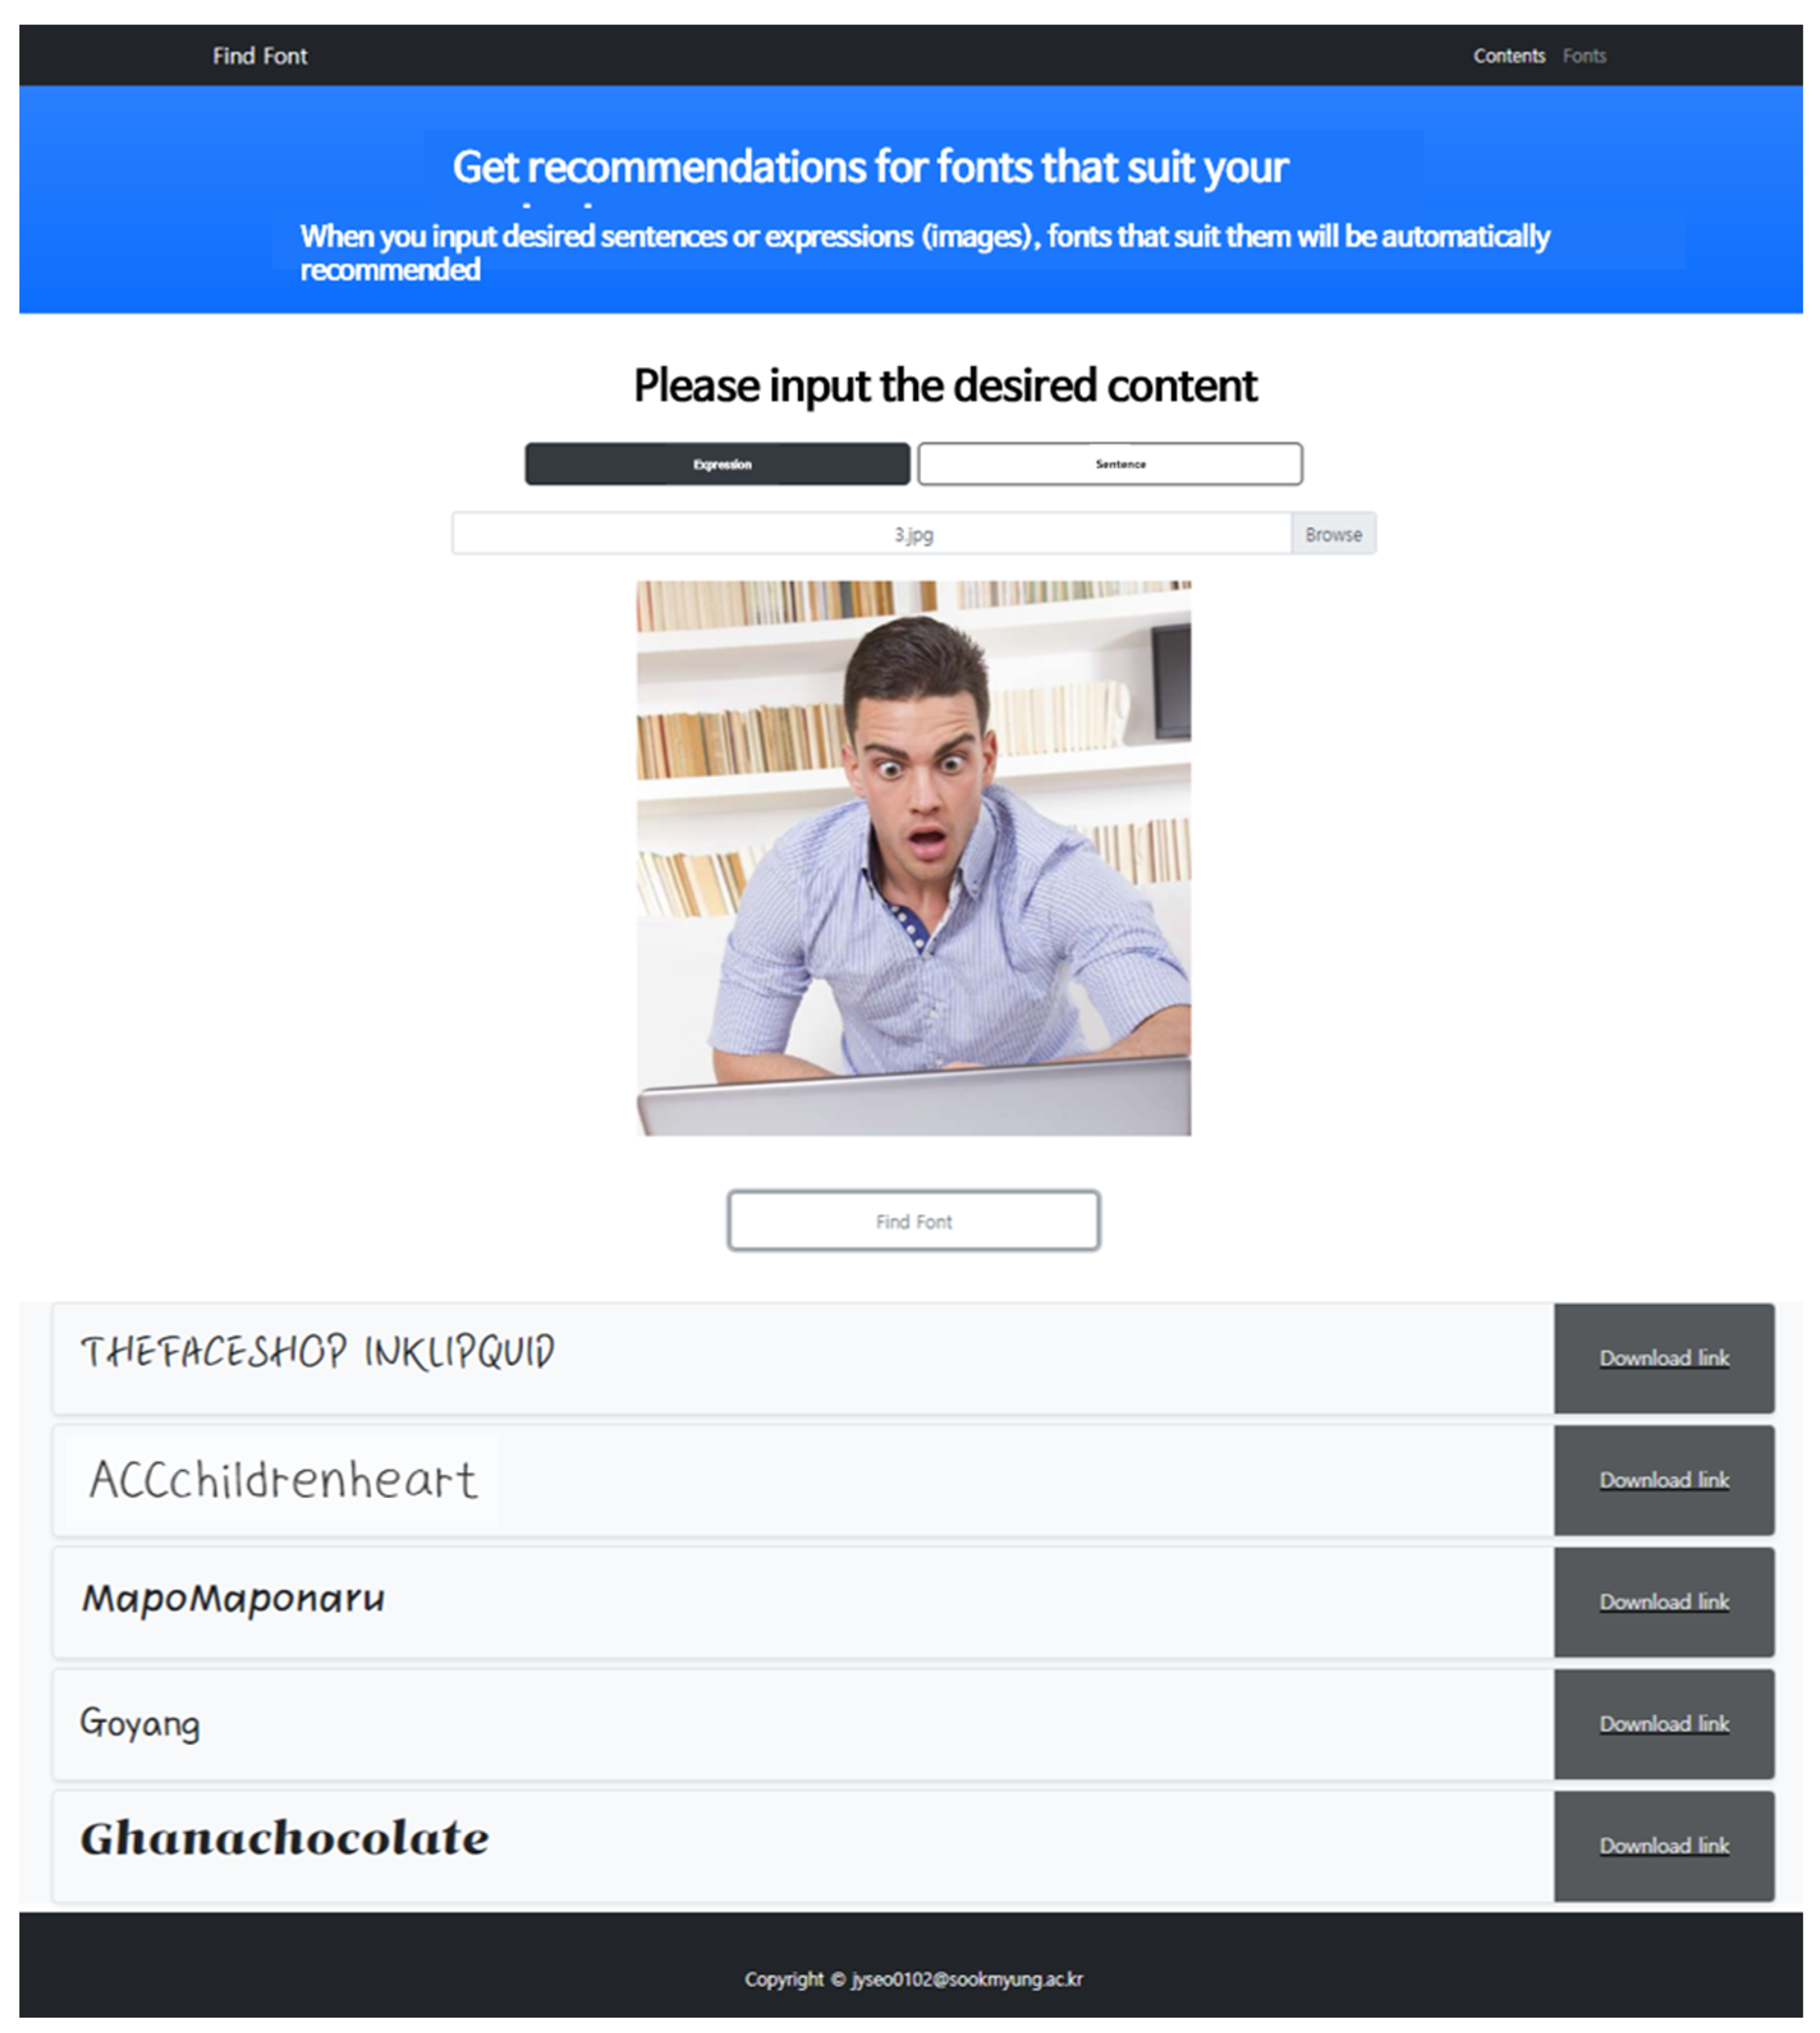
Figure 2 below displays the list of recommended fonts and emotion numerical values based on the input image. The DeepFace API yields seven emotion values as results: ‘angry’, ‘disgust’, ‘fear’, ‘happy’, ‘sad’, ‘surprise’, and ‘neutral.’ In this instance, the ‘surprise’ emotion value is 1, while the values for the other emotions tend to converge toward 0. Fonts with irregular handwritten designs, rather than those from the Ming and Gothic font families, are recommended for expressions manifesting such emotions. Basic Ming fonts are ranked the lowest in the recommendations.
The font recommendation system can also be employed for text input, and for sentence emotion analysis, the IBM Watson API [
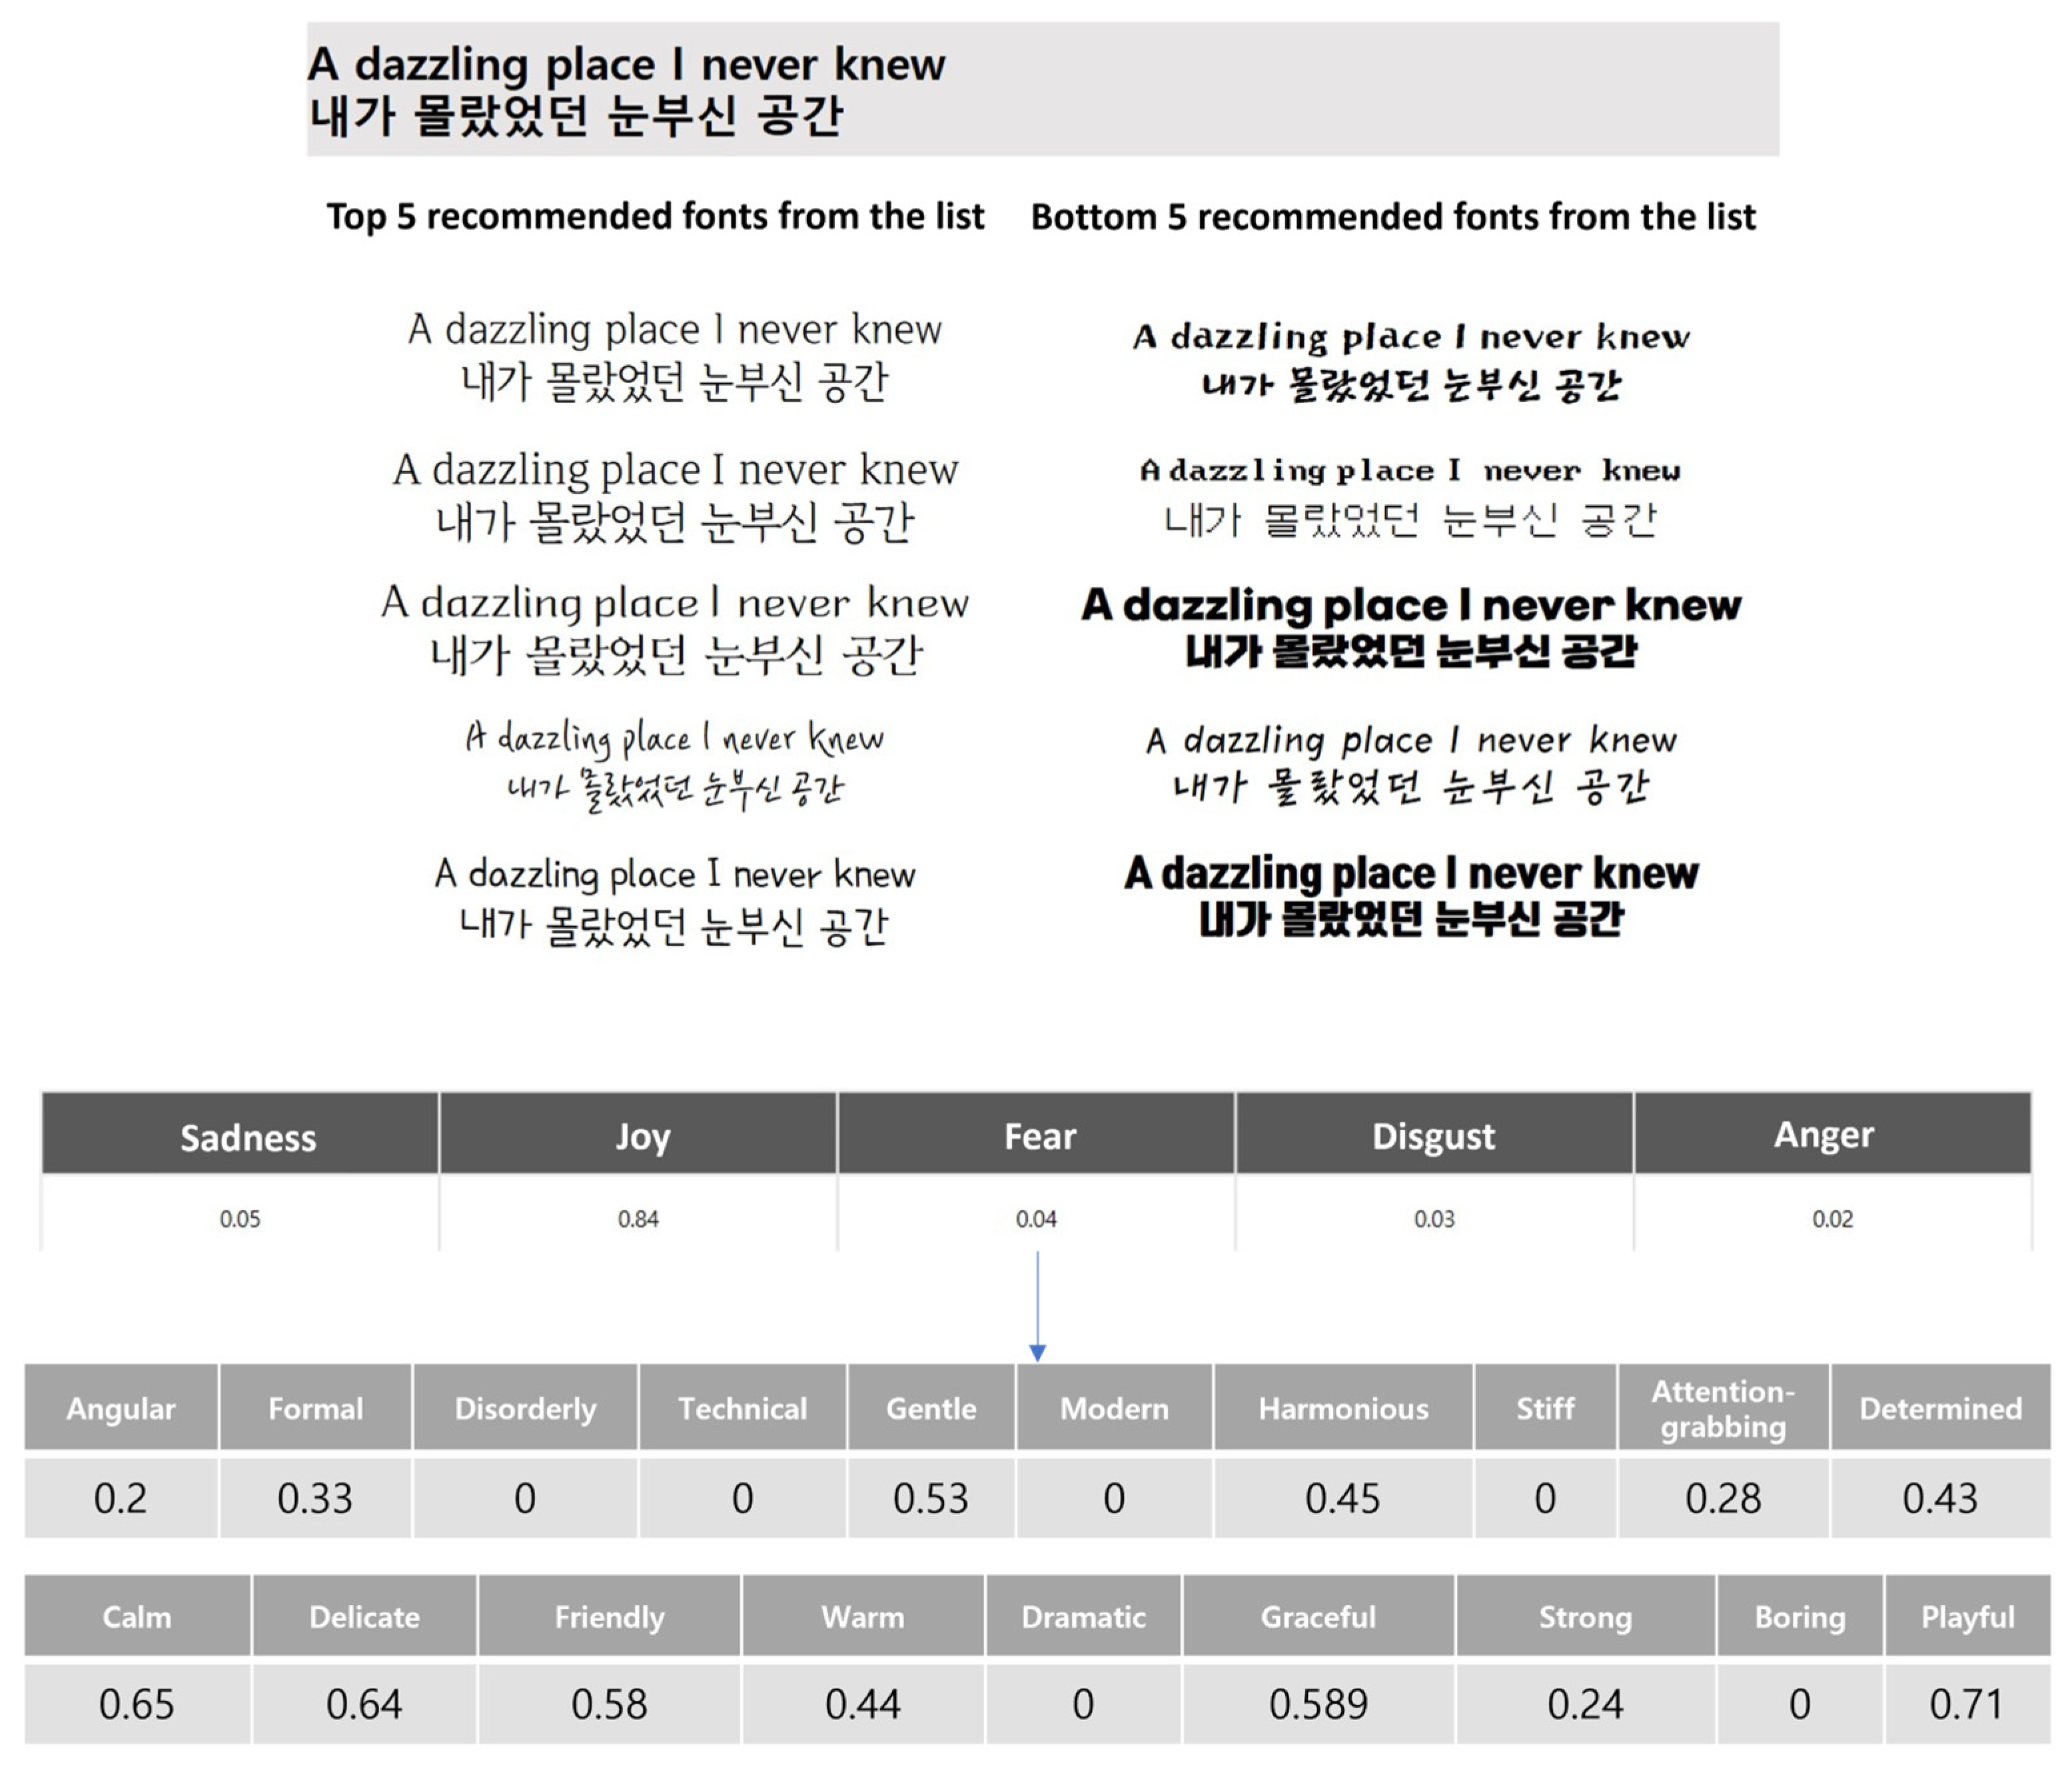
21] is utilized. This model analyzes the emotion of sentences into five categories: ‘sadness’, ‘joy’, ‘fear’, ‘disgust’, and ‘anger.’ An example of this is illustrated in
Figure 3, where the input sentence results in the emotion ‘JOY’, and it displays the associated fonts’ emotions.
5. Usability Evaluation of the Font Auto-Recommendation System
5.1. Implementation Results
Based on the research findings, an interface has been developed to make it accessible to real users. This interface is built on the Django framework and is designed to have two main sections: one for users to input content and the other for displaying the recommended fonts. In the current system, fonts are recommended based on facial expressions and sentence emotion analysis. Users can choose to input content by selecting a facial expression or a sentence from the available options.
Figure 4 represents the implementation of a font recommendation system on the web. At the top, there is an instructional message displayed, and the two buttons below allow the selection between entering an expression or a sentence. This example involves inputting an image with an expression and matching the emotions in the image with the top five recommended fonts. Clicking on the button to the right of the font enables redirection to a webpage featuring that font.
The input photos and sentences undergo emotion extraction through deep-learning emotion analysis models. Subsequently, a mapping model applying Pearson correlation coefficients transforms them into font keyword values. As a result, the transformed values are based on the same criteria as font keywords, enabling similarity evaluation. The transformed values are compared to the font keyword values using cosine similarity, and fonts with the highest similarity are displayed at the top.
5.2. Application of the Implementation Results
In this paper, beyond a simple web-based recommendation system, we developed an additional service utilizing a font recommendation model to suggest fonts based on blog posts. The blog post font recommendation system analyzes the text and images within user-created blog posts to recommend suitable fonts for the content. Sentiment analysis of blog posts is performed in two different cases. First, an analysis of whether the images posted on the blog contain facial expressions is conducted. Images that are categorized by facial expressions are utilized to extract emotion keywords using the Deepface API.
In cases where facial expressions are not present, general images undergo image analysis using the Google Cloud Vision API [
22]. This analysis recognizes objects, text, colors, object locations, and more within the images, with the results of the image analysis being derived as descriptive text.
Subsequently, the derived text undergoes sentiment analysis based on the IBM Watson Natural Language Understanding service. This service analyzes the text to identify the emotional tone of the given text, allowing the determination of the text’s positive or negative emotions. As emotional analysis for Korean text is not supported, translation to English is performed before sentiment analysis.
The results of facial expression and image analysis, as well as text sentiment analysis, are integrated to determine the overall sentiment of the blog posts. Through such analysis, a more accurate understanding of the emotional aspects of the content within the posts is achieved, providing richer emotional information through the combination of images and text.
An example of font recommendation results is as follows:
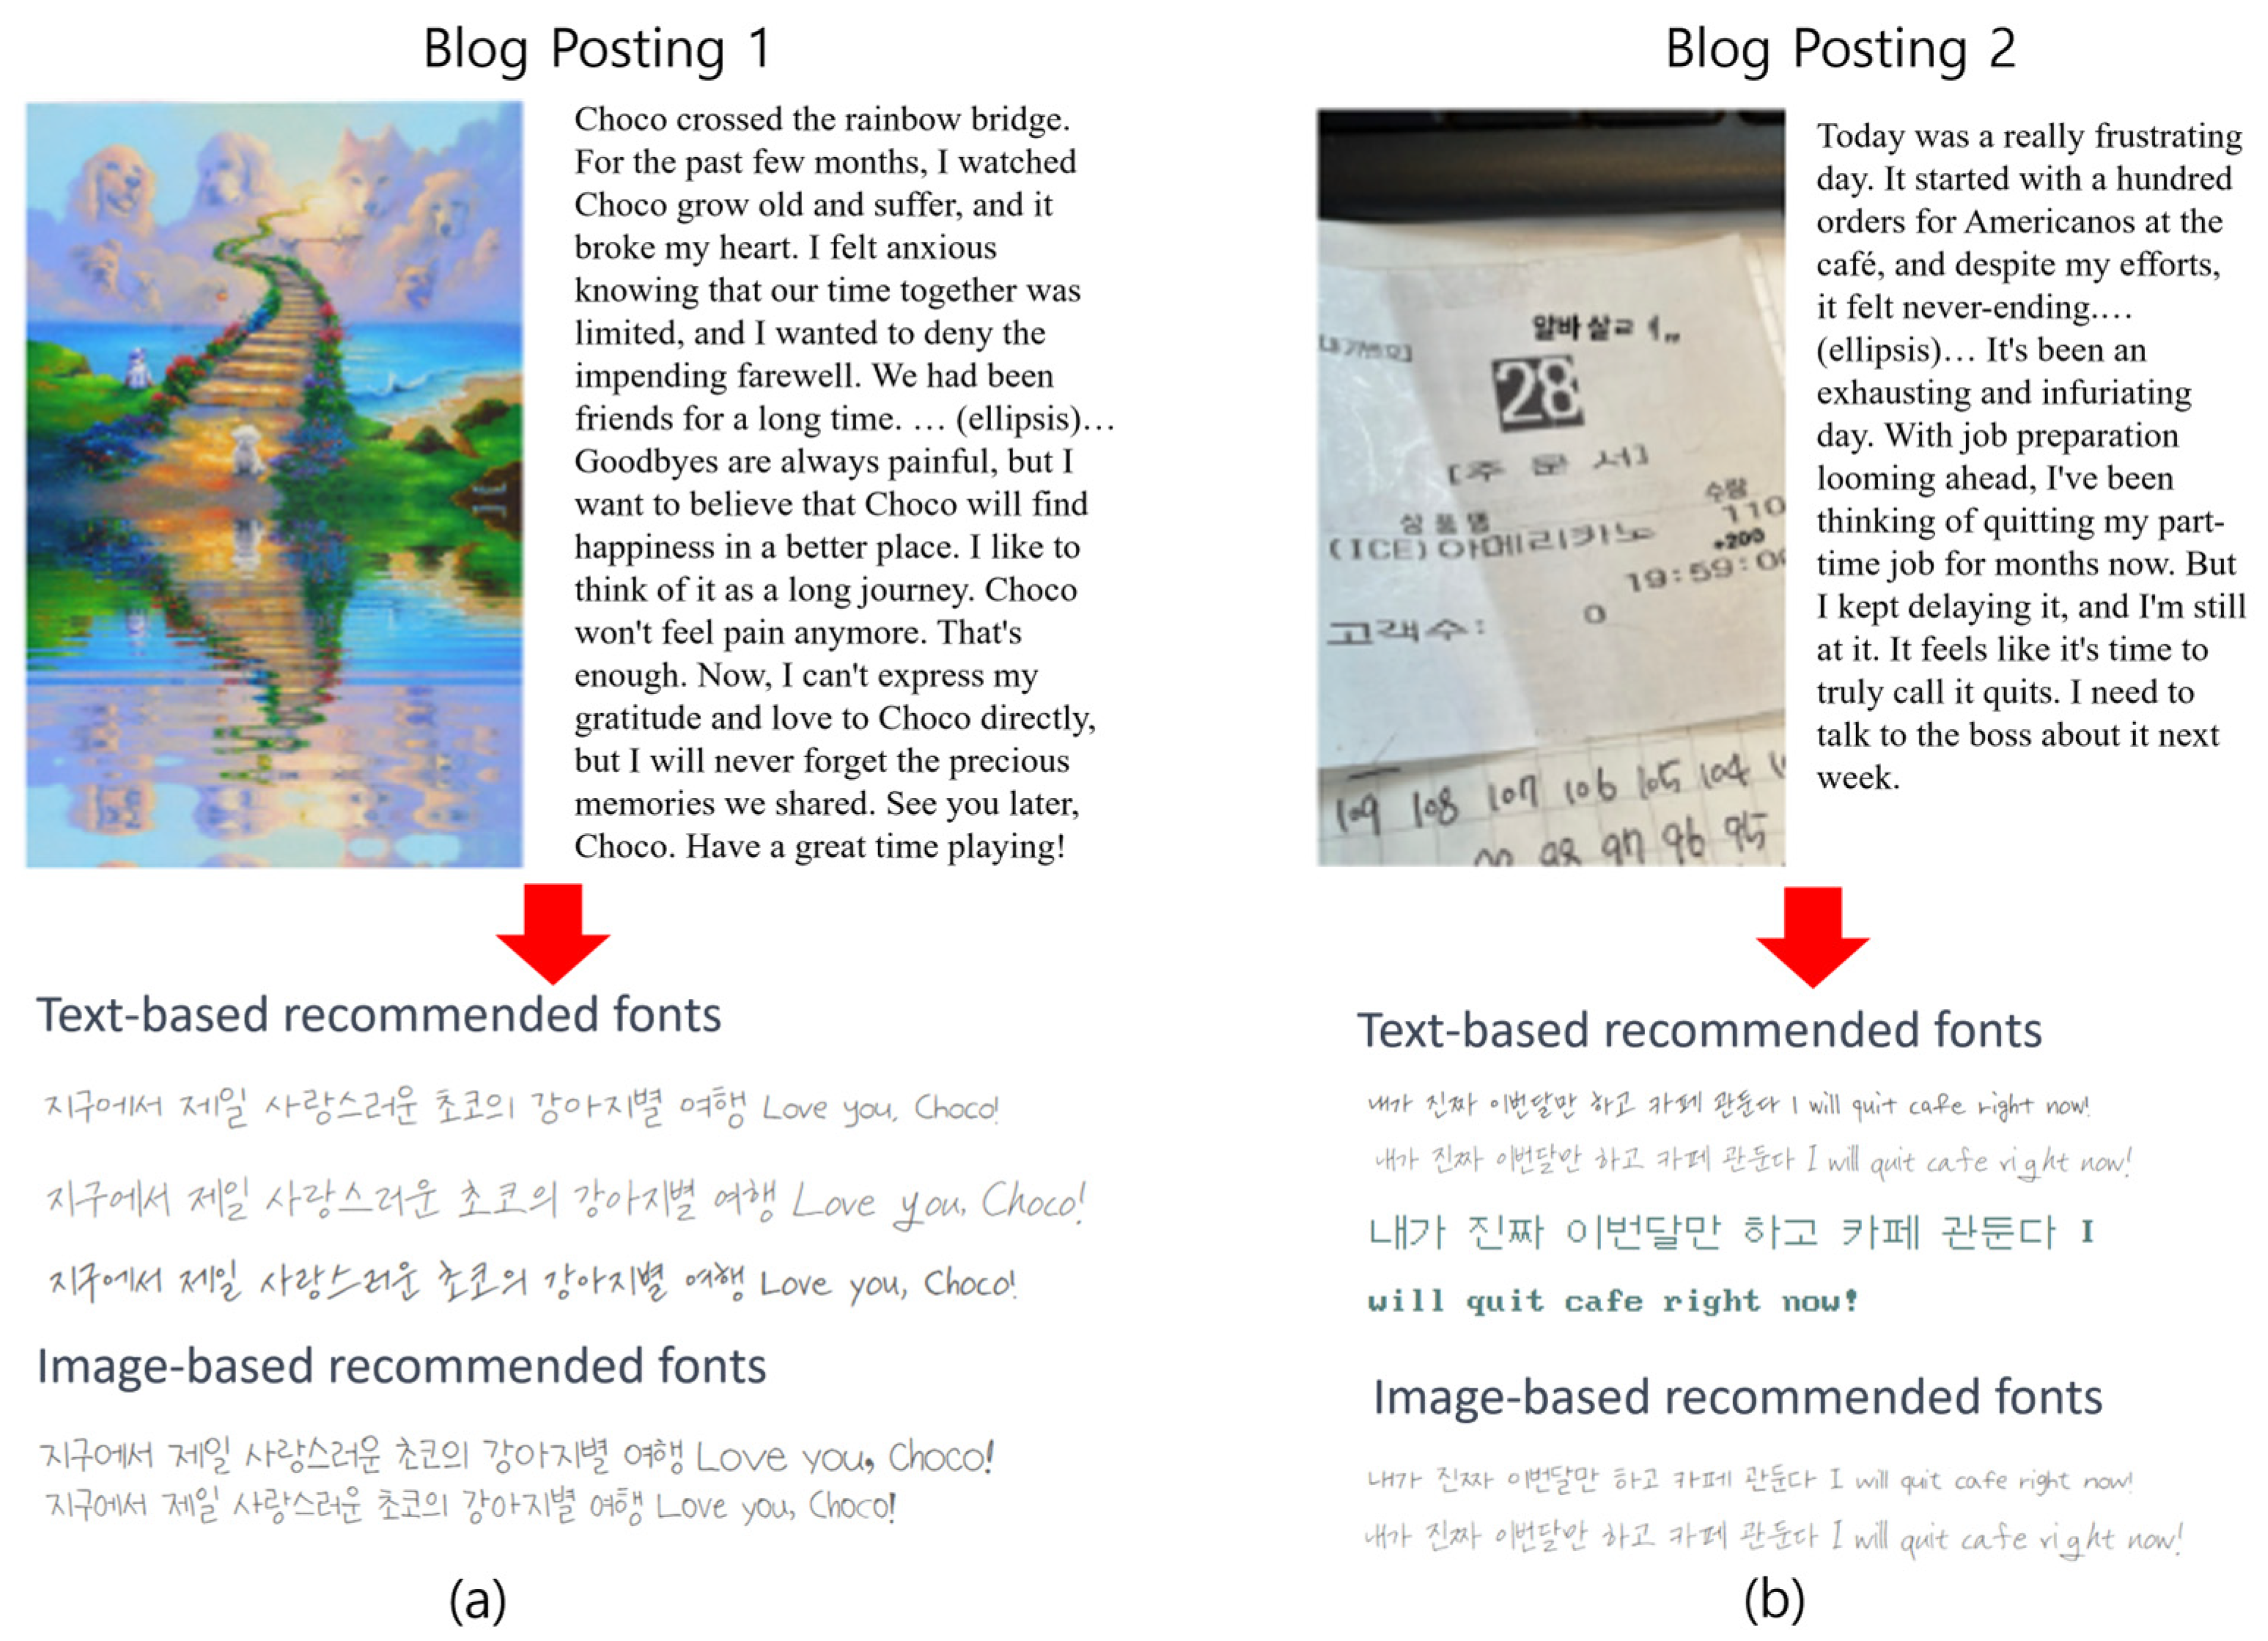
Figure 5 displays a blog post containing both text and images. In this example blog post, there are no images depicting human emotions. In such cases, we generate descriptions for the pictures and analyze the emotions within these descriptions to recommend fonts. Additionally, as blog posts primarily consist of textual content, we analyze the content of the main body to suggest fonts.
As a result, the system provides font recommendations aligned with the emotional analysis of both images and text, empowering users to make their preferred selections. In
Figure 5a, fonts corresponding to the emotion “sadness” were recommended based on the analysis. Similarly,
Figure 5b demonstrates the outcomes of blog post analysis conducted in a parallel fashion, resulting in font suggestions. Here, fonts associated with the emotion ‘anger’ were recommended, drawing from a comprehensive analysis of both image and text content.
5.3. Usability Evaluation
To evaluate the usability of the content emotion-based font recommendation system, three usability metrics were employed: the appropriateness of the recommended fonts concerning how well they matched the content, satisfaction with the recommendations provided by the system, and the efficiency of the content-based font recommendation system. The evaluation categorized the recommended fonts into four groups based on their ranking. Group 1 included fonts ranked from 1st to 6th; Group 2 included fonts ranked from 7th to 12th; Group 3 included fonts ranked from 13th to 19th; and Group 4 included fonts ranked from 20th to 26th.
Participants were presented with various facial expressions and text content to determine the appropriateness of the system’s results. They were asked to select the most appropriate and least appropriate recommendation groups for each piece of content, providing an evaluation of the appropriateness of the system’s results. Additionally, participants were asked to rate their satisfaction with the results for each recommendation group on a 7-point Likert scale. The Likert scale is commonly employed in usability evaluations for its simplicity, clarity, and effectiveness in quantifying and comparing user experiences across various aspects such as interface design, product features, or service quality. Its concise numeric measurements provide an integrated assessment, facilitating statistical analysis and trend observation. The scale’s universality and ease of understanding make it applicable to diverse user groups, enhancing user feedback accessibility. Moreover, Likert scale scores exhibit consistency, allowing for reliable usability tracking and comparisons over time or among different user cohorts. Overall, the Likert scale serves as a versatile and objective tool in usability evaluations, promoting efficiency in data collection and analysis.
Furthermore, users were invited to directly experience the font recommendation system and compare it with the existing font recommendation system developed in previous research [
13] to assess the efficiency of the system when receiving font recommendations. The evaluation was also conducted using a 7-point Likert scale.
Table 4 provides details about the evaluation criteria and measurement methods.
The reason for utilizing the three metrics—Appropriateness; Satisfaction; and Efficiency—in the usability evaluation is as follows: First, each metric comprehensively assesses different aspects of the system. “Appropriateness” gauges the degree to which the system aligns with its purpose; “Satisfaction” measures the user’s contentment; and “Efficiency” evaluates how efficiently tasks are performed. These metrics align with the core principles of user-centered design. “Appropriateness” ensures that the system meets user requirements and accomplishes user-centered goals. “Satisfaction” indicates how positively users experience the system, and “Efficiency” emphasizes reducing user effort and promoting efficient task performance, aligning with user-centered system design principles. These metrics are widely used in usability evaluations, addressing key aspects of the user experience. Appropriateness, Satisfaction, and Efficiency collectively reflect user needs, impacting the success of the system and user satisfaction. Moreover, these evaluation metrics are applicable to various types of systems and user groups and are widely recognized and utilized in usability evaluations [
23,
24,
25,
26,
27,
28].
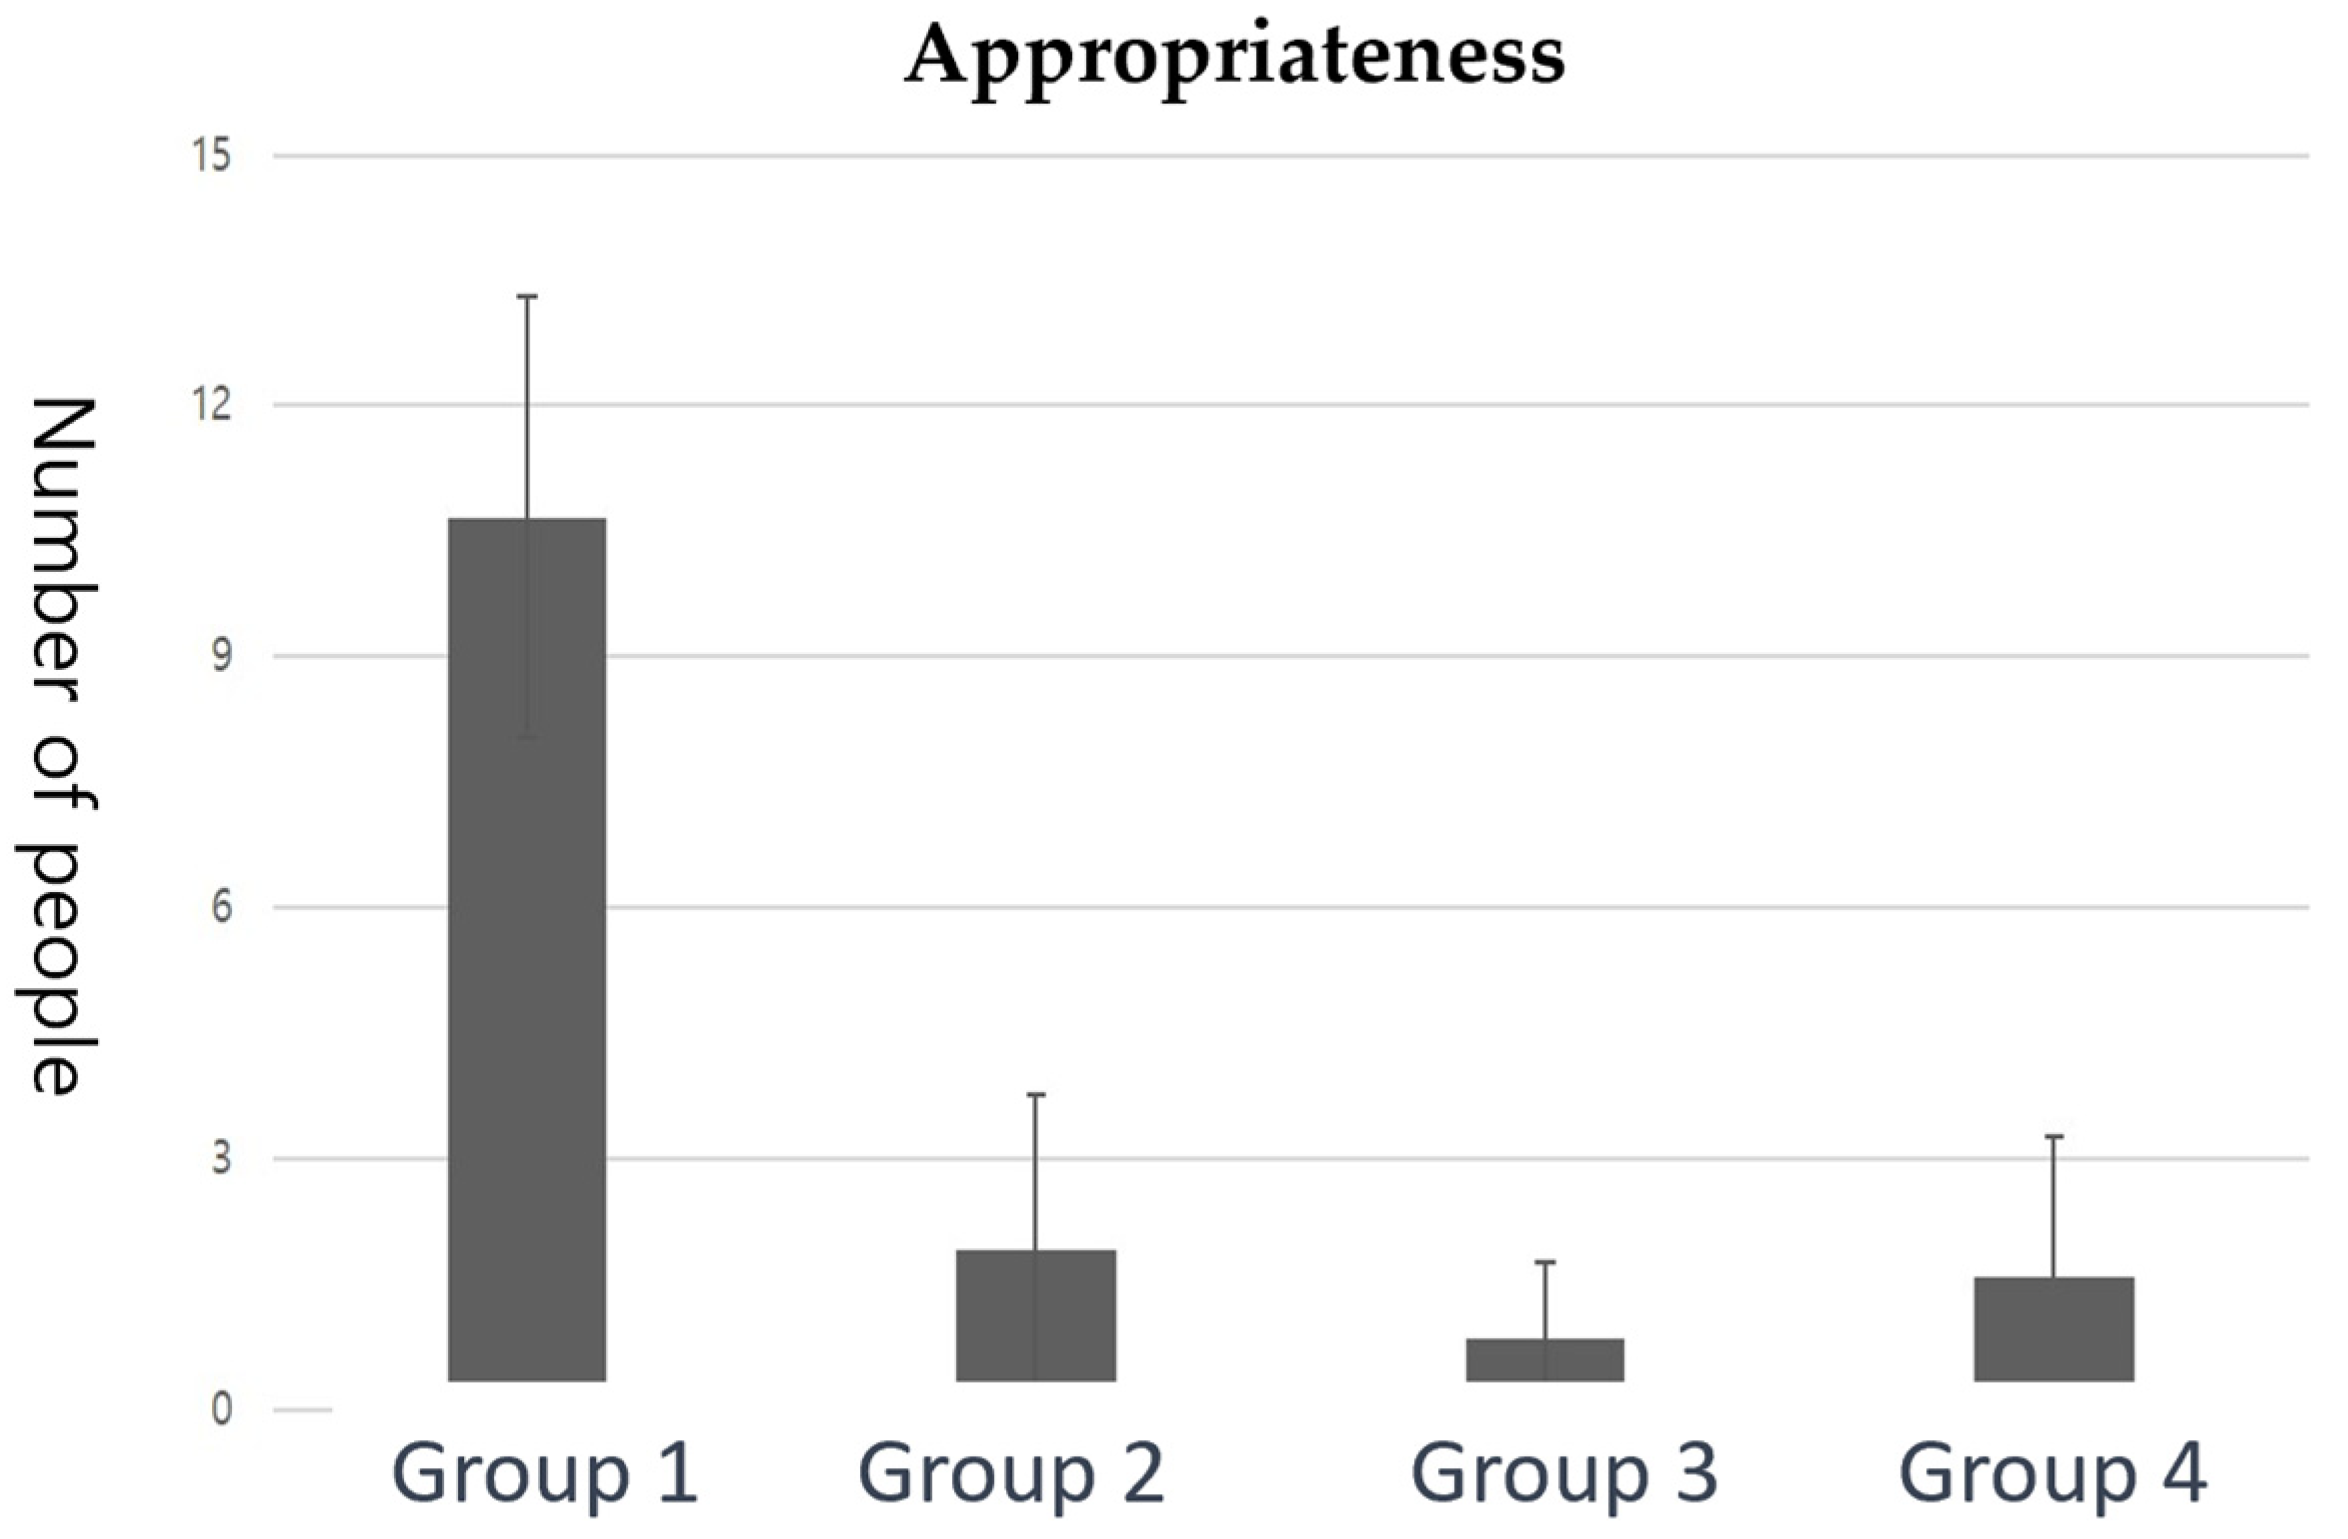
A total of 15 participants took part in the evaluation. In the evaluation, the provided font groups were referred to as Group 1, which includes the top 6 recommended fonts; Group 2, which includes fonts ranked 7th to 12th; Group 3, which includes fonts ranked 13th to 19th; and Group 4, which includes fonts ranked 20th to 26th. Based on the assessment of 12 different contents presented to users, Group 1, which contains the fonts recommended as the top-ranked ones, was consistently rated as the most suitable font group for each content. On average, 10.67 participants rated Group 1 as the most appropriate. In contrast, Group 4, which contains fonts with the lowest rankings, received an average rating of 1.68, with participants finding it suitable. Group 3 received the lowest average rating, with 0.94 participants finding it appropriate. However, statistically, there was no significant difference in ratings between Groups 2, 3, and 4. The graph depicting the appropriateness of the evaluation results is shown in
Figure 6.
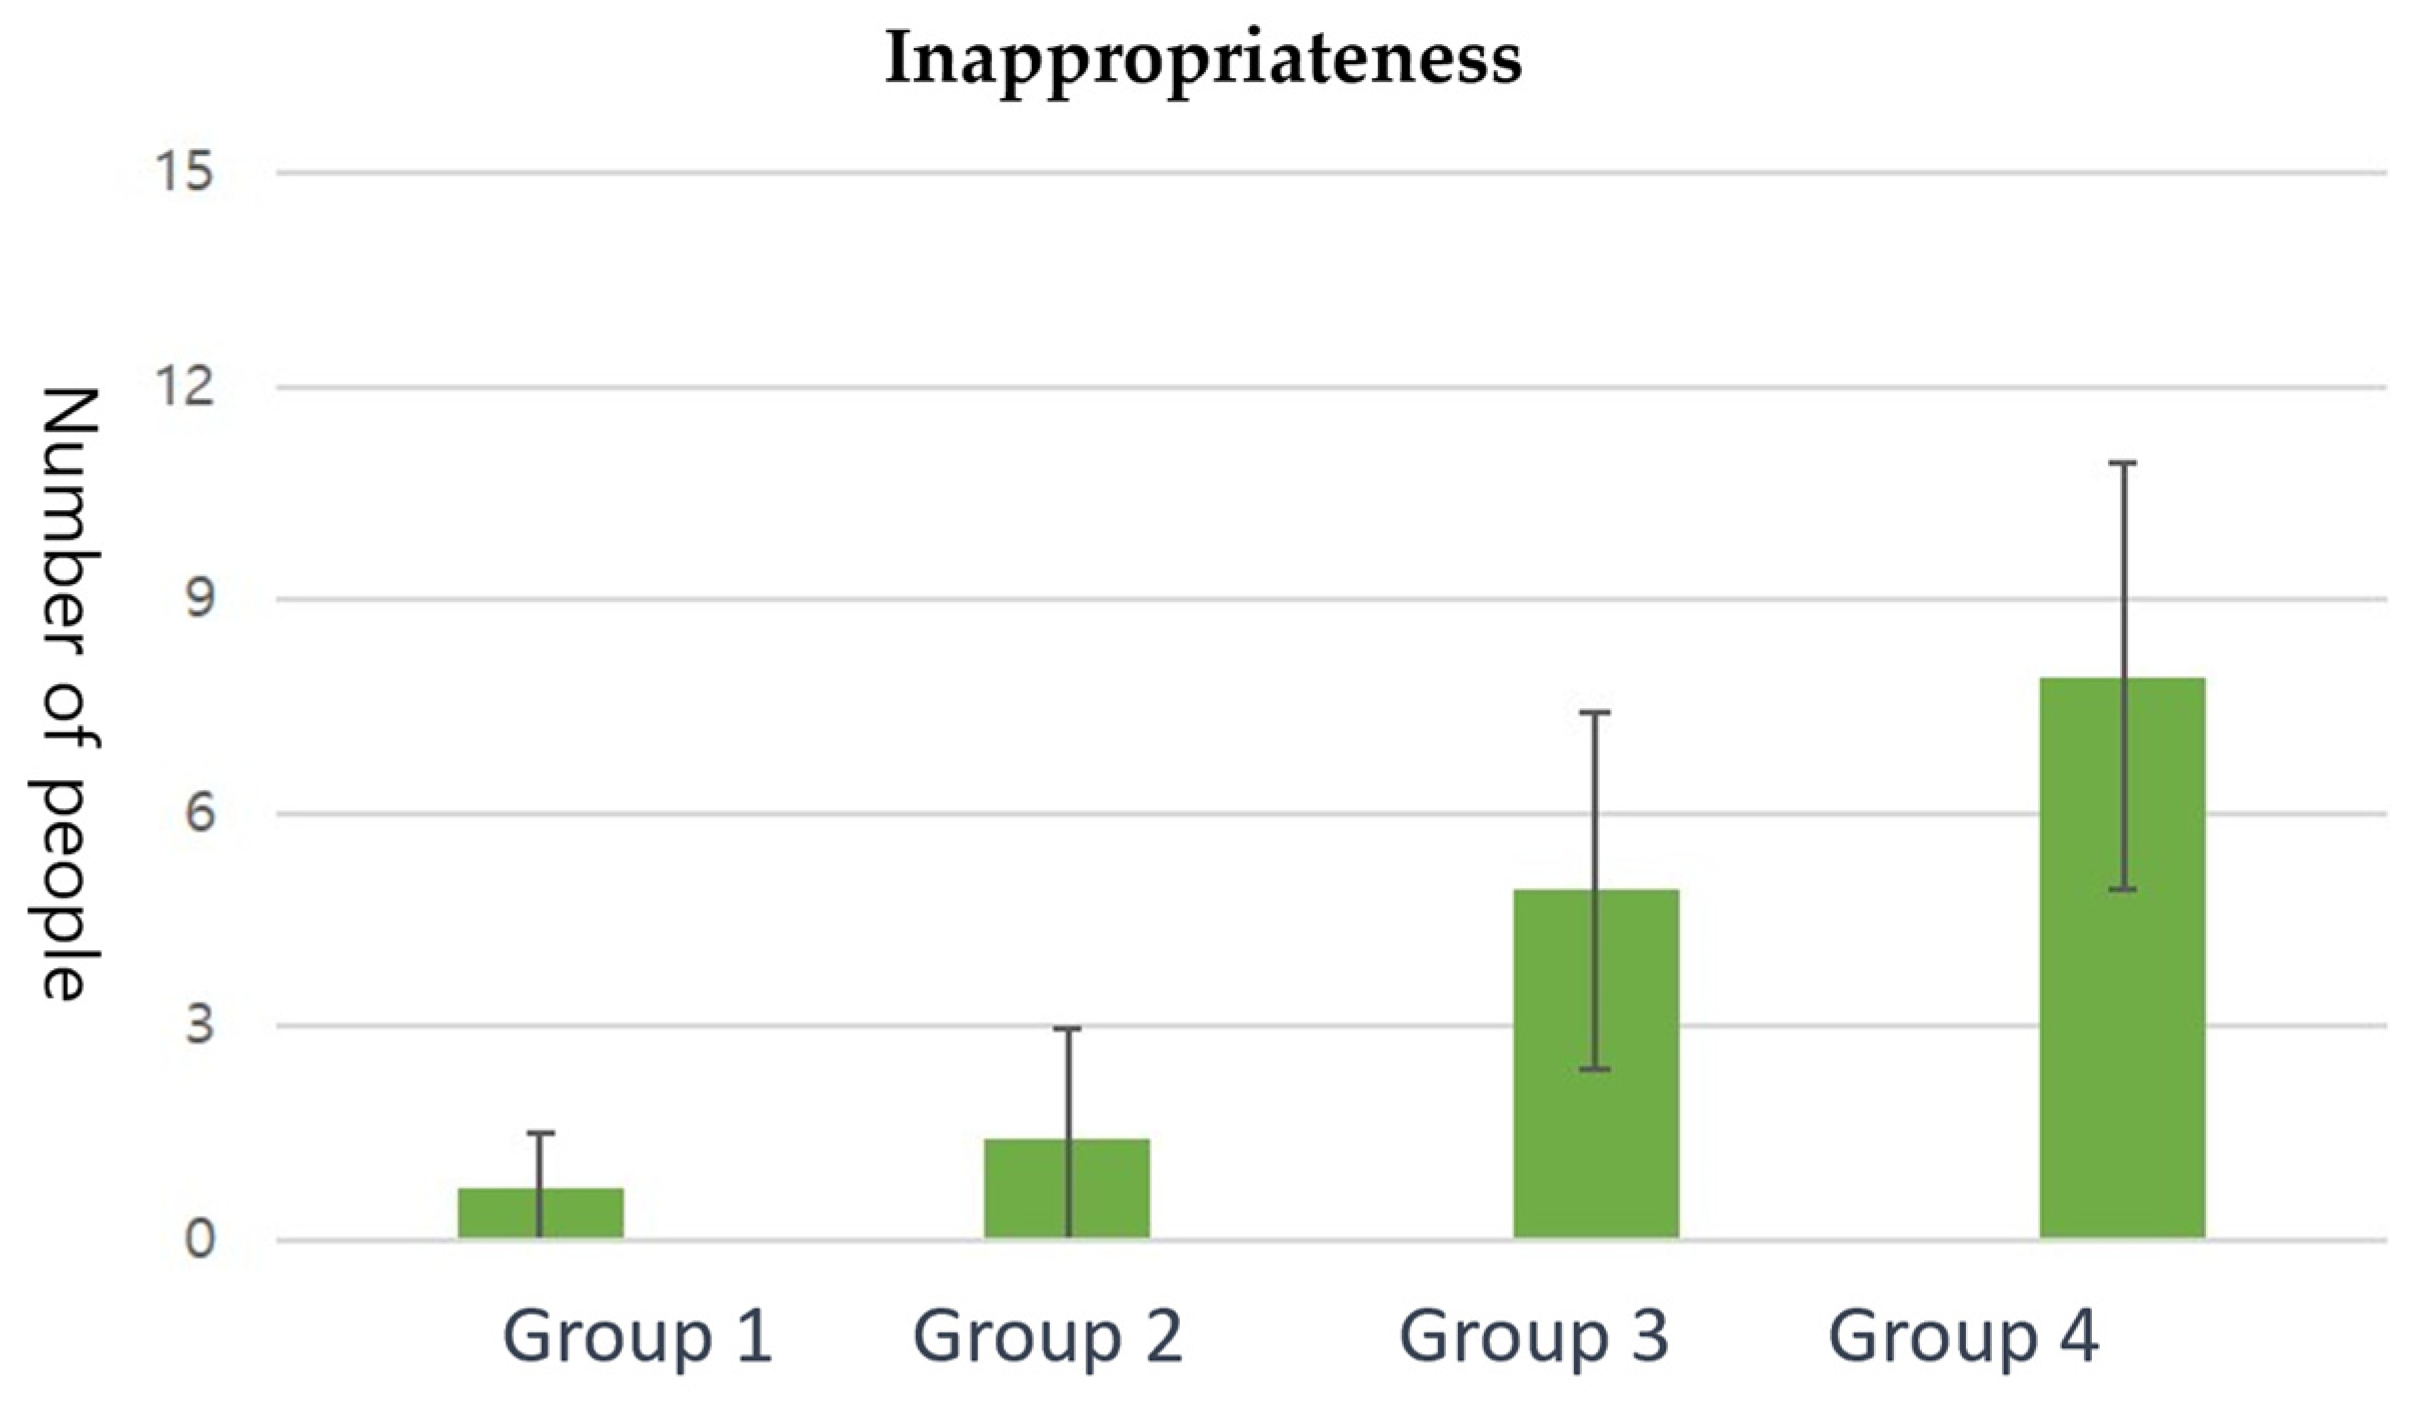
Conversely, in the evaluation where participants were asked to select the least appropriate font group, Group 4 received the highest number of selections, with approximately 7.9 participants choosing it, while Group 1 was chosen by the fewest participants, with only 0.75 individuals selecting it. However, for Groups 2, 3, and 4, there was no statistically significant difference in the choices made by participants. This can be seen in the following
Figure 7.
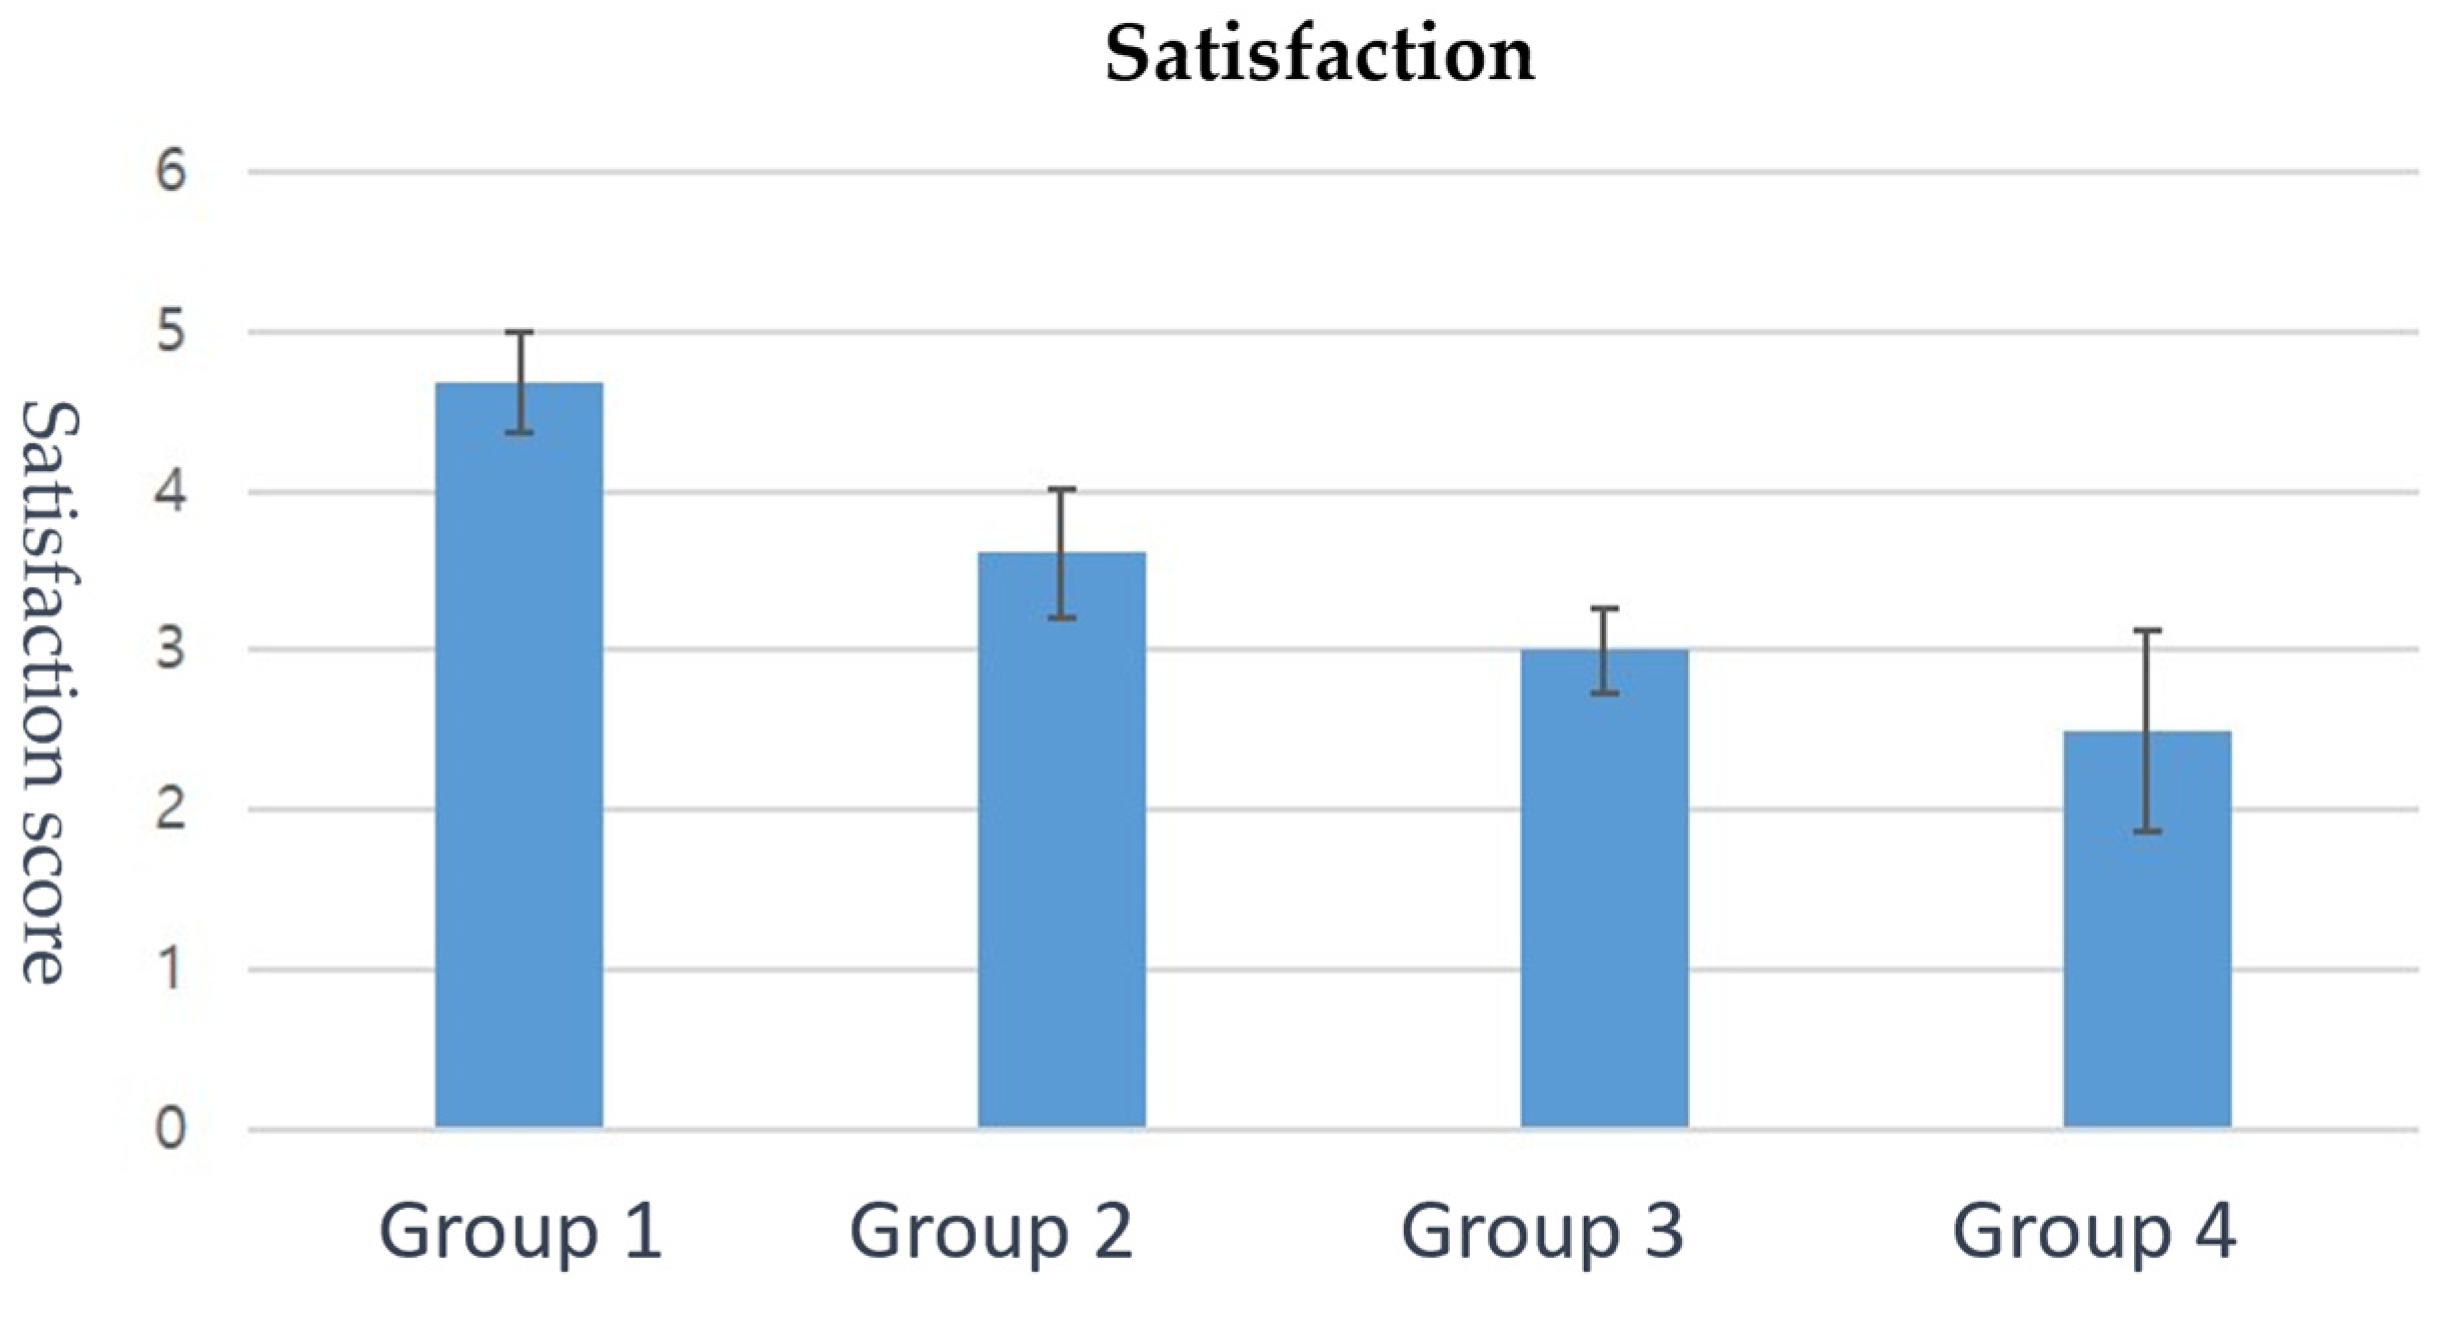
When each font group was individually presented to users and font recommendation satisfaction was evaluated on a scale from 0 to 6 using the Likert score, Group 1 received the highest satisfaction with a score of 4.68. It was observed that as we move from Group 1 to Group 4, the average satisfaction gradually decreases. The group-specific results for satisfaction scores are illustrated in
Figure 8.
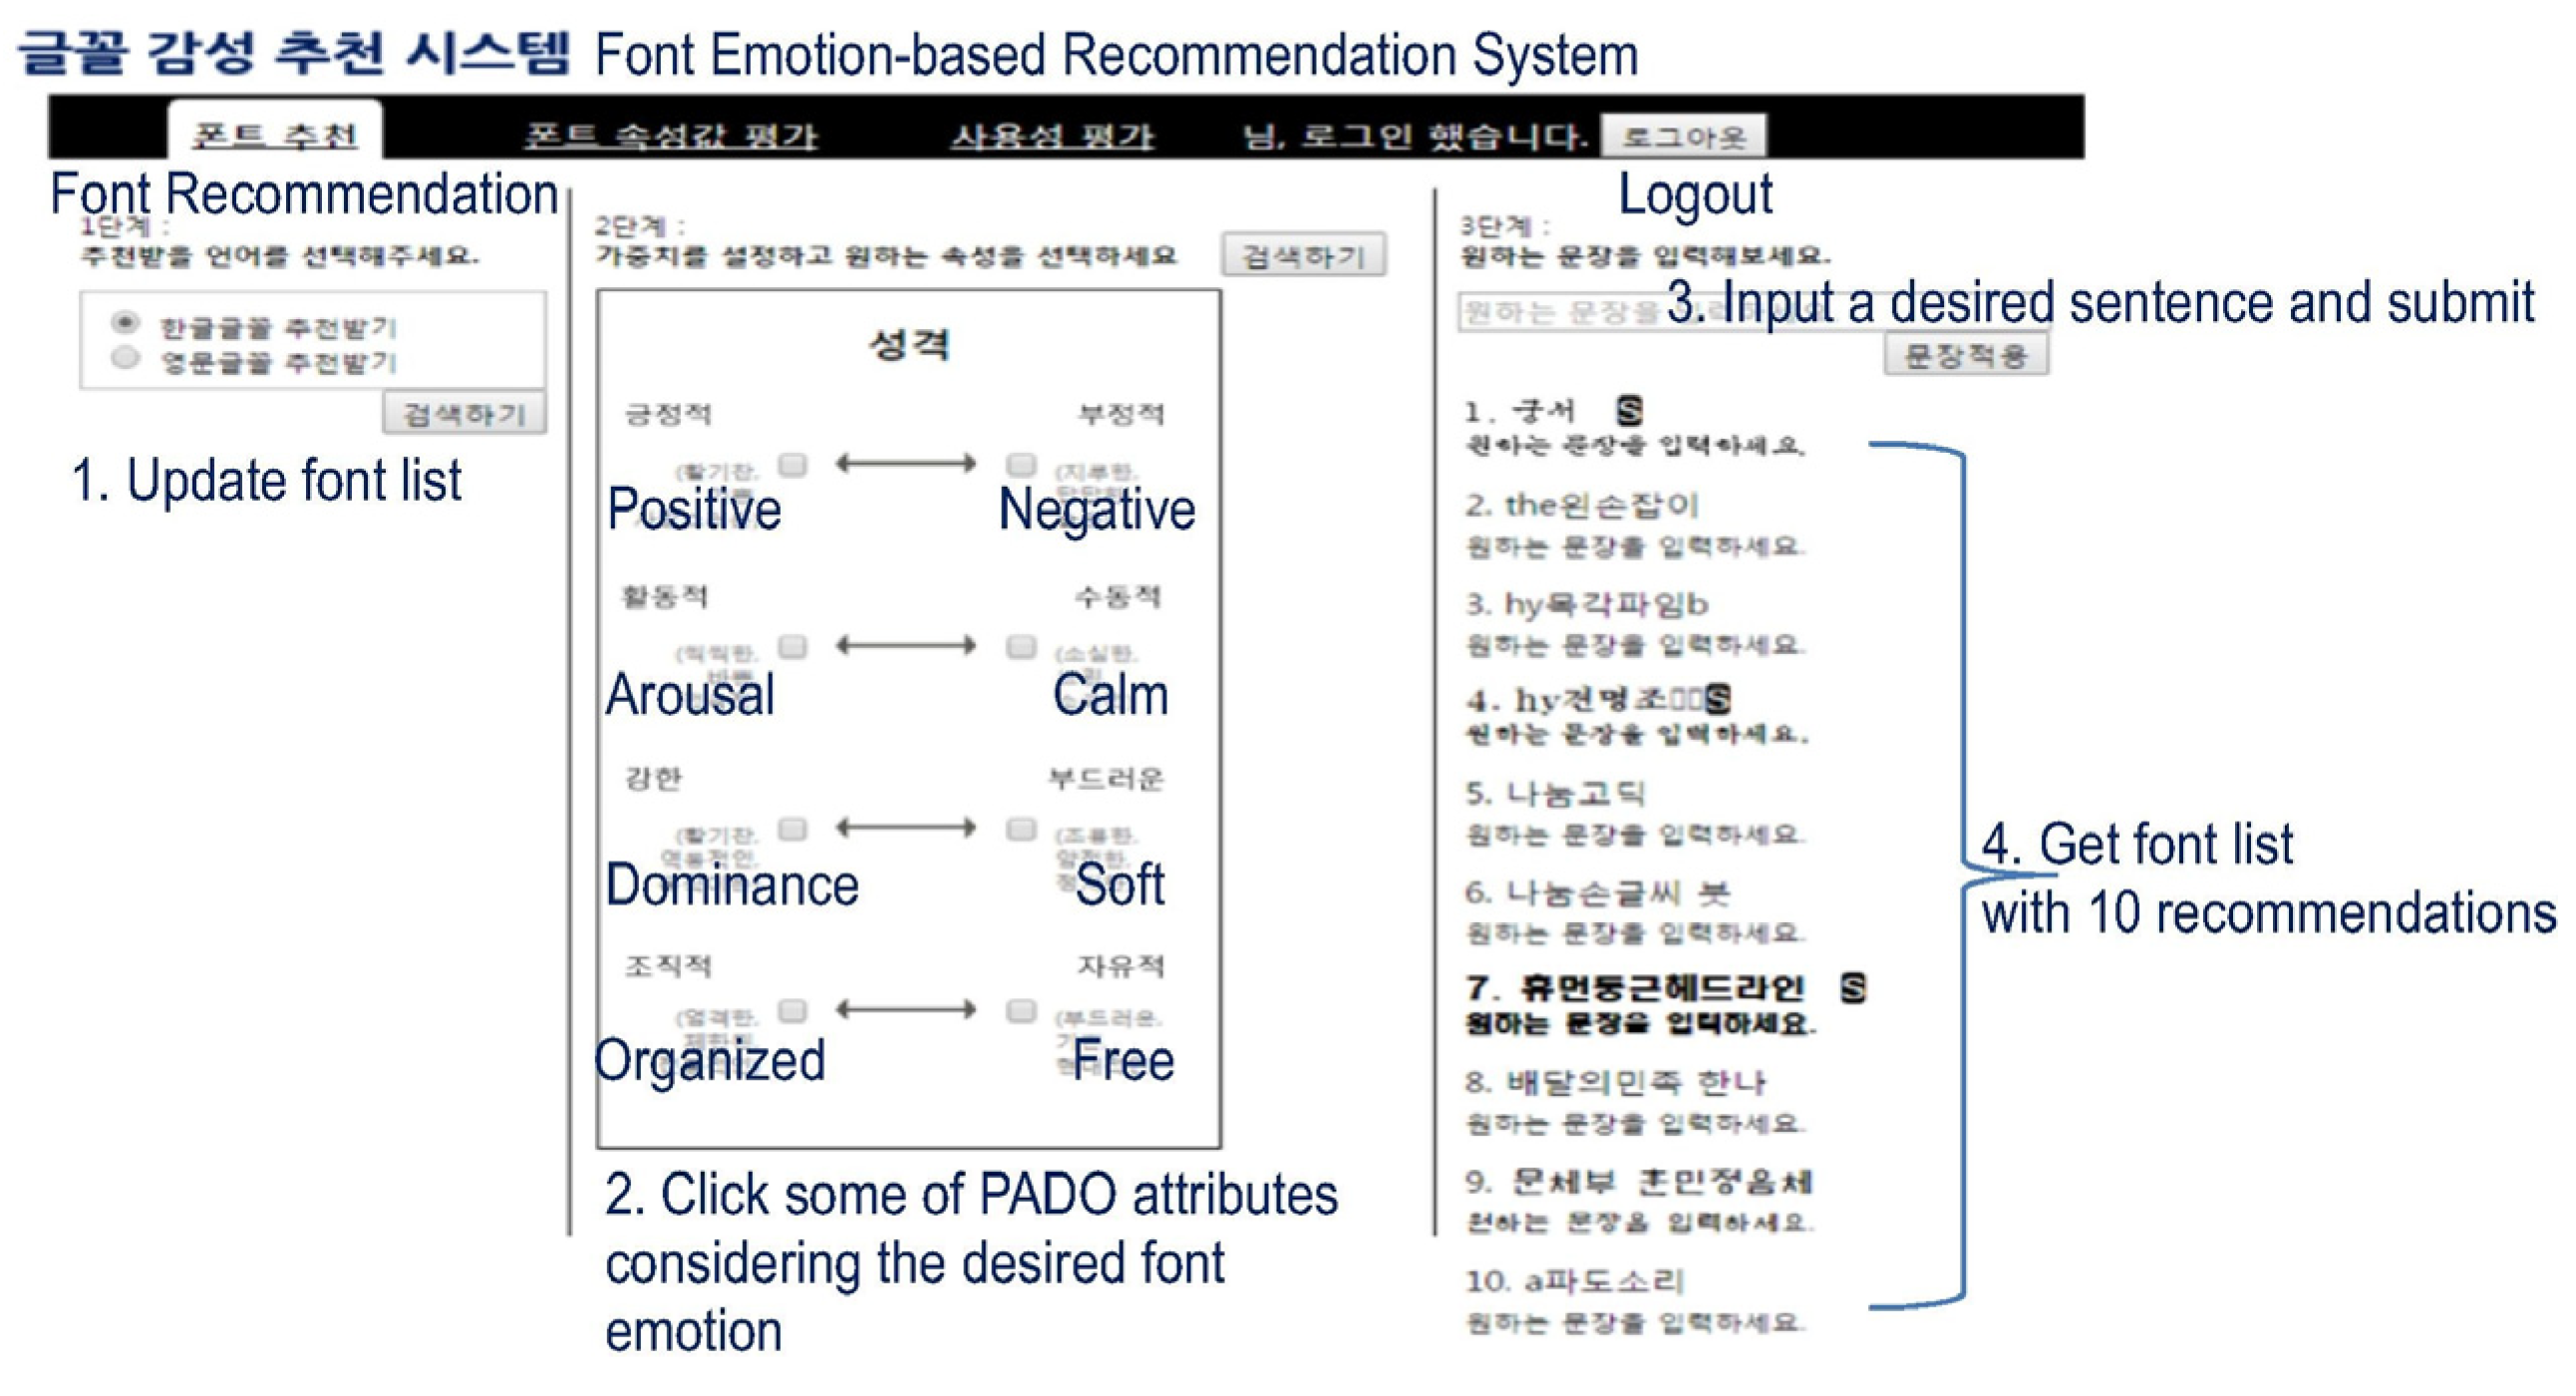
Finally, we aimed to assess the efficiency of our system through a comparison with the existing font search system, as illustrated in
Figure 9 [
13]. As a result, users highly evaluated the system that automatically recommends fonts based on content input, with an average efficiency score of 5.27. This score was measured after comparing it with the sentiment-based font recommendation system developed in previous research. The methodology involved initially having 15 participants use the existing system, followed by using our system. Participants were asked to rate the efficiency of the new sentiment-based font recommendation system compared to the existing one. They were prompted with the question, “Please select a score from 1 (very inefficient) to 7 (very efficient) indicating the efficiency of the new sentiment-based font recommendation system compared to the existing one.” All 15 participants gave a score of 4 or higher. Therefore, the recommendation results of this system were considered both valid and efficient compared to the existing system.
6. Conclusions
In conclusion, this research aimed to implement a system that recommends fonts based on the emotions of the content. To achieve this, the emotions associated with fonts were analyzed using keywords. We selected 19 keywords that are applicable to Korean fonts and easily understandable by users, based on keywords used in previous studies on English fonts. We conducted experiments to examine the relationship between keywords and fonts, selecting 26 fonts representative of various font classifications.
To recommend fonts based on content emotions, we designed new calculation models to allow for a consistent comparison between content emotions and font emotions. While we initially attempted to apply the PAD emotional model, convergence issues arose during the process of converting keyword attributes to PAD values. As a result, we designed two new calculation models: one with a new formula for PAD value conversion and another that utilized an analysis of the correlation between emotional classification criteria. The evaluation results favored the model that applied the correlation-based approach. Therefore, we decided to use this mapping method for font recommendations.
We implemented the recommendation interface using this model and conducted usability evaluations. The findings confirmed the appropriateness of the fonts recommended by the system and the efficiency of our implementation compared to the existing system.
In summary, this research successfully analyzed font emotions through keyword analysis and recommended fonts suitable for content with varying classification criteria. Furthermore, we expanded this recommendation system to platforms such as blogs, which encompass a diverse array of content. As a result, users can receive font recommendations based on the mood and emotions of their creative works during their creative activities, allowing for convenient and suitable font usage. Ultimately, this enables users to easily attain the positive effects achievable through font utilization.
The flexibility of our matching model allows for the recommendation of fonts for a wide range of diversified content. By enhancing font selection, even users with limited design expertise can improve the quality of their creations while reducing the cost associated with font selection. We believe that the concept introduced in this study can be extended to various types of content beyond facial expressions and sentences.
In the future, we plan to conduct an in-depth system evaluation targeting font designers and other experts, separate from the usability assessment. Through this, we aim to measure the accuracy of our font recommendation algorithm and system, assess user satisfaction, and identify areas for further enhancement. Subsequently, we will perform actual usability testing by providing font recommendations to users free of charge, aiming to refine the system for improved temporal efficiency in font selection.
Author Contributions
Conceptualization, S.-B.L. and Y.-S.J.; methodology, S.-B.L., B.A. and S.-B.L.; validation, S.-B.L. and Y.-S.J.; formal analysis, B.A. and J.H.P.; writing—original draft preparation, Y.S.; writing—review and editing, Y.S.; project administration, S.-B.L. All authors have read and agreed to the published version of the manuscript.
Funding
This research was supported by the Basic Science Research Program through the National Research Foundation of Korea (NRF), funded by the Ministry of Education (2021R1I1A4A01059550). This research was supported by the Basic Science Research Program through the National Research Foundation of Korea (NRF), funded by the Ministry of Education (grant number: RS-2022-00165818).
Institutional Review Board Statement
Not applicable.
Informed Consent Statement
Not applicable.
Data Availability Statement
The data presented in this study are available on request from the corresponding author. However, the data cannot be publicly disclosed due to the inclusion of paid fonts and other proprietary elements, which restrict public access. For further inquiries, please contact the corresponding author.
Conflicts of Interest
The authors declare no conflicts of interest.
References
- Haenschen, K.; Tamul, D.J.; Collier, J.R. Font matters: Understanding typeface selection by political campaigns. Int. J. Commun. 2021, 15, 2894–2914. [Google Scholar]
- Murchie, K.J.; Diomede, D. Fundamentals of graphic design—Essential tools for effective visual science communication. Facets 2020, 5, 409–422. [Google Scholar] [CrossRef]
- Ueki, R.; Yokoyama, K.; Nakamura, S. Does the Type of Font Face Induce the Selection? In International Conference on Human-Computer Interaction; Springer Nature: Cham, Switzerland, 2023; pp. 497–510. [Google Scholar]
- Zhao, N.; Cao, Y.; Lau, R.W. Modeling fonts in context: Font prediction on web designs. Comput. Graph. Forum 2018, 37, 385–395. [Google Scholar] [CrossRef]
- Tsuji, K.; Uchida, S.; Iwana, B.K. Using Robust Regression to Find Font Usage Trends. In Document Analysis and Recognition–ICDAR 2021 Workshops: Lausanne, Switzerland, September 5–10, 2021, Proceedings, Part II 16; Springer International Publishing: Berlin/Heidelberg, Germany, 2021; pp. 126–141. [Google Scholar]
- Ji, Y.S.; Lim, S.B. Design and Application of Mapping Model for Font Recommendation System Based on Contents Emotion Analysis. In International Conference on Intelligent Computing; Springer Nature: Singapore, 2023; pp. 397–408. [Google Scholar]
- Shirani, A.; Dernoncourt, F.; Echevarria, J.; Asente, P.; Lipka, N.; Solorio, T. Let me choose: From verbal context to font selection. arXiv 2020, arXiv:2005.01151. [Google Scholar]
- Zhang, S.; Wang, P.; Hou, W. Research on Font Emotion Based on Semantic Difference Method. In Human Centered Computing, Proceedings of the 4th International Conference, HCC 2018, Mérida, Mexico, 5–7 December 2018; Springer International Publishing: Berlin/Heidelberg, Germany, 2018. [Google Scholar]
- Shaikh, A.D.; Fox, D.; Chaparro, B.S. The effect of typeface on the perception of email. Usability News 2007, 9, 1–7. [Google Scholar]
- Lonsdale, M.D.S. Typographic features of text and their contribution to the legibility of academic reading materials an empirical study. Visible Lang. 2016, 50, 79–111. [Google Scholar]
- Ho, A.G. Typography today: Emotion recognition in typography. In Proceedings of the IASDR 2013 Conference, Tokyo, Japan, 26–30 August 2013; Japanese Society for the Science of Design (JSSD): Tokyo, Japan, 2013; Volume 1, pp. 5573–5582. [Google Scholar]
- O’Donovan, P.; Lībeks, J.; Agarwala, A.; Hertzmann, A. Exploratory font selection using crowdsourced attributes. ACM Trans. Graph. 2014, 33, 4. [Google Scholar] [CrossRef]
- Kim, H.Y.; Lim, S.B. Emotion-based Hangul font recommendation system using crowdsourcing. Cogn. Syst. Res. 2018, 47, 214–225. [Google Scholar] [CrossRef]
- Adobe Fonts. Adobe Fonts Website. 2024. Available online: https://fonts.adobe.com/ (accessed on 17 January 2024).
- Google Fonts. Google Fonts Website. 2024. Available online: https://fonts.google.com/ (accessed on 17 January 2024).
- FontSpace. Canva Fonts on FontSpace. 2024. Available online: https://www.fontspace.com/category/canva (accessed on 17 January 2024).
- Eunmi, S. A Study on Image Classification for Hangul Font for Emotional Expression on Digital Media. Ph.D. Thesis, Yonsei University, Seoul, Republic of Korea, 2007. [Google Scholar]
- Mohammad, S. Obtaining reliable human ratings of valence, arousal, and dominance for 20,000 English words. In Proceedings of the 56th Annual Meeting of the Association for Computational Linguistics, Melbourne, Australia, 15–20 July 2018; Volume 1, pp. 174–184. [Google Scholar]
- Kim, H.Y.; Lim, S.B. Standardizing design-based font classification system for Hangul font services. Comput. Stand. Interfaces 2018, 55, 47–54. [Google Scholar] [CrossRef]
- Wang, M.; Deng, W. Deep face recognition: A survey. Neurocomputing 2021, 429, 215–244. [Google Scholar] [CrossRef]
- Carvalho, A.; Levitt, A.; Levitt, S.; Khaddam, E.; Benamati, J. Off-the-shelf artificial intelligence technologies for sentiment and emotion analysis: A tutorial on using IBM natural language processing. Commun. Assoc. Inf. Syst. 2019, 44, 43. [Google Scholar] [CrossRef]
- Saharia, C.; Chan, W.; Saxena, S.; Li, L.; Whang, J.; Denton, E.L.; Norouzi, M. Photorealistic text-to-image diffusion models with deep language understanding. Adv. Neural Inf. Process. Syst. 2022, 35, 36479–36494. [Google Scholar]
- Hashim, N.L.; Isse, A.J. Usability evaluation metrics of tourism mobile applications. J. Softw. Eng. Appl. 2019, 12, 267–277. [Google Scholar] [CrossRef]
- Pu, P.; Chen, L.; Hu, R. A user-centric evaluation framework for recommender systems. In Proceedings of the Fifth ACM Conference on Recommender Systems, Chicago, IL, USA, 23–27 October 2011; pp. 157–164. [Google Scholar]
- Seffah, A.; Donyaee, M.; Kline, R.B.; Padda, H.K. Usability measurement and metrics: A consolidated model. Softw. Qual. Qual. J. 2006, 14, 159–178. [Google Scholar] [CrossRef]
- Bangor, A.; Kortum, P.T.; Miller, J.T. An empirical evaluation of the system usability scale. Intl. J. Hum. Comput. Interact. 2008, 24, 574–594. [Google Scholar] [CrossRef]
- Lewis, J.R.; Sauro, J. The factor structure of the system usability scale. In Human Centered Design: First International Conference, Proceedings of the HCD 2009, Held as Part of HCI International 2009, San Diego, CA, USA, 19–24 July 2009; Springer: Berlin/Heidelberg, Germany, 2009; Proceedings 1; pp. 94–103. [Google Scholar]
- Nielsen, J. Usability Engineering; Morgan Kaufmann: Burlington, MA, USA, 1994. [Google Scholar]
Figure 1.
The entire process of the font recommendation system.
Figure 1.
The entire process of the font recommendation system.
Figure 2.
Displays the list of recommended fonts and corresponding emotion numerical values based on the input image.
Figure 2.
Displays the list of recommended fonts and corresponding emotion numerical values based on the input image.
Figure 3.
Illustration of an example depicting the emotion ‘JOY’ generated from the input sentence, showcasing the corresponding emotions of associated fonts.
Figure 3.
Illustration of an example depicting the emotion ‘JOY’ generated from the input sentence, showcasing the corresponding emotions of associated fonts.
Figure 4.
Web-based font recommendation system with expression and sentence input options, showcasing matching emotions in images to the top five recommended fonts, each linked to its webpage.
Figure 4.
Web-based font recommendation system with expression and sentence input options, showcasing matching emotions in images to the top five recommended fonts, each linked to its webpage.
Figure 5.
Examples of recommended fonts derived from the analysis of blog content. (a) In the case of (a), it is a blog post containing content related to sadness, and below the red arrow are the font recommendations based on blog post content and image analysis, respectively. The font recommendation results can be applied to the blog’s title, and user selection is possible. (b) Similarly, in the case of (b), it represents a blog post with challenging and angry content, along with the font recommendation results.
Figure 6.
The average count of respondents who considered the results appropriate was classified by font recommendation rankings among grouped categories.
Figure 6.
The average count of respondents who considered the results appropriate was classified by font recommendation rankings among grouped categories.
Figure 7.
The average count of respondents who deemed the results inappropriate, categorized by font recommendation rankings among grouped categories.
Figure 7.
The average count of respondents who deemed the results inappropriate, categorized by font recommendation rankings among grouped categories.
Figure 8.
Group-specific results for satisfaction scores.
Figure 8.
Group-specific results for satisfaction scores.
Figure 9.
The existing font recommendation system was described in previous research. (Reprinted/adapted with permission from Ref. [
13]. Copyright 2018, copyright Soon-bum Lim).
Figure 9.
The existing font recommendation system was described in previous research. (Reprinted/adapted with permission from Ref. [
13]. Copyright 2018, copyright Soon-bum Lim).
Table 1.
The impressions of fonts are defined in Donovan’s study.
Table 1.
The impressions of fonts are defined in Donovan’s study.
| 37 Expressions of Font Impressions |
|---|
| Angular | Artistic | Attention-Grabbing | Attractive | Bad | Boring | Clam |
| Capitals | Charming | Clumsy | Complex | Cursive | Delicate | Disorderly |
| Display | Dramatic | Formal | Fresh | Friendly | Gentle | Graceful |
| Happy | Italic | Legible | Modern | Monospace | Playful | Pretentious |
| Serif | Sharp | Soft | Strong | Technical | Thin | Warm |
| Wide | | | | | | |
Table 2.
Results of the emotional keyword survey for DOS Gothic font, by the number of respondents.
Table 2.
Results of the emotional keyword survey for DOS Gothic font, by the number of respondents.
| DOSGothic [(ex) 도스고딕] |
|---|
| <Emotional keywords> | High | Medium | Low |
| angular | 20 | 32 | 9 |
| attention-grabbing | 13 | 17 | 31 |
| boring | 20 | 13 | 28 |
| calm | 4 | 24 | 33 |
| delicate | 1 | 19 | 41 |
| disorderly | 22 | 23 | 16 |
| dramatic | 12 | 14 | 35 |
| formal | 2 | 6 | 53 |
| friendly | 11 | 17 | 33 |
| gentle | 3 | 20 | 38 |
| graceful | 0 | 5 | 56 |
| modern | 1 | 22 | 38 |
| playful | 10 | 20 | 31 |
| strong | 1 | 17 | 43 |
| technical | 3 | 10 | 48 |
| warm | 3 | 15 | 43 |
| determined | 3 | 12 | 46 |
| harmonious | 0 | 11 | 38 |
| stiff | 29 | 20 | 12 |
Table 3.
The correlation coefficient between content and font keyword emotions (Partial Data Included).
Table 3.
The correlation coefficient between content and font keyword emotions (Partial Data Included).
| | Emotion of Content |
|---|
| Font keywords (19) | angry | contempt | … | joy | trust |
| Angular | −0.7627 | −0.909 | 0.388 | 0.914 |
| Formal | −0.872 | −0.972 | 0.557 | 0.975 |
| Disorderly | 0.93 | 0.995 | −0.665 | −0.996 |
| Technical | 0.132 | −0.14 | −0.14 | 0.152 |
| Gentle | −0.984 | −0.996 | 0.797 | 0.994 |
| Modern | 0.93 | 0.995 | | −0.665 | −0.996 |
| Harmonious | −0.95 | −0.999 | | 0.706 | 0.999 |
| Stiff | 0.837 | 0.658 | | −0.994 | −0.649 |
| attention-grabbing | −0.838 | −0.954 | | 0.501 | 0.958 |
| … | | | | | |
| Determined | −0.94 | −0.997 | | 0.684 | 0.998 |
| Playful | −0.645 | −0.415 | | 0.921 | 0.404 |
Table 4.
Measurement methods and evaluation scales for usability evaluation.
Table 4.
Measurement methods and evaluation scales for usability evaluation.
| Evaluation Criteria | Measurement Methods |
|---|
| Appropriateness | Verify the groups in which the content and recommended fonts have been classified according to their rankings. Select the group of fonts that best matches the content. Select the group of fonts that least suits the content.
|
| Satisfaction | |
| Efficiency | |
| Disclaimer/Publisher’s Note: The statements, opinions and data contained in all publications are solely those of the individual author(s) and contributor(s) and not of MDPI and/or the editor(s). MDPI and/or the editor(s) disclaim responsibility for any injury to people or property resulting from any ideas, methods, instructions or products referred to in the content. |
© 2024 by the authors. Licensee MDPI, Basel, Switzerland. This article is an open access article distributed under the terms and conditions of the Creative Commons Attribution (CC BY) license (https://creativecommons.org/licenses/by/4.0/).


