Featured Application
The worm-type distributor stands as a typical distribution mechanism that is extensively employed in agricultural machinery for fertilization.
Abstract
To investigate the causes of flow fluctuations in a worm-type distributor during the fertilization process, this study employed the discrete element method to simulate the fertilization process. The analysis focused on the influences of force chain evolution on particle flow fluctuations and the effects of the rotational speed. The results indicate that the flow fluctuations in the worm-type distributor are not solely attributed to its helical structure but are closely associated with the evolution of force chains within the particle systems. Furthermore, a one-to-one correspondence between the flow fluctuations and force-chain evolution exists. The rotational speed was found to exert significant influences on the axial and circumferential distributions of the force chains. As the rotational speed increases, the coefficient of variation (CV) of the axial distribution of the force chains gradually decreases. Meanwhile, the uniformity index (UI) of the circumferential distribution of the force chains initially increases and then decreases. In the context of a worm-type distributor, the axial distribution of force chains emerges as the dominant influencing factor for flow fluctuations. For the specific worm-type distributor model chosen in this study, the minimum flow fluctuations were observed at a rotational speed of 80 rpm. These research findings offer valuable insights into understanding the flow fluctuations of worm-type distributors and provide references for further exploration in this field.
1. Introduction
The worm-type distributor, comprising a hopper, a screw shell, and a rotating screw, stands as a typical distribution mechanism that is extensively employed in agricultural machinery for fertilization [1,2]. Fertilization, aimed at providing an appropriate amount of nutrients to crops, encounters challenges with existing worm-type distributors due to flow fluctuations—a key factor influencing crop quality and yield [3]. Flow fluctuation correlates closely with the physical properties of particles (e.g., particle size [4] and shape [5,6]), the helical structure (e.g., screw pitch [7] and blade diameter [8]), and operational conditions (e.g., rotational speed [9,10]). Dynamic simulation methods using the discrete element method (DEM) have recently proven effective in studying the motion laws of particles [11]. Consequently, numerous researchers have employed the DEM to address the flow fluctuation issue in worm-type distributors by focusing on these aspects.
For instance, Zhang et al. studied the effect of particle size on flow fluctuation and found that the reduction of particle size gradually improved the stability and accuracy of spiral transportation [12]. Nicolin et al. found, through the DEM, that particle shape significantly influences mass flow rate under screw conveyance at high rotational speeds [13]. Song et al. reduced flow fluctuation by altering the screw pitch at the feed inlet, conveying section, and outlet [14]. Fernandez et al. studied the effects of six types of helical structures on flow fluctuation based on the DEM [15]. Liu et al. simulated helical transportation under different helical rotational speeds and angles of inclination through the DEM, finding that flow fluctuation decreases with the increase in the helical rotational speed and angle of inclination [16]. Sun et al. explored the influences of a shaft helix and shaftless helix on flow fluctuation under different rotational speeds, observing a decrease in flow fluctuation with an increasing rotational speed [17].
Despite successful proposals of various methods to decrease flow fluctuation, the underlying causes still warrant deeper exploration. Flow fluctuation in the helical fertilization process is a macroscopic phenomenon that is essentially driven by changes in the particle swarm movement, induced by external stresses. Analyzing the stress characteristics of particle swarms at the microscopic level can offer a novel perspective to elucidate flow fluctuation. The rotational speed, a crucial operational parameter of the worm-type distributor, significantly affects both macroscopic flow fluctuation and microscopic force and energy transmission among particle swarms. Although scholars have emphasized the importance of the spiral rotational speed on flow fluctuation [18,19,20], the influence of the stress characteristics of particle swarms on the flow fluctuation from the meso-scale remains largely unexplored. Therefore, this study investigates the causes of flow fluctuation by employing the rotational speed as a variable, aiming to reveal the action mechanism of particle swarm force and energy on the meso-scale.
In this study, a numerical simulation of the fertilization process of a worm-type distributor was conducted through the DEM. The qualitative and quantitative exploration of the internal relations between the flow fluctuation and contact force fluctuation among particles paved the way for a deep analysis of the influences of the helical rotational speed on contact forces (including the axial coefficient of variation and the circumferential uniformity index) among particles. The ultimate goal is to elucidate the internal mechanism of flow fluctuation and provide theoretical guidance for the stable fertilization of worm-type distributors.
2. Materials and Methods
2.1. DEM Model
In this study, a numerical simulation of the fertilizer particle conveying process in a worm-type distributor was conducted using the soft ball model. The DEM simulation involved the continuous updating and iteration of the force–displacement relations of particles, centered around Newton’s second law, to determine the movement conditions of particles [21]. Fertilizer particles in the worm-type distributor exhibit translational and rotational motion, expressed as follows:
where is the mass of the fertilizer particle . is the translational velocity of the fertilizer particle . is the gravitational acceleration of fertilizer particles. is the number of fertilizer particles in contact with the fertilizer particle . and are normal force and tangential force of fertilizer particles. is the rotational inertia of the fertilizer particle . is the angular velocity of rotational motion of the fertilizer particle . and are tangential torque and rolling frictional torque, respectively.
Numerous studies have demonstrated that the Hertz–Mindlin contact model is the most widely used for simulating the dynamic flow behaviors of fertilizer particles in worm-type distributors [22,23]. Hence, the Hertz–Mindlin (no-slip) contact model was selected for numerical simulation in this study. The contact force in this simulation encompasses forces between particles and forces between particles and the distributor. The discrete element method (DEM) was first proposed by Cundall and Strack to simulate the motion behavior of particulate matter. All forces, torques, and relevant parameters are detailed in Table 1 [24].

Table 1.
Force and torque equations used in contact model.
2.2. Simulation Conditions and Process
Urea fertilizers are widely utilized due to their high nitrogen content, cost-effectiveness, and rapid nutrient supply to crops upon application [25]. Consequently, urea fertilizers were selected as the test materials for this study. To obtain accurate measurements, a micrometer with a precision of 0.01 mm was employed to measure the length, width, and height of 100 fertilizer particles. The recorded results were 2.55 mm, 2.50 mm, and 2.16 mm, respectively. Using Equations (3) and (4), the equivalent sphere diameter and sphere rate of the fertilizer particles were calculated as 2.40 mm and 94.54%, respectively.
where is the equivalent diameter (mm). is the length of fertilizer particles (mm). is the width of fertilizer particles (mm). is thickness of fertilizer particles (mm). expresses the sphere rate (%).
A previous study established that the particle model could be represented as a sphere when the exceeded sphere rate of fertilizer particles 90% [26]. Consequently, for this study, the fertilizer particle model was simplified as spheres with a diameter of 2.40 mm (Figure 1). It is essential to highlight that, in this project, fertilizer particles were simplified as breakage-free, wear-free, liquid bridge-free, and monodispersed.
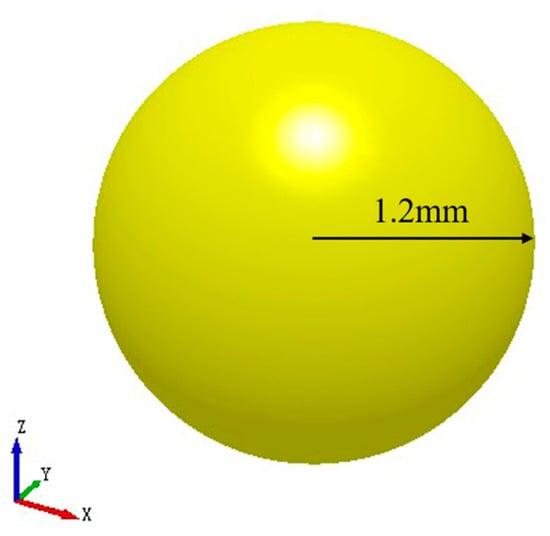
Figure 1.
Spheroid fertilizer particles and their characteristic parameters.
In this study, the focus was on the conveying process of the worm-type distributor. Building upon the research findings of Shi [27], the worm-type distributor was segmented into the conveying zone, barrier zone, and distribution zone, which includes the hopper, helix, outlet, and shell. The specific geometric structural parameters are detailed in Figure 2a, and essential parameters were measured and calibrated during the simulation, with the remaining parameters sourced from relevant studies [28,29]. Refer to Table 2 for more details. The outlet opening of the worm-type distributor was set at 40 mm, and the helical rotation speed varied from 20 rpm to 80 rpm.
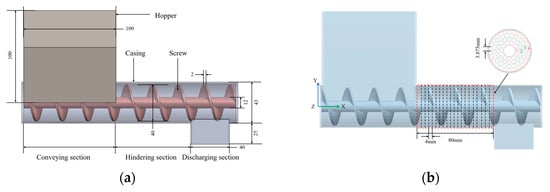
Figure 2.
(a) Geometry of the screw fertilizer feeder. (b) Schematics of the model used in DEM simulations.
Table 2.
Parameters used in DEM simulations.
The geometric model of the worm-type distributor in the simulation is illustrated in Figure 2b. Initially, fertilizer particles were randomly generated at the hopper inlet and allowed to fall freely under the influence of gravity. Particle generation ceased upon reaching a height of 120 mm (Figure 3a). Subsequently, all particles were made static for 2 s to attain a stable state. The distribution helix then rotated at the predetermined speed, propelling fertilizer particles forward along the distribution direction (Figure 3b). Ultimately, a dynamically stable particle flow was established within the worm-type distributor (Figure 3c). It is crucial to note that dynamic stability is determined by the average speed of particles in the barrier zone of the worm-type distributor. As depicted in Figure 4, the average speed of particles fluctuated around the mean during the 19 s–25 s timeframe, with the fluctuation range within the upper and lower deviations indicating the attainment of a stable state. It is important to emphasize that the data sampling interval was 0.1 s, and t = 0 s marked the commencement of the simulation.
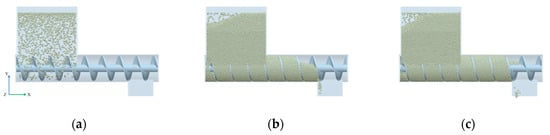
Figure 3.
Snapshots from a DEM showing the evolution of fertilizer particles’ flow during fertilization: (a) an initial state where the particles are filled in the hopper, (b) particles gradually being full inside hindering section, and (c) a steady state in which average velocity of particles is in dynamical equilibrium. The screw rotational speed is 50 rpm.
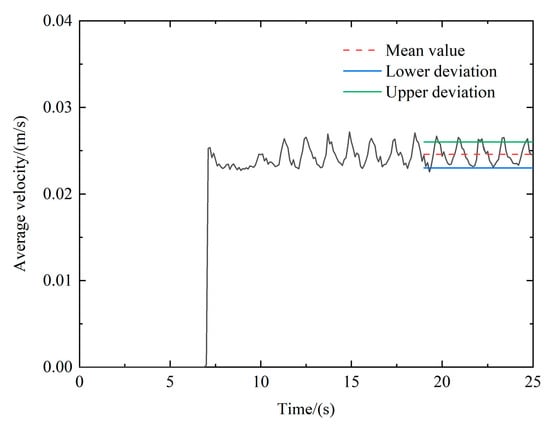
Figure 4.
Average velocity of particles in the Hindering section.
3. Results and Discussion
3.1. Model Verification
To validate the accuracy of the contact parameters and other relevant parameters in the DEM simulation, the model underwent verification before the simulation test. The experimental verification platform is shown in Figure 5, and the red dotted box is the screw type fertilizer distributor.. The conveying process of the worm-type distributor was captured by a camera to record the flow patterns and particle distribution. The instantaneous comparison between the test and simulation is presented in Figure 6, where each moment corresponds to different motion states of the particles. The comparison reveals that, under the same conditions, the particle flow forms and distributions in different sections of the test device were generally consistent with the simulation results.
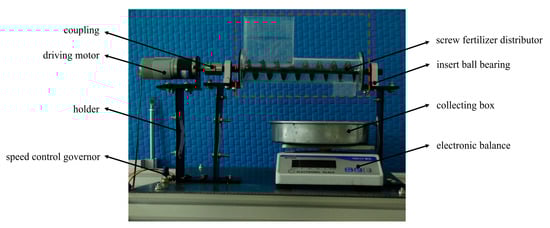
Figure 5.
Test platform.
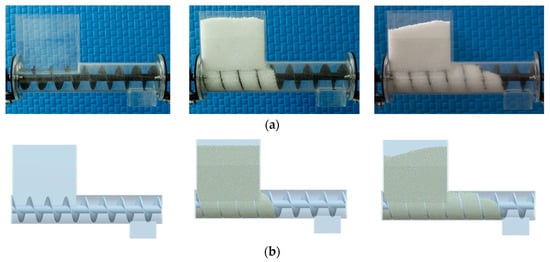
Figure 6.
Comparison of the simulated conveying process with the corresponding experiment at the rotation speed of 50 rpm: (a) experiment and (b) simulation.
For further verification of the simulation model’s accuracy, changes in the cumulative mass with time under 50 rpm were measured. In the simulation process, data were collected at intervals of 0.1 s, with the moment when fertilizer particles appeared at the Group bin set as 0 s and a total extraction time of 8 s. In the test process, changes in the electronic scale readings were recorded by a camera, and mass data were extracted based on the number of frames in the video. As shown in Figure 7, the simulation and test curves exhibit a good fit, with a result error of 5.79%. When the error value is below 15%, it is considered that the current DEM model has achieved acceptable accuracy, and the discussion on the meso-scale laws of particles meets the required standards [30].
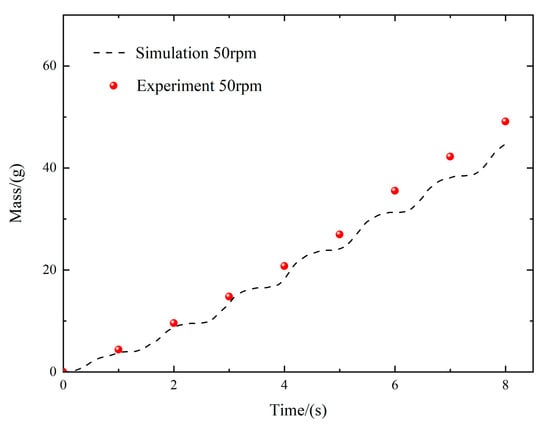
Figure 7.
The simulation and experimental comparison diagram of the cumulative mass changing with time.
3.2. Analysis of Flow Fluctuation Process
Extensive flow fluctuation issues are observed in the distribution process of the worm-type distributor. To investigate the causes of flow fluctuations, a simulation process of the worm-type distributor under a rotational speed of 50 rpm was conducted. As illustrated in Figure 8, significant changes in mass flows from the red zone (barrier zone) were observed as the distribution helix rotated through different phase angles. Analyzing the changes in the mass flow rate in the barrier zone revealed regular fluctuations over time, with the mean fluctuating around the upper and lower deviations (Figure 9). Therefore, the continuous rotation of the distributed spiral and periodic changes in the size of the opening between the spiral sleeves were identified as the main cause of the fluctuation of the flow in the obstacle area, which is consistent with Dun’s findings [31]. Furthermore, Yang proposed that flow fluctuation is not only related to the helical structure but also closely associated with the force chain of particle interaction, representing another key influencing factor of flow fluctuation [32].
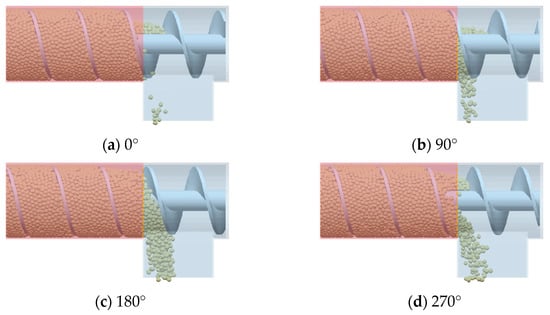
Figure 8.
Transient simulation effects of different phase angles of screw rotation of the screw fertilizer feeder with screw. The screw rotational speed is 50 rpm.
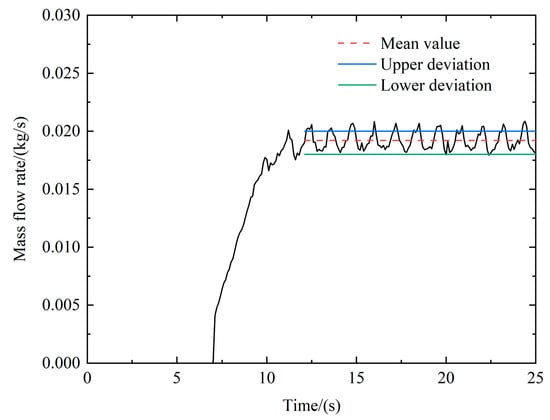
Figure 9.
Variation in mass flow rate of particle with time. The screw rotational speed is 50 rpm.
In the dynamic conveying process, uneven contact forces were generated among particles under the influence of external loads and gravity, forming a transmission path contact network known as force chains [33]. Given the focus on normal stress in the worm-type distributor [34], the force chain analysis primarily concentrates on the normal contact force. The network distribution of normal contact forces among particles under different phase angles is depicted in Figure 10, in order to clarify the failure stage of the force chain, a black dotted line is circled in the diagram. It is important to note that each contact rod represents a connection at the contact point of particles, and its size is proportional to the normal contact force (red for large numerical values and blue for small numerical values). With the continuous growth of the phase angle, force chains in the black zone are continuously broken, influenced by gravity. Extracting the average normal contact force changes in the barrier zone of the worm-type distributor reveals some regular fluctuations over time (Figure 11). Consequently, flow fluctuation is closely related to the formation and breakage of force chains among particle systems.
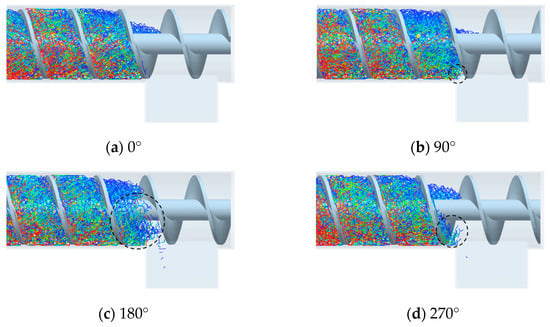
Figure 10.
Network distribution of normal contact force between fertilizer particles under different phase angles. The screw rotational speed is 50 rpm.
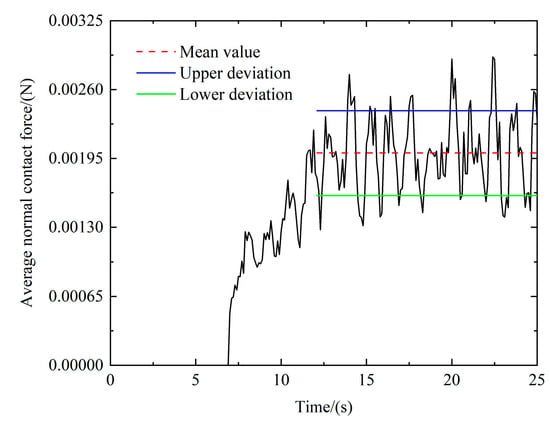
Figure 11.
The variation in average normal contact force with time. The screw rotational speed is 50 rpm.
For a comprehensive analysis of the relationship between flow fluctuation and force chains, the mass flow rate and average normal phase contact force in the barrier zone were compared (Figure 12). It is crucial to note that the extraction time was during the dynamically stable phase of fertilizer particles (19 s–25 s). Clearly, the fluctuation peak of the average normal contact force corresponds to the valley of the flow fluctuation, and the fluctuation exhibits stable amplitudes and periods. In the fertilization process, with the increase in the helical phase angle, the discharge flow of fertilizer particles starts to increase. Due to differences in generation speeds among fertilizer particle layers, the upper layer loses support from the lower fertilizer particles, leading to a decrease in the average normal contact force. This observation is consistent with the research conclusions of Zeng [35]. Therefore, the quantitative analysis of the average normal contact force distribution among fertilizer particle systems provides insights into the flow fluctuation characteristics of the worm-type distributor.
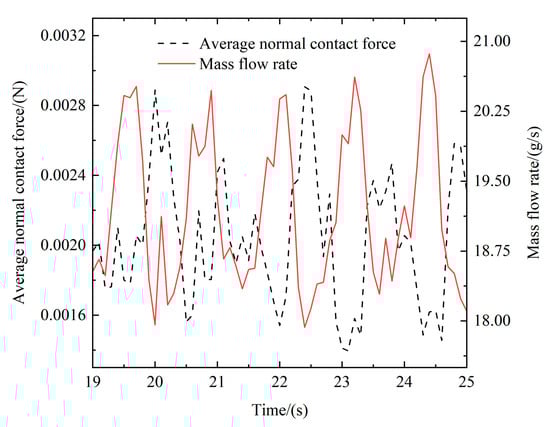
Figure 12.
Relationship between average normal contact force and average mass flow rate. The screw rotational speed is 50 rpm.
3.3. The Axial Distribution of Force Chains
To achieve the visualization of the axial distribution of force chains in the barrier zone, samples were selected within the axial range of 102 mm ≤ X ≤ 182 mm after particles reached dynamic stability (within the red dotted line range in Figure 2b). The cloud chart illustrating the axial distribution of force chains under different rotational speeds is presented in Figure 13. Clearly, the relatively strong force chain distribution in the barrier zone significantly decreased at 20 rpm (Figure 13a). As the rotational speed increased, there was an extensive distribution of relatively strong force chains in the barrier zone at 80 rpm, approaching the outlet gradually (Figure 13c). These results indicate that the increase in rotational speed strengthens the disturbance of the helical blades to the particles, promoting the axial distribution of force chains simultaneously.
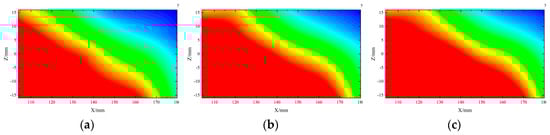
Figure 13.
The axial distribution of the force chain: speed (a) 20 rpm, (b)50 rpm, (c) 80 rpm.
The axial coefficient of variation (CV) was employed for the quantitative characterization of the axial distribution uniformity of force chains. The CV, also known as the relative standard deviation, is defined as the ratio of the standard deviation to the mean of the axial distribution of force chains. A higher CV value indicates lower uniformity in the axial distribution.
where is the average normal force of sample at time . is the number of time, and it is set 0.1 s in this study. is the average normal force of sample in time, and its unit time is 19 s–25 s. is number of samples, and it is set 20 in this study. is the average normal force of samples. is the standard deviation of samples. is the coefficient of variation.
The CV of force chains under different rotational speeds is illustrated in Figure 14. As the rotational speed increases, the CV exhibits a declining trend. The qualitative results of the axial distribution of force chains in Figure 13 and the quantitative CV results in Figure 14 are generally consistent.
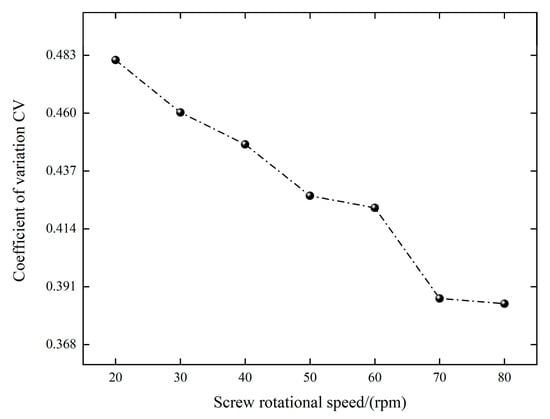
Figure 14.
The relationship between uniformity variation coefficient and rotational speed.
Given that force and energy transmission among particle swarms occur through contact, the coordination number is a crucial index for studying the contact characteristics of particle systems. It directly reflects the contact number [36]. The average coordination number of all particles in the barrier zone under different rotational speeds was used to effectively investigate the force transmission among particles. As depicted in Figure 15, the average coordination number decreases with the increase in rotational speed. This decline is attributed to the increase in centrifugal force and the strengthened disturbance of helical blades to the particle swarm, which is associated with the higher rotational speed. The axial distribution diagram of force chains clearly shows a significant increase in force chains and a more uniform distribution with the rise in rotational speed. Although the average coordination number decreases, the residual particles are more tightly connected with the increased force chains, leading to more consistent movements. This observation aligns with the axial distribution of force chains.
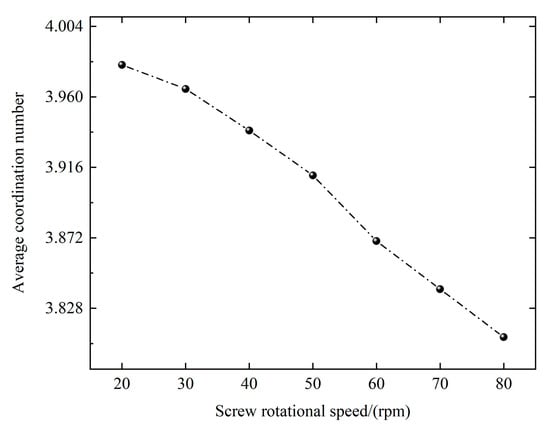
Figure 15.
The average coordination number of different rotational screw speeds.
In summary, rotational speed influences the axial distribution of force chains, as evidenced by differences in CV. Considering the characteristics of helical transportation, there is undoubtedly nonuniformity in the circumferential distribution of force chains. Hence, it is crucial to elucidate the influence of the rotational speed on the circumferential distribution of force chains and its overall impact.
3.4. The Circumferential Distribution of Force Chains
To visualize the circumferential distribution of force chains in the barrier zone, four layers (sizes indicated in Figure 2b) were divided within the circumferential range after the particles reached dynamic stability. The dotted circle, from the outer layer to the inner layer, represents the boundary of the screw shell and the boundary of the screw axis (Figure 16).
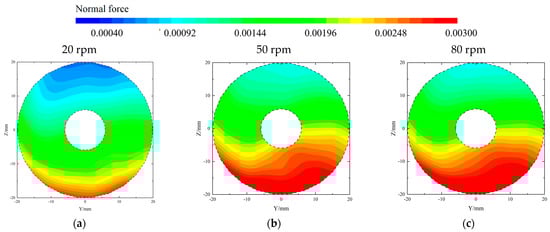
Figure 16.
Circumferential distribution of force chains: spherical particles, speed of (a) 20 rpm, (b) 50 rpm, and (c) 80 rpm.
From Figure 16, it is evident that the force chains above the screw shell exhibit smaller sizes compared to those below (Figure 16a). Although the circumferential distribution of force chains under other conditions is not presented here, the described situations are representative. This suggests a clear distribution gradient of force chains along the circumferential direction in the screw drainer. At a rotational speed of 20 rpm, the force chains are generally small and exhibit a uniform distribution. When the rotational speed is increased to 50 rpm, the strength of the force chains significantly increases, and the distribution becomes uneven. There are no obvious changes at 80 rpm, and the circumferential distribution of the force chains remains consistent with that at 50 rpm.
To quantify the uniformity of the circumferential distribution of force chains, the uniformity index (UI) was introduced. The data extraction method is depicted in Figure 2b. Initially, the average normal contact force was extracted and normalized. Subsequently, the standard deviation of the normalized average contact force in the Y–Z plane and its mean were calculated. Finally, UI was obtained. It is important to note that a lower UI indicates a more uniform contact force distribution. The calculation formula for the UI is:
where is the average normal force of sample in the layer . and are the maximum average normal force and minimum average normal force of all particles in each layer, respectively. is the normalized normal force of sample in the layer . and are the number of divided sample layers and the number of samples in each layer. is the normalized average normal force of layer . is the standard deviation of all particles in layer . is the average standard deviation of all layer numbers. is the uniformity index of particles.
The relationship between the rotational speed and UI is illustrated in Figure 17. With the increase in rotational speed, the UI initially increases and then declines. At a rotational speed of 20 rpm, the force chains exhibit a relatively uniform circumferential distribution, indicating a small difference in the normal contact force within the same layer and a small difference in the normal contact force between adjacent layers. It is crucial to note that the variation in the UI aligns with the results in Figure 16.
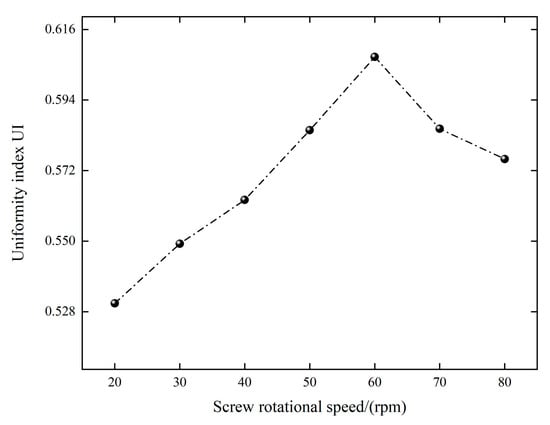
Figure 17.
The relationship between uniformity index and rotational speed.
The circumferential distribution of force chains is directly related to the energy transmission among particles. Therefore, particles with an axial length of 4 mm were tracked over 25 s, and their kinetic energy was extracted (Figure 18). When the rotational speed is too low, the helical blade provides minimal kinetic energy to the particle system, and the kinetic energy of the entire particle system is uniformly distributed (Figure 18a). As the rotational speed increases, the helical blade imparts more kinetic energy to the particle systems. However, there is kinetic energy consumption in the transmission process, and the kinetic energy cannot be transferred to the entire particle system, resulting in a nonuniform distribution (Figure 18b). When the rotational speed is too high, a significant amount of kinetic energy passes through the entire particle system, reaching a state of uniform distribution (Figure 18c). This observation is consistent with the circumferential distribution of force chains.
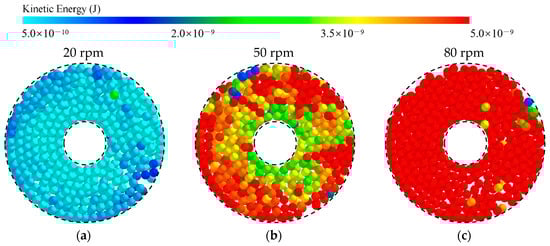
Figure 18.
The change in particle circumferential distribution kinetic energy, speed of (a) 20 rpm, (b) 50 rpm, and (c) 80 rpm.
3.5. Discussions
According to the analysis results, the rotational speed significantly influences the axial and circumferential distribution of force chains. However, the helical transportation process of particles is intricate, and it is essential to delve deeper into the relationship between the force chain distribution and flow fluctuation.
The quantitative characterization of the flow fluctuation of a worm-type distributor was conducted, following the test method provided by NY/T1003-2006 [37]. The simulation extraction time was set at 19 s–25 s, and the calculation formula is as follows:
where is the mean mass of samples in all intervals. is the mass in the interval . is the standard deviation of the mass of all intervals. is the uniform coefficient of variation.
The uniform coefficient of variation under different rotational speeds is depicted in Figure 19. Clearly, the CV1 decreases with the increase in rotational speed. This directly demonstrates that the flow fluctuation decreases with the increase in rotational speed. It is crucial to note that this aligns with the axial distribution laws of force chains. Consequently, it is deduced that force chains mainly exhibit axial distribution in the worm-type distributor, influencing the uniformity of flow fluctuation.
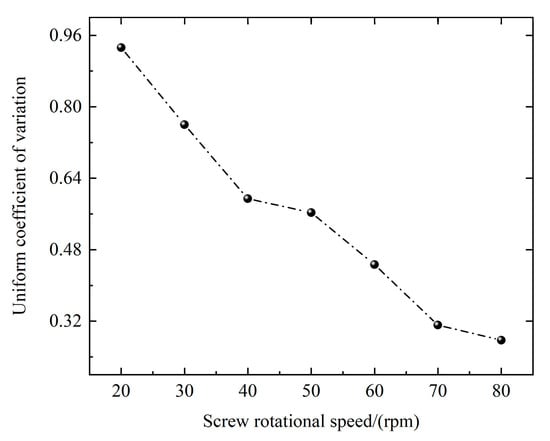
Figure 19.
Uniform coefficient of variation in different rotational speeds.
To verify the above deduction, the distribution diagram of the axial speed and circumferential speed of fertilizer particles in the barrier zone under different rotational speeds is presented in Figure 20. Evidently, the axial speed exhibits a linear growth with the increase in rotational speed, while the circumferential speed remains almost the same. Moreover, the axial speed is significantly higher than the circumferential speed as the rotational speed increases. In this scenario, the axial translation of particles plays a dominant role. This observation aligns with the research results of Minglani and Owen [2,10]. It is clear that the force chain transmission among particles is primarily axial due to axial translation. This is consistent with the previous conjecture.
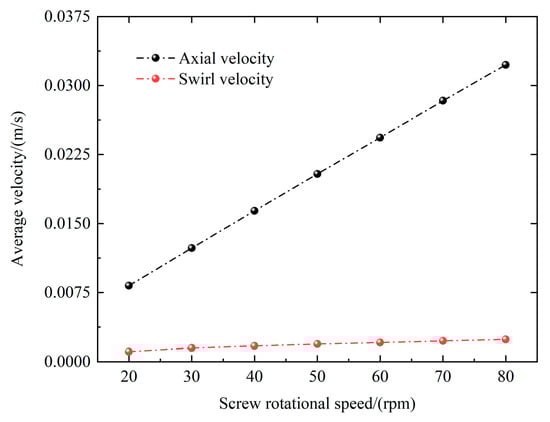
Figure 20.
The distribution of axial velocity and circumferential velocity at different rotational speeds.
For a comprehensive analysis of the influence of the axial force chain distribution on flow fluctuation, the relationship between the CV of axial force chain distribution and the CV1 of the flow fluctuation was established through function fitting, as shown in Figure 21. A mathematical model was constructed:
where Y is the CV1 of flow fluctuation, and X is the CV of the axial force chain distribution. In this mathematical model, R2 values are 0.95, indicating that the fitting line has high accuracy. It can be seen from the mathematical model that the axial force chain distribution is positively related with the CV1 under different rotational speeds. With respect to the chosen worm-type distributor model, the flow fluctuation reaches the minimum when the rotational speed is 80 rpm.
Y = 6.365X − 2.181
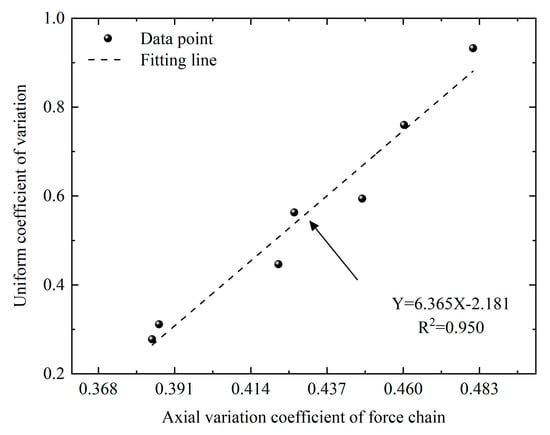
Figure 21.
The relationship between the axial distribution of force chain and the coefficient of variation in uniformity.
Furthermore, it is crucial to emphasize that an increasing rotational speed enhances the contact force among particles and stabilizes the network structure that is formed by particle contact. However, the centrifugal force increases with the rise in rotational speed, leading to a significant decline in the final transport efficiency and performance. Therefore, it becomes imperative to select appropriate operational parameters for different worm-type distributors to achieve optimal transmission effectiveness.
4. Conclusions
This study conducted a numerical simulation of the particle flow in a worm-type distributor based on the DEM. It qualitatively and quantitatively investigated the flow fluctuation and force chain evolution, elaborating on their relationship. The analysis considered the influences of the axial and circumferential distributions of force chains on the flow fluctuation of the worm-type distributor under different rotational speeds. The following major conclusions can be drawn:
The reasons for the fluctuation in the flow rate of the screw-type fertilizer distributor are as follows: first, the flow rate fluctuation is caused by the unique spiral structure of the screw-type fertilizer distributor; the second reason is the formation and destruction of the force chain between particles in the process of fertilizer discharge. In addition, this paper explores the relationship between the flow fluctuation and the force chain and finds that there is a one-to-one correspondence between the flow fluctuation and the average normal contact force fluctuation, that is, the peak of the average contact force fluctuation corresponds to the trough of wave of the flow fluctuation. As an important parameter of the spiral fertilizer distributor, the influence of the rotational speed on the force chain was explored according to the above conclusions, and it was found that the rotational speed had a significant impact on the axial and circumferential distribution of the force chain, showing the difference between the coefficient of variation and the uniformity index. The coefficient of variation decreased with the increase in the rotational speed, and the uniformity index first increased and then decreased with the increase in the rotational speed.
In order to understand the influence of the axial and circumferential distribution of the force chain on the flow fluctuation in a spiral fertilizer distributor, the variation coefficient of flow fluctuation is introduced. It is found that in a spiral fertilizer distributor, the axial distribution of the force chain is the dominant factor affecting flow fluctuation, and the variation coefficient of the force chain axial distribution is positively correlated with the variation coefficient of the flow fluctuation. When the rotational speed is 80 rpm, the flow fluctuation reaches the minimum.
In addition, it should be emphasized that although this paper explores the relationship between the flow fluctuation of the screw fertilizer distributor and the evolution of the force chain with the speed as an influencing factor, in addition to the speed, the flow fluctuation of the screw fertilizer distributor also has a signficant relationship with its structure, and the fertilizer particles that are selected in this paper are ideal spheres, which do not exist in the actual process. Therefore, the flow fluctuation of the screw fertilizer distributor should also be considered in terms of its structural parameters and particle shape.
Author Contributions
Resources, H.Z. and Z.T.; data curation, Y.H. (Yichuan He); writing—original draft preparation, M.Z. and H.N.; writing—review and editing, H.N. and M.Z.; visualization, Y.H. (Yuchen Han), Y.Z. and T.Y.; supervision, H.Z. and H.L.; project administration, H.Z. and H.L. All authors have read and agreed to the published version of the manuscript.
Funding
This research was financially supported by the Bingtuan Science and Technology Program, grant number (2021AA005, 2021AA0050302).
Institutional Review Board Statement
Not applicable.
Informed Consent Statement
Not applicable.
Data Availability Statement
The data presented in this study are available in the article.
Acknowledgments
The authors are grateful to the anonymous reviewers for their comments.
Conflicts of Interest
The authors declare no conflicts of interest.
References
- Dun, G.Q.; Liu, W.H.; Du, J.X.; Zhou, C.; Mao, N.; Ji, W.Y. Optimal Design and Experiment of Arc-groove Double-spiral Fertilizer Discharge Device. Trans. Chin. Soc. Agric. Mach. 2022, 53, 118–125+174. [Google Scholar]
- Minglani, D.; Sharma, A.; Pandey, H.; Dayal, R.; Joshi, J.B.; Subramaniam, S. A review of granular flow in screw feeders and conveyors. Powder Technol. 2020, 366, 369–381. [Google Scholar] [CrossRef]
- Karwat, B.; Rubacha, P.; Stańczyk, E. Simulational and experimental determination of the exploitation parameters of a screw conveyor. Eksploat. Niezawodn. Maint. Inf. 2020, 22, 741–747. [Google Scholar] [CrossRef]
- Wang, S.S.; Mao, J.R.; Liu, G.W. Mechanism of Discharge Pulsation of Particles Feeder and New Method of Restraining Pulsation. J. Xi’an Jiaotong Univ. 2005, 39, 1199–1202. [Google Scholar]
- Sun, H.Y.; Ma, H.Q.; Zhao, Y.Z. DEM investigation on conveying of non-spherical particles in a screw conveyor. Particuology 2022, 65, 17–31. [Google Scholar] [CrossRef]
- Ahmed, H.; Xia, Y.D.; Nepu, S.; Jordan, K.; David, N.L.; James, H.D. Particle size and shape effect of Crumbler® rotary shear-milled granular woody biomass on the performance of Acrison® screw feeder: A computational and experimental investigation. Powder Technol. 2023, 427, 118707. [Google Scholar] [CrossRef]
- Dalenjan, M.B.; Jamshidi, E.; Ebrahim, H.A. The best screw shape for fine zinc oxide particles feeding. Adv. Powder Technol. 2012, 23, 372–379. [Google Scholar] [CrossRef]
- Ye, F.P.; Liu, G.J.; Tang, L.; Jang, X.W.; Li, C.Y. Simulation of Canned Fruit Transportation Process Based on Discrete Element Method. Packag. Eng. 2021, 15, 189–196. [Google Scholar]
- Orefice, L.; Khinast, J.G. DEM study of granular transport in partially filled horizontal screw conveyors. Powder Technol. 2017, 305, 347–356. [Google Scholar] [CrossRef]
- Owen, P.J.; Cleary, P.W. Prediction of screw conveyor performance using the Discrete Element Method (DEM). Powder Technol. 2009, 193, 274–288. [Google Scholar] [CrossRef]
- Hou, Q.F.; Dong, K.J.; Yu, A.B. DEM study of the flow of cohesive particles in a screw feeder. Powder Technol. 2014, 256, 529–539. [Google Scholar] [CrossRef]
- Zhang, X.L.; Ma, K.; Wang, H.; Cui, S.J.; Shi, Y.F. Effect of particle size on precision dosing of screw feeder. Trans. Chin. Soc. Agric. Eng. (Trans. CSAE) 2014, 5, 19–27. [Google Scholar]
- Nicolin, G.; Paul, W.C.; Daniel, N.W.; Johannes, K. The influence of faceted particle shapes on material dynamics in screw conveying. Chem. Eng. Sci. 2021, 243, 116654. [Google Scholar] [CrossRef]
- Song, H.; Li, Y.; Ma, Y.Y.; Liu, W.D. Study on optimization of quantitative screw conveyor based on discrete element method. Hoisting Conveying Mach. 2016, 2, 30–34. [Google Scholar]
- Fernandez, J.W.; Cleary, P.W.; McBride, W. Effect of screw design on hopper drawdown of spherical particles in a horizontal screw feeder. Chem. Eng. Sci. 2011, 66, 5585–5601. [Google Scholar] [CrossRef]
- Liu, C.F.; Li, Y.J.; Wang, Y. Experimental Study on Particles Conveying in Screw Conveyor of D-shape Cross Section. J. Agric. Mech. Res. 2017, 39, 141–146. [Google Scholar]
- Sun, Z.Y.; Meng, W.J.; Kang, K.; Wang, X.W. Study on the influencing factors of flow pulsation at the outlet of screw conveyor. Packag. Food Mach. 2022, 40, 59–64. [Google Scholar]
- Mei, L.; Hu, J.Q.; Li, Y.Z.; Yang, G.B. Modeling and Simulation of Horizontal Single Head Screw Conveyor with Different Fill Levels and Rotational Speed Based on EDEM. Appl. Mech. Mater. 2013, 2746, 1611–1617. [Google Scholar] [CrossRef]
- Zhang, R.; Kong, D.G.; Li, Z.H.; Zhang, C.; Zuo, S.J. Test and Analysis for the Conveying Capacity of Spiral Straw Deep Application Device. J. Agric. Mech. Res. 2014, 5, 196–200. [Google Scholar]
- Wu, C.; Hu, Z.C.; Wu, N. Numerical Simulation and Analysis of Screw Conveyer Based on the Discrete Element Method. J. Agric. Mech. Res. 2015, 2, 57–61+70. [Google Scholar]
- Wang, J.F.; Fu, Z.D.; Jiang, R.; Song, Y.L.; Yang, D.Z.; Wang, Z.T. Influences of grooved wheel structural parameters on fertilizer discharge performance: Optimization by simulation and experiment. Powder Technol. 2023, 418, 118309. [Google Scholar] [CrossRef]
- Yang, Q.L.; Li, Z.H.; Li, H.W.; He, J.; Wang, Q.J.; Lu, C.Y. Numerical Analysis of Particle Motion in Pneumatic Centralized Fertilizer Distribution Device Based on CFD-DEM. Trans. Chin. Soc. Agric. Mach. 2019, 50, 81–89. [Google Scholar]
- Liu, J.B.; Tang, Z.H.; Zheng, X.; Yang, H.J.; Zhang, L.Y.; Meng, X.J.; He, X.C. Design and experiment of deep fertilizing shovel for furrow and layering. J. Gansu Agric. Univ. 2021, 56, 169–176+186. [Google Scholar]
- Cundall, P.A.; Strack, O.D.L. A discrete numerical modelfor granular assemblies. Geotechnique 1979, 29, 47–65. [Google Scholar] [CrossRef]
- Zhang, T.; Liu, F.; Liu, Y.Q.; Zhao, M.Q.; Zhang, S.; Li, N.; Li, F.L.; Lv, B. Discrete Element Simulation of Outer Groove Wheel Type Fertilizer Discharging Device Capacity Analysis. J. Agric. Mech. Res. 2015, 37, 198–201. [Google Scholar]
- Ye, D.P.; Zhao, J.N.; Qing, J.X.; Shen, B.K.; Weng, H.Y.; Zheng, S.H. Design and Test of Key Components of Small Electric Helical Fertilizer Spreader Based on EDEM. J. Shenyang Agric. Univ. 2023, 54, 81–89. [Google Scholar]
- Shi, Y.F.; Zhang, X.L.; Xu, Y.F.; Cui, S.J. Influence of feeding method on feed quantity of screw feeder. J. Drain. Irrig. Mach. Eng. 2019, 37, 341–345. [Google Scholar]
- Liu, J.S.; Gao, C.Q.; Nie, Y.J.; Yang, B.; Ge, R.Y.; Xu, Z.H. Numerical simulation of Fertilizer Shunt-Plate with uniformity based on EDEM software. Comput. Electron. Agric. 2020, 178, 105737. [Google Scholar] [CrossRef]
- Liu, C.L.; Li, Y.N.; Song, J.N.; Ma, T.; Wang, M.M.; Wang, X.J.; Zhang, C. Performance analysis and experiment on fertilizer spreader with centrifugal swing disk based on EDEM. Trans. Chin. Soc. Agric. Eng. (Trans. CSAE) 2017, 33, 32–39. [Google Scholar]
- Ma, Z.; Zhang, C.C.; Wang, J.F. Plough shovel life prediction model based on discrete element method. China Sci. Technol. Inf. 2022, 12, 120–124. [Google Scholar]
- Dun, G.Q.; Wu, X.P.; Ji, X.X.; Ji, W.Y.; Ma, H.Y. Optimization Design and Experiment of Oblique Opening Spiral Precision Control Fertilizer Apparatus. Trans. Chin. Soc. Agric. Mach. 2023, 54, 167–174. [Google Scholar]
- Yang, W.W.; Fang, L.Y.; Lou, X.W.; Li, H.; Ye, Y.Q.; Liang, Z.H. Experimental study of the effects of discharge port parameters on the fertilizing performance for fertilizer distribution apparatus with screw. Trans. Chin. Soc. Agric. Eng. (Trans. CSAE) 2020, 17, 1–8. [Google Scholar]
- Heinze, K.; Frank, X.; Lullien-Pellerin, V.; George, M.; Radjai, F.; Delenne, J.Y. Stress transmission in cemented bidisperse granular materials. Phys. Rev. E 2020, 101, 052901. [Google Scholar] [CrossRef]
- Yu, S.H.; Shen, Y.X. Influence of screw shaft diameter on performance of vertical screw conveyor. China Powder Sci. Technol. 2018, 24, 32–37. [Google Scholar]
- Zeng, Y.; Jia, F.G.; Zhang, Y.X.; Meng, X.Y.; Han, Y.L.; Wang, H. DEM study to determine the relationship between particle velocity fluctuations and contact force disappearance. Powder Technol. 2017, 313, 112–121. [Google Scholar] [CrossRef]
- Ha, W.J.; Xiao, Y.J.; Wang, M.; Zheng, J.X.; Wang, X.M.; Chen, X.B. Discrete element modeling(DEM) study on effect of gradation and morphology on shear strength behavior of rock debris as embankment fill materials. J. Cent. South Univ. (Sci. Technol.) 2021, 52, 2332–2348. [Google Scholar]
- Liao, Q.X.; Chen, Y.; Zhang, Q.S.; Wang, L.; Lin, J.X.; Du, W.B. Design and Experiment of Side Deep Hole Fertilization Device for Rapeseed. Trans. Chin. Soc. Agric. Mach. 2023, 54, 41–52. [Google Scholar]
Disclaimer/Publisher’s Note: The statements, opinions and data contained in all publications are solely those of the individual author(s) and contributor(s) and not of MDPI and/or the editor(s). MDPI and/or the editor(s) disclaim responsibility for any injury to people or property resulting from any ideas, methods, instructions or products referred to in the content. |
© 2024 by the authors. Licensee MDPI, Basel, Switzerland. This article is an open access article distributed under the terms and conditions of the Creative Commons Attribution (CC BY) license (https://creativecommons.org/licenses/by/4.0/).