Article

Traditional and New Sensing Techniques Combination for the Identification of the Forgotten “New Flour-Weighing House” in Valencia, Spain

by
Antonio Gómez-Gil
1,*,
Giacomo Patrucco
2 and
José Luis Lerma
3
1
History of Architecture, Department of Architectural Composition, Universitat Politècnica de València, 46022 Valencia, Spain
2
Laboratory Geomatics for Cultural Heritage (LabG4CH), Department of Architecture and Design (DAD), Politecnico di Torino, 10125 Turin, Italy
3
Photogrammetry and Laser Scanning Research Group (GIFLE), Department of Cartographic Engineering, Geodesy and Photogrammetry, Universitat Politècnica de València, 46022 Valencia, Spain
*
Author to whom correspondence should be addressed.
Appl. Sci. 2024, 14(24), 11962; https://doi.org/10.3390/app142411962
Submission received: 31 October 2024 / Revised: 12 December 2024 / Accepted: 18 December 2024 / Published: 20 December 2024
(This article belongs to the Special Issue Application of Digital Technology in Cultural Heritage)

Abstract

:
In the city of Valencia (Spain), there existed from the Middle Ages until the mid-nineteenth century a building that fulfilled a municipal strategic function: The “new flour-weighing house”. Its purpose was to distribute food to the population and collect the corresponding indirect municipal taxes. Today, the existence of this building is not remembered, neither by scientists nor by citizens, and its importance, location and appearance are unknown. The building investigated, behind which the medieval façade of the “flour-weighing house” is hidden, is the Colomina Palace. In the investigation, its growth phases have been detected, and an idea of its structural organisation has been obtained. Research and investigation have been carried out by consulting historical, cartographic and archival material, together with advanced geomatics techniques, including close-range photogrammetry, terrestrial laser scanning and thermography. The fuse of colour and thermal imagery, together with point clouds and 3D models, help to visualise and check the different spatial transformations of the current “Colomina Palace”, adapting the sequence from medieval times into present. The methodology proposed in this study avoids the need to carry out destructive tests and the processing of permits, which speeds up decision-making and historical architectural reconstruction.

1. Introduction

Despite its importance in the life of the city, there is hardly any news of its existence, not even in the Valencian historical archives, and even less of the original appearance that the building of the “new flour scale” of Valencia may have had. In this city, there was a flour-weighing house prior to the building studied in this text.
Before occupying its final location, according to Marcos Antonio de Orellana, the flour-weighing house was in the area surrounding the archbishop’s palace. And that is the explanation for why the current archbishop’s square was called “plaça del Pes de la Farina” (place of flour-weighing) for many years, as stated in very old municipal provisions. And it seems that it remained in that area until the year 1585, when Philip II, in a privilege and act of the Cortes given in Monzón, closed its door: “(…) the door of “Pes de la farina” is a tank, which is the site of the said square. (…) and the Peso de la Arina (sic) was laid out where it now exists, and it was called Calle del Peso Nuevo de la Arina” [1] (p. 400).
From the current Plaza del Arzobispo, there is a Calle de la Harina (street of flour), where Tramoyeres located the millers’ guild house [2] (p. 93), which connects the square with the Almudín (wreath warehouse).
Studying the stonemason Nicolau Bonet, Mercedes Gómez-Ferrer states that “In 1457 he had been collaborating with Miquel Navarro, Pere Compte and Joan de Cabeçon on the stone corner of the house of the flour weight that faced the Almudín portal” [3] (p. 336). The quote refers to one of the two corners existing at the beginning of Calle de la Harina and that face the Almudín door, being without a doubt the one on the right side (Figure 1).
As for the “new flour-weighing house”, according to Esclapez, in 1517, it began to be built on a site facing Salvador Street [4] (p. 41). This house was tiny and in 1594, the city bought other houses in the block to build a larger flour-weighing house (Figure 2) piece of the block, which the city council bought opposite the Almudín, facing Salvador Street [4] (p. 41). Its great capacity is proven when the city was left without a theatre; initiated by the enlightened archbishop Andrés Mayoral, the flour-weighing house replaced its functions, until the abandoned Balda theatre was rehabilitated, from 23 November 1761 to 17 January 1762 [5] (p. 37).
In this same sense, Cruilles in his Guía urbana de Valencia antigua y moderna (1870) stated that “(…) it is one of the few isolated buildings that existed in Valencia” [6] (p. 60).
Its use, almost identical to that of the Almudín (Figure 3), still existing, can guide us on the general features of the plan, since the tasks undertaken in both were substantially the same. Although initially planned around a patio, the Almudín was covered with the superimposition of a general roof at the end of the sixteenth century [7] (p. 32).
As will be seen, the Almudín has in common with the flour-weighing house the same supervisory objective, and therefore, they had to have similar distributions.
The almudines were premises built expressly for the sale of grain, and their “architectural type” was a direct heir to the Islamic alhóndiga or grain warehouse. The alhóndiga is an evolution of the funduq, the difference between them being that the alhóndiga is public, while the funduq can be private (owned by a guild-type group or by individuals of another religion) and contains stables, warehouses and accommodation for merchants. “The alhóndiga is an institution with specific functions of storage and tax collection of certain goods” [8] (p. 315). In this way “(…) the alhóndigas and the alfondechs, or fondacos in Italian States, as an evolution of the Andalusian funduq, continued and adapted the functionality of these Islamic constructions in the context of Christian cities” [9] (p. 239). This adaptation of the Islamic funduq to the Christian commercial world of the peninsula also influenced the medieval Mediterranean commercial structure, giving rise to the appearance of the fondachi.
They all have in common a substantially rectangular floor plan, which could have one or two floors, and which has in its centre an open courtyard, normally surrounded by an arcade. An Islamic funduq was recently found and excavated in Valencia, on Corregería Street, which clearly shows a type of floor plan common to other Christian buildings of the same use [10] (pp. 41–60).
Few buildings of this type, so old, have survived the passage of time: “The only Arab alhóndiga preserved in Spain al-funduq is the one in Granada: “El Corral del Carbon” [11] (p. 36).
One of the goals of this paper is to investigate the history and evolution of this historic building. To carry out the research, historical archival and cartographic material from Valencia was used.
Additionally, to support this historical research, various geomatics techniques were employed to provide a geometric survey of the building in its current form. In particular, terrestrial laser scanning (TLS) and close-range photogrammetry from digital cameras were used, since these methods represent an established, effective, and efficient approach for the 3D metric documentation of built heritage [12].
However, one of the objectives of this research was not only to document the geometry and visible radiometry of the studied building using the aforementioned techniques but also to provide support for historical interpretation through the use of thermal images. In fact, the acquisition and use of TIR imagery for diagnostic purposes represent a well-established and non-invasive investigative method [13]. This approach allows for the assessment of a building’s condition without resorting to destructive techniques, which are unsustainable given the intrinsic fragility of historical buildings that are part of cultural heritage.
In this regard, numerous researchers working not only in the field of 3D sensing but also in the areas of conservation and enhancement of cultural heritage are focusing their efforts on developing contactless techniques that do not risk damaging the buildings being analysed [14]. In this direction—towards the sustainability of 3D metric surveying applied to historical buildings—thermography represents an extremely valuable tool. The possibility of acquiring images in non-visible ranges of the electromagnetic spectrum, specifically in the thermal infrared range, allows for the detection of anomalies that can effectively support the work of restorers, conservators and historians [15]. Specifically, thermography can be used not only for diagnostic purposes but also to support investigative studies aimed at interpreting historical structures, providing a contactless tool for identifying features or structures that are not visible within the visible range of the electromagnetic spectrum, thereby aiding in the interpretation of these historical buildings [16].
However, a potential limitation of this technique lies in the fact that, traditionally, thermography is applied to individual images, which are subject to geometric and perspective distortions. As a result, it becomes impossible to obtain precise measurements, quantify the extent of anomalies or accurately position these anomalies within a 3D reference system. For this reason, in recent years, several studies have focused on establishing a spatial connection between thermal information and 3D models derived from LiDAR techniques or digital photogrammetry, with the aim of making thermal images metrically measurable and providing the possibility of deriving 3D information from them as well. Some of the most commonly used methods include homographic transformations and single image rectification [17], the generation of thermal textures based on the projection of the TIR images onto a 3D surface model [18] or the use of digital photogrammetry with SfM (Structure from Motion) algorithms [19]. These strategies allow for the spatialization of thermal information, enhancing the effectiveness of the investigations: for this reason, based on the 3D data previously acquired, in the case of the present research, an additional survey was integrated using a thermal camera capable of capturing thermal-infrared images, thus providing non-visible information useful for analysing the presence of thermal anomalies, which can support historical research and analyses and the investigation and interpretation of the building’s construction evolution. The thermal images were integrated into the previously conducted 3D metric survey through 3D co-registration strategies from a data fusion perspective, allowing these anomalies to be assessed not only qualitatively but also quantitatively for 3D metric purposes. The preliminary results of this experimentation were published in Patrucco et al. (2022) [20], where an in-depth comparison of different 3D co-registration strategies for thermal data was proposed, as well as the potential of this type of information managed in an HBIM environment to support historical analyses.

Contextualization

In Valencia, since the Middle Ages, the supply of cereals was in the hands of the City Council, which imposed taxes and delegated the administration of wheat to the juries [21] (p. 55). All taxes on cereals were collected in the Almudín, where the grains were sold. “Outside the Almudín, wheat and other grains could not be sold, either in private homes or in shops” [21] (p. 62). This monopoly, on the part of the city, is not only explained by the equitable distribution of grain and flour but also by the fact that the medieval Valencian tax system was based on excise taxes or taxes on basic foodstuffs such as wheat, meat or fish.
To meet their expenses, in addition to the collection of taxes, which by royal concession taxed a product and were paid directly by the population, there were the so-called “own” and “communal” assets. By “own” was meant the inalienable real estate assets of the city, that is, the shops, bakeries, granaries, markets, lands, mills, etc. Due to the Aragonese custom of Empriu, since the Christian conquest, the places, rivers, coasts, etc. did not depend on the city council; they were reserved by King James I as royal property, but he left the perpetual right of exploitation to the people of those places [22] (p. 183). For this reason, the city council of Valencia “(…) never had a large number of own properties, the income produced by these properties being scarce” [23] (p. 552). Due to this lack of “communal assets” and the scarcity of “own” assets, it was necessary that “(…) the mu-nicipal income be completed with an increasing number of taxes and contributions which, despite their temporary nature, could not be dispensed with” [23] (p. 554). The form of credit par excellence, since the Middle Ages, was the “census”, also called “censales” in Aragon. The protagonists of the “census” were the “censalista” who lent the money and the “censatario” (in this case, the city council of Valencia), who received it and pledged his assets for the payment of the annual rents, called “pensions”.
On the other hand, and due to its high population, the kingdom of Valencia could not produce wheat for all its inhabitants, not even for those of the city, and this had to be imported on a large scale. Since the Christian Middle Ages, imports were usually made by sea, mainly from Sicily and later from Sardinia and the Kingdom of Naples, territories with large extensions of cereal and states of the Crown of Aragon [24] (p. 18). The wheat received by this route was stored in the Atarazanas or medieval shipyards of Grao (walled towns in the ports, near the cities, for the kingdom of Valencia) (Figure 4), which were used for ship repairs and storage.
Since the 16th century, after the unification of the peninsular kingdoms, if the grain arrived from the interior, it was stored in the large Silos or wheat warehouses of Burjassot (1573–1600) (Figure 5), which had a storage capacity of 45,000 Hl. If it could not contain it all, the wheat was distributed among several premises that the city council owned for this purpose, within the city walls (the old theatre of La Balda, La Baldeta, La Senia, La Redonda, Les Reixetes and Los Gigantes), waiting to be transported to the Almudín [25].
In the Almudín of Valencia, the necessary personnel were available to carry out a regulated and supervised sale [26] (p. 147) (Figure 6).
The city council scrupulously arranged the sales process and all the excise taxes that were deducted from the wheat, as well as from other essential products. After the wheat was stored in the building each day, the buyers, normally belonging to the millers’ guild, made their orders from a porch that existed at the door of the Almudín, facing the street of the same name. They were not allowed inside so that they would not meet municipal workers (renewed every year) and so that agreements that would lead to fraud would not occur.
The Almudín staff was made up of “(...) the notaries in charge of making the delivery notes for retail sales and the person in charge of the stamp -bolleta del colp-, who had to carry the delivery notes for the milling, there were also the measurers and sifters, who, together with the guards of the Almudín, were elected annually for the month of June” [26] (p. 147). The entire process was supervised by the Mustaçaf of the city of Valencia, who was the municipal official elected annually, in charge of enforcing the provisions of the Consell in matters of supply, hygiene, urban planning, industry and commerce.
After the purchase, its owners transported it to outside the walls, since no mill could exist within the walled enclosure. Those who carried wheat from the Almudín could not leave through the gates; they had to go through one of the four large doors of the city. These were equipped with two scales each, where the wheat was weighed again and compared with what was written on the delivery notes. Outside the city, the wheat was taken to one of the mills that existed outside the city walls and was transformed into flour. They entered the city again through one of the four authorized doors, where the weighing and control process was repeated, this time for the flour, and the load was sent to the flour-weighing house. The main mission of the flour-weighing house was to collaborate with the Almudín, to avoid fraud and to avoid not paying the corresponding taxes or “excises” imposed by the Valencia city council.
According to Marco Antonio de Orellana [1] (p. 115), all the purchase operations carried out within the mill were recorded in duplicate by the notaries, in a “book” and in the “book of the book” which contained a list of all the millers in the city. The delivery notes issued previously in the Almudín were required, and it was verified that the loss in weight, due to the loss of bark, grinding, etc., complied with the prescriptions of the Valencia City Council. If the miller did not comply with this ordinance, he had to add, from his own pocket, the necessary amount of flour to comply with the municipal ordinance.
“Their work must have been hard, especially in the months of October to February, because the Consell was very committed to ensuring that this service was well attended to, so much so that it went so far as to order that the weighers and clerks of the flour weight remained at their posts from dawn until prayer, taking turns to go to eat, under penalty of loss of salary. After the first prayer of the Ave Maria is played, no sack may be weighed (…). (…) that at night no sack of wheat or flour may be left inside the place where the Weight is located, fining the miller or muleteer who leaves it” [1] (pp. 114–115).
With the dynastic change and the decree of Nueva Planta, which abolished the laws and rights of the Crown of Aragon, the fiscal situation changed substantially. Philip V “(…) resolved to end the old Aragonese political customs as punishment for their infidelity during the war. Thus, (…) he extended the laws of Castile to the kingdoms of Aragon and Valencia, by Royal Decree of 29 June 1707, (…) and established the creation of a Chancellery for each territory” [27] (p. 17). The new king intended that all his kingdoms and towns should be governed without differences, and he applied Castilian laws to the entire territory; the new highest control body would be the Council of Castile.
The new fiscal measures, for the town councils, consisted of the establishment of taxes on the income from “own” and “communal” municipal property. This brought with it a “considerable decrease in their coffers in favour of the economic needs of the Council, causing sales and a decrease in municipal property in the last years of the Ancien Régime” [23] (p. 544). When the new law was applied, buildings intended for municipal public functions and those whose income was “own” were defined as “own” [22] (p. 187). As the Valencia City Council had very few “own assets”, this forced it to sell part of the municipal assets or property to pay the “census”.
At the arrival of the first constitutional corporation, which arose from the revolution in the summer of 1835, the Valencia City Council was financially exhausted. Such a large fiscal effort had been made in the war against England, and the subsequent French invasion (1808–1814), that the communal funds, in relation to municipal assets and taxes, did not produce sufficient income to alleviate the large debt incurred during the war period.
Finally, the creditors of the census organised themselves and, at the beginning of 1835, filed a lawsuit against the Valencia City Council, proposing the summary execution of the “own” municipal assets to settle the debt. There was a precedent, since previously, on 19 January 1801, the Council of Castile had authorized the city to sell its property, not all of which was sold.
After a long process (1835–1846), the court’s ruling prescribed the payment of 3 million reales, the amount of nine pensions owed (from 1814 to 1823) [28] (p. 54). If this amount was not paid, the debtors of the censused were ordered to seize and auction off the city’s “own” property, which was what had to be done. Among the properties that were finally sold was the “house of the weight of flour”, which is reported by the Marquis of Cruilles in his Guía Urbana de Valencia Antigua y Moderna [6] (p. 60). It was put up for auction with a rental value of 0.00 reales; a rate of 400 reales and a price of 66,220 reales were reached, and it was bought by Lamberto Teruel, on behalf of Santiago García. This was because Santiago García “(…) was a councillor of the Valencia city council –and provincial deputy- in the years when he admonished the council, announcing the auctions” [28] (p. 56). The “new flour weighing house” had operated, going through various extensions, from 1517 to 1863, until it passed into private hands. Since then, in Valencia, the building located at 1 Almudín Street has been known as the Palace of the Marquise of Colomina (Figure 7).

2. Materials and Methods

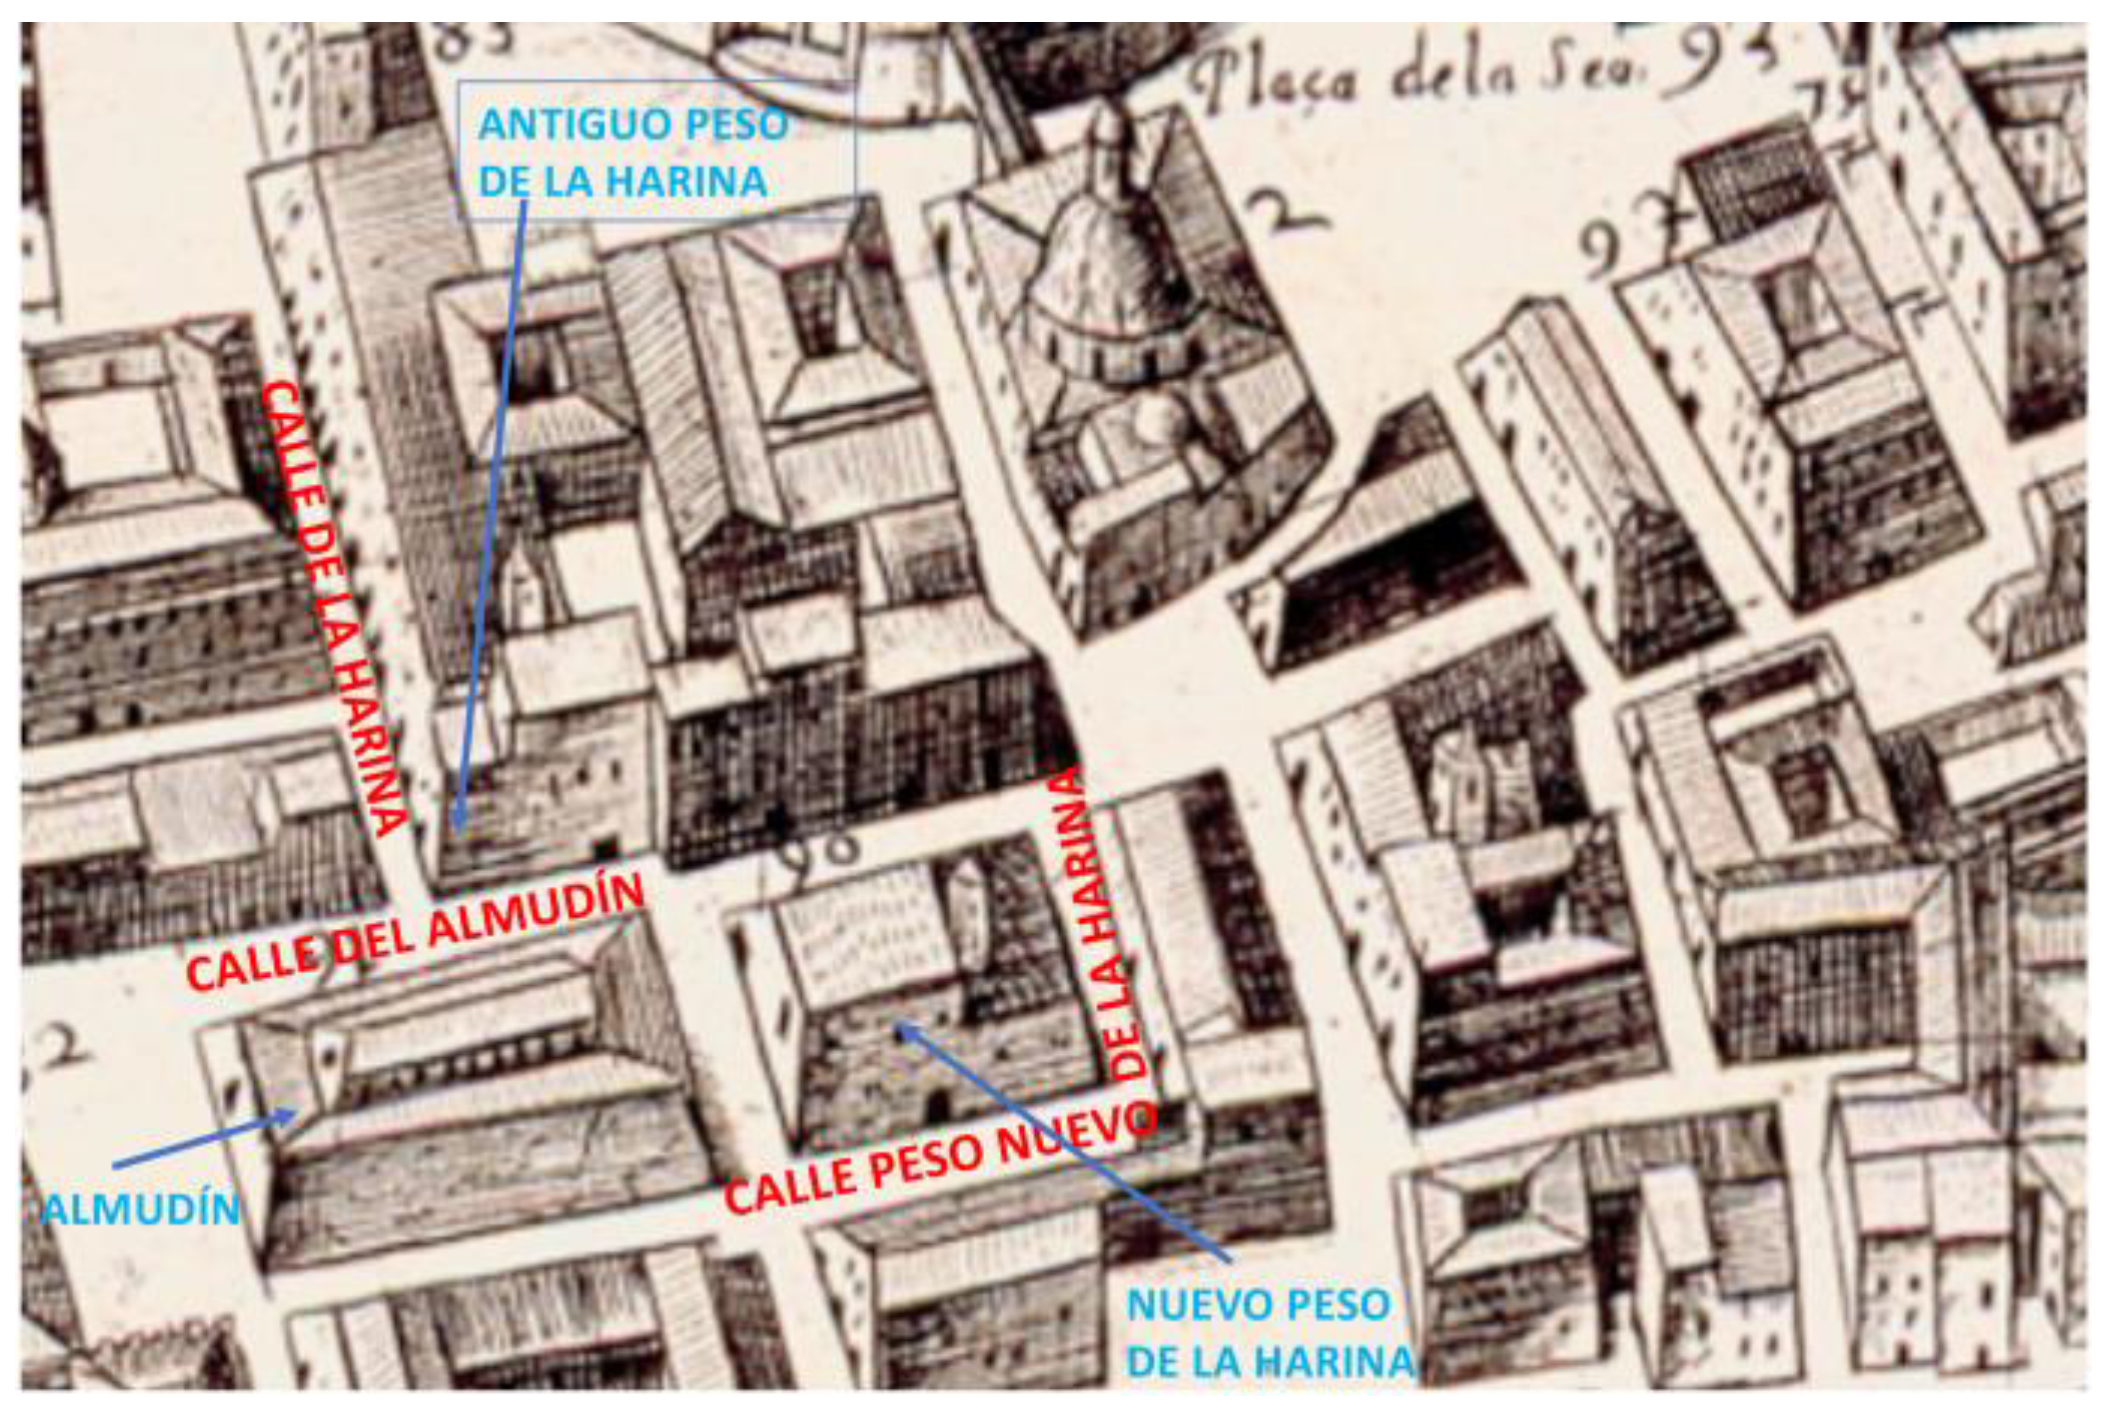
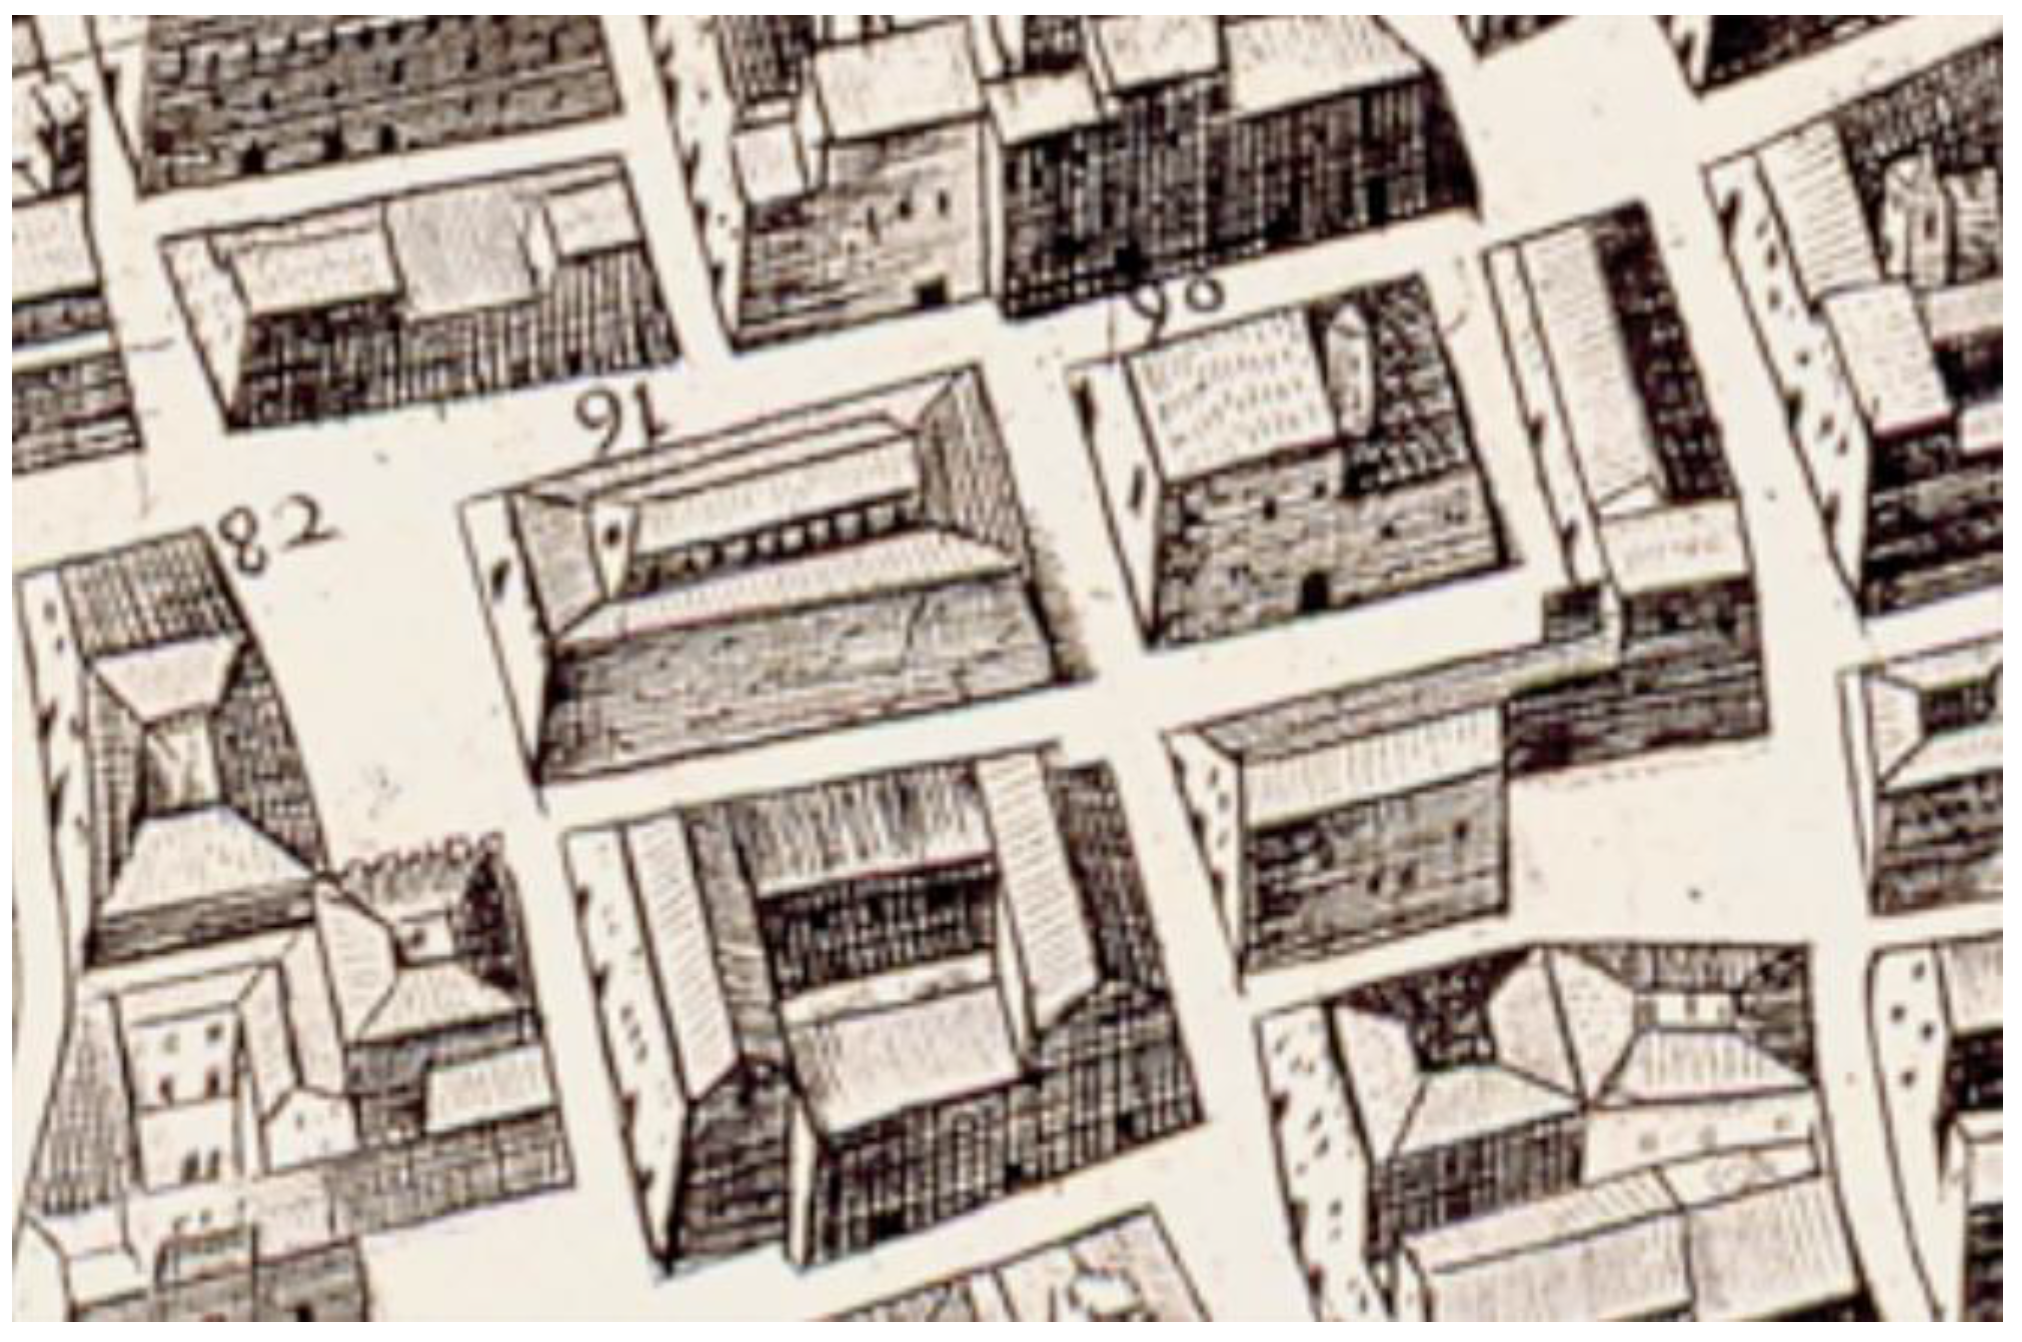
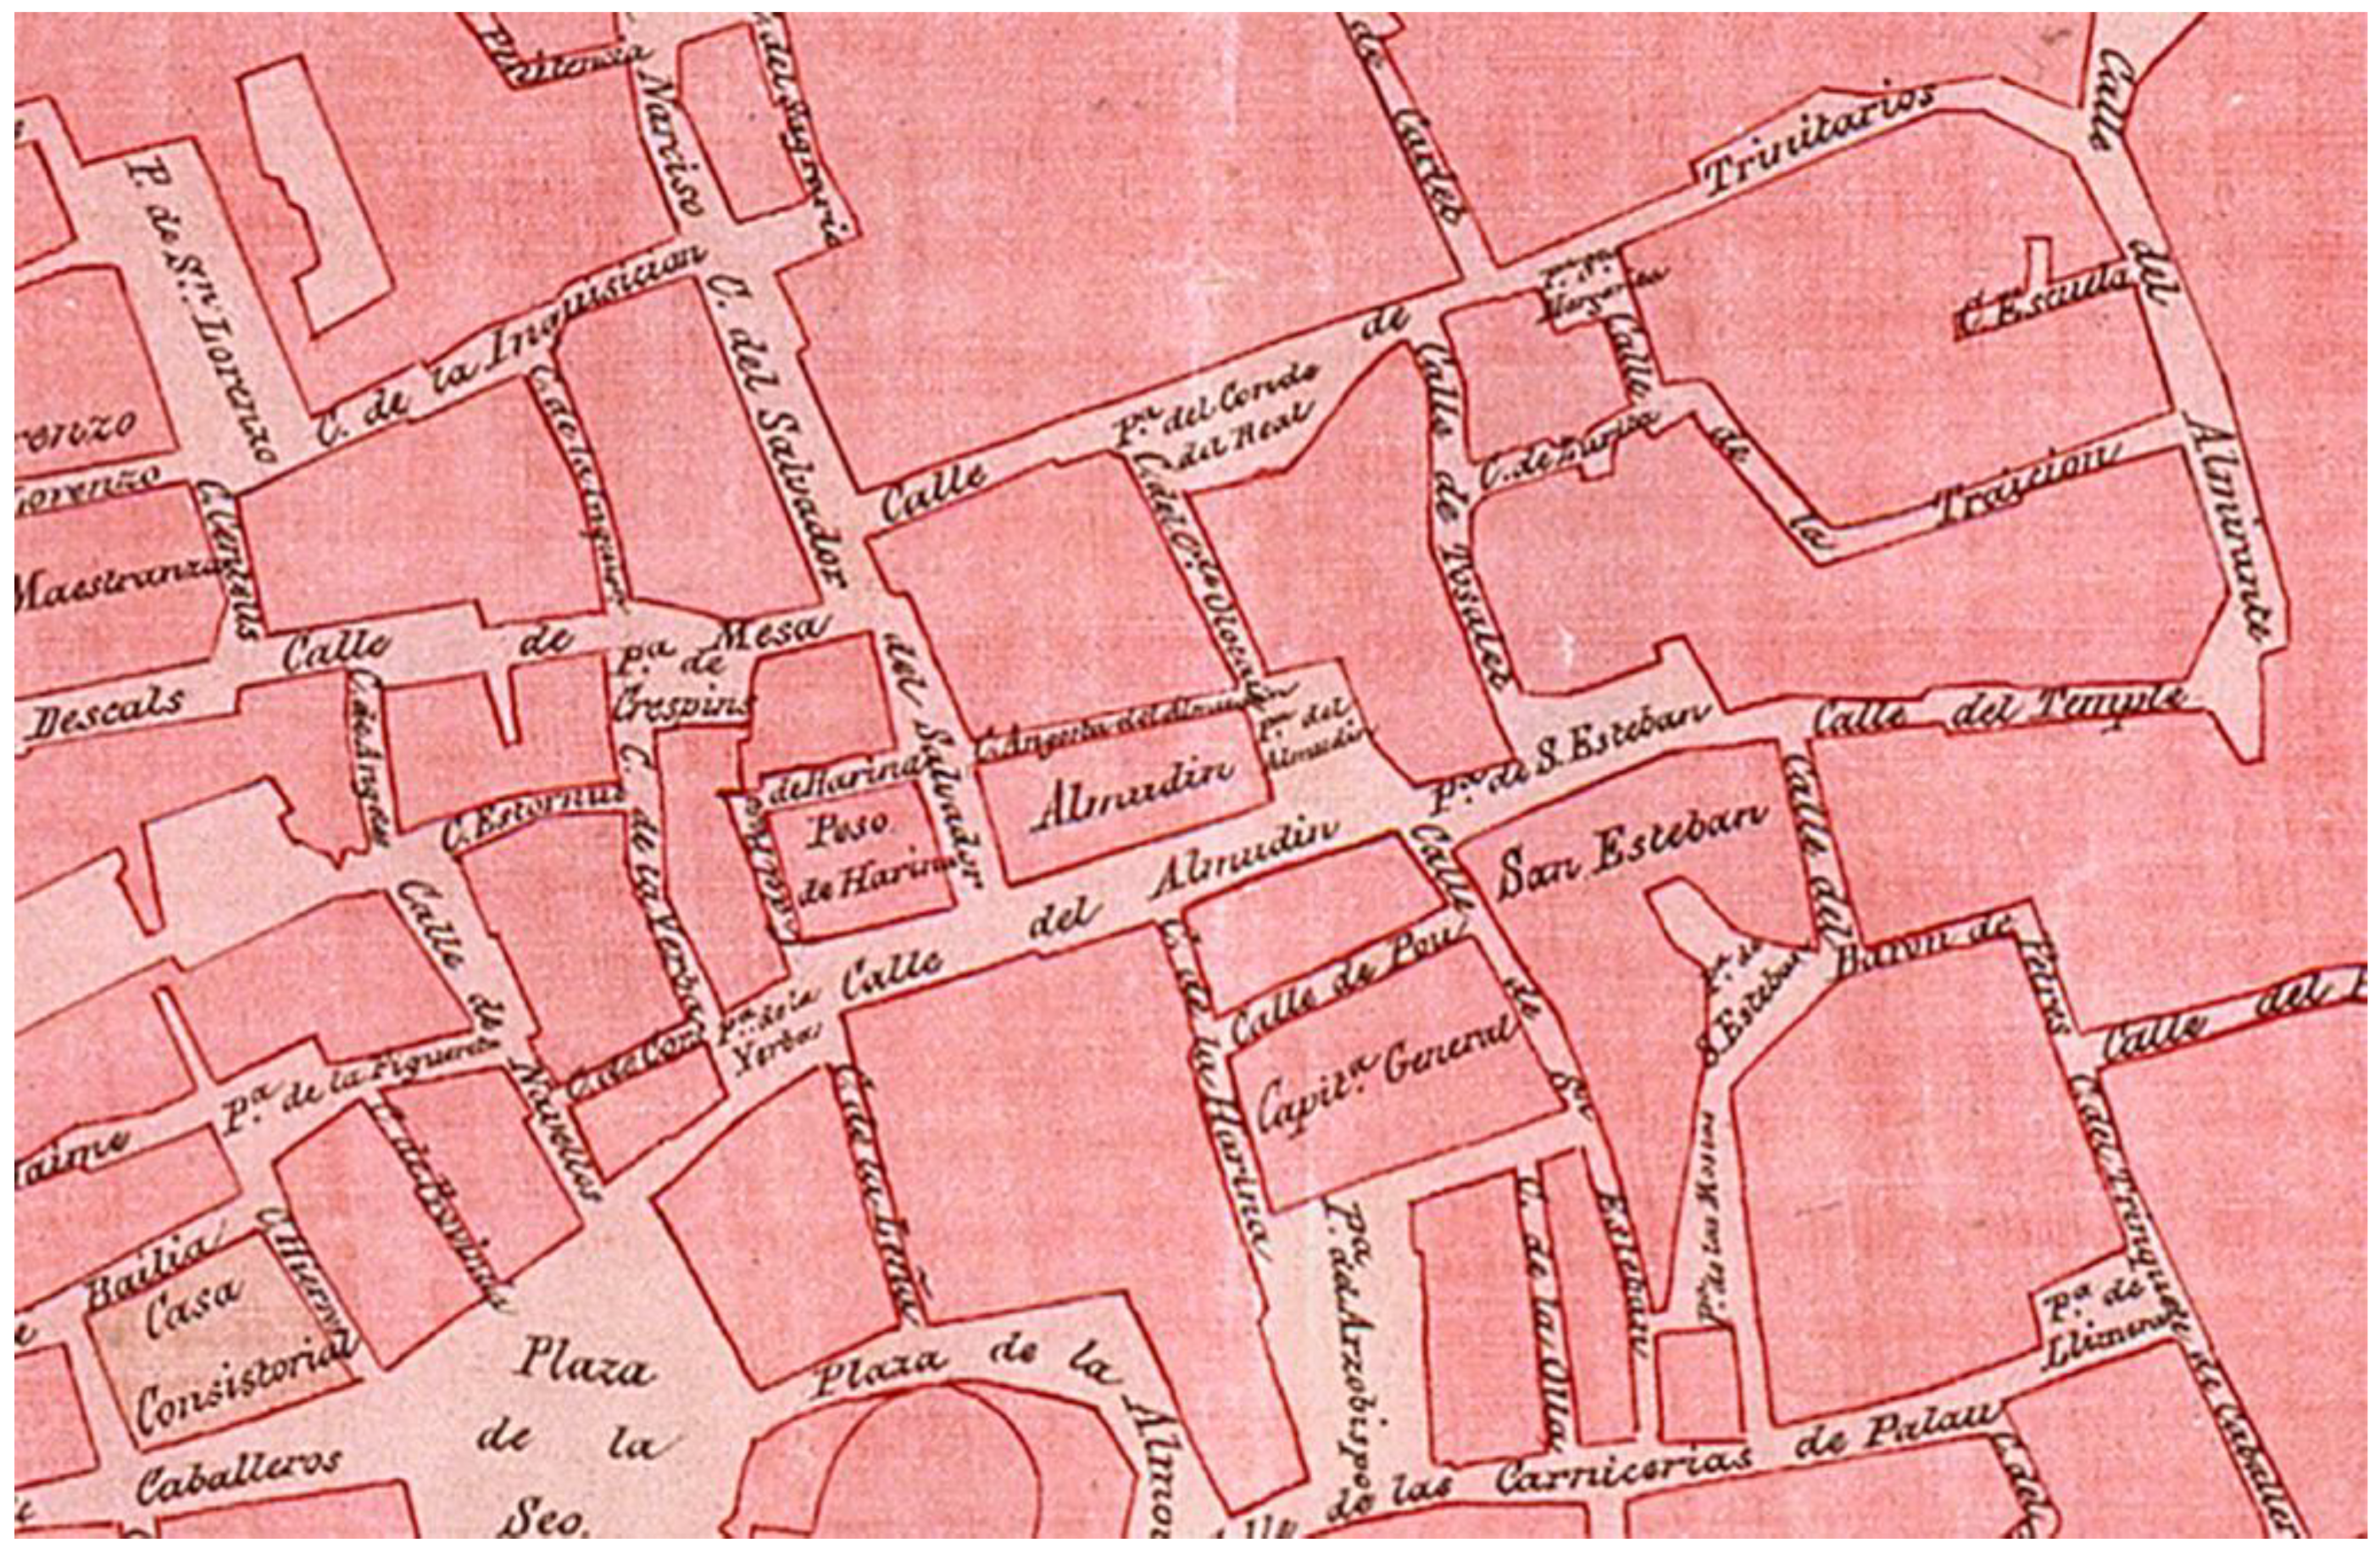
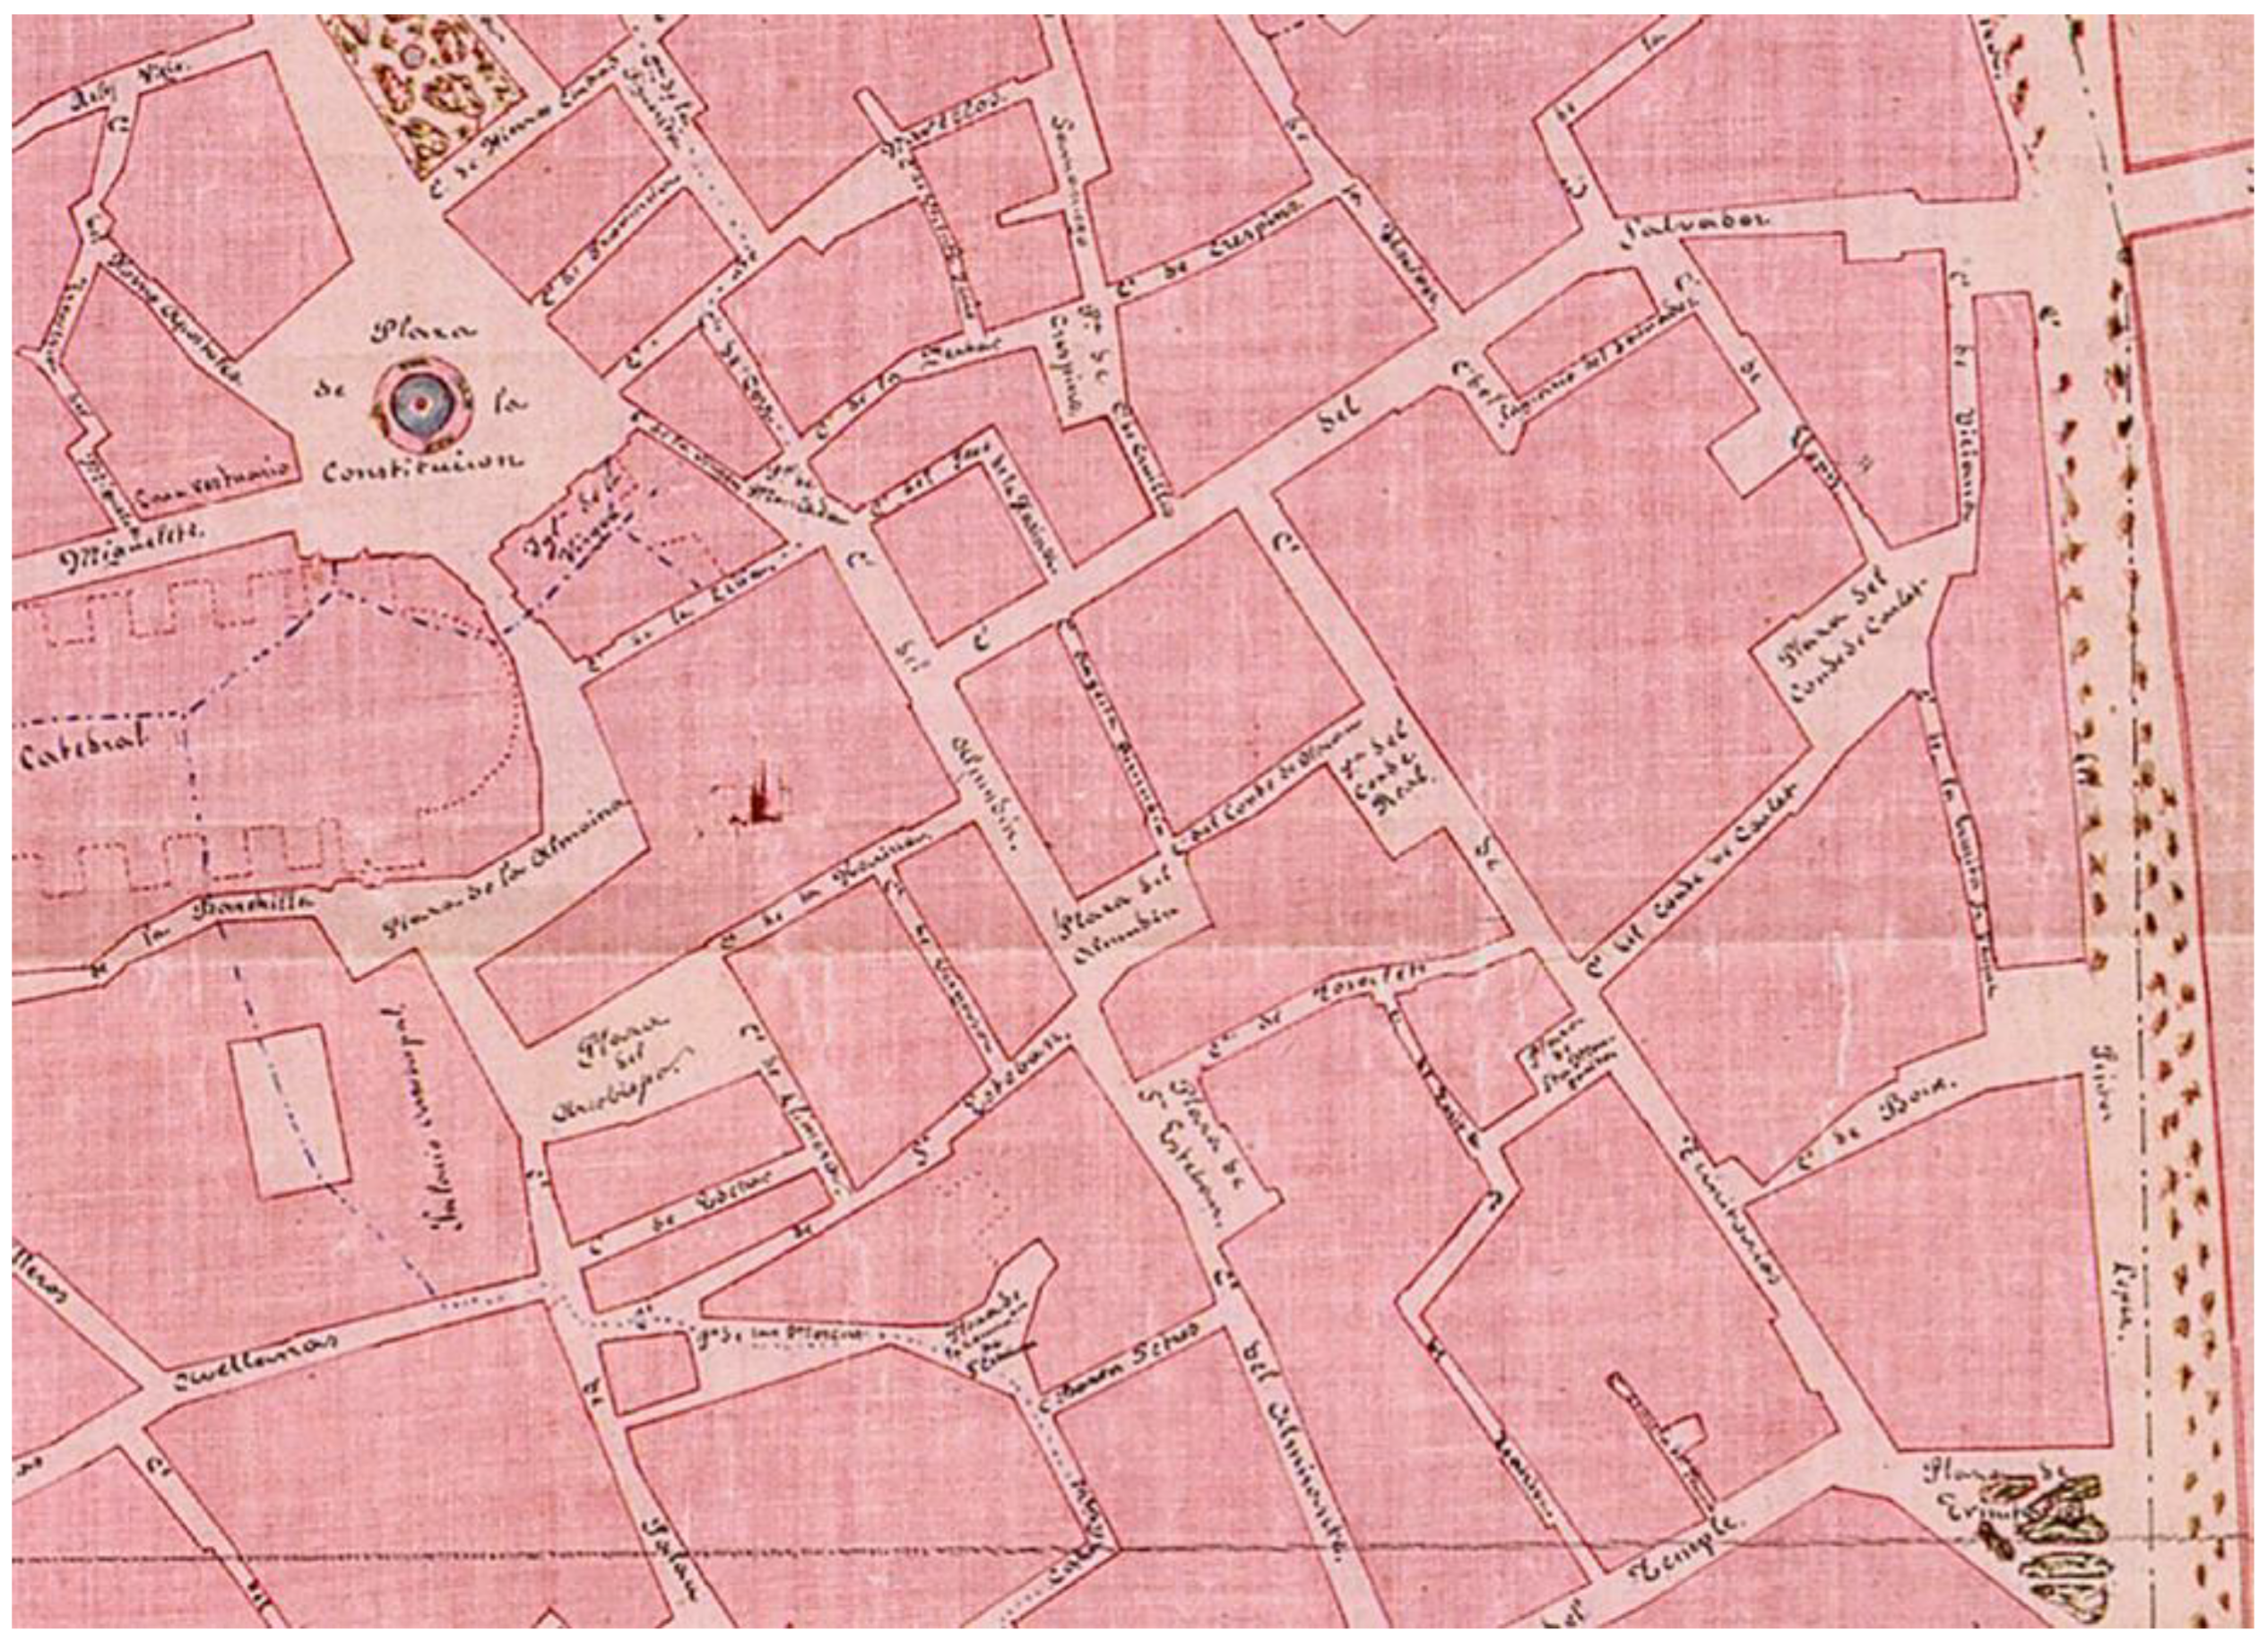
2.1. Historical Cartography

The continuous location of the flour-weighing house at 1 Almudín Street can be identified in all historical Valencian maps, from 1608 (Figure 8), with number 95, to the present day [29].
If the map drawn by Vicente Tosca in 1704 (Figure 9) is considered a base map, with number 95, it is possible to identify the building completed in 1594. At this time, the east façade of the building (facing Salvador Street) was shorter than the west façade of the Almudín, a fact that is reproduced in Tosca’s map, engraved by J. Fortea in 1738, with number 90 (Figure 10).
In the following map of the city drawn up in 1811 and in all subsequent maps up to 1883, it can be seen how the alignment of the northern façade of the Almudín has been projected onto the plot studied and has been extended, occupying part of the northern side of the street of the weight of the flour.
The land had also grown towards the north on that date, after the privatisation of the building, until acquiring its current size. The permanence of medieval use on that same site is evident on all maps up to the one corresponding to 1869, drawn by the Army Corps of Engineers (Figure 11); the block, as a large municipal facility, is clearly identified as “Casa del peso de la harina”, while, from the 1883 (Figure 12) map, drawn by the army general staff corps, any legend disappears. Also, thanks to historical maps, the block grew towards the north side of the flour-weighing street.

2.2. Municipal Historical Records

2.2.1. Municipal Historical Archive of Valencia

In the Municipal Historical Archive of Valencia, there is a file from the Urban Police referring to the flour-weighing house [30]. It was urged by Santiago García, and in it, he requested a license for reforming his property, based on a project by the master builder Manuel Ferrando. The file contains two proposals. The first is a request for a license dated 4 June 1863, where Ferrando presented the four façades, with a height of two floors that would be extended with a basement, which would not increase the maximum historical height of the flour-weighing house (Figure 13).
The municipal response was to suggest that he add one more floor [30]. Following the municipal suggestion, in August 1863, Manuel Ferrando presented a second proposal with three floors and no basement, this time faithful to the one that was built (Figure 14). As for the study of its floor plan and distribution data, they are non-existent since only façades are presented.

2.2.2. Intermediate Archive of Valencia City Council

This is a rehabilitation project for the Colomina palace, commissioned by the CEU San Pablo to the architect Francisco Esquembre Casañ, dated May 1995 [31]. After having inspected the building, in his descriptive report, the architect states that from 1863 until 1906 various minor interventions by Manuel Ferrando are noted. From that date onwards, the following documented interventions, all of them also minor, were carried out for the same property by other master builders (14 October 1913): Manuel García for the replacement of 7 joists, and on 21 July 1919, Ricardo Cerdá taking the downpipes back to their original position to clean up dampness [31] (p. 13). Actions are also detected in the 1940s and 1950s of the 20th century, the last being documented in 1980.
The 1995 project provides invaluable information in several of its plans, where there are indications that there was once a good-sized courtyard (Figure 15). Esquembre also observed “On the ground floor there are two interior walls that, due to their strength, must have had a load-bearing or dividing wall function in the original layout of the building (prior to 1863) and that currently act as mere partition elements on that ground floor” [31] (p. 9). From this description, it could be deduced that the “new flour weighing house” could have been articulated by a courtyard to illuminate, ventilate and place the carts and horses. These walls that can be seen in the plan are orthogonal to each other and parallel to the façades, seeming to delimit an open space. The courtyard, in a central position, refers us to a type of typology that was highly developed during the Middle Ages, which would belong to the family of almudines, caravanserais, etc.

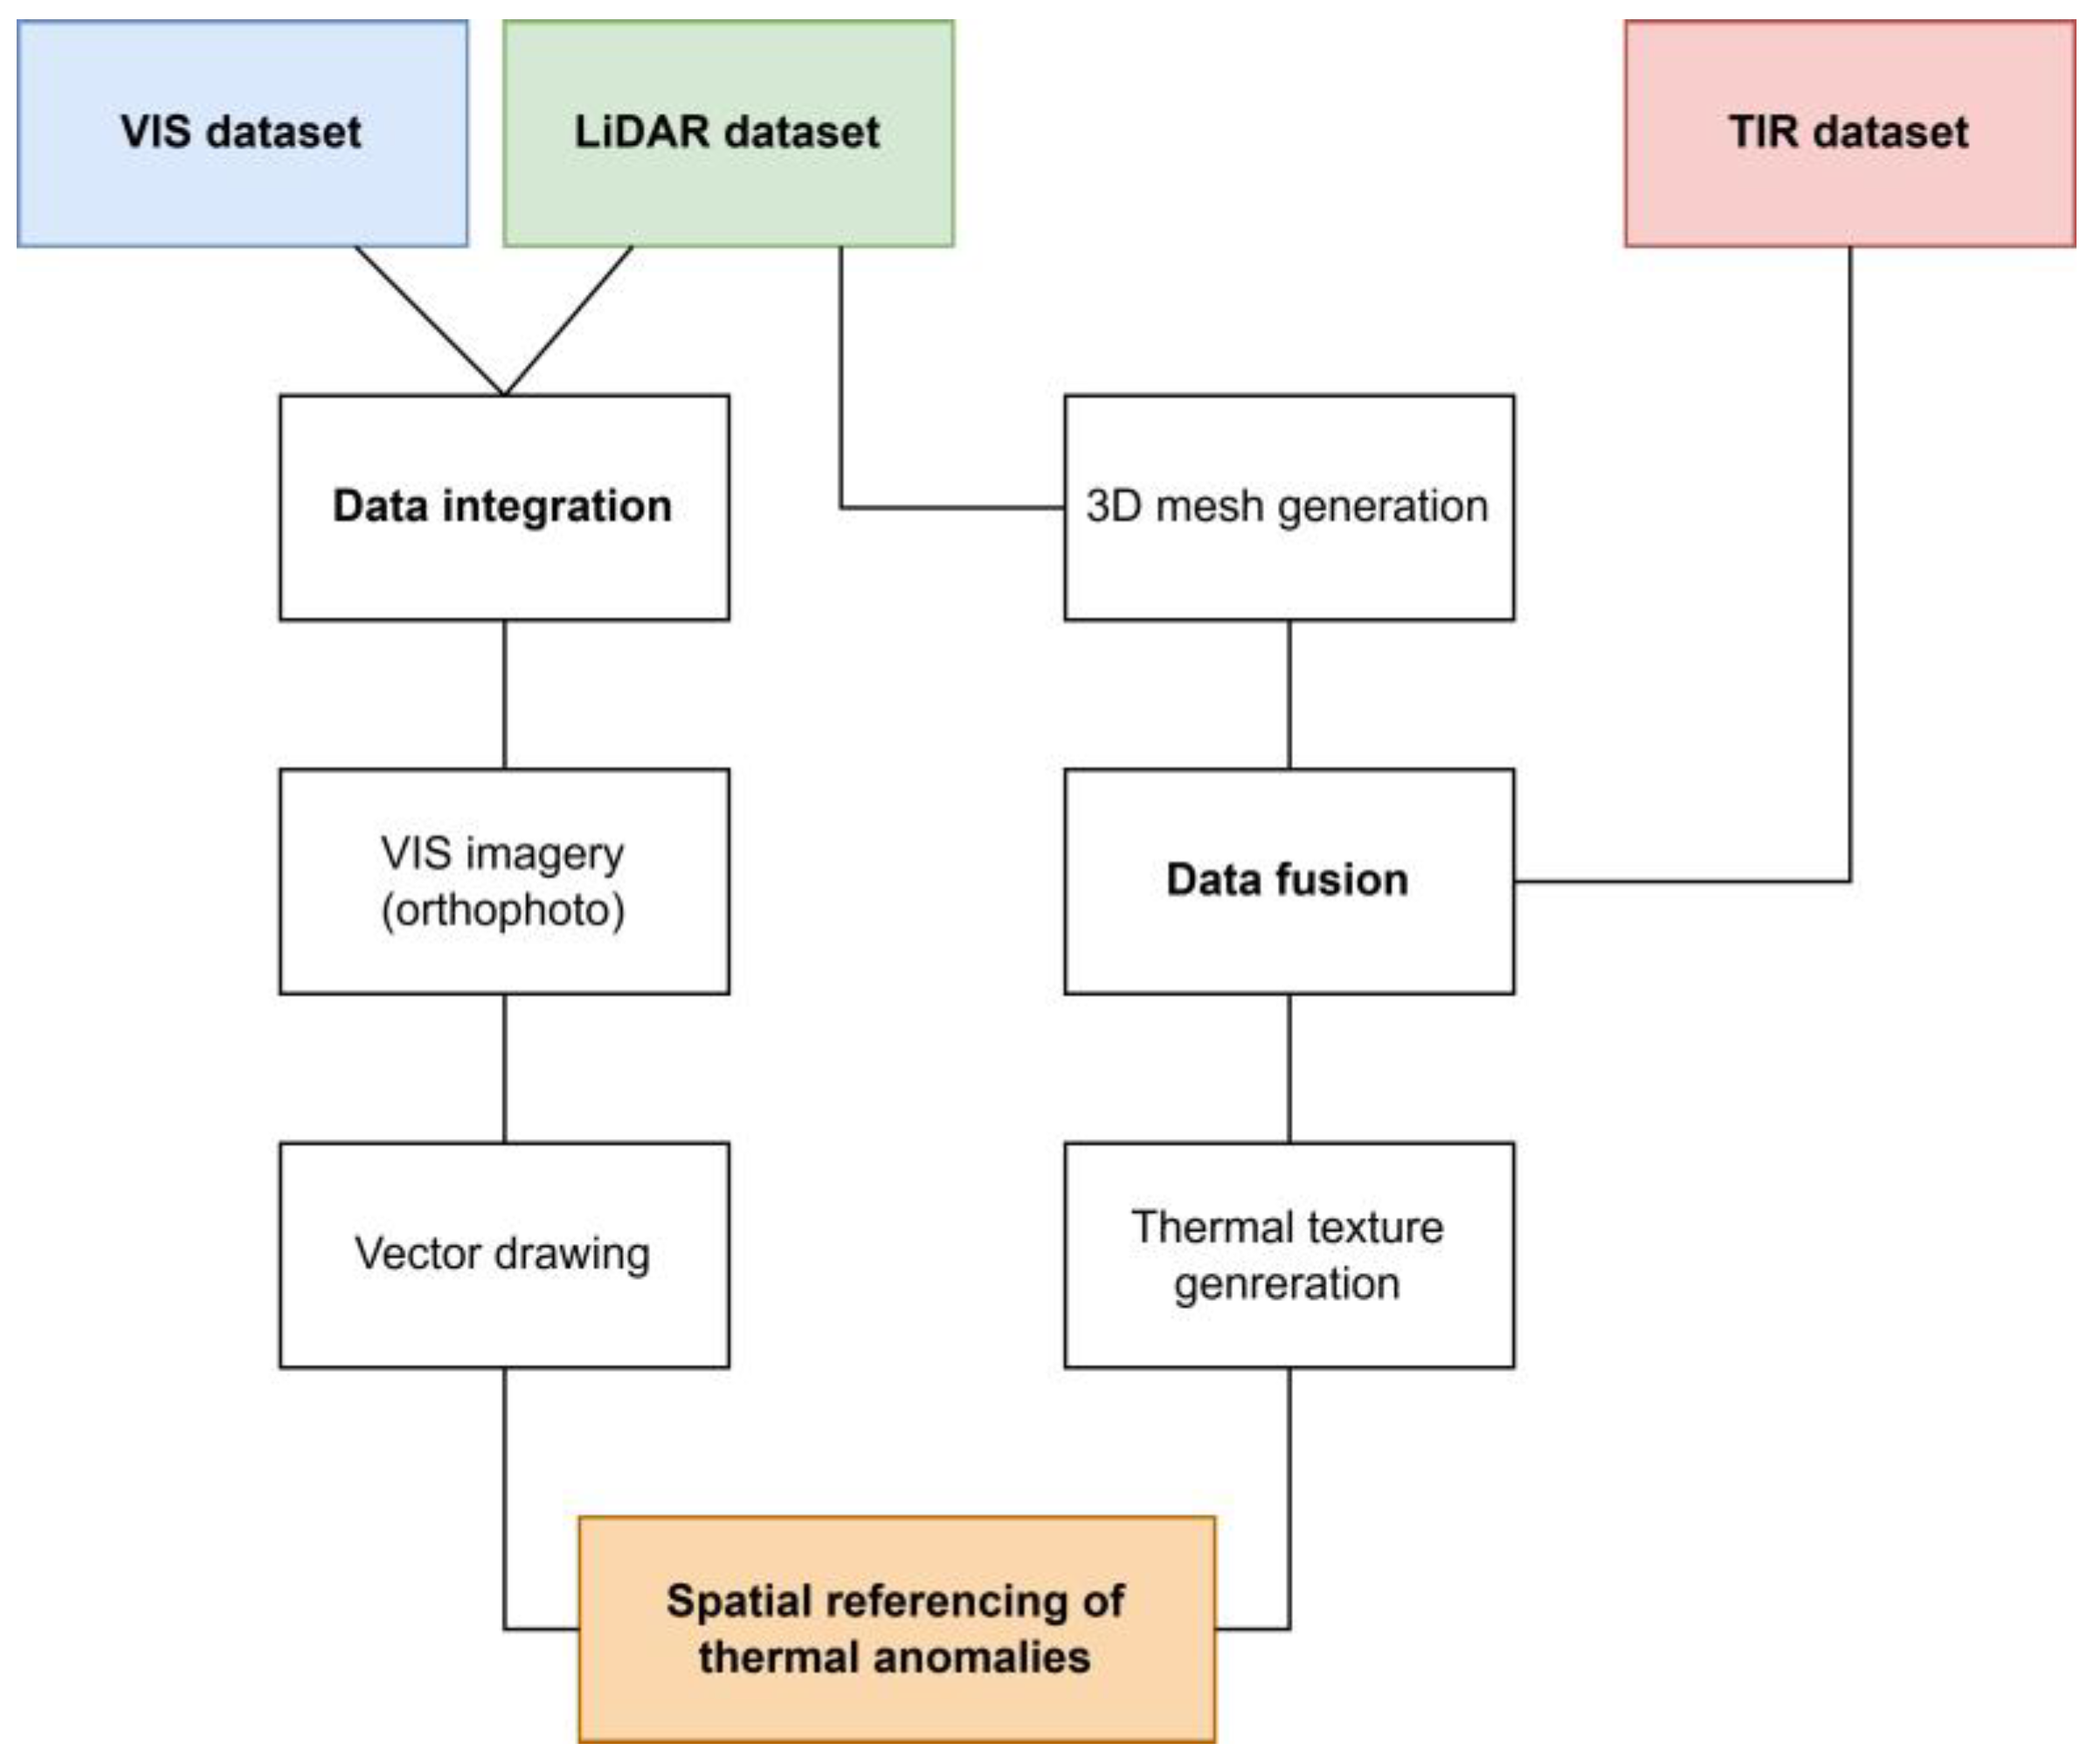
2.3. Multi-Sensor Integrated 3D Metric Survey

In recent years, the role of geomatics has been increasingly consolidated with regard to the significant contribution it provides to researchers working in the field of built heritage. In particular, a clear trend has emerged involving the execution of multi-scale and multi-sensor 3D metric surveys, with the goal of providing the most complete and reliable documentation possible of historical buildings that are part of our legacy, with a specific focus on the sustainability of these documentation activities [32,33]. The integration of different 3D sensing techniques, particularly range-based and image-based techniques, has now become an established practice that allows for the generation of dense and accurate 3D models [34], successfully supporting historical analyses and reconstructive hypotheses at various levels, as in the case of this paper. A significant aspect that should be emphasised, contributing to the sustainability of these metric survey operations, is the fact that these techniques (LiDAR, digital photogrammetry, etc.) are contactless and non-destructive approaches and therefore represent preferred techniques for the documentation of heritage assets which are intrinsically fragile and require tailored methods for being properly recorded.
Staying on the topic of non-destructive and contactless techniques, thermography has for many years been an effective and efficient solution for monitoring historic buildings, providing a powerful tool for those involved in non-destructive diagnostics [35]. The usefulness of this technique is undeniable, and it represents an established and respected approach within the scientific community focused on monitoring and diagnostics.
However, as previously underlined, thermal imagery has traditionally been used for visual inspections and through two-dimensional visualisations. To make the radiometric information derived from TIR (Thermal Infrared) images metrically measurable and referable to 3D models generated by the aforementioned 3D sensing techniques—specifically, TLS and digital photogrammetry—numerous research groups have developed and are developing new methods for integrating thermal images and high-resolution 3D models, primarily using photogrammetric approaches, achieving remarkable results [36,37,38].
Also, in the case of the presented research, a similar approach has been followed, with the aim of providing a base to support the historical analyses. For this reason, a 3D metric survey campaign was carried out in 2022 using an integrated multi-sensor approach, as extensively described in Patrucco et al. 2022 [20]. Namely, a TLS acquisition was performed, and the point clouds captured the geometries of the building of interest in its current state. Subsequently, a block of stereoscopic and convergent images (455) was acquired and co-registered with the TLS point cloud with the aim of providing high-resolution radiometry of the previously acquired TLS model. Finally, 308 thermal images were acquired to identify any thermal anomalies related to the different construction phases of the building in order to support the subsequent interpretive phase aimed at analysing historical maps and archival materials.
The acquisition of the primary data and the associated processing operations related to the spatial co-registration are described in the following sections. Figure 16 presents the schematic workflow adopted in this research to establish a spatial connection between the 3D geometry of the investigated object and the detected thermal anomalies in order to enhance their interpretation.

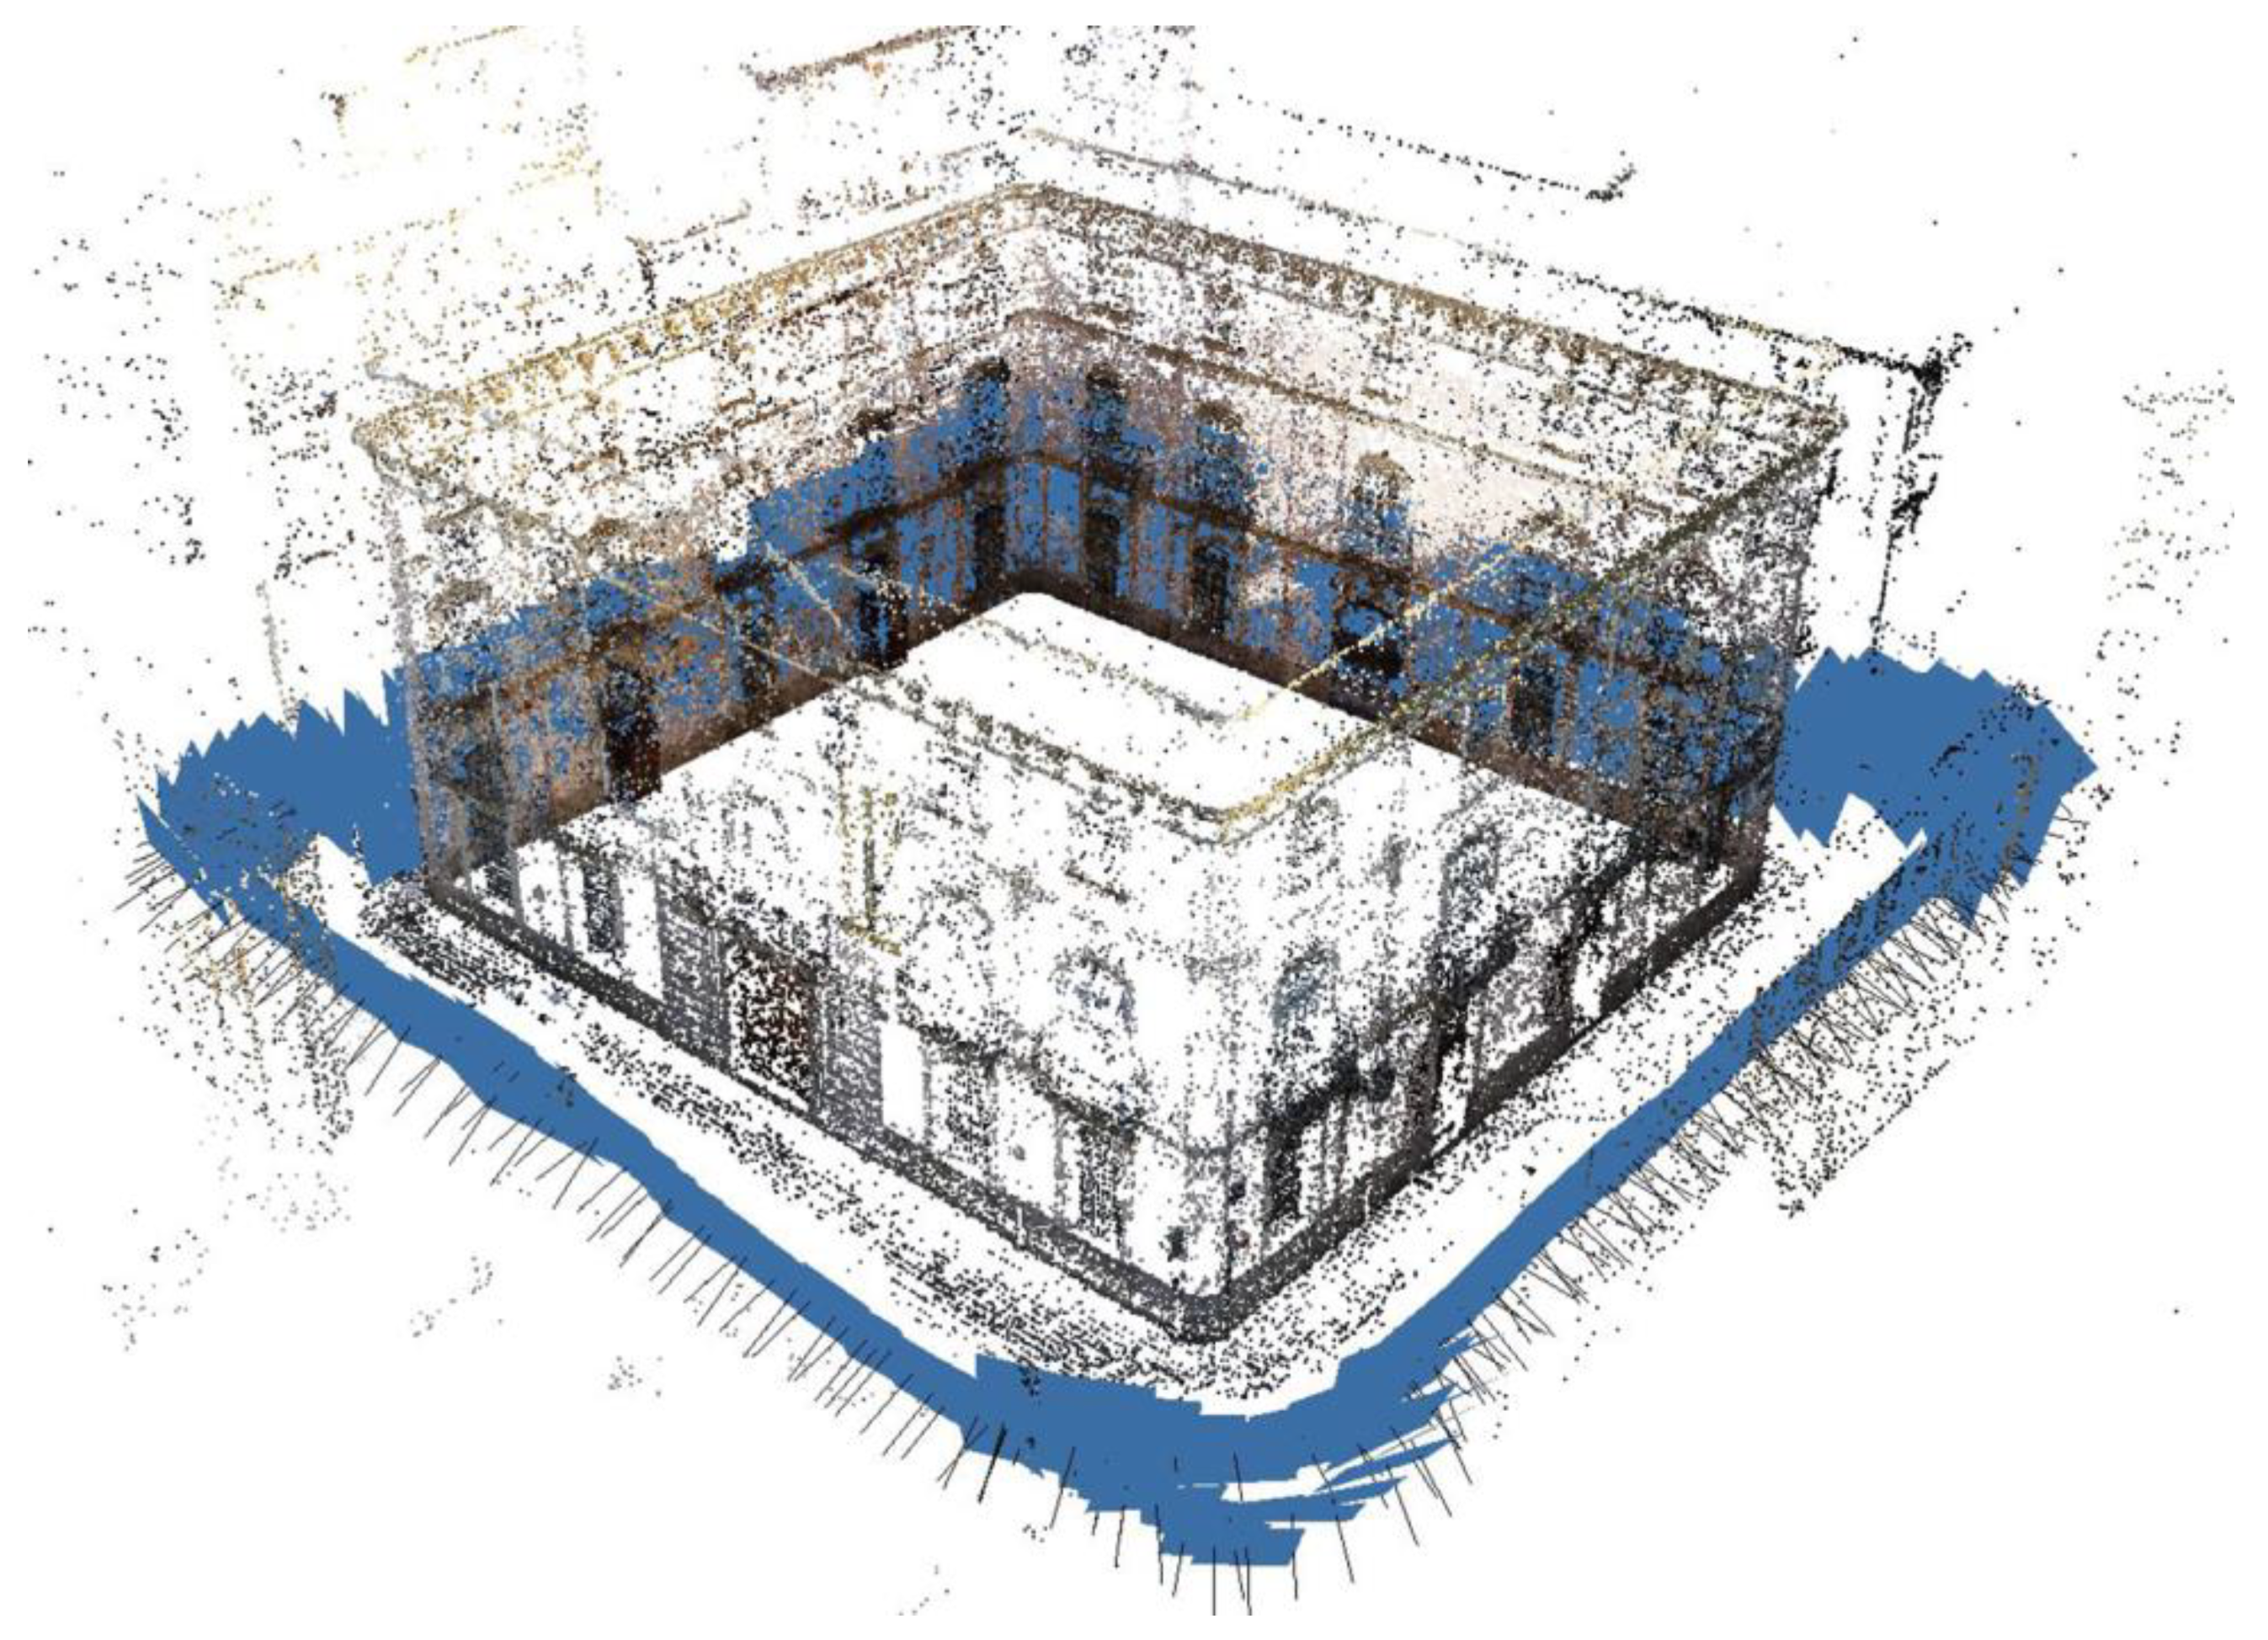
2.3.1. TLS and Digital Photogrammetry

In total, the building was surveyed through the acquisition of eight scans, which were collected while paying particular attention to ensure adequate overlap between adjacent scans aimed at facilitating the subsequent co-registration operations.
Additionally, a set of 455 was acquired with the aim of performing a photogrammetric reconstruction to provide a high-resolution texture to the TLS model. For this task, a full-frame high-resolution (Digital Single Lens Reflex (DSLR) camera was used (model: Canon EOS 5D Mark II). The average acquisition distance was 20 m, leading to an estimated ground sampling distance (GSD) of approximately 0.005 m.
The TLS scans were registered using the software Trimble RealWorks v. 11.3, exploiting an automatic plane-based algorithm which enables the merging of the eight point clouds. The following procedure allowed for reaching an average deviation between the adjacent scans lower than 0.002 m. After the optimisation and filtering process—carried out using the open-source software CloudCompare v. 2.11 Alpha—the final point cloud was composed of 60 million points (Figure 17).
The digital images were processed using the consolidated SfM-based software Agisoft Metashape v. 1.8.0, enabling the relative orientation and the generation of a sparse cloud of tie points (Figure 18). The absolute orientation of the photogrammetric block was performed using a set of points derived from the TLS point cloud, with the aim of co-registering the two datapoints. Natural points that could be easily and unambiguously identified were selected for this task (for example, edges, corners or points characterised by significant radiometric contrast compared to the surrounding ones due to a difference in terms of material). The Root Mean Square Error (RMSE) observed on the Ground Control Points (GCPs) and Check Points (CPs) at the end of this procedure was approximately 0.010 m.
Exploiting the fact that, at the end of these registration procedures, the TLS scans and the photogrammetric block are both aligned in the same local reference system, the TLS point cloud was textured using the oriented images. In fact, although the laser scanner is equipped with an integrated camera that, at the end of the scan, captures a set of digital images, allowing an RGB value to be associated with each collected point during the processing phase, the radiometric resolution of the photogrammetric data acquired using the DSLR camera sensor is significantly higher. In Figure 19, it is possible to observe the difference in terms of radiometry between the two textured point clouds.
Therefore, considering the accuracies achieved during the photogrammetric process (ca. 1 cm, which is consistent with the data resolution, since the GSD is approximately 5 mm) and the results obtained from the registration of the TLS point clouds, it is possible to observe that the model derived from the integration of the range-based approach and the image-based one can support architectural scale restitutions (1:50/1:100).

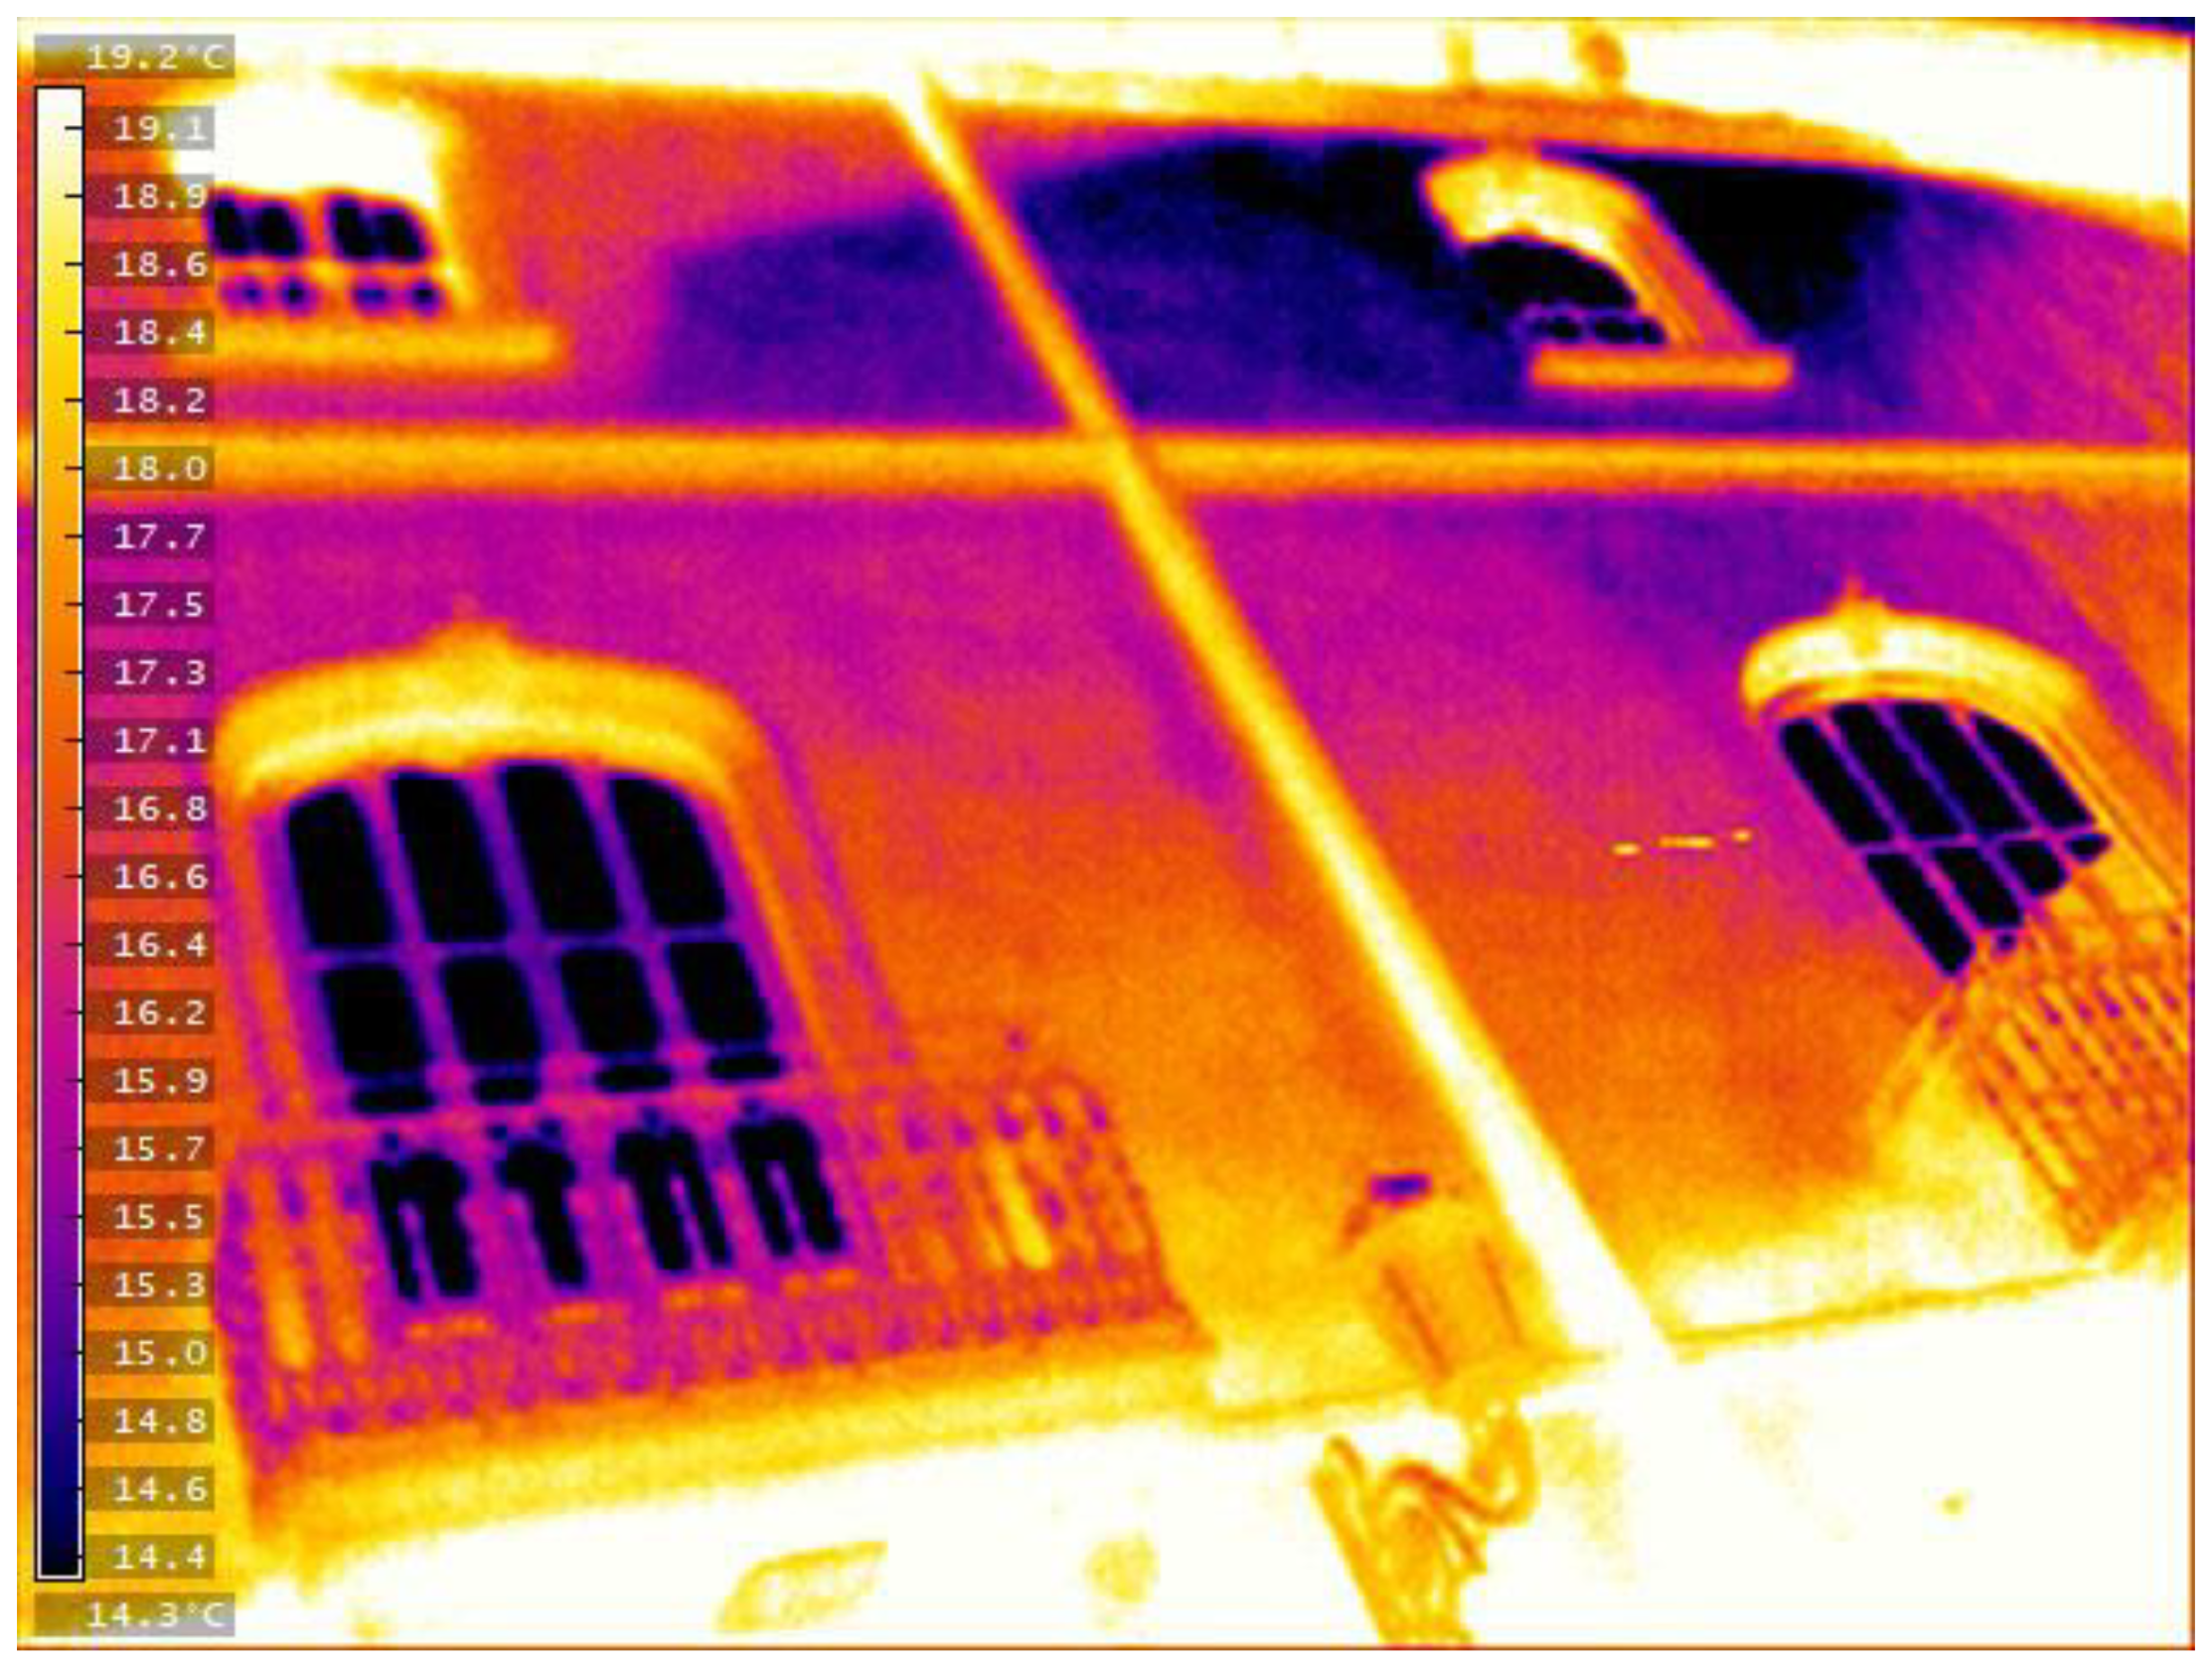
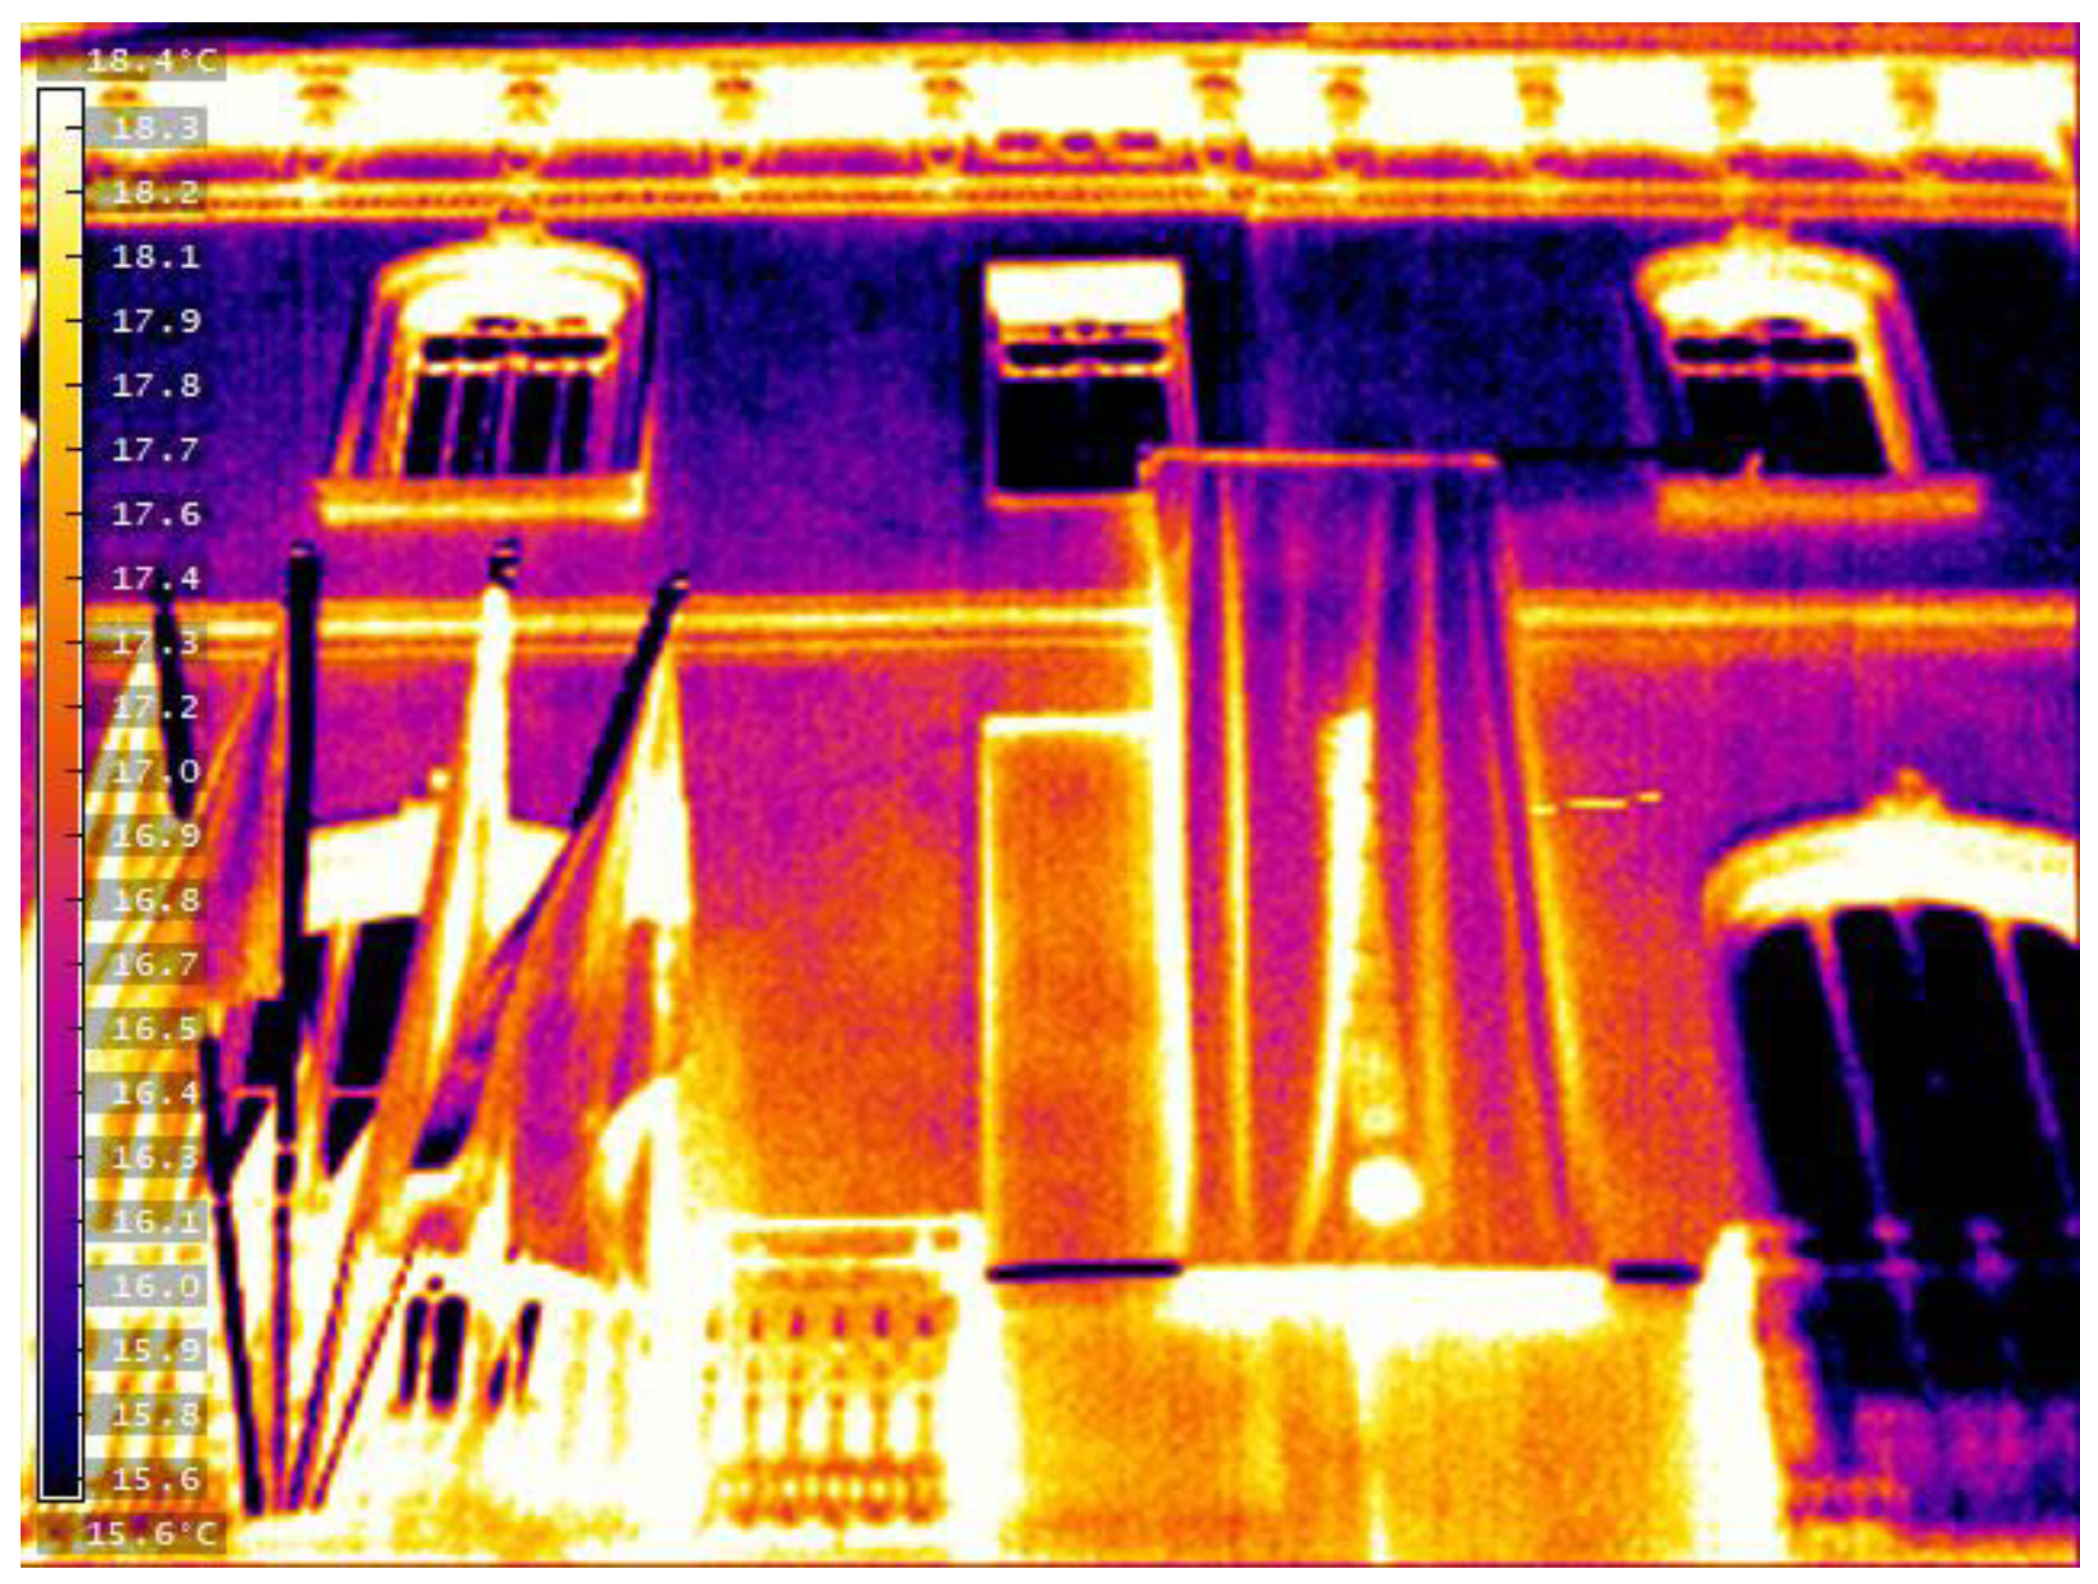
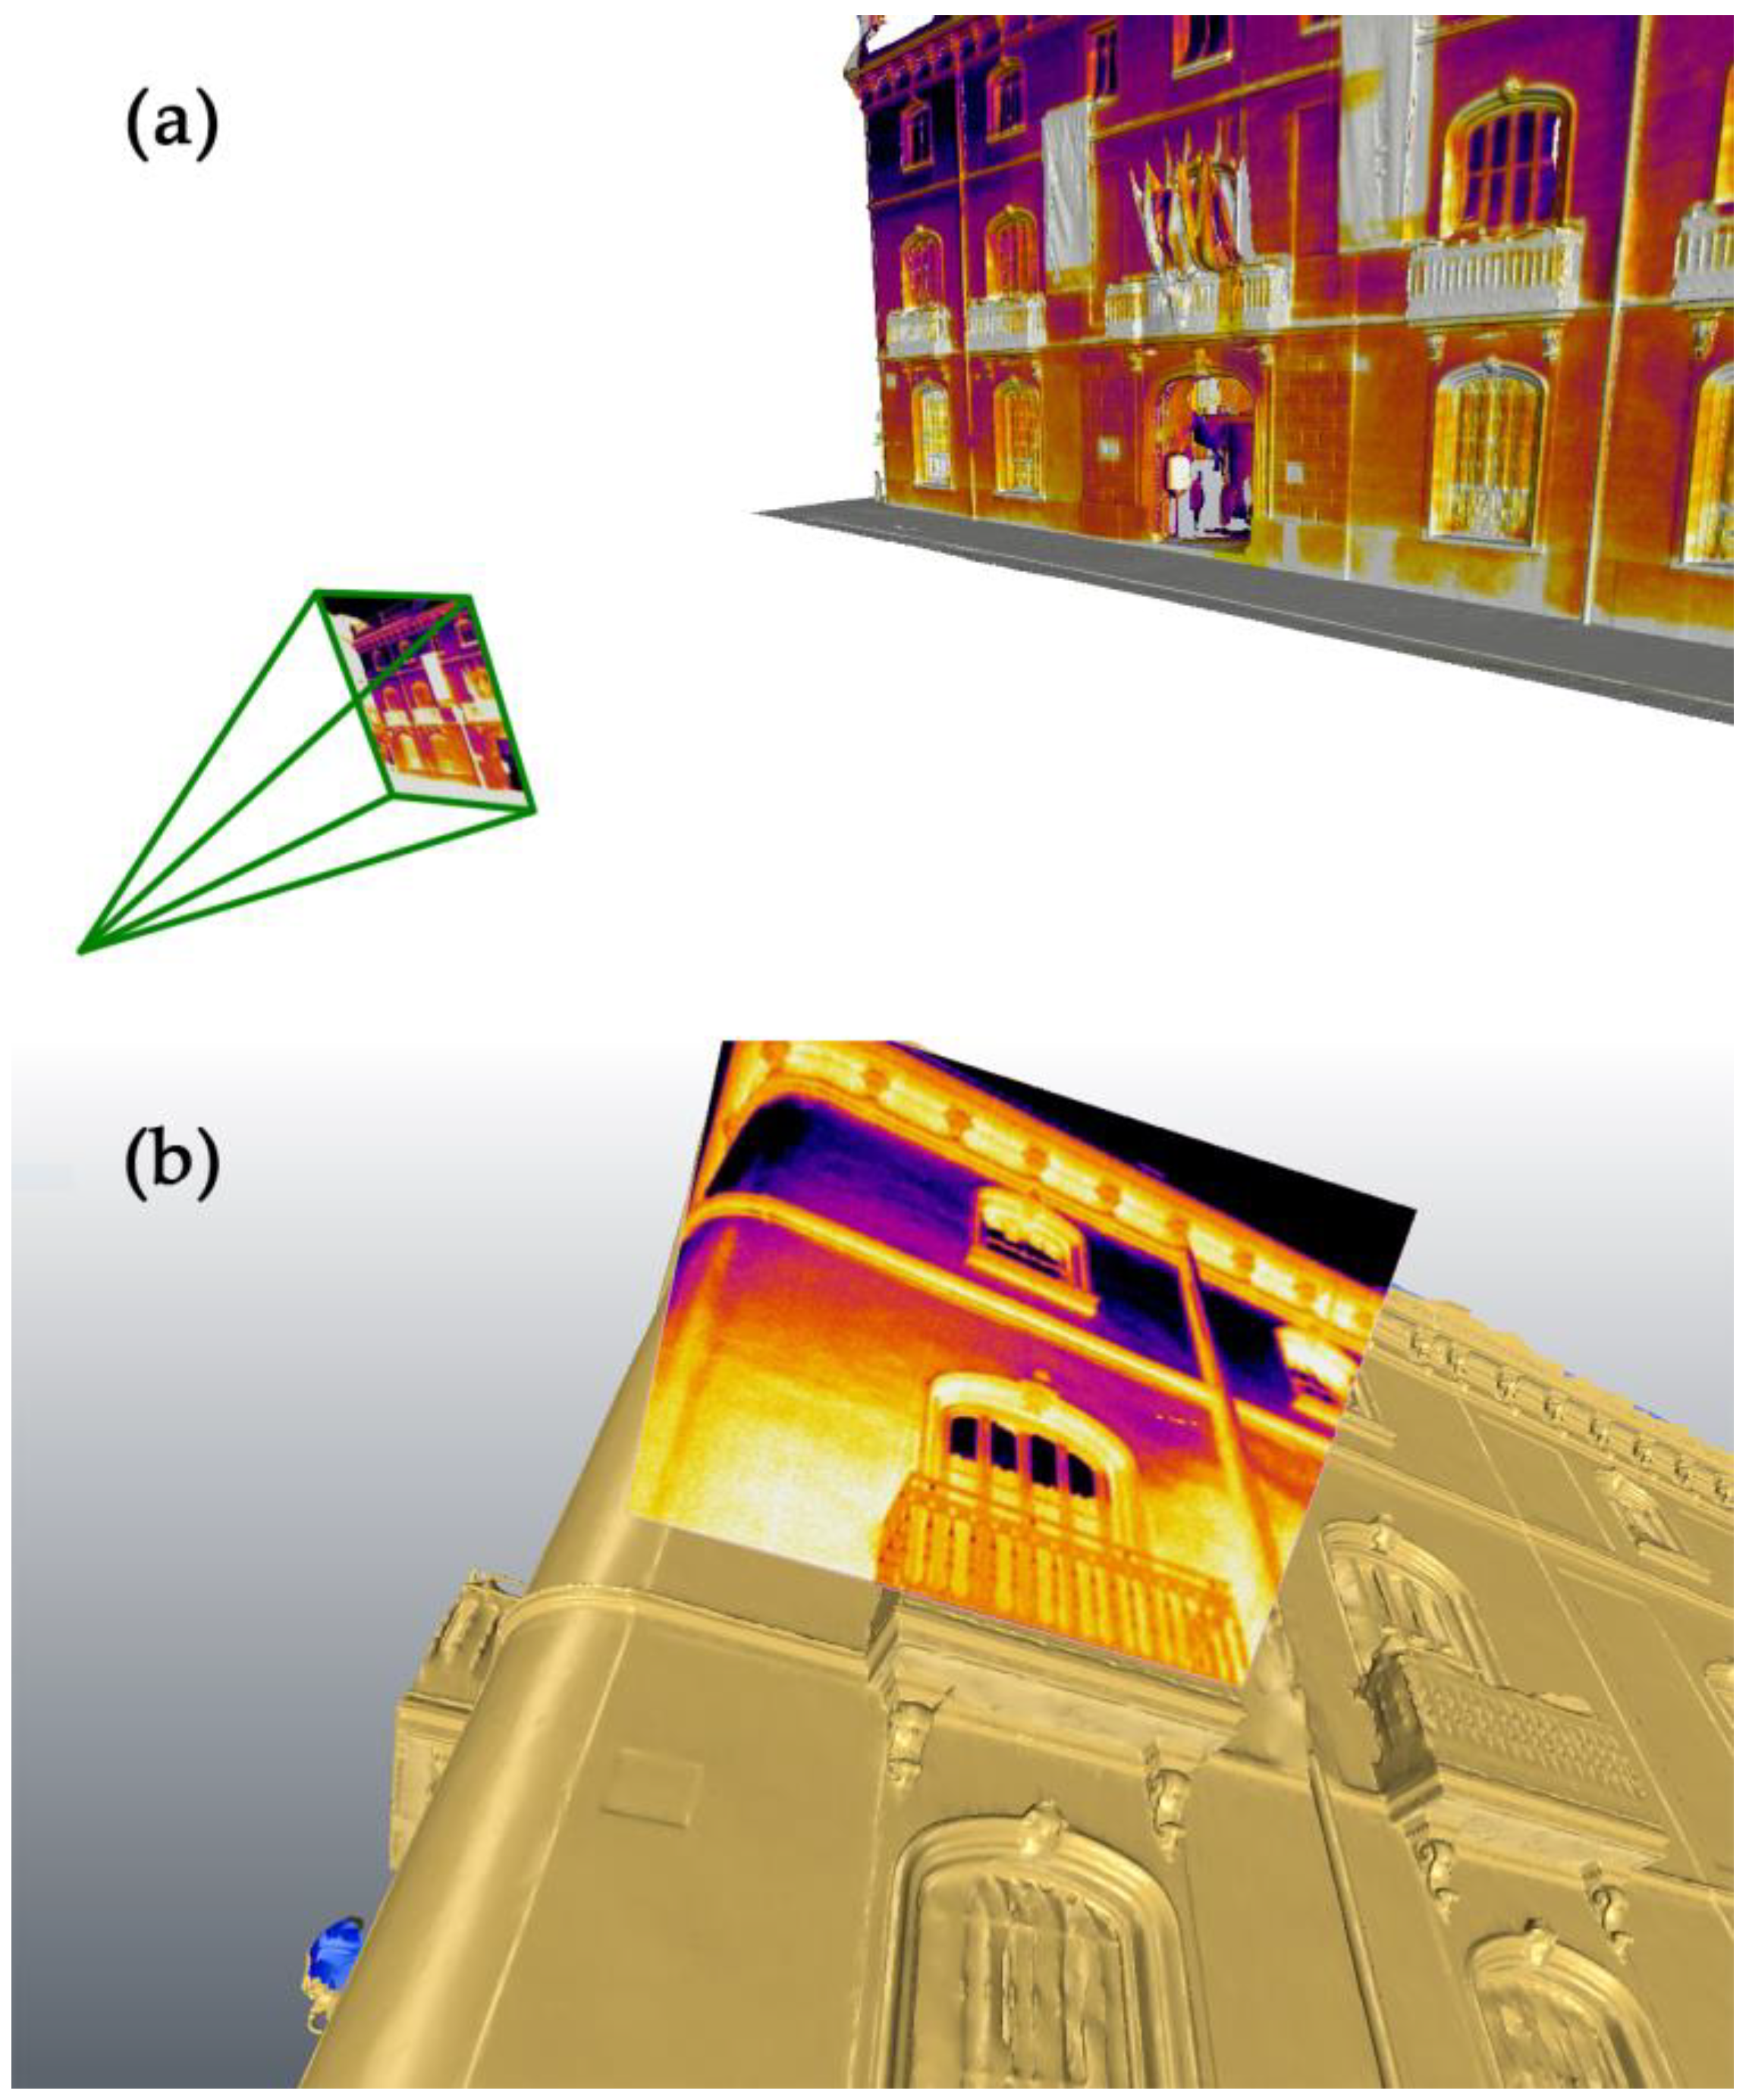
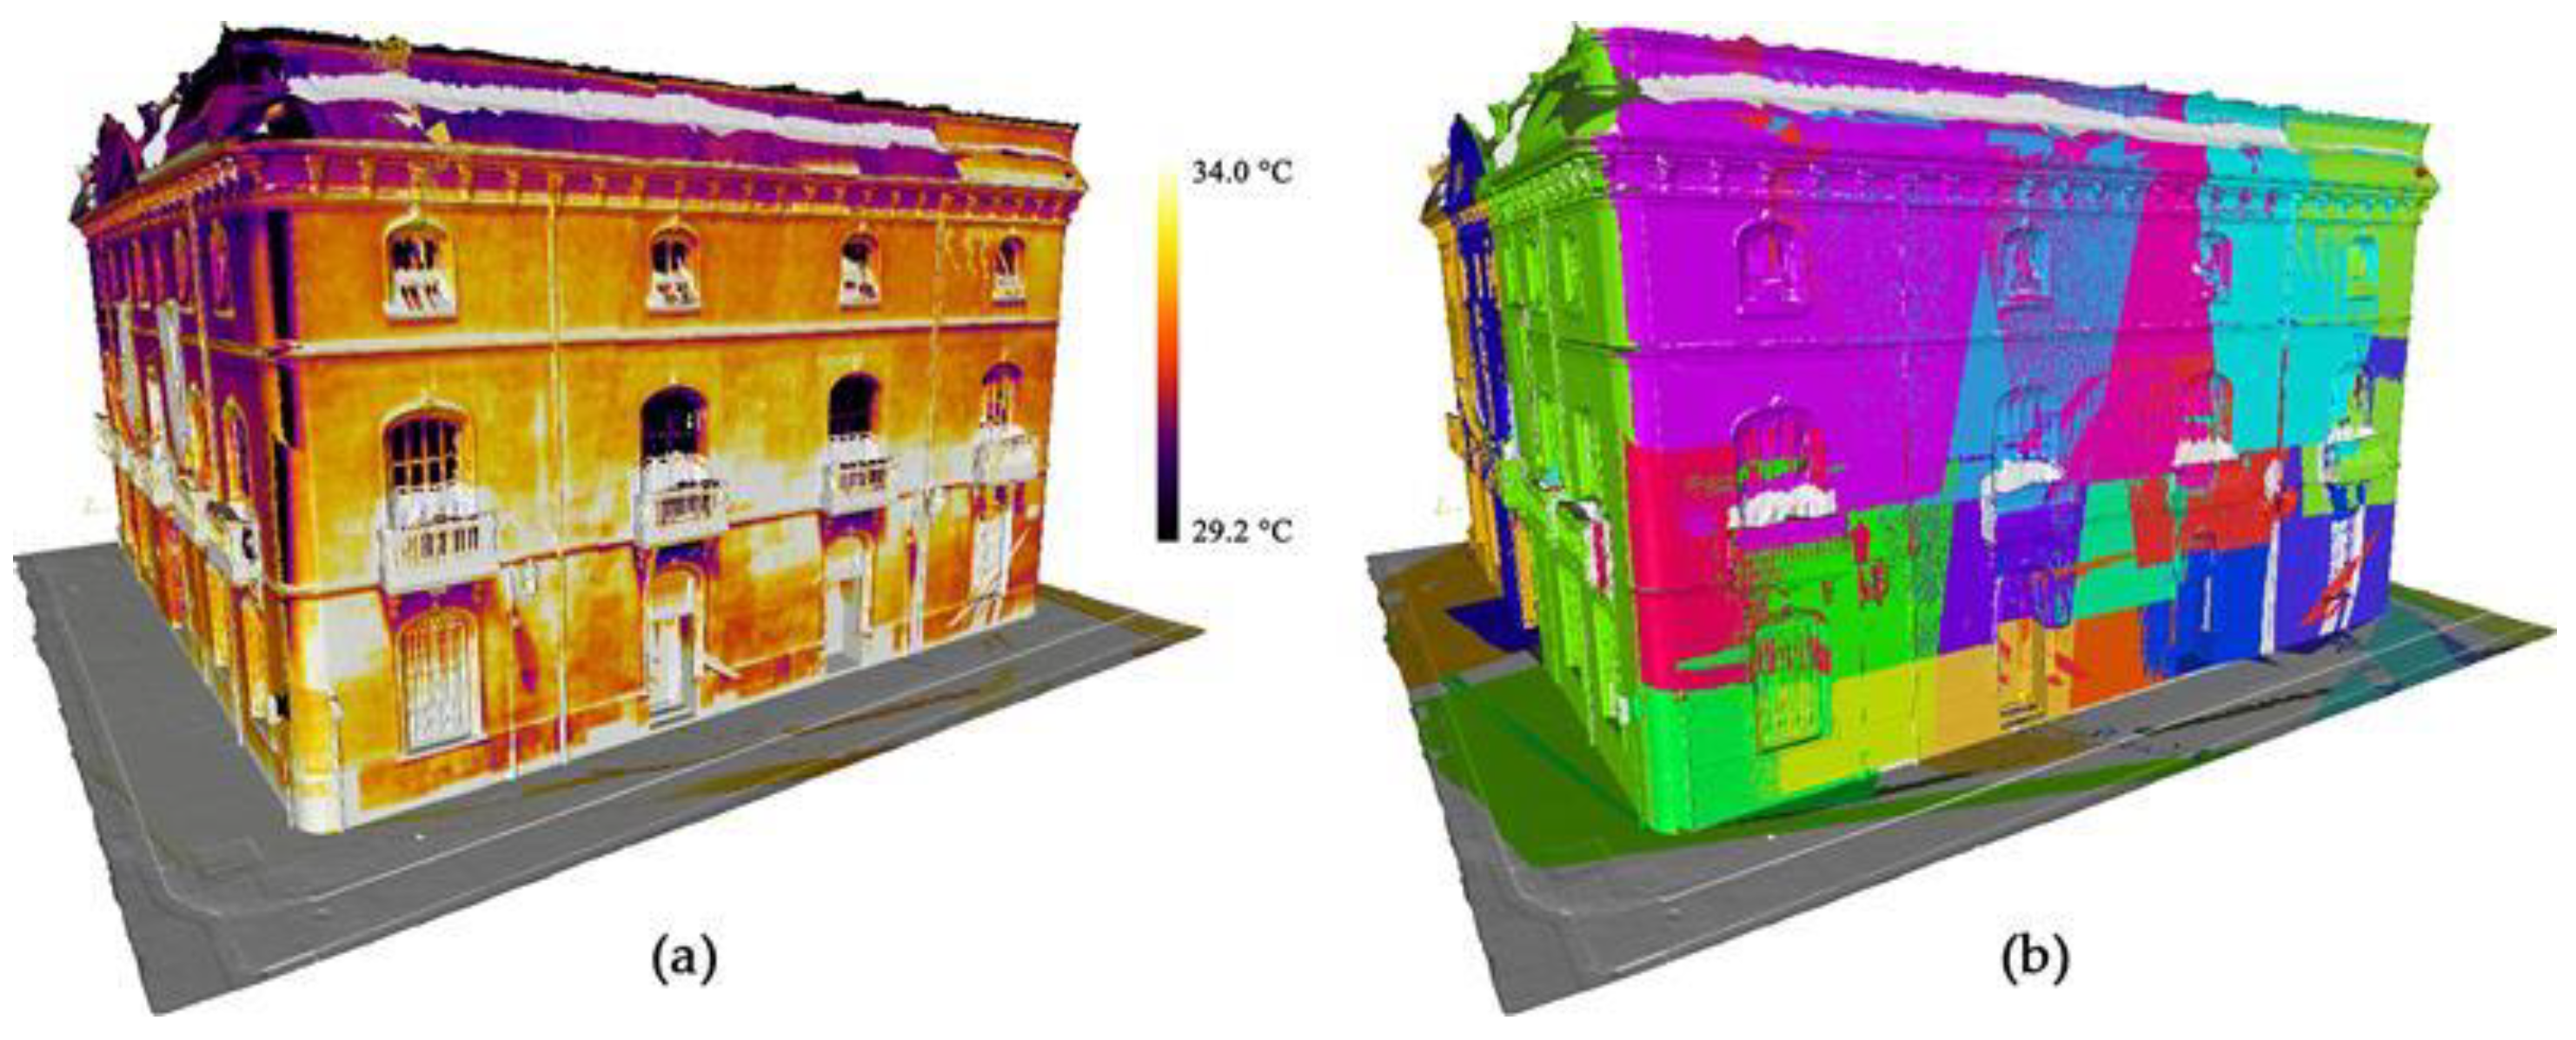
2.3.2. Thermal-Infrared Images Acquisition and Processing

During the 3D data acquisition campaign, a set of thermal data was also collected using a thermal camera FLIR B4 by FLIR Systems (Wilsonville, OR, USA). The TIR images will help us detect possible anomalies capable of supporting the interpretative process conducted in the subsequent historical analysis. The acquisition was planned for the early hours of the day, taking into account the shadow cast by adjacent buildings, so that the TIR images were captured during the moment of maximum thermal imbalance, in order to maximize the radiometric contrast between adjacent elements made of materials with different emissivity and to facilitate the identification of possible thermal anomalies.
In total, 308 TIR images were acquired with the aim of generating high-resolution thermal orthophotos. The relatively high number of images was necessary for two main purposes:
-
Considering the low spatial resolution of this kind of imagery—this latter aspect represents a well-known issue concerning thermal images [31]—and the reduced image size (320 × 240 pixels), a high number of images is necessary in order to provide an adequate GSD;
-
Covering the higher number of surfaces of the building and avoiding occlusions—and the consequent lack of data—due to the presence of overhanging volumes (e.g., balconies).
As it is possible to observe in Figure 20 and Figure 21—respectively, an example of TIR images acquired on the east façade and the south façade, evidencing significant thermal anomalies—the information embedded in the collected dataset is relevant for supporting the subsequent historical interpretation, but it is necessary to establish a spatial connection between the radiometric information and the high-spatial-resolution 3D model derived from the integration of LiDAR point cloud and photogrammetric data. For this reason, a co-registration strategy has been followed with the aim of co-registering the TIR dataset and a 3D mesh triangulated from TLS data.
In fact, the acquired TIR images were projected onto the high-resolution 3D mesh to exploit the higher spatial resolution of the TLS data. This procedure was carried out using Cyclone 3DR software v. 21.3.6.39469 by collimating natural points that were unambiguously identifiable in both the TIR images and the 3D mesh (Figure 22).
By collimating these points, the orientation matrix of each TIR image was estimated, enabling the generation of a thermal texture through mosaicking multiple TIR images (Figure 23a). A manual editing phase was necessary to optimise the mosaicking of the selected TIR images (Figure 23b).
As a result, a textured 3D mesh—with the spatial resolution from the TLS point cloud and the radiometric information derived from the oriented block of TIR images—was generated. From the orthogonal projection of this 3D model, thermal orthophotos of the considered façade were created (Figure 24 and Figure 25).

3. Results

Starting from the integrated model achieved from the integration between TLS scans and photogrammetric data, the current state of the east (Figure 26) and south (Figure 27) façades has been obtained. Additionally, after the co-registration process described in the previous section, it was possible to establish a spatial connection between the CAD drawings—derived from the orthophoto generated from the integration of TLS point clouds and photogrammetric data—and the thermal orthophoto. Therefore, this process enabled the possibility of establishing the unambiguous position of the radiometric contrast phenomena on the vector drawings, referencing the position and the dimensions of the detected thermal anomalies.
It is advisable to carry out the study by façades, which are determined as follows:
-
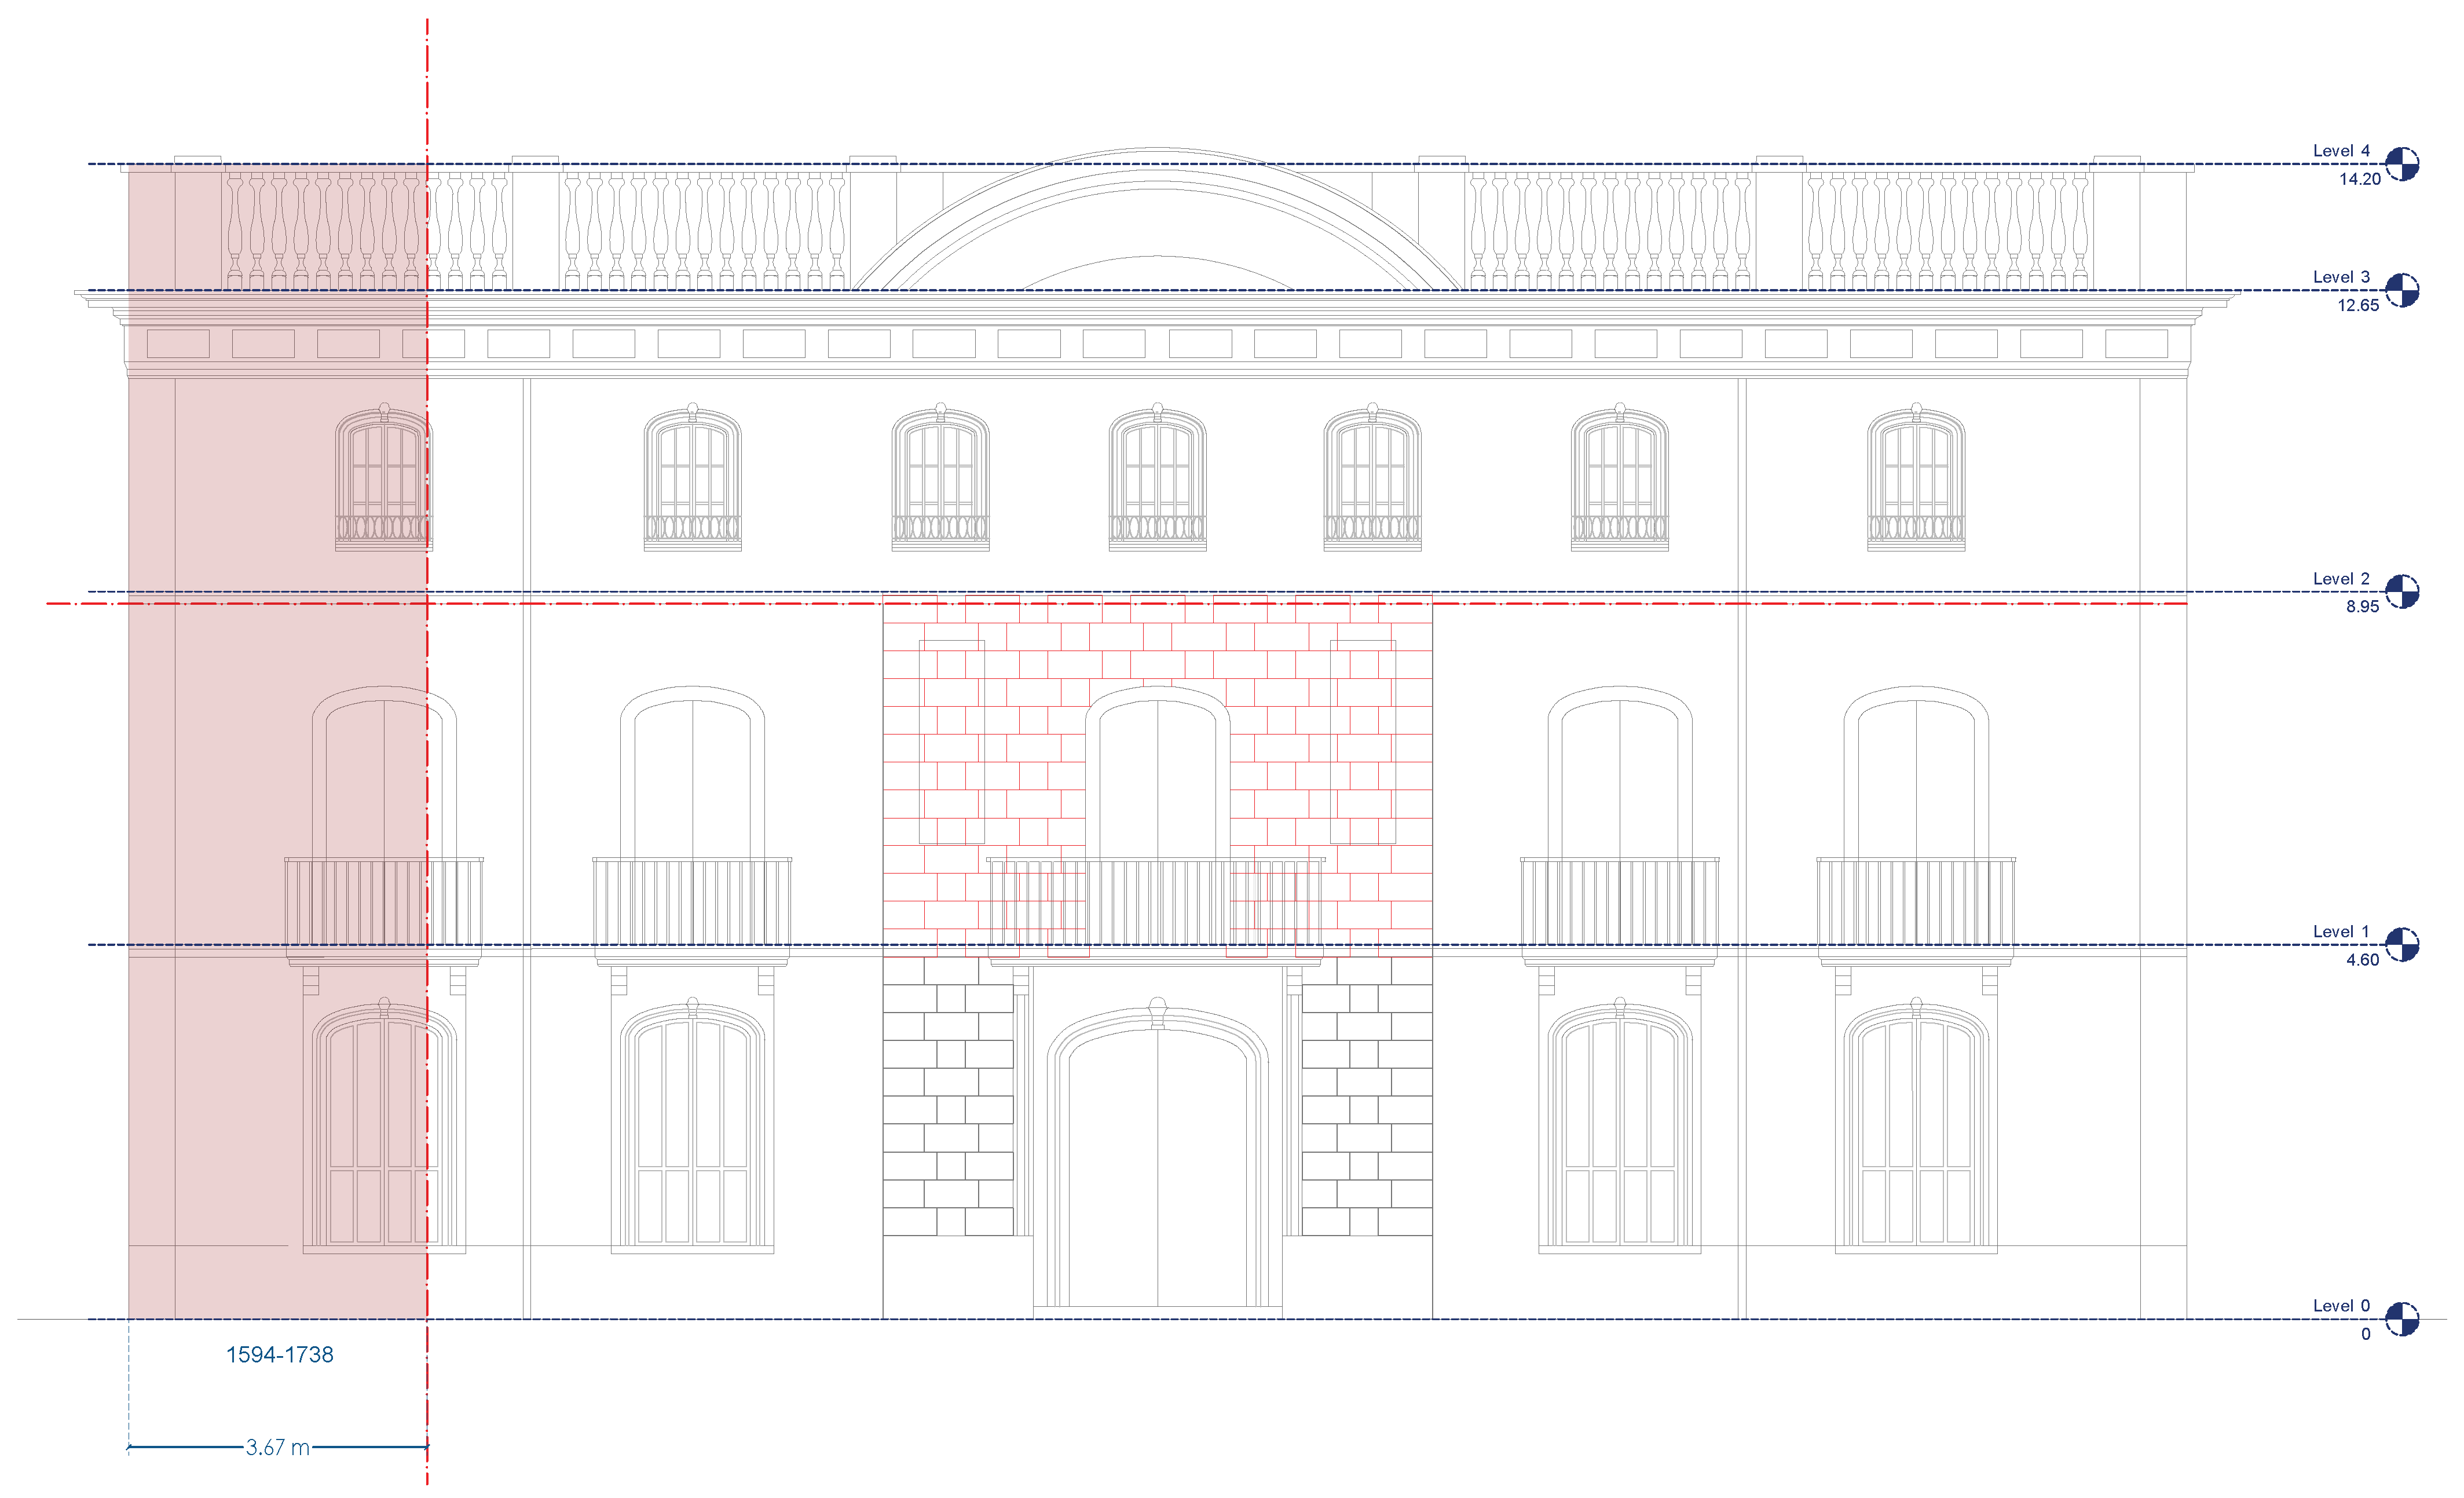
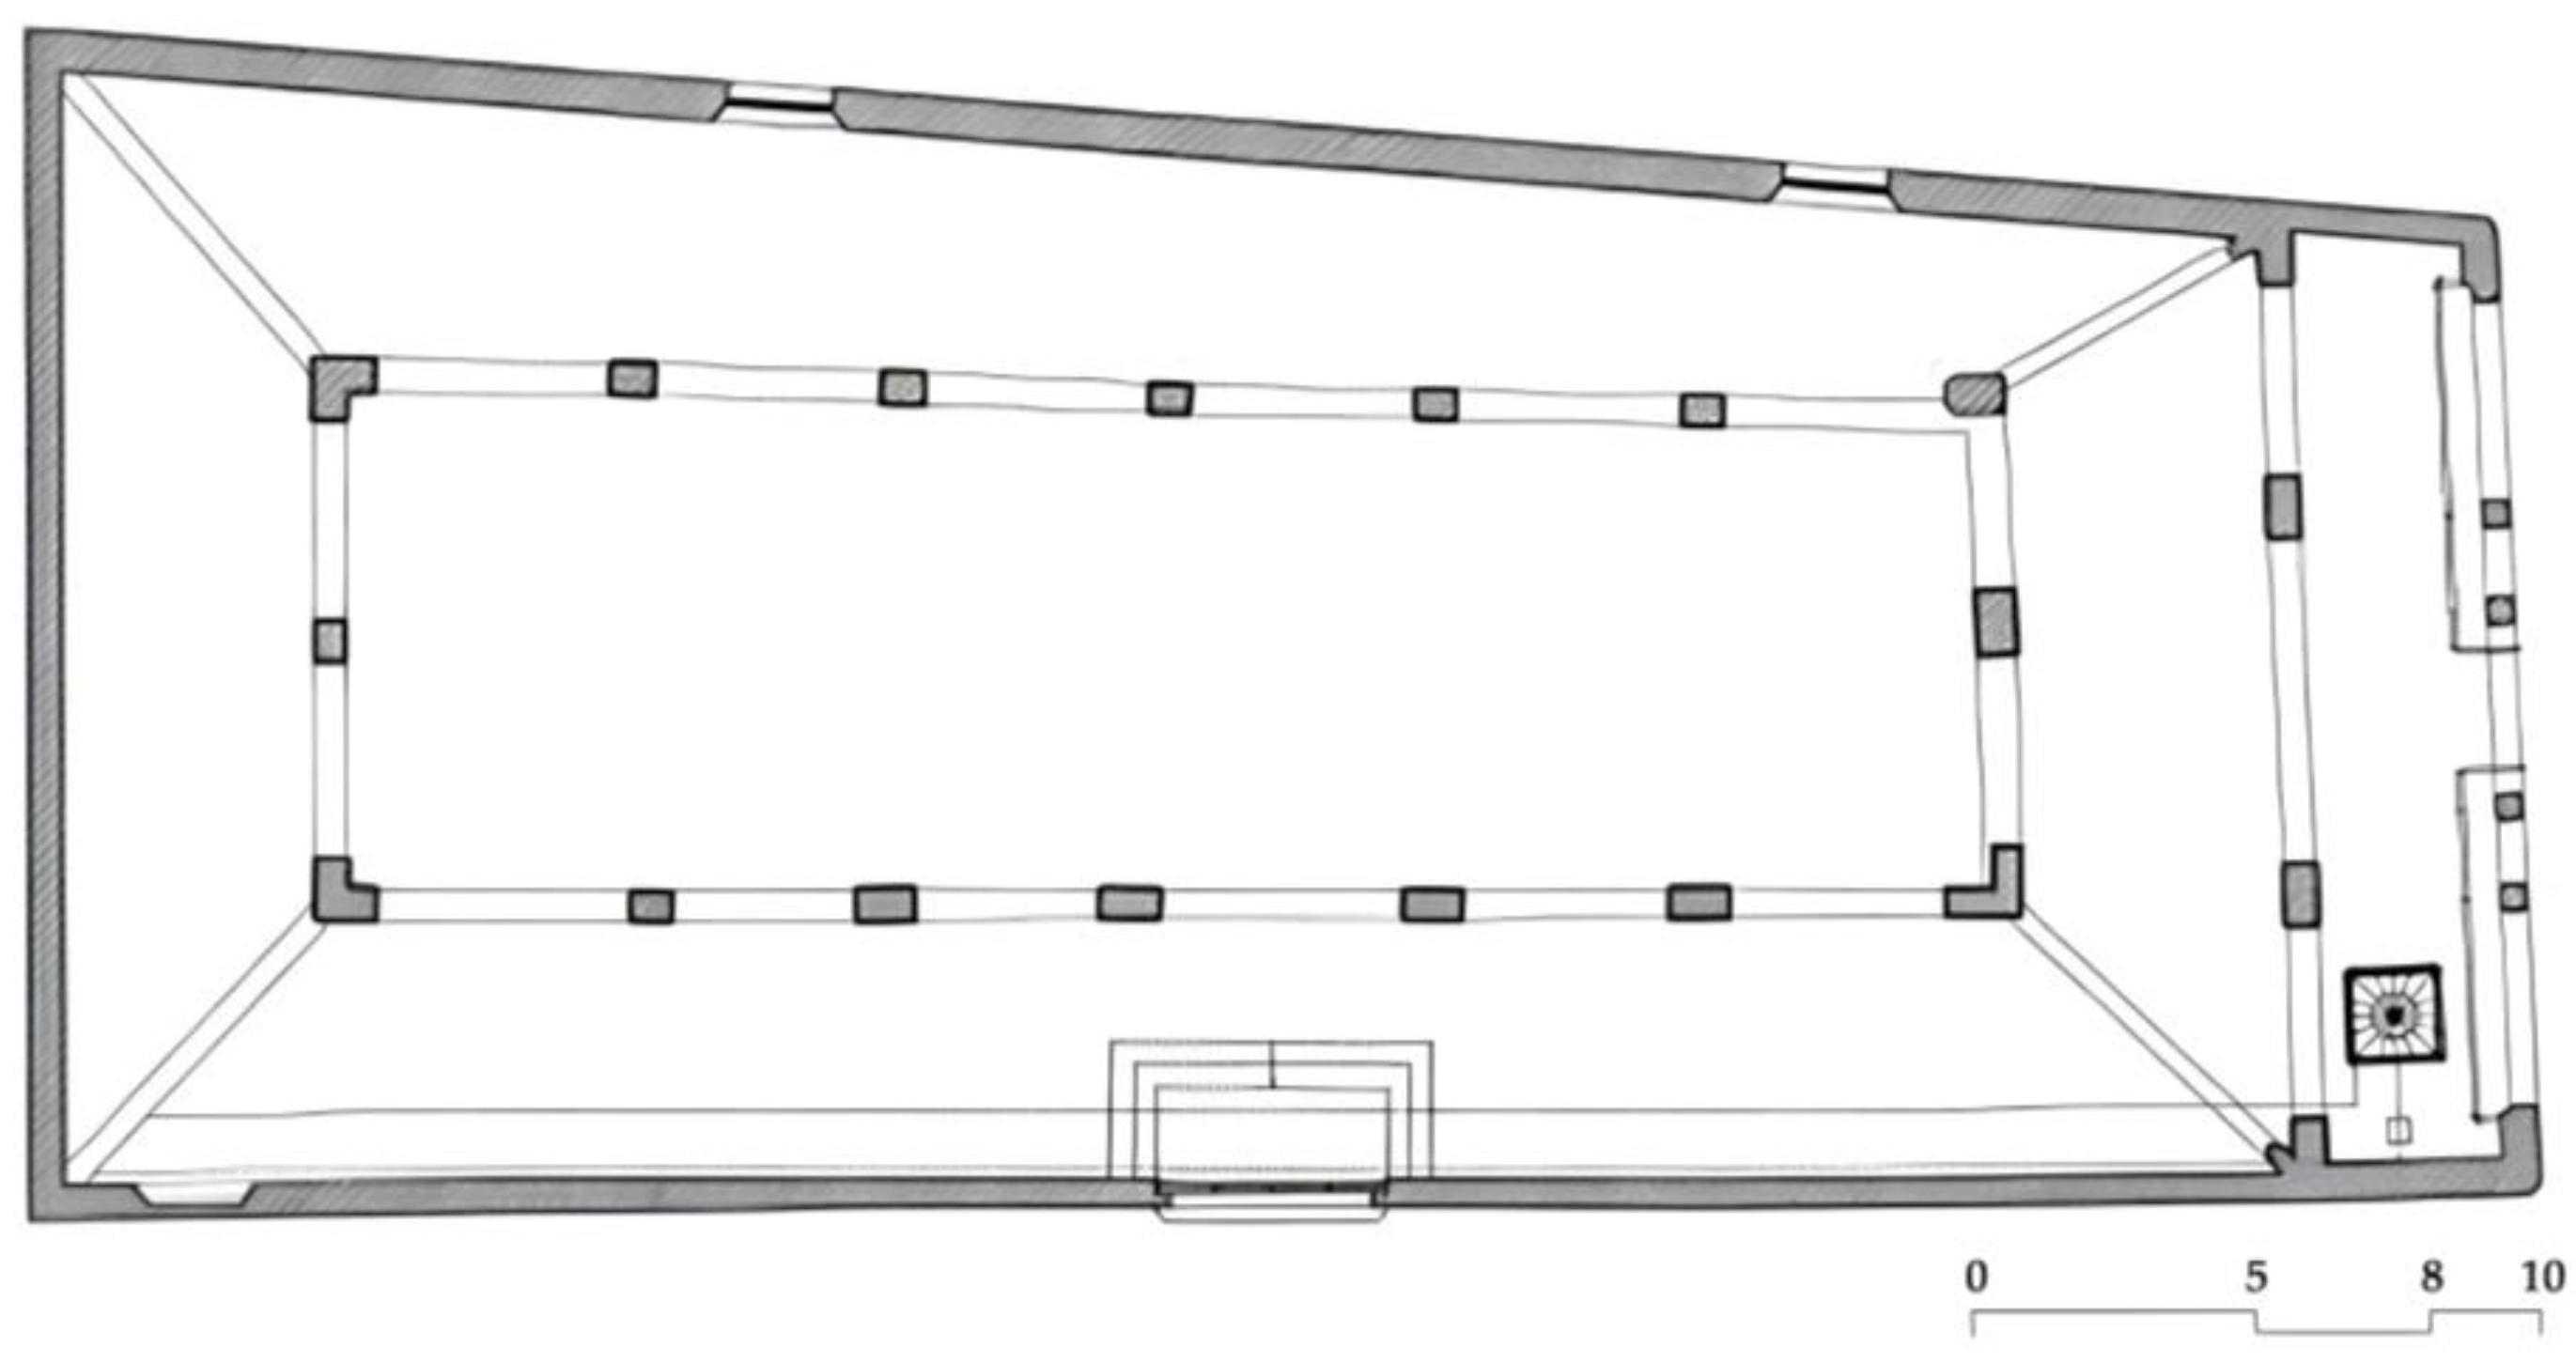
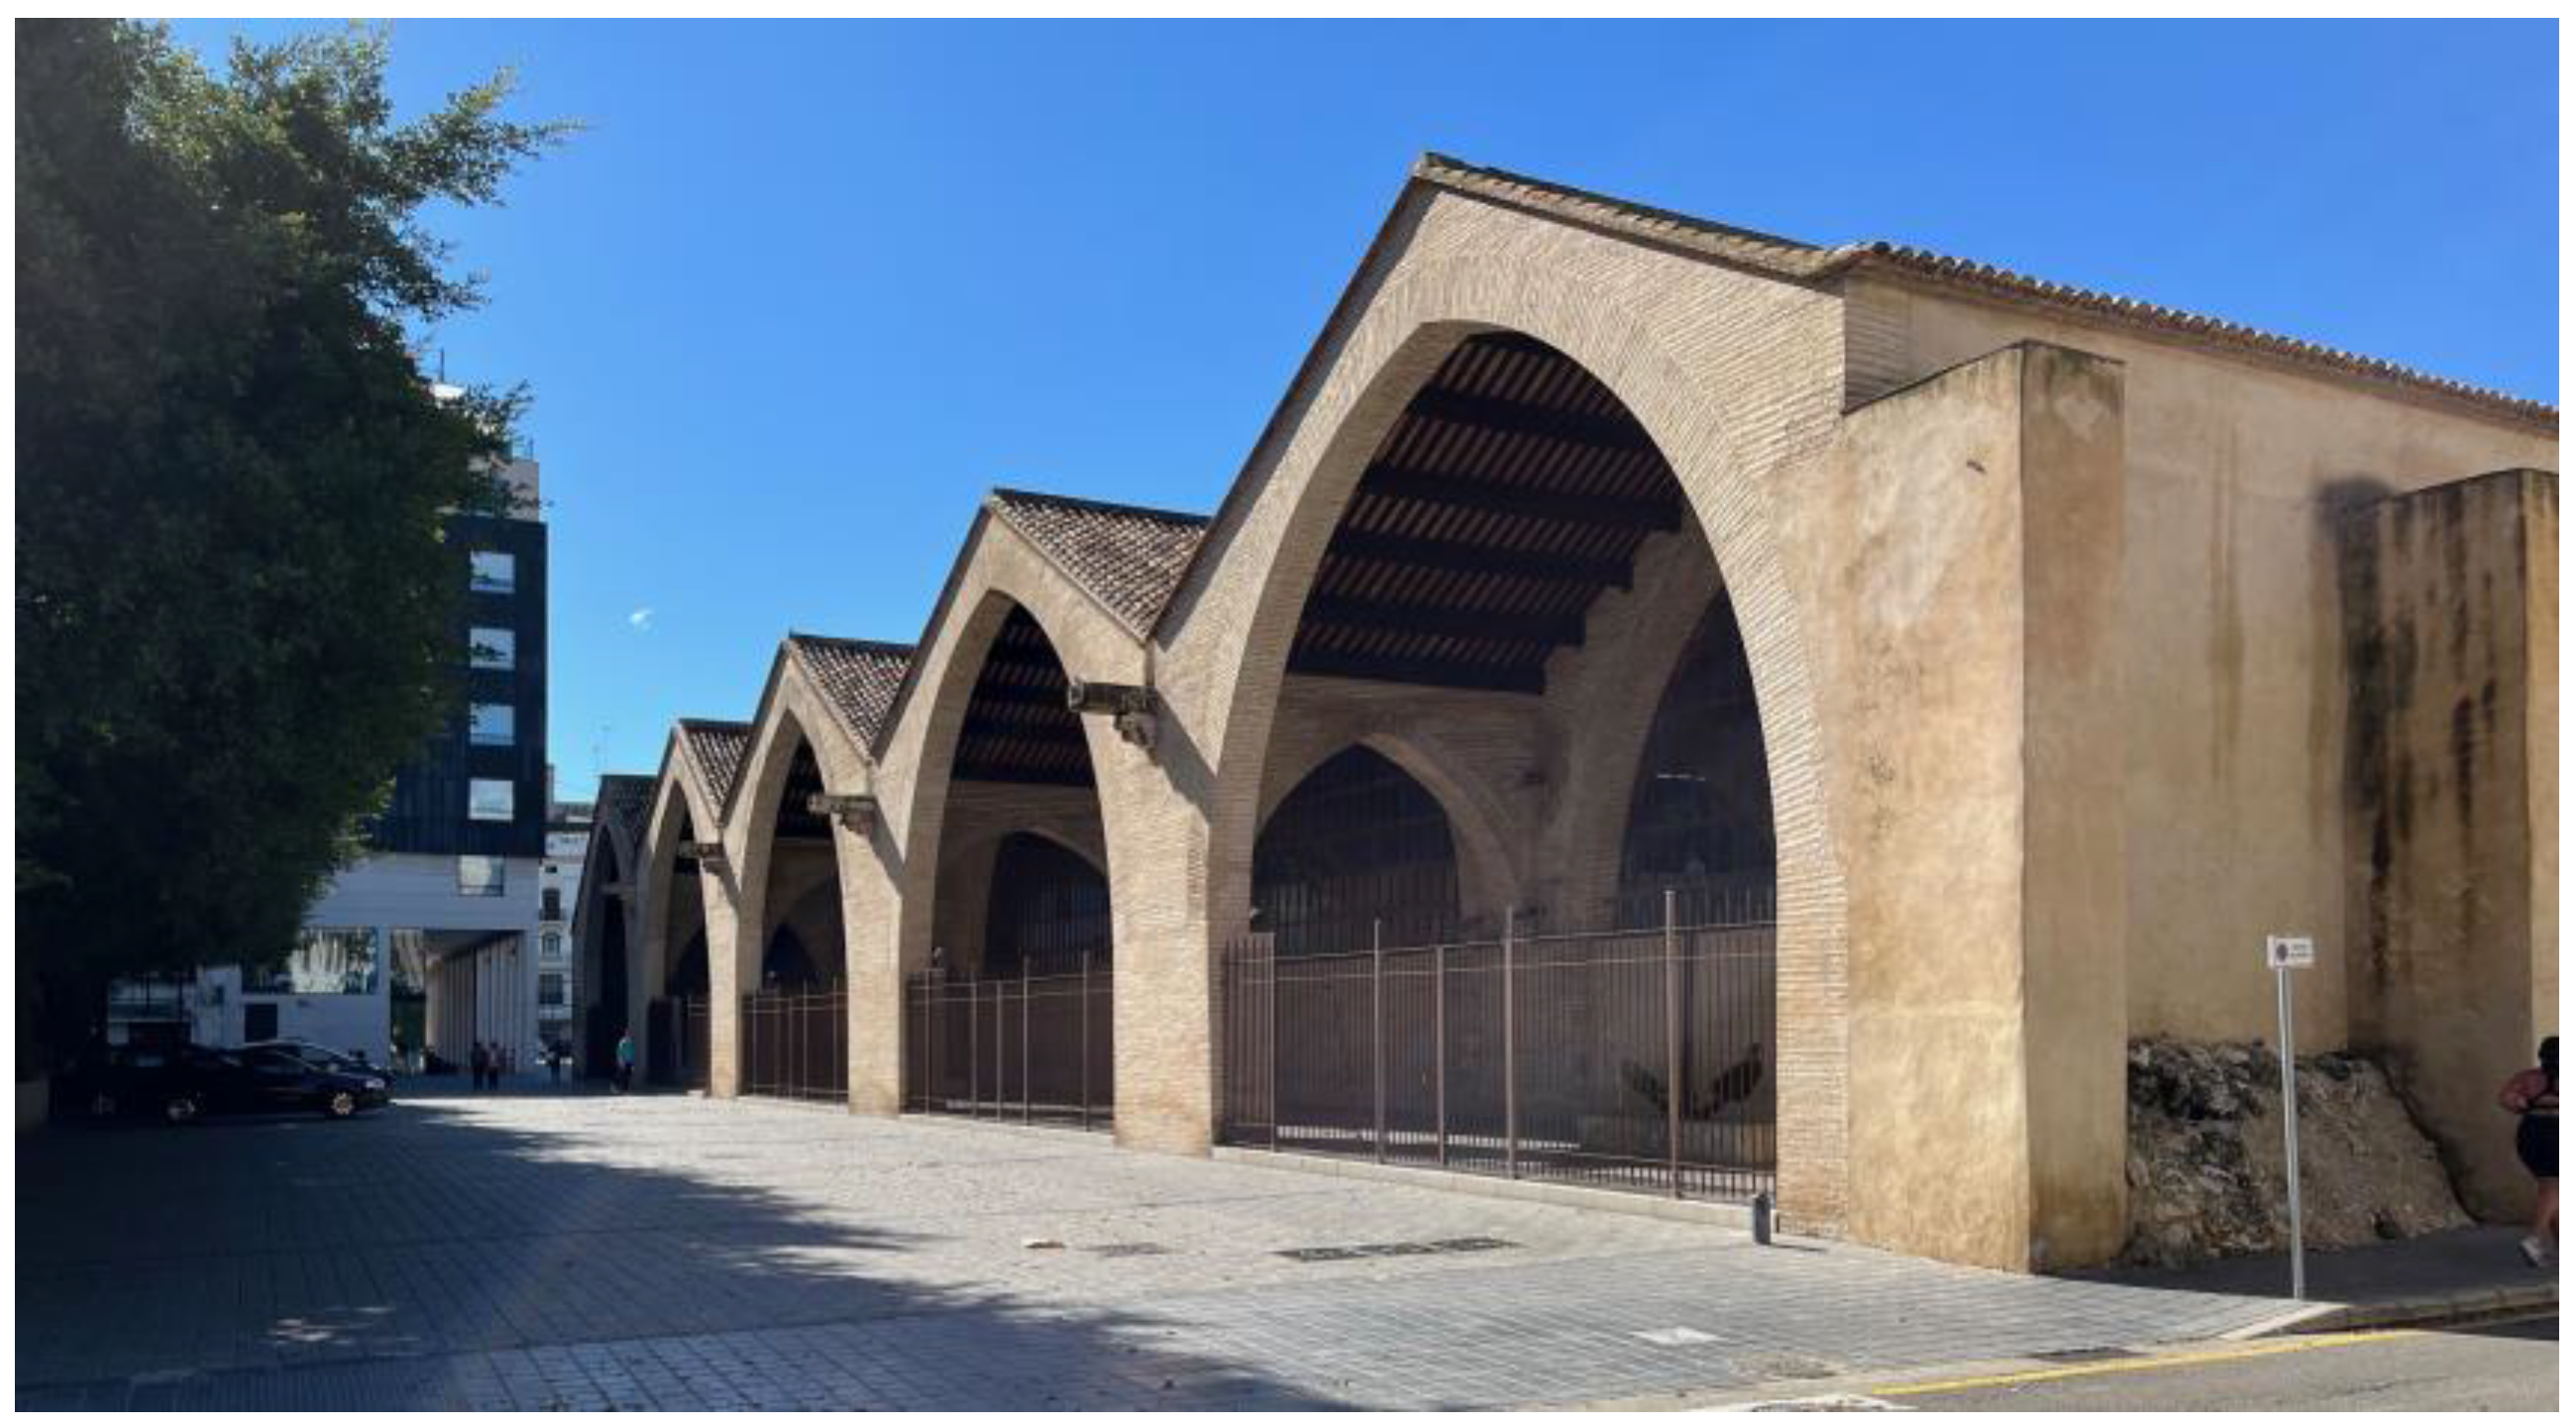
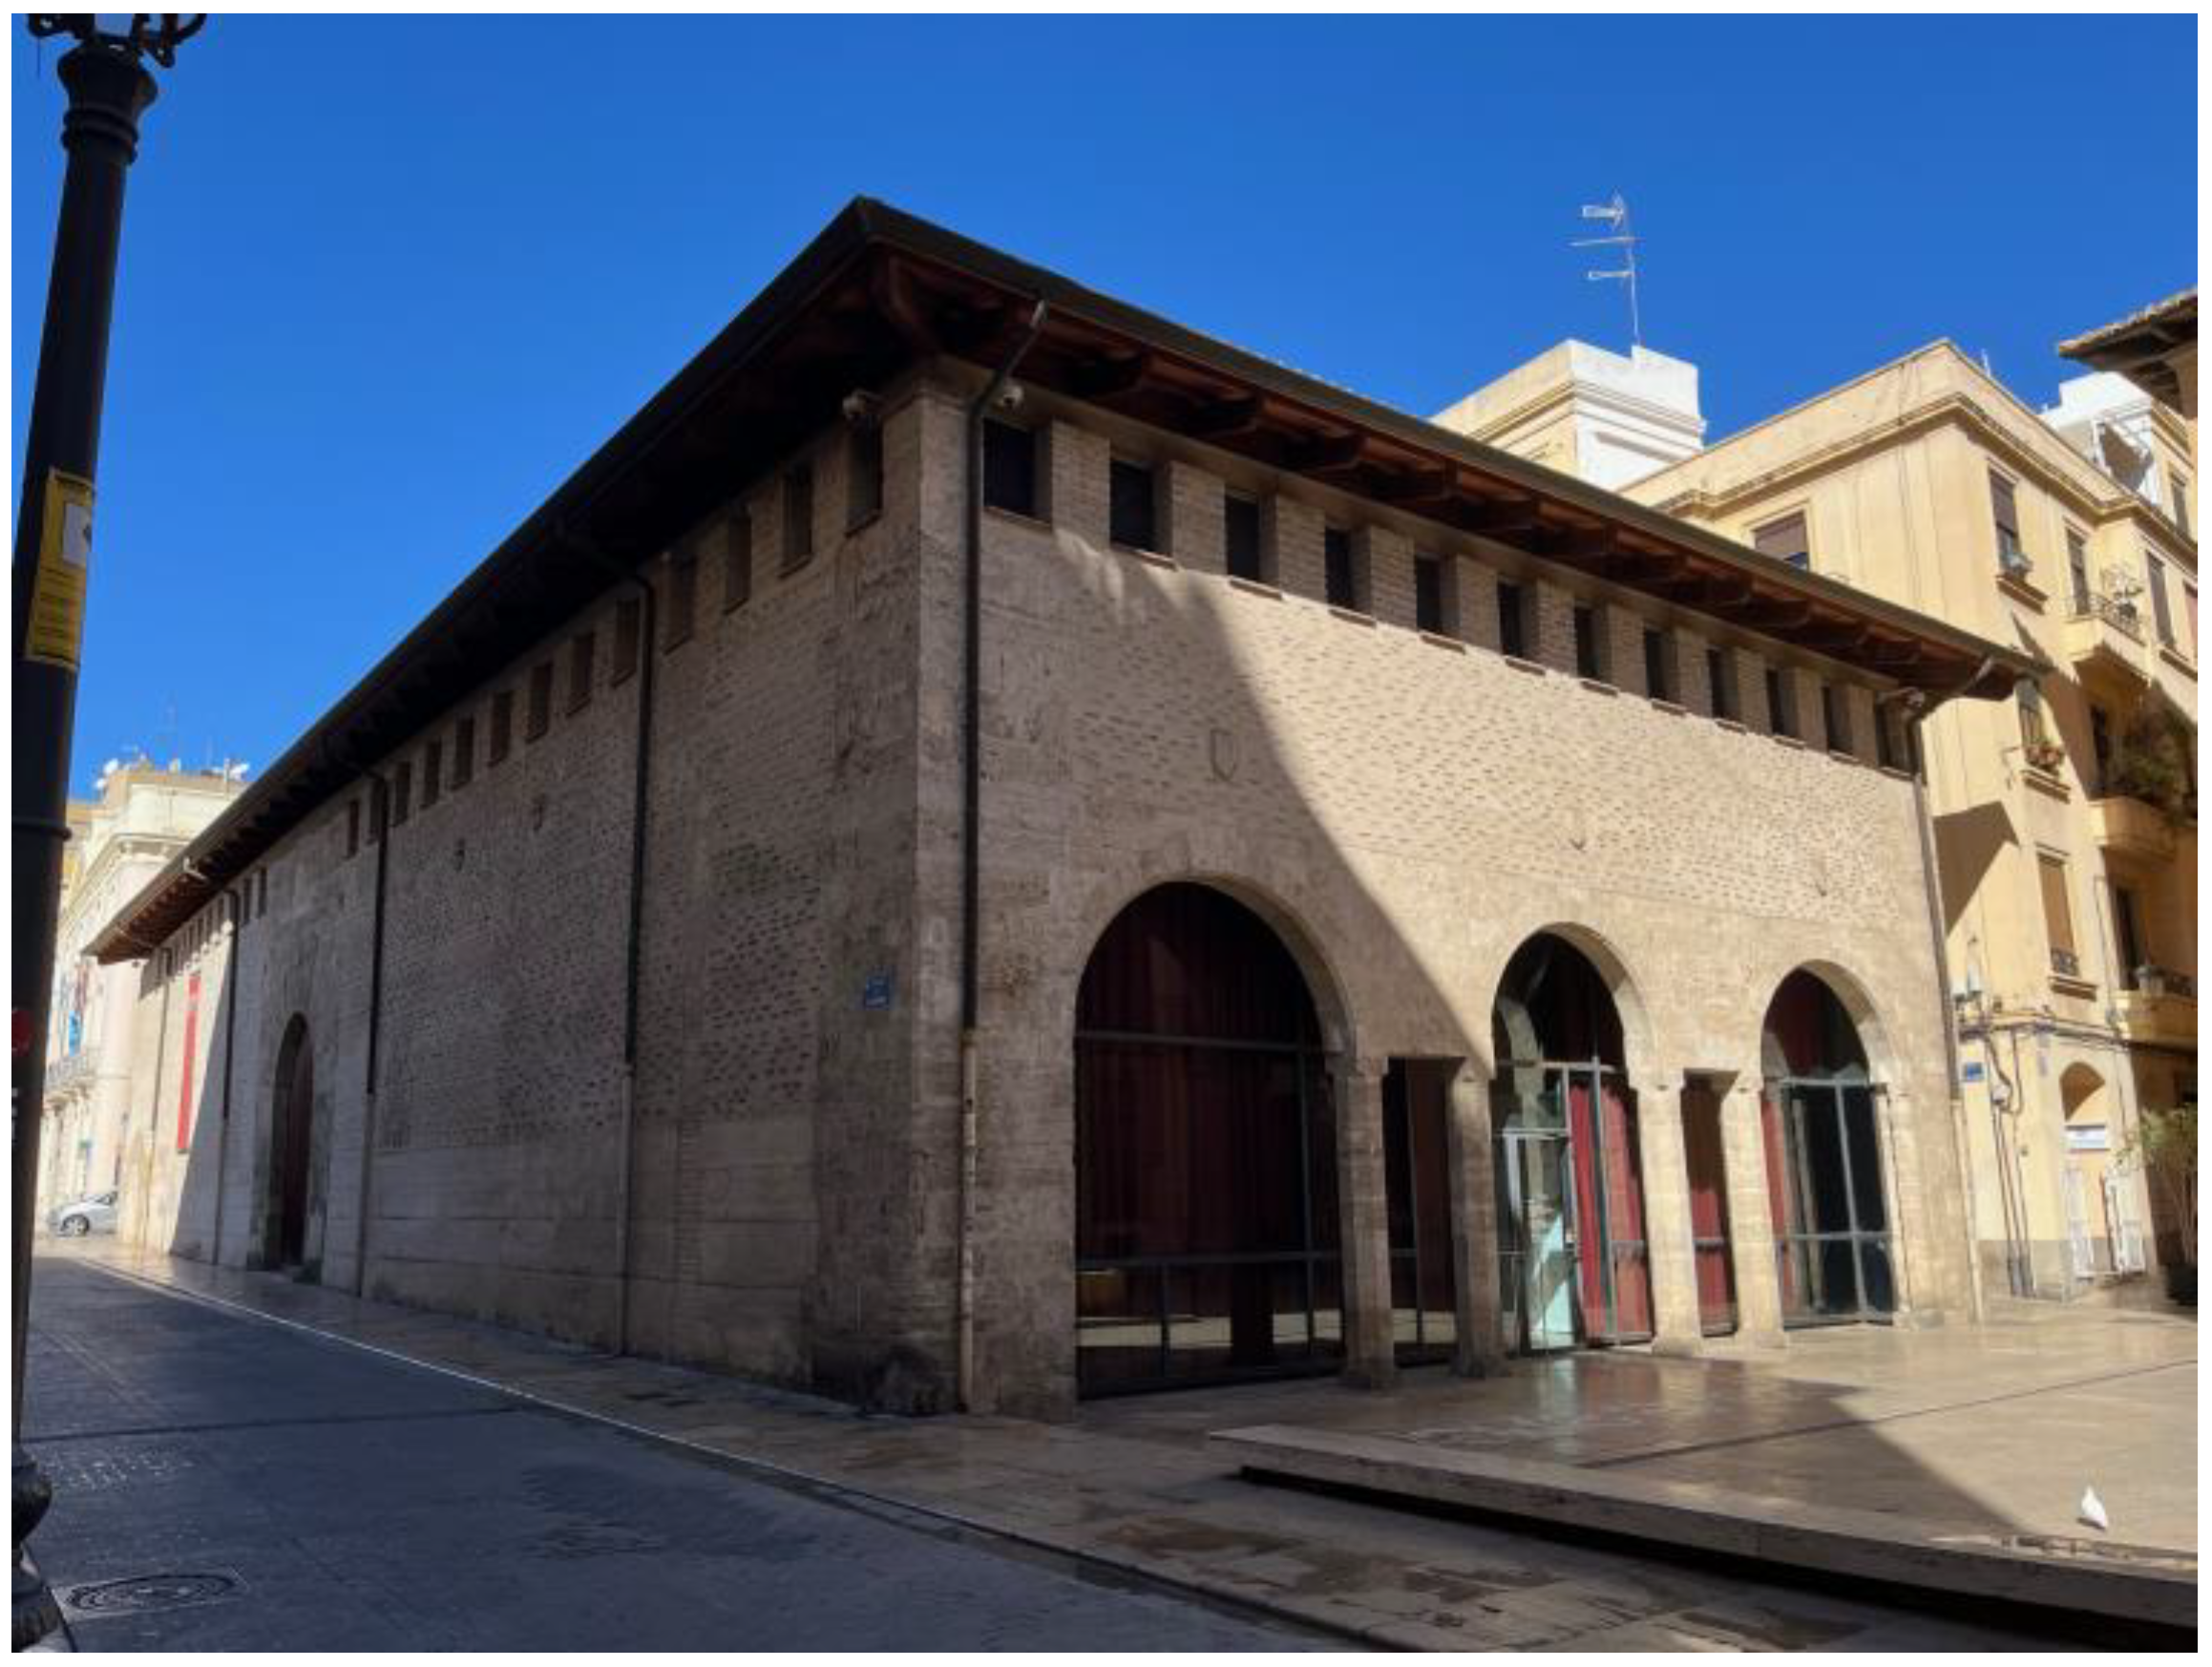
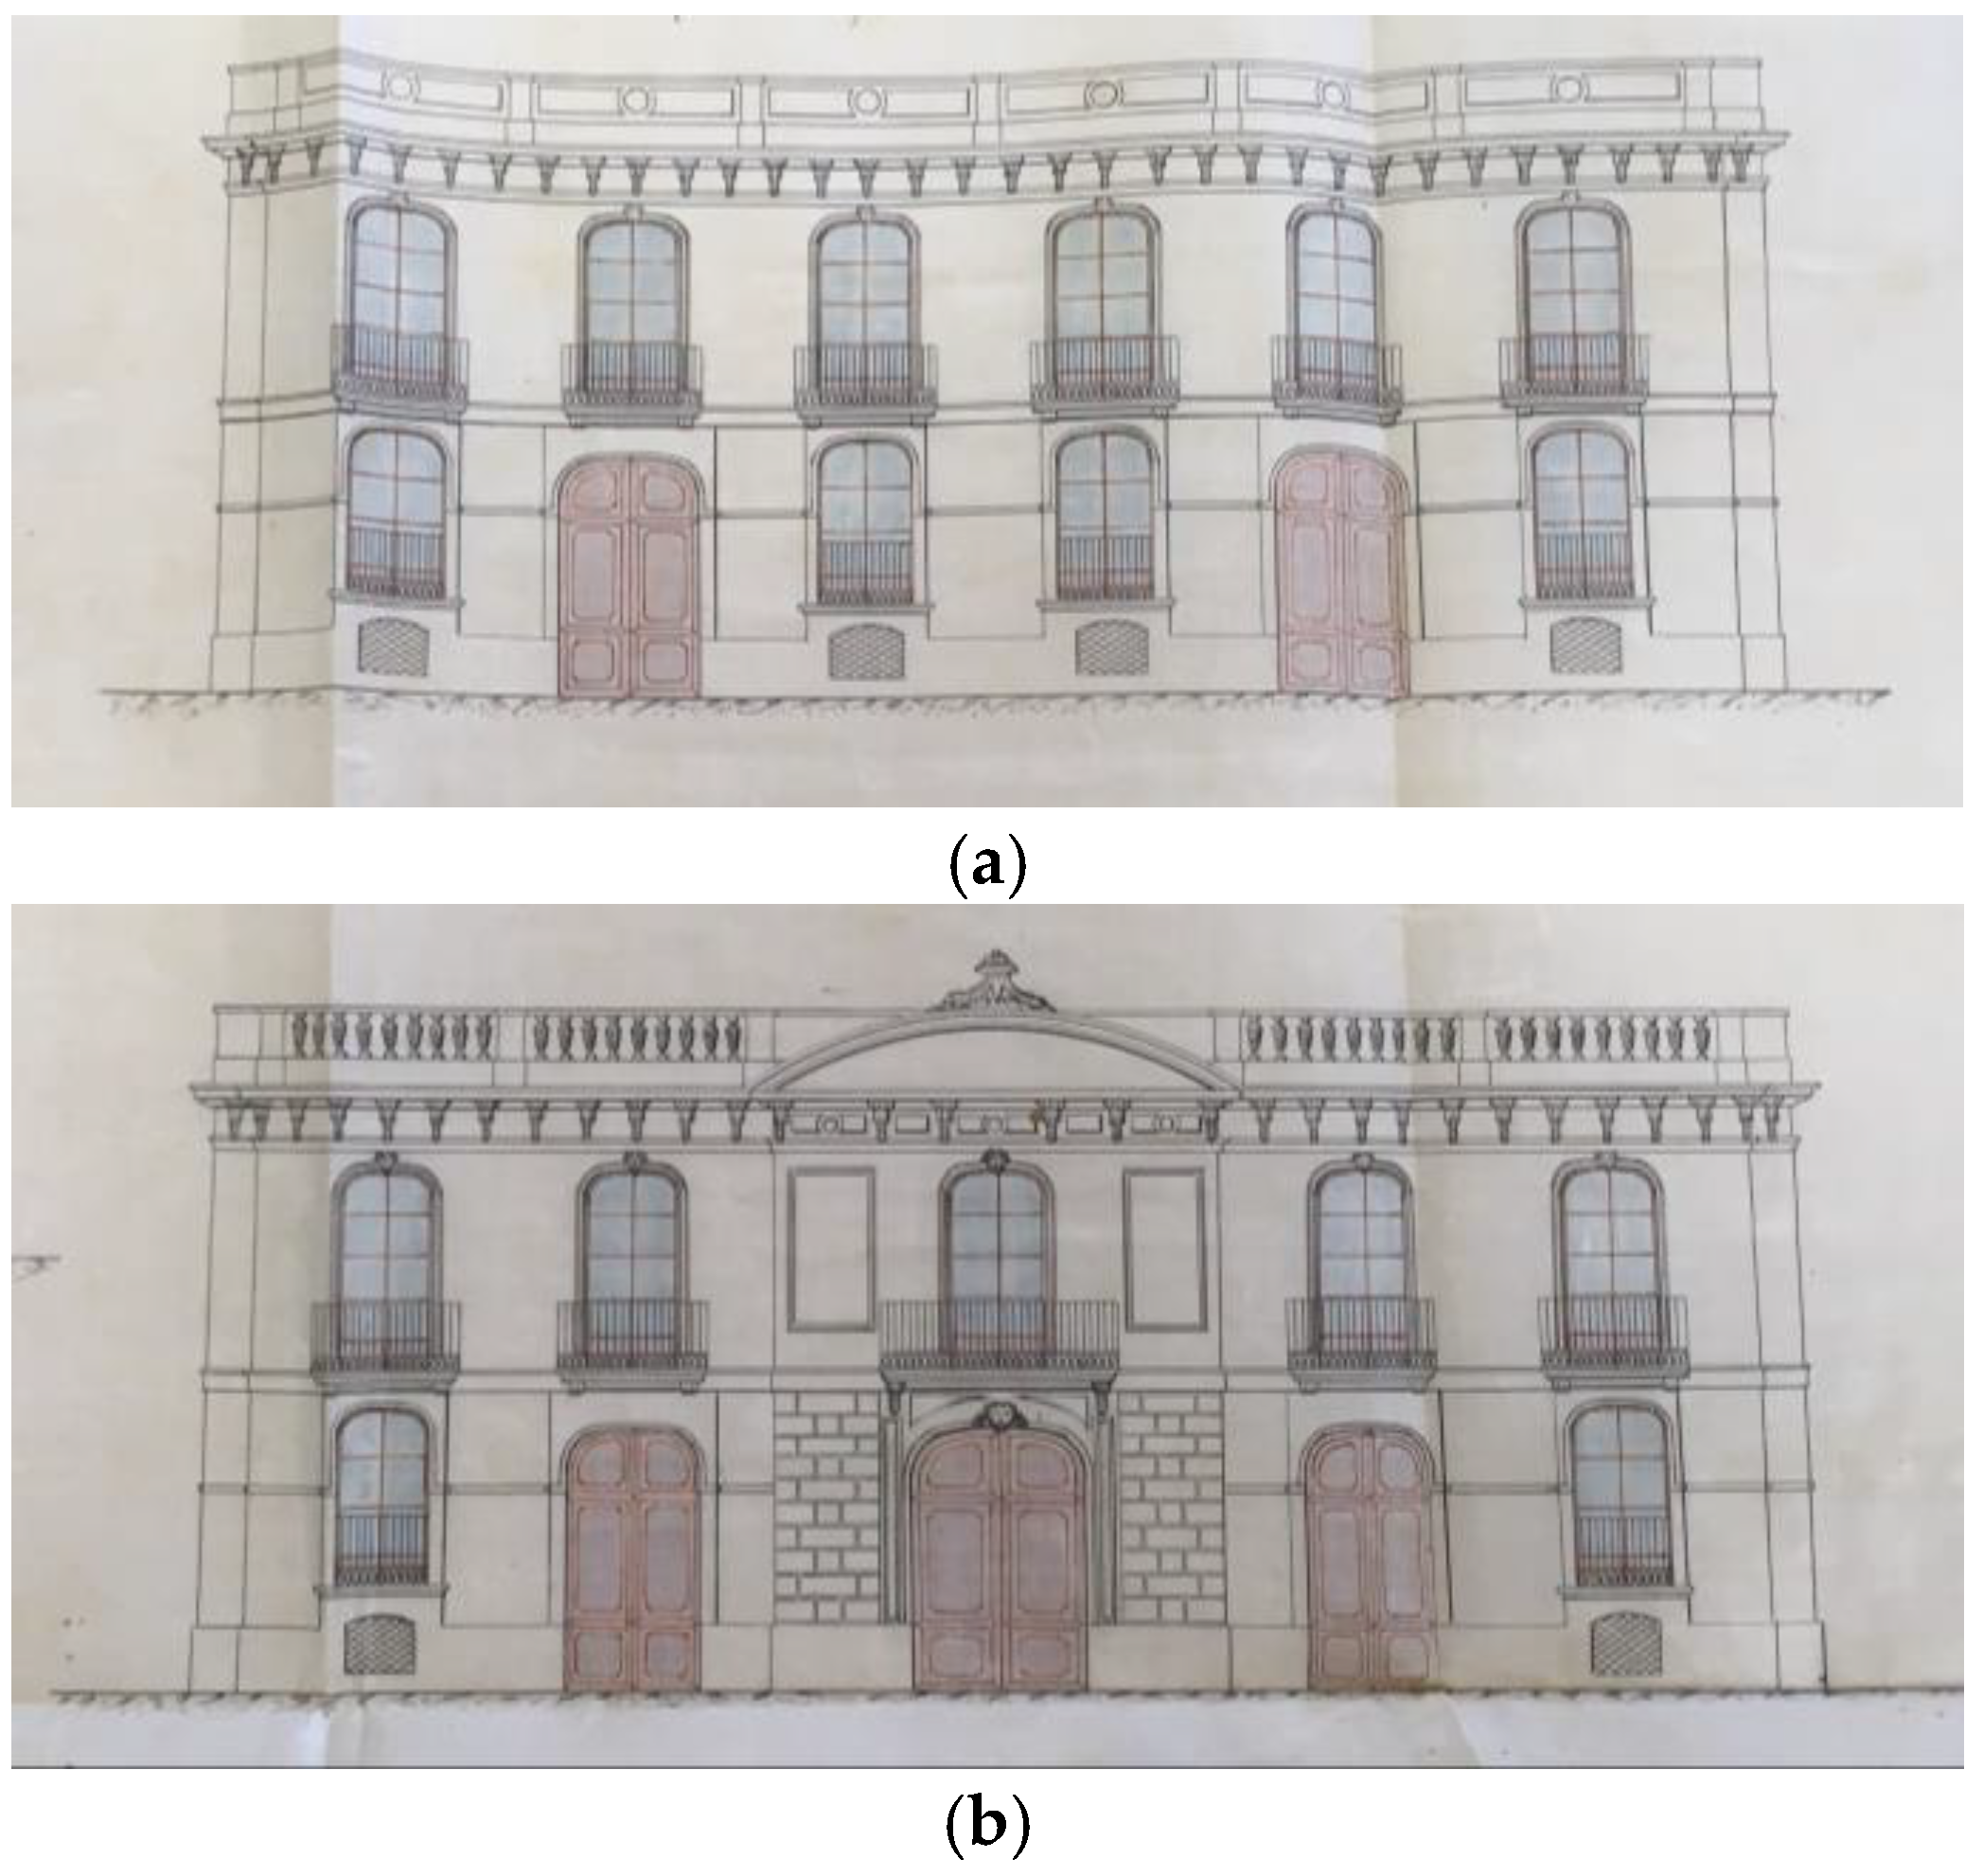
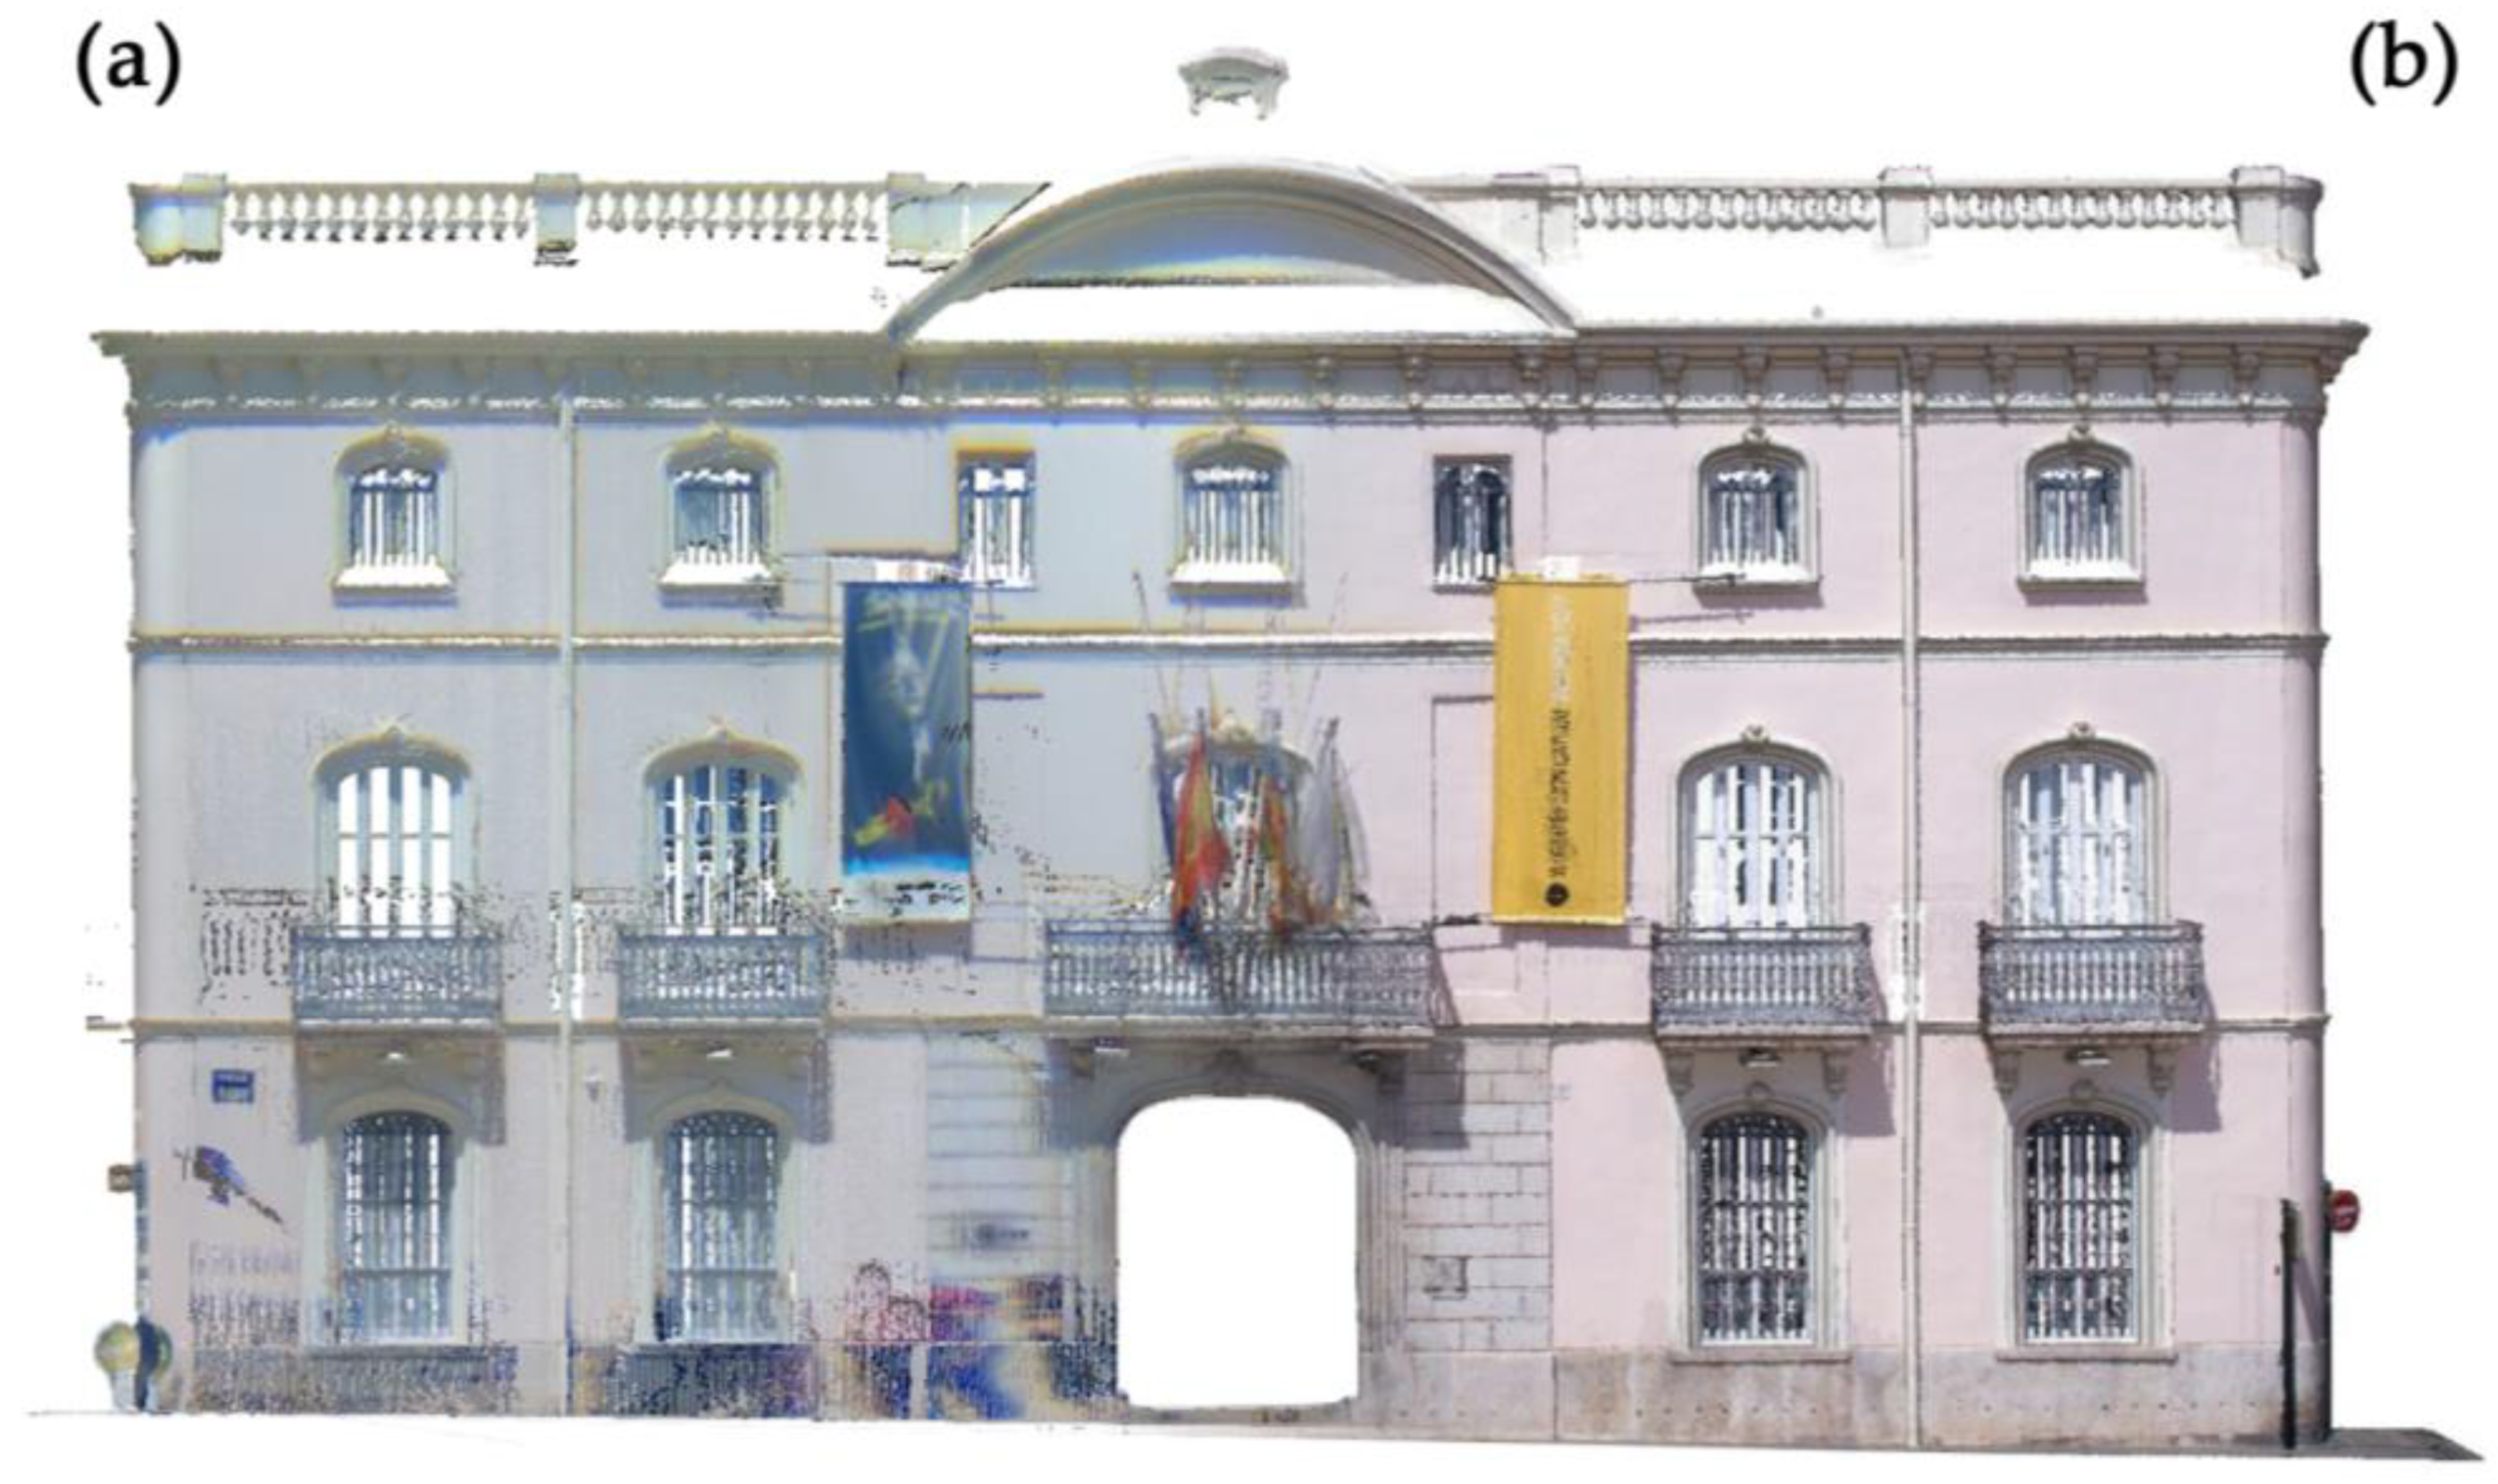
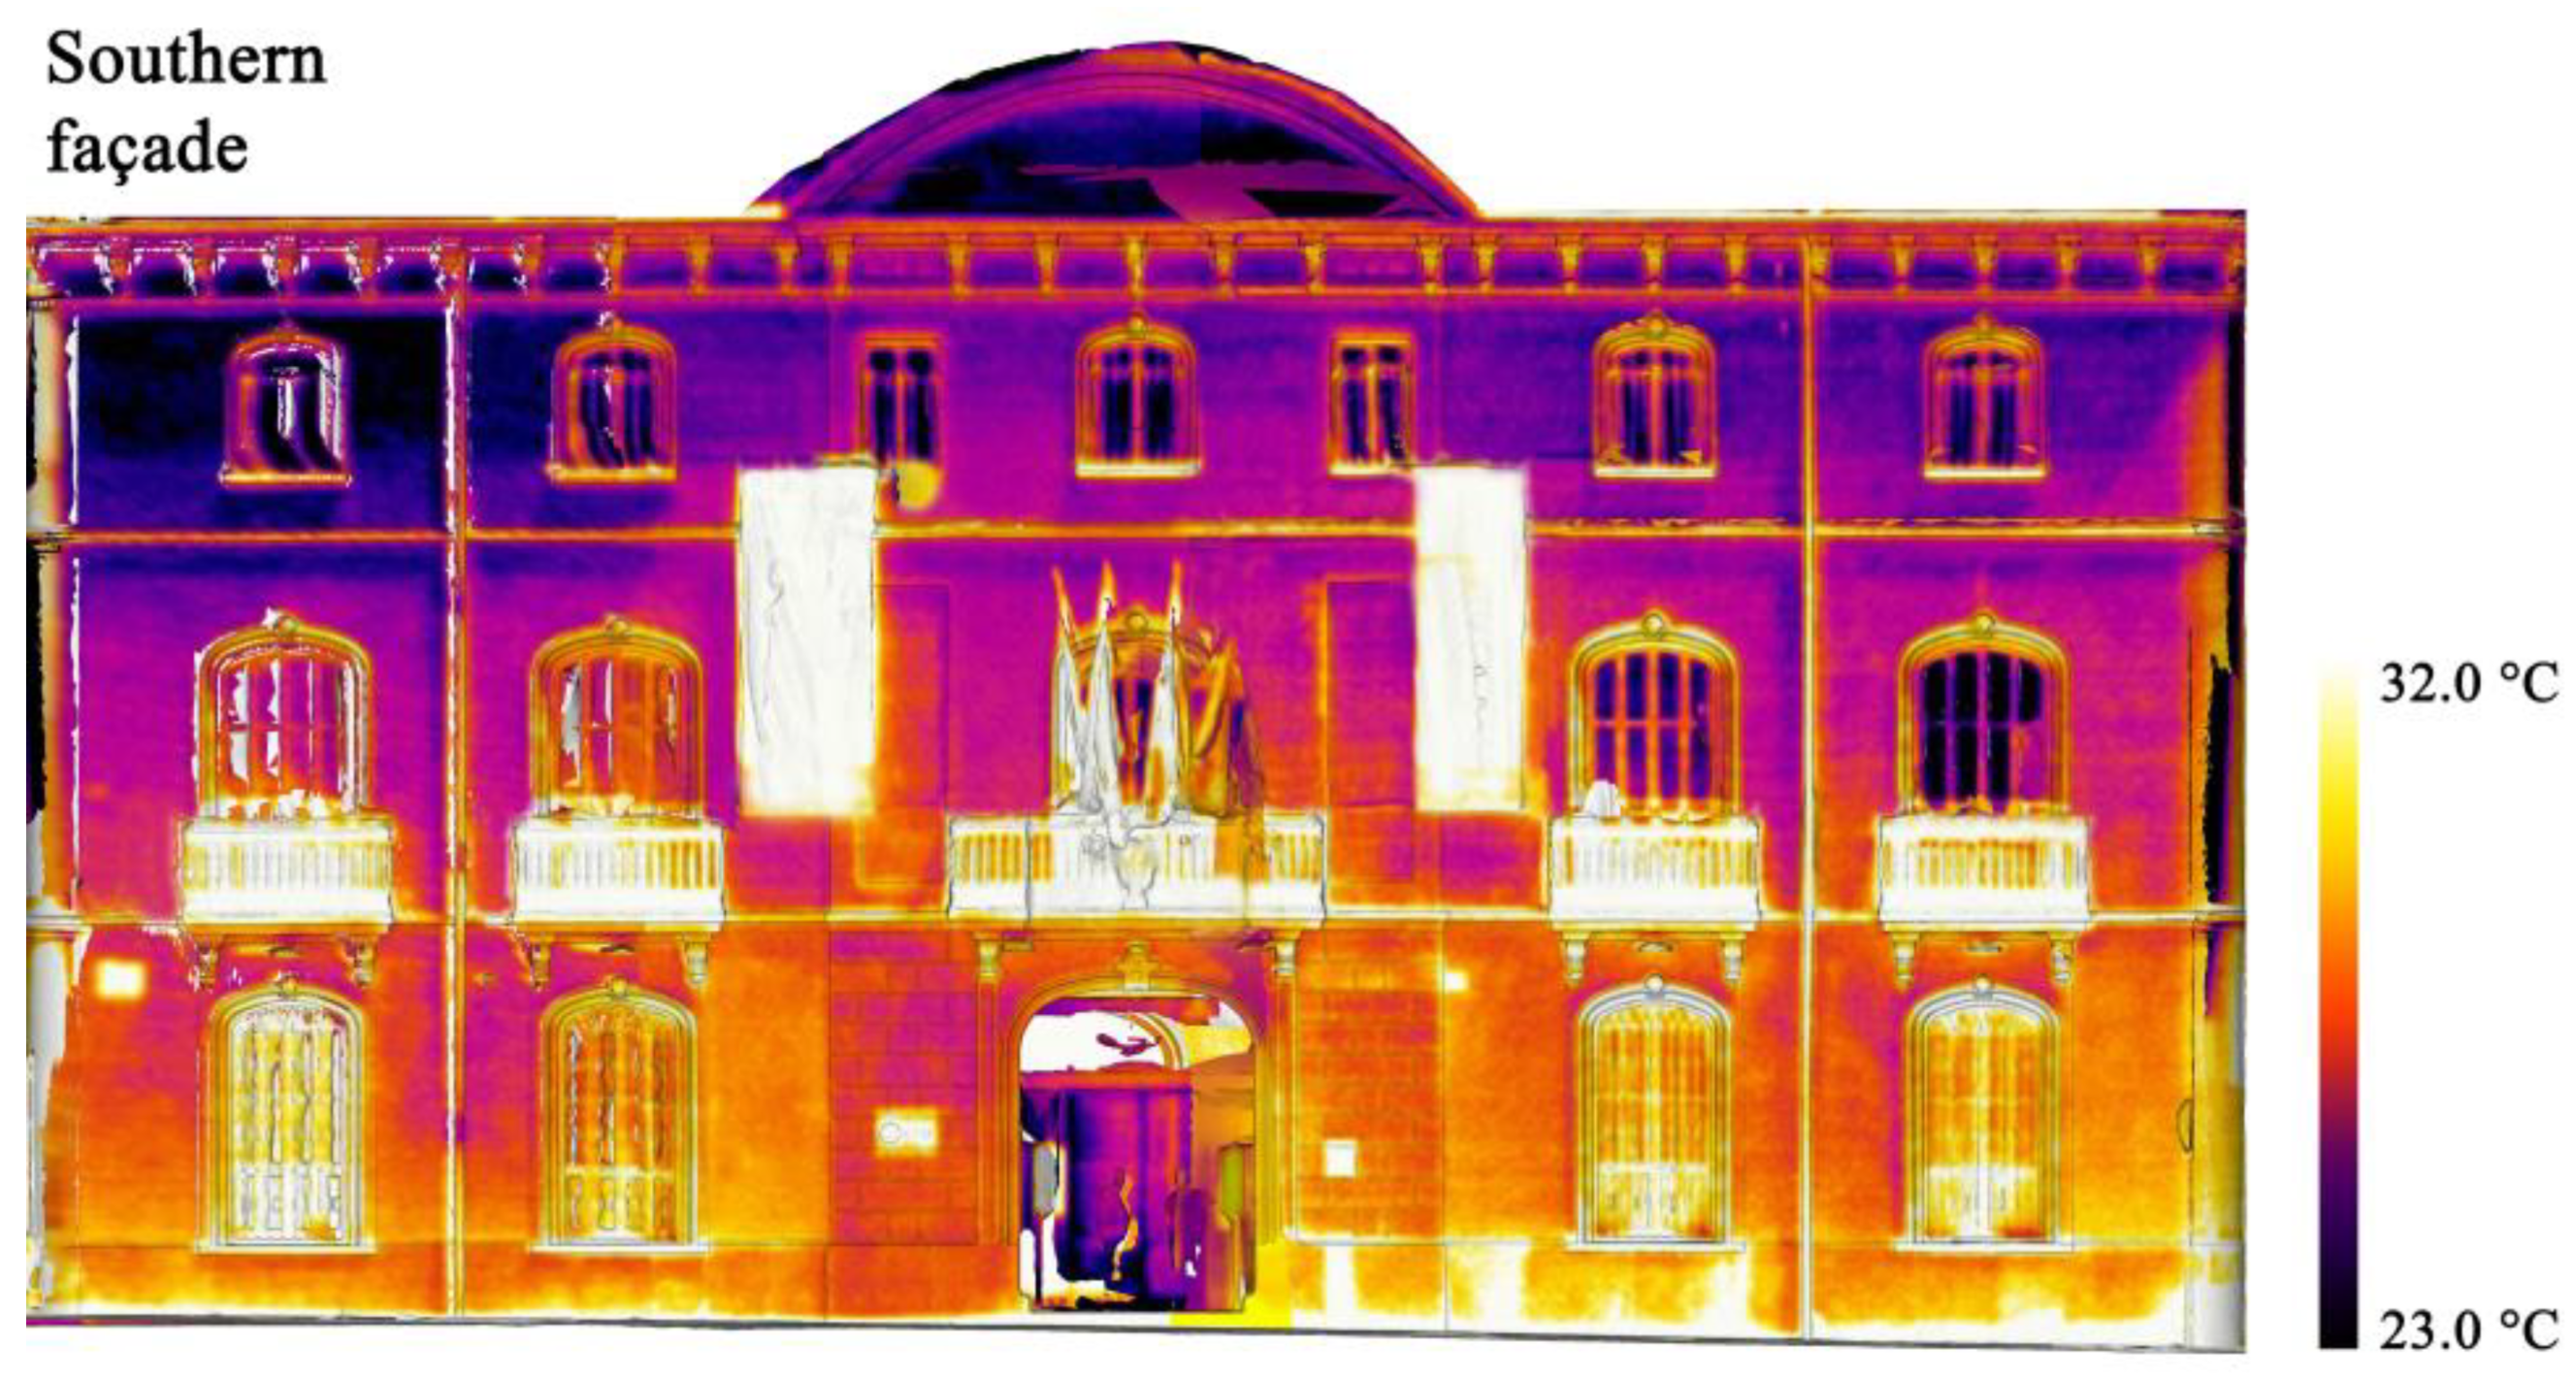
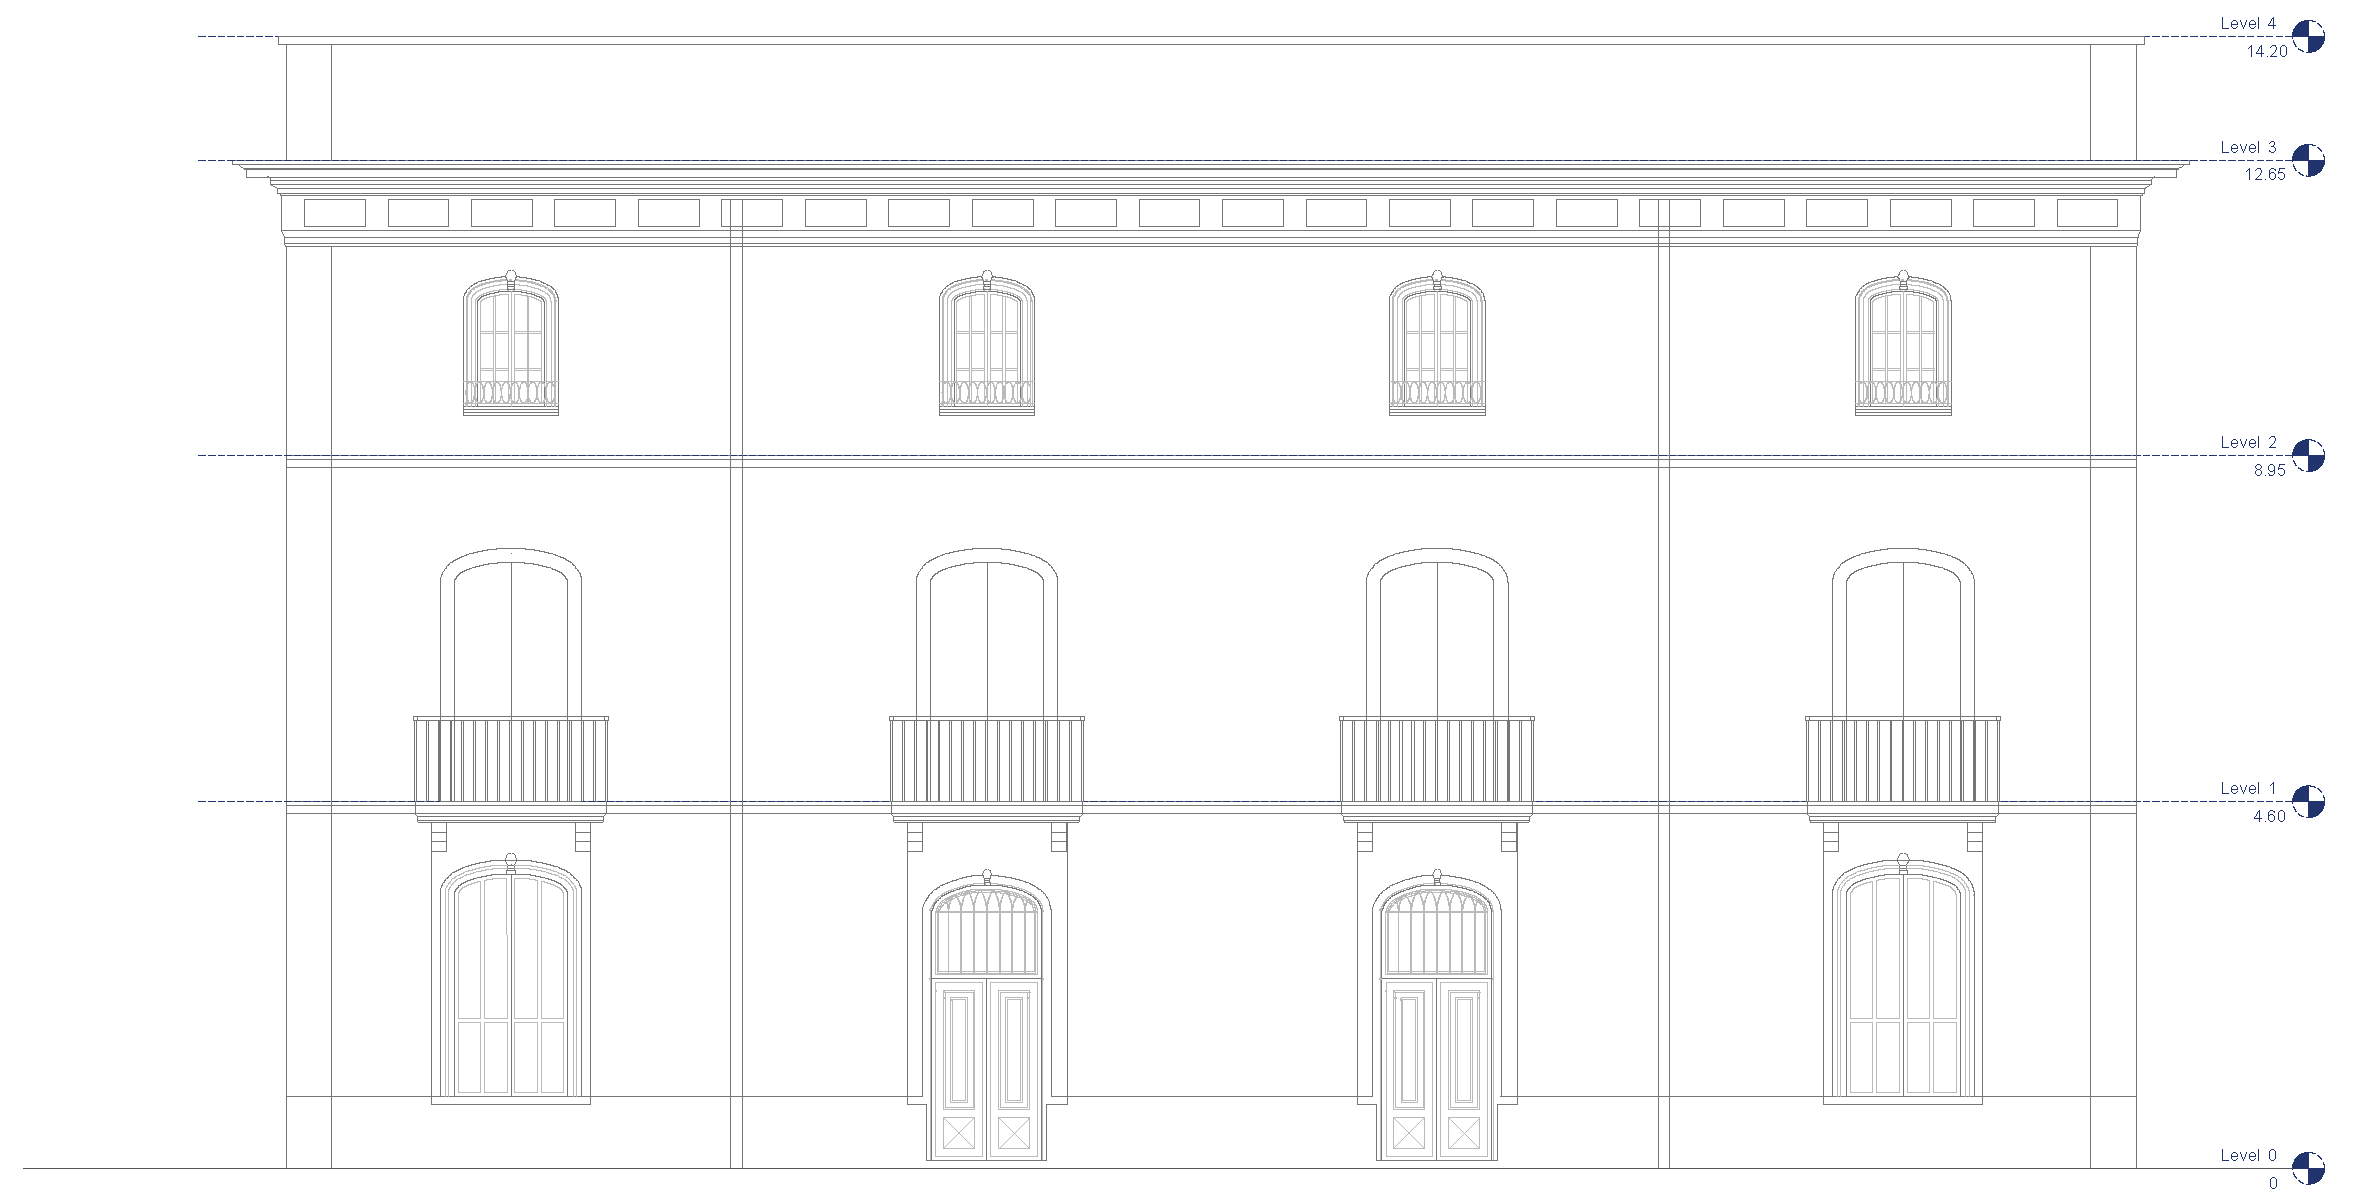
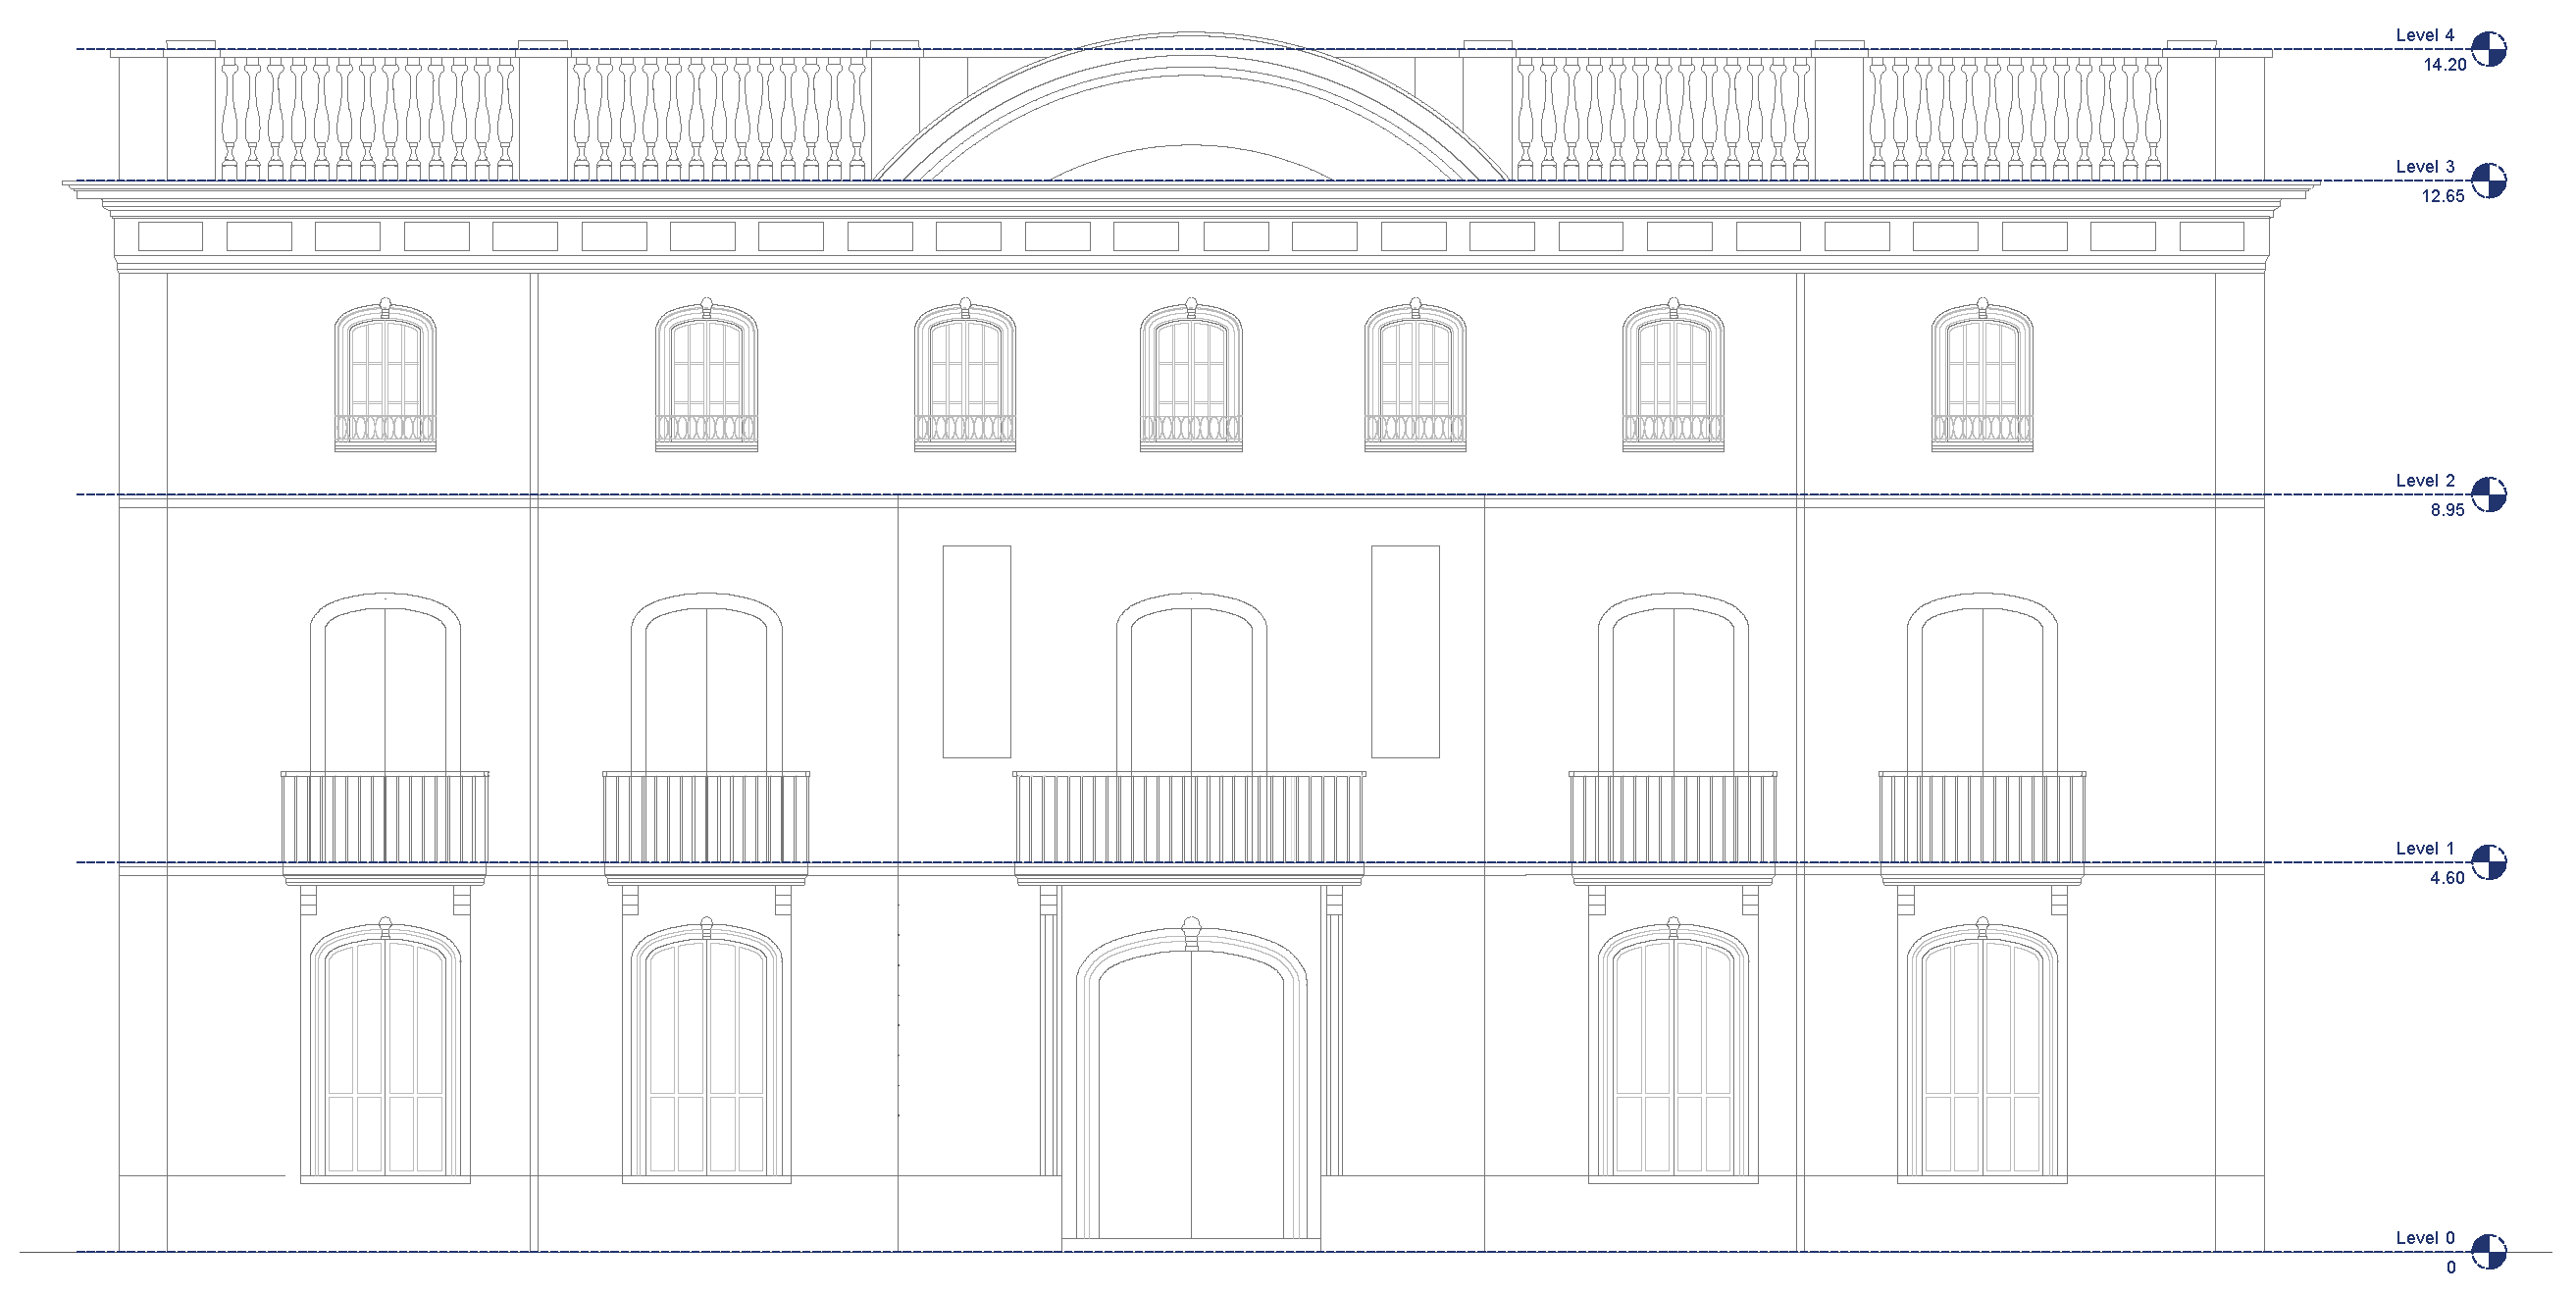
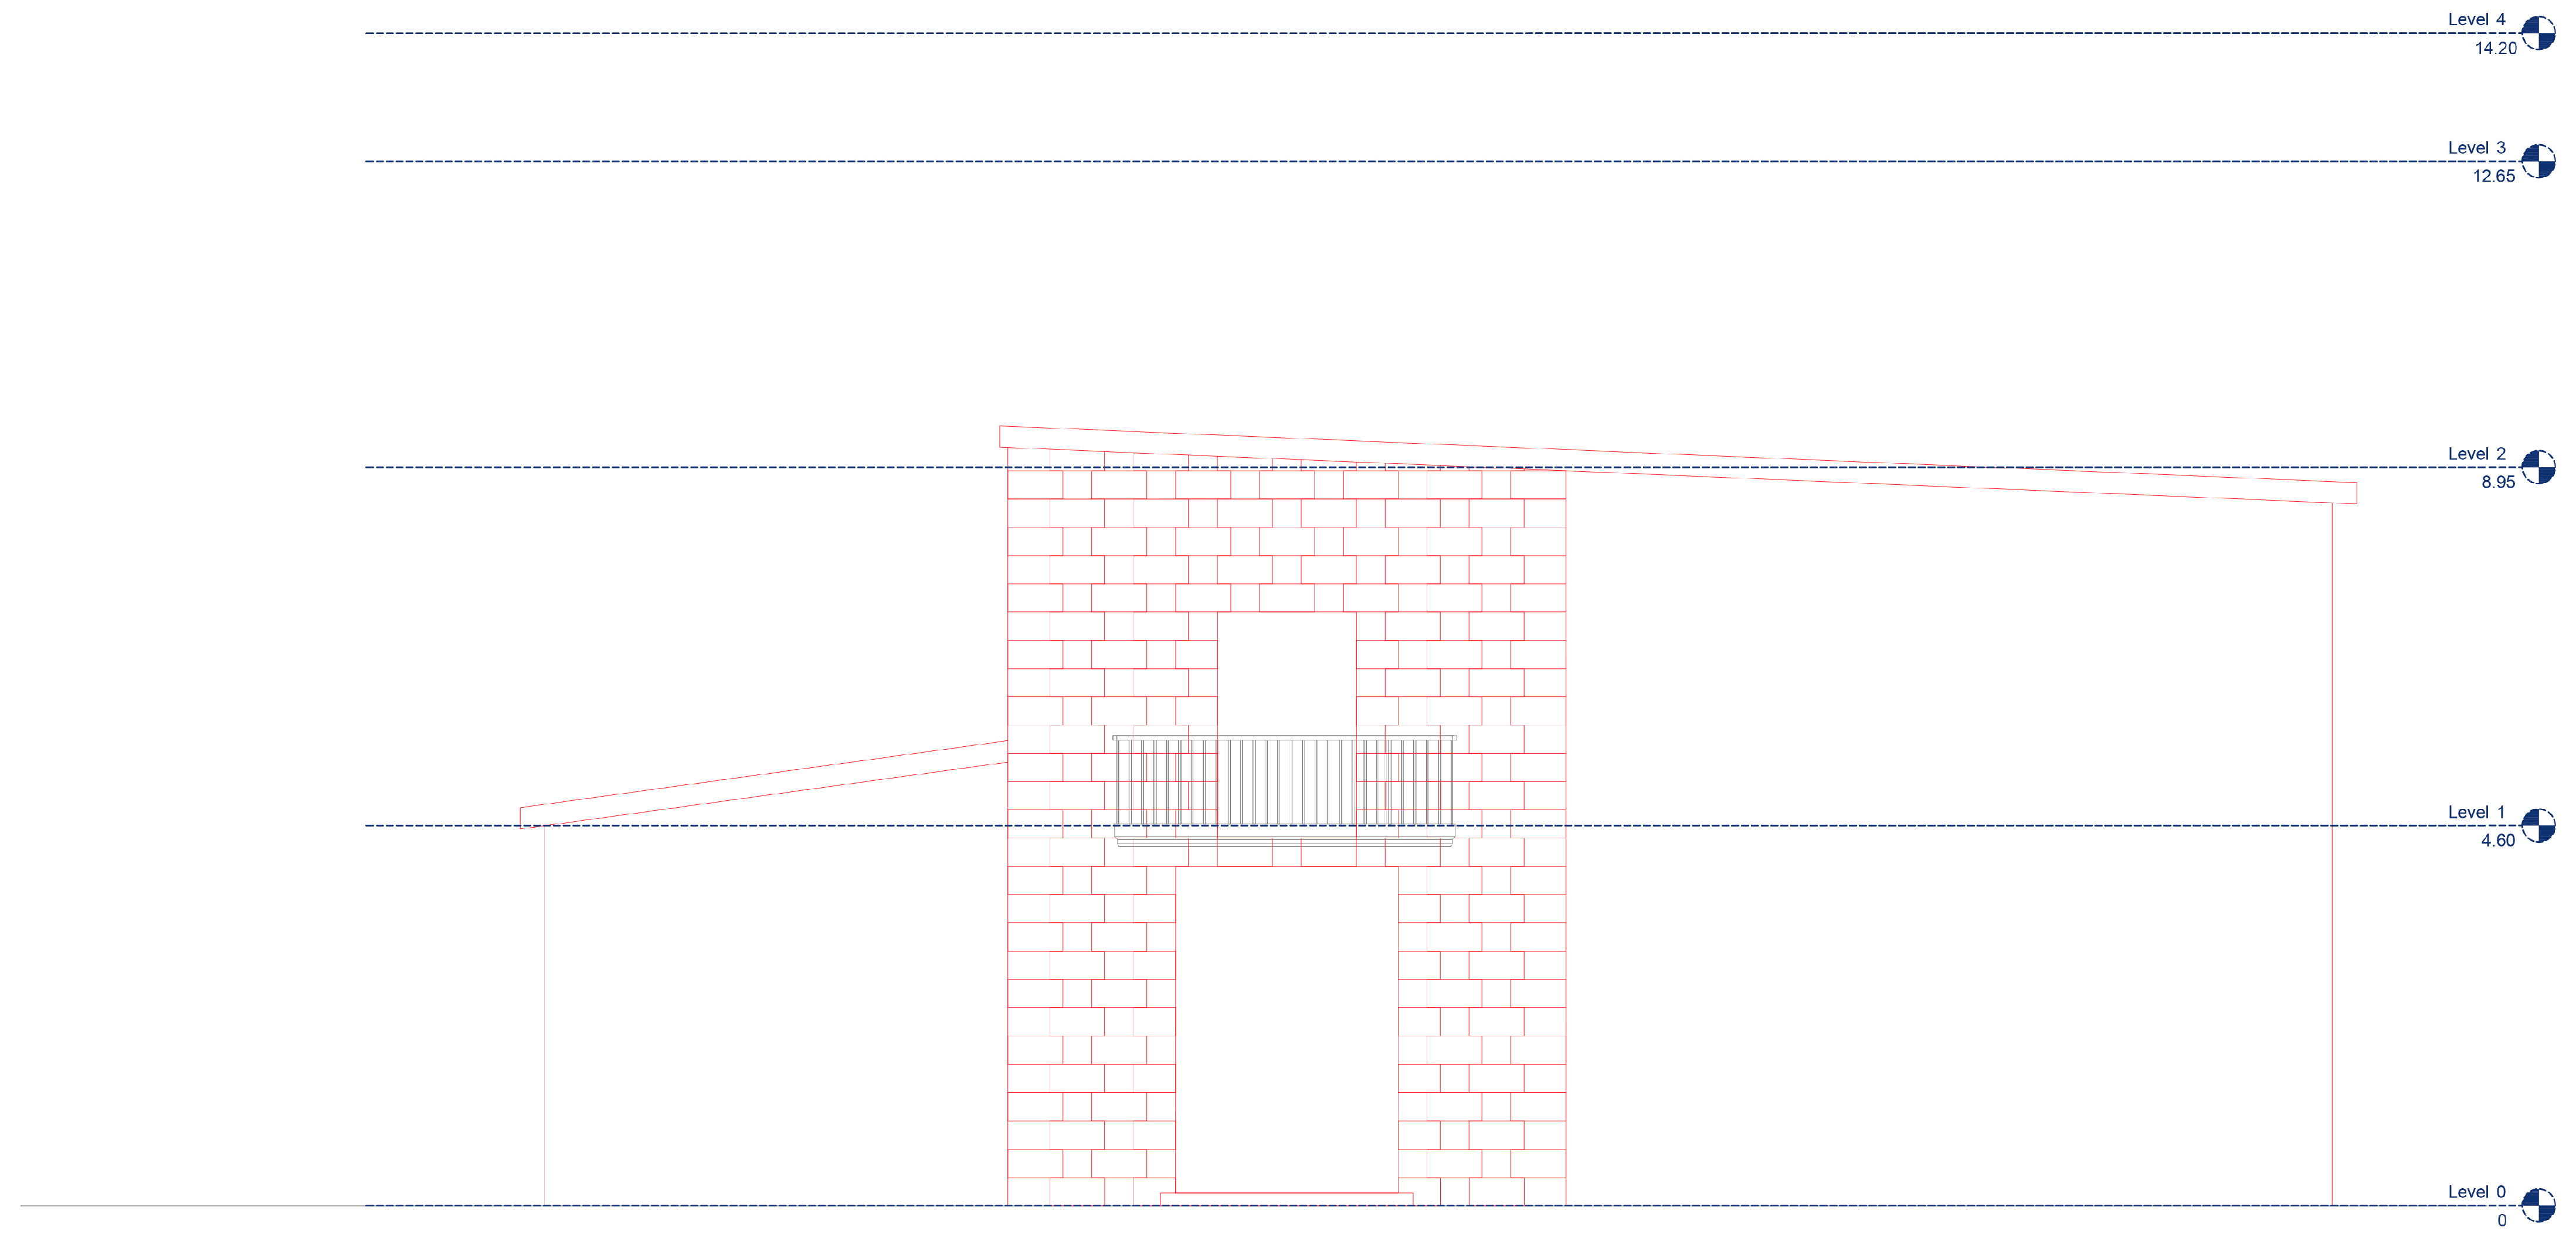
South façade, which is the main one and faces Almudín Street and its length seems not to have changed since 1704. Studying the plan of the 1995 project, the addition of a bay parallel to the existing one on the west façade can be clearly seen (Figure 28). This addition, which dates to between 1594 and 1704, influences the elevation of the south façade and has been marked in red (Figure 29). Thermography shows that the ashlar blocks surrounding the current main door were continuous on the upper floor, and this hypothesis has been colored in red (Figure 29).
-
The north façade, which faces the northern part of “Calle del Peso Nuevo de la Harina”, is the façade that has undergone the most changes. In the study, we can discard the north façade, since due to the two extensions that the building benefited from, its thermographic reading would only offer us the works carried out from 1863 onwards.
-
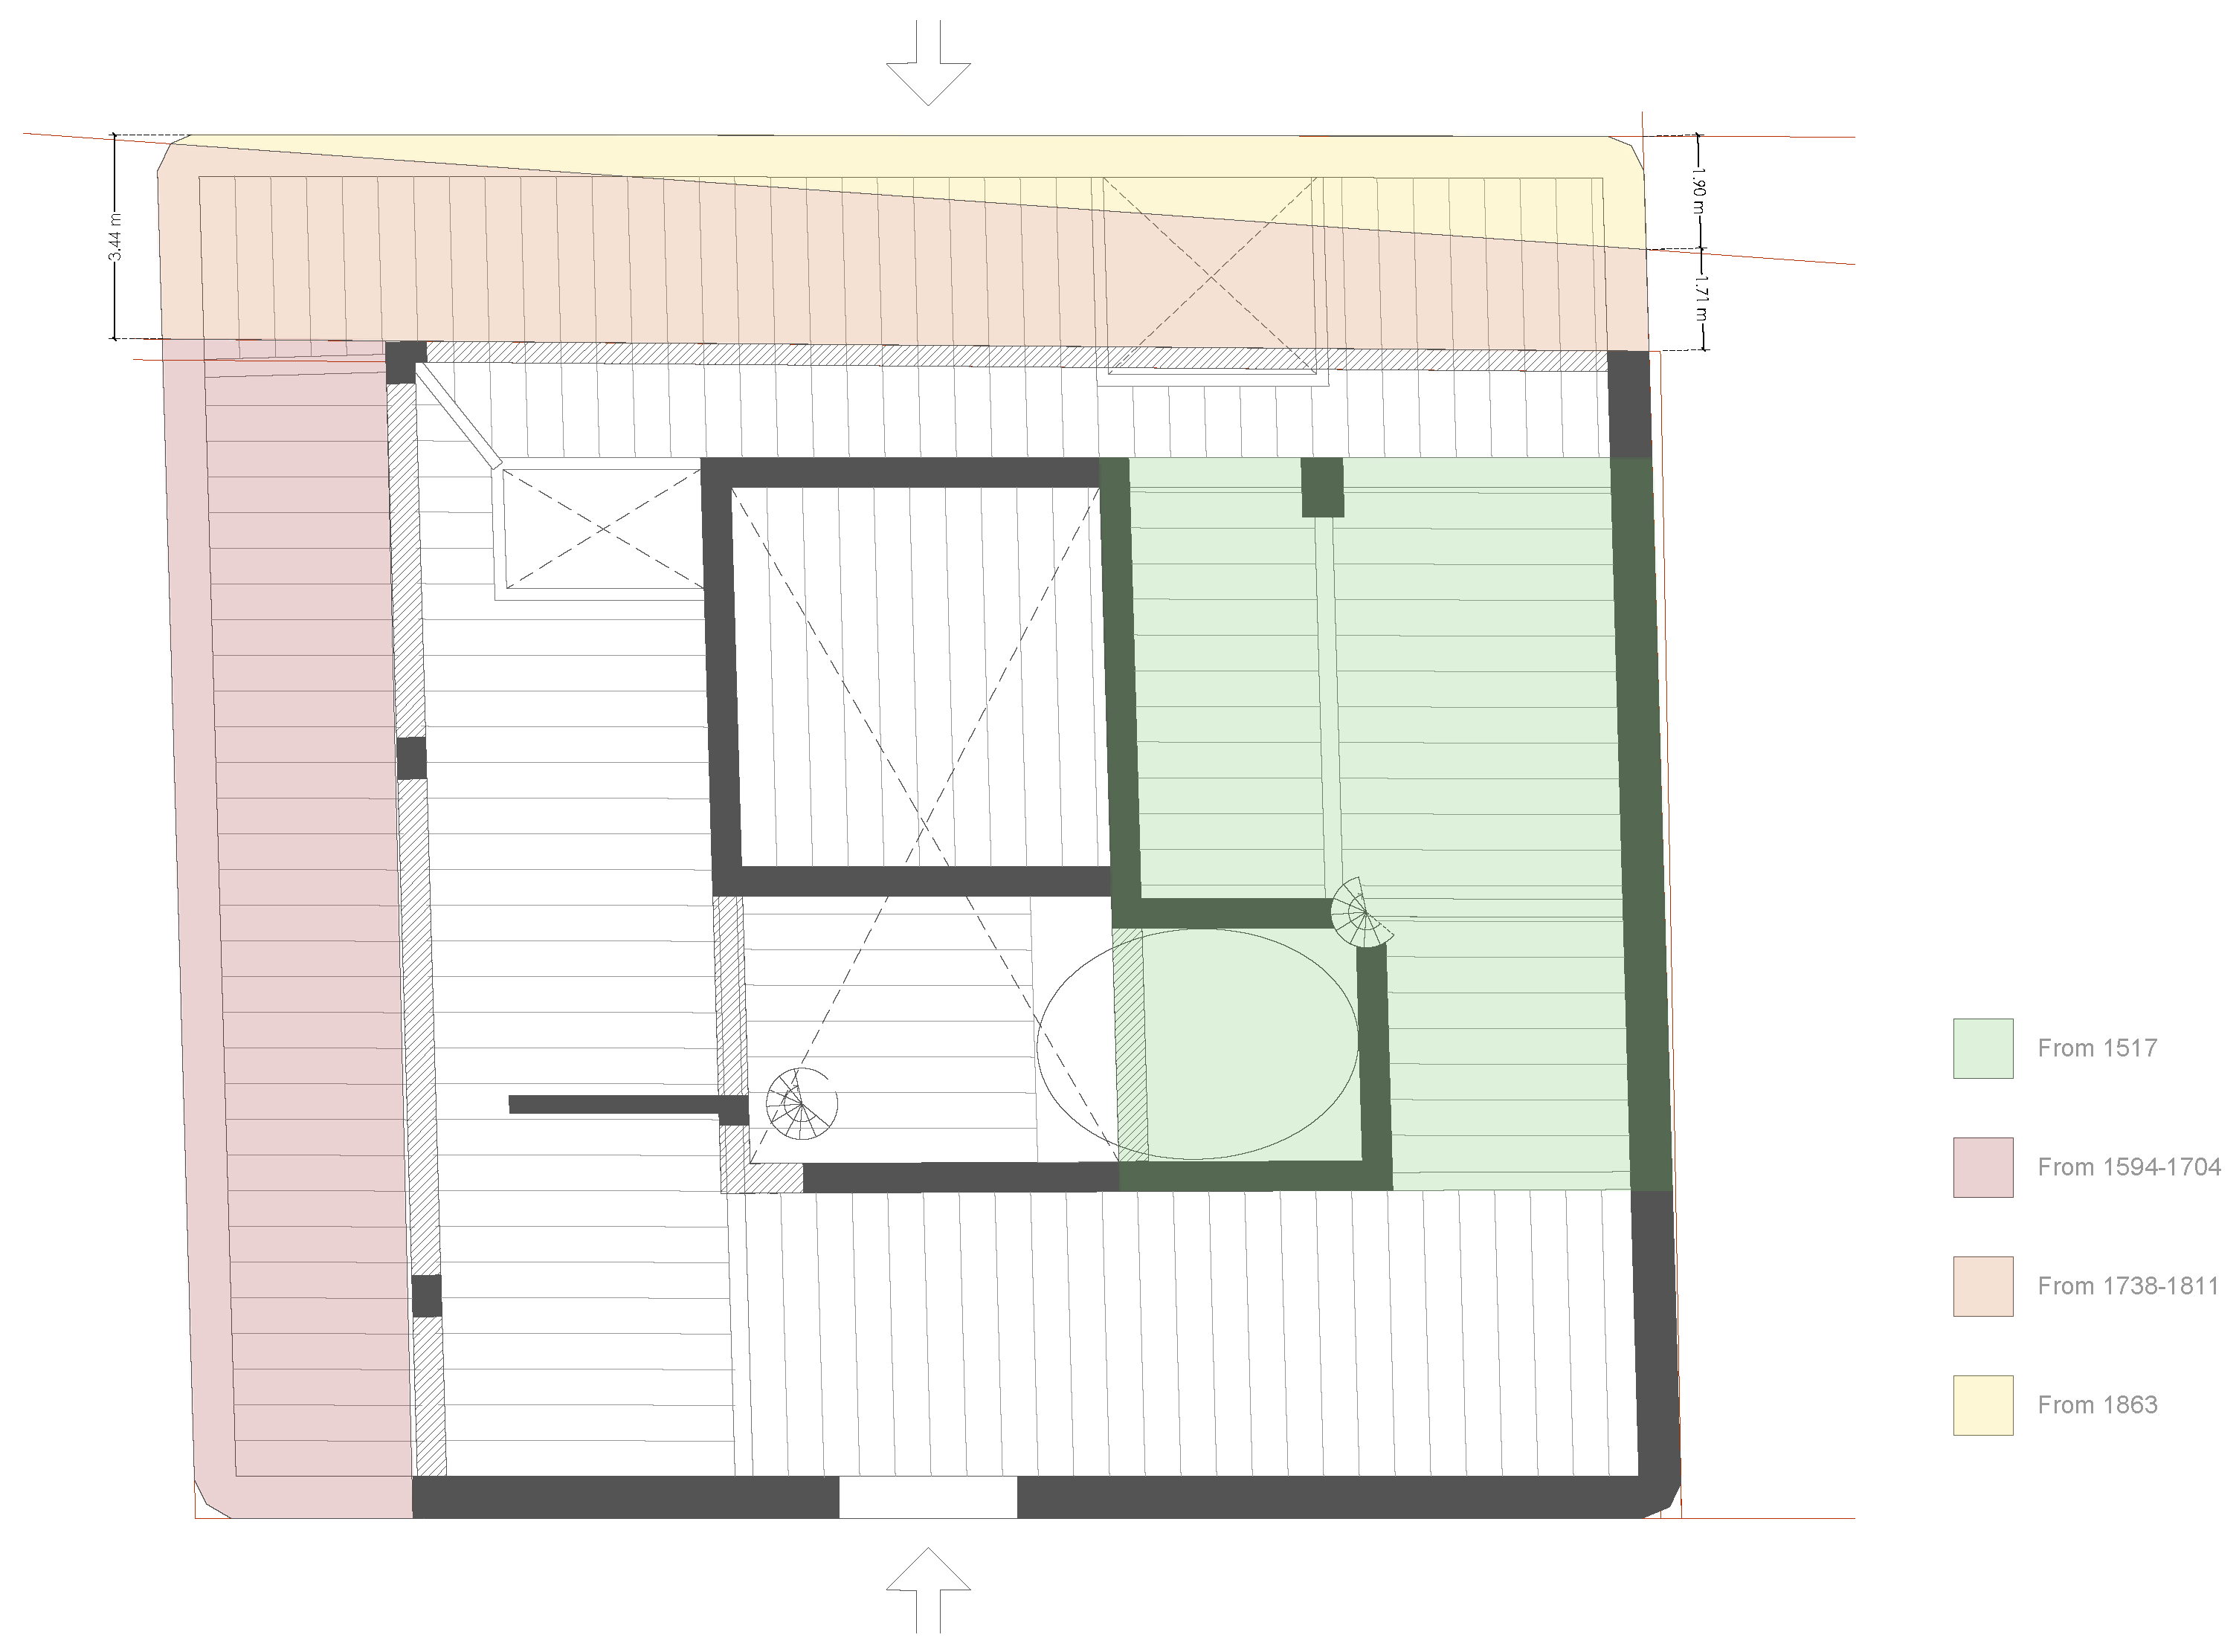
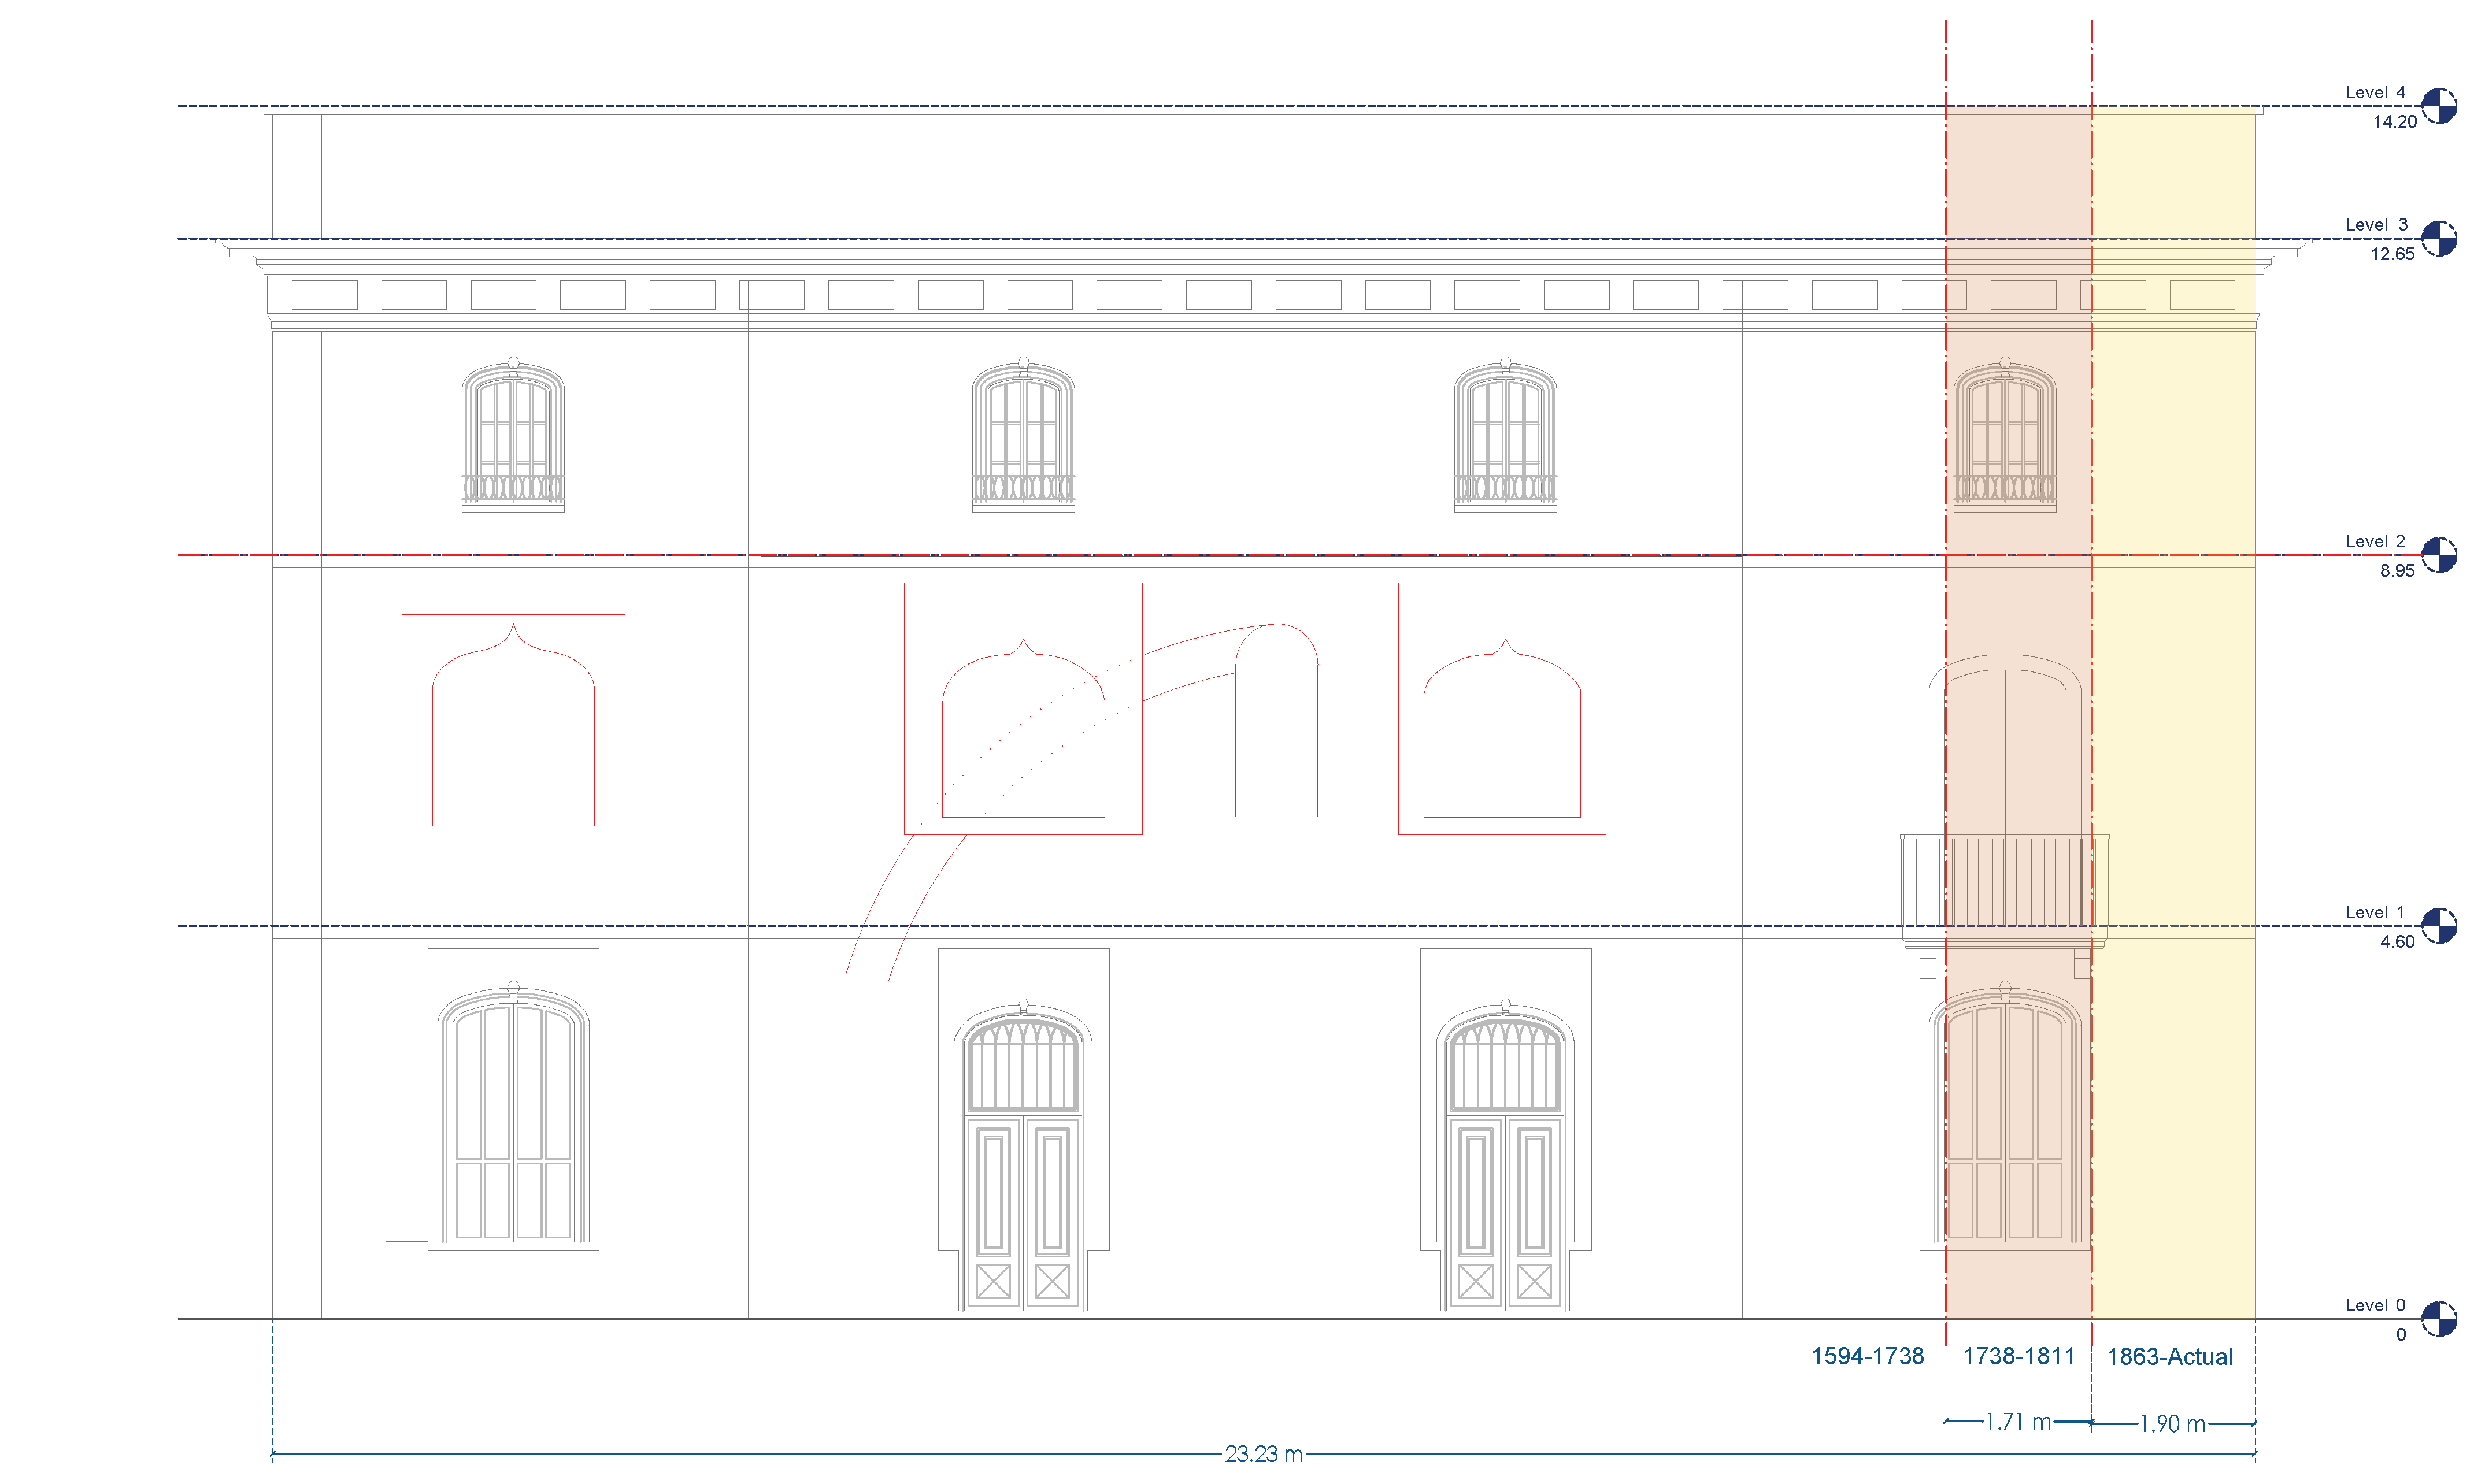
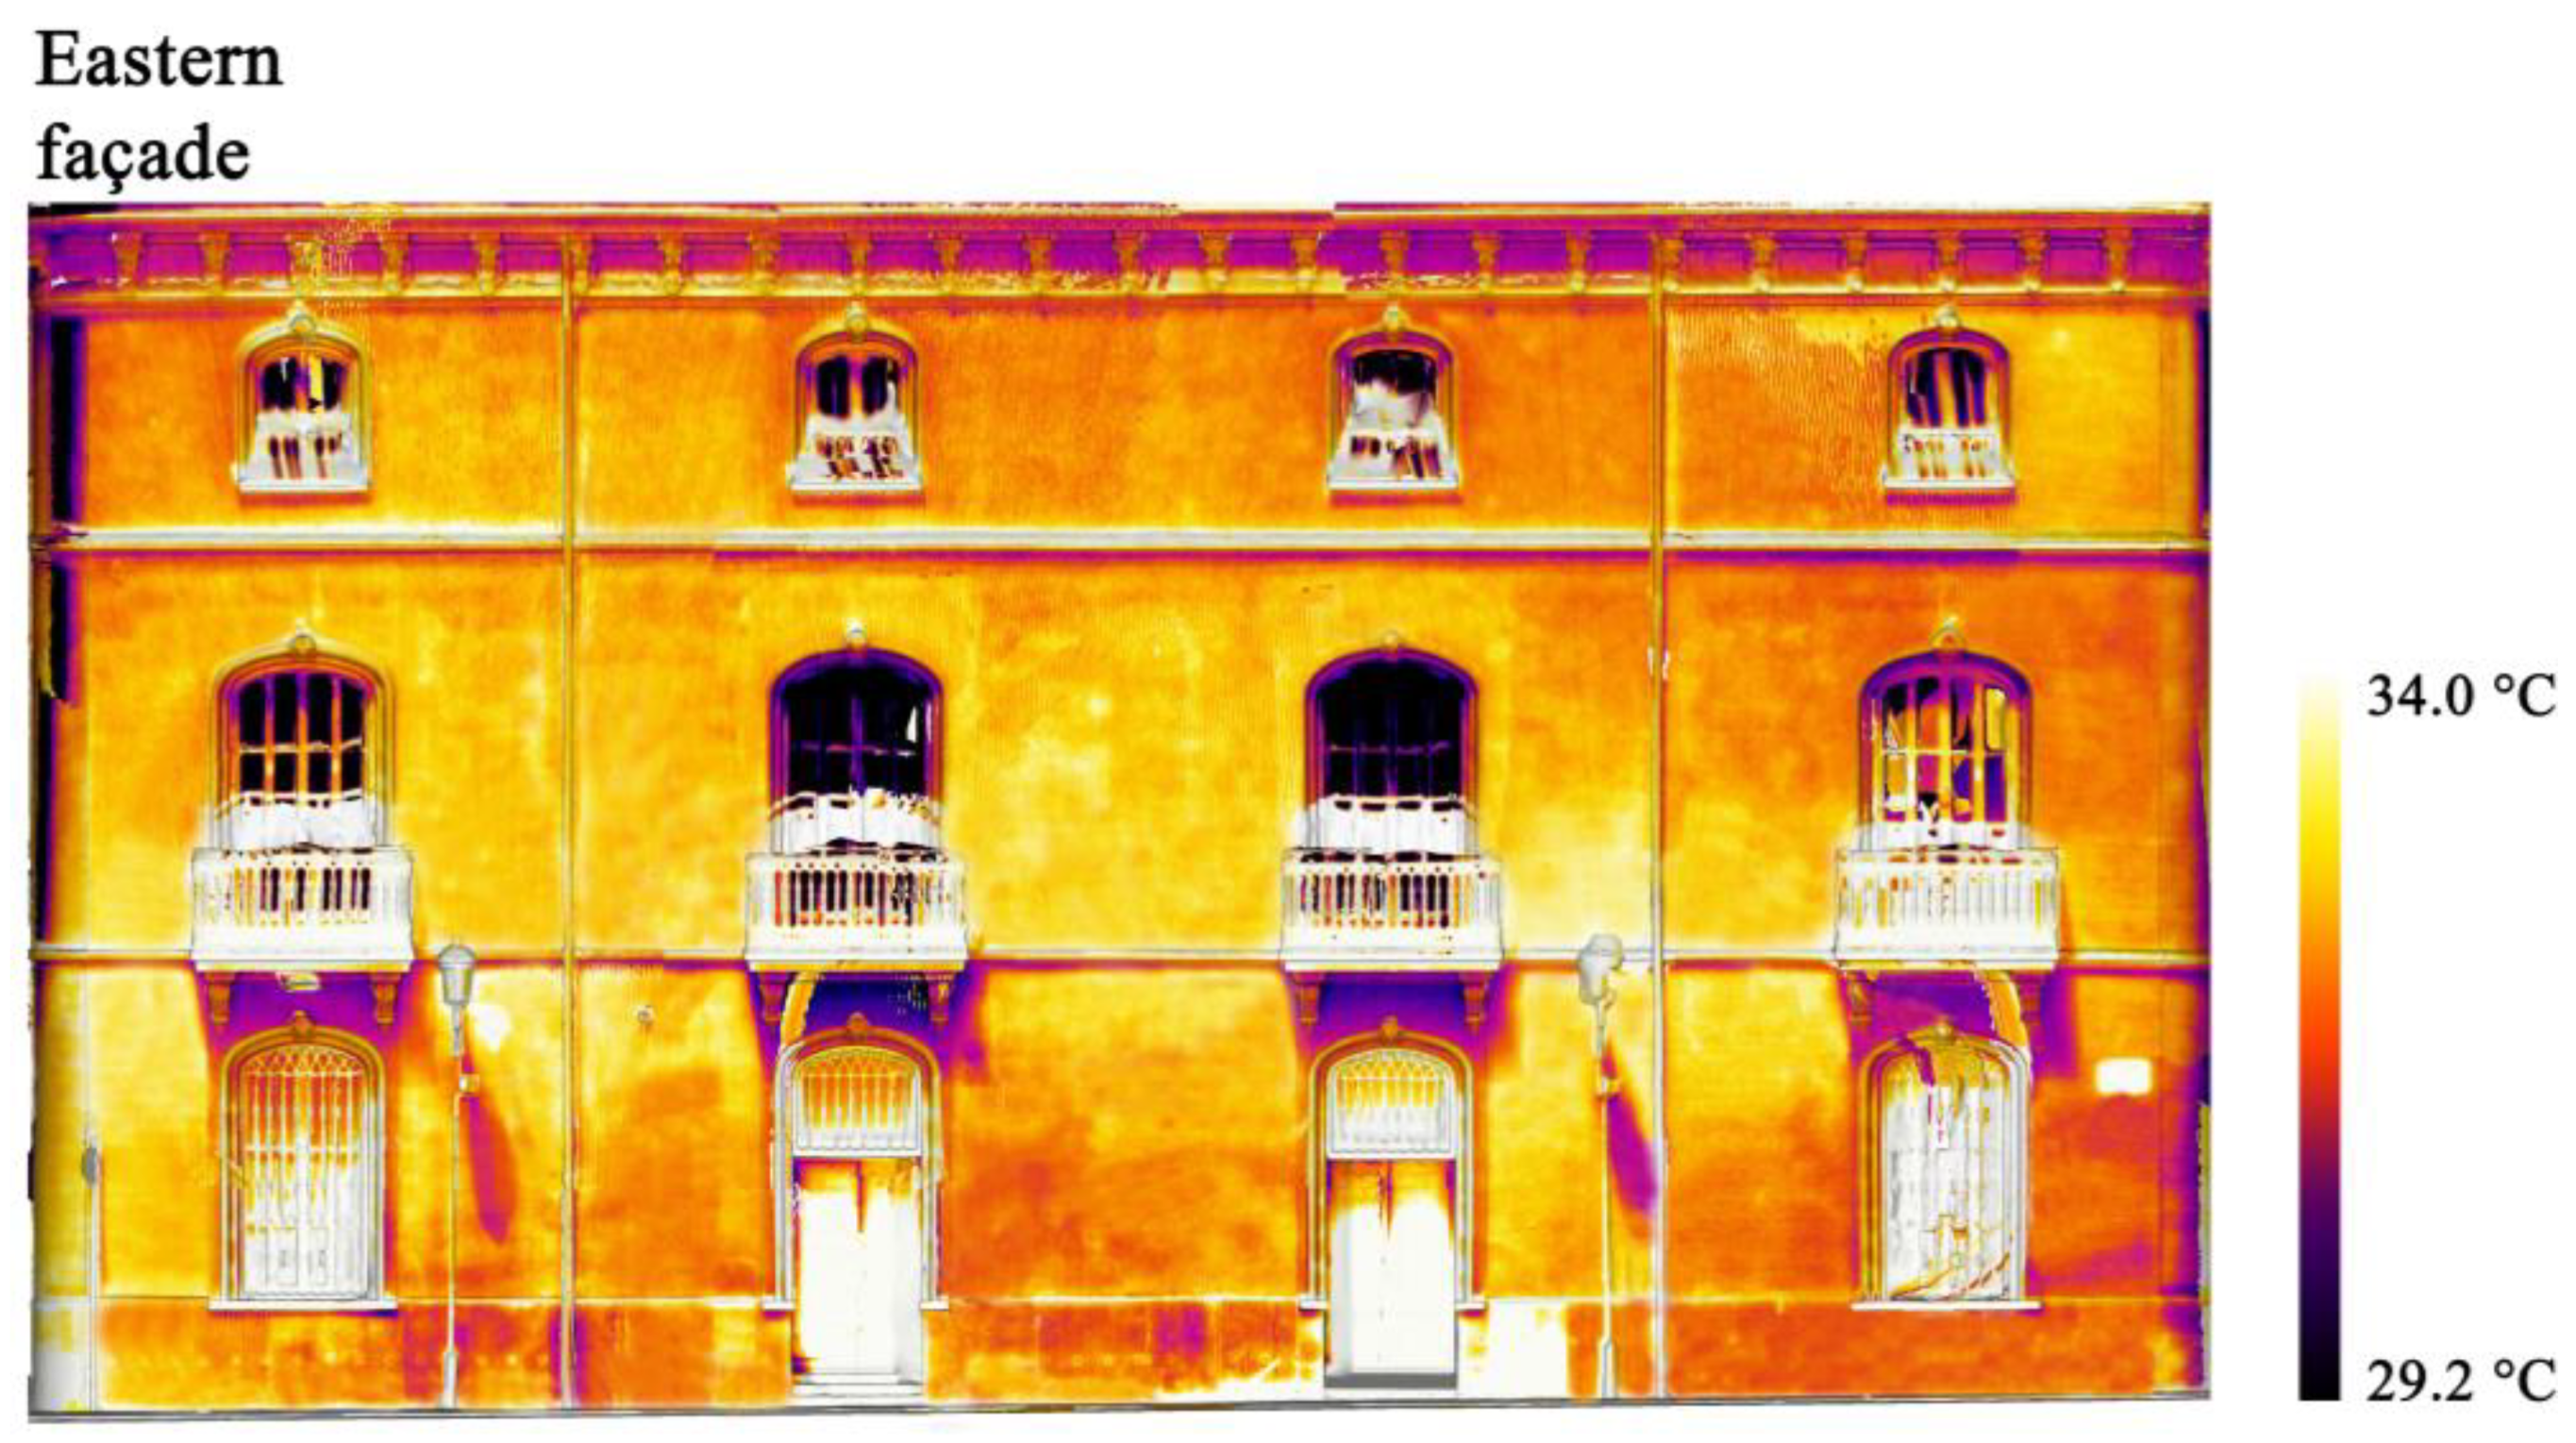
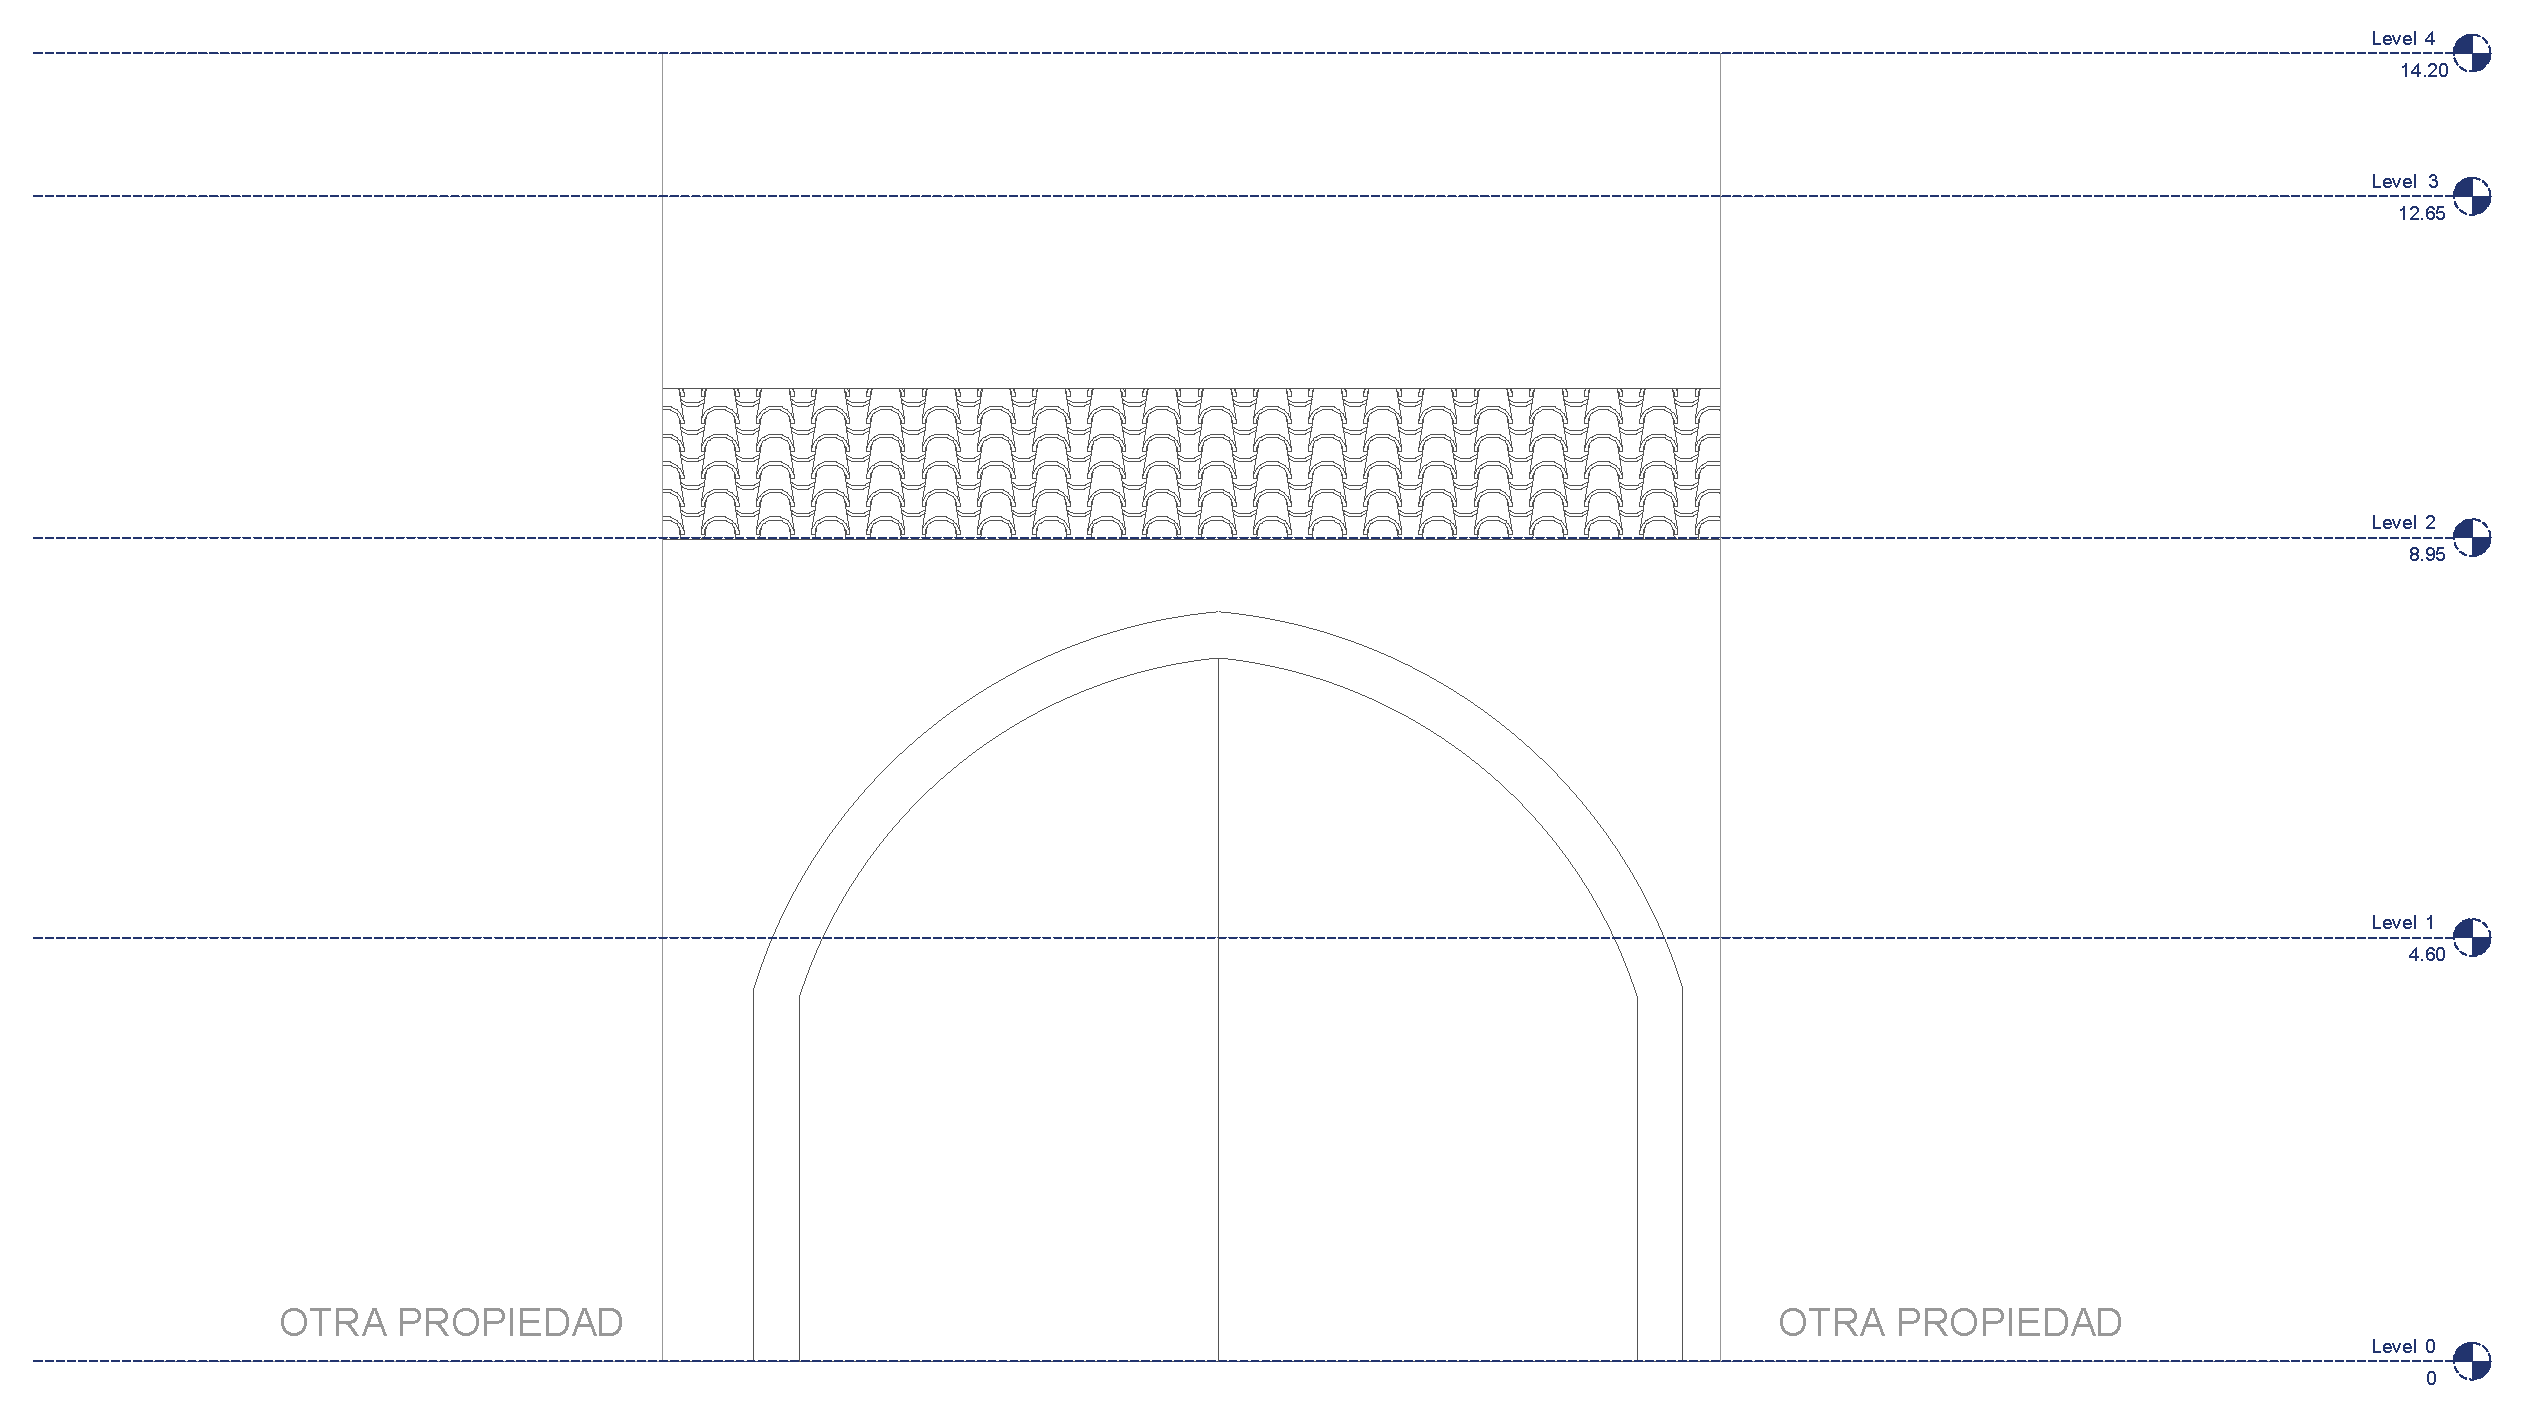
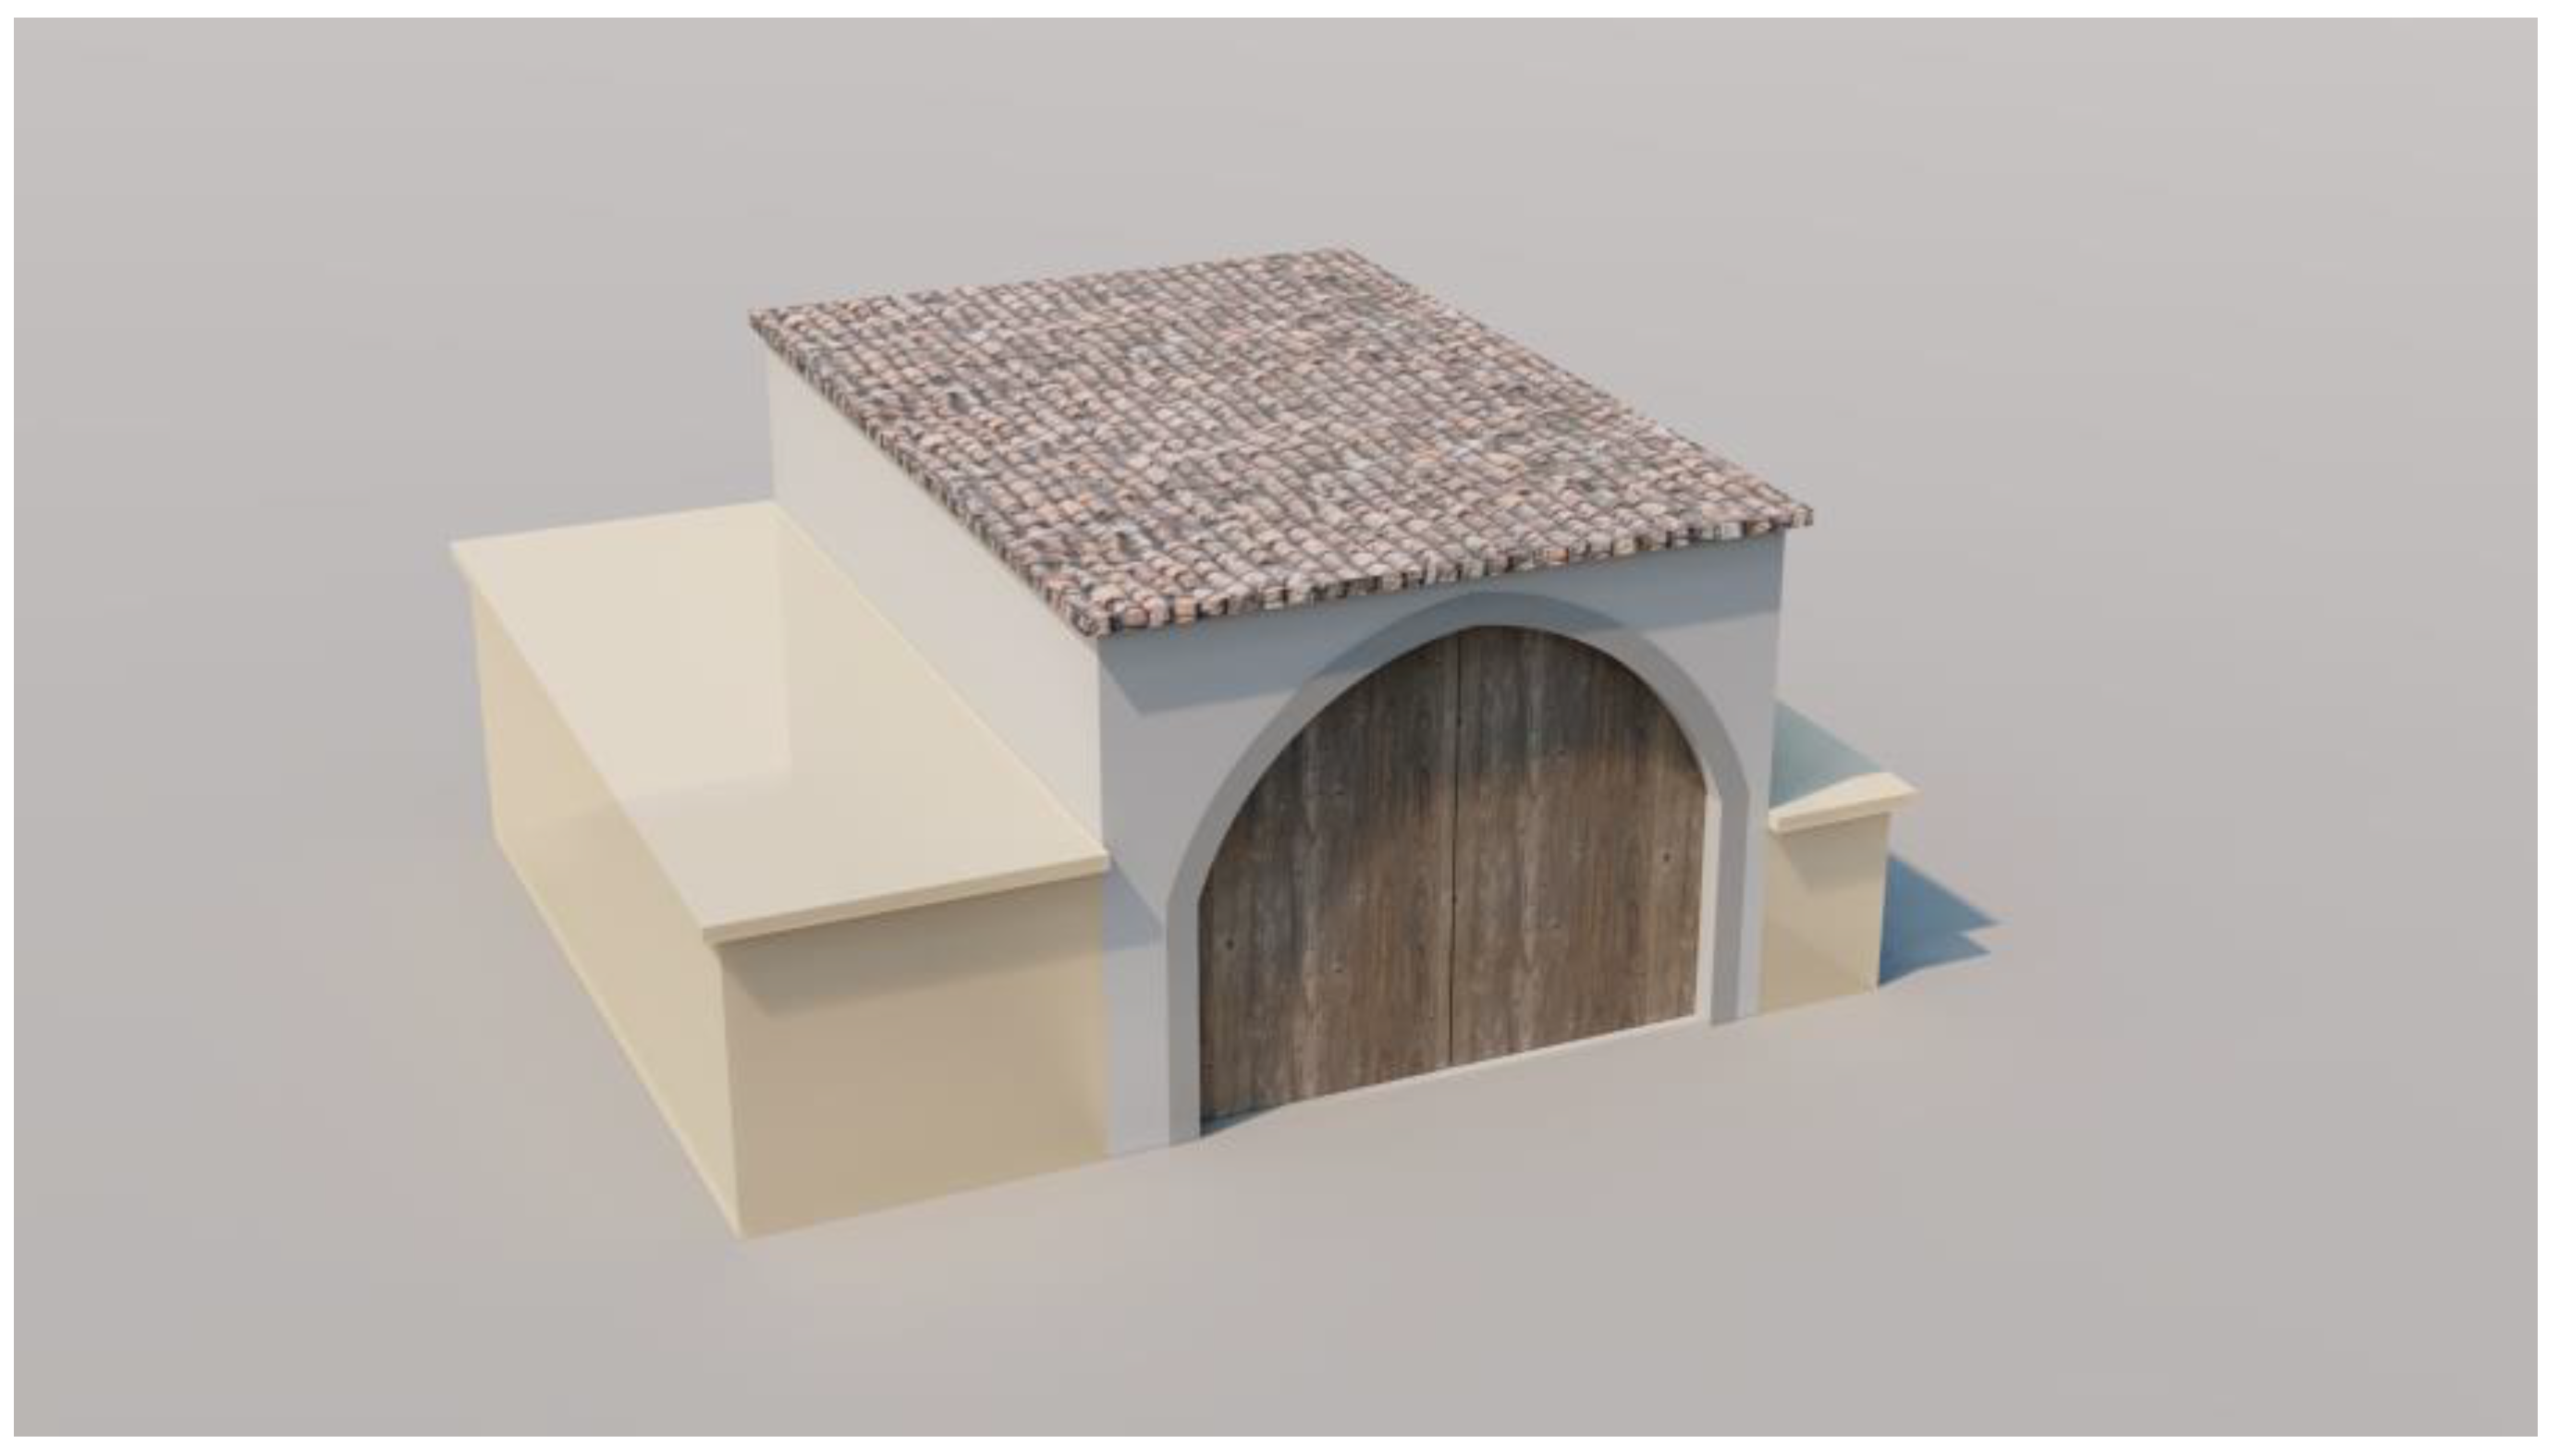
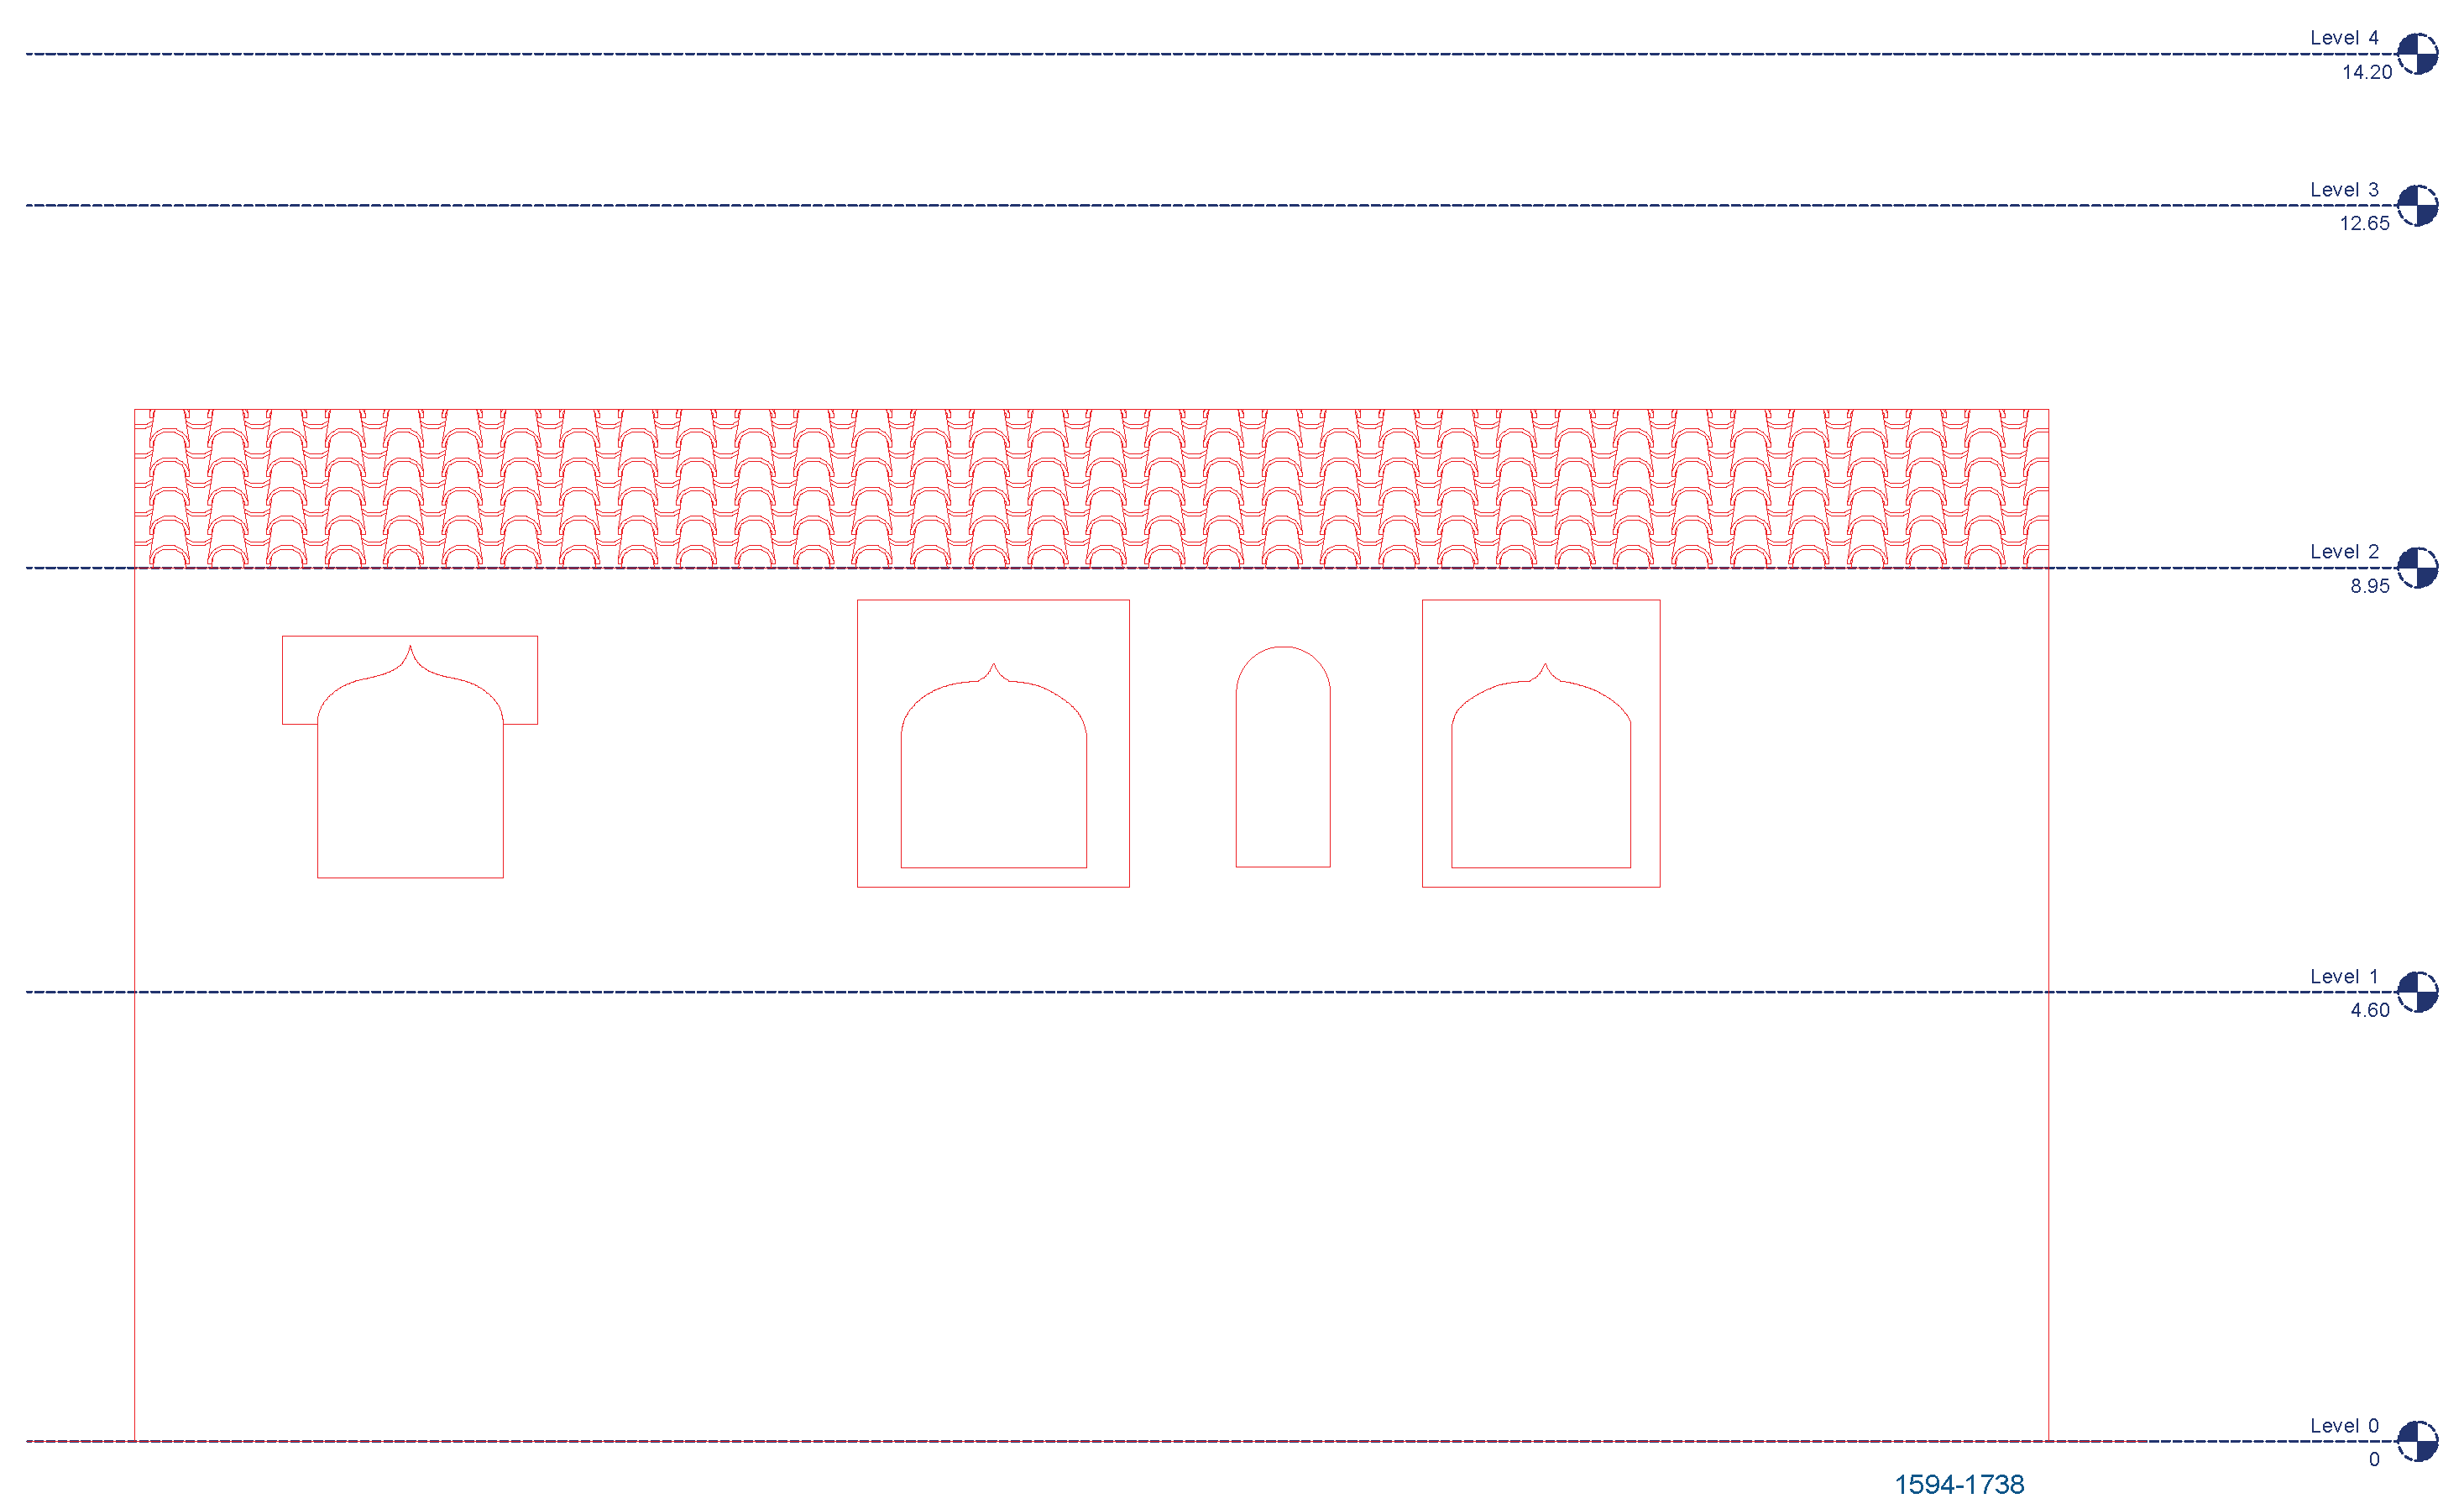
The east façade, which faces Salvador Street and is parallel to Almudín Street, must have been the main façade of the building and, according to what was studied in the cartography, the place of the first work in 1517. By studying the historical cartographic series of the city, the growth of the north façade can be determined. These additions are verified on the east façade and have been represented in different colours. The red band identifies the growth between 1738 and 1811, and the cream-colored band identifies the final extension between 1811 and 1863 (Figure 30). Through thermography, the following gaps, which are now hidden, have been identified and marked in red: on the ground floor, the perimeter of a large, pointed door that must have been the only access to the small building in 1517. On the first floor, three Gothic gaps and a niche. The niche is currently covered, and the other three gaps are hidden by the current windows (Figure 28).
-
The west façade is the one facing the west section of the street of the new flour weight, and, according to the Esquembre plan, one bay could have been extended from 1594 to 1704.
Figure 28. Plan of the building’s growth phases from 1517 to 1863 (Esquembre project).
Applsci 14 11962 g028
Figure 29. Drawn south façade anomalies.
Applsci 14 11962 g029
Figure 30. East façade anomalies visualized on CAD drawing.
Applsci 14 11962 g030
Using the cartographic information and that obtained from the floor plan, referring to the horizontal structure, prior to this intervention, contained in the 1995 project, a hypothesis of the building’s growth has been drawn up. For this study, its starting point has been considered the existing one; the only plans that reflect it were outlined by Vicente Tosca (1704) and Fortea (1738). The form chosen to represent the growth phases has been the one represented in the only ones that show the volume, as well as the plans by Tosca and Fortea.
Studying the horizontal and vertical structural plans existing in the 1995 project, one can intuit the phases built from 1594 or before 1704 (Figure 30). Three large phases are identified, marking each one with a different colour. The following growth, which affects the north, east and west façades (which occurred between 1738 and 1811), is added to the previous one by drawing it with a new colour. Here, the state and volume of the flour-weighing house before its sale is completed. Finally, the current volume is reached by incorporating the segment of the north street added from 1863 onwards.
The east façade is currently longer than that of the 16th century building, which is to be determined. For this reason, the pieces added to the plan between 1738 and 1811, as well as the one added in 1863, have been subtracted. The hypothesis of the east façade, which the building would have had in 1517, is shown in Figure 31 and Figure 32. The hypothesis of the east façade, which the building would have before 1704, is shown in Figure 33. The hypothesis of the south façade, which the building would have before 1704, is shown in Figure 34. Finally, the 3D hypothesis of the building’s façades, east and south, between 1517 and before 1704, is shown in Figure 35.
Based on the technical and historical studies carried out, this section aims to show a proposal of what the four façades of the building looked like at the end of the 16th century. Avoiding destructive methods such as chipping away at the cladding or carrying out tests, thermography was chosen. This system is non-destructive and considerably cheaper than the other existing ones.

4. Discussion

Although the initial research focused on identifying gaps from the 16th century that had survived the reform, the plan of the 1995 project has been valuable in determining the location of the resistant walls. Thanks to it, it has been proven that, although not centred, as in the funduq, there was also a courtyard to illuminate and ventilate the building internally.
The data extracted from the 1995 project, added to the information provided by the historical cartography, can enable a graphic reconstruction that determines the construction phases of the flour-weighing house. Two growths have been detected towards the north side and one towards the west side.
The growth towards the west side has only been detected through the 1995 project and was carried out before 1704 to expand the space of the flour-weighing house.
The study of the “reliable” historical cartography has allowed us to find out that from 1594 (once the block was consolidated), the building benefited from two extensions.
This came at the cost of taking space away from the north side of the flour-weighing street.
The first growth towards the north side, according to historical cartography, can be placed between 1704 and 1811 and the second would have taken place between 1811 and 1869.
In this case, the responses to the information provided by the thermography have been disparate and related to its location. The east façade (Salvador street), which receives the sun with hardly any obstacles, has been the one that has alerted to the existence of anomalies (Figure 28), which could be architectural elements of the façade prior to the 1863 project. Also, the same study applied to the south façade has revealed anomalies (Figure 29).
It has been found that the exposed plan of ashlars that exists on the ground floor, although hidden under the plastering, has its continuity on the upper floor. There are no gaps in this façade, deducing that the only existing one was the one at the entrance and that it coincides substantially with the current one. The study of the west façade, facing the west side of “Calle del Peso Nuevo de la Flour”, does not receive sunlight, as it is a very narrow street. A “heat cannon” could have been used to artificially increase its temperature. The fact that it is a private building and the limited financial means available for this article have made this impossible.
The north façade has not been the subject of thermographic images because in the cartographic study, prior to this phase, it was found that the medieval gaps would have disappeared because of the two extensions of the building.
In the framework of this research experience, thermographic techniques—and specifically, the possibilities offered by 3D spatial referencing between thermal information and the LiDAR model—have proven to be very useful. Although the results depend on the temperature difference between adjacent elements and, in this specific case, on the thickness of the plaster covering pre-existing elements, this approach provides a clear, economical, and non-destructive insight into its archaeological value.
In another order of things, for the future, it would be worth considering the possibility that a private asset, such as the Colomina Palace, could be transformed into a public asset. This would be necessary to be able to materialize what is set out in this study and to freely intervene in the property to recover the old endowment.
The cultural heritage has an important role in the regeneration of cities and landscapes aimed at the achievement of the environmental quality improvements promoted by international and national regulatory programs. It is considered as a non-renewable, irreplaceable source and a common good; therefore, its conservation is of well recognized importance. Valorising properties of high historic and artistic value (both public and private ones) means preserving them and giving them back to the community through their conservation [39] (p. 125).
This is the reason for the growing need for governments to compensate the parties, with an acquired right over the property for the losses resulting from their planning regulations, by compensating landowners for their losses due to planning interventions [40] (p. 1010).

5. Conclusions and Future Perspectives

The article informs both the citizens of Valencia and the scientific community about the new flour-weighing house. Despite its proven importance within the wheat cycle that supplied the ancient kingdom of Valencia, there is no published research on this subject. There is also no administrative record, since the book that recorded all the building’s construction or economic movements, as happens in other religious or municipal buildings, such as the Almudín, does not exist in the municipal historical archive of Valencia.
The only existing information, in published elements, is found in urban guides of Valencia, from the 18th and 19th centuries and in historical cartography. In historical cartography, while the flour-weighing house functioned as a municipal facility, its importance is highlighted since all the technicians point it out, or number it, as a singular building to be distinguished from the rest of the buildings in the town.
After confirming, from the information cited above, that such a building existed, old construction circumstances were assessed. It has been verified in other historic buildings, which have undergone extensions or transformations, that the construction professionals who carried them out took advantage of all possible elements of the existing work. That is, they made the position of the new openings coincide with that of the old ones or they used the wall, closing the existing openings that their project did not need.
Based on this question, it was thought that the new techniques would be a very interesting option in relation to other destructive techniques, such as excavations or cuts, in order to be certain of the existence of significant previous remains.
In this regard, it is worth highlighting another interesting aspect that emerged during this research experience, namely, the contribution that modern digital technologies, combined with 3D sensing strategies, can offer to studies aimed at analysing and interpreting built heritage. Specifically, for this study, a combination of thermography, digital photogrammetry and laser scanning was used, providing accurate and useful information. With regard to thermography, the important aspect was not only the information related to thermal anomalies, which, combined with the study of archival material and historical cartography, helped us to validate the research on the built heritage. In fact, what made it possible to locate, measure and quantify these anomalies was the opportunity to establish a spatial connection between the thermal data and the 3D model. Through this strategy, the building custom of making the most of what already exists has been verified and the exact points of the current façade that hide old elements have been located. The adopted approach can potentially facilitate this kind of analysis, contributing to the documentation and monitoring of built heritage with a sustainable, non-destructive and non-invasive integrated approach. However, despite these undeniably interesting aspects, there are still several challenges related to the efficient use of this technology, particularly regarding the establishment of a spatial connection between thermal information and 3D information. One of the main limitations of the proposed method is that the orthoimages generated with this approach are derived from a textured model, and therefore, the digital number does not represent the actual temperature value (which is inferred through the use of a false colour scale). Furthermore, the process of identifying the homologous points required to estimate the orientation matrix is carried out through a manual procedure, which is both labour-intensive and time-consuming.
Both of these limitations could be addressed by using SfM-based photogrammetric techniques, which would allow for the production of orthoimagery in which this information is embedded directly in the image pixel. However, as already highlighted in Patrucco et al. (2022), where an SfM-based approach was proposed and tested, the use of thermal images for photogrammetric purposes presents a long series of challenges [41], mainly due to the following reasons:
-
The low spatial resolution of this type of imagery and, consequently, the low level of detail in the 3D reconstruction;
-
The low radiometric contrast;
-
The acquired elements characterized by similar emissivity, leading to similar temperature;
-
The environmental conditions;
-
The difficulties in the detection of the traditional low-emissivity photogrammetric markers—used for the absolute orientation of the photogrammetric block in thermal images;
All these aspects could lead to significant difficulties in image orientation, especially when acquisition takes place in challenging contexts. In the case of the present research, for example, the presence of neighbouring buildings on three out of four sides of the studied building resulted in an extremely reduced acquisition distance (4–5 m), causing difficulties in capturing converging frames with an adequate percentage of overlap. For this reason, the texture-based methodology proposed in the current research was chosen in this case, despite the limitations outlined above.
The development of new strategies for further enhancing this process, with the goal of providing more effective tools for researchers working in the field of cultural heritage documentation, is undoubtedly an intriguing challenge and a research topic that is likely to advance with the support of new technologies.

Author Contributions

Conceptualization, A.G.-G.; methodology, A.G.-G., G.P. and J.L.L.; software, G.P.; validation, A.G.-G. and J.L.L.; investigation, A.G.-G., G.P. and J.L.L.; resources, A.G.-G., G.P. and J.L.L.; writing—original draft preparation, A.G.-G.; writing—review and editing, A.G.-G., G.P. and J.L.L.; visualization, A.G.-G. and G.P.; supervision, J.L.L.; funding acquisition, A.G.-G., G.P. and J.L.L. All authors have read and agreed to the published version of the manuscript.

Funding

This research received no external funding.

Institutional Review Board Statement

Not applicable.

Informed Consent Statement

Not applicable.

Data Availability Statement

The original contributions presented in this study are included in the article. Further inquiries can be directed to the corresponding author.

Conflicts of Interest

The authors declare no conflict of interest.

References

  1. De Rellana, M.A. Valencia Antigua y Moderna; Acción Bibliográfica Valenciana: Valencia, Spain, 1923. [Google Scholar]
  2. Tramoyeres, L. Instituciones gremiales. In Su Origen y Organización en Valencia; Imprenta de Doménech: Valencia, Spain, 1889. [Google Scholar]
  3. Gómez-Ferrer, M. La antigua capilla de San Vicente en el Monasterio de Santo Domingo de Valencia. Anales R. A. Cult. Valencia. 2020, 95, 323–343. [Google Scholar]
  4. Esclapés de Guilló, P. Resumen Historial de la Fundación i la Antigüedad de la Ciudad de Valencia; Impreso Antonio Bordazar: Valencia, Spain, 1738. [Google Scholar]
  5. Lamarca, L. El Teatro de Valencia Desde su Origen Hasta Nuestros Días; Imprenta de Ferrer de Orga: Valencia, Spain, 1840. [Google Scholar]
  6. de Cruilles, M. Guía Urbana de Valencia Antigua y Moderna; Imprenta de José Rius: Valencia, Spain, 1876; Volumes I and II. [Google Scholar]
  7. Martínez, R. El almudín de Valencia: Una restauración oportuna para la ciudad. Inf. Constr. 1998, 49, 29–49. [Google Scholar] [CrossRef]
  8. Jiménez, C. Del funduq a la alhóndiga: Un espacio entre el emirato nazarí y el reino de Granada (s. XV–XVI). Al-Qantara 2019, 40, 315–354. [Google Scholar] [CrossRef]
  9. Hernández, A. La pervivencia del funduq andalusí en las ciudades de Valencia, Murcia y Sevilla tras la conquista. un estudio a partir de los repartimientos del siglo XIII. Medievalismo 2021, 31, 235–271. [Google Scholar] [CrossRef]
  10. Martí, J.; Burriel, J. Comerciar en tierra extraña. La alhóndiga musulmana de la calle Corretgeria de Valencia. In Historia de la Ciudad. V: Tradición y Progreso; Valencia, Colegio Oficial de Arquitectos de la Comunidad Valenciana: Valencia, Spain, 2008; pp. 41–60. [Google Scholar]
  11. Jiménez, M.A. La alhóndiga de Villanueva de los Infantes. Cuad. Est. Manchegos 2018, 43, 33–63. [Google Scholar]
  12. Stylianidis, E. Photogrammetric Survey for the Recording and Documentation of Historic Buildings; Springer Nature: Berlin, Germany, 2020. [Google Scholar]
  13. Moropoulou, A.; Avdelidis, N.P.; Karoglou, M.; Delegou, E.T.; Alexakis, E.; Keramidas, V. Multispectral Applications of Infrared Thermography in the Diagnosis and Protection of Built Cultural Heritage. Appl. Sci. 2018, 8, 284. [Google Scholar] [CrossRef]
  14. Bianchi, M.G.; Casula, G.; Cuccuru, F.; Fais, S.; Ligas, P.; Ferrara, C. Three-dimensional imaging from laser scanner, photogrammetric and acoustic non-destructive techniques in the characterization of stone building materials. Adv. Geosci. 2018, 45, 57–62. [Google Scholar] [CrossRef]
  15. Dritsa, V.; Orazi, N.; Yao, Y.; Paoloni, S.; Koui, M.; Sfarra, S. Thermographic Imaging in Cultural Heritage: A Short Review. Sensors 2022, 22, 9076. [Google Scholar] [CrossRef] [PubMed]
  16. Glavaš, H.; Hadzima-Nyarko, M.; Haničar Buljan, I.; Barić, T. Locating Hidden Elements in Walls of Cultural Heritage Buildings by Using Infrared Thermography. Buildings 2019, 9, 32. [Google Scholar] [CrossRef]
  17. Usamentiaga, R. Easy Rectification for infrared images. Infrared Phys. Technol. 2016, 76, 328–337. [Google Scholar] [CrossRef]
  18. Lerma, J.L.; Cabrelles, M.; Akasheh, T.S.; Haddad, N.A. Documentation of weathered architectural heritage with visible, near infrared, thermal and laser scanning data. Int. J. Herit. Digital Era 2012, 1, 251–275. [Google Scholar] [CrossRef]
  19. Dlesk, A.; Vach, K. Point cloud generation of a building from close range Thermal images. ISPRS Int. Arch. Int. Soc. Photogramm. Remote Sens. 2019, 42, 29–33. [Google Scholar] [CrossRef]
  20. Patrucco, G.; Gómez, A.; Adineh, A.; Rahrig, M.; Lerma, J.L. 3D Data Fusion for Historical Analyses of Heritage Buildings Using Thermal Images: The Palacio de Colomina as a Case Study. Remote Sens. 2022, 14, 5699. [Google Scholar] [CrossRef]
  21. Ferrero, R. Impuestos municipales sobre los cereales en la Valencia del Quinientos. Estudis 1985, 12, 55–70. [Google Scholar]
  22. Peset, M.; Hernando, P. Comunales y Propios en Valencia. Salustiano de Dios de Dios, Javier Infante Miguel-Motta, Ricardo Robledo Hernández, Eugenia Torijano Pérez (cord.). In Proceedings of the Historia de la propiedad en España. Bienes Comunales, Pasado y Presente: II Encuentro Interdisciplinar, Salamanca, Spain, 31 May–3 June 2000; pp. 179–210.
  23. Hernando, M.P. Un siglo de reformas: Haciendas municipales y Reglamentos en la Valencia del XVIII. AHDE 2013, LXXXIII, 543–568. [Google Scholar]
  24. Blanes, R. Los silos de Burjassot (1573–1600); Serie Minor nº 11; Generalitat Valenciana: Valencia, Spain, 1992. [Google Scholar]
  25. de Valencia, A. Reglamento que Deberá Observarse en la Administración y Distribución de las Rentas de Propios y Arbitrios que Disfruta la Ilustre Ciudad de Valencia, Sujeto al Primitivo Reglamento que en el Año de 1767 Prefinió el Consejo a la Misma Ilustre Ciudad, con Demostraciones de su Actual Estado Según las Reales Soluciones, y Decretos Expedidos Desde Dicho año de 1767 Hasta el Día que Han Originado su Alteración; Imprenta de Benito Monfort: Valencia, Spain, 1802. [Google Scholar]
  26. Cueves, M.A. Abastecimientos de la ciudad de Valencia, durante la edad media. Saitabi 1962, 12, 141–167. [Google Scholar]
  27. Ena, I. Censos, Censatarios y Censalistas: La Deuda del Ayuntamiento de Jaca en la Primera Mitad del Siglo Xviii; Universidad de Zaragoza: Zaragoza, Spain, 2016. [Google Scholar]
  28. Hernández, T.M. Los acreedores censalistas de propios y la burguesía liberal. Saitabi 1992, 42, 47–62. [Google Scholar]
  29. Llopis, A.; Perdigón, L. Cartografía Histórica de la Ciudad de Valencia (1608–1944); Universidad Politécnica de Valencia: Valencia, Spain, 2010. [Google Scholar]
  30. Ferrando, M. Reforma del Edificio N.º 1 Calle del Almudín con Vueltas a las de San Salvador y Peso de la Harina, Propio de don Santiago García. Policía Urbana, Caja 97; Archivo Histórico Municipal de Valencia: Valencia, Spain, 1863. [Google Scholar]
  31. Esquembre, F. Proyecto Básico Rehabilitación Palacio de Colomina, C/Almudín N.º1, Valencia, Promotor Fundación San Pablo CEU; Policía urbana expediente 608/95; Archivo Municipal Intermedio de Valencia: Valencia, Spain, 1995. [Google Scholar]
  32. Spanò, A.; Patrucco, G.; Sammartano, G.; Perri, S.; Avena, M.; Fillia, E.; Milan, S. Digital Twinning for 20th Century Concrete Heritage: HBIM Cognitive Model for Torino Esposizioni Halls. Sensors 2023, 23, 4791. [Google Scholar] [CrossRef]
  33. Murtiyoso, A.; Grussenmeyer, P.; Suwardhi, D.; Awalludin, R. Multi-Scale and Multi-Sensor 3D Documentation of Heritage Complexes in Urban Areas. ISPRS Int. J. Geo-Inf. 2018, 7, 483. [Google Scholar] [CrossRef]
  34. Alshawabkeh, Y.; Baik, A. Integration of photogrammetry and laser scanning for enhancing scan-to-HBIM modeling of Al Ula Heritage site. Herit. Sci. 2023, 11, 147. [Google Scholar] [CrossRef]
  35. Adamopoulos, E.; Rinaudo, F. Close-Range Sensing and Data Fusion for Built Heritage Inspection and Monitoring—A Review. Remote Sens. 2021, 13, 3936. [Google Scholar] [CrossRef]
  36. Sutherland, N.; Marsh, S.; Priestnall, G.; Bryan, P.; Mills, J. InfraRed Thermography and 3D-Data Fusion for Architectural Heritage: A Scoping Review. Remote Sens. 2023, 15, 2422. [Google Scholar] [CrossRef]
  37. Patrucco, G.; Giulio Tonolo, F.; Sammartano, G.; Spanò, A. SfM-based 3D Reconstruction of Heritage Assets Using UAV Thermal Images. ISPRS Int. Arch. Soc. Photogramm. Remote Sens. 2022, 43, 399–406. [Google Scholar] [CrossRef]
  38. Scaioni, M.; Rosina, E.; L’Erario, A.; Dìaz-Vilariño, L. Integration of infrared thermography and photogrammetric surveying of built landscape. ISPRS Int. Arch. Int. Soc. Photogramm. Remote Sens. 2017, 42, 153–160. [Google Scholar] [CrossRef]
  39. Anelli, D.; Tajani, F. Valorization of cultural heritage and land take reduction: An urban compensation model for the replacement of unsuitable buildings in an Italian UNESCO site. J. Cult. Herit. 2022, 57, 165–172. [Google Scholar] [CrossRef]
  40. van der Veen, M.; Spaans, M.; Janssen-Jansen, L. Using compensation instruments as a vehicle to improve spatial planning: Challenges and opportunities. Land Use Policy 2010, 27, 1010–1017. [Google Scholar] [CrossRef]
  41. Javadnejad, F.; Gillins, D.T.; Parrish, C.E.; Slocum, R.K. A photogrammetric approach to fusing natural colour and thermal infrared UAS imagery in 3D point cloud generation. Int. J. Remote Sens. 2019, 41, 211–237. [Google Scholar] [CrossRef]
Figure 1. Corner of Harina Street and Almudín Street. A construction method different from that of a house can be observed, both in the corner and in the wall, which is made up of ashlars: (a) View from Calle de la Harina, at left view of the old flour-weighing house corner with the Almudín gate in the background; (b) Old flour-weighing house’s corner still existing.
Applsci 14 11962 g001
Figure 2. Location of the different buildings involved in the wheat handling process, based on Fortea’s plan (1738). Adaptation by the authors (the street names are reported in their original form in Spanish).
Applsci 14 11962 g002
Figure 3. Almudín plan. Image CTAV.
Applsci 14 11962 g003
Figure 4. Medieval shipyards or Atarazanas in the Grao (Valencia).
Applsci 14 11962 g004
Figure 5. Silos or Wheat warehouse of Burjassot (Valencia).
Applsci 14 11962 g005
Figure 6. Almudín (Valencia).
Applsci 14 11962 g006
Figure 7. Palace of the Marquise of Colomina, Valencia.
Applsci 14 11962 g007
Figure 8. Plan by A. Mancelli, 1608, the flour-weighing house is numbered 95.
Applsci 14 11962 g008
Figure 9. Plan by V. Tosca, 1703; the flour-weighing house is numbered 95.
Applsci 14 11962 g009
Figure 10. Plan by J. Fortea, 1738; the flour-weighing house appears numbered 90.
Applsci 14 11962 g010
Figure 11. Plan by the Army Corps of Engineers, 1869 (the street names are reported in their original form in Spanish).
Applsci 14 11962 g011
Figure 12. Plan by the army general staff corps, 1883.
Applsci 14 11962 g012
Figure 13. Plan of the unbuilt proposal dated June 1863, with two floors. (a) East façade; (b) South façade. Master builder, Manuel Ferrando. A.H.M.V.
Applsci 14 11962 g013
Figure 14. Plan of built proposal dated June 1863, with three floors. (a) East façade; (b) South façade. Master builder, Manuel Ferrando. A.H.M.V.
Applsci 14 11962 g014
Figure 15. Plan of the first level of the framework state prior to the intervention, 1995. Architect Francisco Esquembre. A. I. A. V.
Applsci 14 11962 g015
Figure 16. Flowchart of the proposed workflow.
Applsci 14 11962 g016
Figure 17. Point cloud after registration of the eight TLS scans.
Applsci 14 11962 g017
Figure 18. Oriented block of images (relative orientation) and the sparse cloud of tie points.
Applsci 14 11962 g018
Figure 19. Southern façade: radiometric difference between (a) TLS point cloud textured from the images acquired from the embedded camera and (b) TLS point cloud textured from the oriented photogrammetric block composed of visible images.
Applsci 14 11962 g019
Figure 20. East façade anomalies. In the graphical scale located on the left side of the image, it is possible to see the correspondence between the false-colour representation and the temperature trend. In this case, the thermal range observed in this TIR image spans from 14.4 °C (dark purple) to 19.2 °C (white).
Applsci 14 11962 g020
Figure 21. South façade anomalies. In the graphical scale located on the left side of the image, it is possible to see the correspondence between the false-colour representation and the temperature trend. In this case, the thermal range observed in this TIR image spans from 15.6 °C (dark purple) to 18.4 °C (white).
Applsci 14 11962 g021
Figure 22. (a) 3D mesh (derived from the LiDAR point cloud) with the oriented thermal images; (b) Oriented thermal image projected onto the 3D mesh. The temperature of the thermal image is represented using a false-color visualization (Iron palette).
Applsci 14 11962 g022
Figure 23. (a) 3D mesh after the first phase of the texturization; (b) Editing of the texture. Each colour is associated with a different TIR image used during the mosaicking process. Therefore, each area (represented by the solid colour) is thermally mapped based on the corresponding TIR image.
Applsci 14 11962 g023
Figure 24. Thermal orthophoto (eastern façade).
Applsci 14 11962 g024
Figure 25. Thermal orthophoto (southern façade).
Applsci 14 11962 g025
Figure 26. Current state of the east façade.
Applsci 14 11962 g026
Figure 27. Current state of the south façade.
Applsci 14 11962 g027
Figure 31. East façade in 1517.
Applsci 14 11962 g031
Figure 32. 3D hypothesis of the appearance of the east façade in 1517.
Applsci 14 11962 g032
Figure 33. East façade before 1704.
Applsci 14 11962 g033
Figure 34. South façade hypothesis before 1704.
Applsci 14 11962 g034
Figure 35. 3D Hypothesis of the appearance of the building before 1704.
Applsci 14 11962 g035
Disclaimer/Publisher’s Note: The statements, opinions and data contained in all publications are solely those of the individual author(s) and contributor(s) and not of MDPI and/or the editor(s). MDPI and/or the editor(s) disclaim responsibility for any injury to people or property resulting from any ideas, methods, instructions or products referred to in the content.

