
Numerical Simulation of Microwave-Induced Cracking of Coal Containing Pyrite Powder Based on a Multi-Field Coupling Model


Abstract
1. Introduction
2. Numerical Methodology
2.1. Model Simplifications
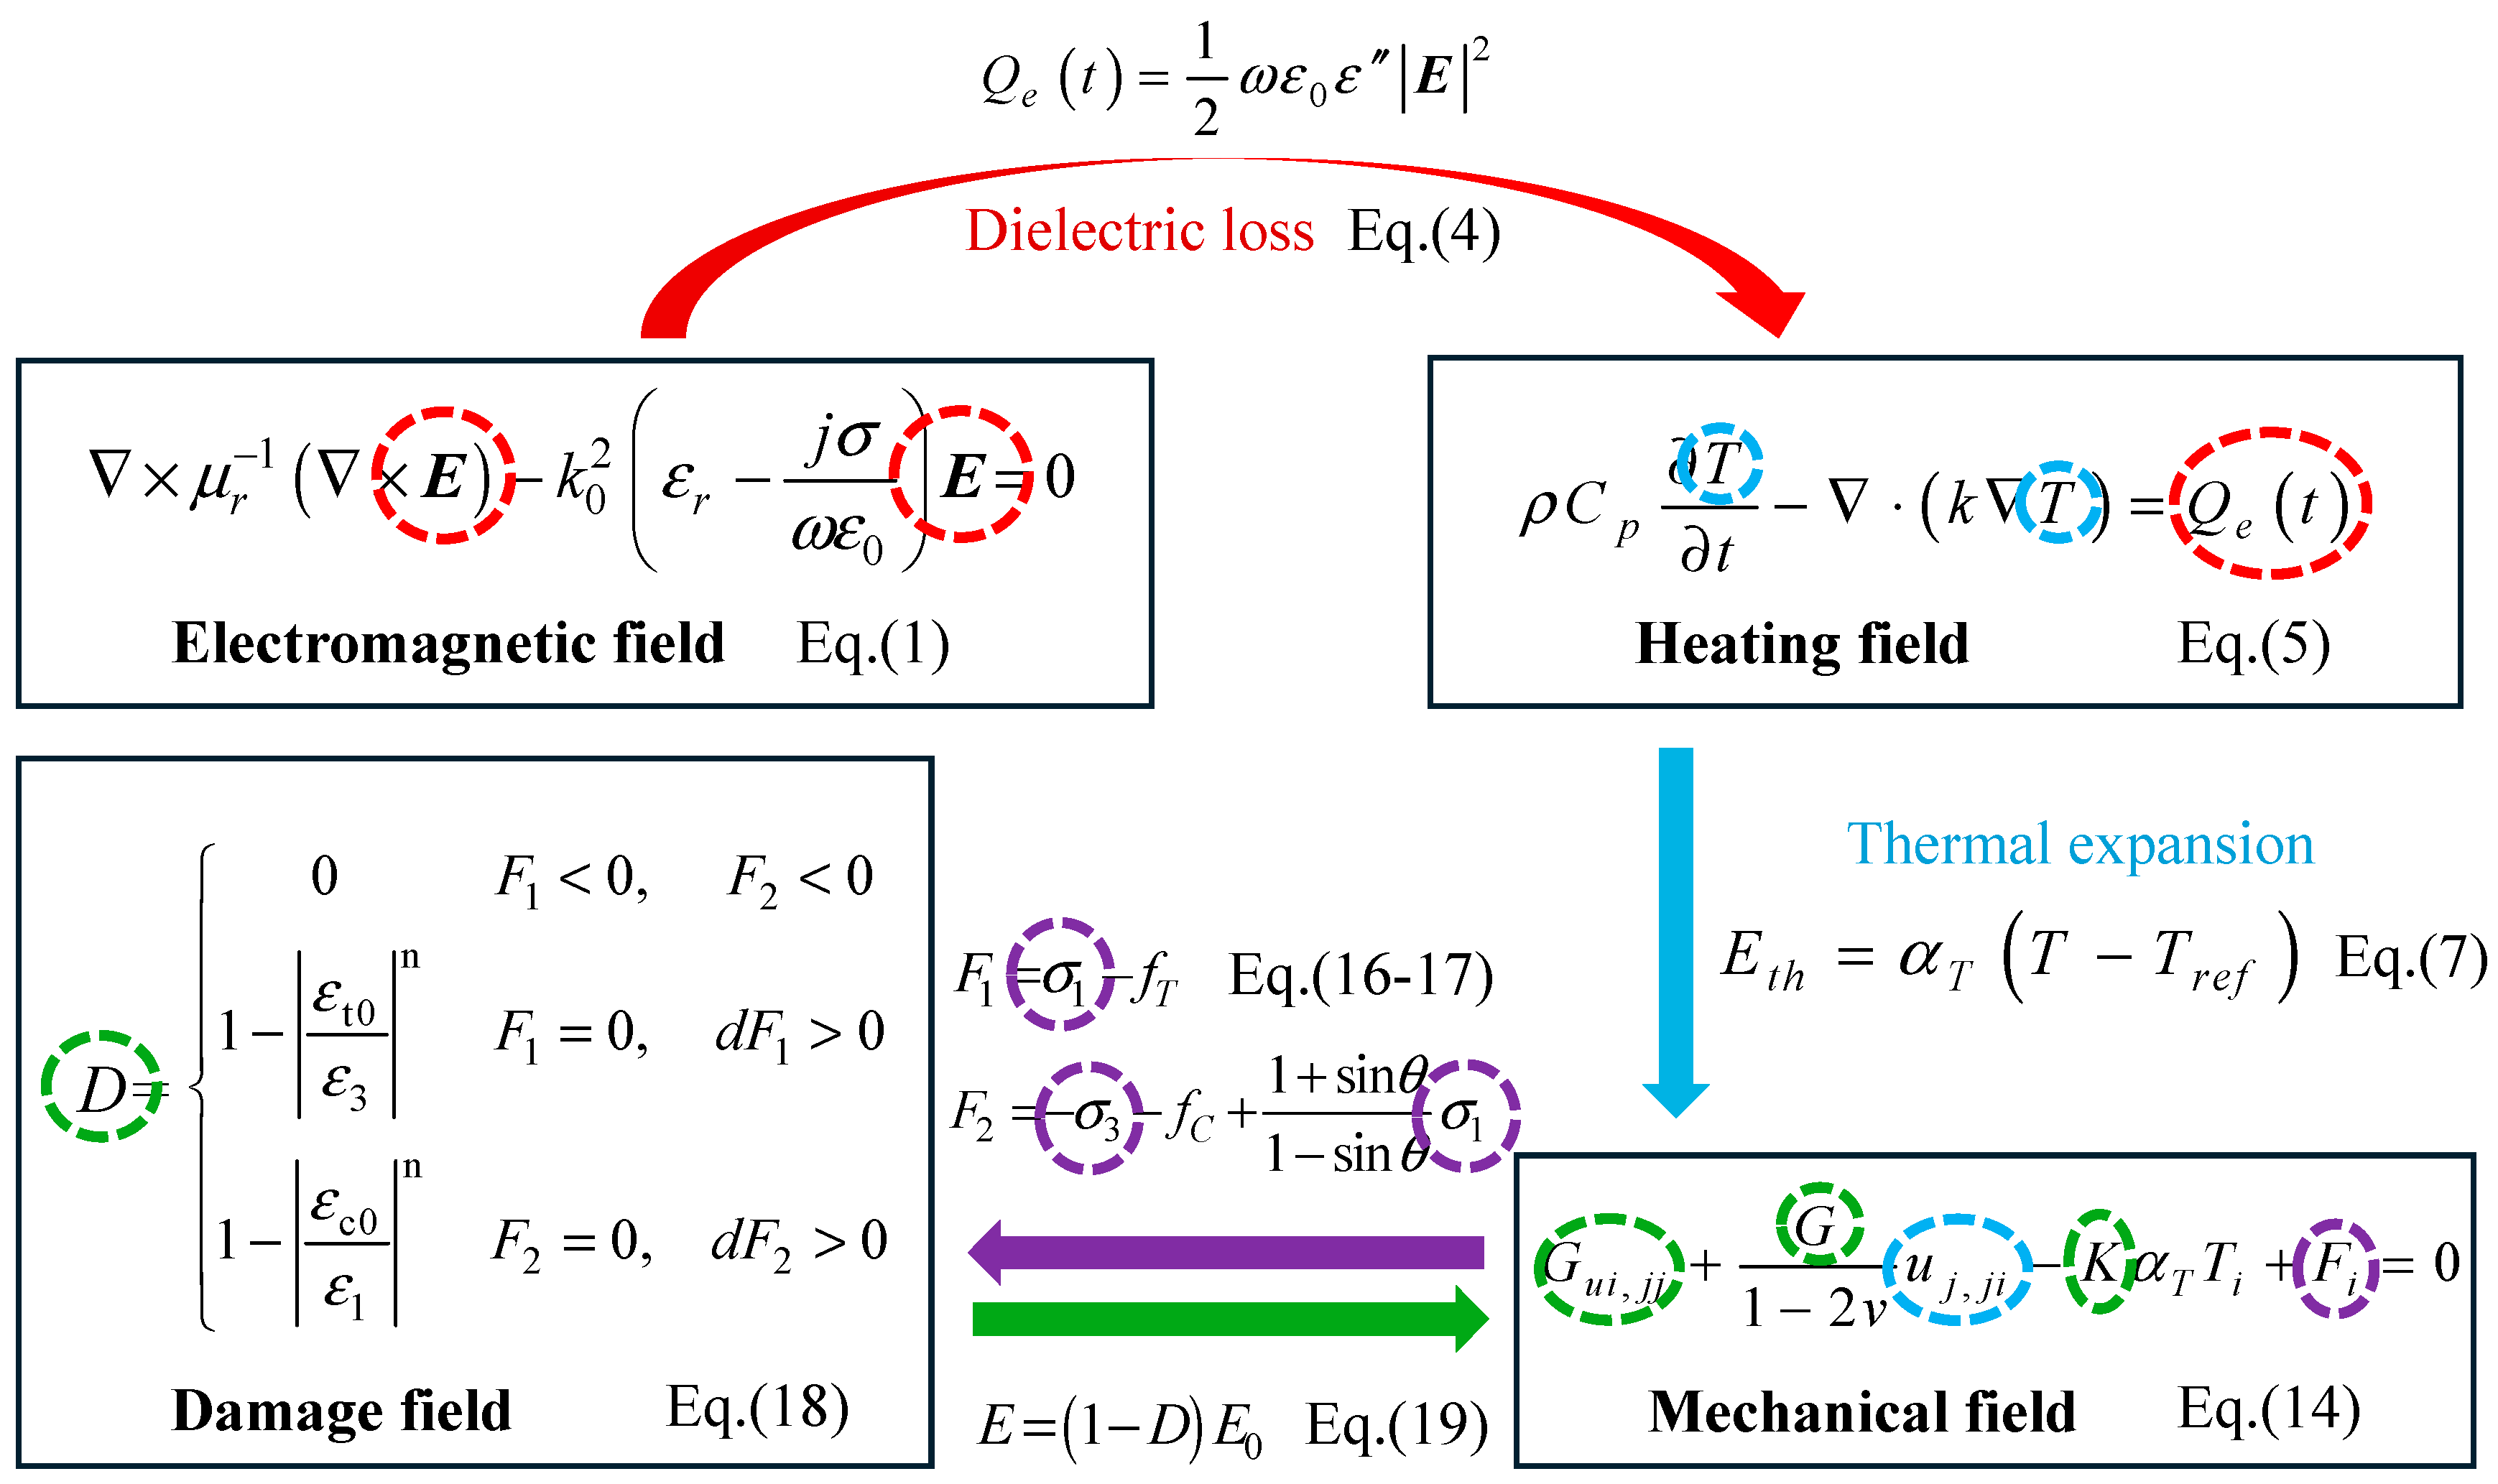
2.2. Governing Equations
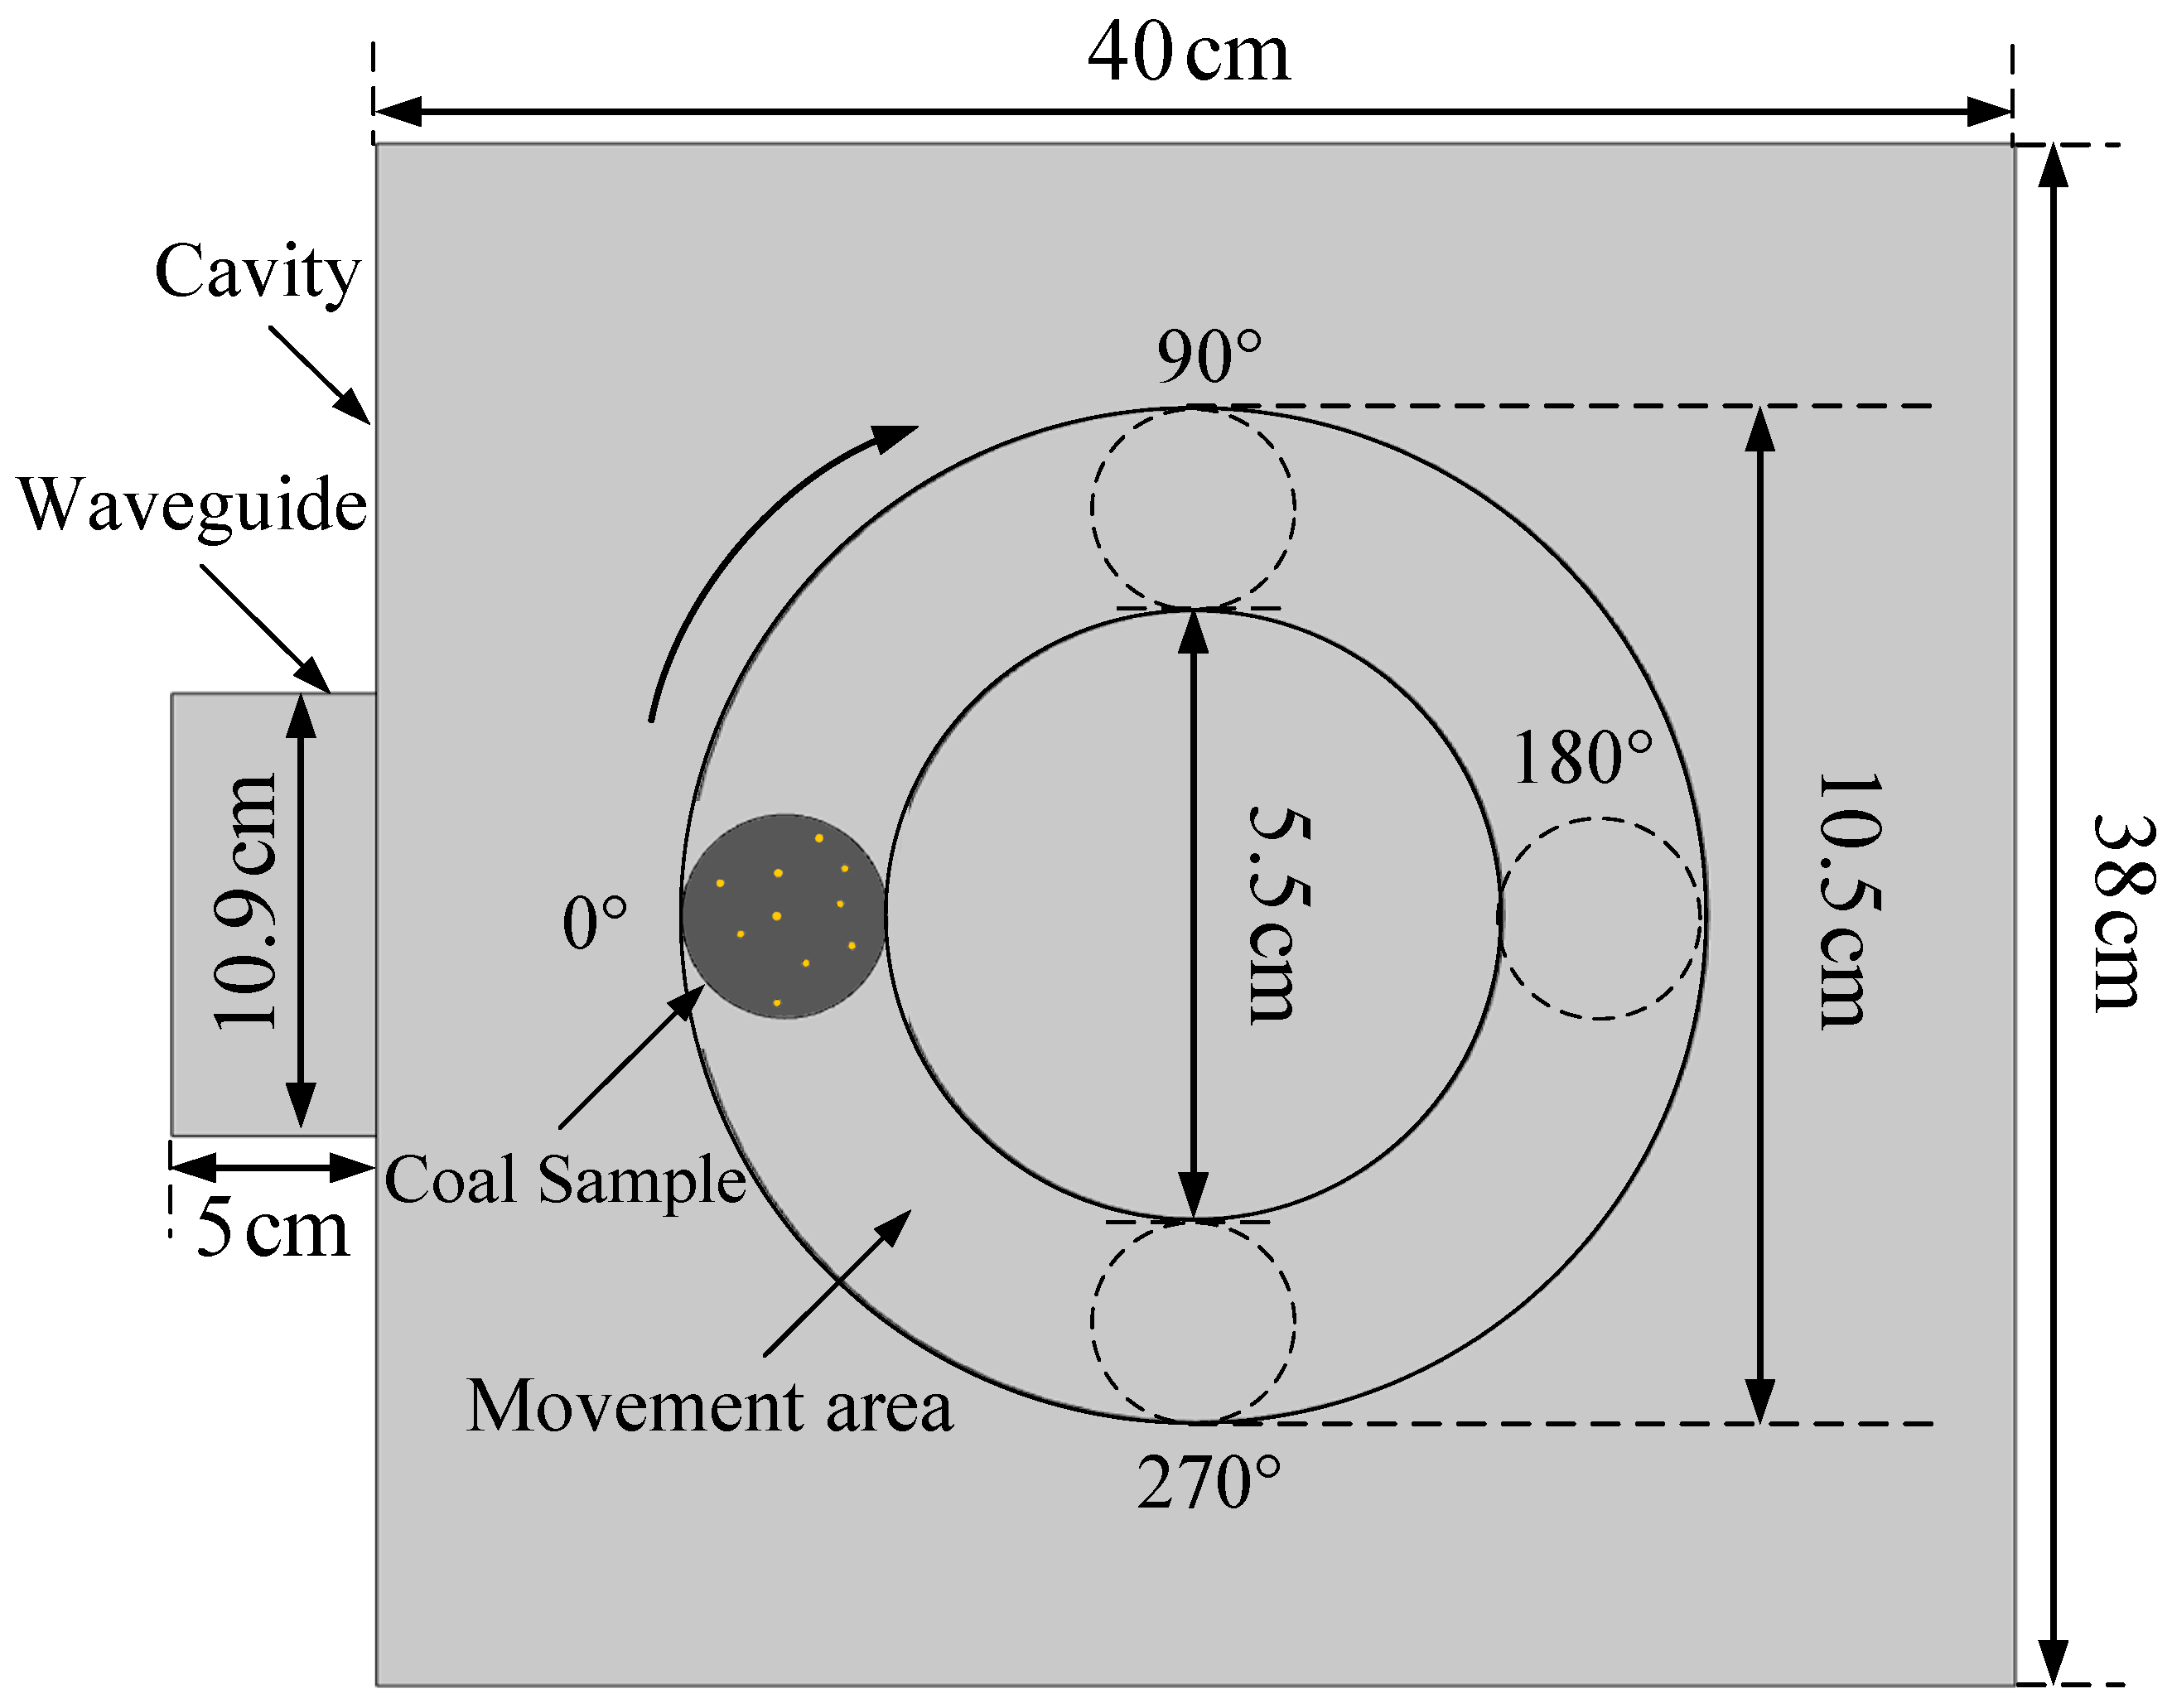
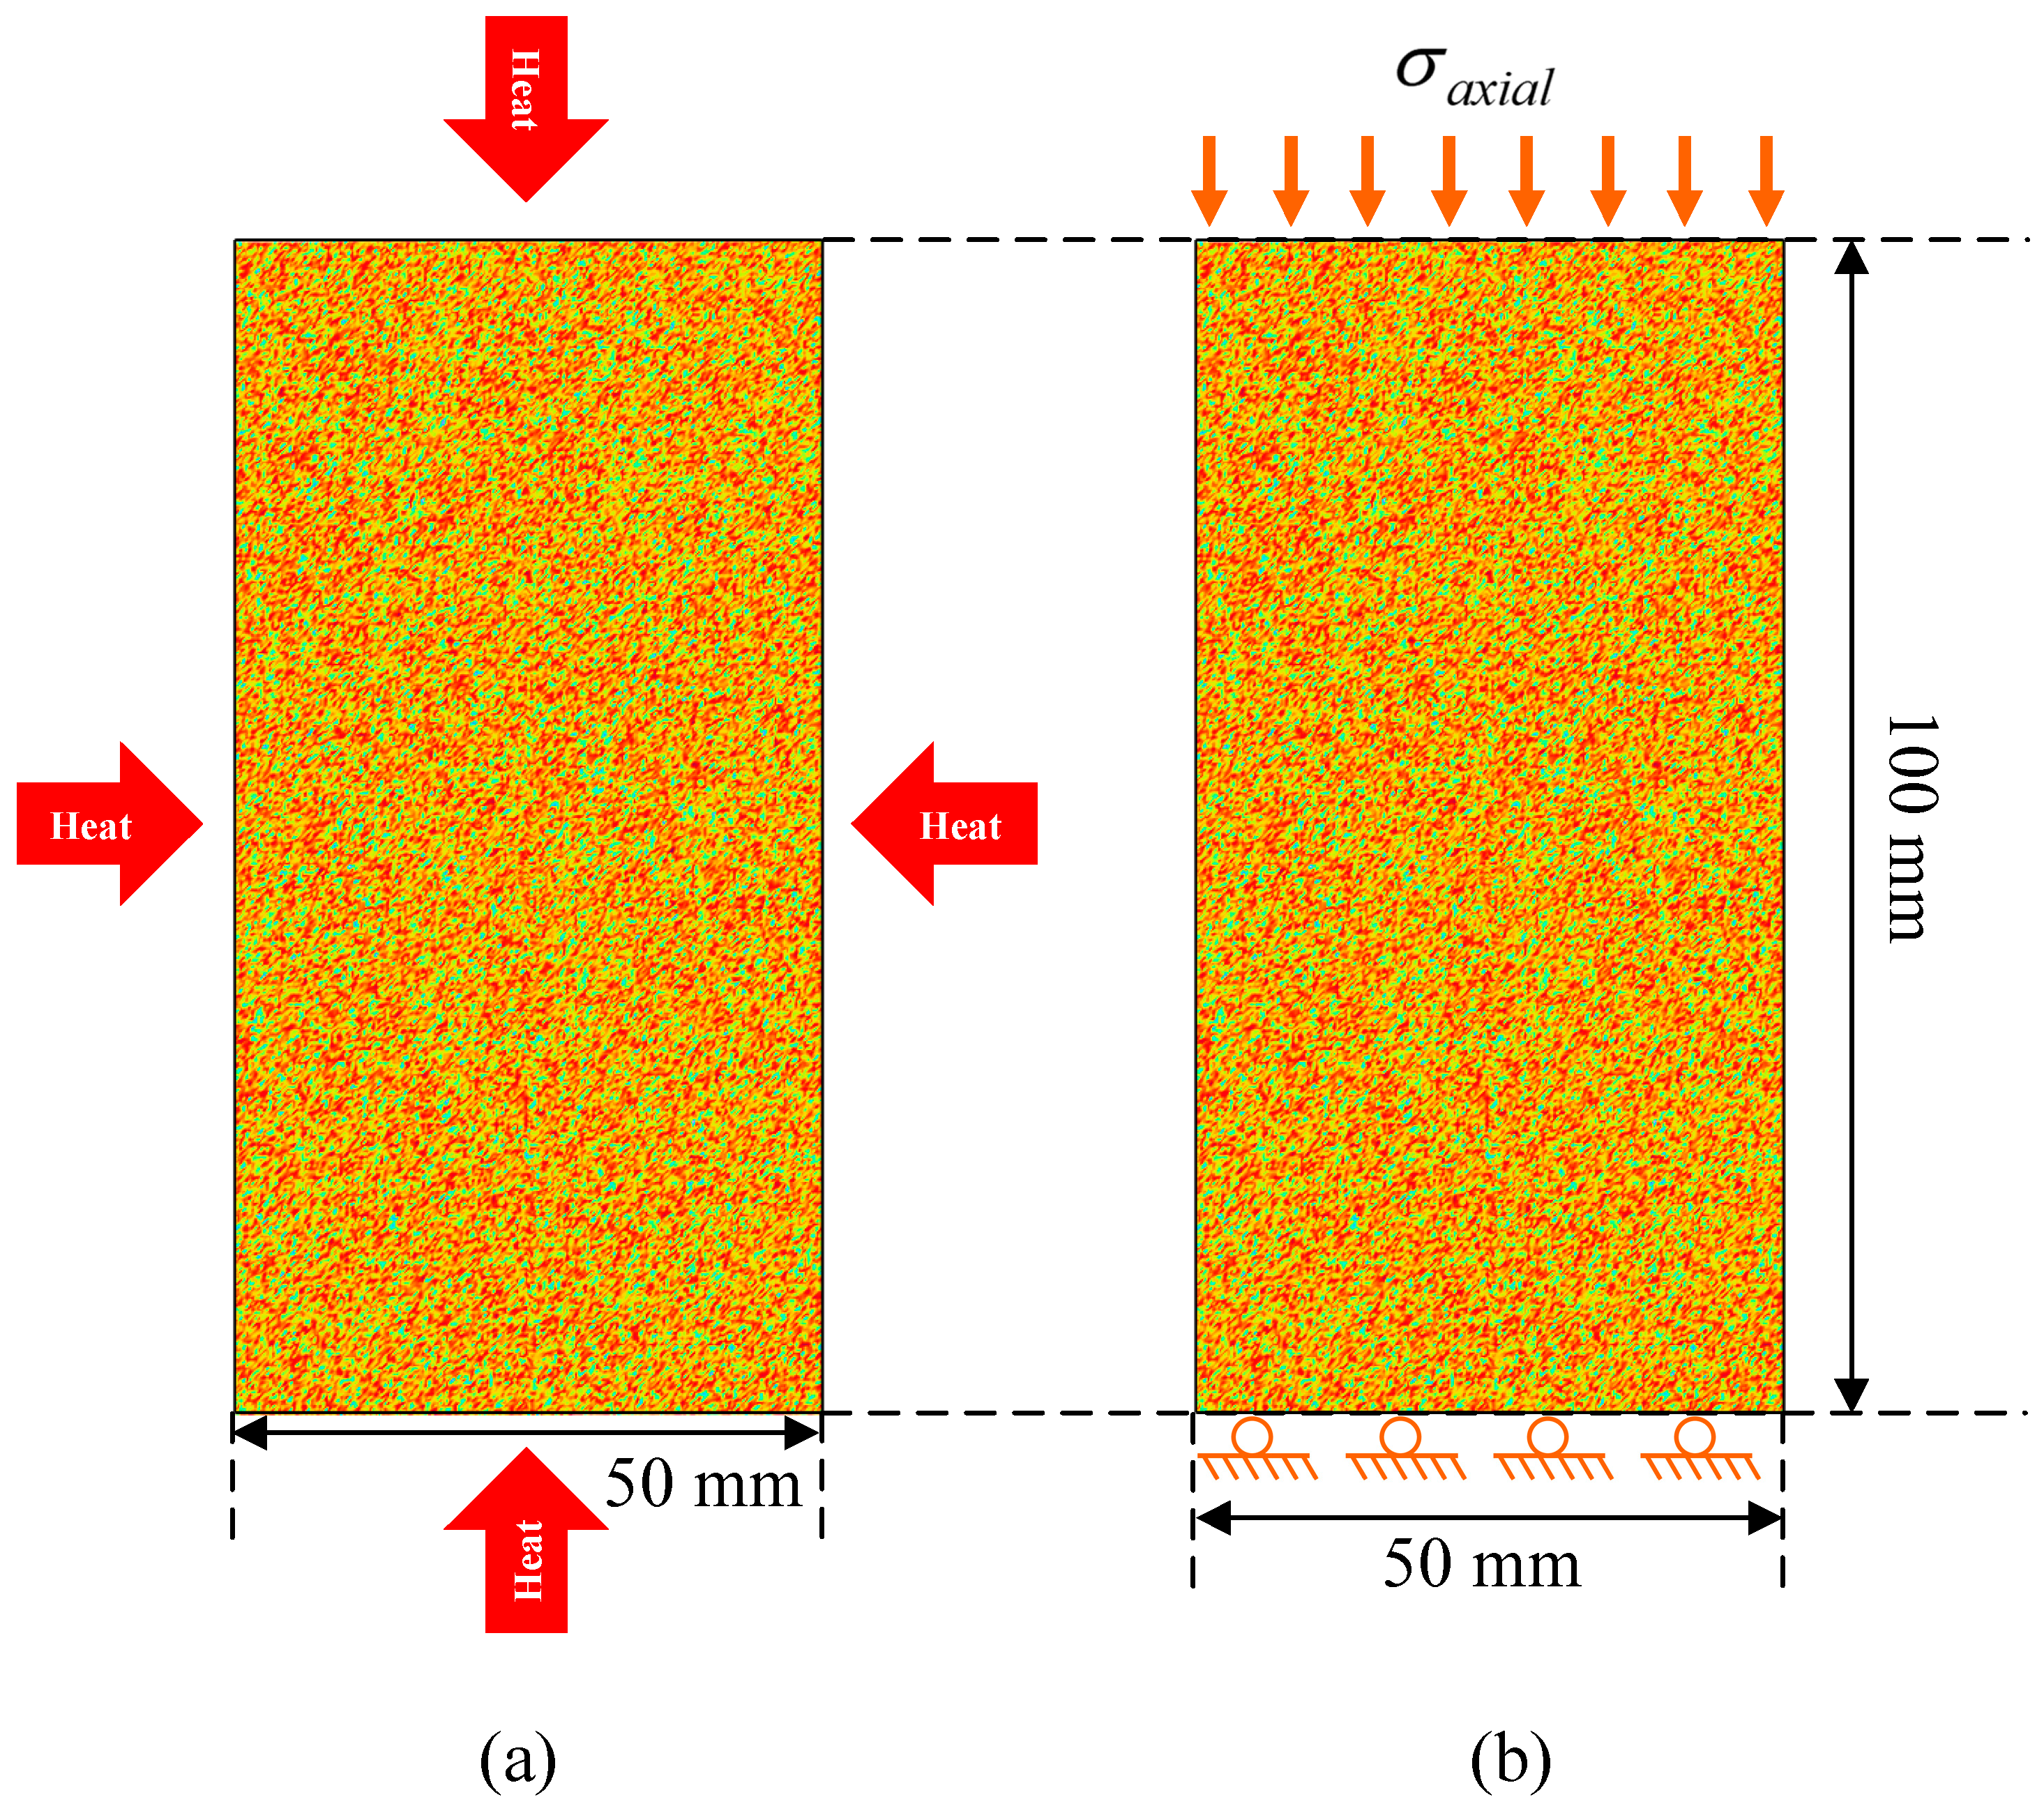
2.3. Geometry
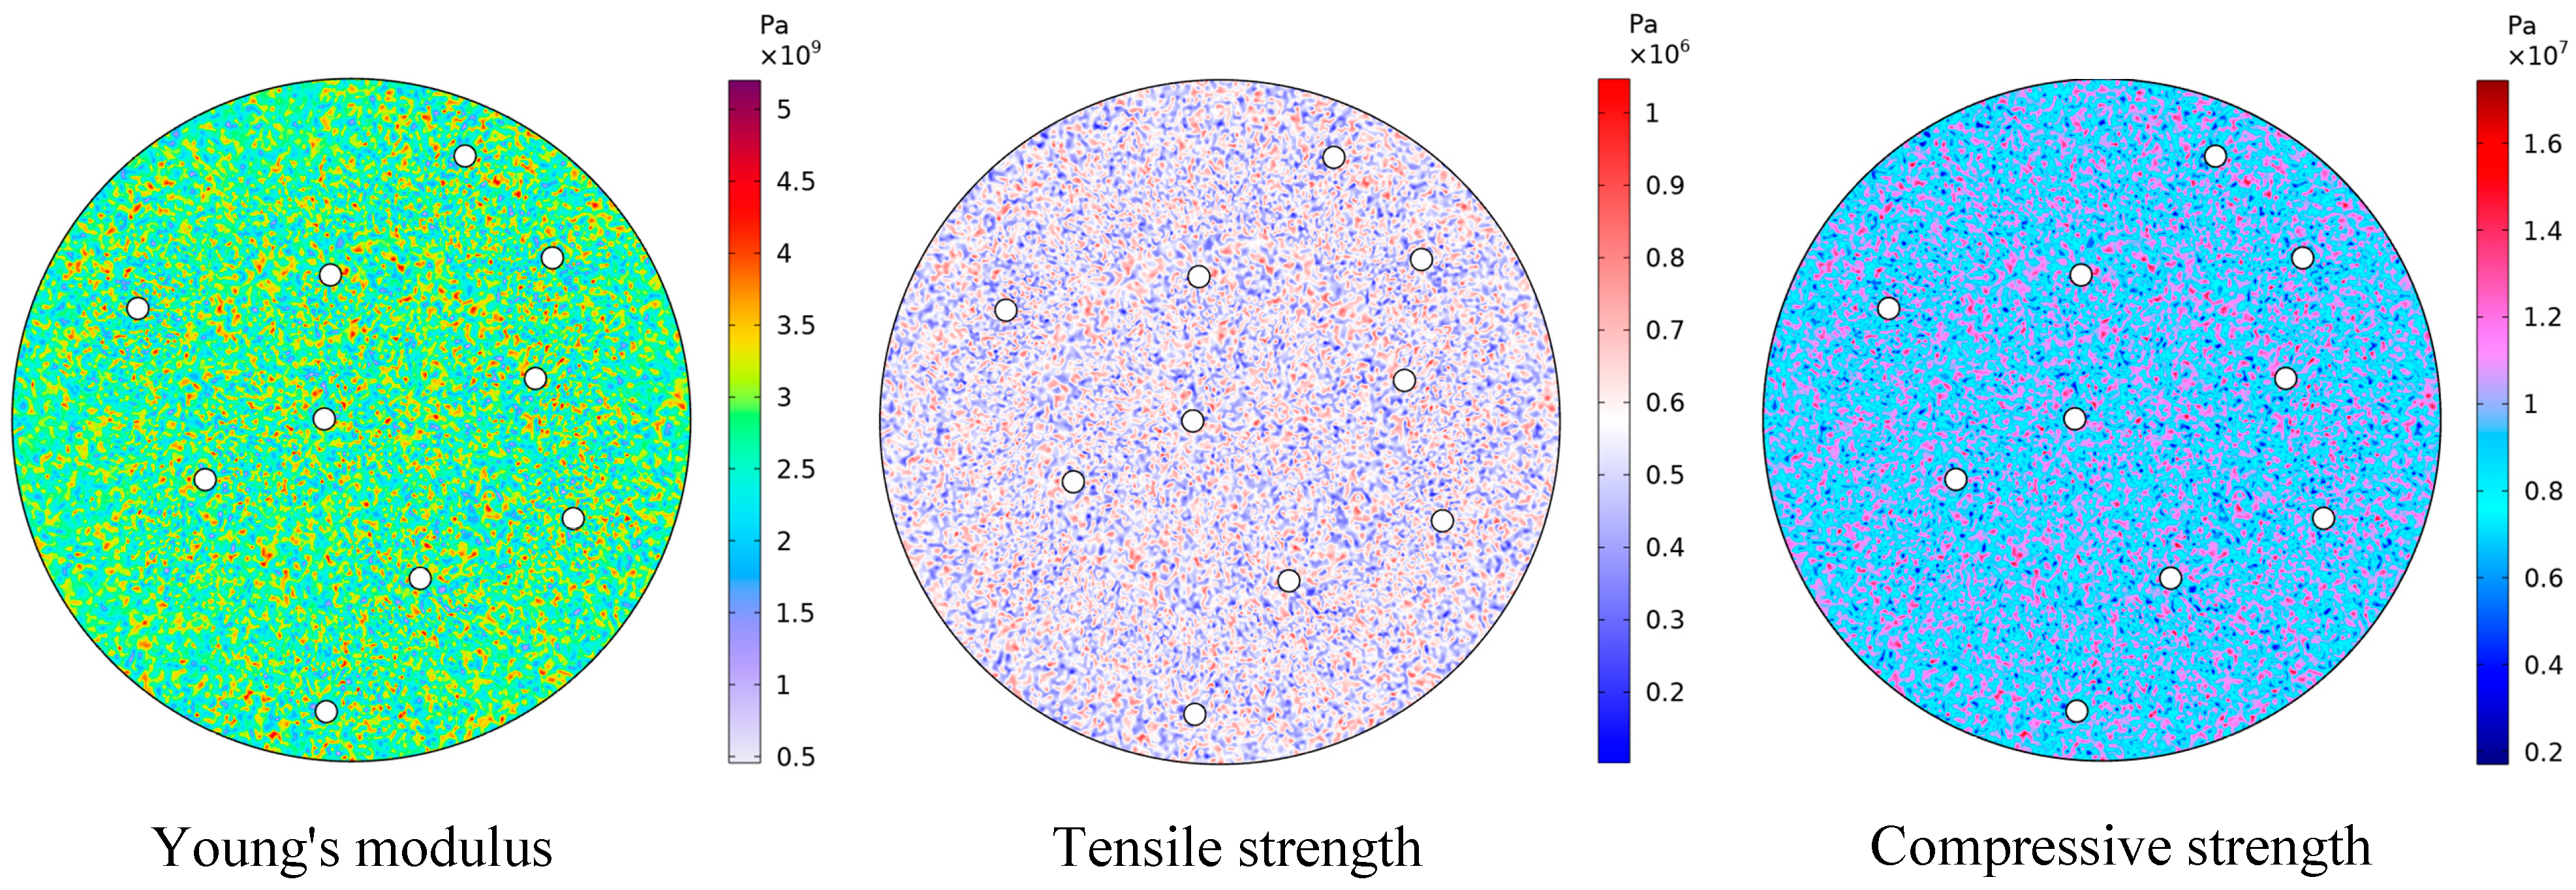
2.4. Material Parameters
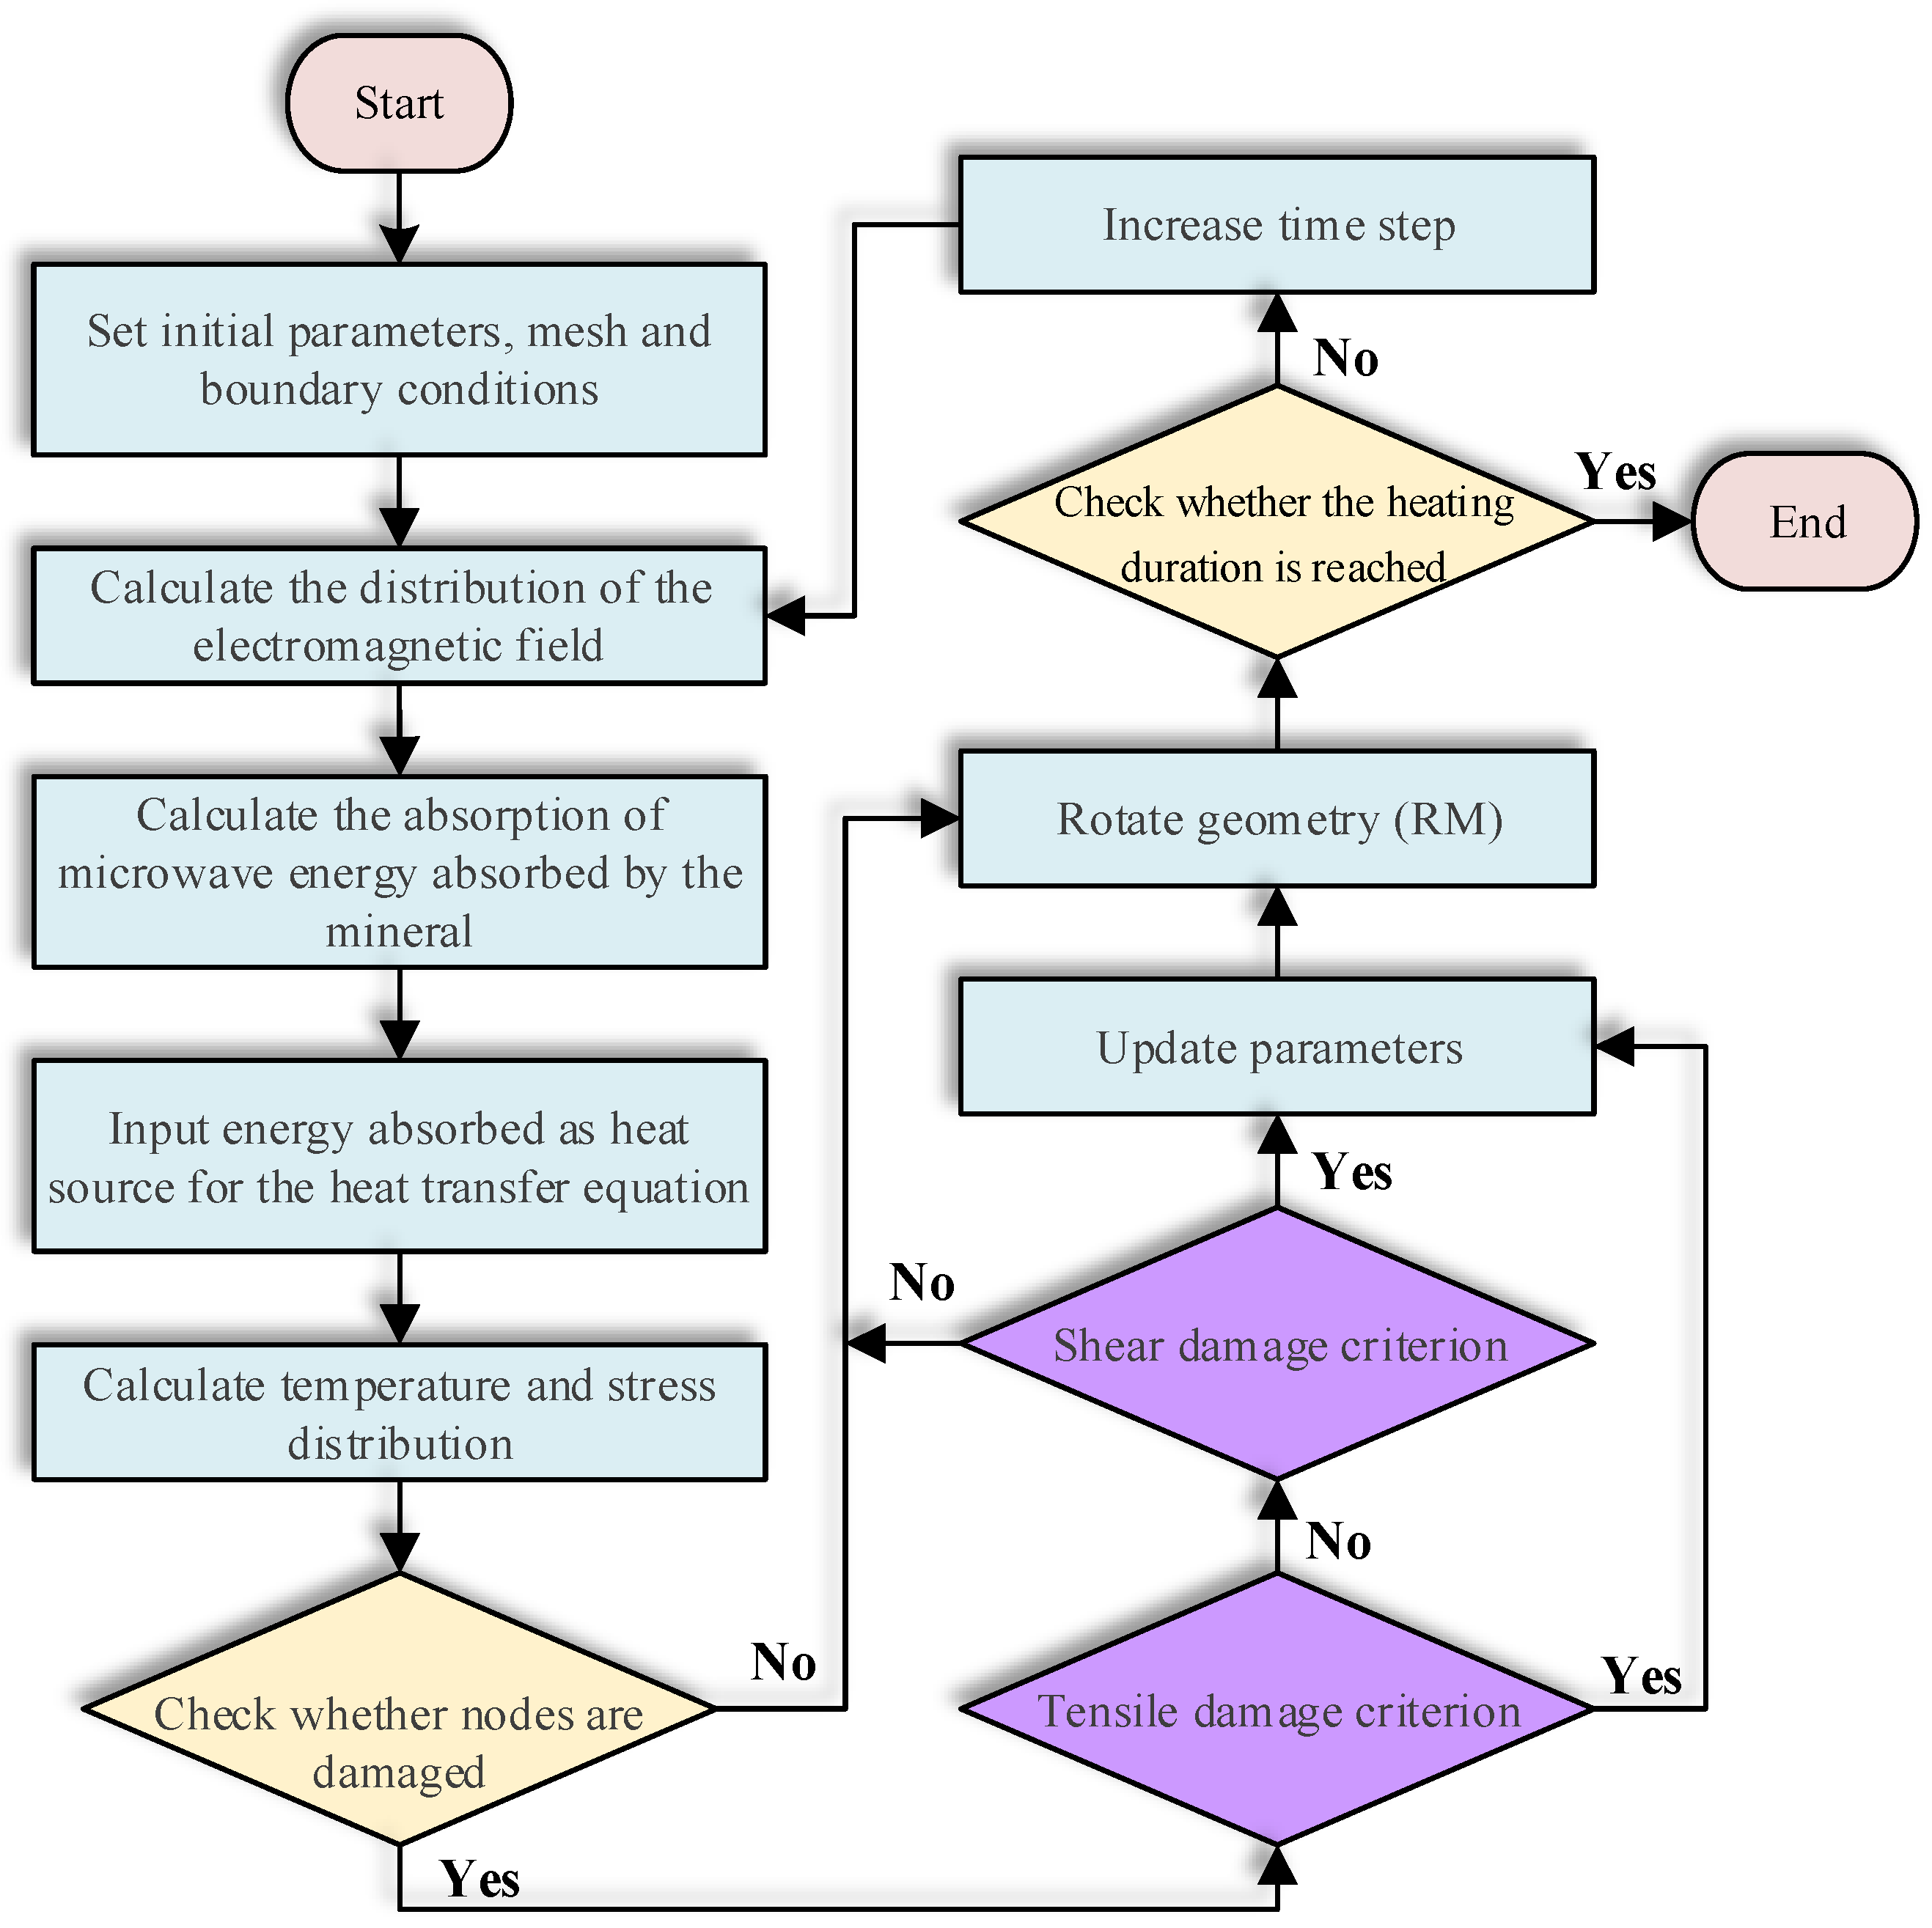
2.5. Solution Strategy
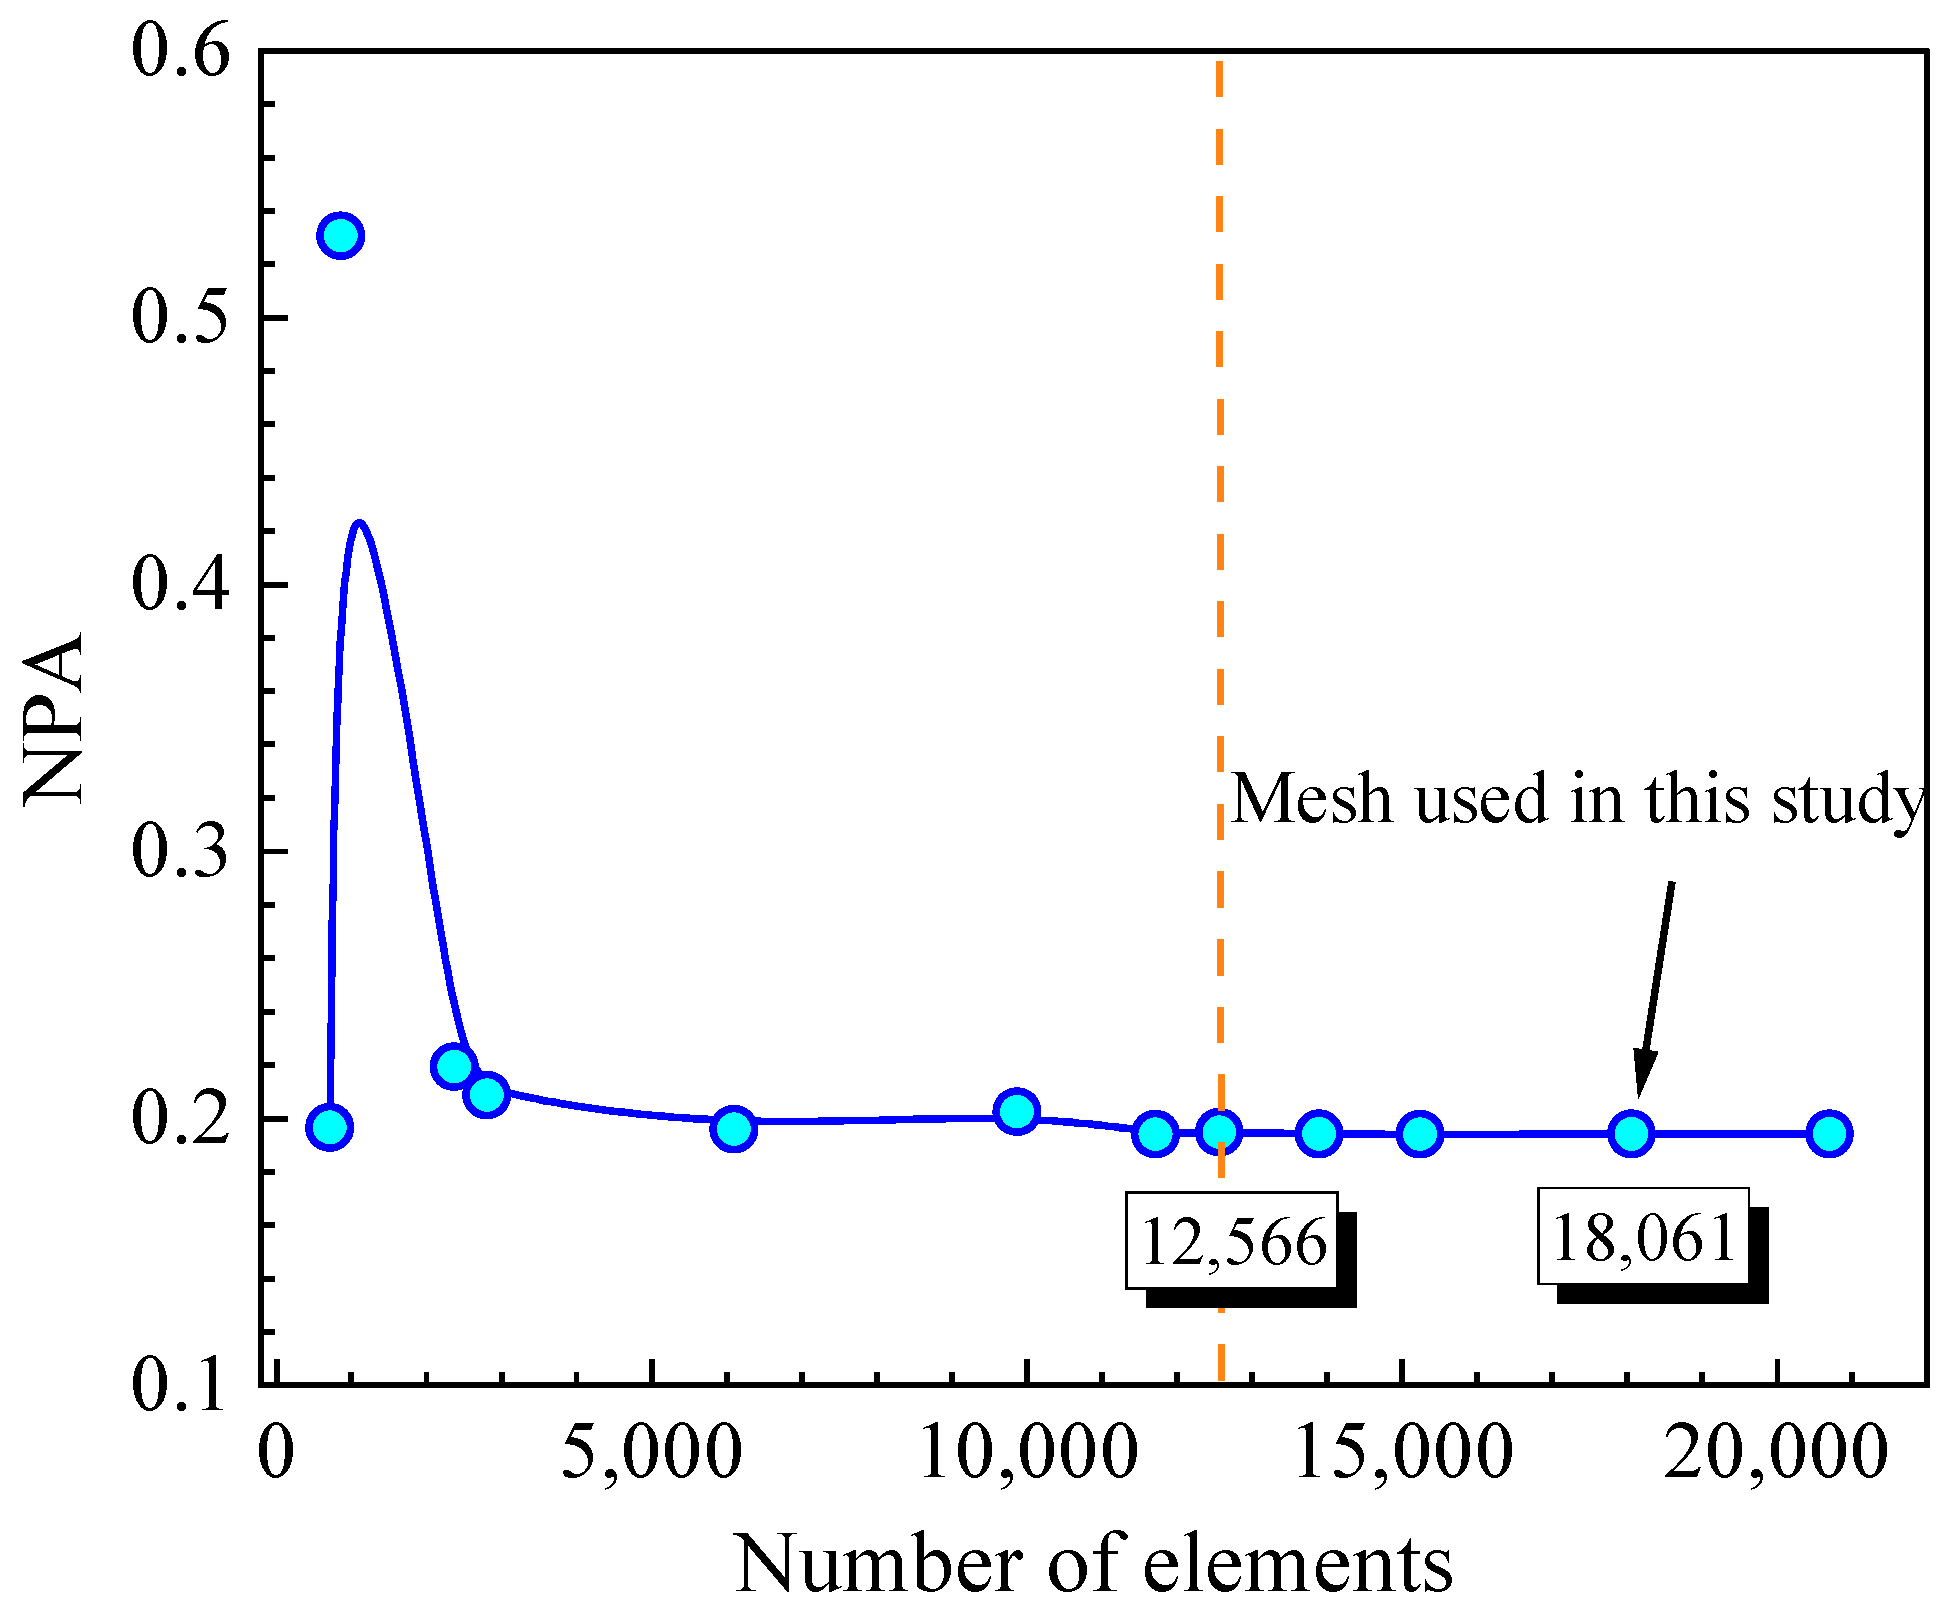
2.6. Mesh Qualities
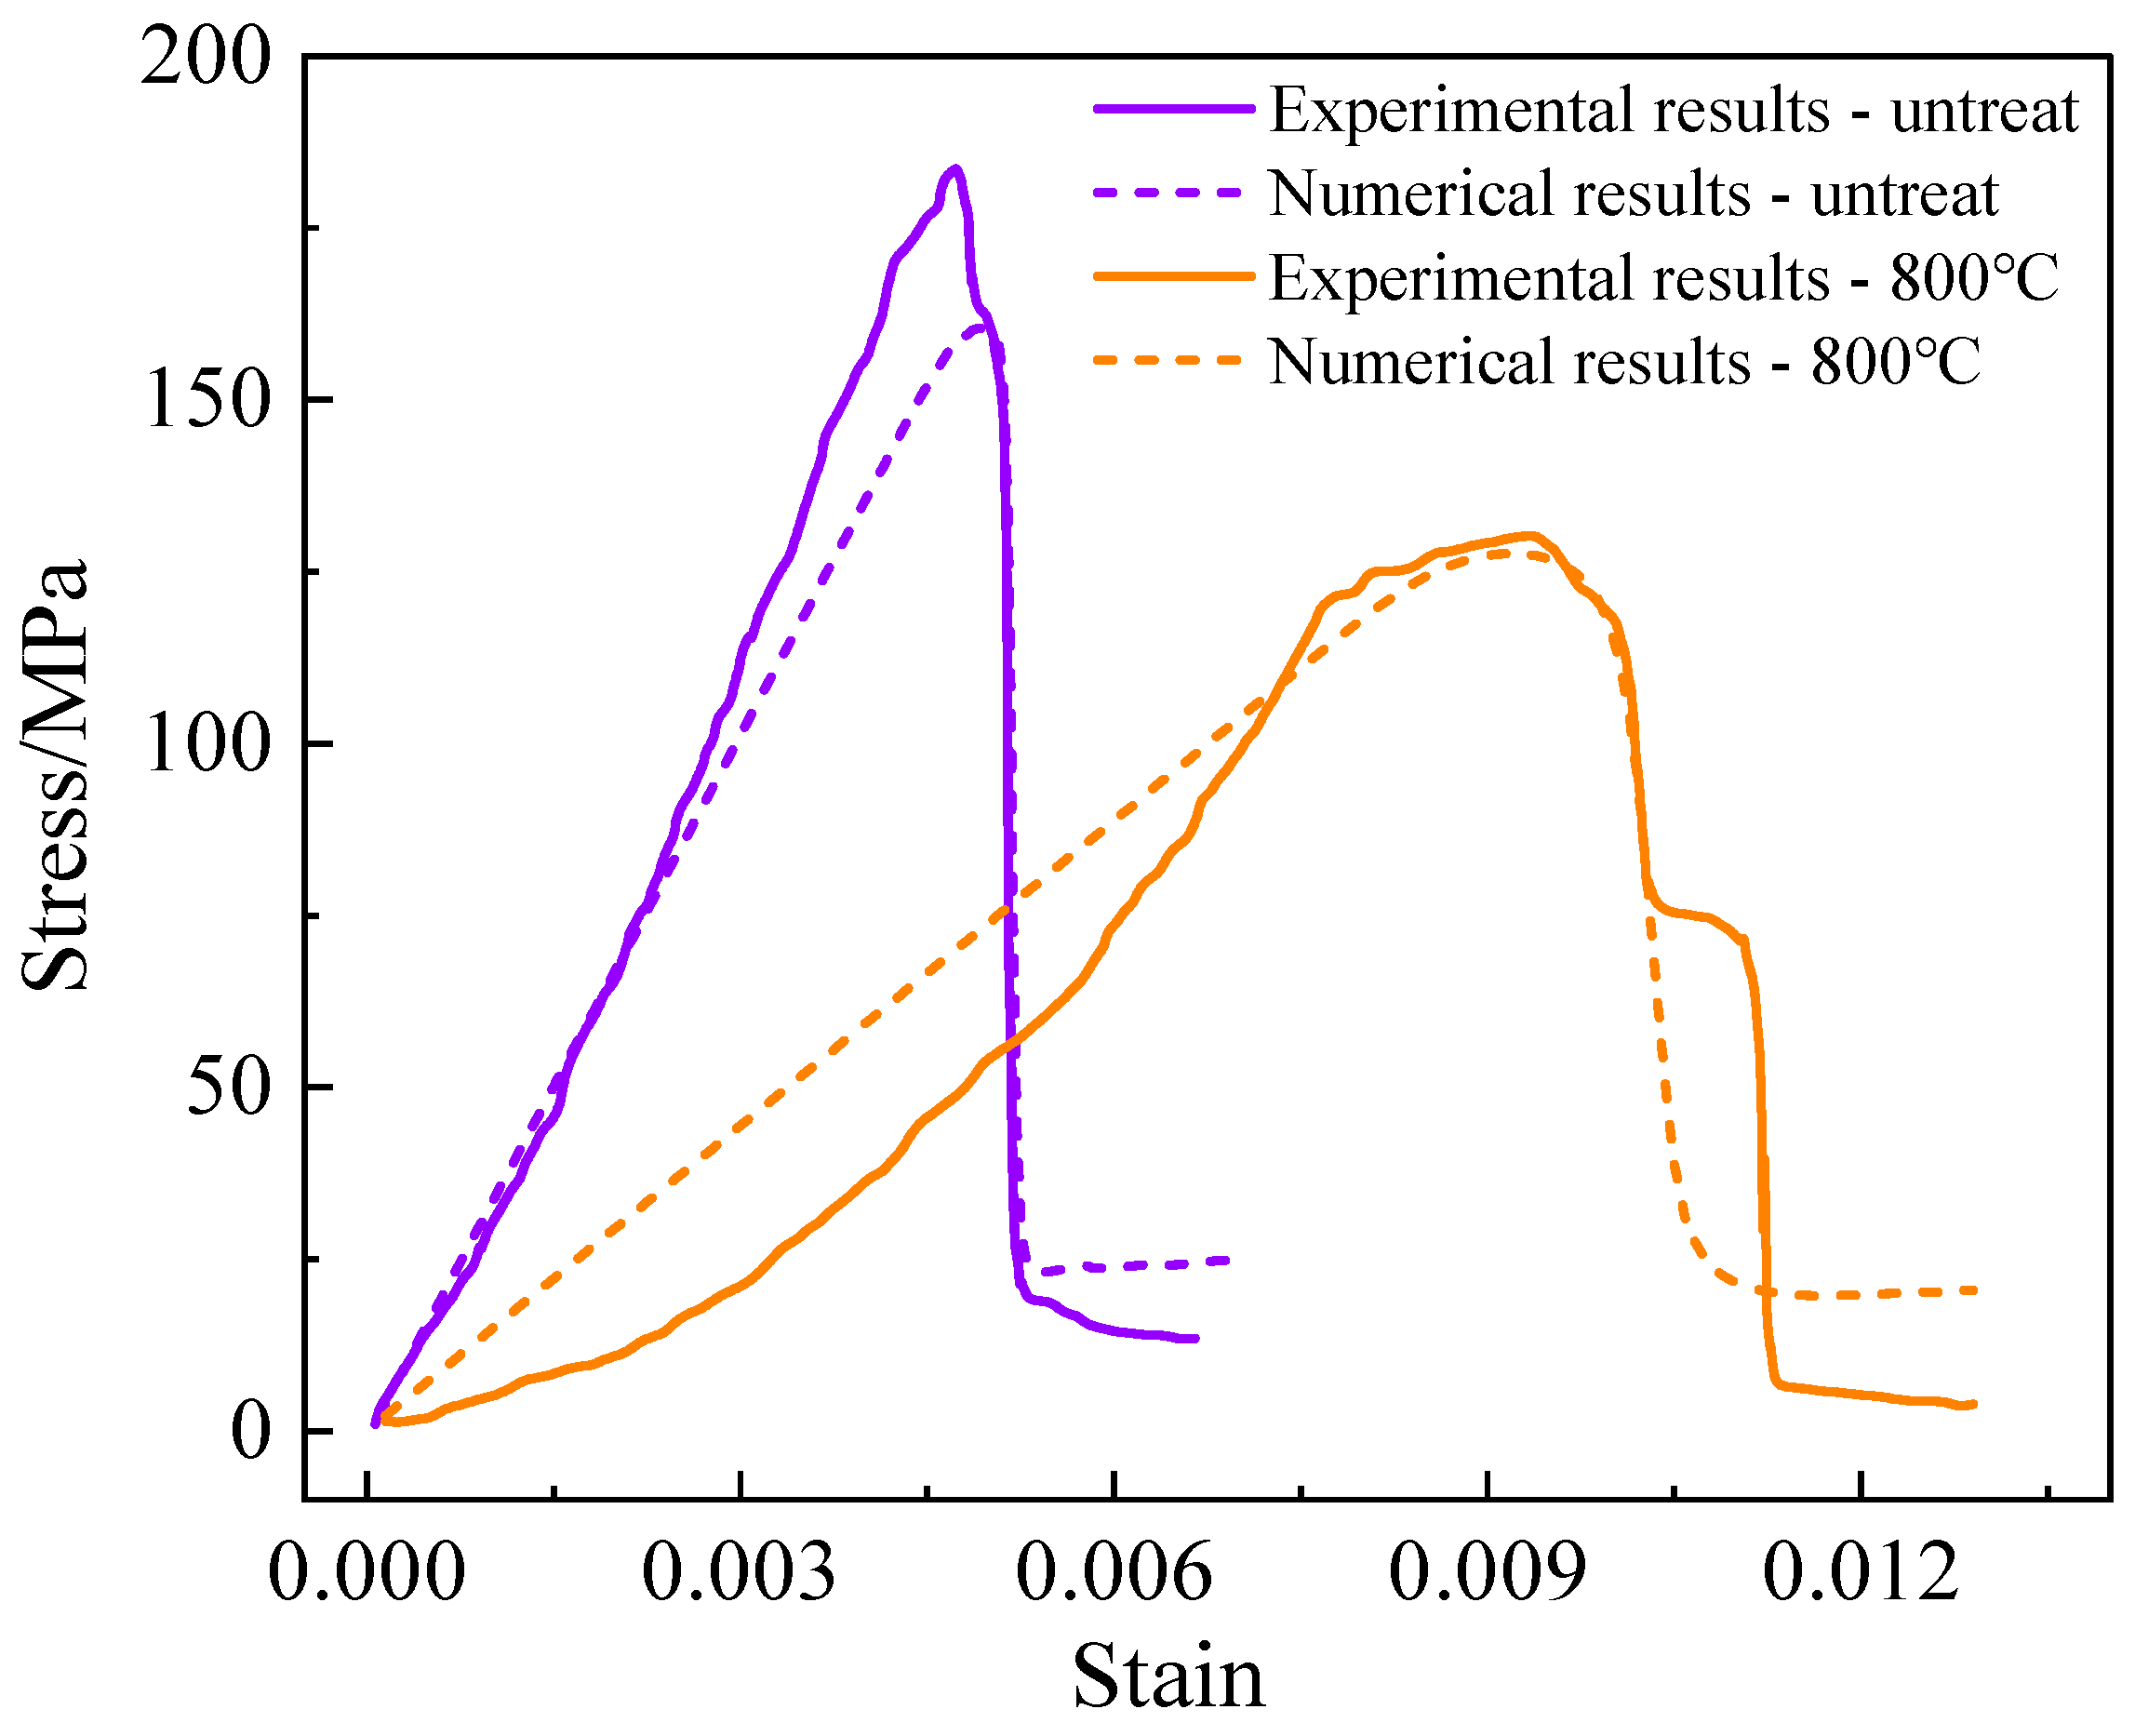
2.7. Model Validation
3. Results and Discussion
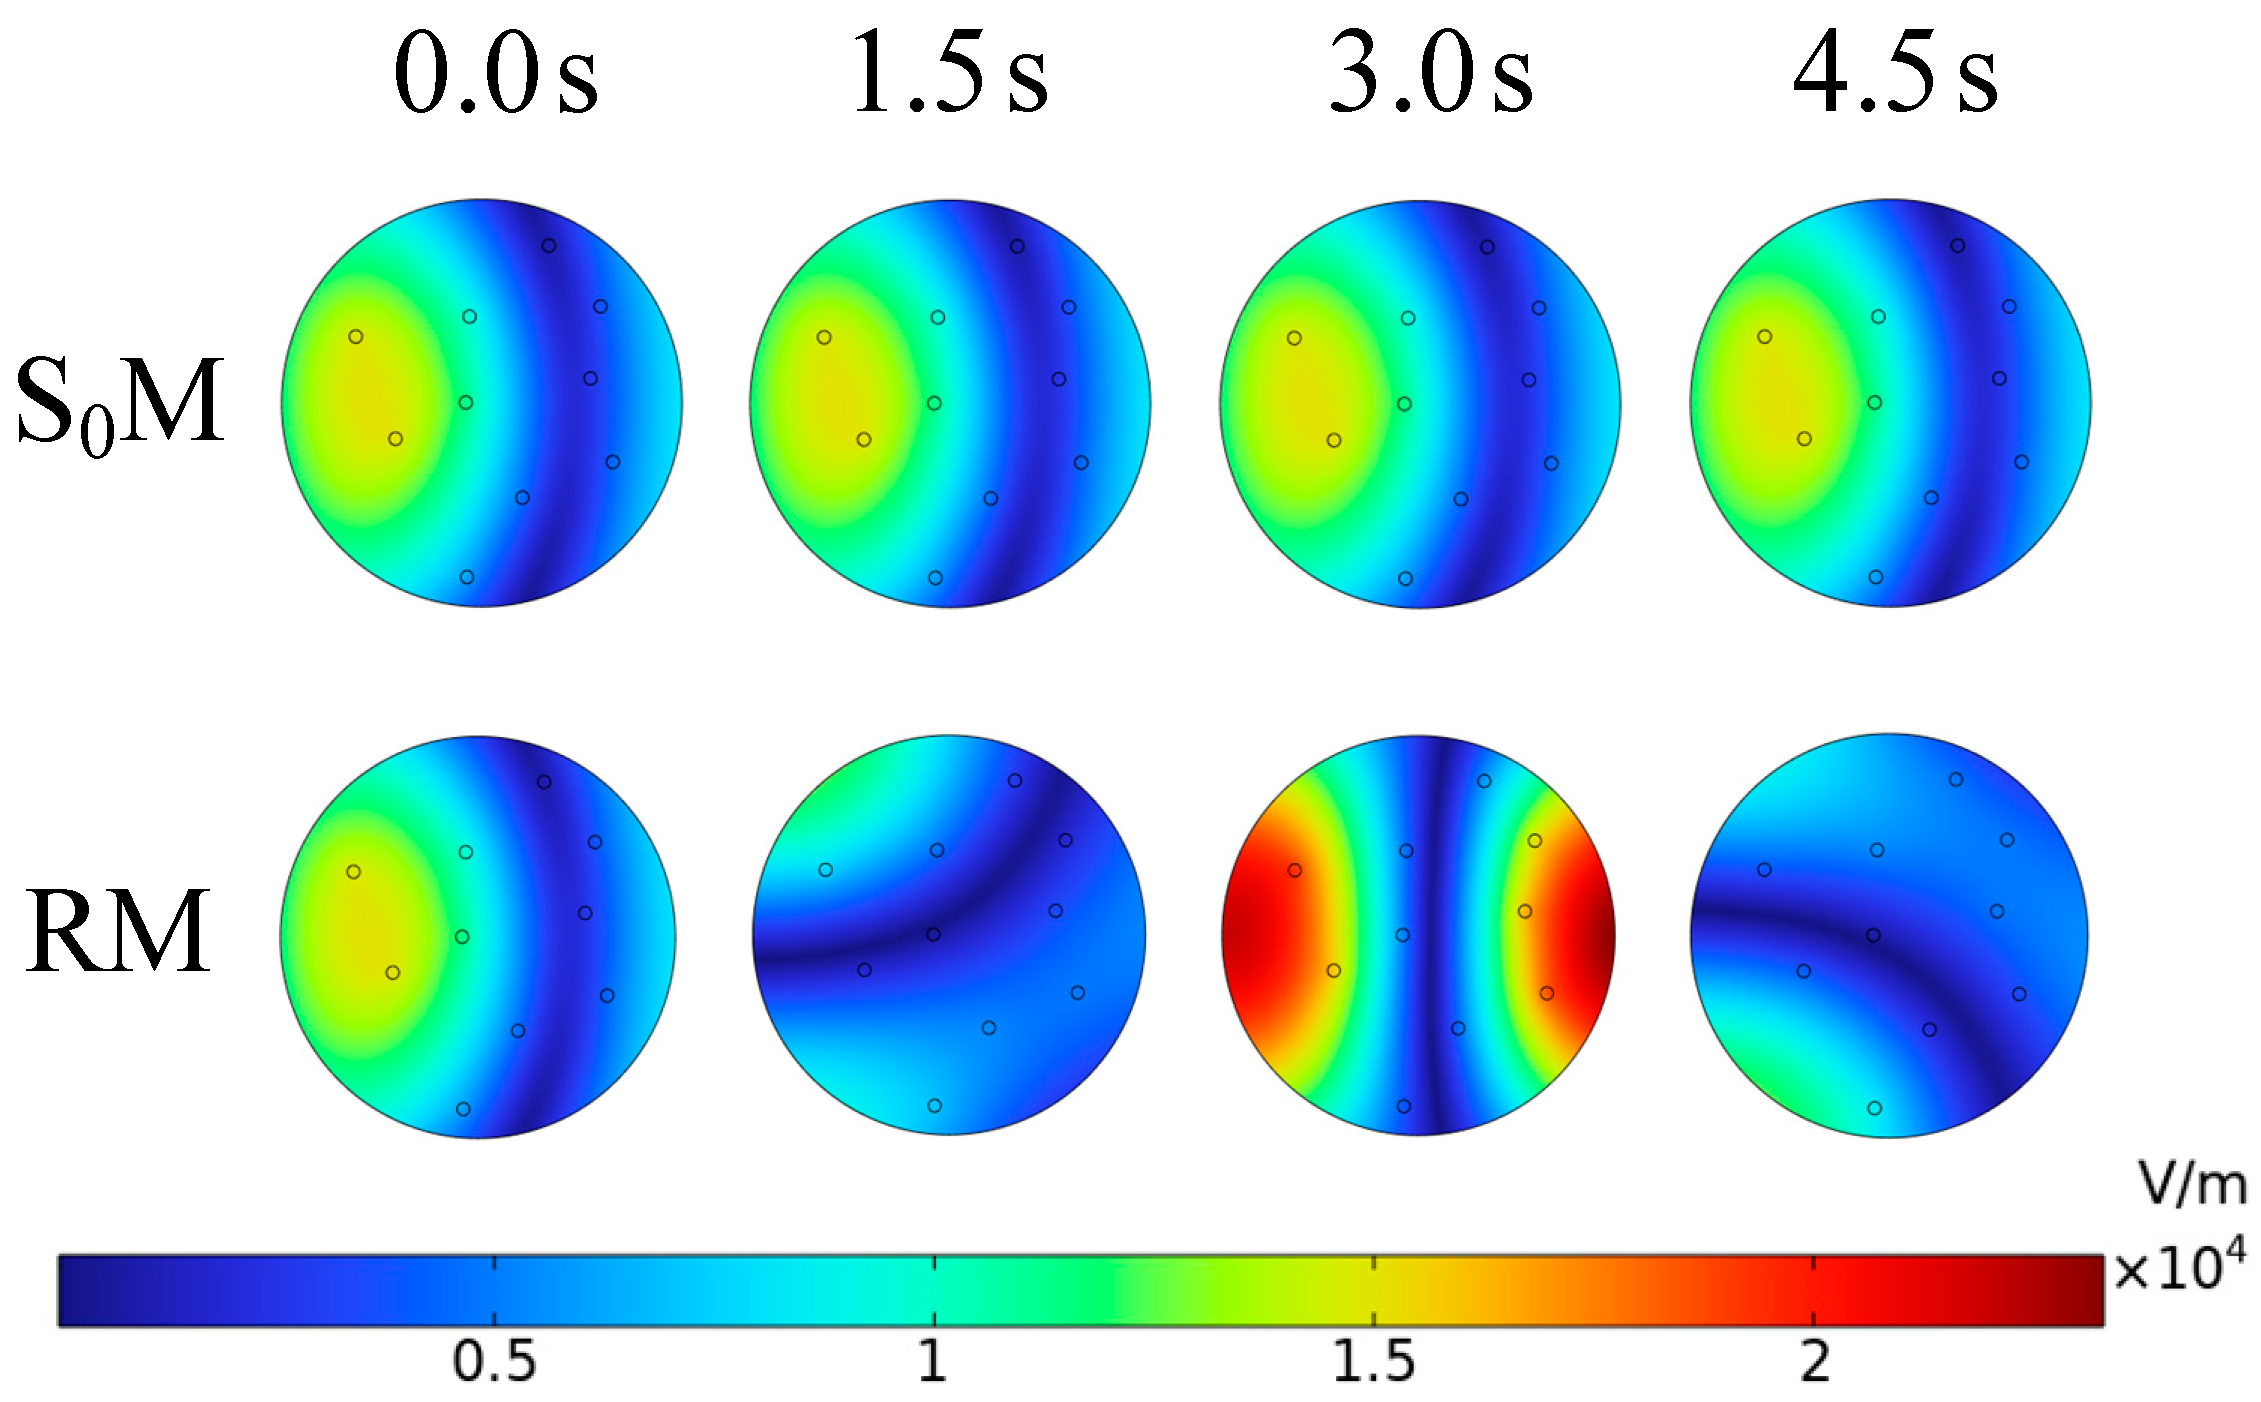
3.1. Electric Field Distribution in SM and RM
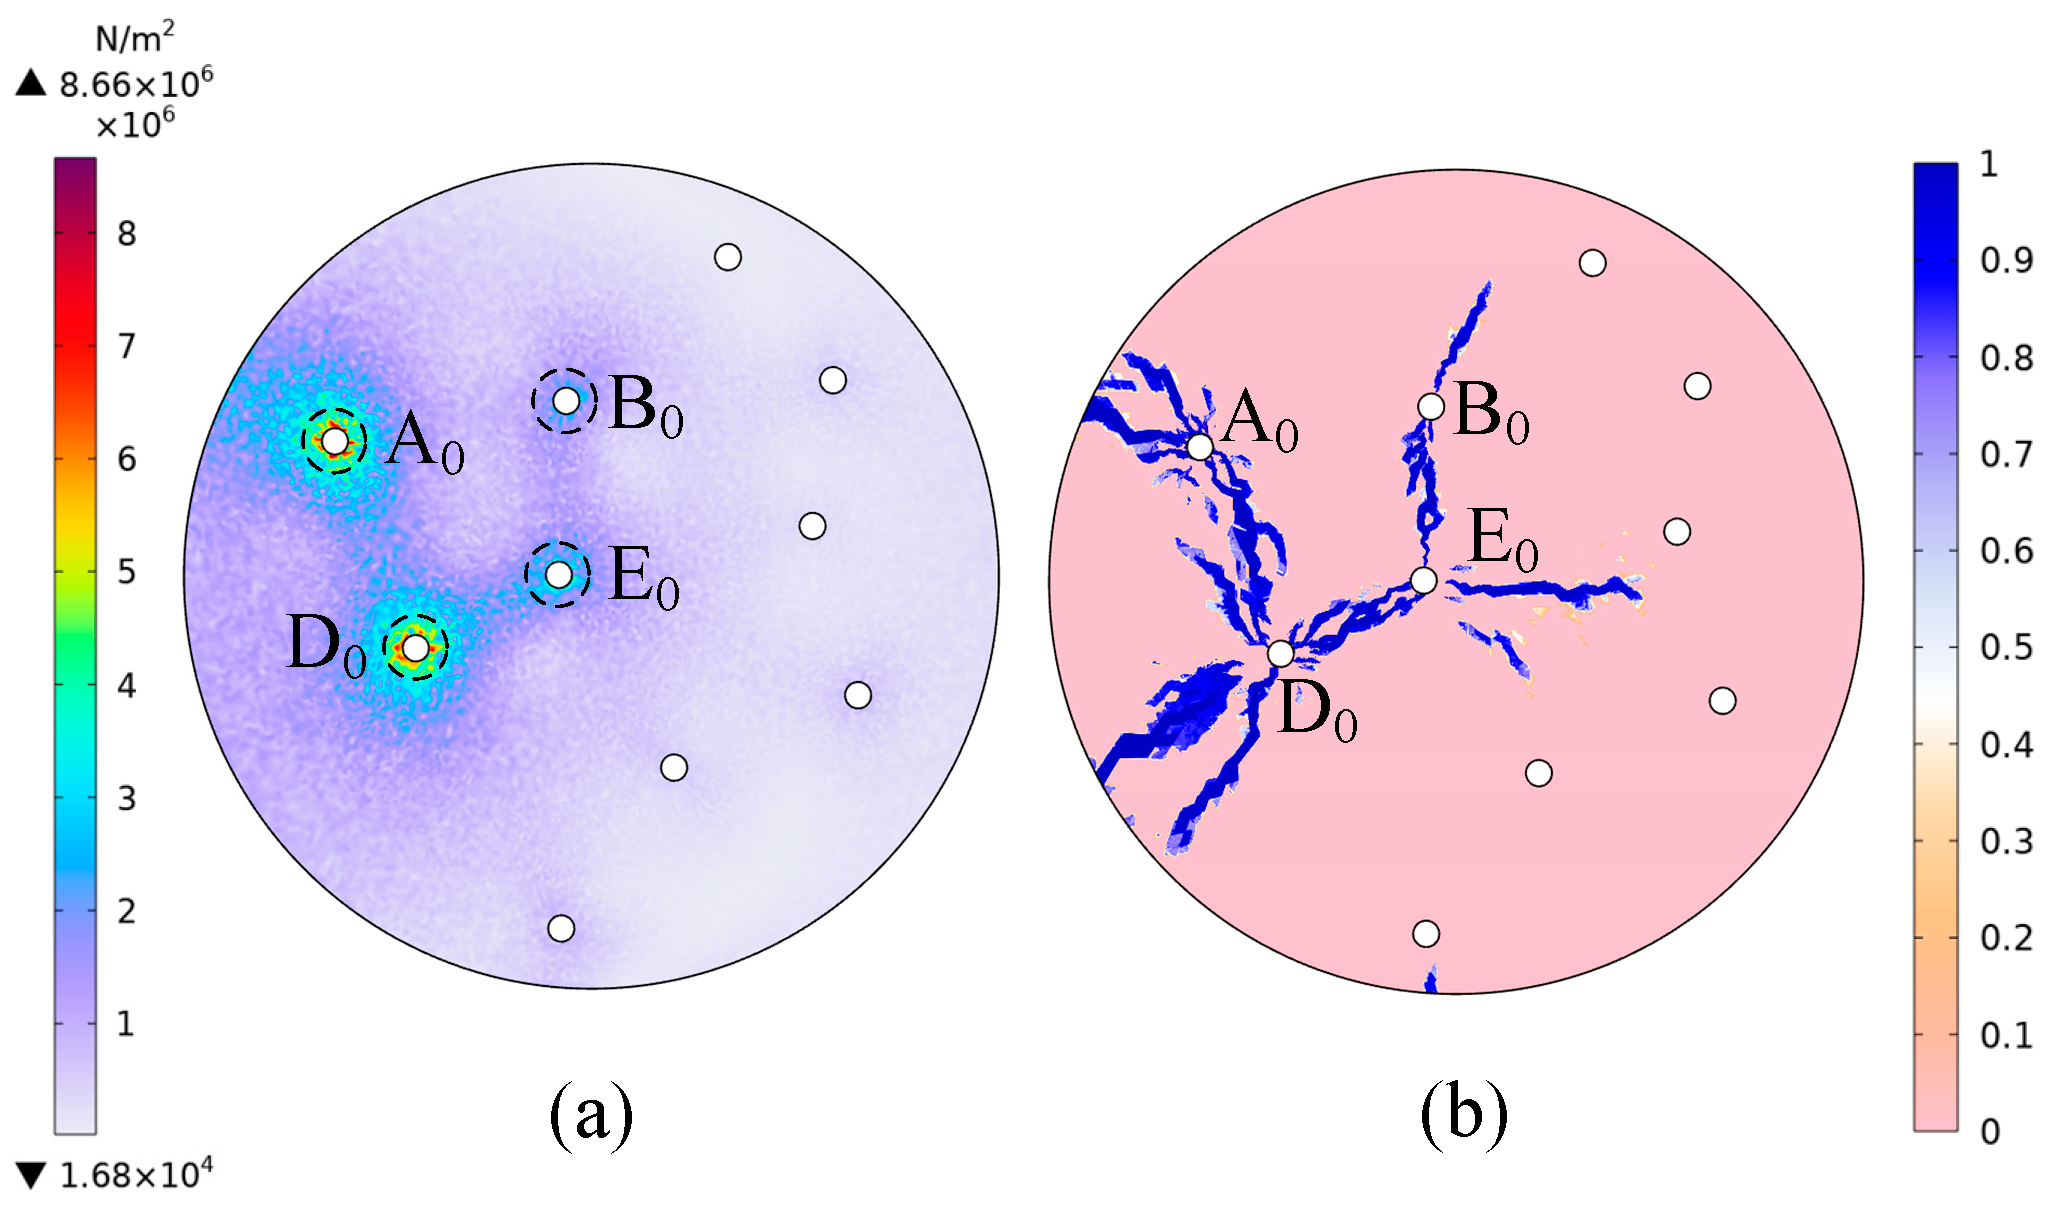
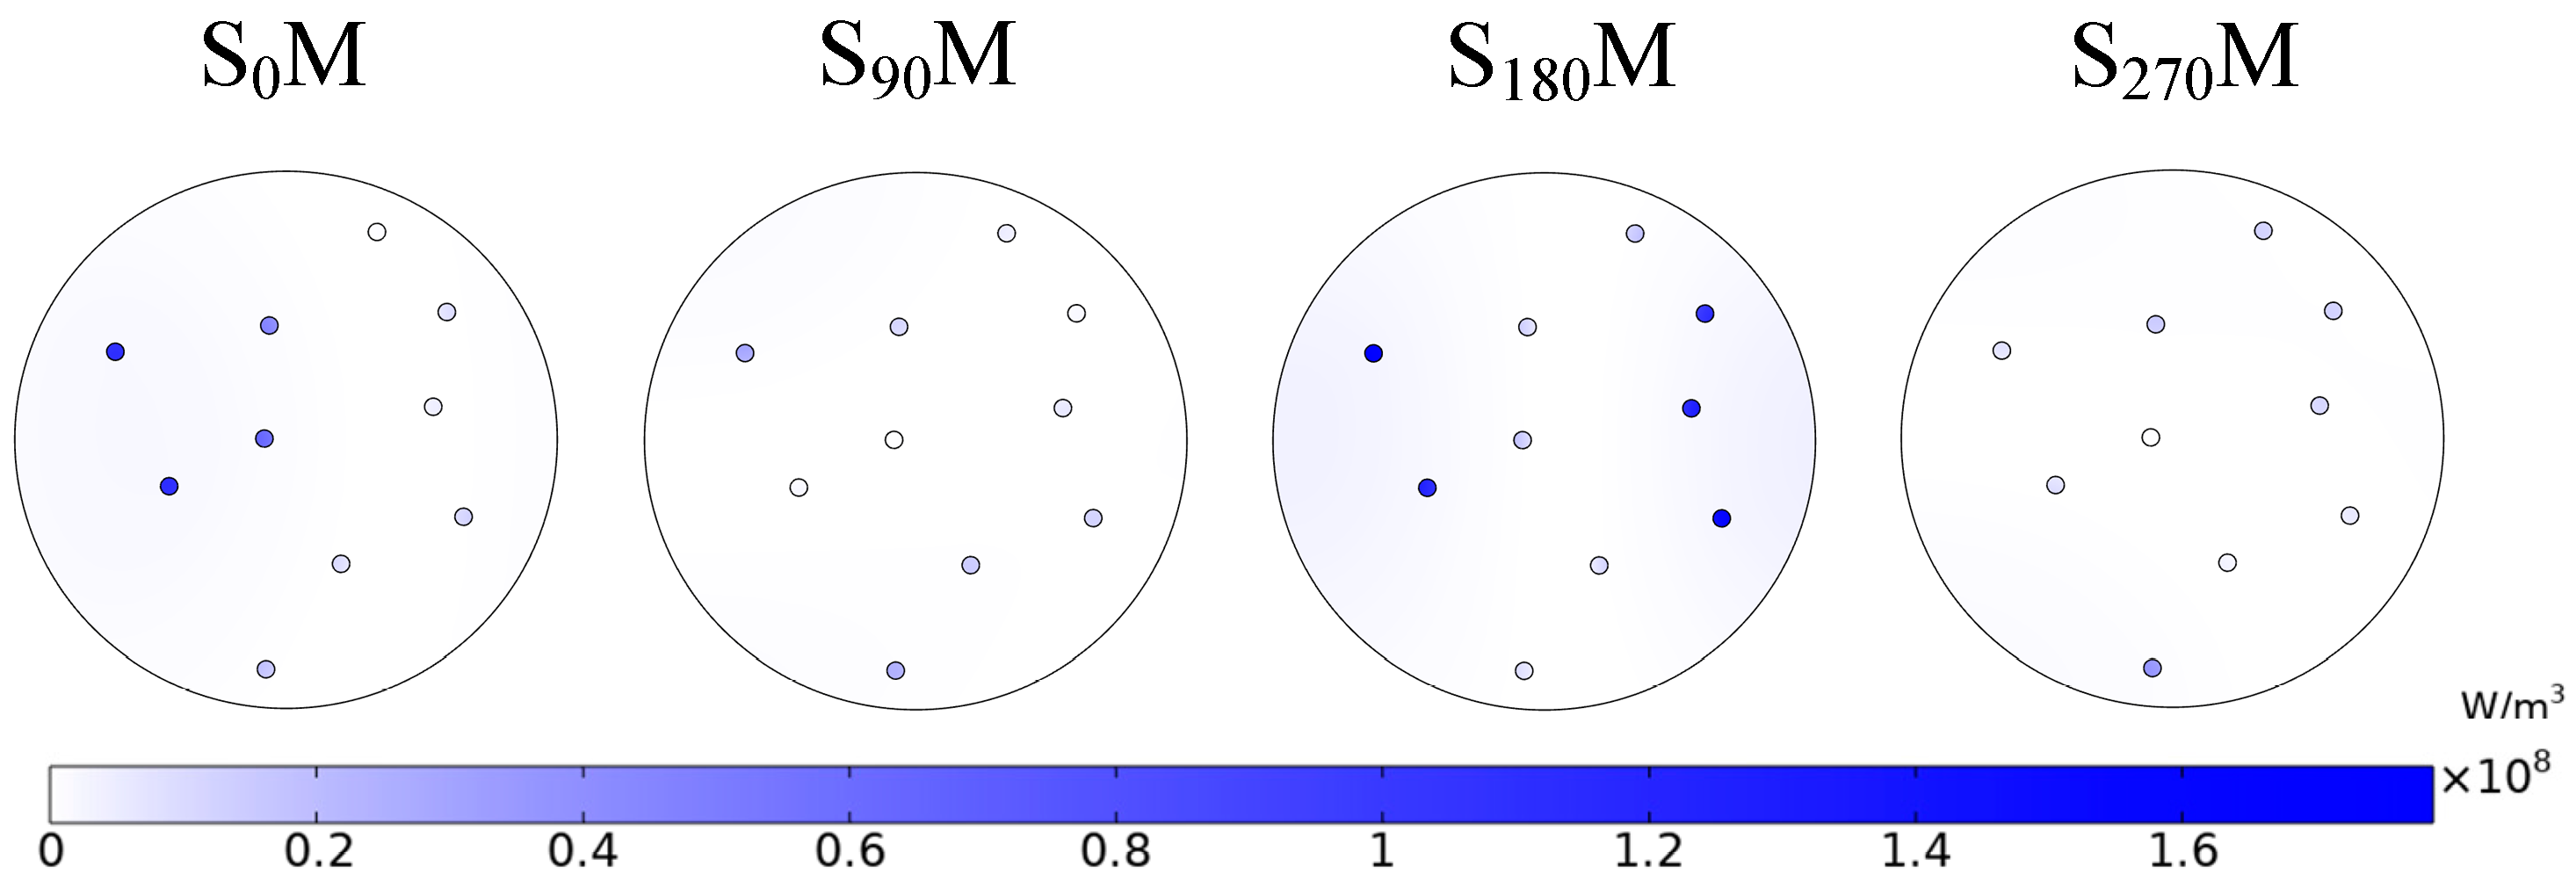
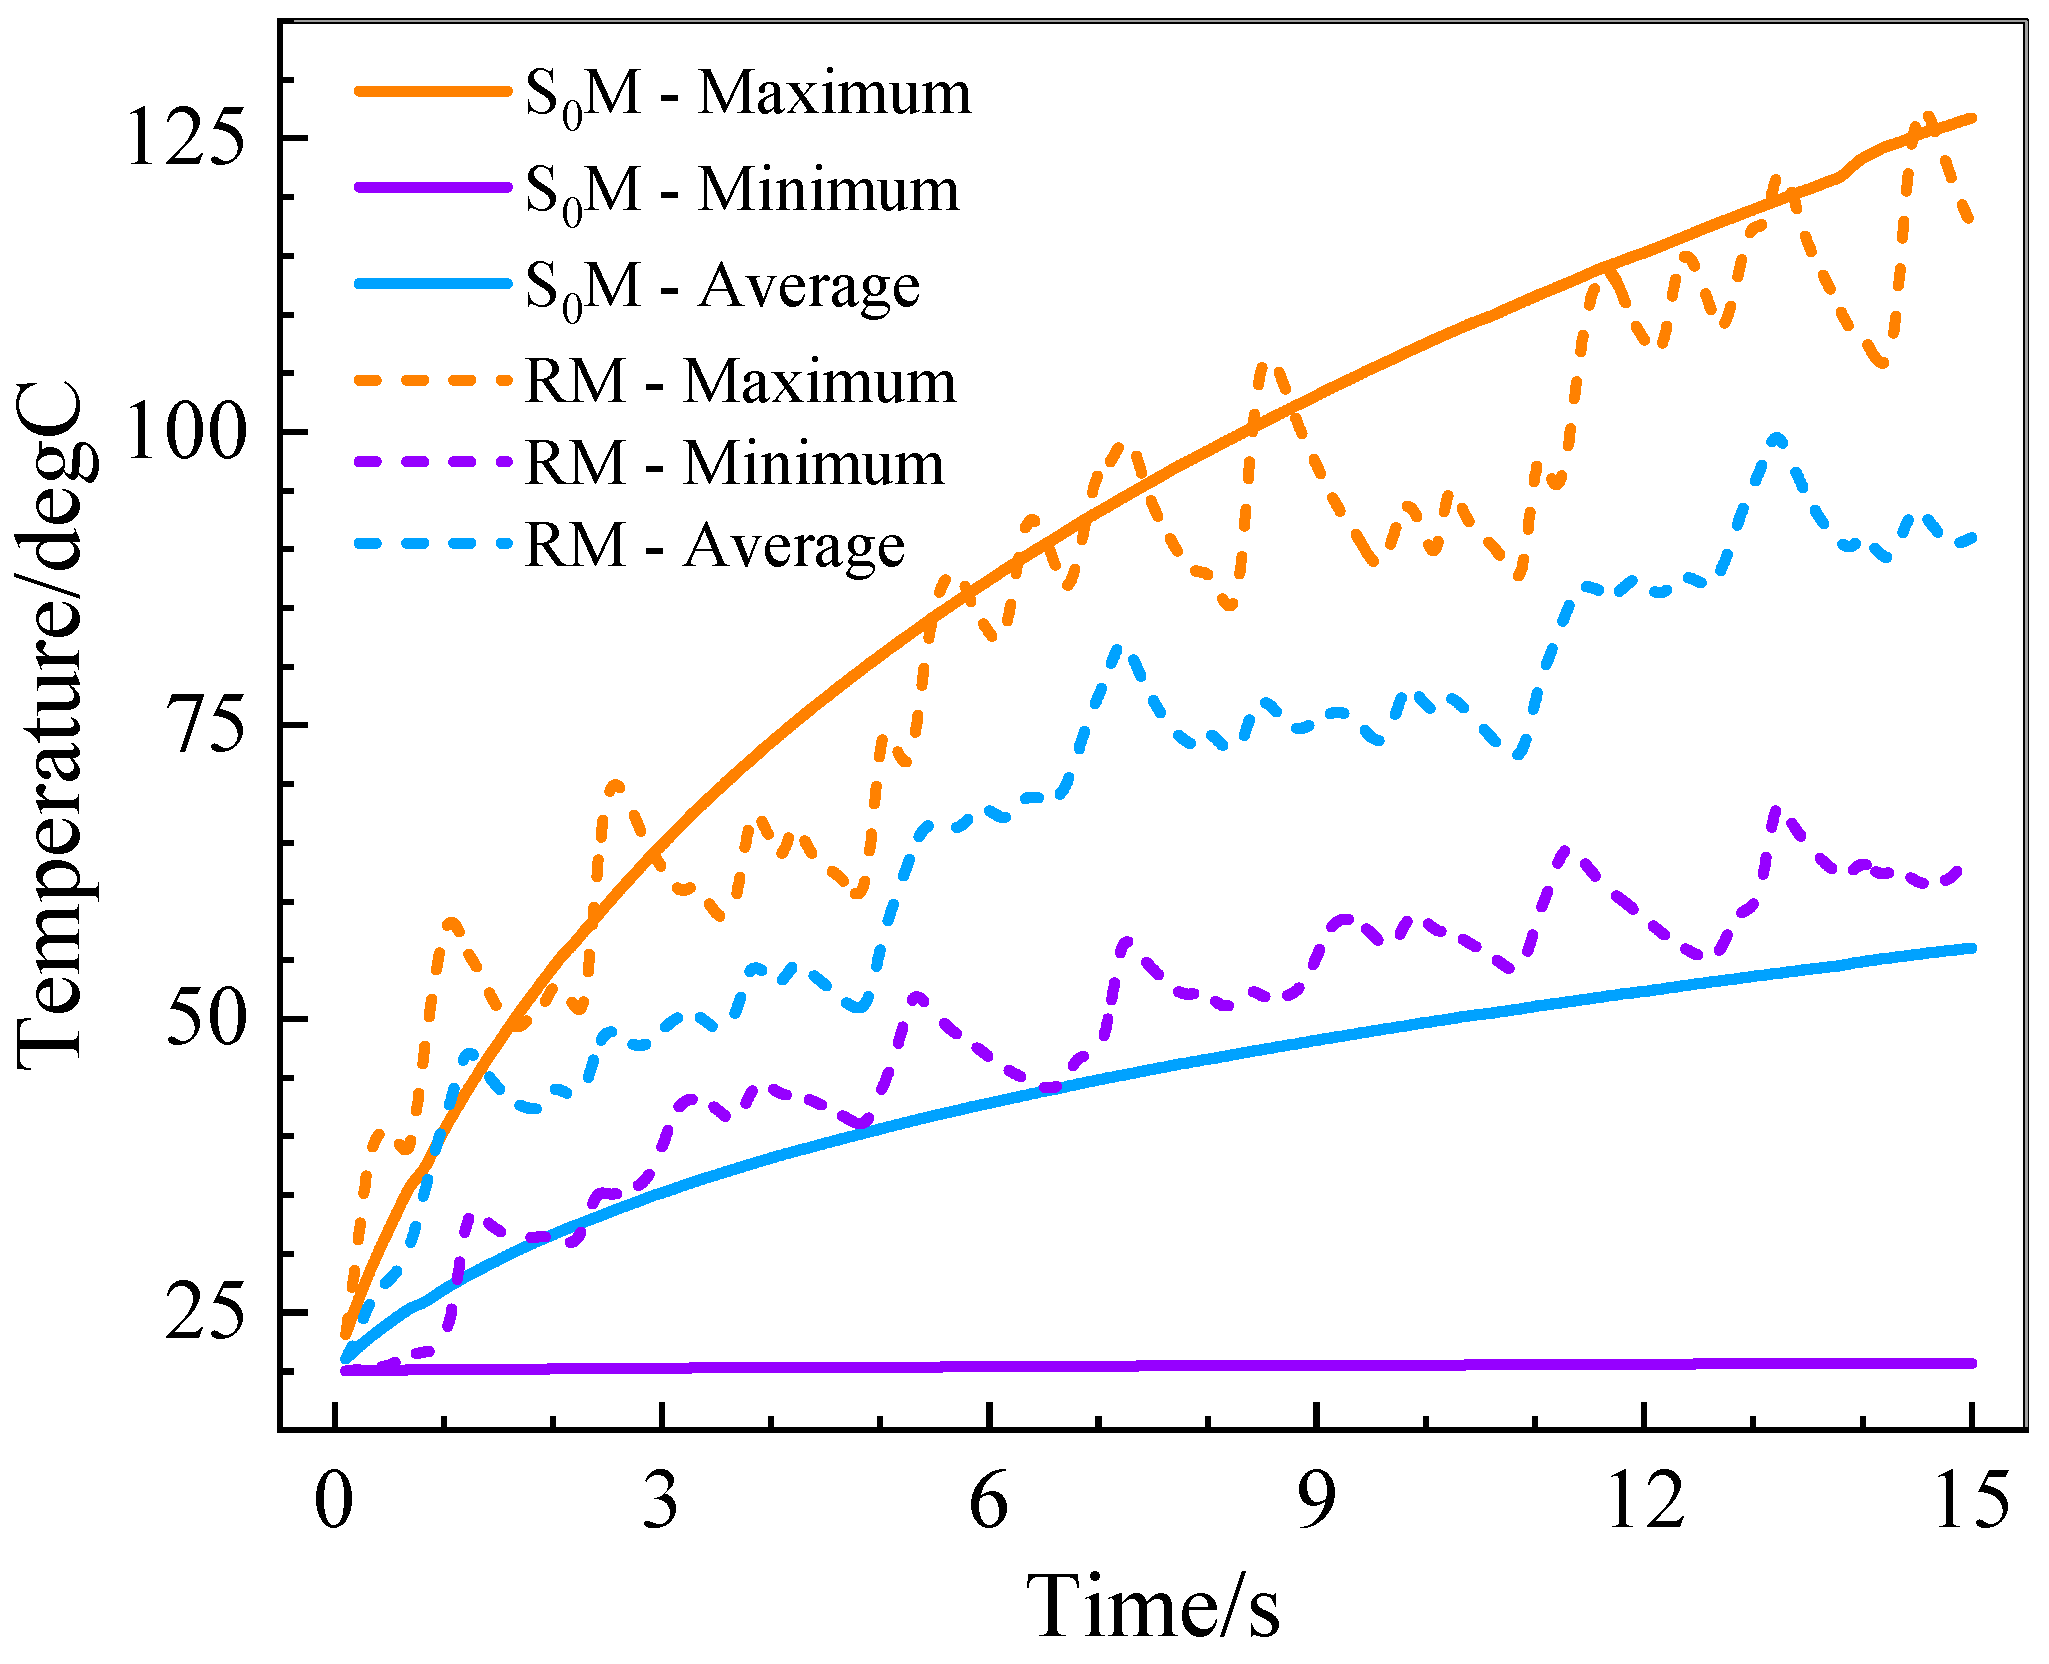
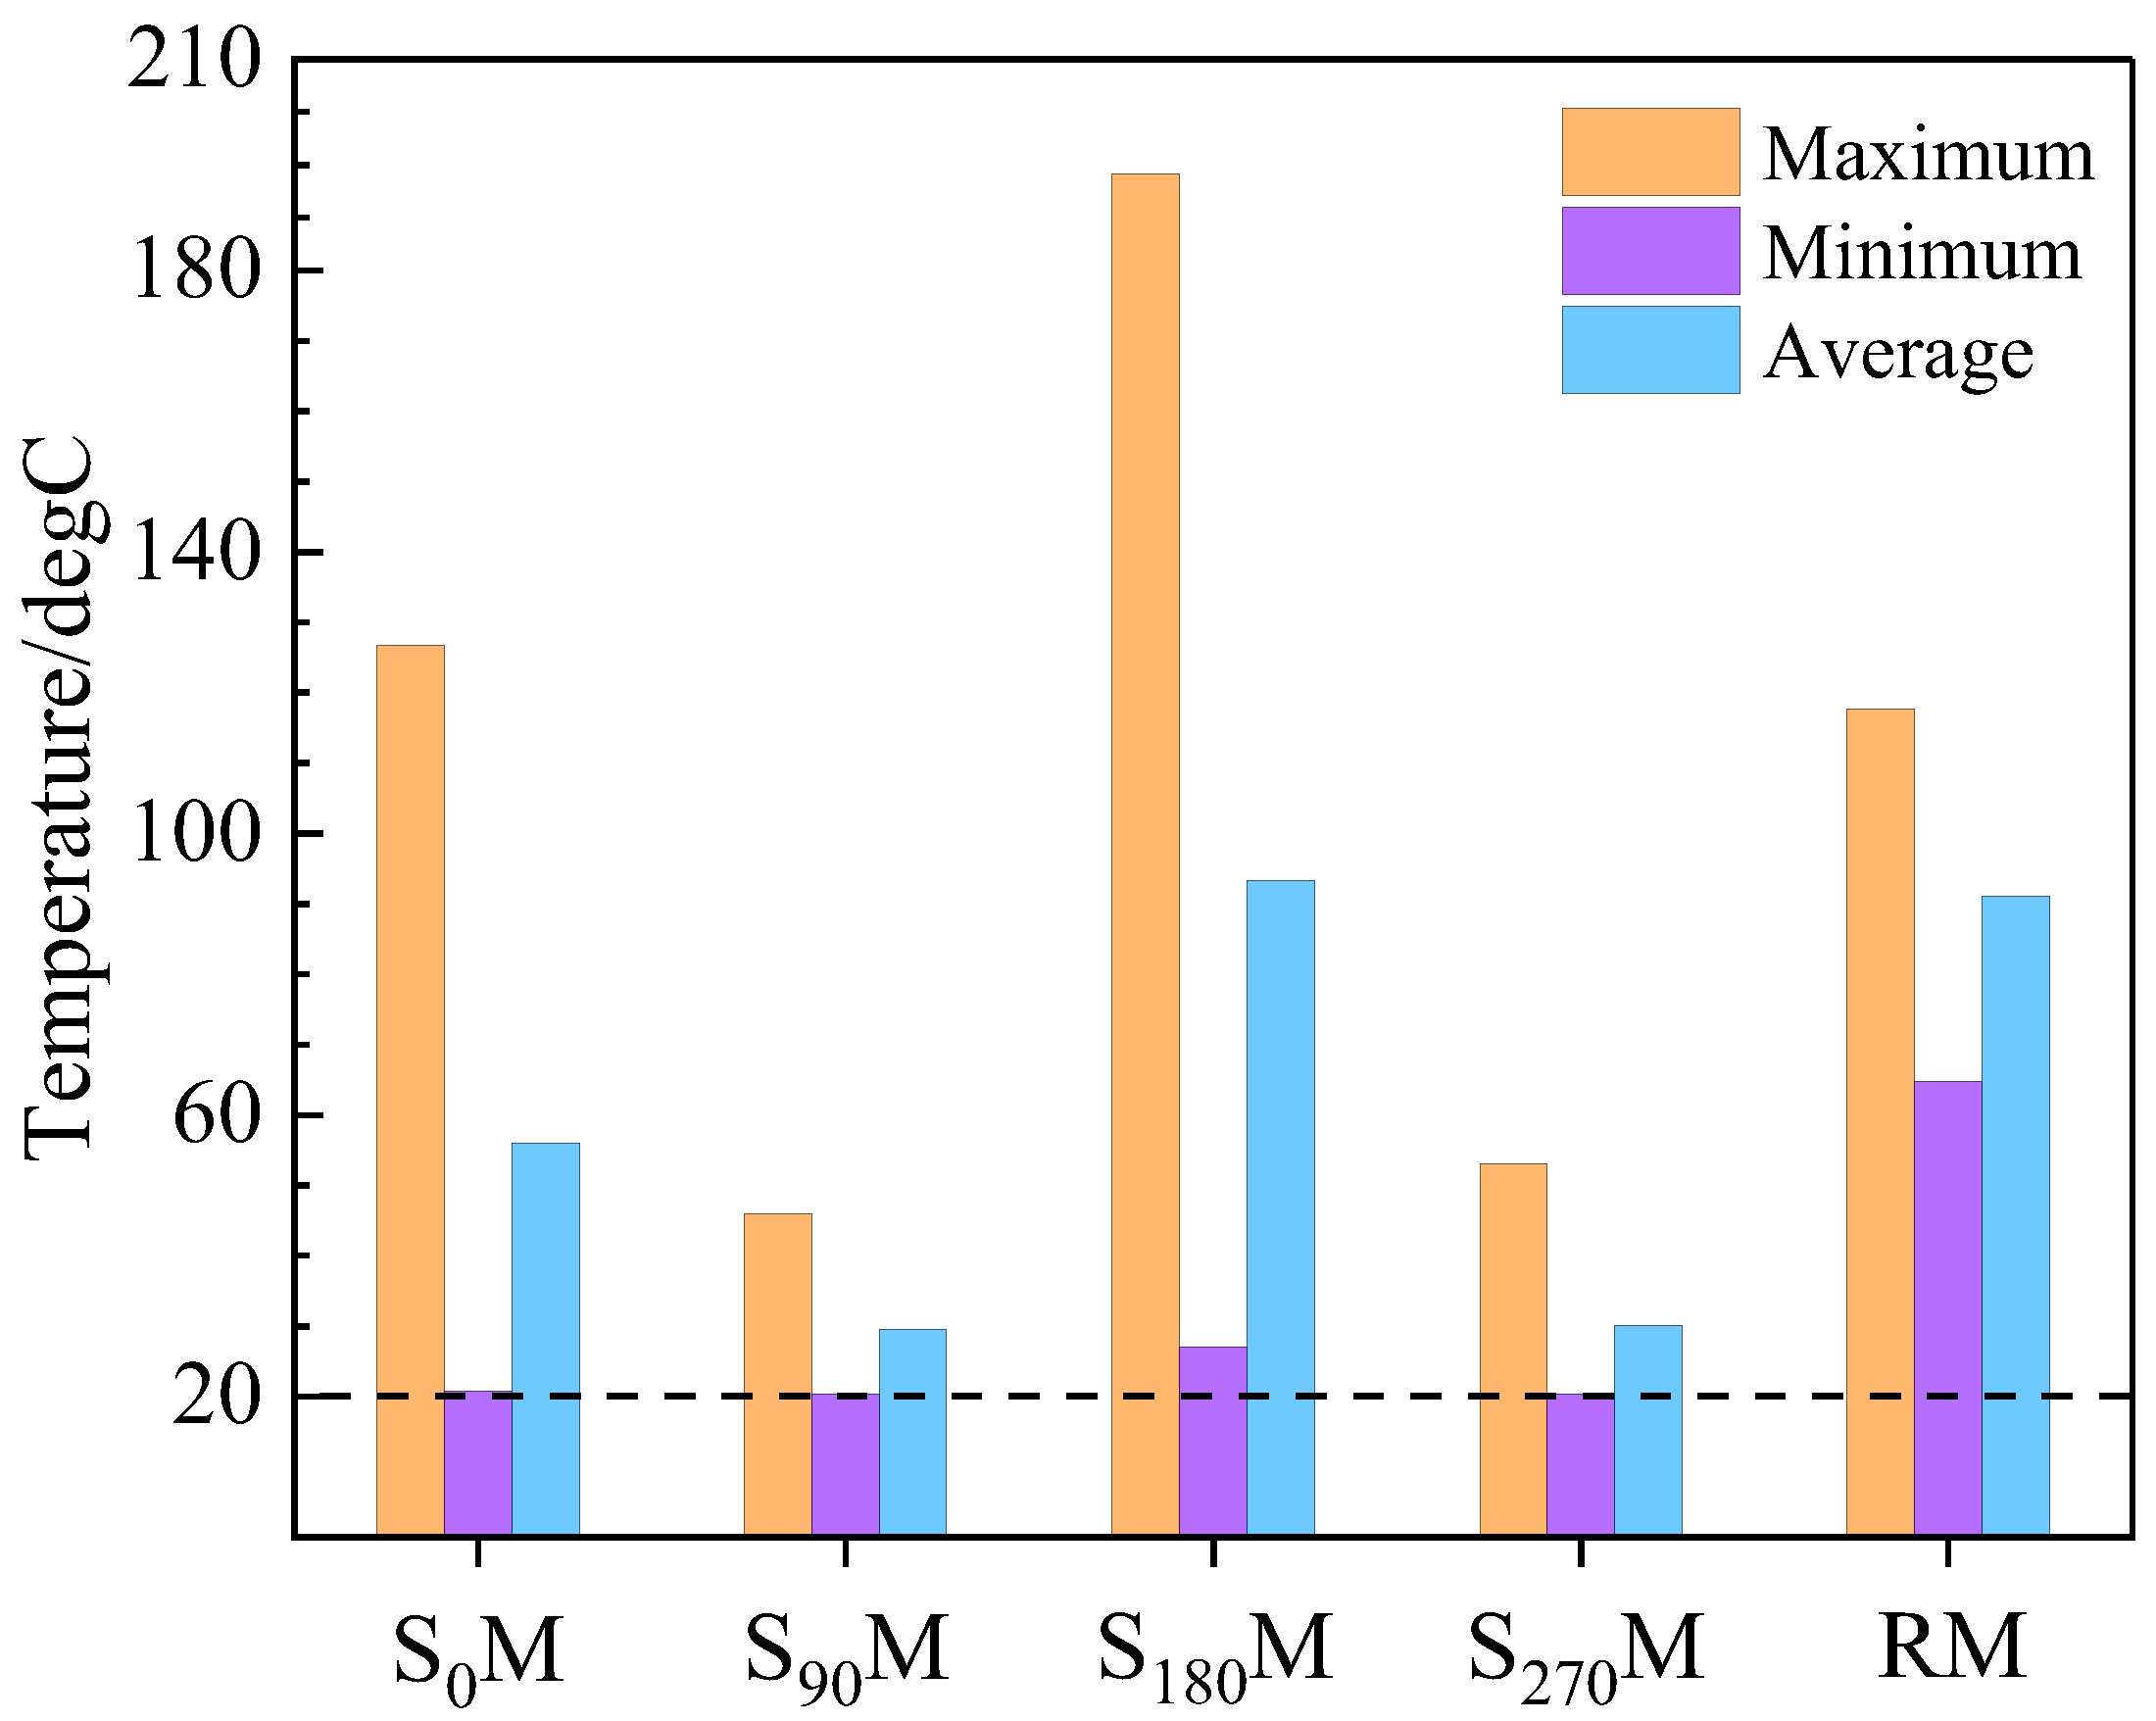
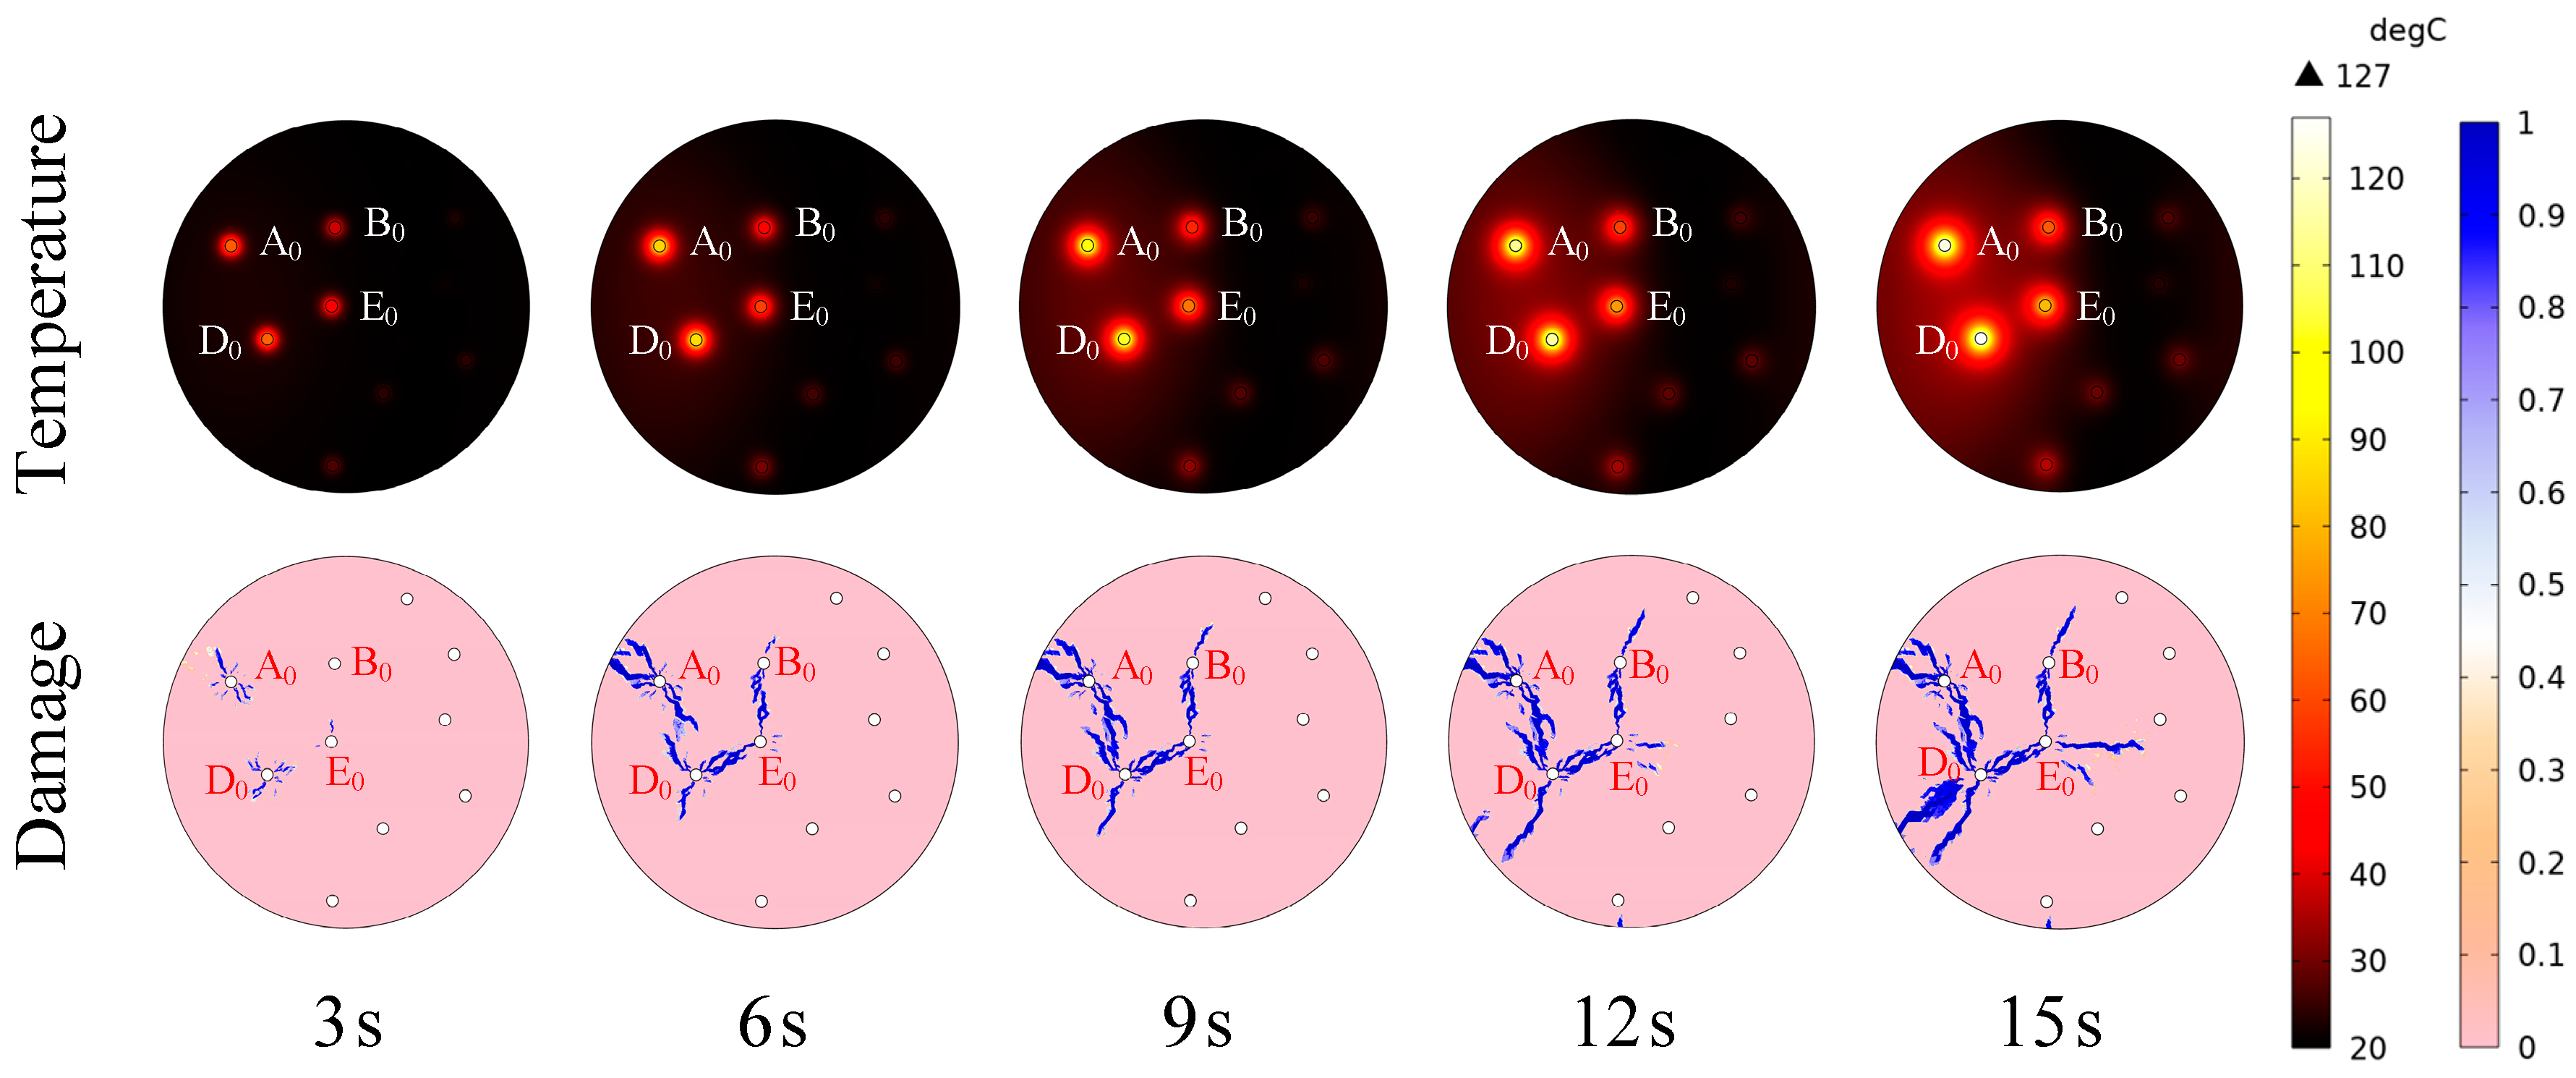
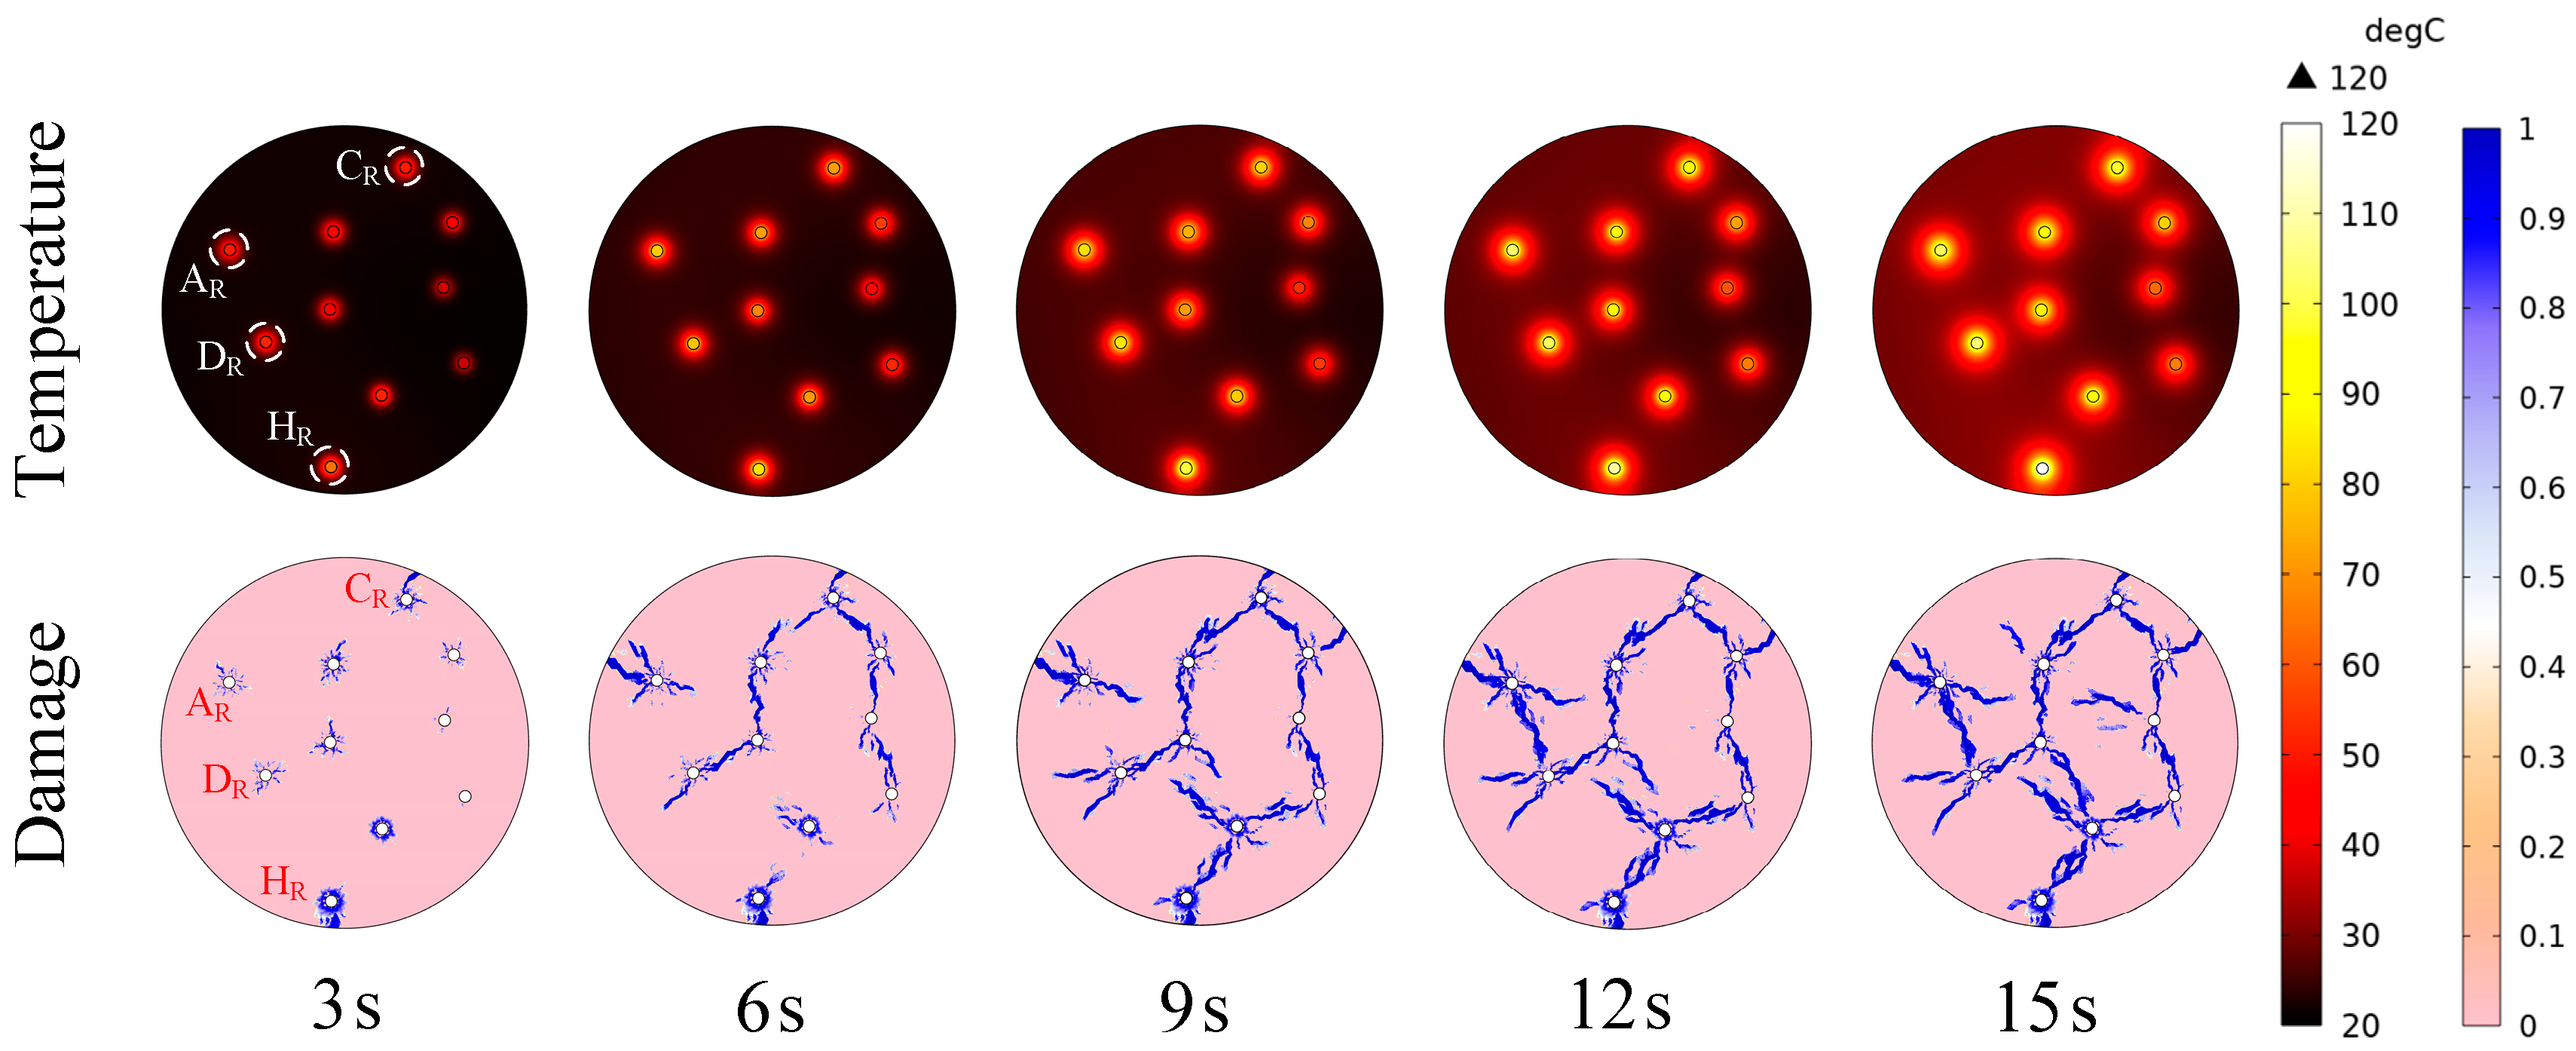
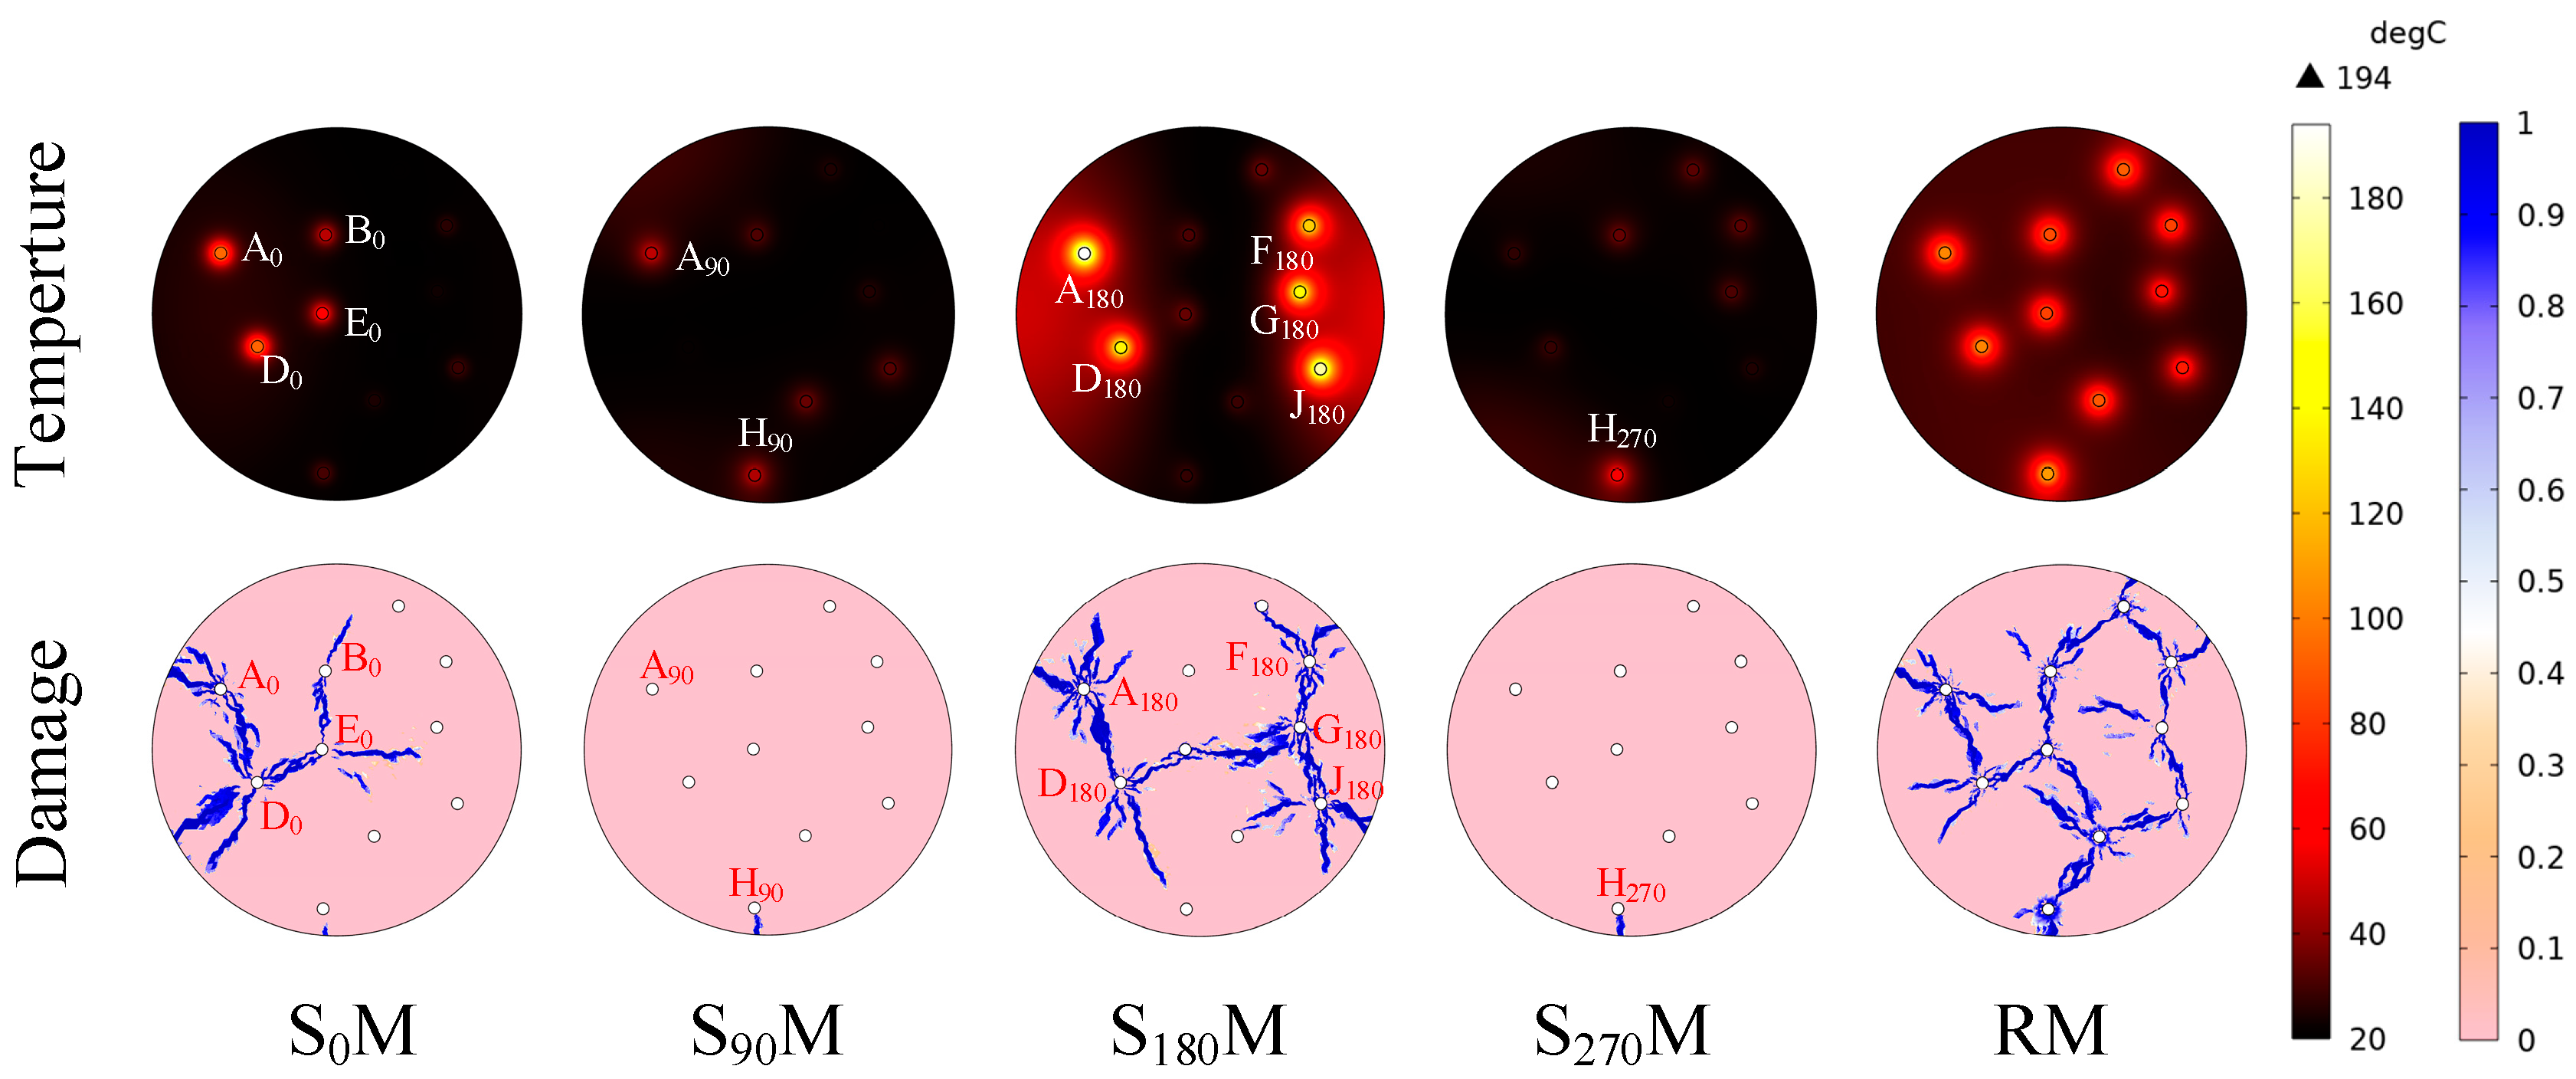
3.2. Temperature and Damage Distribution in SM and RM
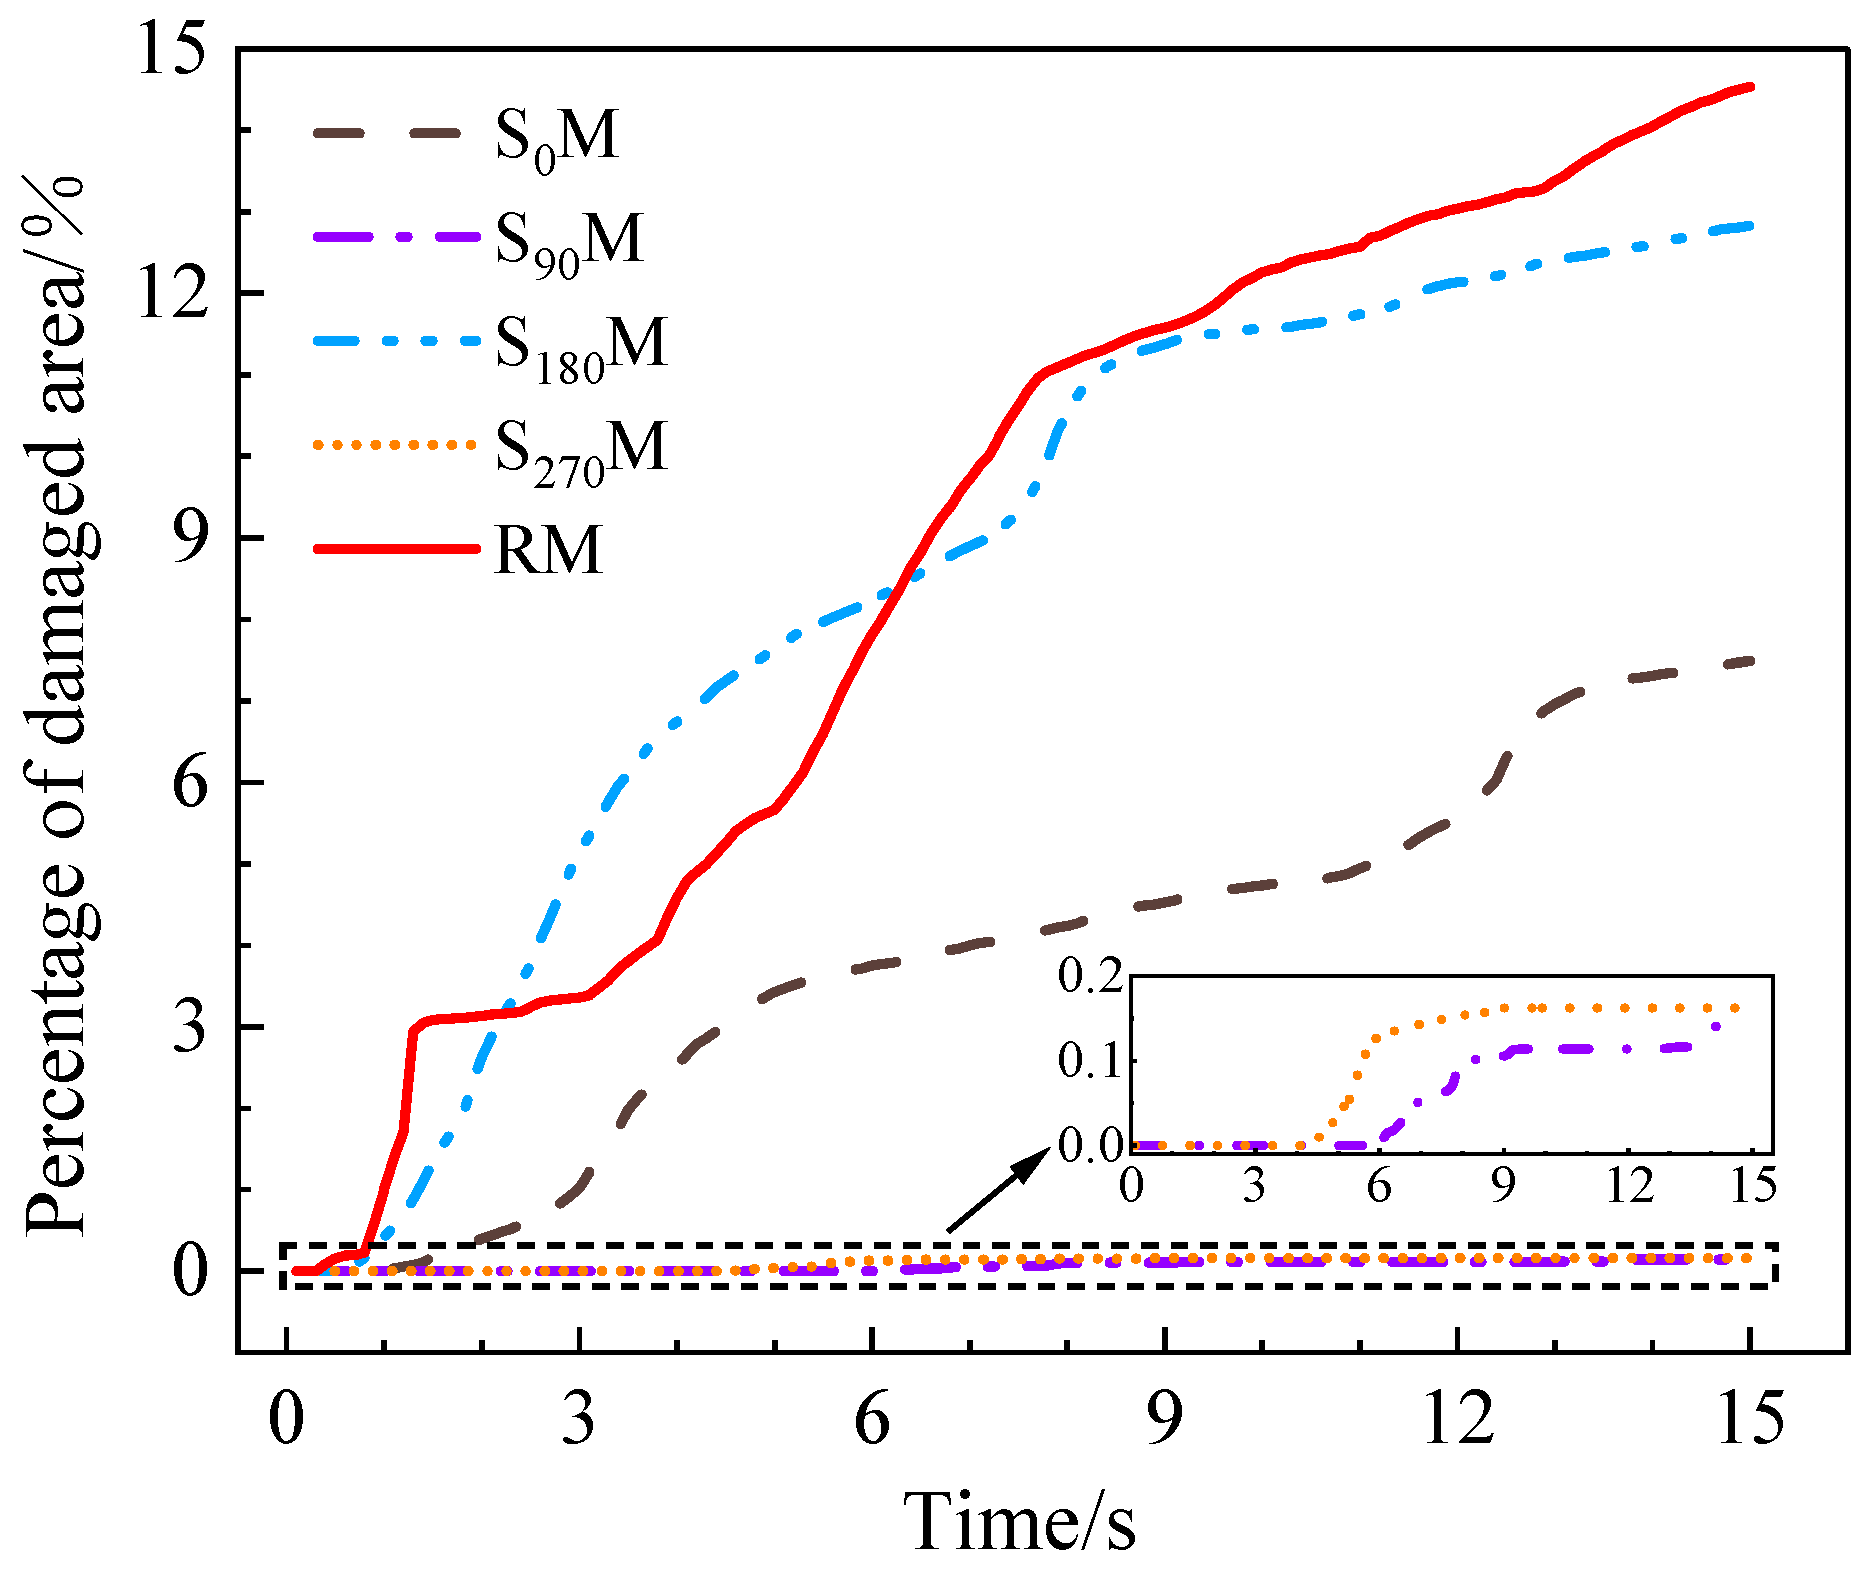
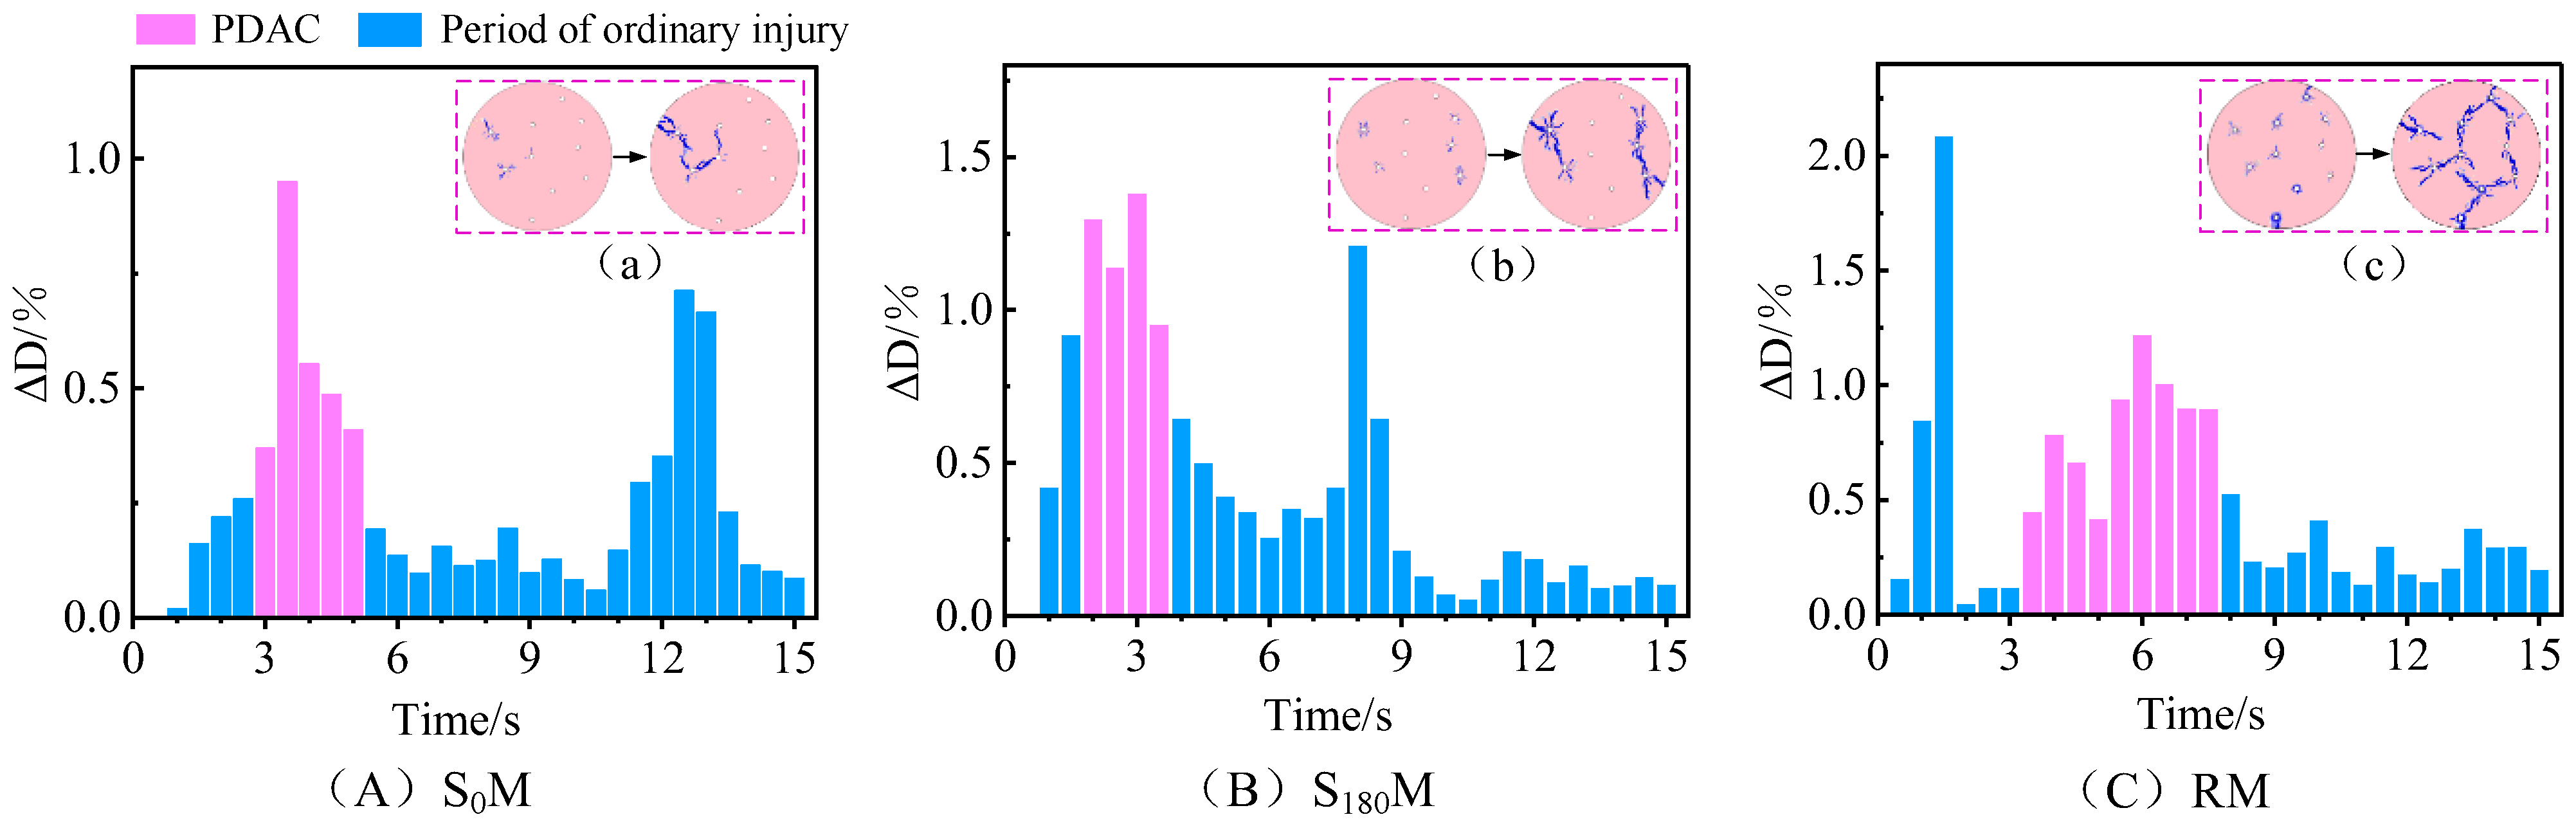
3.3. Damage Efficiency in SM and RM
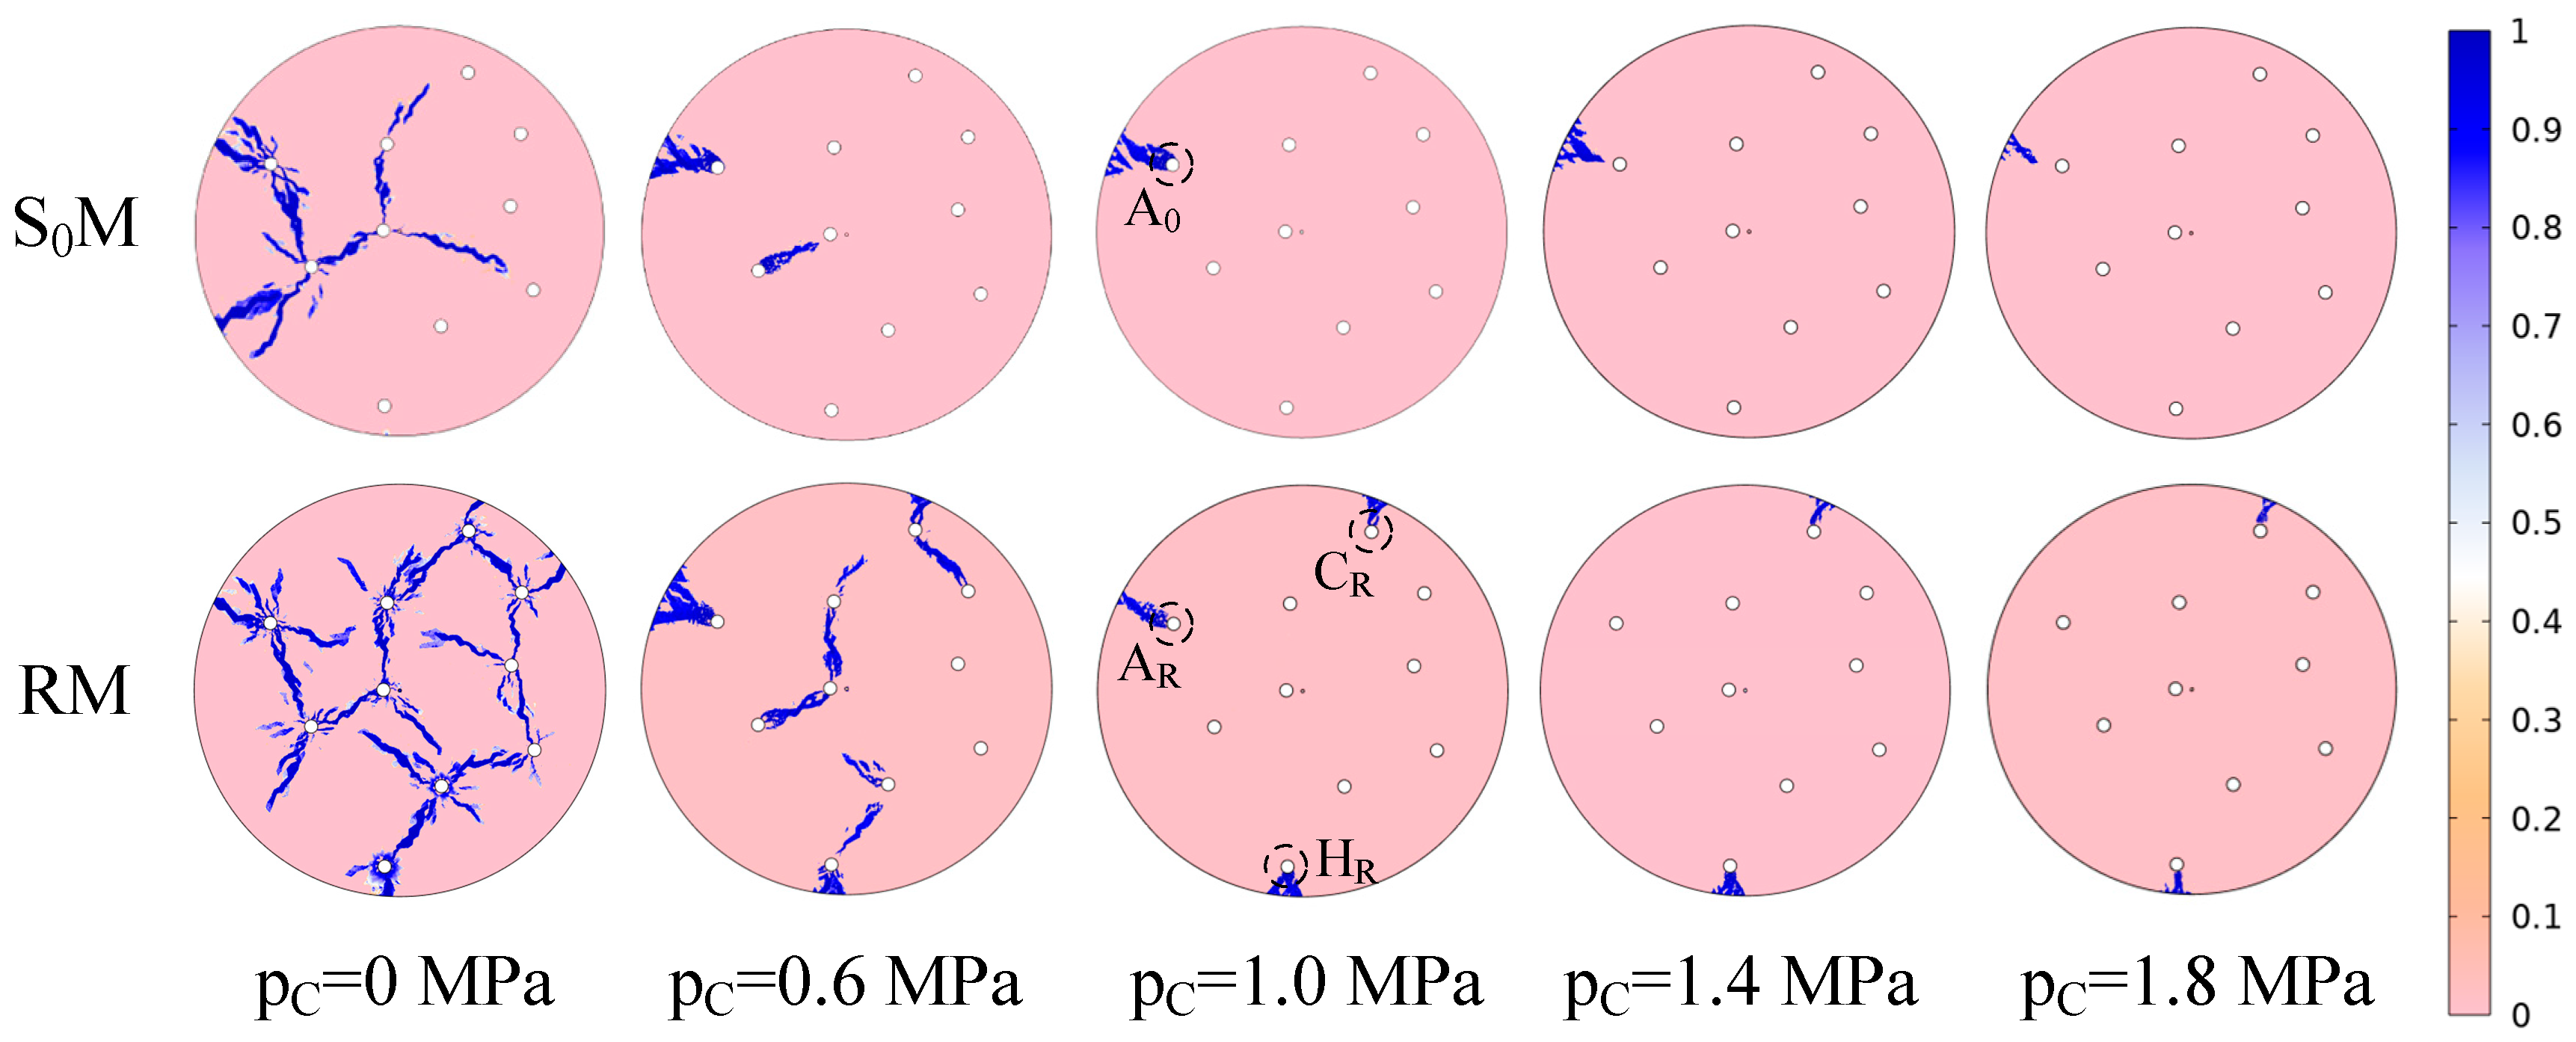
3.4. Effect of Confining Pressure
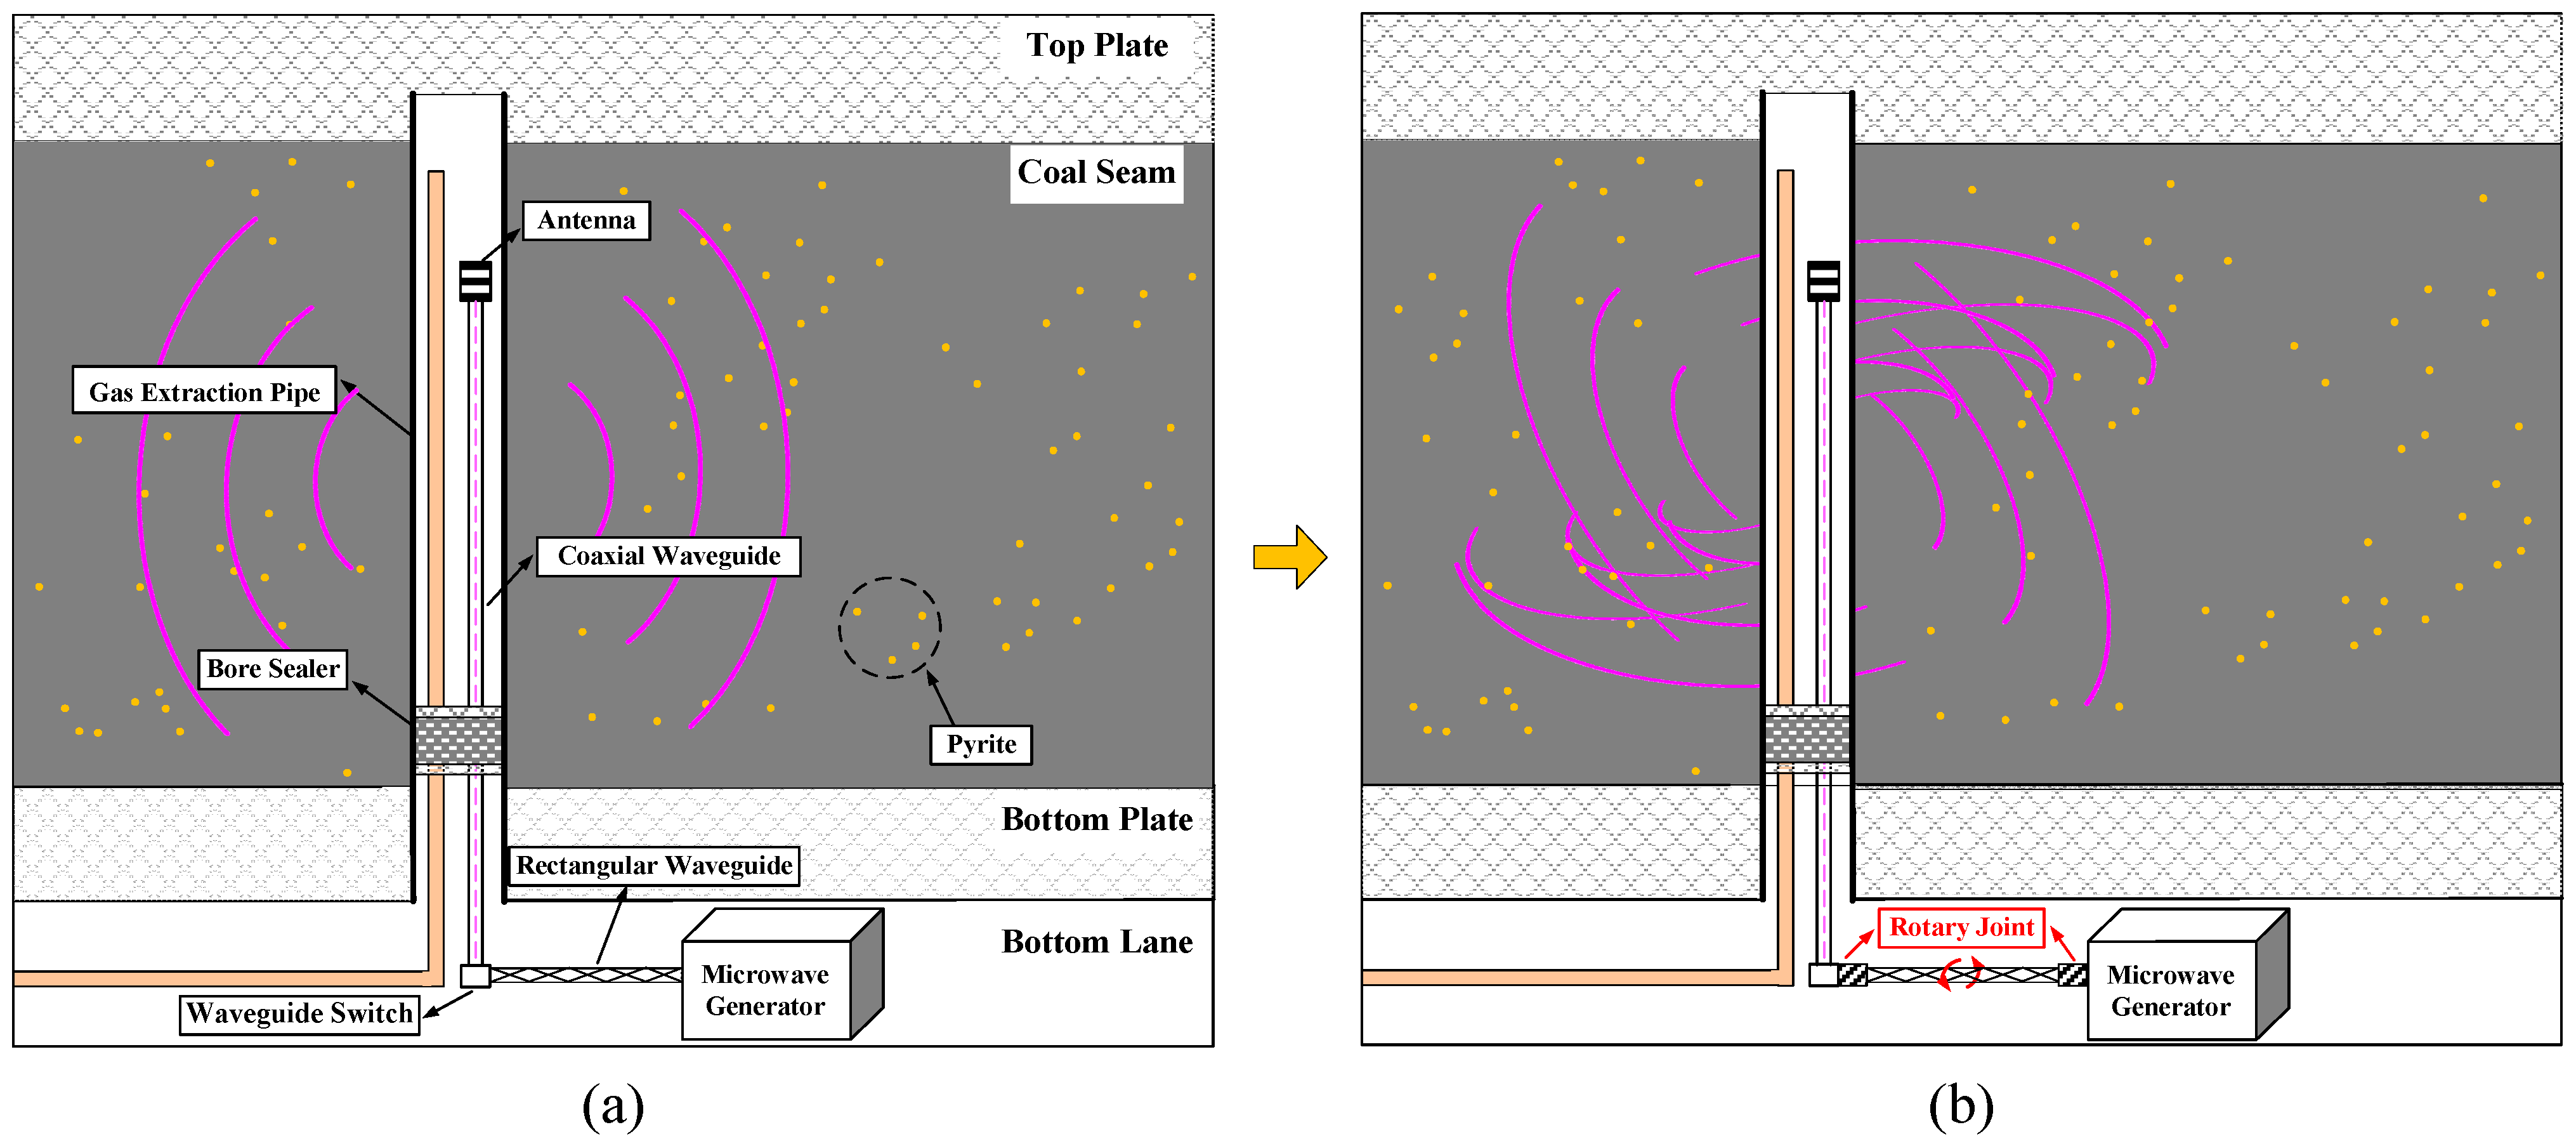
4. Applications of Microwave Heating in Coal Gas Drainage
5. Conclusions
Author Contributions
Funding
Institutional Review Board Statement
Informed Consent Statement
Data Availability Statement
Conflicts of Interest
References
- National Bureau of Statistics of China. Statistical Communiqué of the People’s Republic of China on the 2022 National Economic and Social Development; China Statistics: Beijing, China, 2023; pp. 12–29.
- Wang, Z.; Li, B.; Ren, C.; Xu, J.; Gao, Z.; Zhang, Y. A permeability model for coal based on elastic and plastic deformation conditions under the interaction of hydro-mechanical effects. J. Pet. Sci. Eng. 2022, 212, 10209. [Google Scholar] [CrossRef]
- Fu, E.; Bai, R.; Liu, G.; Zhao, H.; Yang, C. Analysis on characteristics and evolution trend of coal mine accidents in our country during “13th five-year” plan period. China Saf. Sci. J. 2022, 32, 88–94. [Google Scholar]
- Yuan, L.; Lin, B.Q.; Yang, W. Research progress and development direction of gas control with mine hydraulic technology in China coal mine. Coal Sci. Technol. 2015, 43, 45–49. [Google Scholar]
- Wang, X.; Pan, J.; Wang, K.; Mou, P.; Li, J. Fracture variation in high-rank coal induced by hydraulic fracturing using X-ray computer tomography and digital volume correlation. Int. J. Coal Geol. 2022, 252, 103942. [Google Scholar] [CrossRef]
- Zheng, C.; Lin, B.; Kizil, M.S.; Aminossadati, S.M.; Li, H.; Chen, Z. Analysis on the multi-phase flow characterization in cross-measure borehole during coal hydraulic slotting. Int. J. Min. Sci. Technol. 2018, 28, 701–705. [Google Scholar] [CrossRef]
- Yang, W.; Wang, H.; Zhuo, Q.; Lin, B.; Zang, J.; Lu, C.; Lin, M. Mechanism of water inhibiting gas outburst and the field experiment of coal seam infusion promoted by blasting. Fuel 2019, 251, 383–393. [Google Scholar]
- Miran, W.; Palazoğlu, T.K. Development and experimental validation of a multiphysics model for 915 MHz microwave tempering of frozen food rotating on a turntable. Biosyst. Eng. 2019, 180, 191–203. [Google Scholar] [CrossRef]
- Liu, J.Z.; Zhu, J.F.; Cheng, J.; Zhou, J.H.; Cen, K.F. Pore structure and fractal analysis of Ximeng lignite under microwave irradiation. Fuel 2015, 146, 41–50. [Google Scholar] [CrossRef]
- Song, Z.; Yao, L.; Jing, C.; Zhao, X.; Wang, W.; Jing, S.; Mao, Y.; Ma, C. Elucidation of the pumping effect during microwave drying of lignite. Ind. Eng. Chem. Res. 2016, 55, 3167–3176. [Google Scholar] [CrossRef]
- Hong, Y.; Lin, B.Q.; Zhu, C.J.; Wang, Z.; Liu, Z.; Saffari, P.; Nie, W. Image and ultrasonic analysis-based investigation of coal core fracturing by microwave energy. Int. J. Rock Mech. Min. Sci. 2020, 127, 104232. [Google Scholar]
- Li, H.; Tian, L.; Huang, B.; Lu, J.; Shi, S.; Lu, Y.; Huang, F.; Liu, Y.; Zhu, X. Experimental study on coal damage subjected to microwave heating. Rock Mech. Rock Eng. 2020, 53, 5631–5640. [Google Scholar] [CrossRef]
- Li, H.; Lin, B.; Yang, W.; Zheng, C.; Hong, Y.; Gao, Y.; Liu, T.; Wu, S. Experimental study on the petrophysical variation of different rank coals with microwave treatment. Int. J. Coal Geol. 2016, 154, 82–91. [Google Scholar] [CrossRef]
- Marland, S.; Han, B.; Merchant, A.; Rowson, N. The effect of microwave radiation on coal grindability. Fuel 2000, 79, 1283–1288. [Google Scholar]
- Kumar, H.; Lester, E.; Kingman, S.; Borune, R.; Avila, C.; Aled, J.; Robinson, J.; Halleck, P.M.; Mathews, J. Inducing fractures and increasing cleat apertures in a bituminous coal under isotropic stress via application of microwave energy. Int. J. Coal Geol. 2011, 88, 75–82. [Google Scholar] [CrossRef]
- Ju, Y.; Zhu, Y.; Zhang, Y.; Iglauer, S.; Pan, B.; Wang, K. Microwave-aided pyrolysis and fragmentation of tar-rich coal and rocks for in situ coal conversion and clean utilization. Int. J. Rock Mech. Min. Sci. 2023, 167, 105391. [Google Scholar] [CrossRef]
- Jones, D.-A.; Kingman, S.-W.; Whittles, D.-N.; Lowndes, I.-S. The influence of microwave energy delivery method on strength reduction in ore samples. Chem. Eng. Process. 2007, 46, 291–299. [Google Scholar] [CrossRef]
- Ali, A.-Y.; Bradshaw, S.-M. Quantifying damage around grain boundaries in microwave treated ores. Chem. Eng. Process. 2009, 48, 1566–1573. [Google Scholar] [CrossRef]
- Ali, A.-Y.; Bradshaw, S.-M. Bonded-particle modelling of microwave-induced damage in ore particles. Miner. Eng. 2010, 23, 780–790. [Google Scholar] [CrossRef]
- Wei, W.; Shao, Z.; Chen, W.; Qiao, R.; Yuan, Y.; Cheng, J. Heating process and damage evolution of microwave absorption and transparency materials under microwave irradiation. Geomech. Geophys. Geo-Energy Geo-Resour. 2021, 7, 86. [Google Scholar] [CrossRef]
- Toifl, M.; Philipp, H.; Meisels, R.; Antretter, T.; Kuchar, F. Numerical study of the influence of irradiation parameters on the microwave-induced stresses in granite. Miner. Eng. 2017, 103–104, 78–92. [Google Scholar] [CrossRef]
- Toifl, M.; Meisels, R.; Philipp, H.; Antretter, T.; Kuchar, F. 3D numerical study on microwave induced stresses in inhomogeneous hard rocks. Miner. Eng. 2016, 90, 29–42. [Google Scholar] [CrossRef]
- Wang, G.; Radziszewski, P.; Jacques, O. Particle modeling simulation of thermal effects on ore breakage. Comput. Mater. Sci. 2008, 43, 892–901. [Google Scholar] [CrossRef]
- Li, J.; Kaunda, R.B.; Arora, S.; Hartlieb, P.; Nelson, P. Fully-coupled simulations of thermally-induced cracking in pegmatite due to microwave irradiation. J. Rock Mech. Geotech. Eng. 2019, 11, 242–250. [Google Scholar] [CrossRef]
- Pressacco, M.; Kangas, J.-J.-J.; Saksala, T. Numerical modelling of microwave heating assisted rock fracture. Rock Mech. Rock Eng. 2022, 55, 481–503. [Google Scholar] [CrossRef]
- Pressacco, M.; Kangas, J.-J.-J.; Saksala, T. Numerical modelling of microwave irradiated rock fracture. Miner. Eng. 2023, 203, 108318. [Google Scholar] [CrossRef]
- Xu, T.; Yuan, Y.; Heap, M.-J.; Zhou, G.; Perera, M.-S.; Ranjith, P.-G. Microwave-assisted damage and fracturing of hard rocks and its implications for effective mineral resources recovery. Miner. Eng. 2021, 160, 106663. [Google Scholar] [CrossRef]
- Ge, L.; Liu, X.; Feng, H.; Jiang, H.; Zhou, T.; Chu, H.; Zhang, Y.; Xu, C.; Wang, Z. The interaction between microwave and coal: A discussion on the state-of-the-art. Fuel 2022, 314, 123140. [Google Scholar] [CrossRef]
- Hong, Y.; Lin, B.; Li, H.; Dai, H.; Zhu, C.; Yao, H. Three-dimensional simulation of microwave heating coal sample with varying parameters. Appl. Therm. Eng. 2016, 93, 1145–1154. [Google Scholar] [CrossRef]
- Huang, K.M.; Liao, Y.H. Transient power loss density of electromagnetic pulse in Debye media. IEEE Trans. Microw. Theory Tech. 2015, 63, 135–140. [Google Scholar] [CrossRef]
- Goldblith, S.-A.; Wang, D.-I. Effect of microwaves on Escherichia coli and bacillus subtilis. Appl. Microbiol. 1967, 15, 1371–1375. [Google Scholar] [CrossRef] [PubMed]
- Pandit, R.-B.; Prasad, S. Finite element analysis of microwave heating of potato-transient temperature profiles. J. Food Eng. 2003, 60, 193–202. [Google Scholar] [CrossRef]
- Pitchai, K.; Birla, S.-L.; Subbiah, J.; Jones, D.; Thippareddi, H. Coupled Electromagnetic And Heat Transfer Model For Microwave Heating In Domestic Ovens. J. Food Eng. 2012, 112, 100–111. [Google Scholar] [CrossRef]
- Liu, X.; Qu, Z.; Guo, T.; Sun, Y.; Rabiei, M.; Liao, H. A coupled thermo-hydrologic-mechanical (THM) model to study the impact of hydrate phase transition on reservoir damage. Energy 2021, 216, 119222. [Google Scholar] [CrossRef]
- Ghassemi, A. A review of some rock mechanics issues in geothermal reservoir development. Geotech. Geol. Eng. 2012, 30, 647–664. [Google Scholar] [CrossRef]
- Zhang, X.; Wang, J.; Gao, F.; Ju, Y.; Liu, J. Impact of water and nitrogen fracturing fluids on fracturing initiation pressure and flow pattern in anisotropic shale reservoirs. Comput. Geotech. 2017, 81, 59–76. [Google Scholar] [CrossRef]
- Zhang, Q.; Ma, D.; Liu, J.; Zhang, K.; Fan, Z. Numerical studies on the failure process of heterogeneous rock material with preexisting fracture under uniaxial compression. Adv. Civ. Eng. 2018, 2018, 1–12. [Google Scholar] [CrossRef]
- Yu, Q.; Ranjith, P.-G.; Liu, H.; Yang, T.; Tang, S.; Tang, C.; Yang, S. A mesostructure-based damage model for thermal cracking analysis and application in granite at elevated temperatures. Rock Mech. Rock Eng. 2015, 48, 2263–2282. [Google Scholar] [CrossRef]
- Tao, J.; Shi, A.; Li, H.T.; Zhou, J.; Yang, X.; Lu, G. Thermal-mechanical modelling of rock response and damage evolution during excavation in prestressed geothermal deposits. Int. J. Rock Mech. Min. Sci. 2021, 147, 104913. [Google Scholar] [CrossRef]
- Zhu, W.C.; Wei, C.H.; Tian, J.; Yang, T.; Tang, C. Coupled thermal-hydraulic-mechanical model during rock damage and its preliminary application. Rock Soil Mech. 2009, 30, 3851–3857. [Google Scholar]
- Zhu, W.; Wei, C.; Li, S.; Wei, J.; Zhang, M. Numerical modeling on destress blasting in coal seam for enhancing gas drainage. Int. J. Rock Mech. Min. Sci. 2013, 59, 179–190. [Google Scholar] [CrossRef]
- Long, S.; Hong, Y.; Sun, X.; Yang, F.; Guo, J.; Nie, W. Microwave heating temperature rise characteristics of composite minerals under the circumferential stirring mode. J. China Univ. Min. Technol. 2024, 53, 318–333. [Google Scholar]
- Ma, M. Transformation Characteristics of Pyriteduring Coal Accumulation, Flotation and Pyrolysis. Ph.D. Thesis, China University of Mining and Technology, Beijing, China, 2023. [Google Scholar]
- Sun, Q.; Zhang, W.; Xue, L.; Zhang, Z.; Su, T. Thermal damage pattern and thresholds of granite. Environ. Earth Sci. 2015, 74, 2341–2349. [Google Scholar] [CrossRef]
- Liu, L.; Ji, H.; Elsworth, D.; Zhi, S.; Lv, X.; Wang, T. Dual-damage constitutive model to define thermal damage in rock. Int. J. Rock Mech. Min. Sci. 2020, 126, 104185. [Google Scholar] [CrossRef]
- Lin, X.; Cheng, W.; Xie, J.; Liu, Z.; Hu, W. Study of thermal-mechanical coupling numerical simulation of rock under uniaxial heating. Coal Sci. Technol. 2018, 46, 145–151. [Google Scholar]
- Zhang, L.; Qi, Q.; Ren, T.; Li, X.; Gao, K.; Li, C.; Li, X.; Yuan, H. Study on the damage and fracture characteristics of coal rock based on the X-ray micro-CT scanning technology and statistical strength theory. Coal Sci. Technol. 2023, 51, 1–12. [Google Scholar]
- Wang, P.; Yin, T.; Li, X.; Konietzky, H. Dynamic compressive strength and failure mechanisms of microwave damaged sandstone subjected to intermediate loading rate. Trans. Nonferrous Met. Soc. China 2022, 32, 3714–3730. [Google Scholar] [CrossRef]

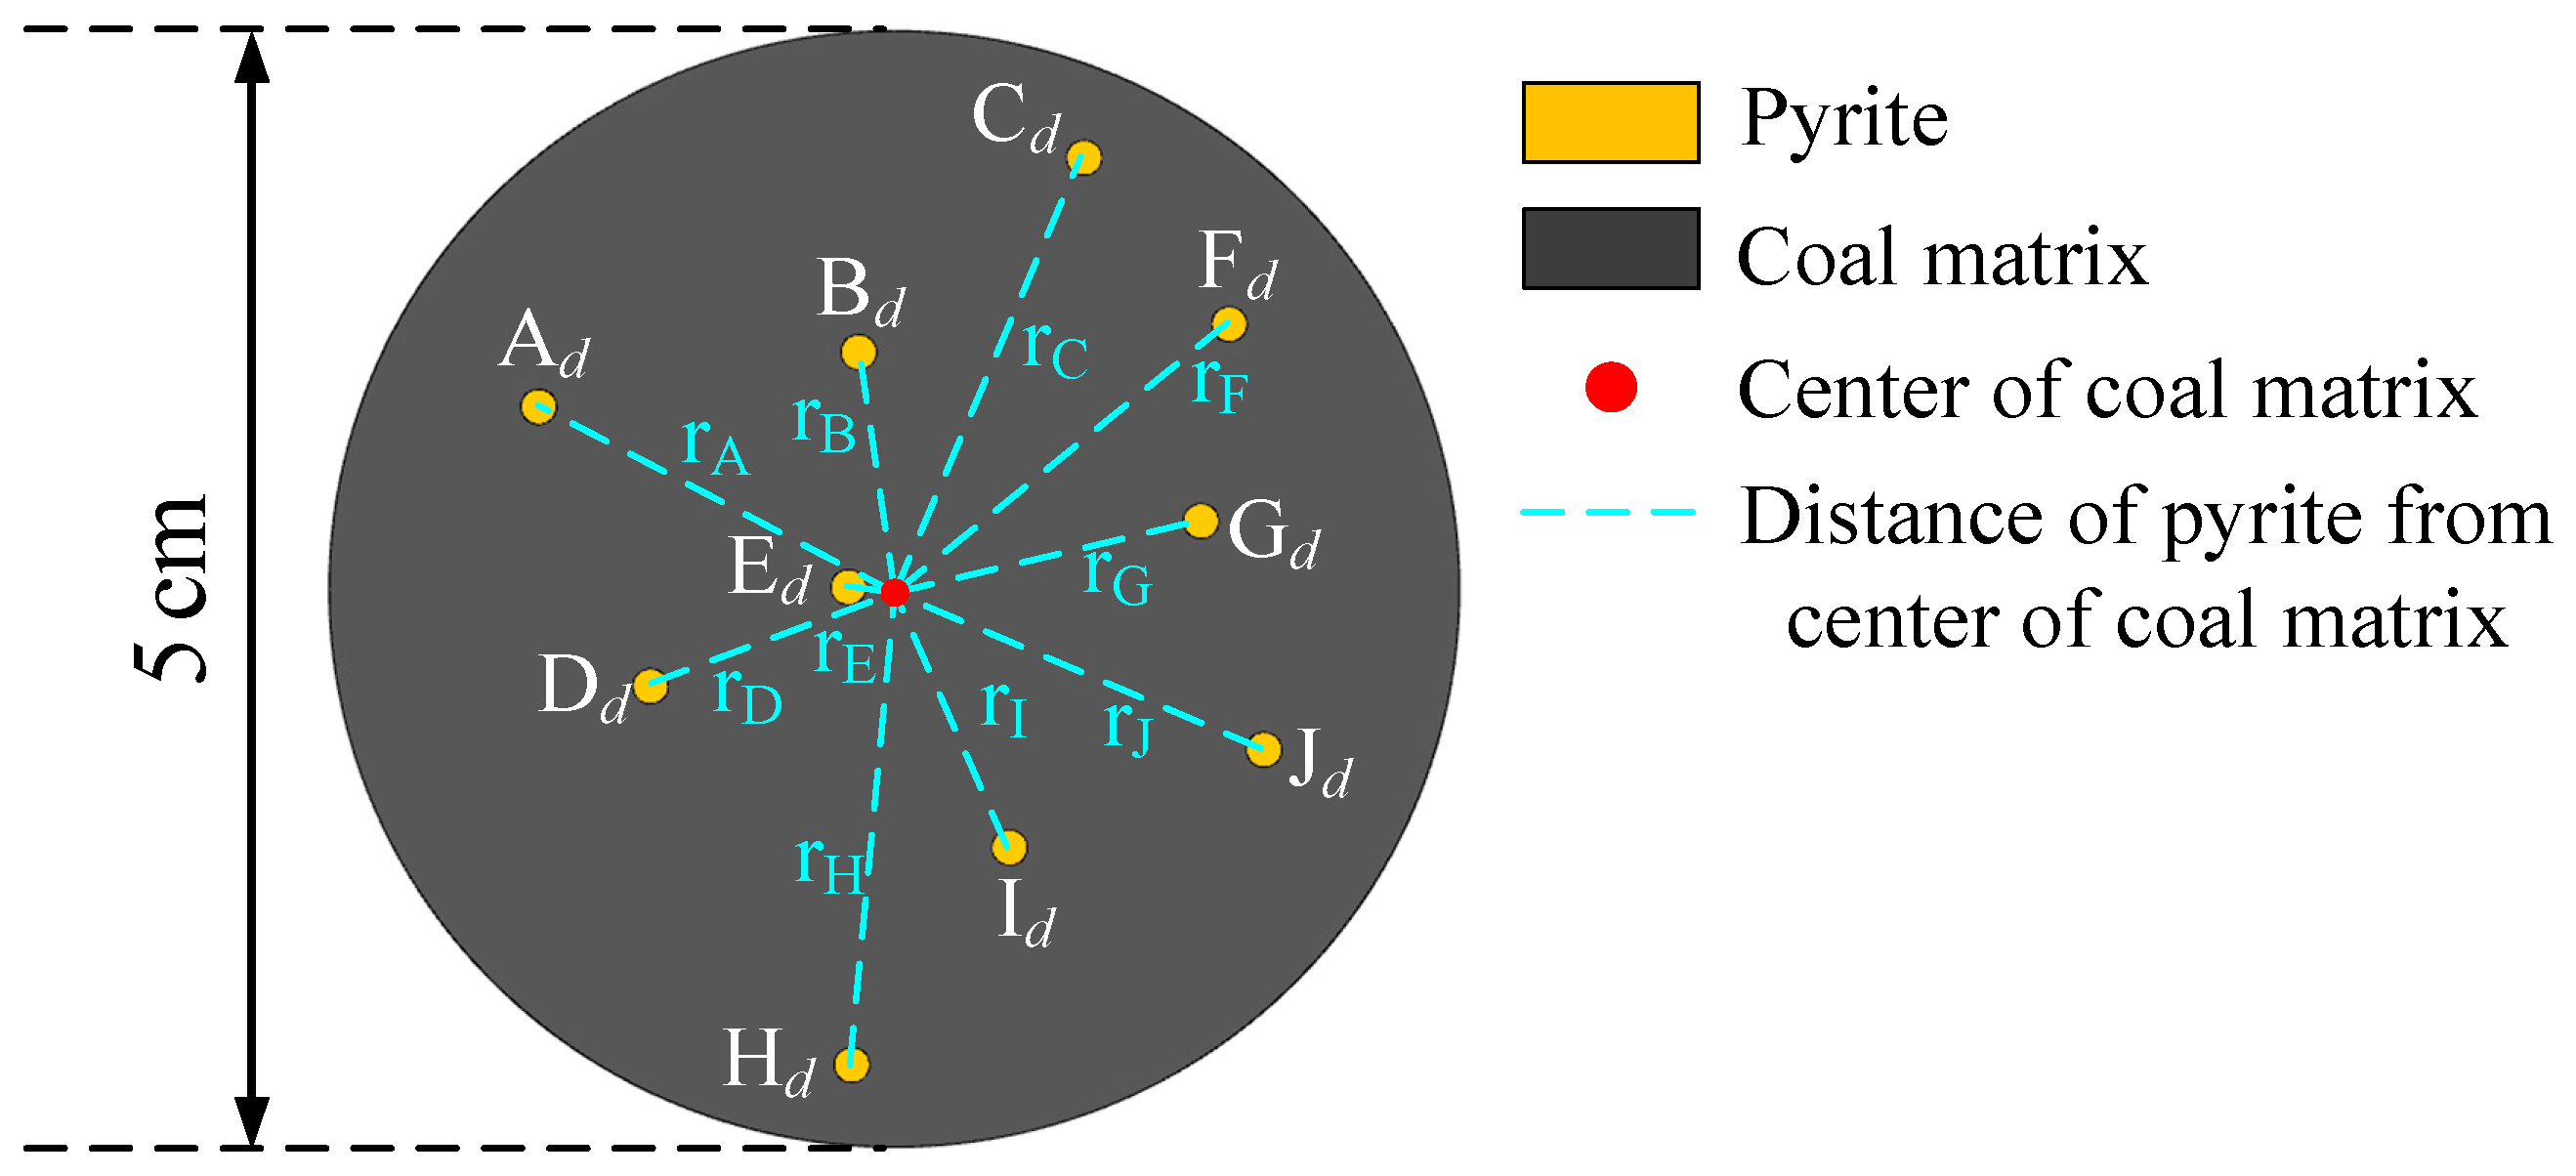
| Distance | Unit | Value |
|---|---|---|
| rA | cm | 1.78 |
| rB | cm | 1.10 |
| rC | cm | 2.11 |
| rD | cm | 1.15 |
| rE | cm | 0.22 |
| rF | cm | 1.91 |
| rG | cm | 1.38 |
| rH | cm | 2.12 |
| rI | cm | 1.24 |
| rJ | cm | 1.76 |
| Material | Ro,max (%) | Proximate Analysis (%) | |||
|---|---|---|---|---|---|
| M, ad | A, d | V, daf | FC, ad | ||
| Coal matrix | 3.21 | 1.30 | 27.12 | 22.65 | 48.93 |
| Material | Relative Dielectric Constant | Density (kg/m3) | Thermal Conductivity [W/(m·K)] | Constant Pressure Heat Capacity [J·(kg·K)−1] |
|---|---|---|---|---|
| Pyrite | 25.66–6.83j | 5018 | 20.50 | 600 |
| Coal matrix | 1.9–0.1j | 1250 | 0.487 | 1250 |
| Material | Young’s Modulus (GPa) | Angle of Internal Friction (°) | Tensile Strength (MPa) | Compressive Strength (MPa) | Poisson’s Ratio | Thermal Expansion Coefficient |
|---|---|---|---|---|---|---|
| Pyrite | 292 | 35 | 12 | 120 | 0.16 | 2.93 × 10⁻⁵ |
| Coal matrix | 3 | 38 | 0.6 | 10 | 0.3 | 2.4 × 10⁻⁵ |
| Parameters | Value | Unit |
|---|---|---|
| Homogeneity index, m | 10 | - |
| Elastic modulus, E | 37.6 | GPa |
| Uniaxial compressive strength, | 183.2 | MPa |
| Uniaxial tensile strength, | 22.9 | MPa |
| Density, | 2760 | kg/m3 |
| Poisson’s ratio, | 0.25 | - |
| Thermal conductivity, | 0.1 | W/(m·k) |
| Specific heat capacity, Cp | 700 | J/(kg·K) |
| Thermal expansion coefficient, | 2.0 × 10⁻⁶ | 1/K |
| Time | Maximum-Temperature Pyrite in S0M | Minimum-Temperature Pyrite in S0M | Maximum-Temperature Pyrite in RM | Minimum-Temperature Pyrite in RM |
|---|---|---|---|---|
| 3 | D0 | C0 | HR | JR |
| 6 | D0 | C0 | AR | GR |
| 9 | D0 | C0 | HR | GR |
| 12 | D0 | C0 | AR | GR |
| 15 | D0 | C0 | HR | GR |
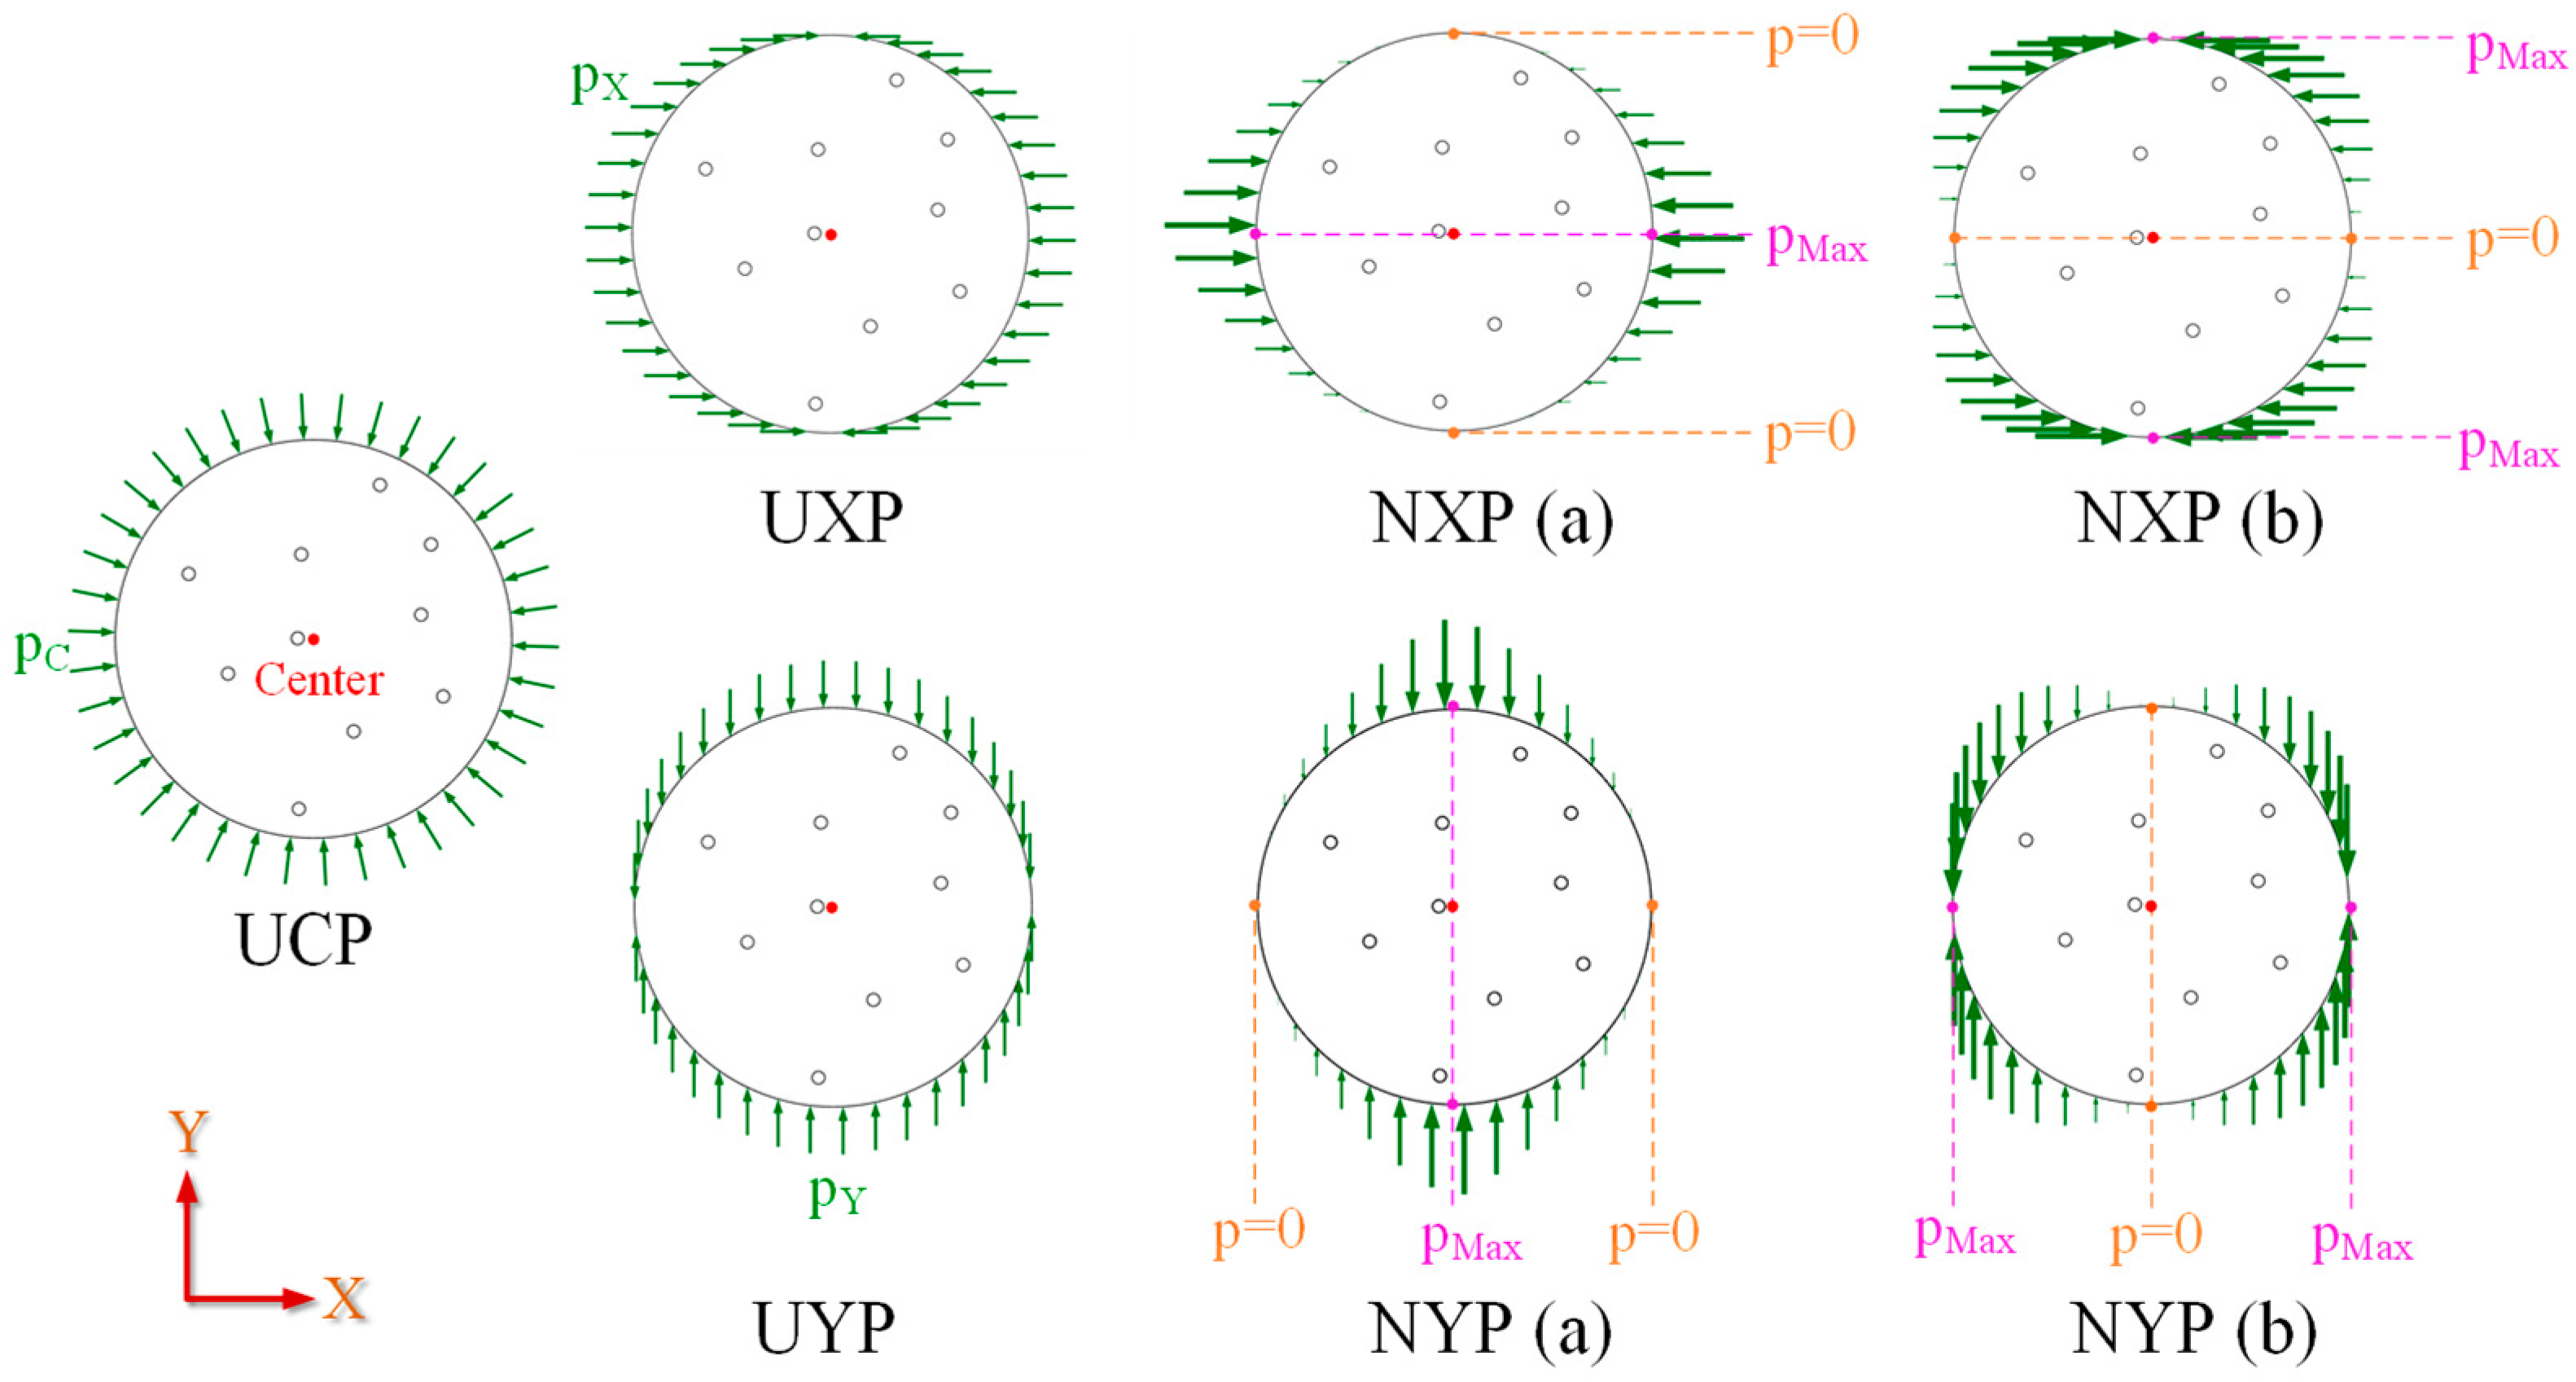
| Model | Pressure Direction | Maximum Pressure Point | Minimum Pressure Point |
|---|---|---|---|
| UCP | Center | Uniform | Uniform |
| UXP | X-axis | Uniform | Uniform |
| UYP | Y-axis | Uniform | Uniform |
| NXP (a) | X-axis | Center | Sides |
| NXP (b) | X-axis | Sides | Center |
| NYP (a) | Y-axis | Center | Sides |
| NYP (b) | Y-axis | Sides | Center |
Disclaimer/Publisher’s Note: The statements, opinions and data contained in all publications are solely those of the individual author(s) and contributor(s) and not of MDPI and/or the editor(s). MDPI and/or the editor(s) disclaim responsibility for any injury to people or property resulting from any ideas, methods, instructions or products referred to in the content. |
© 2024 by the authors. Licensee MDPI, Basel, Switzerland. This article is an open access article distributed under the terms and conditions of the Creative Commons Attribution (CC BY) license (https://creativecommons.org/licenses/by/4.0/).
Share and Cite
Hong, Y.; Long, S.; Sun, X. Numerical Simulation of Microwave-Induced Cracking of Coal Containing Pyrite Powder Based on a Multi-Field Coupling Model. Appl. Sci. 2024, 14, 11835. https://doi.org/10.3390/app142411835
Hong Y, Long S, Sun X. Numerical Simulation of Microwave-Induced Cracking of Coal Containing Pyrite Powder Based on a Multi-Field Coupling Model. Applied Sciences. 2024; 14(24):11835. https://doi.org/10.3390/app142411835
Chicago/Turabian StyleHong, Yidu, Shengyi Long, and Xiaowan Sun. 2024. "Numerical Simulation of Microwave-Induced Cracking of Coal Containing Pyrite Powder Based on a Multi-Field Coupling Model" Applied Sciences 14, no. 24: 11835. https://doi.org/10.3390/app142411835
APA StyleHong, Y., Long, S., & Sun, X. (2024). Numerical Simulation of Microwave-Induced Cracking of Coal Containing Pyrite Powder Based on a Multi-Field Coupling Model. Applied Sciences, 14(24), 11835. https://doi.org/10.3390/app142411835