1. Introduction
In recent years, with the development of advanced sugarcane planting technologies, a pre-cut seed-cane planting method has been proposed. This method primarily involves manually removing pre-cut sugarcane sections from disordered stacked boxes and placing them on the conveyor belt of a planting machine, from which the sugarcane falls into seed distribution tubes for planting. Typically, to complete the seeding of a row, two workers are required to perform the seed-cane retrieval [
1,
2,
3,
4,
5]. However, this method of operation involves high labor intensity and does not meet the needs for automated sugarcane seeding. Therefore, to address this issue, our research group has proposed replacing manual labor with machines through visual detection of disordered stacked sugarcane. Nonetheless, retrieving seed-canes from disordered stacks presents several challenges, such as occlusions and overlaps between targets leading to background diversity issues, sugarcane seed-canes often being made from the tips, which results in varied shapes and sizes, and poor lighting conditions in field operations. Consequently, developing a detection algorithm with high robustness and powerful feature extraction capabilities is crucial and forms the key technological foundation for achieving automated mechanical planting of sugarcane seed-canes [
6,
7,
8,
9].
When traditional machine learning techniques are employed for crop target detection, they are affected by factors such as terrain, weather conditions, camera angles, and crop spacing [
10]. This typically requires manual setting and adjustment of feature thresholds, leading to long training times and lower recognition accuracy. In recent years, with innovations in neural network algorithms and the increasing demand for smart devices, many scholars have conducted research on crop target detection using deep learning technology [
11,
12,
13,
14]. For example, Liu et al. [
15] employed the YOLOv3 algorithm and modified the prediction boxes to circular boundaries, effectively enhancing the accuracy of tomato localization to an average precision (mAP) of 96.4%. Yang et al. [
16] combined the K-means++ algorithm with mean denoising techniques, successfully improving the precision of YOLOv3 in identifying post-harvest cotton residue. Gai et al. [
17] introduced the DenseNet network into YOLOv4, improving the label box design, thereby increasing the mAP for cherry detection by 15%. Zhou et al. [
18] integrated RepGhost and ECA attention mechanisms into YOLOv7, developing a new method for detecting dragon fruit. Li et al. [
19] optimized the YOLOv5 network, incorporating focus networks and cross-stage techniques as well as the EIOU loss function, enhancing the detection accuracy for small tomato targets. Matte et al. [
20] proposed a deep learning-driven method for enhancing fruit classification image annotation, effectively resolving the issue of a large number of unlabeled images in automatic annotations.
Given the current challenges faced in identifying disordered stacked sugarcane, a plan has been formulated to develop an improved object detection algorithm. This algorithm aims to effectively recognize disordered stacked sugarcane while maintaining high accuracy and low computational resource consumption. Among the many object detection algorithms, the YOLO series is widely praised for its excellent balance between detection accuracy and processing speed. Therefore, this study focuses on improving four key aspects of the YOLOv8n algorithm, aimed at enhancing and boosting its performance in sugarcane recognition. The main contributions of this paper include the following:
Backbone network replacement: Replace the original backbone network of the YOLOv8n model with VanillaNet to enhance the model’s feature extraction capability and computational efficiency, ensuring more effective processing and analysis of disordered stacked sugarcane image data.
Introduction of a deep convolutional architecture: Integrate the InceptionNeXt deep convolutional architecture into the improved model, utilizing its multi-scale processing capabilities to enhance the model’s recognition and localization accuracy for sugarcane of various shapes and sizes.
Integration of attention mechanism: Incorporate the Efficient Channel Attention (ECA) mechanism into the feature fusion module C2F, further enhancing the model’s ability to capture key features of sugarcane and improving recognition accuracy.
Loss function optimization: Optimize the model with the MPDIOU loss function to improve its ability to distinguish overlapping sugarcane, significantly reducing false positives and missed detections, ensuring higher detection accuracy.
Model performance validation: Through experimental testing of disordered stacked sugarcane, the improved YOLOv8 model, named VIEM-YOLOv8n, achieved an average precision (mAP) of 96.0% on the dataset used, outperforming the majority of existing mainstream object detection algorithms, including SSD, Faster R-CNN, YOLOv3, YOLOv5, and YOLOv7, demonstrating superior performance. This achievement not only proves the effectiveness of the proposed improvements in enhancing the performance of the object detection model but also provides a viable technical solution for real-time, high-precision object detection under complex visual tasks.
2. Materials and Methods
2.1. Object Detection Algorithm
YOLOv8 is an advanced object detection algorithm introduced by Ultralytics in January 2023. Compared to previous versions, it shows significant improvements in detection accuracy and speed on the COCO128 dataset. This model inherits the basic architecture of YOLOv5 while incorporating the latest technologies, such as an anchor-free prediction structure, stacked convolutions for feature extraction, and a new weighted loss calculation method. The entire architecture is divided into four main parts: the input, backbone, neck, and head [
21,
22,
23].
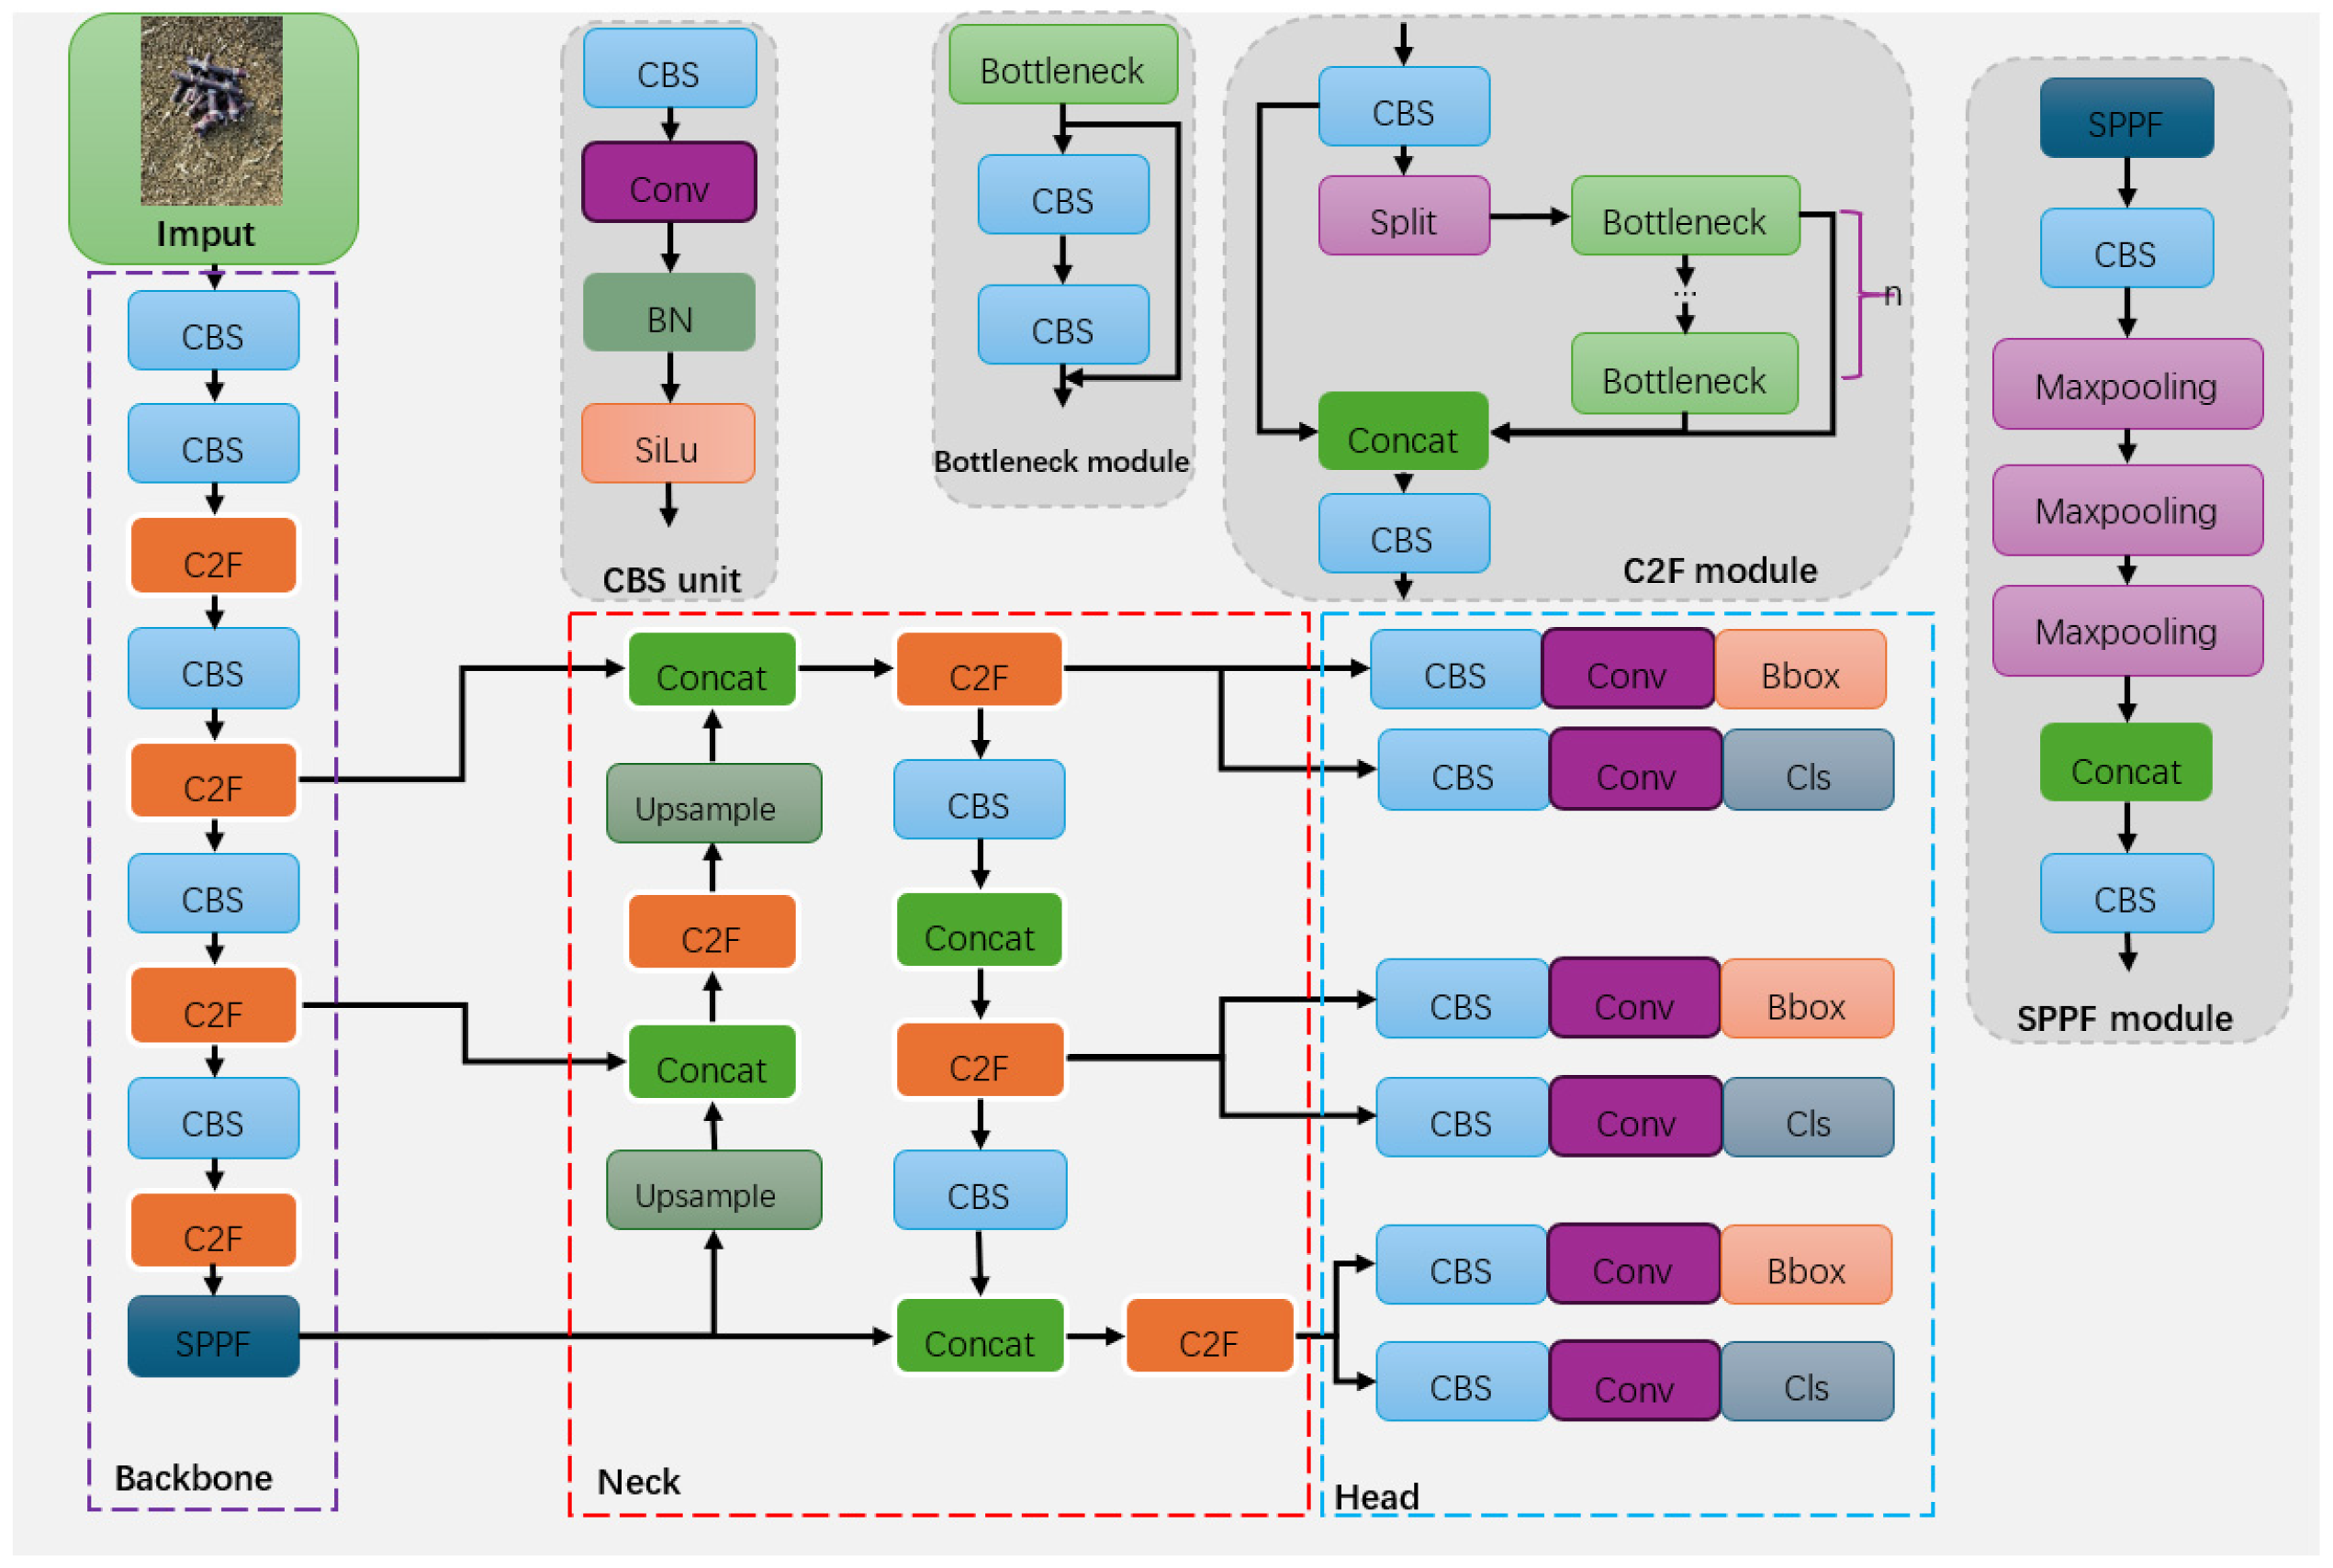
In the structure of YOLOv8, as shown in
Figure 1, the initial step involves mosaic data augmentation of the input image to increase data complexity. Then, the image proceeds to the backbone, where it progressively extracts and generates feature maps of different sizes. Next, the neck module is responsible for effectively merging these multi-scale feature maps. Finally, the head module adjusts the scale of the feature maps according to specific task requirements and outputs the final predictions.
In the backbone of YOLOv8, the original C3 module from YOLOv5 is replaced by the new C2F feature extraction module. The C2F module consists of the following steps: a slicing operation, two 1 × 1 convolutions, multiple bottleneck operations, and a final concatenation. First, the 1 × 1 convolution is used for cross-channel information interaction. Then, the slicing operation divides the feature map into two parts along the channel dimension, one of which undergoes multiple bottleneck operations, with each result being concatenated with the feature map from the first convolution. Another 1 × 1 convolution compresses the channel number of the concatenated feature map back to that of the input feature map, a design that ensures model lightness while enriching gradient information.
In the head part, YOLOv8 adopts a different design approach from YOLOv5, changing from a coupled head to a decoupled head, which separates the classification and localization prediction heads and removes the object branch. This change shifts the model from an anchor-based prediction method to an anchor-free method, eliminating the need to design prior boxes and reducing the time spent by the model in removing redundant boxes during prediction.
2.2. VanillaNet
VanillaNet [
24] introduces an innovative neural network architecture that optimizes model complexity by eliminating unnecessary depth, shortcuts, and complex operations such as self-attention, making it highly suitable for scenarios with limited computational resources.
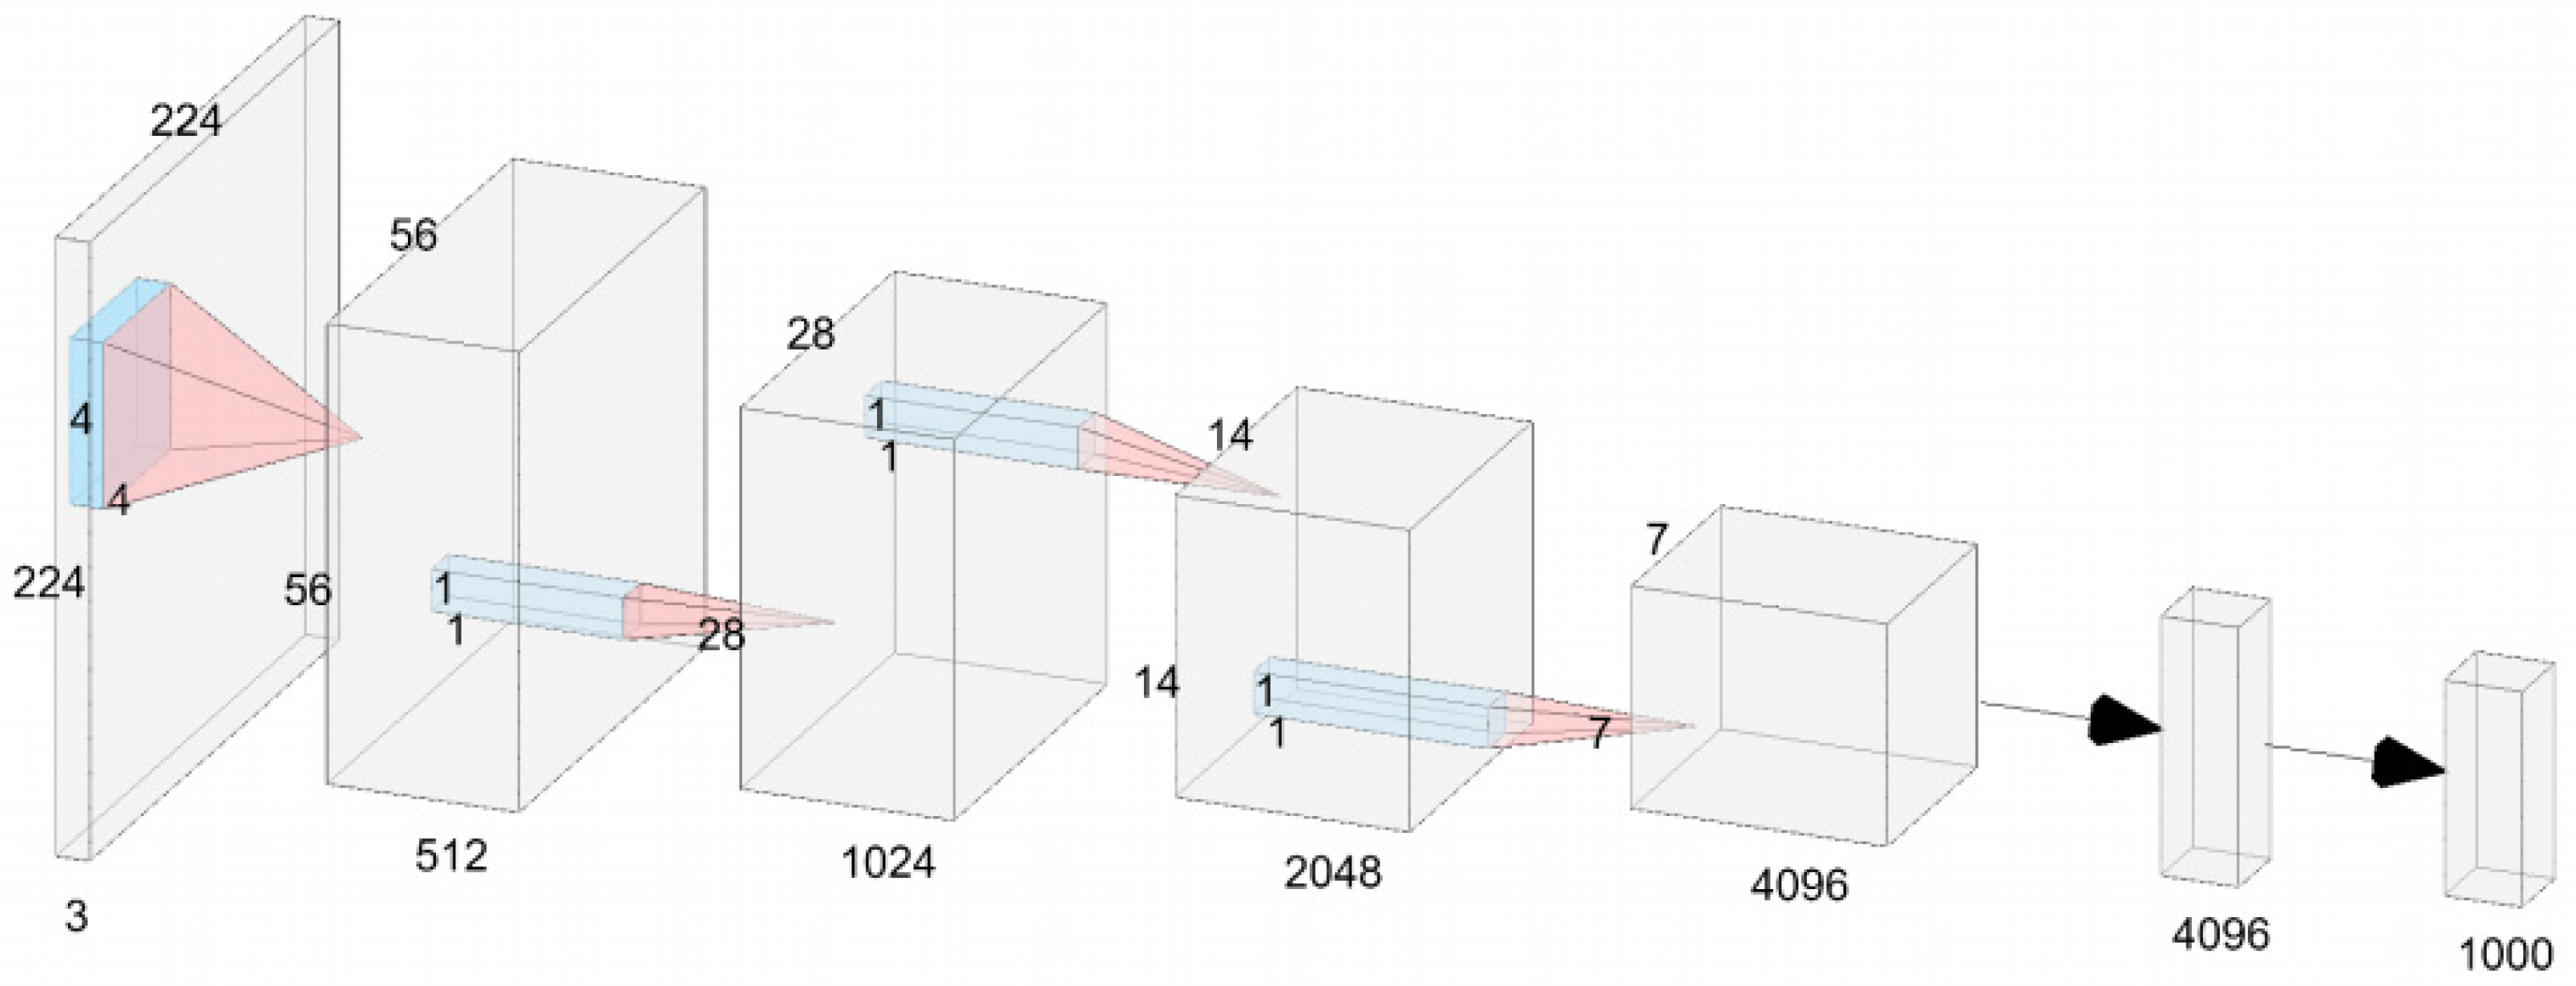
Most state-of-the-art (SOTA) image classification model structures contain three main components: the initial module (stem block) converts the input image’s three color channels into multiple feature channels and performs downsampling; the main body is responsible for feature extraction and typically consists of four stages, with each stage containing several differently designed units (blocks), and reduces the resolution of the feature maps while increasing the number of channels after each stage; finally, a fully connected layer maps the extracted features to the classification outcomes. VanillaNet follows this popular design but adopts a more minimalist approach, with each stage consisting of only a single network layer, greatly simplifying the overall network structure.
Specifically, in the architecture of VanillaNet-6, the initial module employs a single 4 × 4 × 3 × C convolutional layer with a stride of four to convert from a three-channel image to a C-channel feature map. In the following three stages (stage 1, 2, and 3), downsampling is achieved by applying max pooling layers with a stride of two and doubling the number of channels, while in the fourth stage (stage 4), the number of channels remains the same, followed by an average pooling layer. The entire network’s output is then produced by a fully connected layer at the end. To minimize computation, all convolutional layers use a 1 × 1 size, and each is followed by a normalization layer (BN layer) and an activation function (
Figure 2).
During the training process for the object detection model, an innovative deep learning strategy was employed, which initially included the training of two convolutional layers as well as the integration of an activation layer. As the training progressed, this activation layer gradually transformed into an identity function, where its output increasingly matched its input, no longer applying a nonlinear transformation to the data. At the end of the training, using model reconstruction techniques, these two convolutional layers were effectively merged into a single layer to optimize the model’s inference speed in practical applications.
Regarding the activation function
A(
x) (common functions include ReLU and Tanh), its combination with an identity mapping can be described as follows:
“λ” serves as a tuning factor used to balance the degree of nonlinearity in the adjusted activation function. Set the current training cycle as e and the total number of training cycles as E, and define “λ = 1 − e/E”. This means that in the early stages of training, “λ” is close to 1, giving the network a stronger nonlinear capability. As training approaches completion, “λ” tends towards 0. At this point, the activation function originally placed between the two convolutional layers ceases to function, allowing these two layers to be merged into a single convolutional layer through network parametrization techniques, thus simplifying the model and enhancing inference efficiency.
In the design of simplifying and reducing the number of network layers, the main performance loss originates from insufficient nonlinear characteristics. Strategies to enhance the model’s nonlinearity are mainly divided into two categories: one is increasing the number of nonlinear activation function layers, and the other is strengthening the nonlinearity effect of a single activation layer. Although most designs tend to adopt the first method, this study employs the second strategy, but both are achieved through layering.
By adopting a weighted superposition method, where n represents the number of layers superimposed, and αi and βi respectively represent the scaling factors and bias terms for each activation layer, this approach significantly enhances the nonlinear processing capability of the activation function.
Viewing the above formula as a mathematical series expansion, to improve the approximation accuracy of this series-based function, a design was implemented that allows the activation function to learn global information by adjusting inputs from neighbors, similarly to the principle of BNET. Specifically, for the input feature “
x”, the expression of the activation function is as follows:
2.3. InceptionNeXt
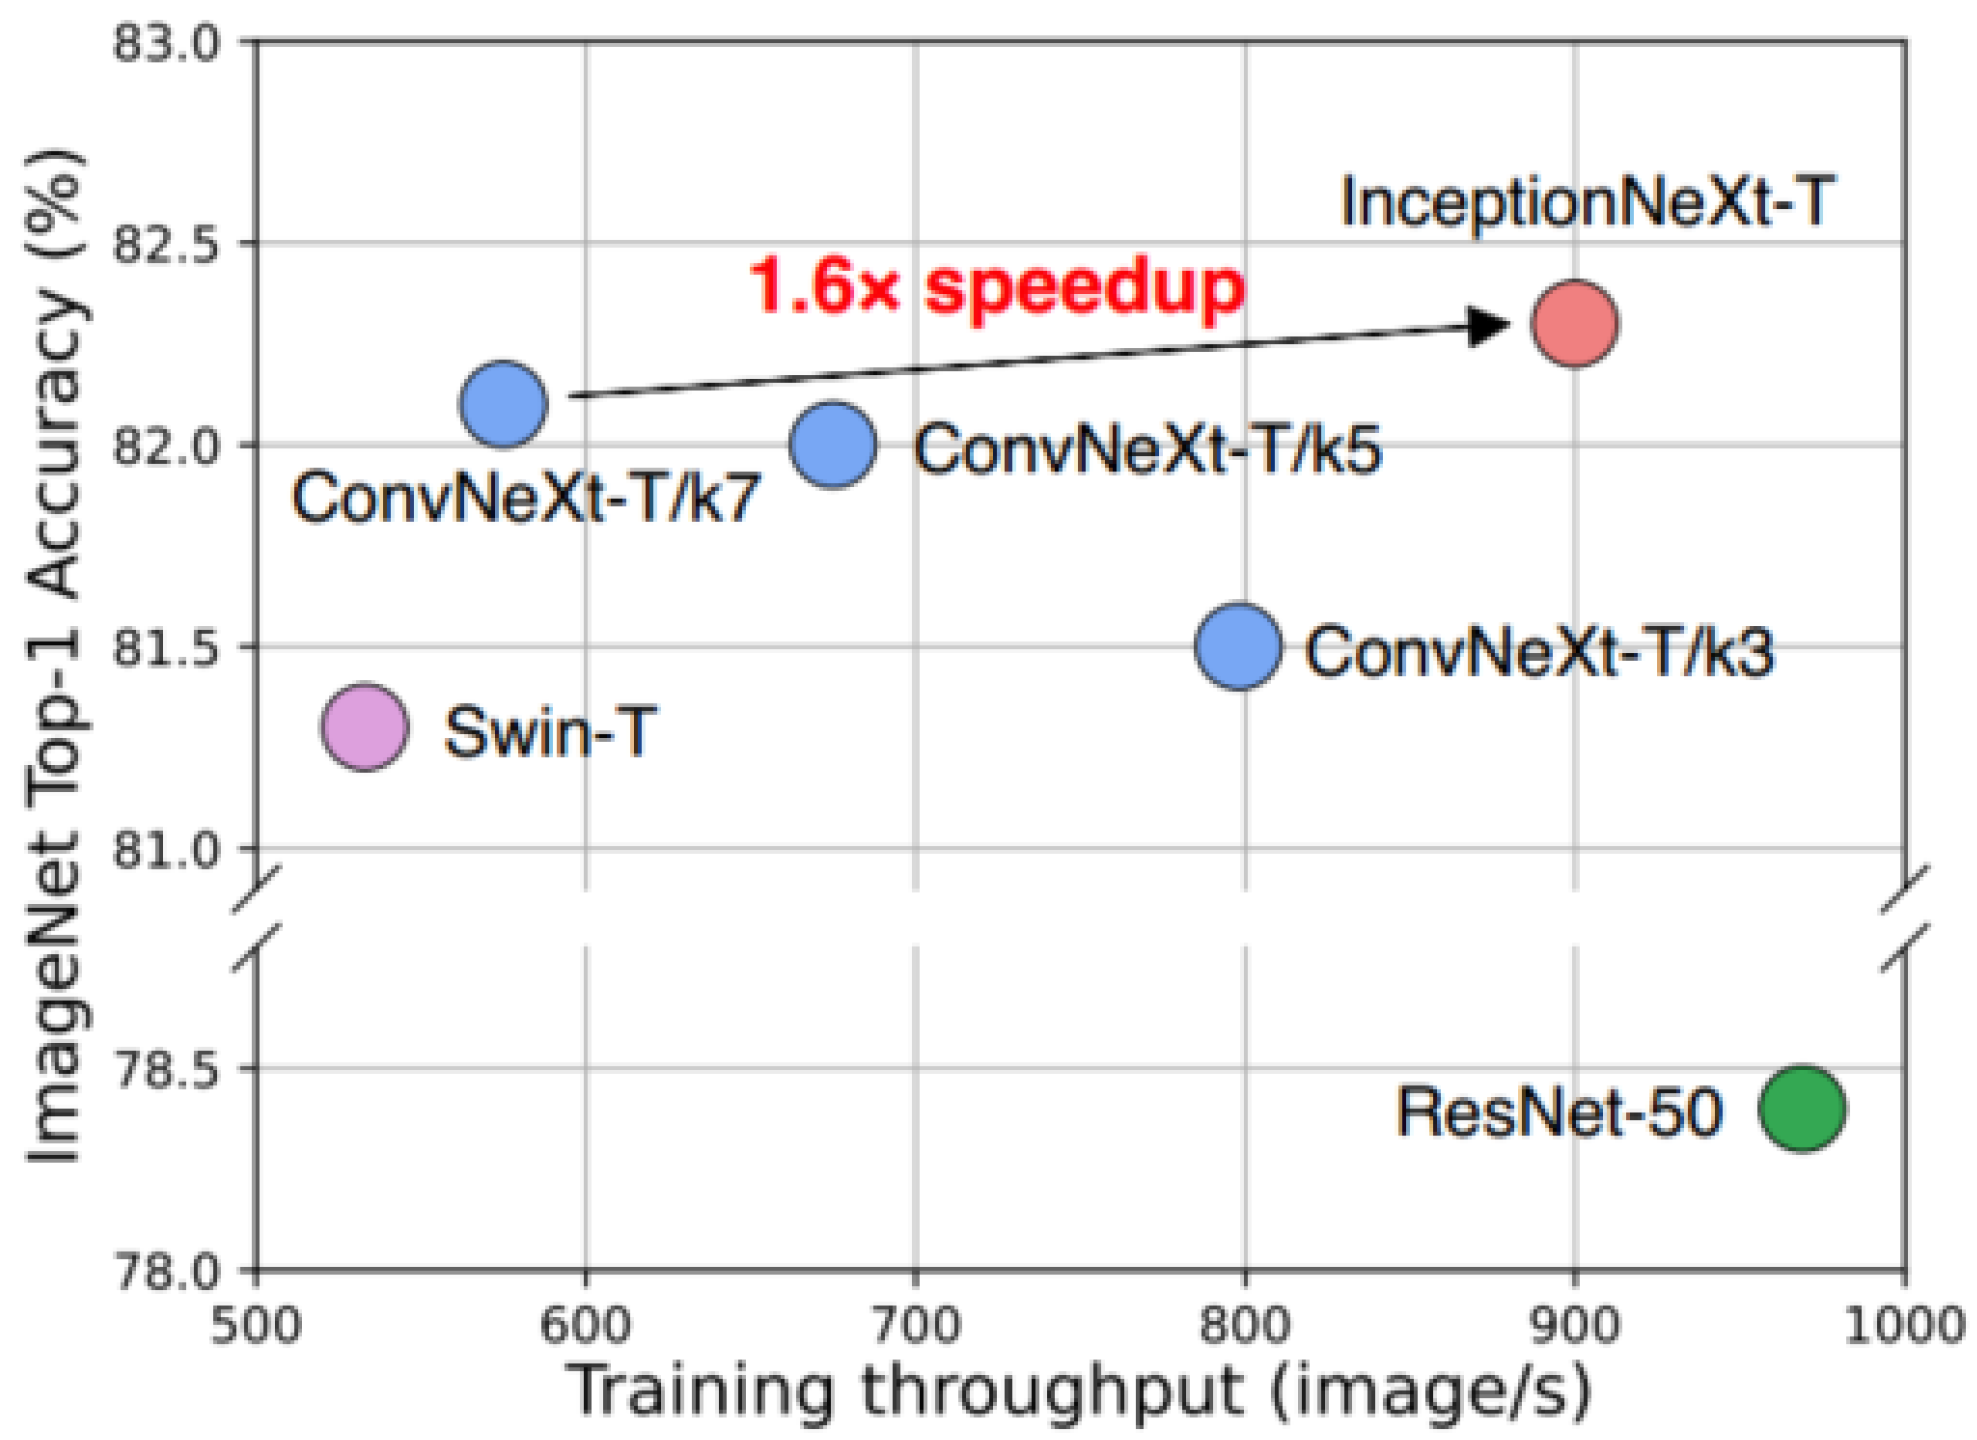
Inspired by the long-range modeling capabilities of Vision Transformers (ViTs), extensive research and adoption of large convolutional kernels have been undertaken to expand the receptive field and enhance model performance, as exemplified by the remarkable achievements of ConvNeXt, which utilizes 7 × 7 deep convolutions. Although such deep operations require only a modest amount of floating-point operations, the higher memory access costs significantly reduce model efficiency on powerful computing devices. For instance, ConvNeXt-T and ResNet-50 have similar amounts of floating-point operations, yet the throughput on an A100 GPU during full-precision training is only 60%. While reducing the kernel size of ConvNeXt could speed up operations, it results in a significant performance drop. Inspired by Inceptions, a solution has been proposed to accelerate large-kernel-based CNN models while maintaining performance by decomposing the deep convolution of large kernels into four parallel branches along the channel dimension, namely, a small square kernel, two orthogonal band kernels, and an identity mapping. With this novel Inception deep convolution approach, a series of networks called IncepitonNeXt [
25] were developed, which not only achieve high throughput but also maintain competitive performance. For example, the training throughput of InceptionNeXt-T is 1.6 times higher than that of ConvNeXt-T, and it achieves a 0.2% top-1 accuracy improvement on ImageNet-1K (
Figure 3).
All models were trained following the DeiT training hyperparameters [61, 37, 38, 69]. The training speed was measured on an A100 GPU with a batch size of 128. ConvNeXt-T/kn represents different versions with a deep convolutional kernel size of n × n. InceptionNeXt-T combines the rapid training of ResNet-50 with the high accuracy of ConvNeXt-T.
2.4. C2f_ECA Module
An Efficient Channel Attention (ECA) module [
26,
27,
28] suitable for deep convolutional neural networks (CNNs) eliminates the need for dimension reduction and achieves cross-channel interaction capture in an efficient manner. As shown in
Figure 4, after channel-level global average pooling without dimension reduction, ECA facilitates local cross-channel interactions by considering each channel and its k neighboring channels. This method has been proven to ensure both efficiency and effectiveness. ECA can be deployed efficiently using fast 1D convolution with a kernel size of k, where the kernel size k represents the extent of local cross-channel interactions, i.e., how many neighboring channels are involved in predicting attention for a single channel. To avoid manually adjusting k through cross-validation, an adaptive method has been developed to determine k, where the interaction range (i.e., kernel size k) is proportional to the number of channels.
The summarized features obtained through Global Average Pooling (GAP) are used by the ECA to generate channel weights using a fast one-dimensional convolution. The size of the convolution, k, is automatically adjusted based on the number of channel dimensions, C.
2.5. MPDIOU
MPDIOU is an optimized loss function for bounding box regression in object detection tasks, designed to enhance accuracy and efficiency in computer vision tasks such as object detection, scene text detection, and instance segmentation [
29]. It improves the localization accuracy of bounding boxes by minimizing the Euclidean distance between key points (typically the top-left and bottom-right corners) of the predicted and true bounding boxes. The specific formula is as follows:
In the formula, A and B represent two random convex shapes, respectively. w and h denote the width and height of the image dimensions. respectively represent the coordinates of the top-left and bottom-right corners of A. respectively represent the coordinates of the top-left and bottom-right corners of B. respectively denote the squares of the Euclidean distances between the top-left corners and the bottom-right corners of A and B.
Using the MPDIOU loss function simplifies the comparison of similarity between two bounding boxes in object detection tasks, aiding the algorithm in more precisely selecting the bounding box that best matches the real target, thereby improving localization accuracy. MPDIOU is particularly effective in target detection scenarios involving object overlap, such as stacked sugarcane, because it minimizes the distance between key points, reducing the distortion of detection boxes caused by overlap and effectively decreasing the rate of target misses.
2.6. Improvements in VIEM-YOLOv8n Model
To address the challenges of complex, diverse target features and target overlap in the chaotic stacked sugarcane detection, we made several significant improvements to the YOLOv8n model to enhance its detection performance and robustness.
First, we replaced the backbone network of YOLOv8n with VanillaNet. VanillaNet simplifies unnecessary depth, skip connections, and complex operations (such as self-attention mechanisms), adopting a more lightweight design. This improvement effectively enhances the model’s feature extraction capability and significantly improves computational efficiency. Especially in resource-constrained application scenarios, it ensures good inference speed and accuracy.
Second, we introduced the InceptionNeXt deep convolutional architecture, which employs a multi-branch convolution design. This design decomposes large convolution kernels into multiple smaller ones, both improving computational efficiency and expanding the receptive field. As a result, the model can more accurately detect sugarcane targets of different shapes and sizes, especially in complex stacked situations, effectively capturing the key information of the targets.
Third, in the feature fusion module C2F, we integrated an efficient channel attention mechanism (ECA). ECA captures channel interactions in a way that does not involve dimensionality reduction, effectively enhancing the model’s attention to key features in stacked sugarcane. This improvement boosts the model’s recognition ability in complex backgrounds, reducing the loss of critical features and thus improving detection accuracy.
Finally, to improve the model’s detection accuracy in overlapping target scenarios, we optimized the boundary box regression loss function by adopting the Modified Probabilistic Distance Intersection over Union (MPDIOU) loss function. This loss function significantly improves accuracy in overlapping target detection by minimizing the Euclidean distance between the predicted and ground truth keypoints, reducing false positives and false negatives.
Through these improvements, the VIEM-YOLOv8n model not only significantly enhances the accuracy of sugarcane target detection but also ensures high efficiency in complex scenarios, making it more suitable for real-world agricultural tasks.
3. Experiment
3.1. Dataset
3.1.1. Image Acquisition
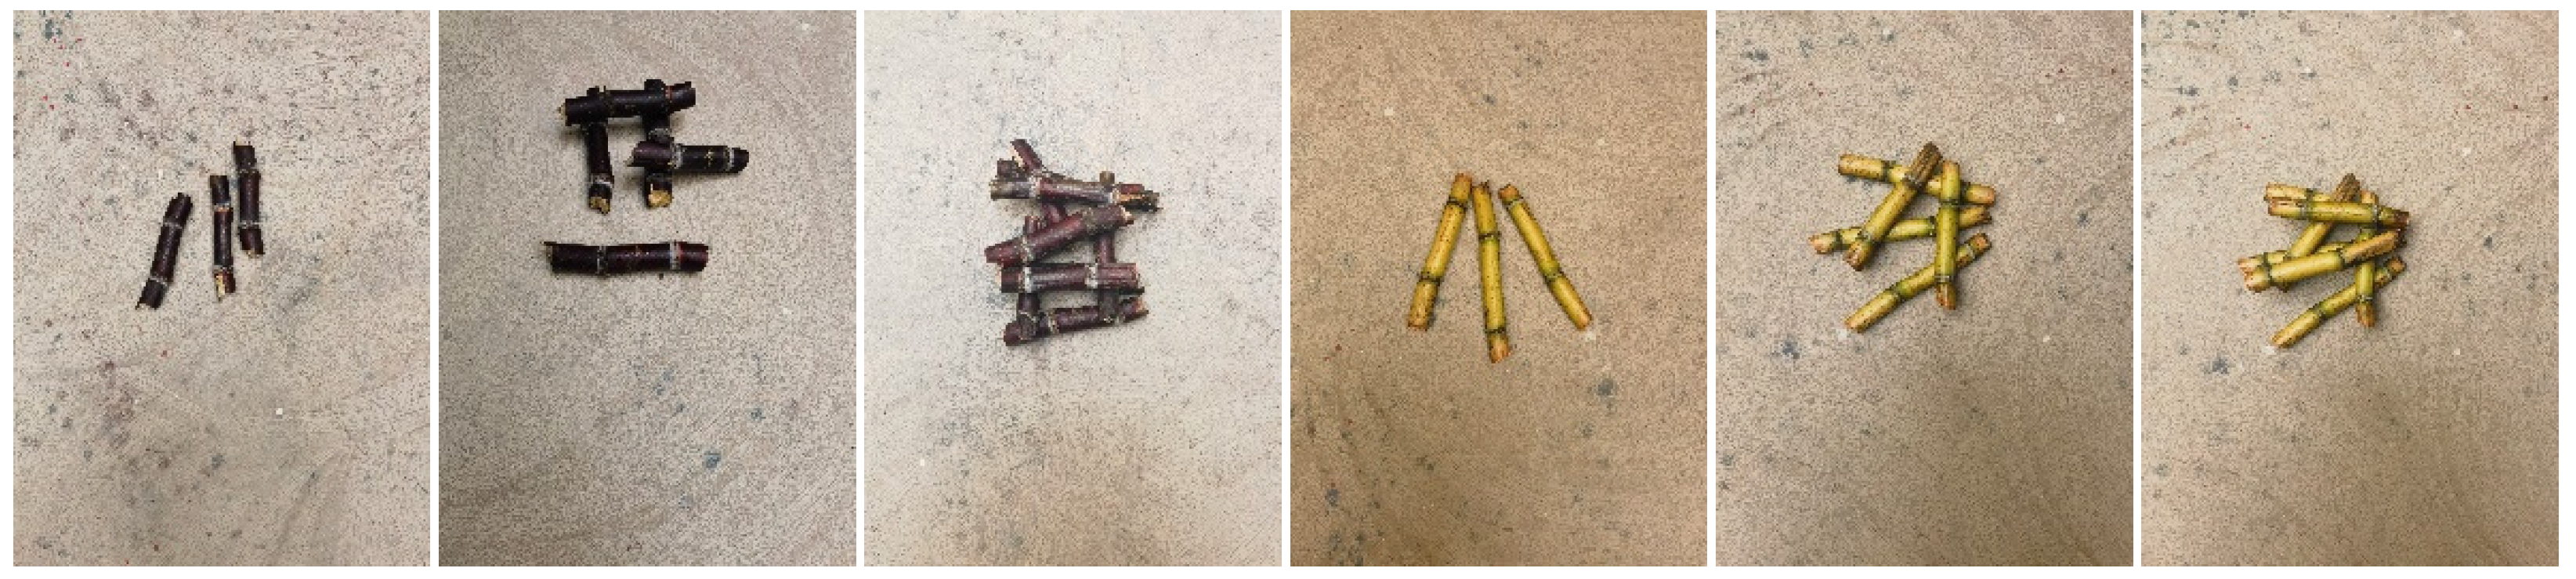
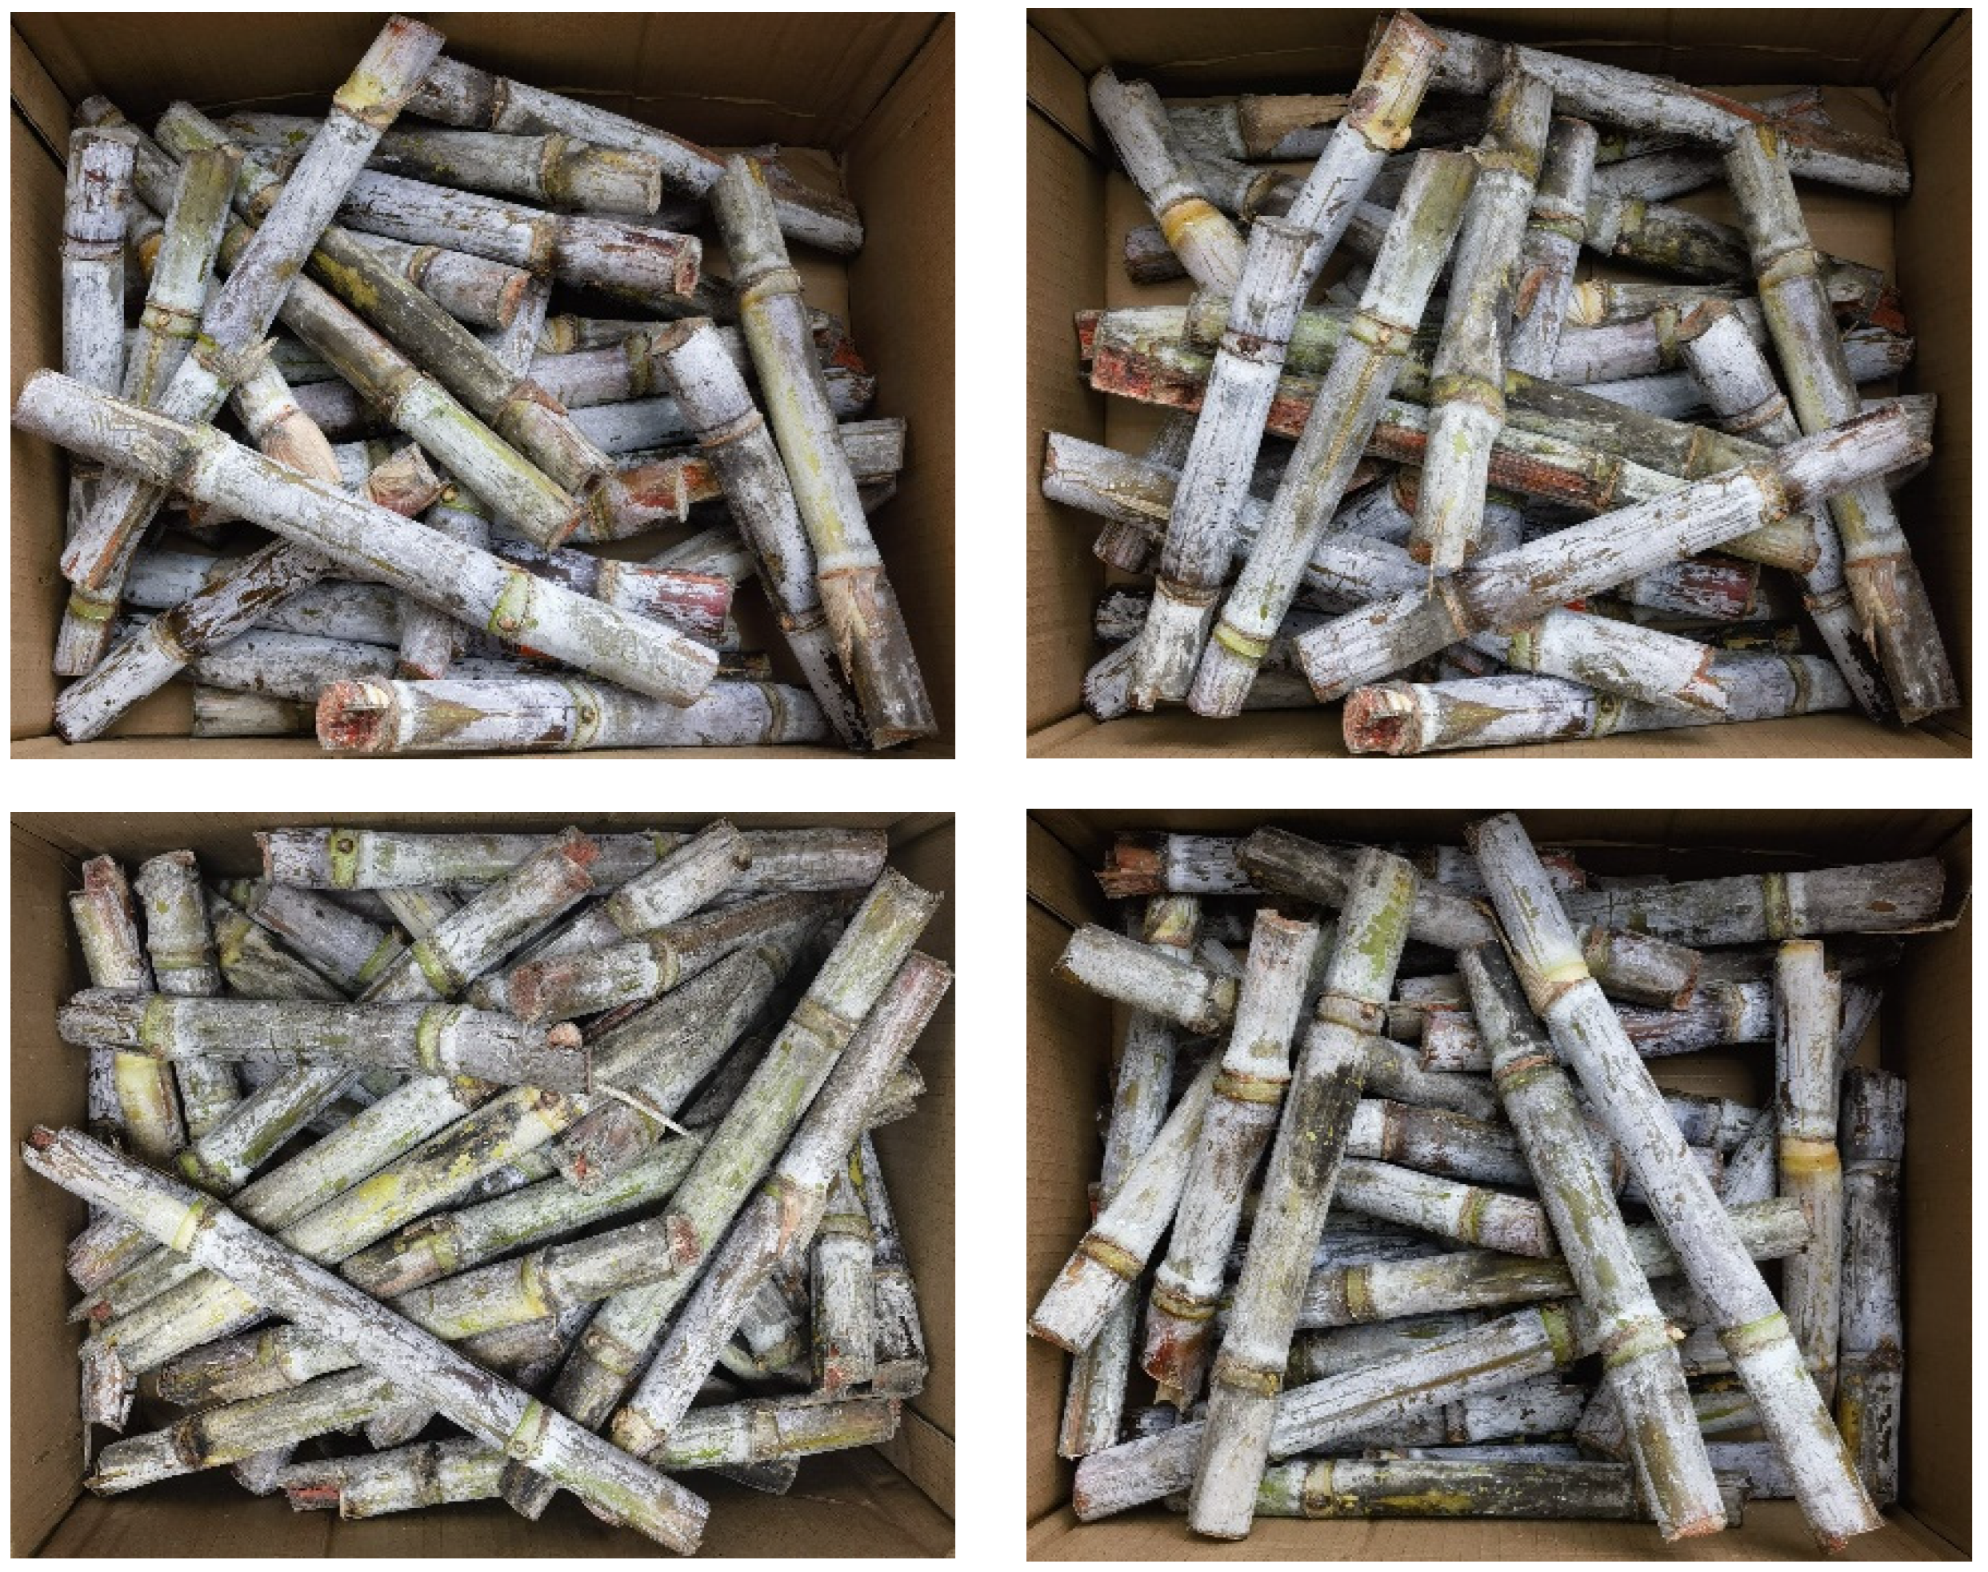
The sugarcane dataset used in this study originates from the National Agricultural Science and Technology Park in Guilin City, Guangxi, China (Coordinates: E25°06′, N110°31′). The research subject is the “Gui Sugar 44” sugarcane variety, which includes parts such as buds, leaf scars, stalk nodes, and internodes. The research method involves cutting the sugarcane into sets and then stacking them randomly for image acquisition.
The image data collection took place from October to November 2023, daily from 9 a.m. to 5 p.m. A smartphone was used as the collection tool, and all images were captured under natural light conditions. To enhance the diversity of the data and the generalization ability of the model, the target was placed in various ways across multiple environments, and data were collected under these scenarios. The original image library contains 2500 images with a resolution of 544 × 960 pixels. After screening and removing images blurred due to technical or weather factors, 2252 effective images were retained.
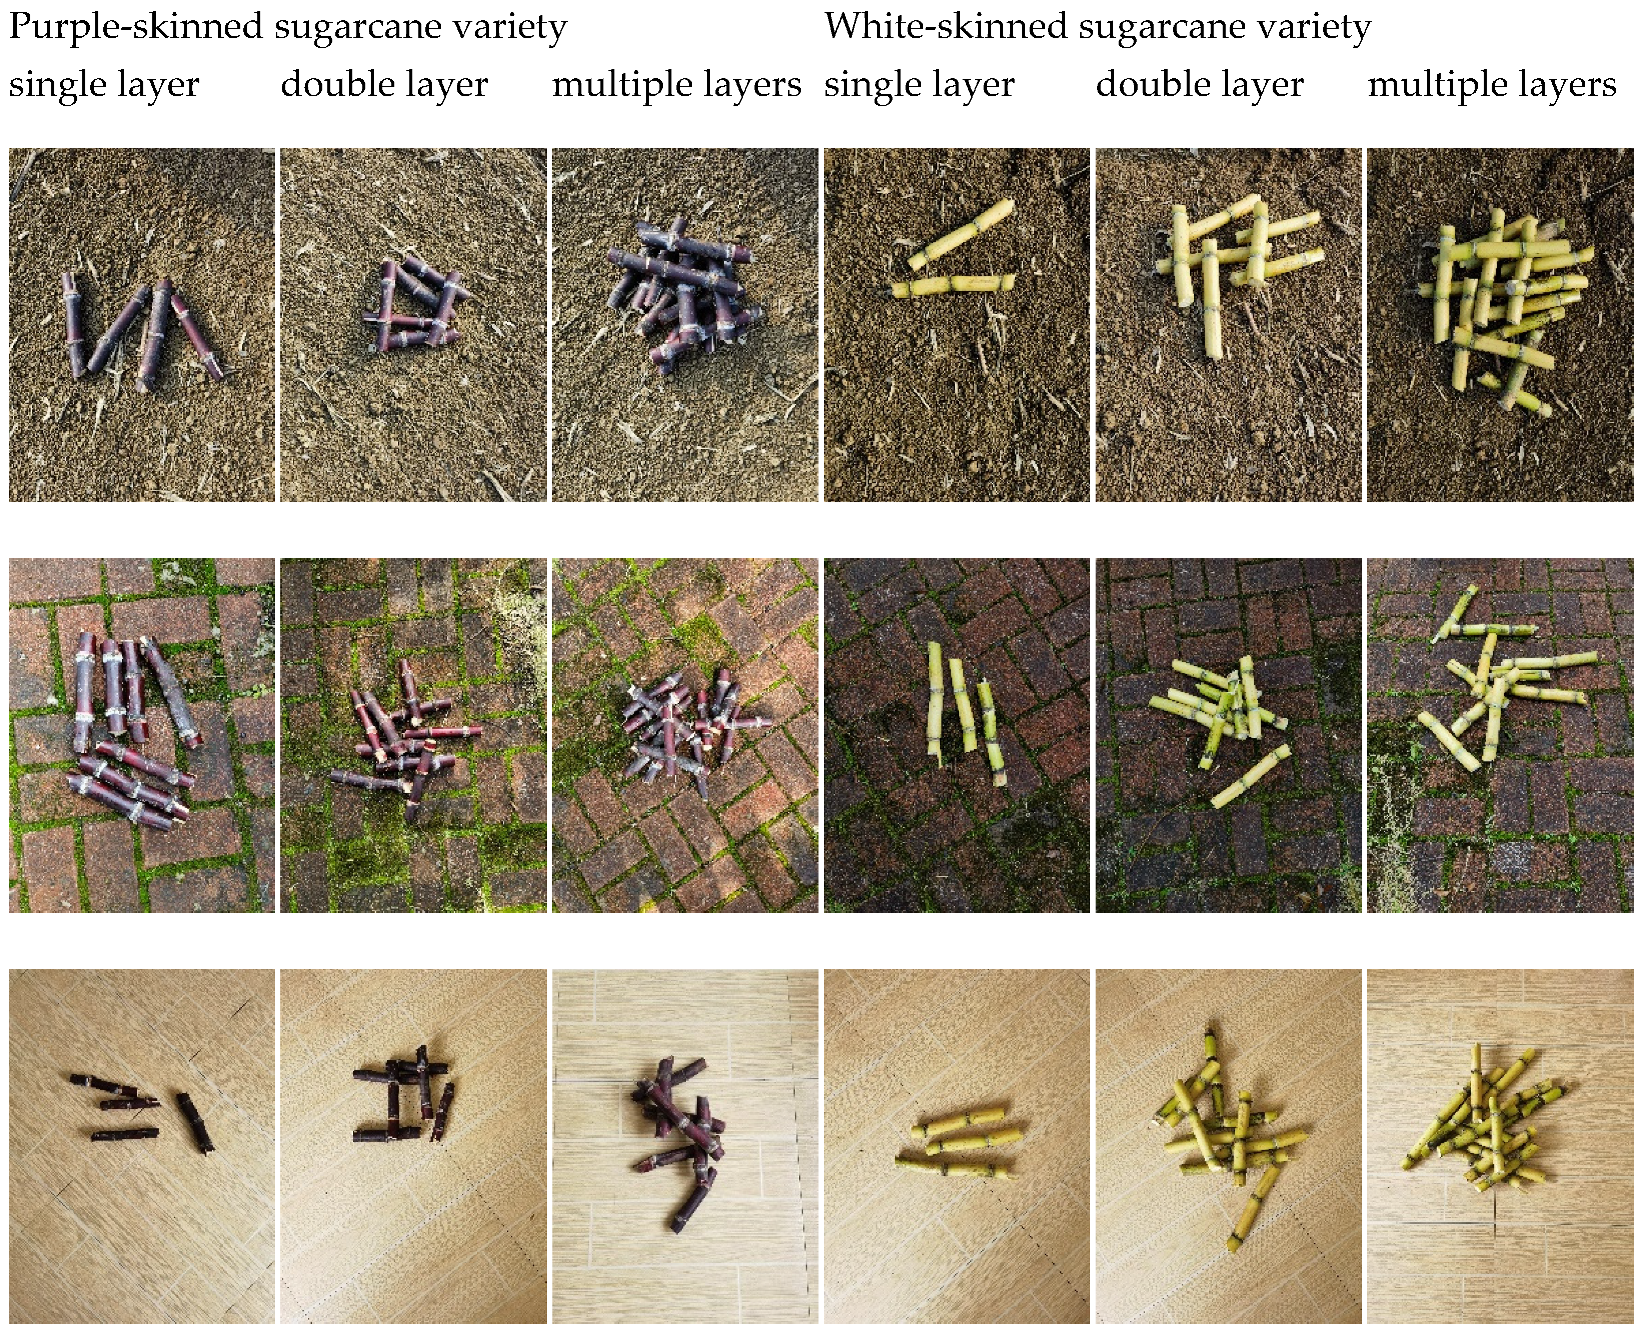
Figure 5 and
Figure 6 show some of the collected images.
3.1.2. Dataset Creation
During the data collection process, we encountered the following major challenges and implemented corresponding measures to address them:
- (1)
Lighting variations: The images were captured under natural light conditions, resulting in variations in lighting due to changes in time and weather. To address this, we conducted data collection from 9:00 a.m. to 5:00 p.m. daily, covering different lighting intensities and directions to enhance the diversity of the dataset.
- (2)
Target occlusions: Stacked sugarcane often led to overlapping targets. To reduce annotation noise, we excluded targets that were more than 70% occluded or smaller than 20 × 20 pixels during annotation, ensuring high-quality data annotations.
- (3)
Target diversity: To ensure the dataset covered more real-world scenarios, we randomly altered the stacking configurations of sugarcane (single-layer, double-layer, and multi-layer) and captured images in multiple environments. Additionally, the dataset included different sugarcane varieties (e.g., purple-skinned and green-skinned sugarcane) to improve its breadth and representativeness.
These measures effectively addressed the critical issues in data collection, providing a high-quality dataset to support the robust training of the model.
The data annotation was carried out using the LabelImg software (v1.8.1) on a dataset of 2252 unordered stacked sugarcane images. During the annotation process, all unoccluded sugarcane targets were labeled as the same class, and each target was precisely bounded by a horizontal rectangle in the images. For blurry targets in the distance or targets that were too small, we chose not to annotate them. Specifically, sugarcane targets smaller than 20 × 20 pixels or those with over 70% occlusion were not annotated, to ensure the quality of the annotations and the accuracy of model training. All annotation information was saved in txt format.
To prevent model overfitting and improve training effectiveness, the dataset was split into a training set and a validation set. The training set consisted of 1763 images, accounting for 80% of the total dataset, while the validation set contained 489 images, making up 20% of the total dataset. This split ensured that the model could learn effectively while providing enough validation data to test the model’s generalization ability.
3.2. Experimental Setup and Environment
In this study, all models were trained and tested on a Windows 11 operating system equipped with an Intel i7-12700H CPU and an NVIDIA GeForce RTX 3060 GPU (12 GB VRAM). This hardware configuration provides sufficient computational power to support large-scale image data processing and model training. The system has 32 GB of RAM, ensuring efficient data loading and processing during training. The training process utilized CUDA 11.3 to accelerate GPU computation, significantly improving the training speed.
In terms of the software environment, Python 3.8 was used, and model training was based on the PyTorch 1.11.0 deep learning framework. To ensure efficient image processing and data augmentation, the torchvision 0.12.0 and torchaudio 0.11.0 libraries were employed. These tools support various data augmentation techniques, such as random cropping and rotation, and are capable of handling large-scale image datasets.
For the training setup, the input image size was set to 640 × 640 pixels to balance training efficiency and accuracy. To ensure efficient data loading during training, a batch size of 64 was used, with 8 worker processes for data loading. Stochastic Gradient Descent (SGD) was selected as the optimizer, with an initial learning rate of 0.0001, momentum of 0.937, and a weight decay coefficient of 0.1. These hyperparameters were tuned based on initial experimental results and previous research experience. Additionally, a learning rate decay strategy was applied to prevent overfitting and improve the model’s generalization ability. The model training was conducted for a total of 300 epochs, with performance evaluated on the validation set after each epoch to ensure continuous improvement.
3.3. Evaluation Metrics
This study employed several metrics to assess the performance and complexity of the model. Firstly, the training accuracy of the model was measured by the following indicators: Precision (abbreviated as P), Recall (abbreviated as R), and mean Average Precision (abbreviated as mAP). Secondly, to evaluate the complexity of the model, the number of parameters (parameters) was considered. These metrics reflect the model’s demand for hardware resources and its efficiency. Precision P refers to the proportion of correctly predicted samples among all predicted samples. The formula is as follows:
The recall rate (R) serves as a pivotal performance metric, quantifying the proportion of samples correctly identified by the model among all actual positive samples. This metric reflects the model’s ability to identify positive samples, indicating its capacity to detect all true positive samples. Typically, a higher recall rate signifies fewer positive samples missed by the model. The formula is as follows:
The mean Average Precision (mAP) is a critical metric obtained by calculating the mean of Average Precision (AP). Average Precision (AP) essentially represents the area under the Precision–Recall curve. Across different recall levels, AP measures the average precision, thereby providing a comprehensive assessment of model performance. The formula is as follows:
In this formula, (True Positives) represents the number of samples correctly identified as positive, while (False Positives) denotes the number incorrectly labeled as positive. (False Negatives) refers to the number of samples incorrectly classified as negative. denotes the total number of classes. In the context of this study, as only the sugarcane species were of interest, the value of was set to 1.
4. Analysis of Experimental Results
4.1. Comparative Analysis of Different Algorithms
To assess the performance of the enhanced YOLOv8n model (VIEM-YOLOv8n) in sugarcane target detection tasks and to compare it with other mainstream object detection algorithms, this study selected several algorithms for experimental comparison, including SSD, Faster R-CNN, and the YOLO series. These comparative experiments aimed to analyze the performance of each algorithm and further validate the performance advantages of the improved model. The experimental results are shown in
Table 1. Based on the experimental data in
Table 1, the Faster-RCNN framework exhibited limited adaptability for this dataset due to its high parameter complexity and the lowest F1 score, suggesting that this two-stage object detection algorithm is not well-suited for this particular dataset. In contrast, although the SSD model has slightly fewer parameters than Faster-RCNN, its F1 score improved to 81%, indicating that single-stage object detection architectures are more adaptive for this type of dataset. However, the parameter count of the SSD model is still large, making it unsuitable for deployment on mobile devices, and its accuracy does not meet the requirements for high-precision detection.
The YOLOv3 model has the largest number of parameters, which may lead to slower inference speeds and increased storage demands. Despite displaying the highest accuracy, it does not perform ideally for this dataset. YOLOv7-tiny, a lightweight model introduced in the YOLO series over the past two years, achieves higher accuracy while maintaining a low parameter count and computational cost, yet its effectiveness is not pronounced on this dataset. The v5n version of the model has 71% fewer parameters than YOLOv7-tiny but shows a 4.5% decrease in mAP, indicating limited recognition capabilities for this dataset. From the table, it can be seen that VIEM-YOLOv8n outperforms the original YOLOv8n in multiple key metrics: its mAP@0.5 increased by 5.1 percentage points (from 90.9% to 96.0%), and its mAP@0.5:0.95 improved by 6.4 percentage points (from 65.1% to 71.5%), while the recall rate significantly increased to 93.3%. Although the parameter count slightly increased (from 3.0 M to 3.93 M), this change is justified by the model’s high precision and efficiency.
The experimental results demonstrate that the optimizations made to the YOLOv8n model, including the substitution with a VanillaNet backbone, integration of the InceptionNeXt deep convolutional architecture, introduction of the ECA attention mechanism in the C2F feature fusion module, and the adoption of the MPDIOU loss function, led to a slight increase in model parameters but significantly improved its mAP (mean Average Precision) by 5.1%. This confirms that the VIEM-YOLOv8n model substantially enhances recognition performance on the sugarcane dataset, making it more suitable for precise target detection.
4.2. Results Analysis
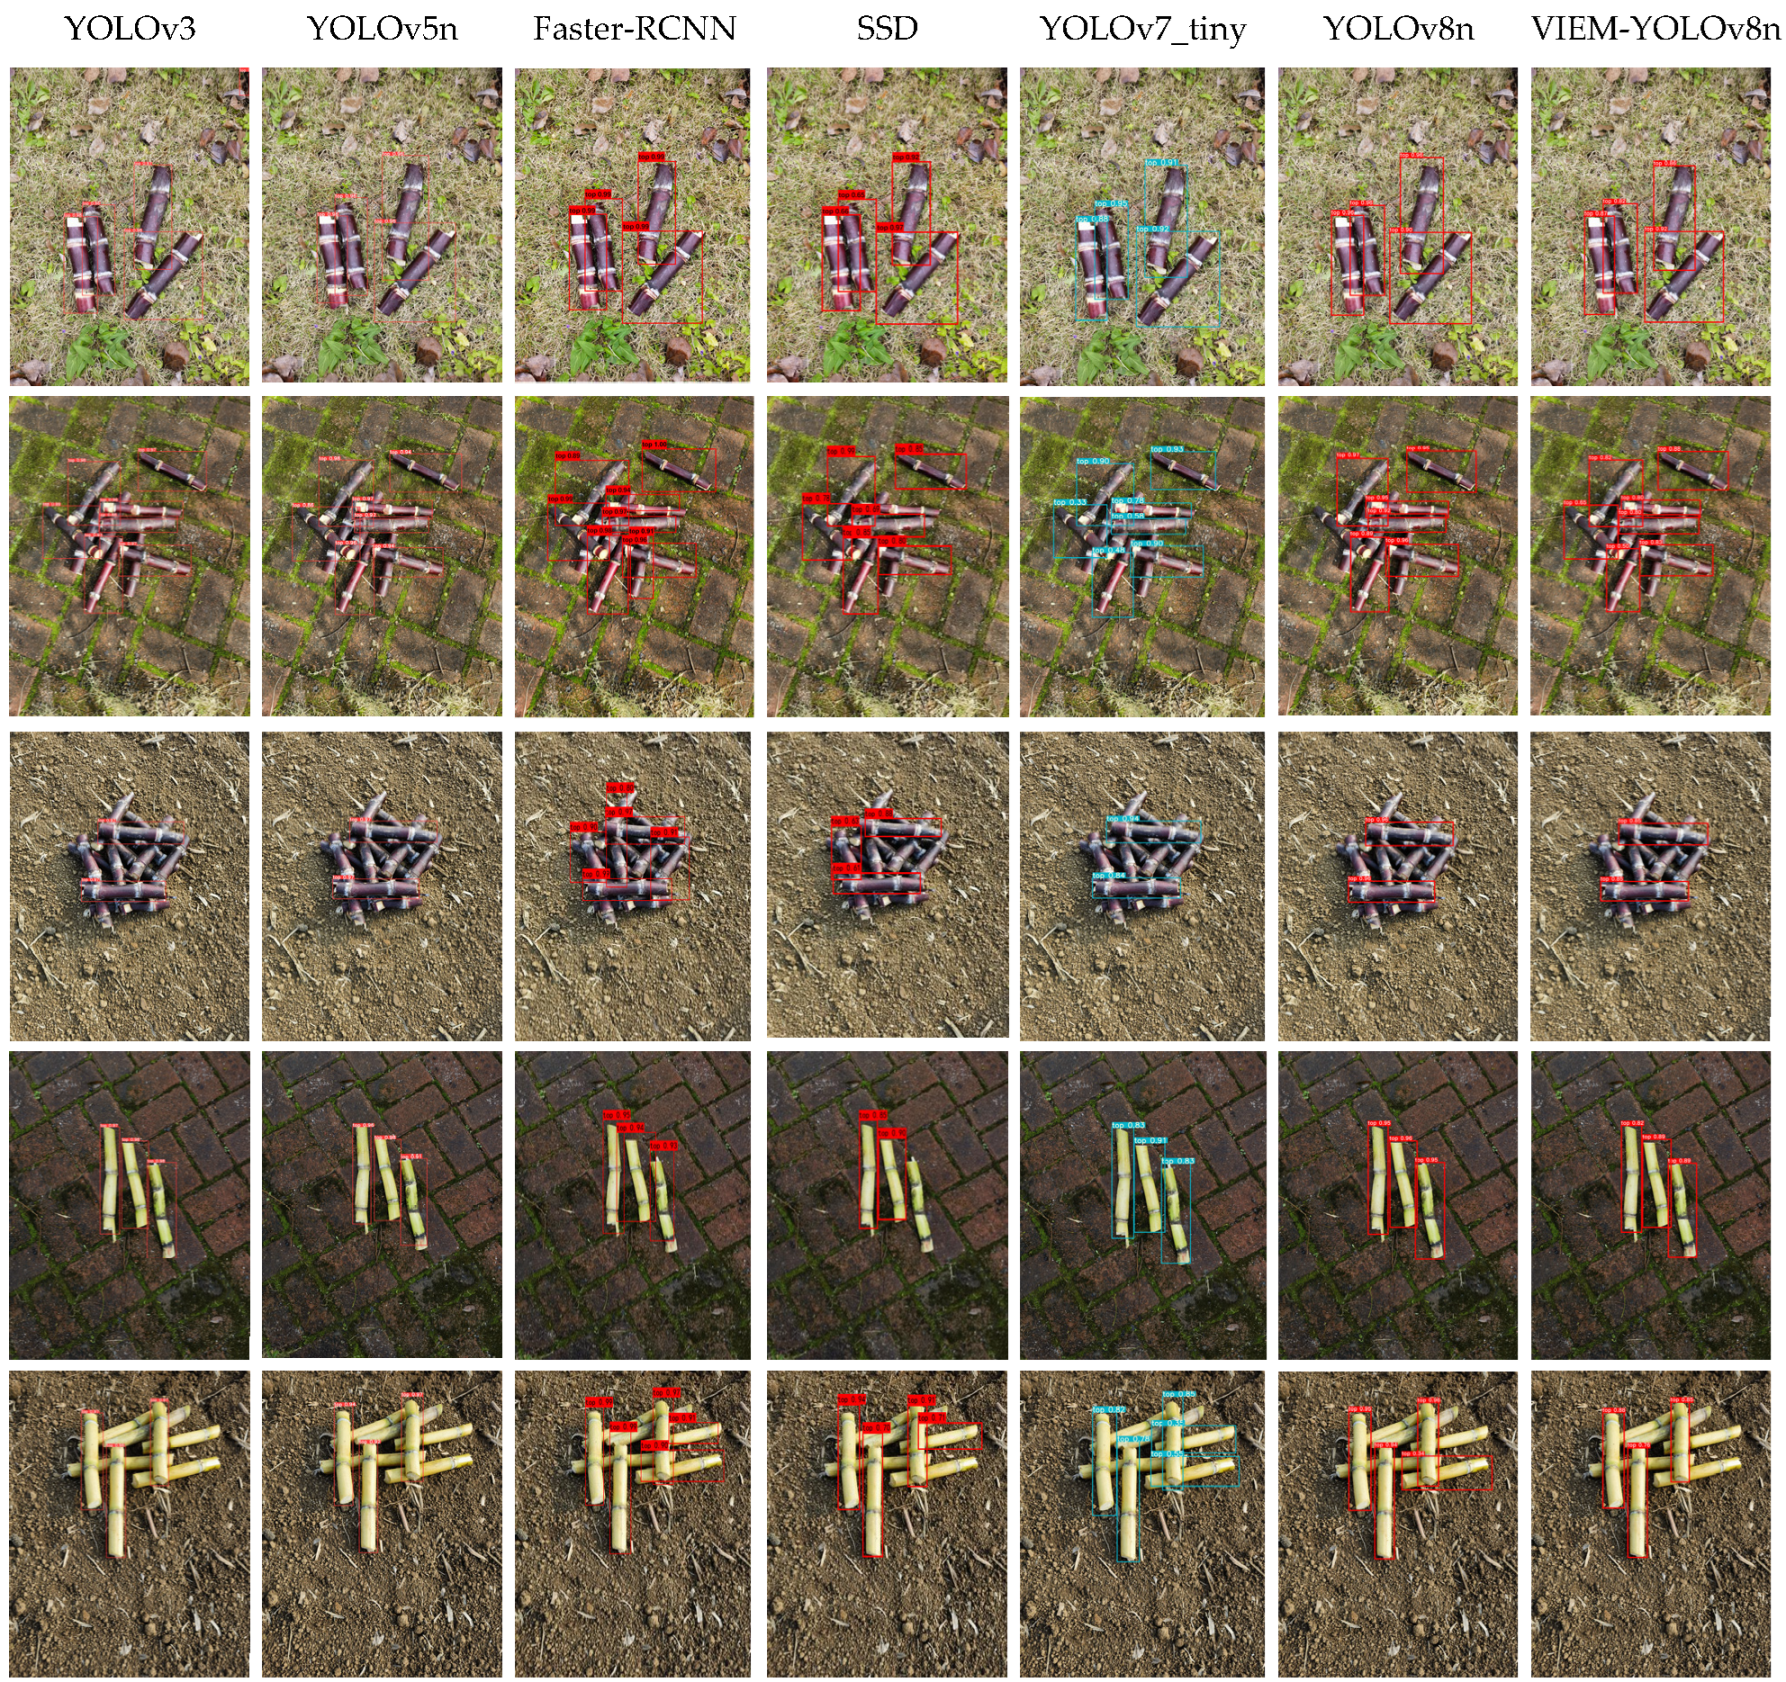
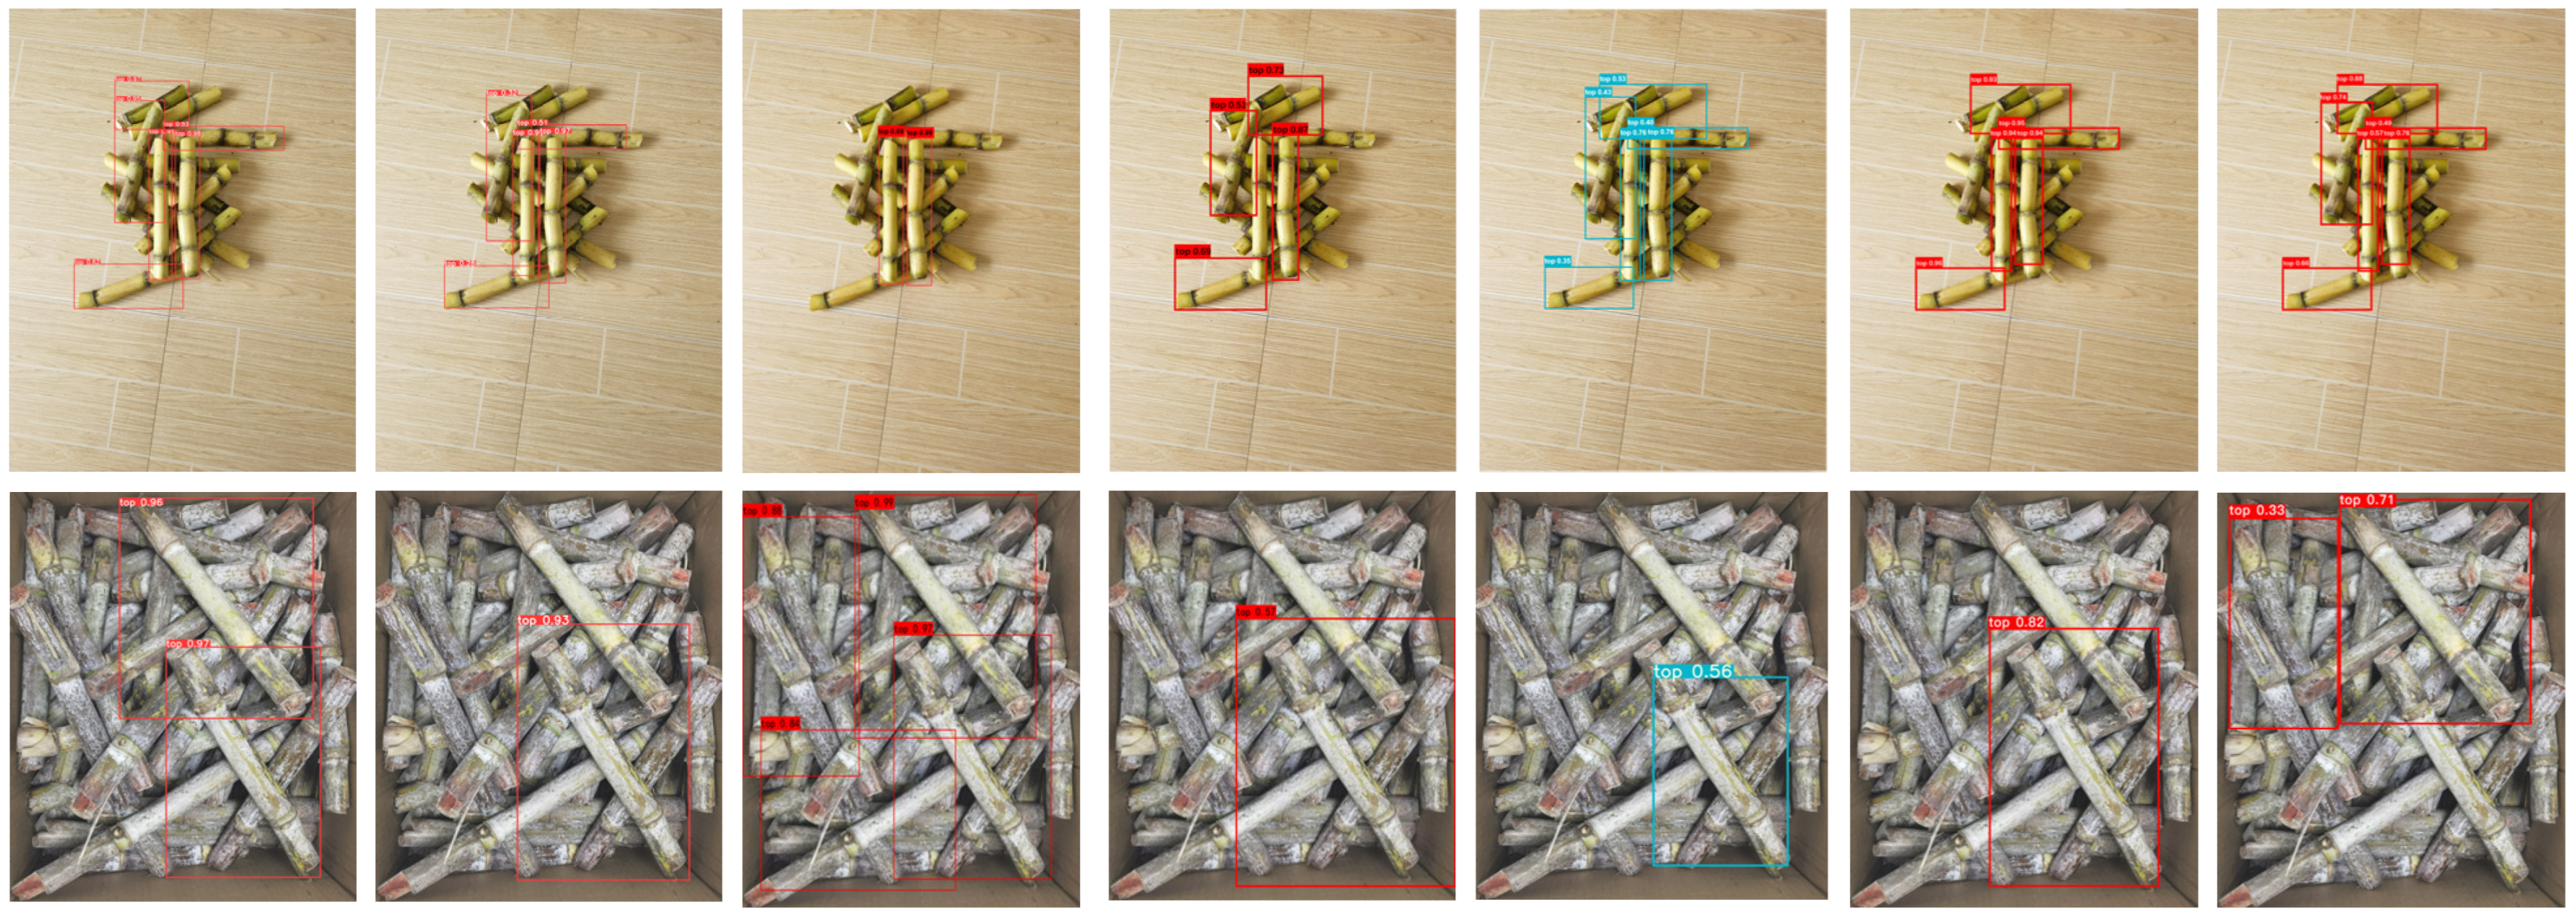
The recognition performance of different object detection models on sugarcane is illustrated in
Figure 7.
The results analysis indicates that the improved model outperforms other object detection models in recognizing various varieties of sugarcane and their different layout configurations, demonstrating high accuracy and confidence. It ensures that the detection boxes precisely encapsulate the sugarcane without any instances of missed detections. In comparisons, the SSD model shows lower confidence and fails to identify all top-layer sugarcane in the image, resulting in omissions; although the YOLOv3 model displays higher confidence in identifying all top-layer sugarcane, its slower detection speed makes it unsuitable for real-time applications on mobile devices. The Faster-RCNN model, while exhibiting high confidence, may interfere with the recognition and retrieval of top-layer sugarcane due to its detection of obscured lower layers, affecting subsequent operational efficiency; the YOLOv5n and YOLOv7-tiny models perform less effectively on this dataset compared to the improved YOLOv8-based model, as the YOLOv5 and v7 series primarily optimize detection performance for multiple targets, whereas this dataset contains only a single category.
The enhanced YOLOv8n model, with its reduced parameter count, excels in handling stacked sugarcane configurations, achieving the highest mean Average Precision (mAP) and accurately recognizing top-layer sugarcane without missing any detections. Thus, the improved model effectively meets the needs of stacked sugarcane detection, with a smaller parameter count making it more suitable for deployment on mobile devices.
4.3. Ablation Study Analysis
For the ablation study, the effects of integrating VanillaNet, MPDIOU, InceptionNeXt, and the C2F_ECA module on enhancing the performance of the original YOLOv8n algorithm were evaluated. These experiments were conducted on a uniform sugarcane dataset for both training and validation, with the specific outcomes summarized in
Table 2.
The data from
Table 2 reveal that replacing the backbone network with VanillaNet enhanced the model’s ability to extract critical information, resulting in a 1.8% increase in mean Average Precision (mAP) compared to the original YOLOv8n. The adoption of MPDIOU as the loss function optimized the network structure and effectively reduced instability during the model training process, which led to a 2.8% improvement in mAP over the original YOLOv8n. Replacing the existing large kernel deep convolutional structure with the InceptionNeXt deep convolutional architecture not only improved the model’s processing efficiency but also resulted in a 3.6% increase in mAP. Integrating the Effective Channel Attention (ECA) mechanism in the C2F module, with only a minor increase in parameters, significantly enhanced the model’s recognition capability, achieving a 5.1% increase in mAP. These experimental results demonstrate that each technological improvement introduced in this study effectively enhanced model performance. These enhancements not only increased the model’s accuracy in complex scenarios but also improved its training and inference efficiency to some extent, making it more suitable for real-time and resource-constrained application scenarios.
To more vividly demonstrate the impact of improvements on model performance,
Figure 8 and
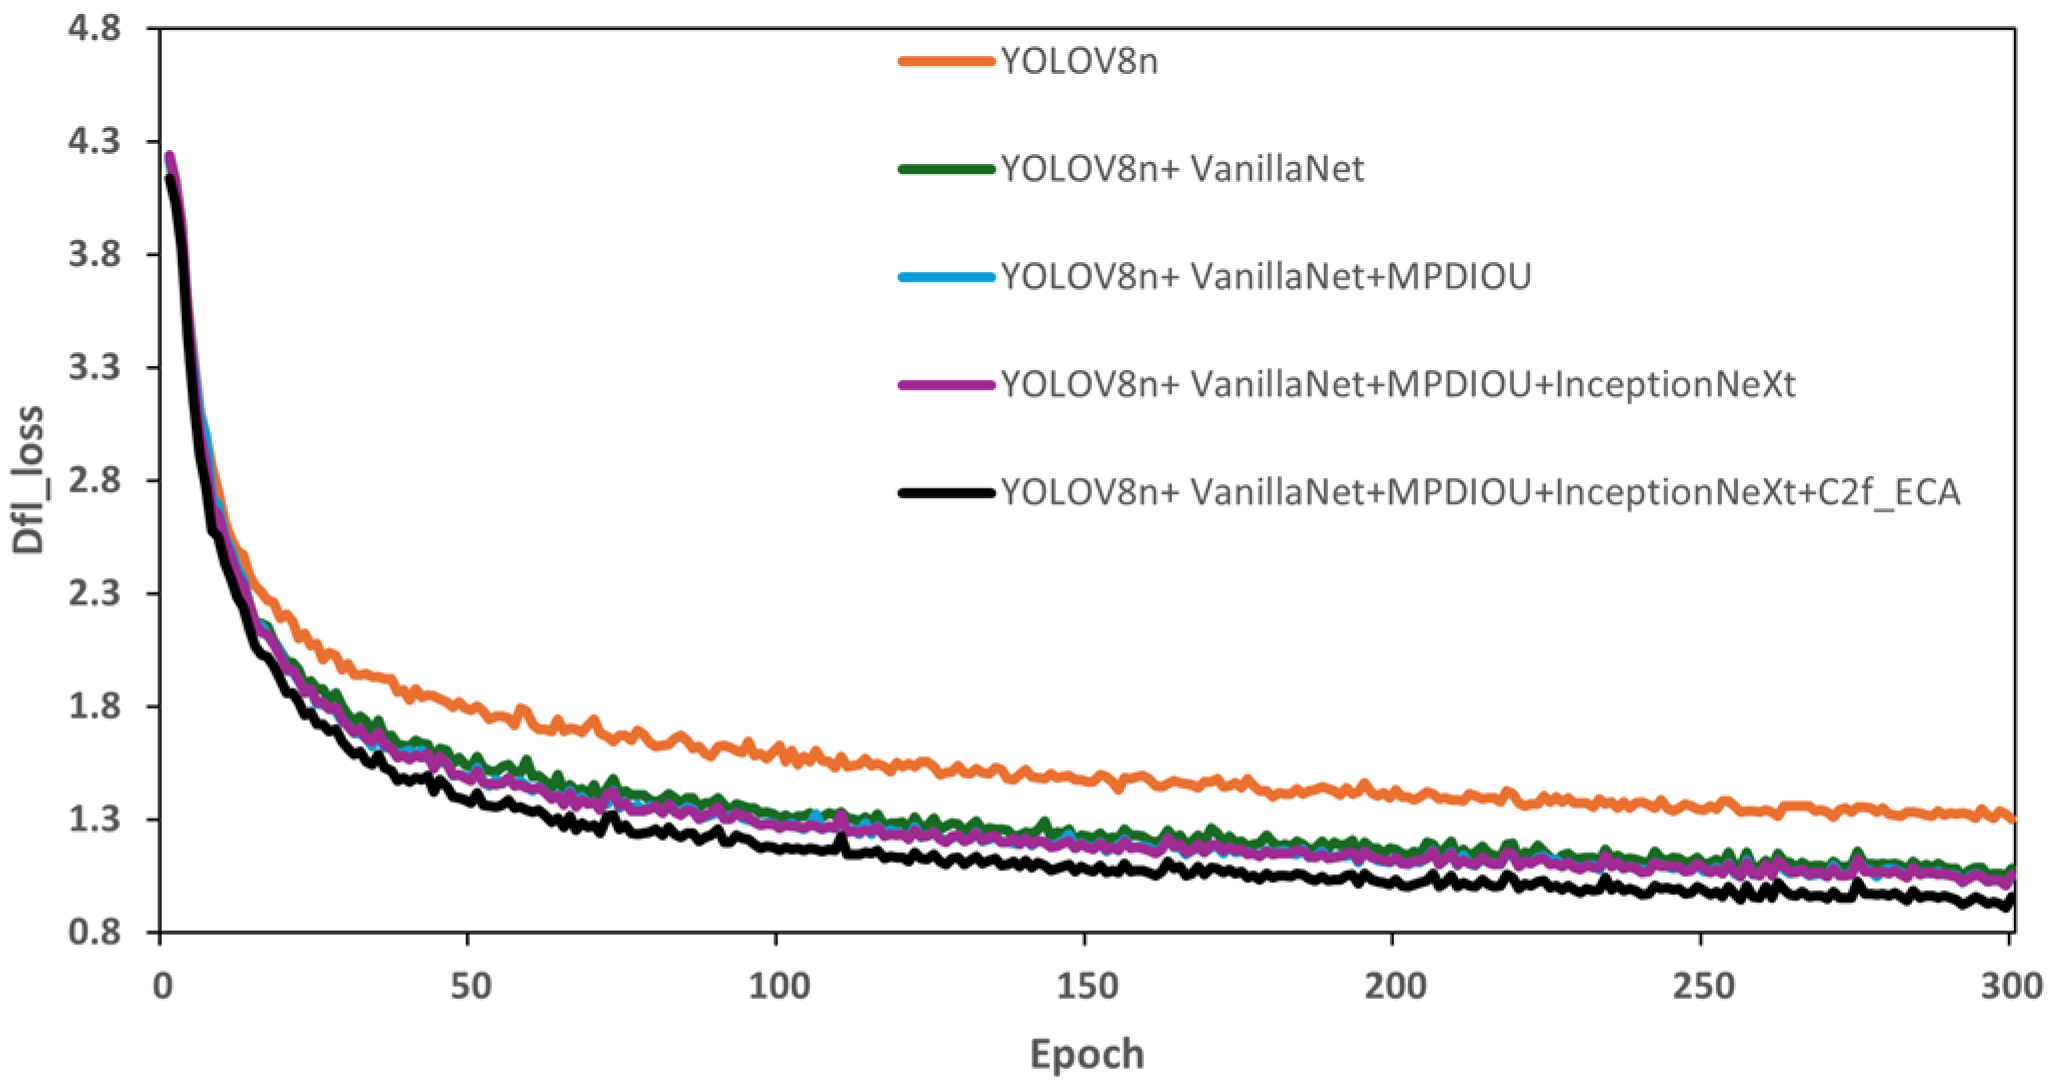
Figure 9 respectively depict the model’s performance in terms of mAP@0.5 and Deep Feature Loss (DFL). In these figures, the orange curve represents the mAP values and loss function trends of the YOLOv8n model, while the black curve represents the performance of the improved VOEM-YOLOv8n model in these two aspects. These charts clearly show that compared to the original model, the improved VOEM-YOLOv8n achieved a significant improvement of 5.1% in mAP, directly reflecting an enhancement in accuracy. Moreover, the loss values of the improved model were generally lower than those of the original throughout the evaluation process, indicating a significant increase in robustness. These improvements not only optimized the model’s performance but also enhanced its adaptability and robustness in complex detection environments.
4.4. Public Dataset Experiment Analysis
To further validate the research methods, two public datasets were obtained from CSDN for experimentation. The first dataset was a single-category apple detection dataset containing 2500 images; the second dataset included 12 types of crop leaf diseases, comprising 5483 images. These datasets were divided into training, testing, and validation sets in a 7:2:1 ratio, resulting in 1750, 500, and 250 images for the apple detection dataset, and 3839, 1096, and 548 images for the crop leaf disease dataset, respectively. During the model training process, both the YOLOv8n model and the improved VIEM-YOLOv8n model were utilized for comparison.
Experimental results on the apple detection dataset, as presented in
Table 3, show that the YOLOv8n and VIEM-YOLOv8n models exhibit similar precision. However, the VIEM-YOLOv8n model achieves a 0.8% increase in recall and a 2.8% improvement in mAP0.5, demonstrating enhanced accuracy in correctly identifying targets. The F1 scores are comparable, indicating that both models achieve a similar balance between precision and recall, with a slight advantage for VIEM-YOLOv8n.
For the crop leaf disease dataset, as shown in
Table 4, the VIEM-YOLOv8n model outperforms the YOLOv8n across all performance metrics. Notably, it achieves a precision of 81.3%, which is 6.4 percentage points higher than the 74.9% recorded by YOLOv8n, reflecting greater accuracy in predicting positive classes. In terms of recall, VIEM-YOLOv8n also leads with 69.6%, an increase of 3.8 percentage points over YOLOv8n, indicating more effective identification of all positive samples. Under the mAP criterion with an IoU threshold of 0.5, VIEM-YOLOv8n achieves 70.1%, surpassing YOLOv8n’s 68.1% by 2 percentage points. The F1 score, at 75.0%, is also 4.9 percentage points higher, further confirming a better balance between precision and recall achieved by VIEM-YOLOv8n.
Combining the experimental outcomes from both the apple detection and crop leaf disease datasets, it is evident that the VIEM-YOLOv8n model significantly surpasses the YOLOv8n in target detection performance, validating the effectiveness of the proposed VIEM-YOLOv8n model in enhancing detection precision.
5. Conclusions
This study improves upon the YOLOv8n object detection model, focusing on aspects such as replacing the backbone network, integrating deep convolutional architectures and attention mechanisms, and optimizing the loss function. Although the model’s parameter count has increased, the improved model shows significant gains in detection accuracy for stacked sugarcane targets, particularly in efficiently recognizing unordered stacked sugarcane. Additionally, the model maintains good computational efficiency, making it suitable for deployment on mobile devices and in resource-constrained environments.
Through ablation experiments and comparisons with other object detection algorithms, we draw the following conclusions:
- (1)
Architectural Optimization: Replacing the original backbone network of the YOLOv8n model with VanillaNet significantly enhances feature extraction ability and computational efficiency. The introduction of the InceptionNeXt deep convolutional architecture further improves the model’s ability to recognize sugarcane targets of different shapes and sizes. At the same time, the integrated Efficient Channel Attention (ECA) mechanism enhances the model’s focus on key sugarcane features, while the optimized MPDIOU loss function improves accuracy in overlapping target scenarios, significantly reducing misdetection and missed detection.
- (2)
Experimental Results: The improved VIEM-YOLOv8n model achieved an average precision (mAP@0.5) of 96.0% and a comprehensive average precision (mAP@0.5:0.95) of 71.5% on the sugarcane dataset, significantly outperforming the original YOLOv8n model and other existing mainstream object detection algorithms. Furthermore, experiments on two public datasets further validated the generalizability and robustness of the VIEM-YOLOv8n model across different application scenarios.
Despite the promising experimental results, we recognize that the applicability and generalizability of this method in real-world applications still need further verification. Future work will focus on testing the model in more complex real-world scenarios, including varying lighting conditions, different sugarcane species, and stacking arrangements. Further optimization of the model’s computational efficiency and improving its deployment capability on edge computing devices are also important directions for future research. In conclusion, this study provides an efficient solution for stacked sugarcane target detection, offering technological support for automated sugarcane harvesting and mechanized planting, with significant application prospects.


