


Computer-Integrated Surface Image Processing of Hydrogen-Saturated Steel Wear Products

 ,
,  ,
,  , , and
Abstract
Featured Application
Abstract
1. Introduction
2. Literature Review and Some Theoretical Approaches
- -
- Deep Learning Applications;
- -
- Event-based vision;
- -
- Hybrid Image Retrieval Systems;
- -
- Smart Cities and Industrial Applications;
- -
- Medical Imaging and Extended Reality;
- -
- Improved Learning Methods.
3. Materials and Investigation Methodology
3.1. Range Map
3.2. Needle Chart
3.3. Reflectivity Map
3.4. Building a Needle Diagram
3.5. Range Map Calculation
4. Results and Discussions
- Load two gray-scale images.
- Binarize the image based on the average luminance value.
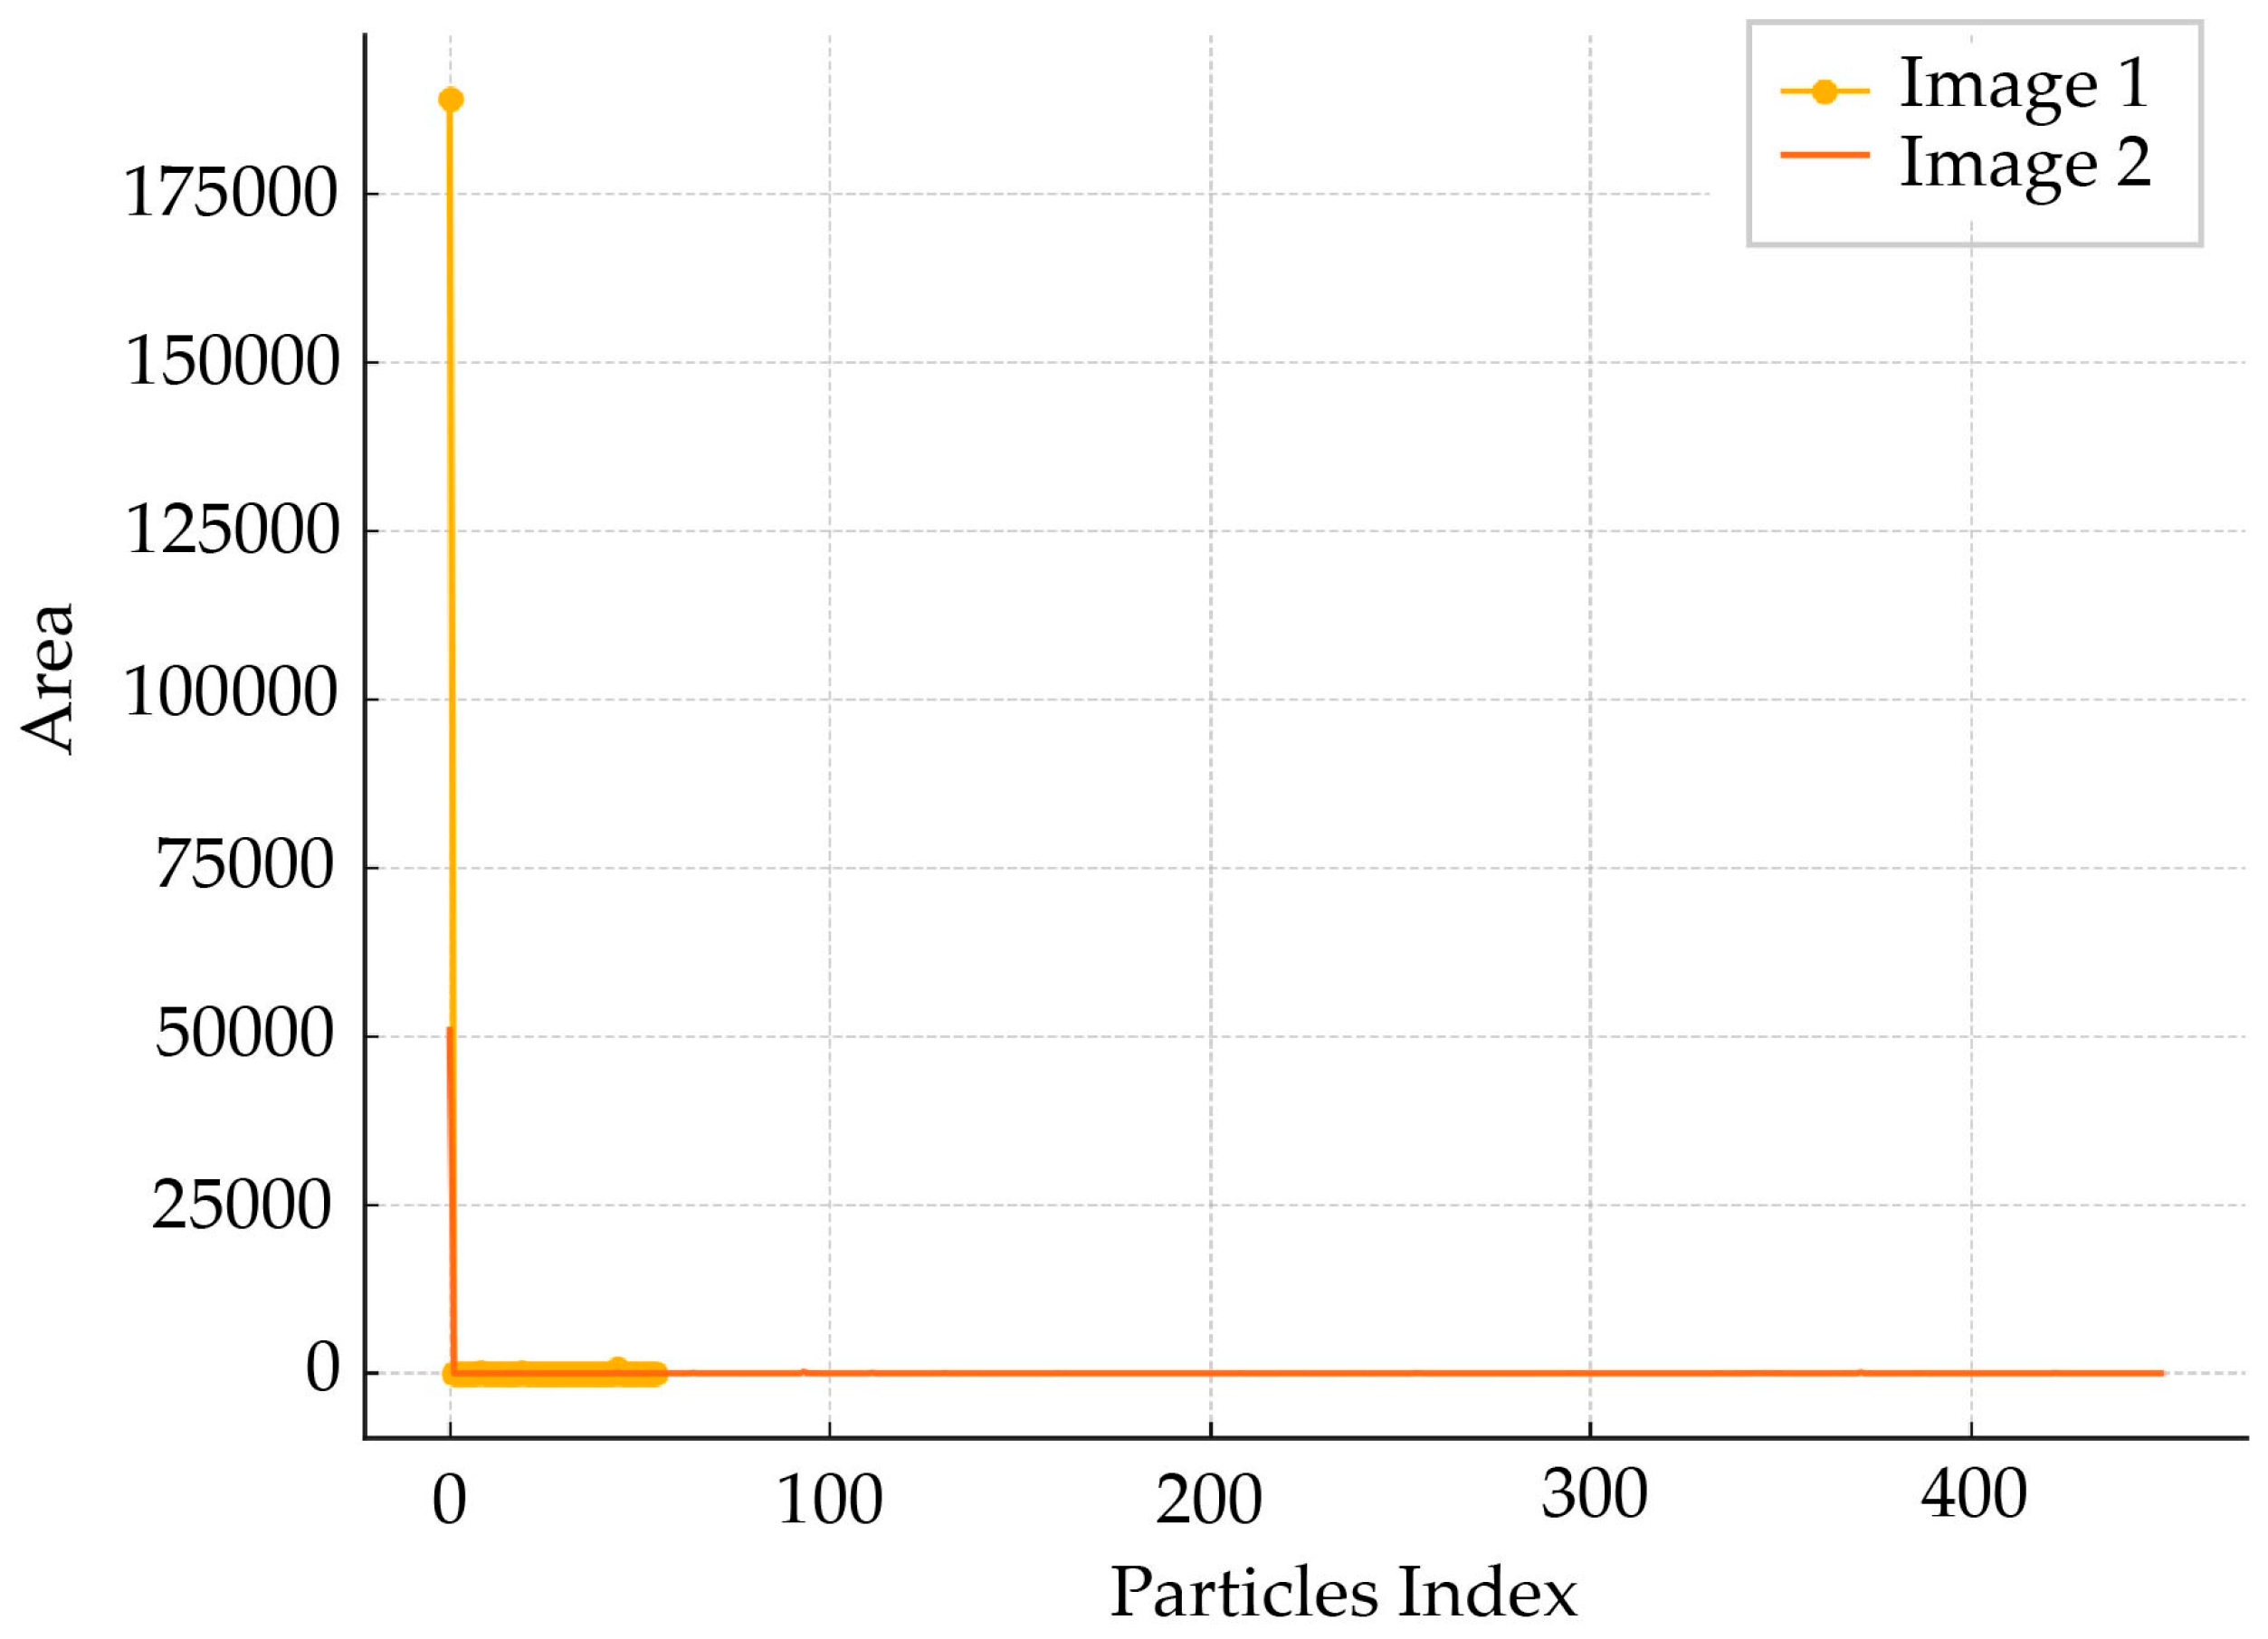
- Mark regions in the image and calculate their properties.
- Display the binarized image.
- Convert the results into a table for easy viewing.
- Shape and distribution analysis:
- -
- Classify particles by shape:
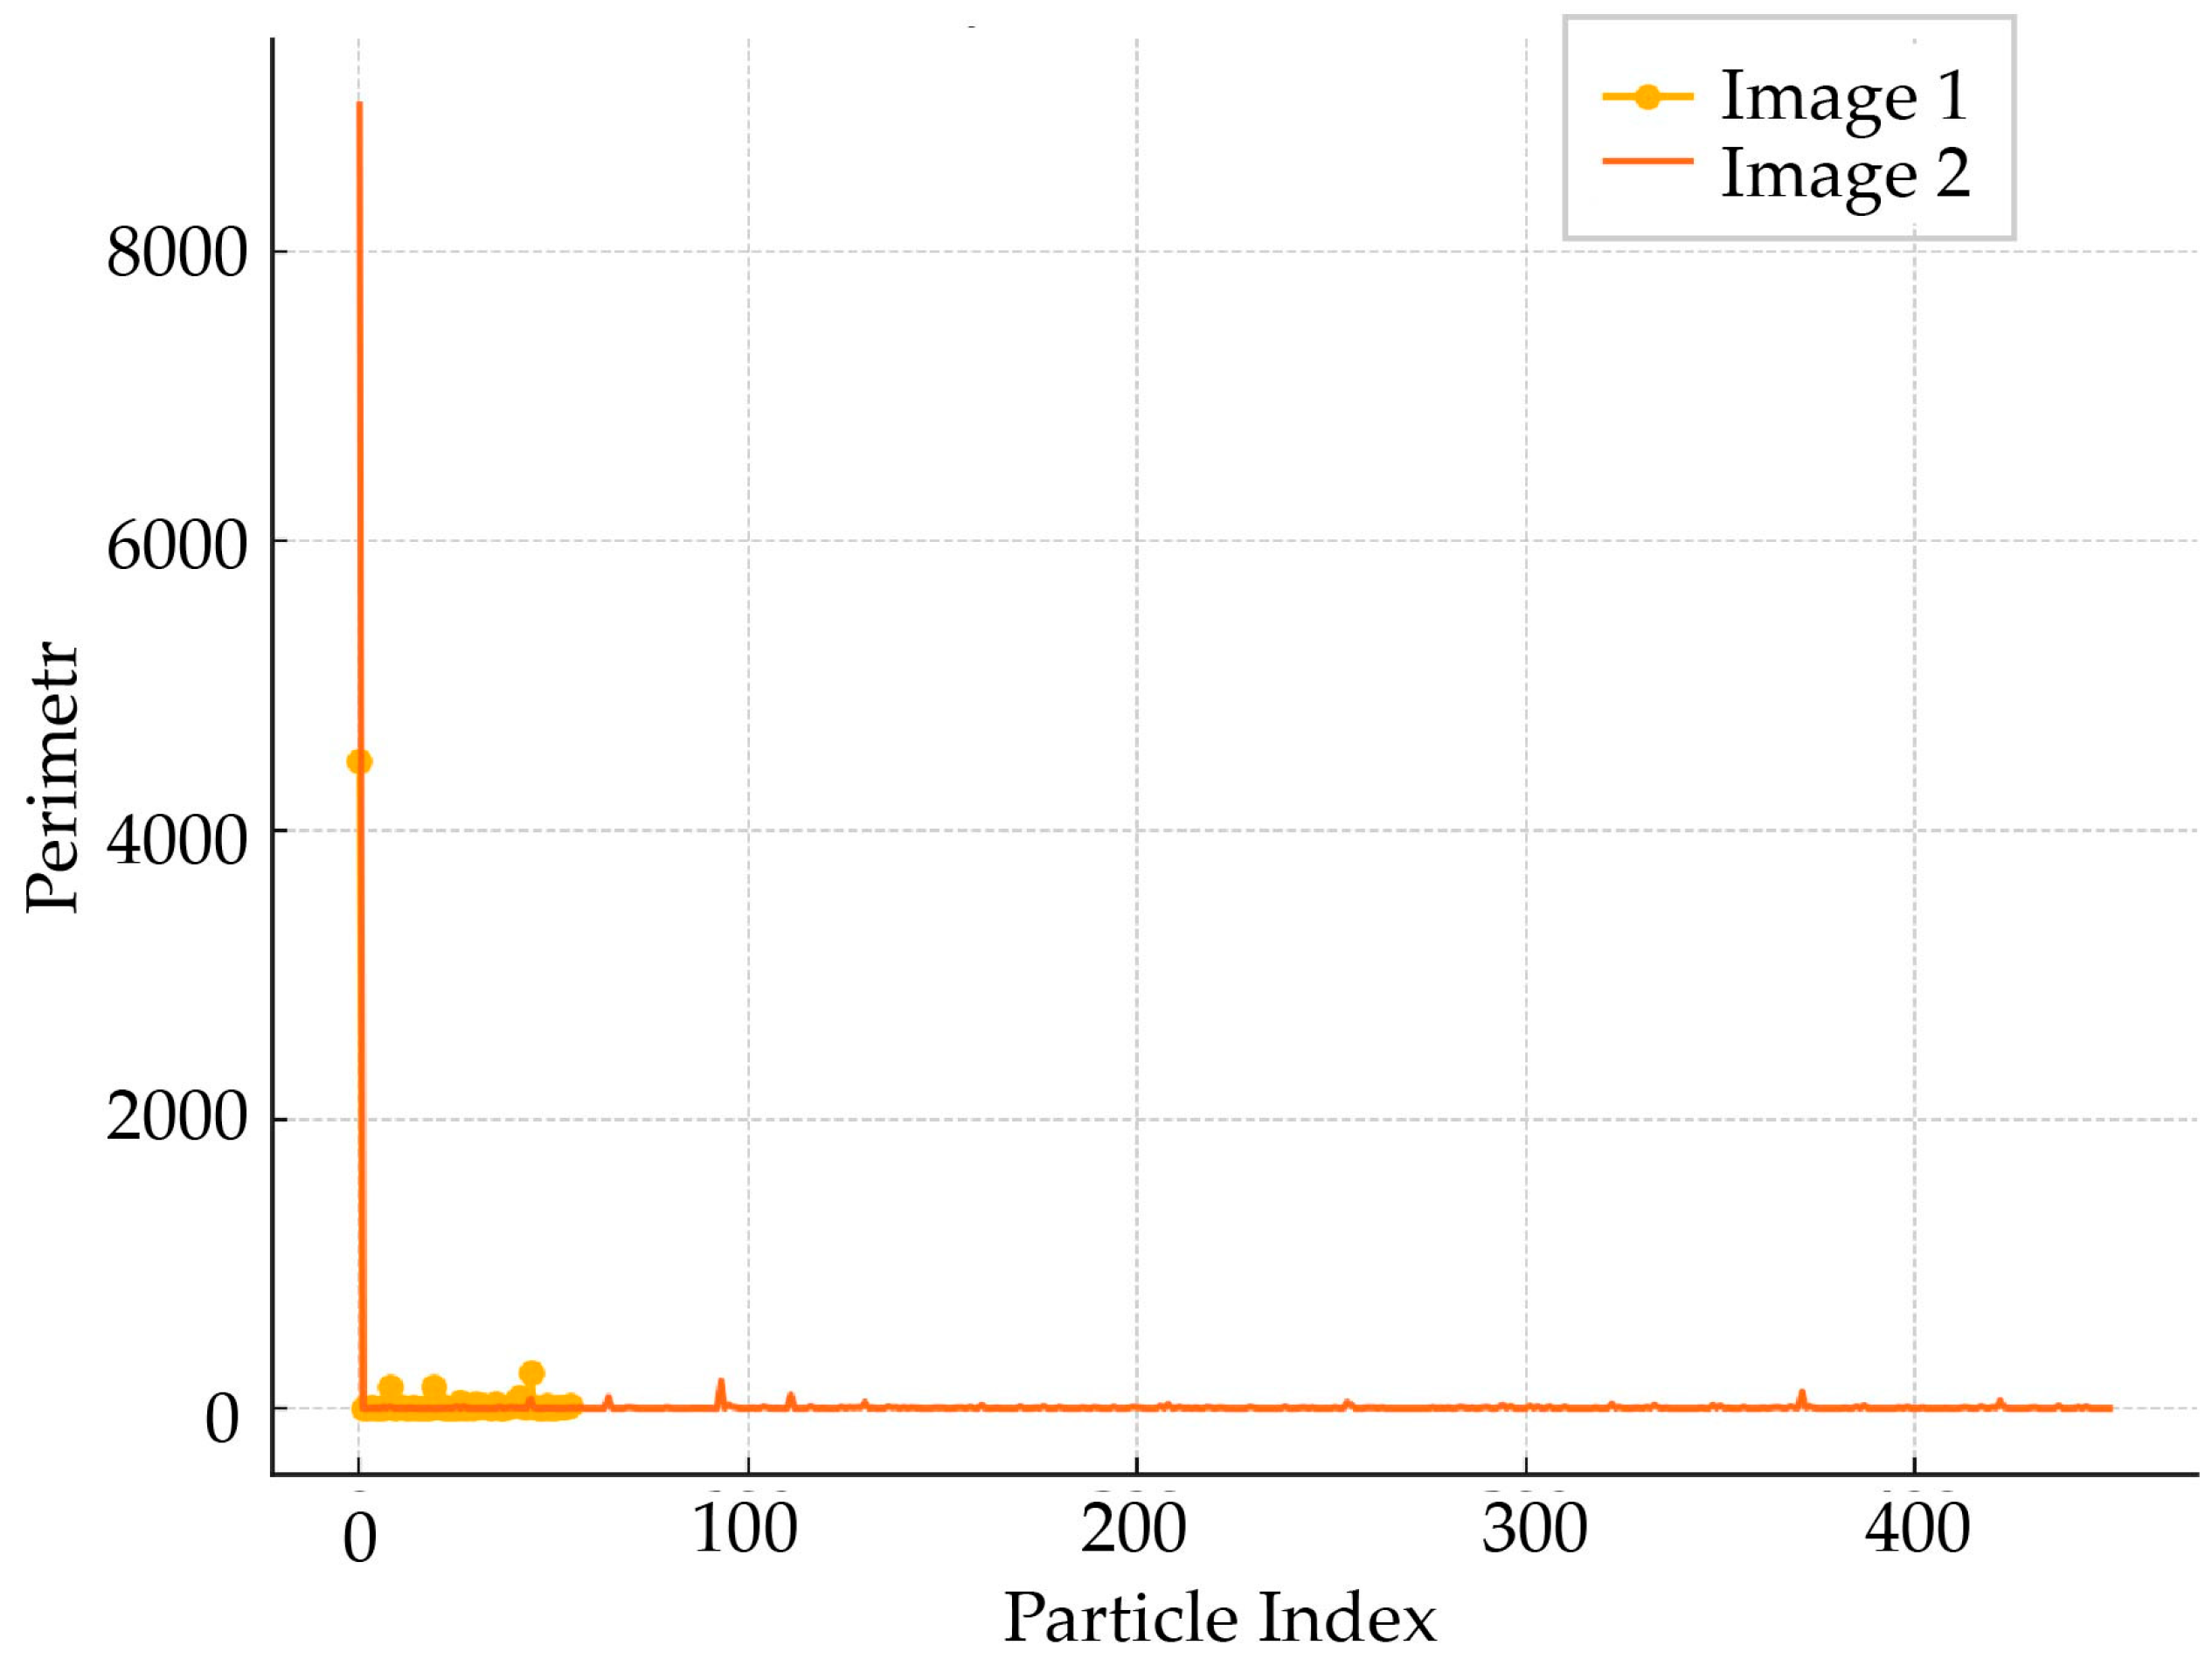
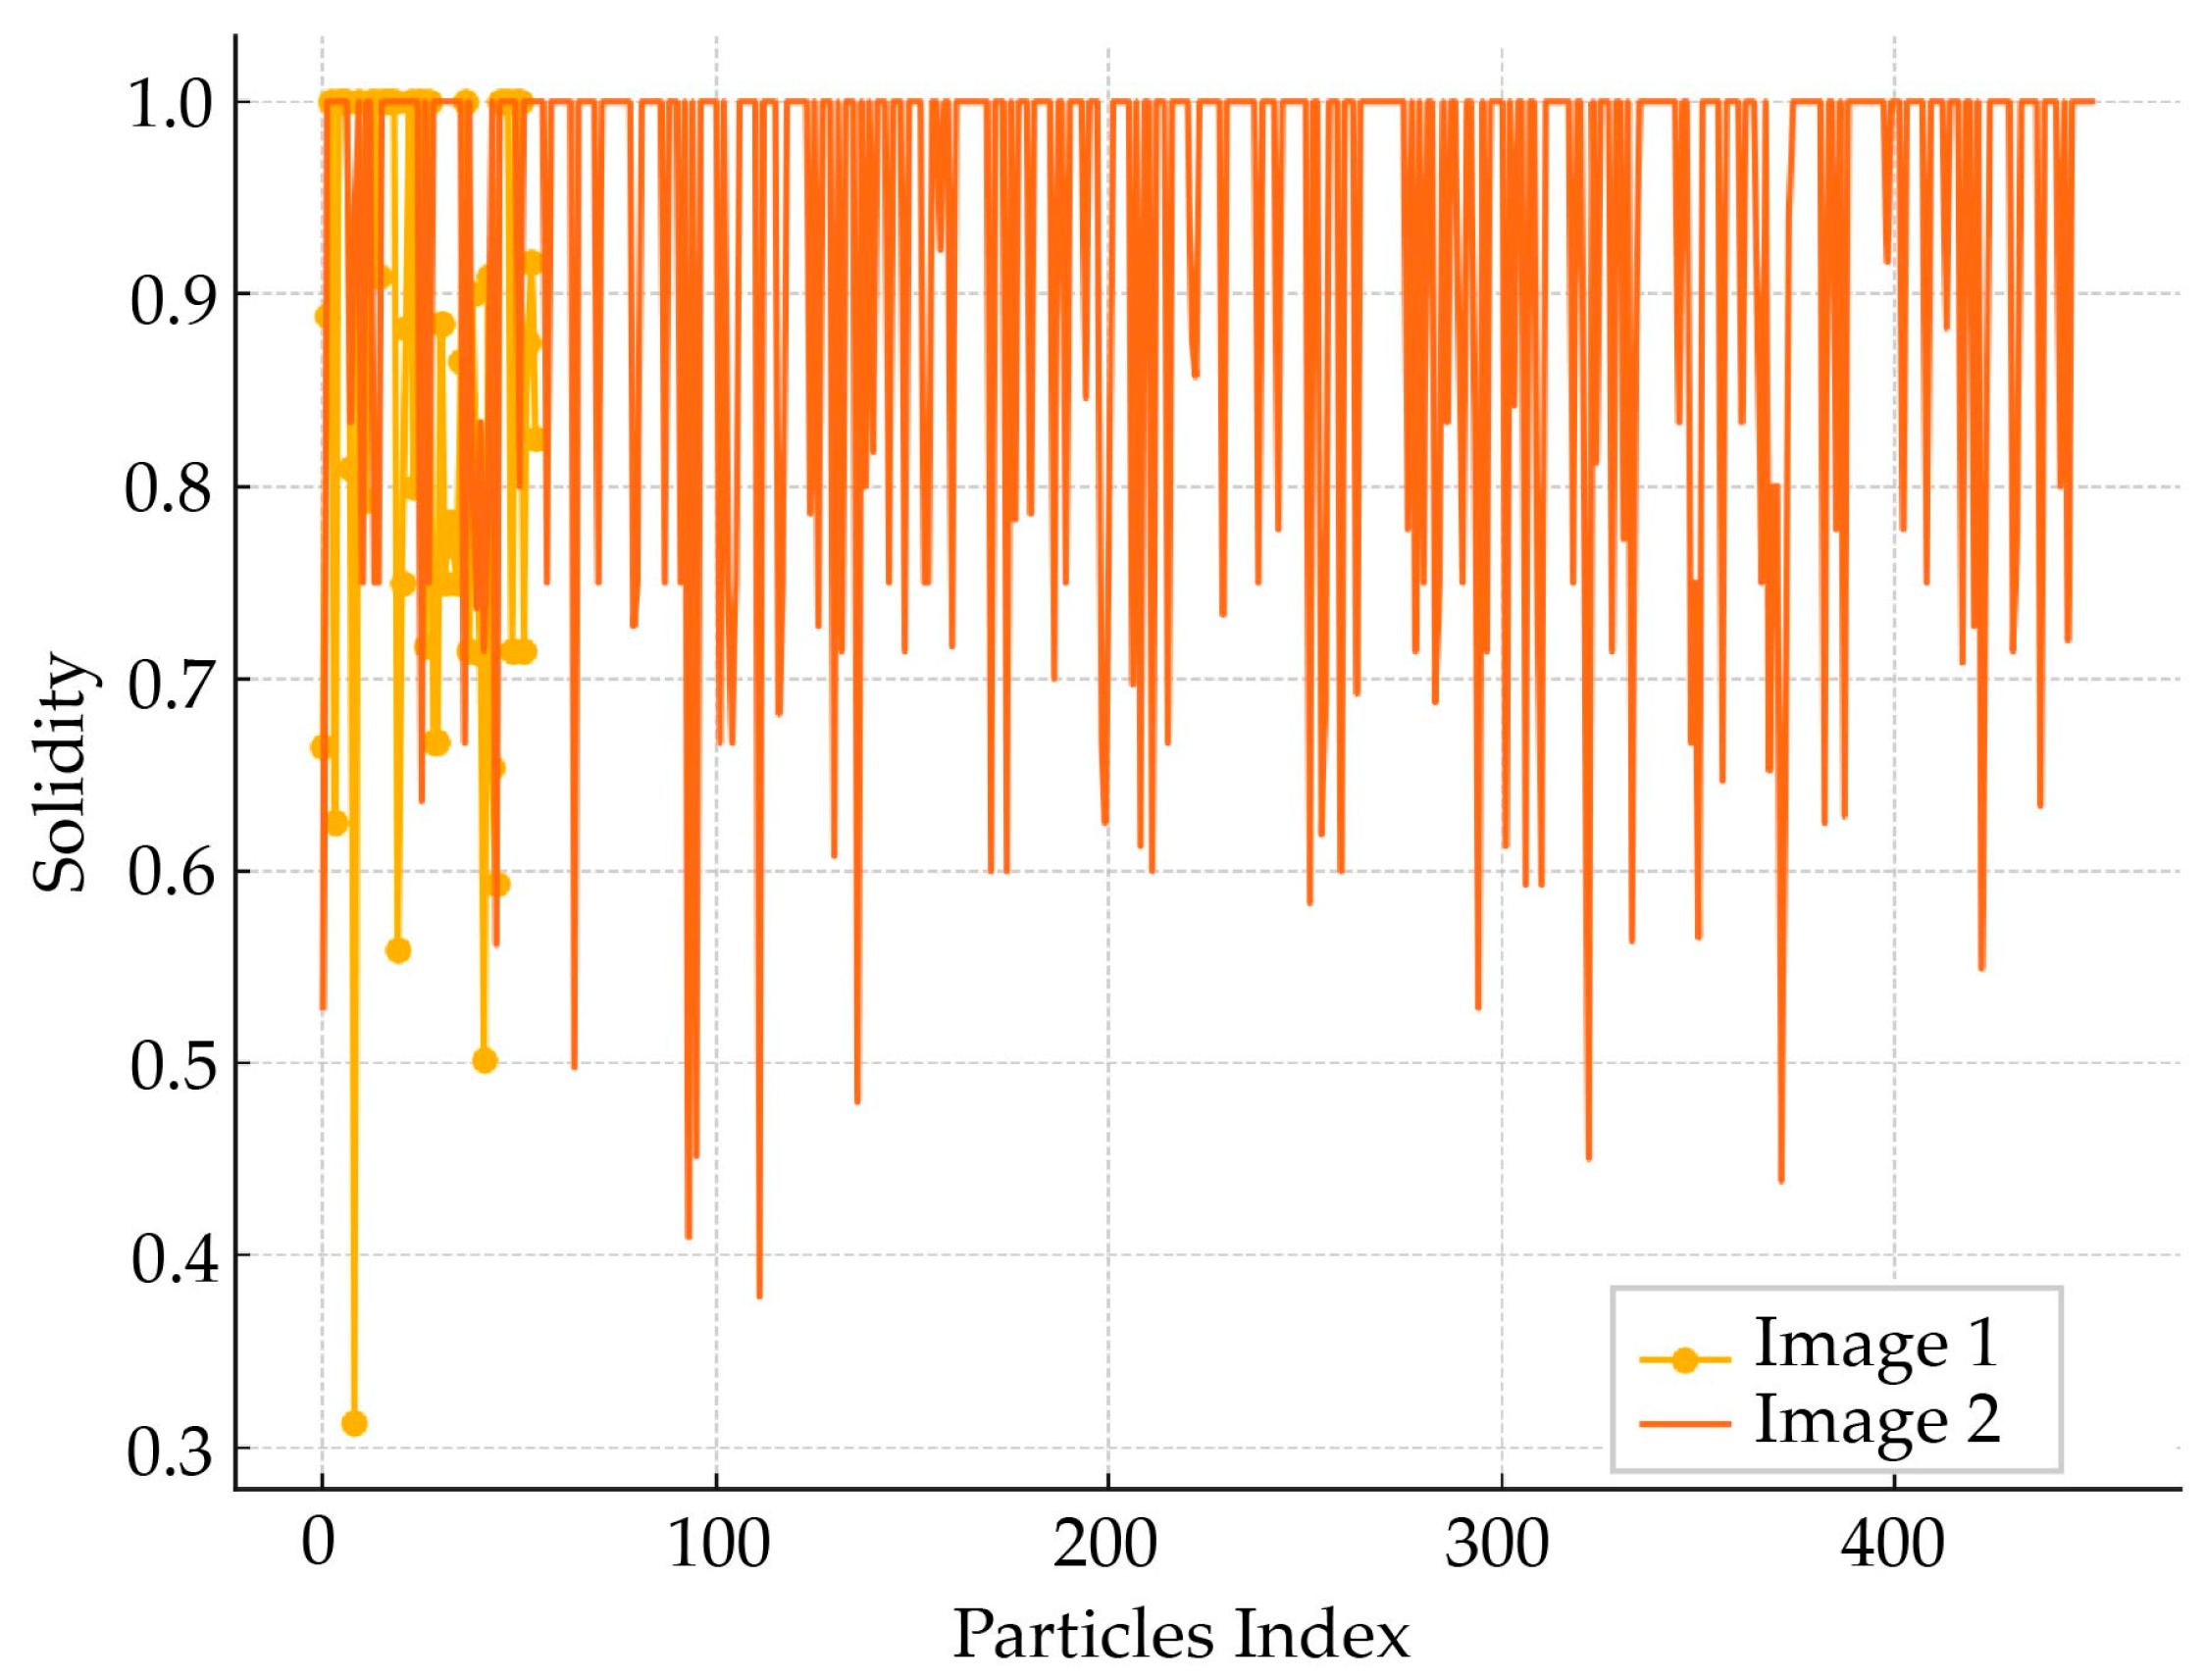
- Use clustering (e.g., k-means) to group particles based on their characteristics (area, perimeter, eccentricity, density).
- -
- Particle size distribution.
- Create histograms to analyze the distribution of areas or perimeters.
- -
- Estimation of anisotropy.
- Analyze the direction of elongation of particles to study the dominant orientation in the material.
- Detecting defects:
- -
- Search for cracks or voids.
- Use edge detectors (Sobel, Canny) to identify areas that indicate defects or microcracks.
- -
- Estimation of defect density.
- Count the number of defects per unit area or estimate their effect on the shape of the particle.
- Texture analysis:
- -
- Texture features (GLCM, LBP).
- Use texture analysis techniques (e.g., gray-level correlation matrix, local binary patterns) to determine the internal structure of particles.
- -
- Texture classification.
- Apply machine learning to classify particles based on texture features (e.g., smooth, rough, cracked).
- Three-dimensional modeling:
- Reconstruction of 3D models.
- -
- If image series are available, a 3D particle model can be reconstructed to analyze volume, shape, and structure.
- Damage simulation.
- -
- Simulate the effect of cracks on particle shape in three dimensions.
- Dynamic analysis:
- -
- Tracking the movement of particles.
- If a series of images are available over time, the movement of particles can be tracked to analyze their interactions.
- -
- Fragmentation studies.
- Analyze how large particles are divided into smaller ones under load.
- Comparison with samples:
- -
- Comparison with reference data.
- Use reference particles or samples to assess whether the particles being analyzed meet certain standards (e.g., size, shape, defects).
- -
- Estimate the level of wear.
- Compare particles from different samples to estimate the degree of wear.
- Semantic segmentation:
- -
- Separation into regions of interest.
- Use semantic segmentation techniques (e.g., U-Net neural networks) to separate particles from the background or to highlight defects.
- -
- Analysis of complex structures.
- Segment areas of high and low material density.
- Integration with machine learning:
- -
- Automatic classification.
- Use machine learning algorithms to automatically classify particles according to their characteristics (e.g., healthy/defective).
- -
- Prediction of material properties.
- Use particle shape data to predict physical and mechanical properties.
- Modeling of interaction with hydrogen:
- -
- Analysis of the impact of hydrogen.
- Model which particles are more vulnerable to hydrogen exposure based on their area, density, and shape.
- -
- Visualization of hydrogen concentration.
- Integrate fluorescence analysis data to create heat maps of hydrogen distribution on particles.
- These studies can help to deepen the understanding of material characteristics and assess how various factors affect particle properties.
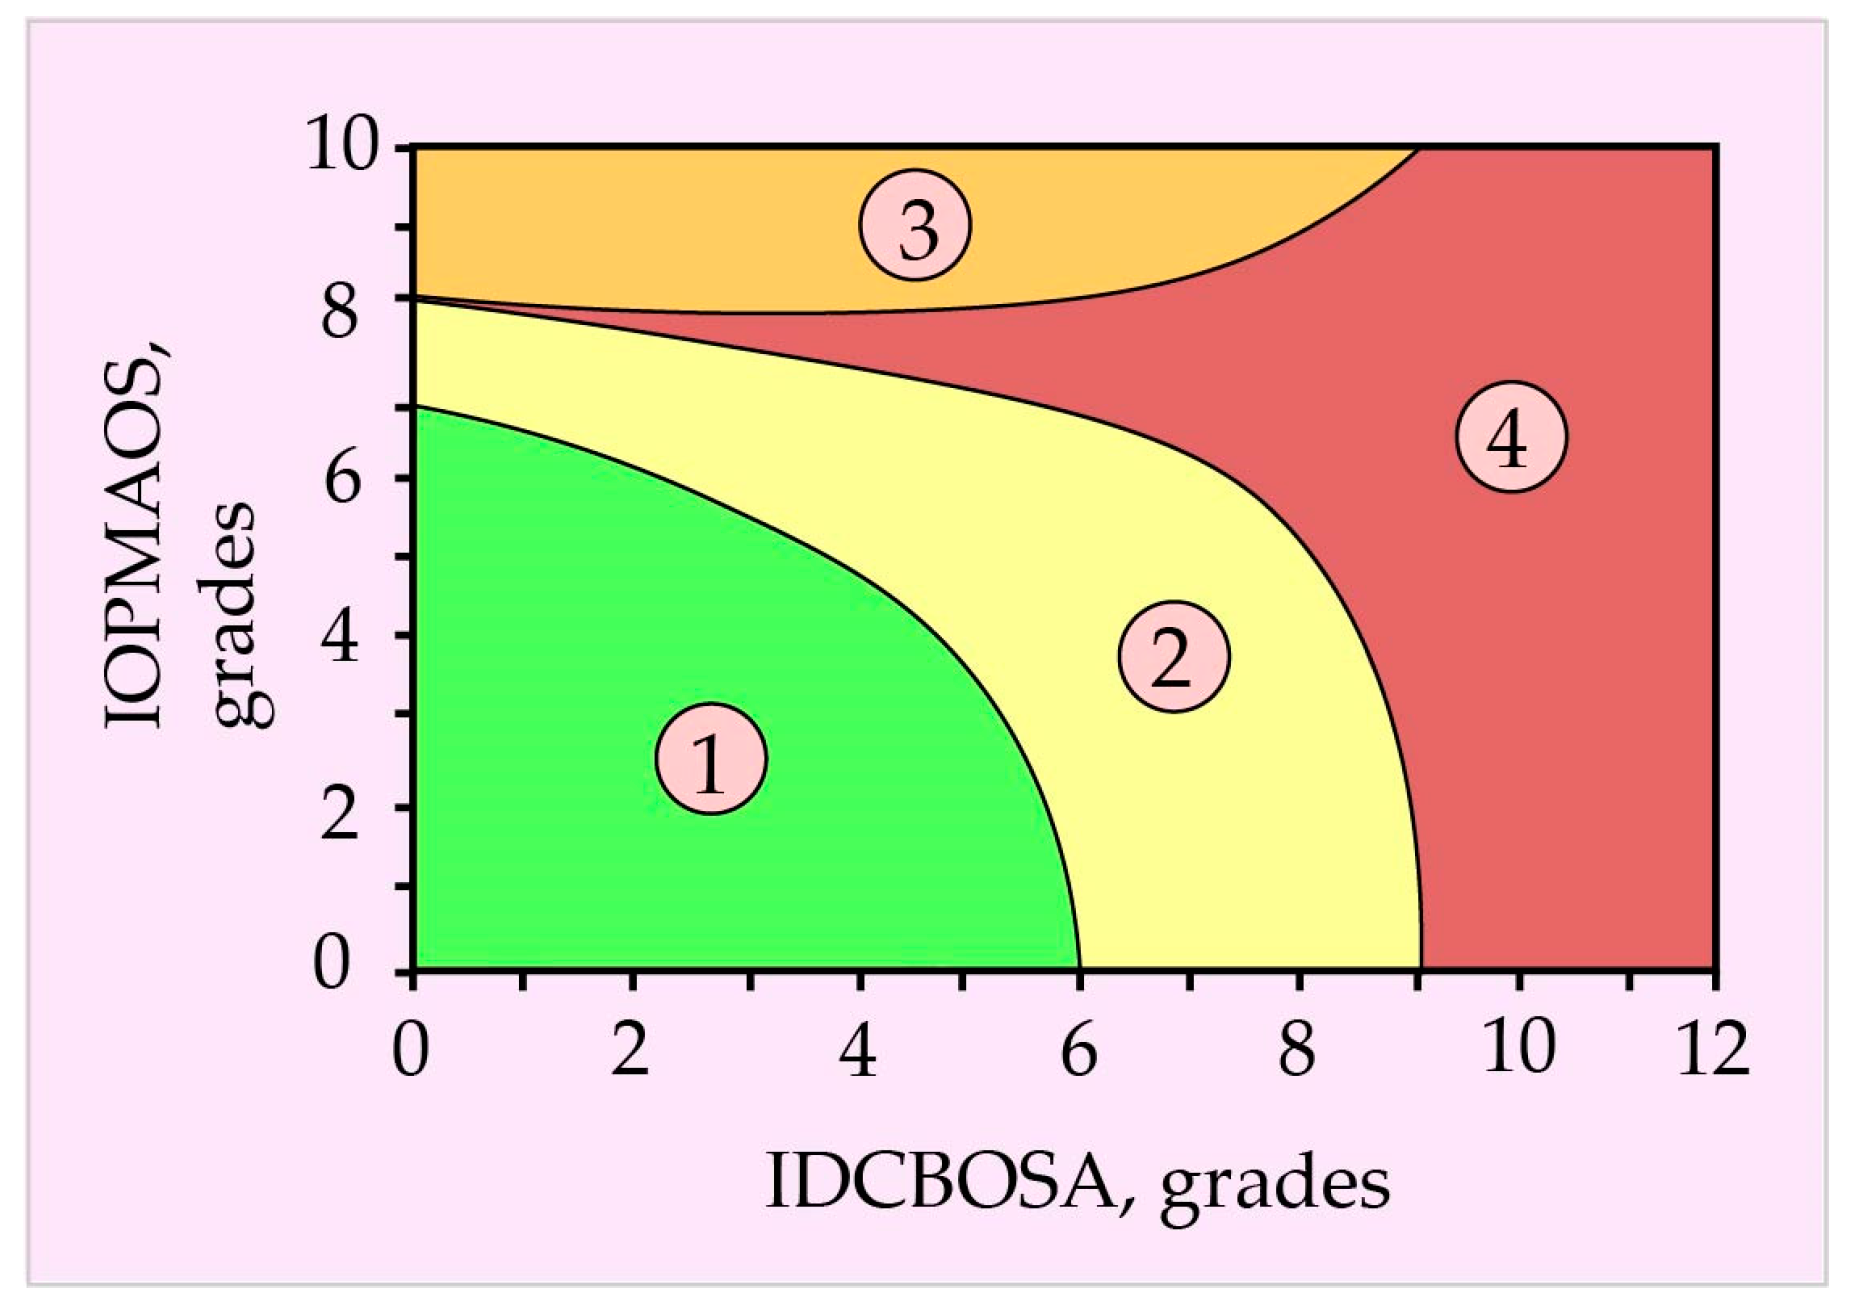
Concept for the Construction and Implementation of a Scheme for Determining the Performance and Technical Condition of a Tribotechnical Unit
5. Conclusions
- A conceptual scheme is proposed to illustrate how the hydrogen concentration affects the wear resistance of materials during friction and long-term operation. Three modes are identified, including running-in, normal operation, and catastrophic failure, each with distinct wear particle morphologies. Low hydrogen concentrations enhance plasticity, while high levels cause embrittlement and catastrophic failure.
- Key trends in computer vision (CV) development are outlined, including deep learning, event-based vision, hybrid retrieval systems, smart applications, medical imaging, and improved learning techniques.
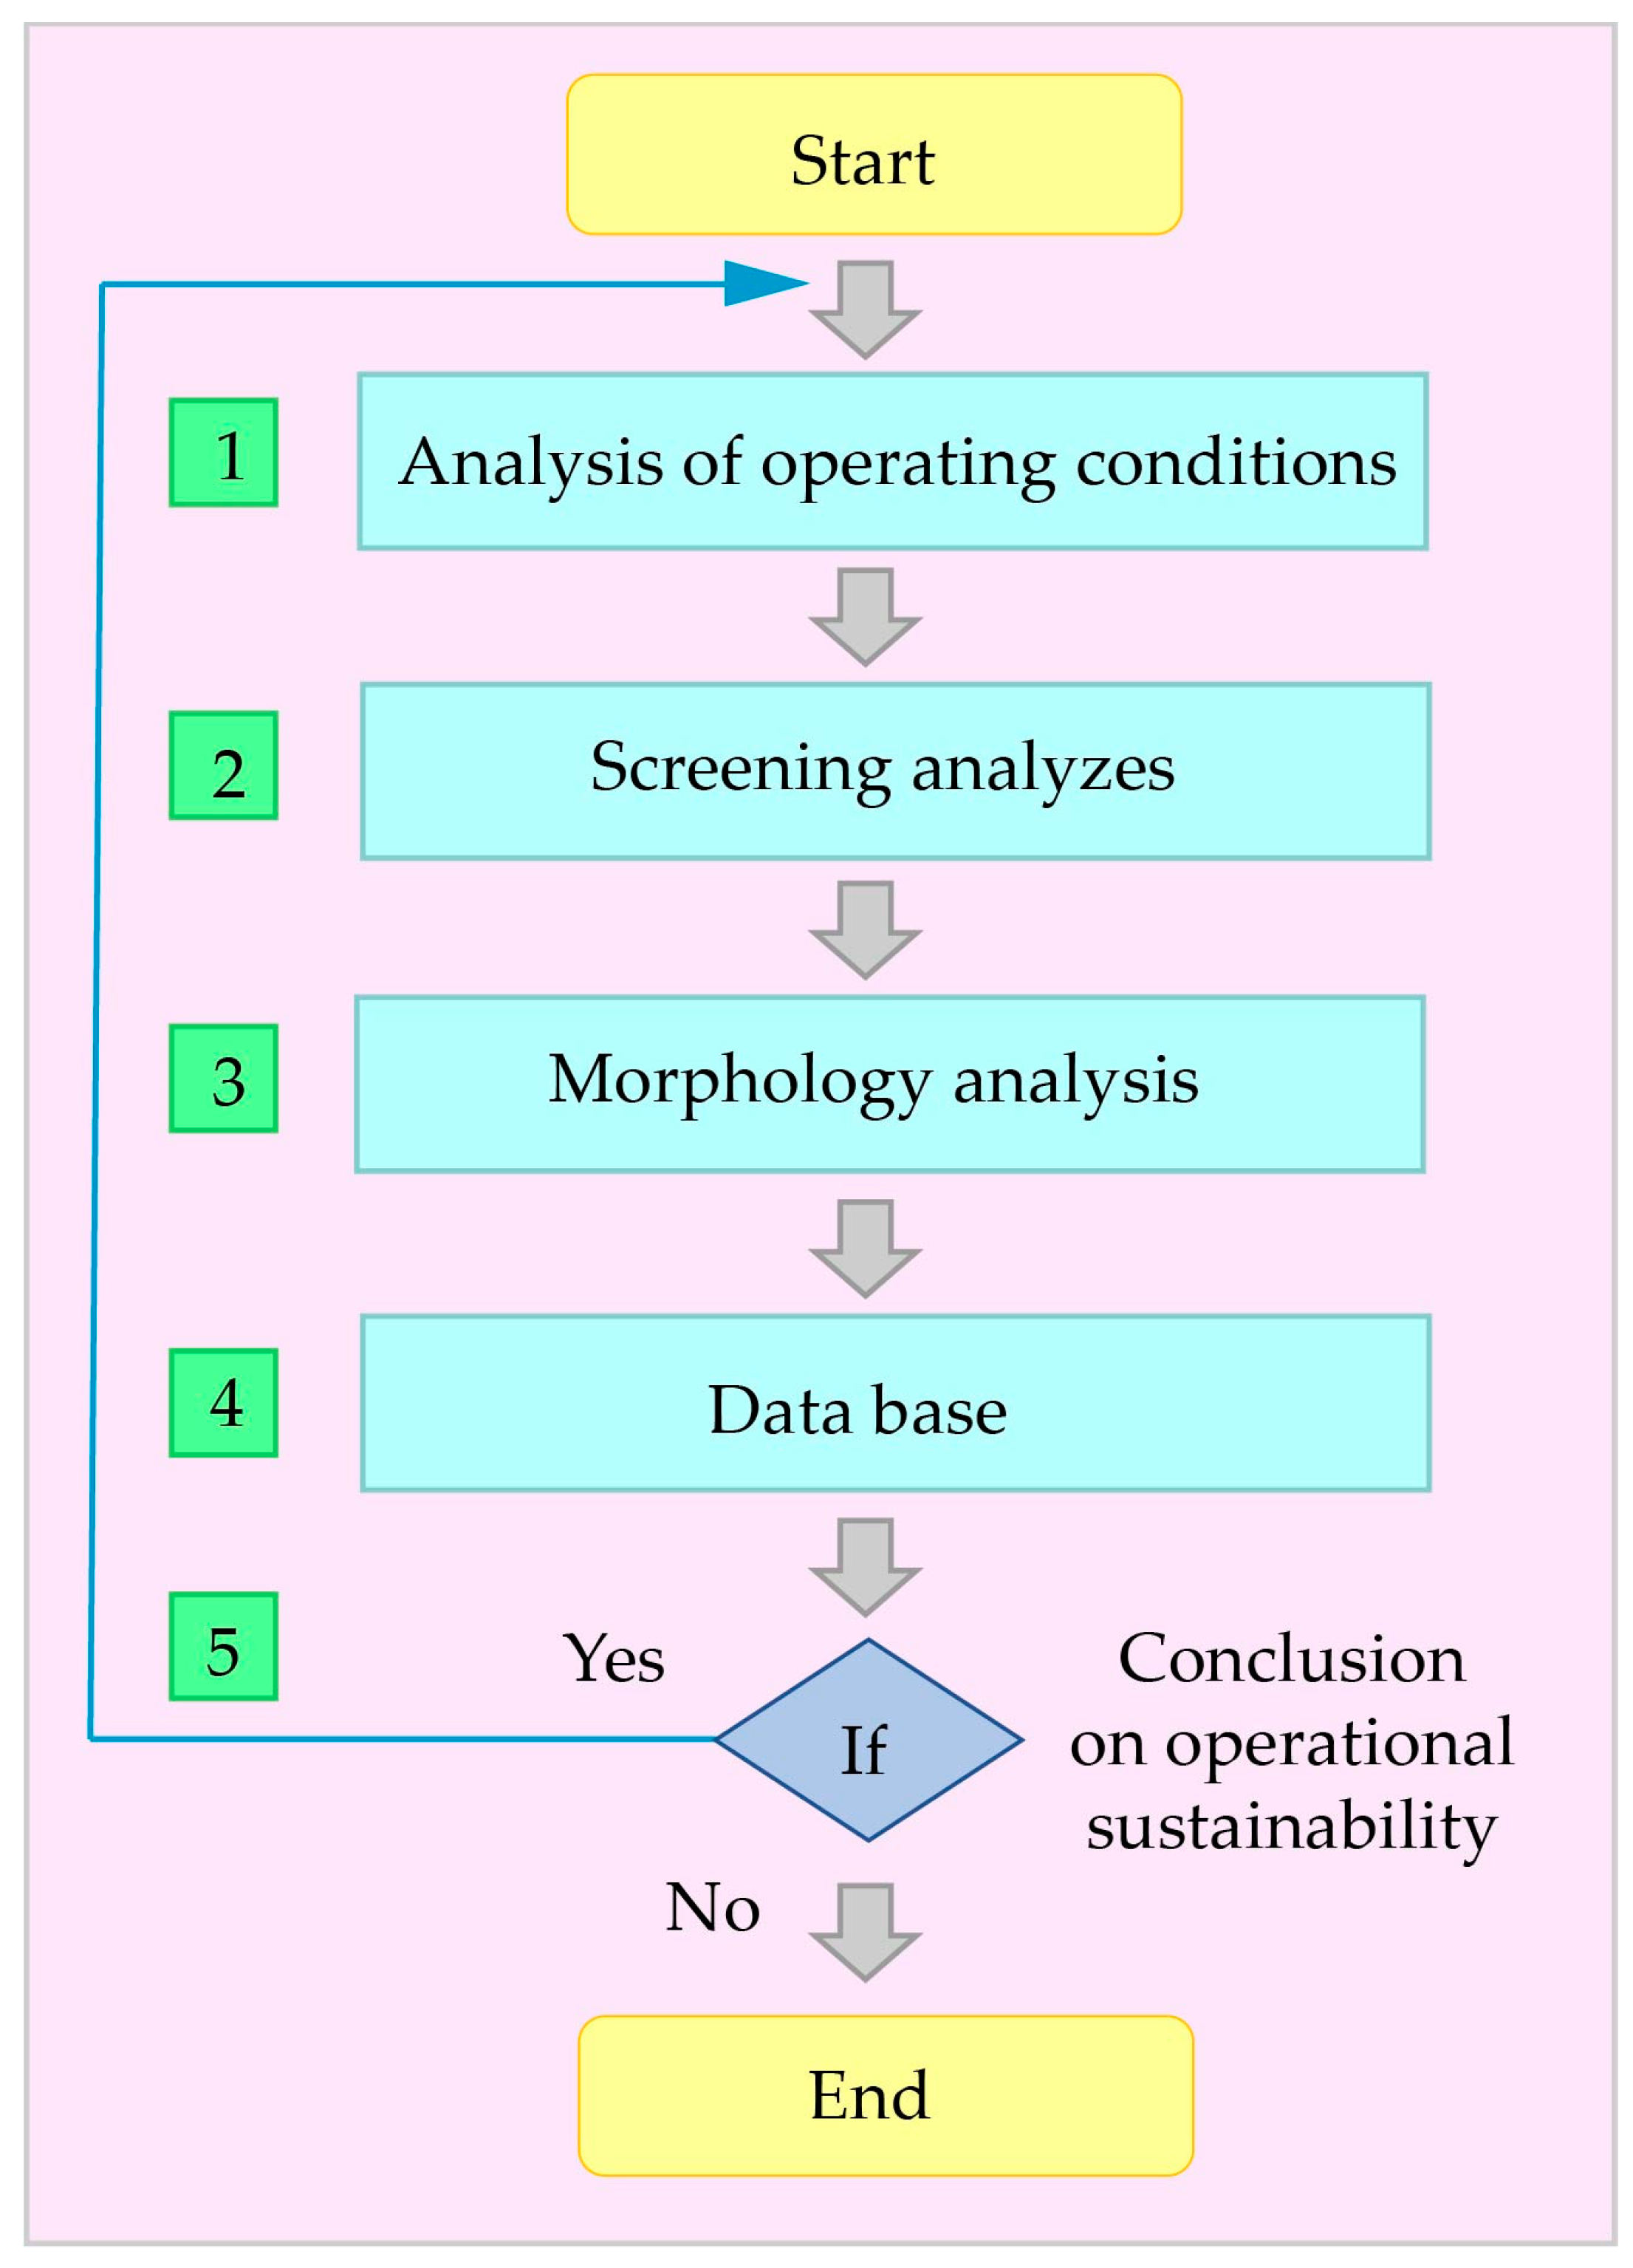
- A flowchart for CV-based wear particle analysis is presented. It includes steps such as analyzing operating conditions, conducting screening, assessing particle morphology, comparing results with a database, and determining operational stability.
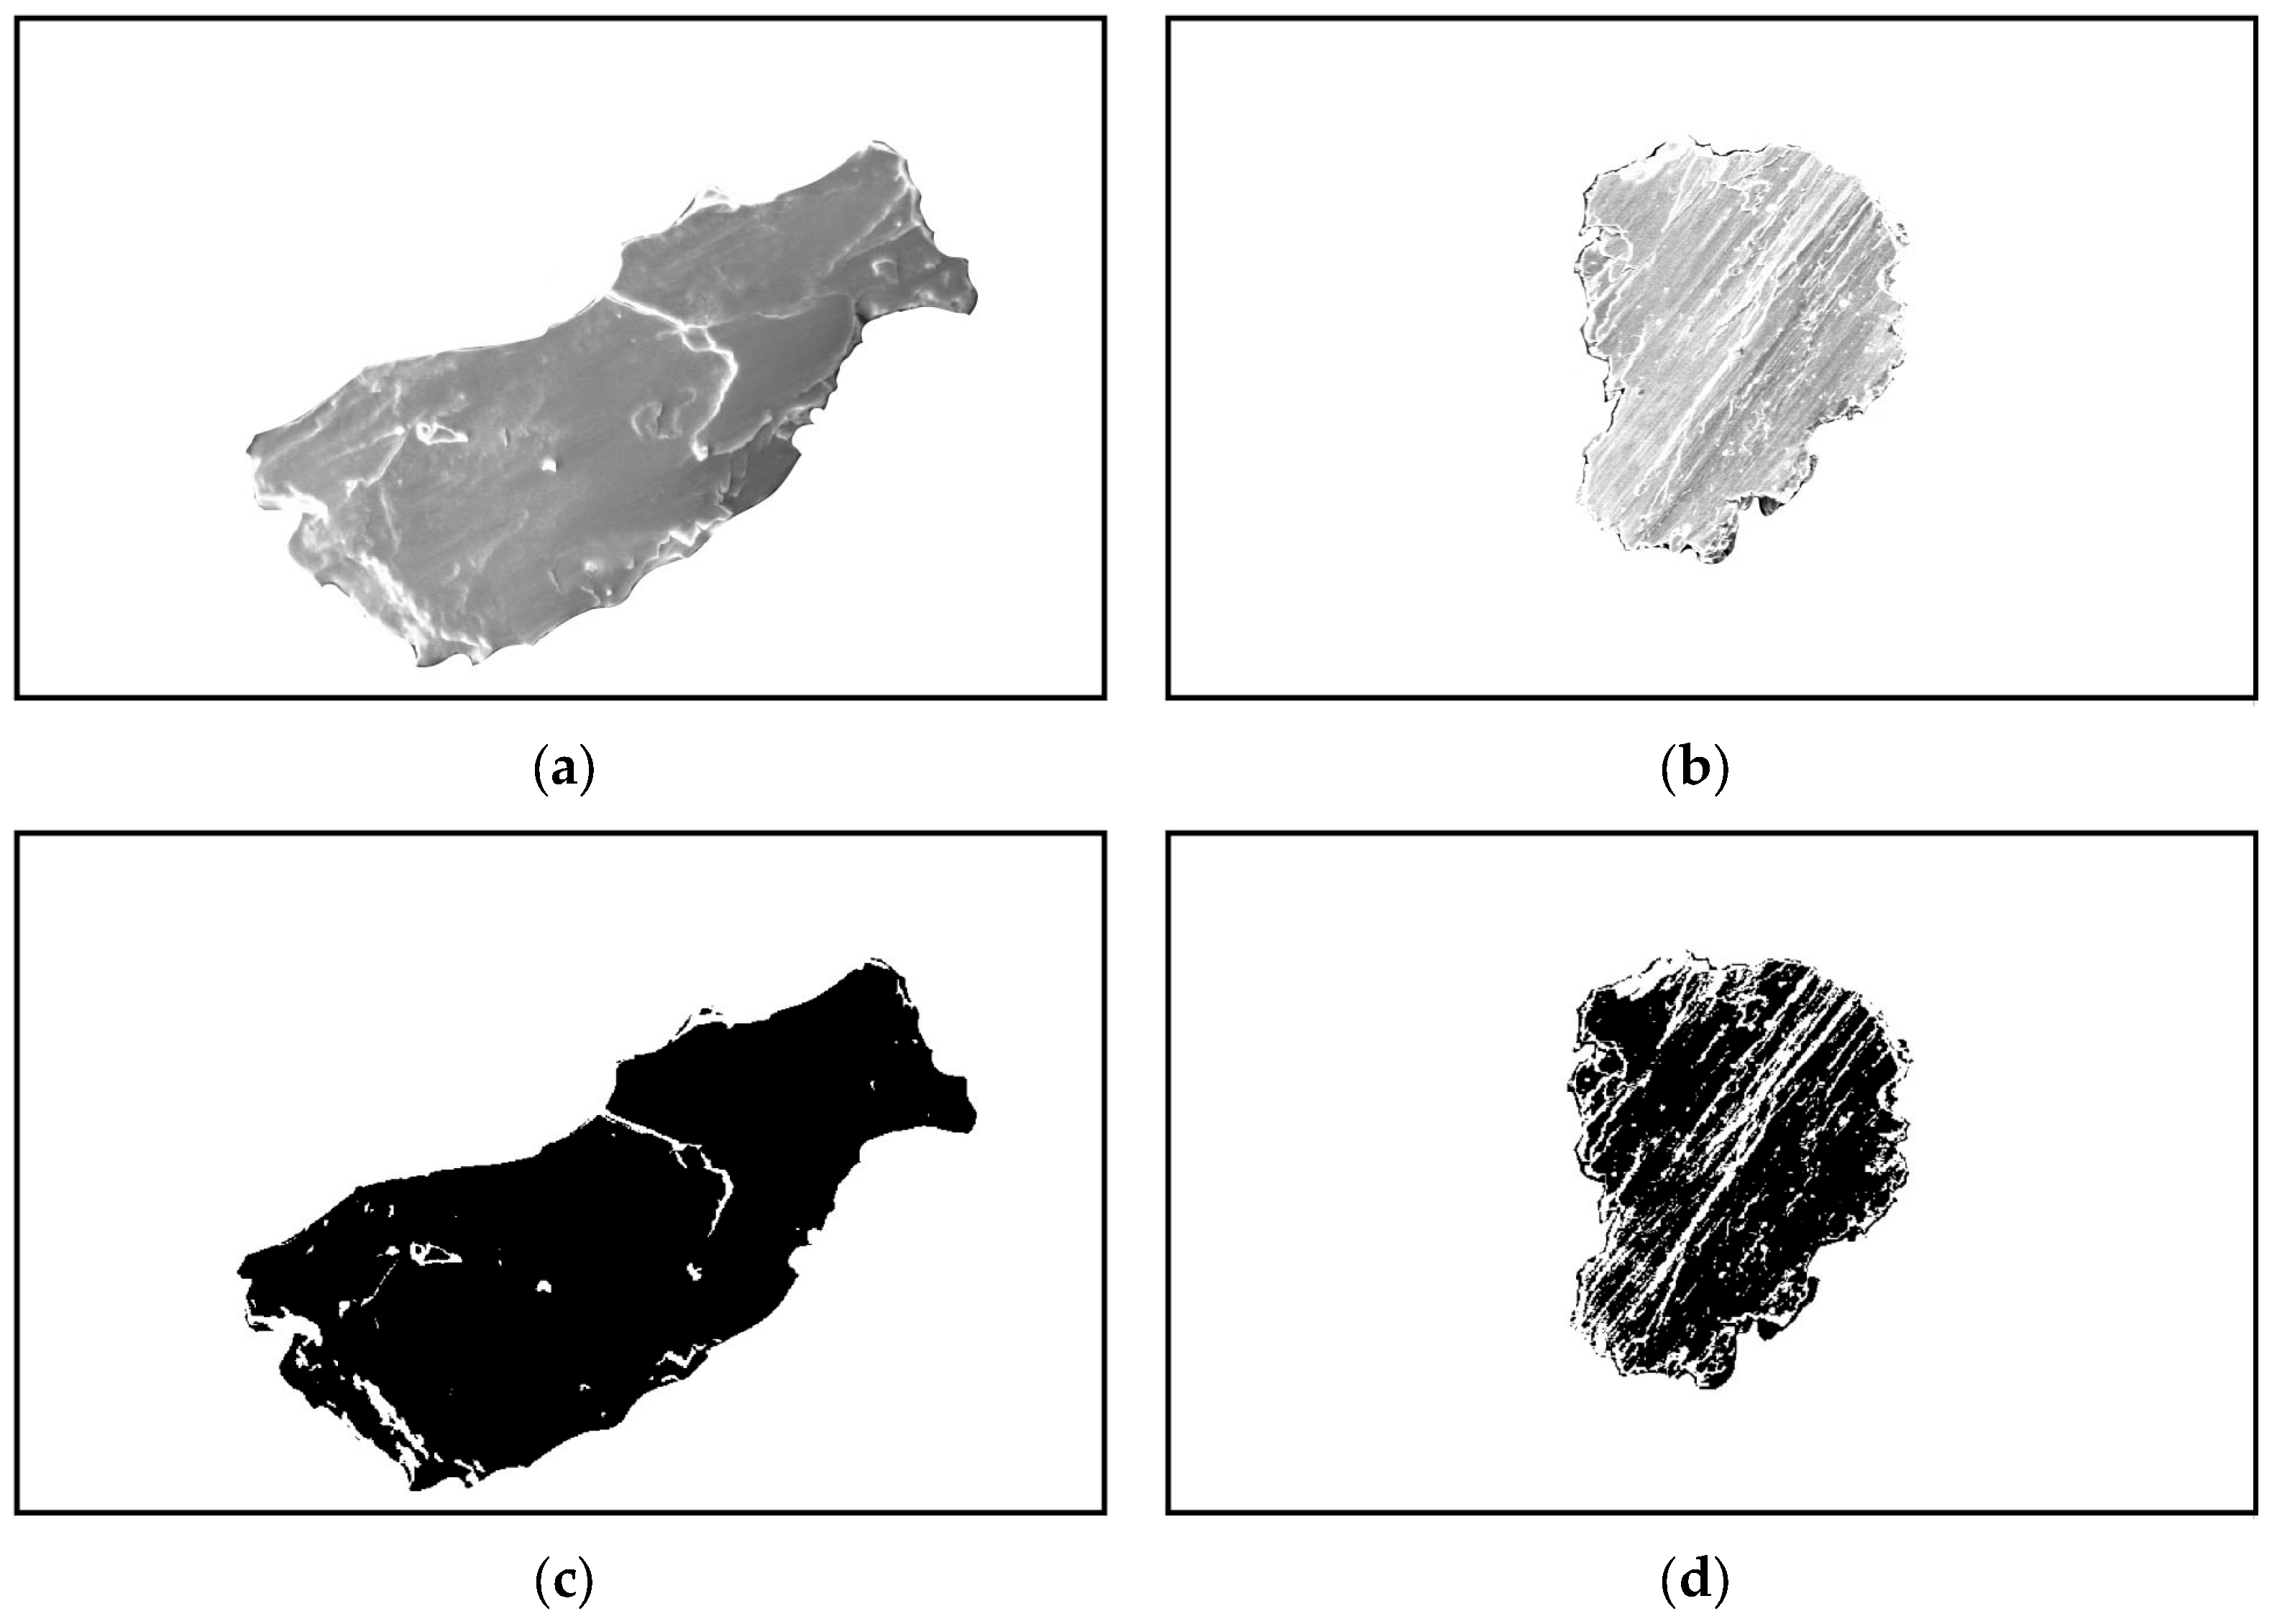
- A CV system and mathematical methods are used to analyze wear particle shapes after dry and wet wear. Techniques such as high reflectivity detection and threshold separation are applied.
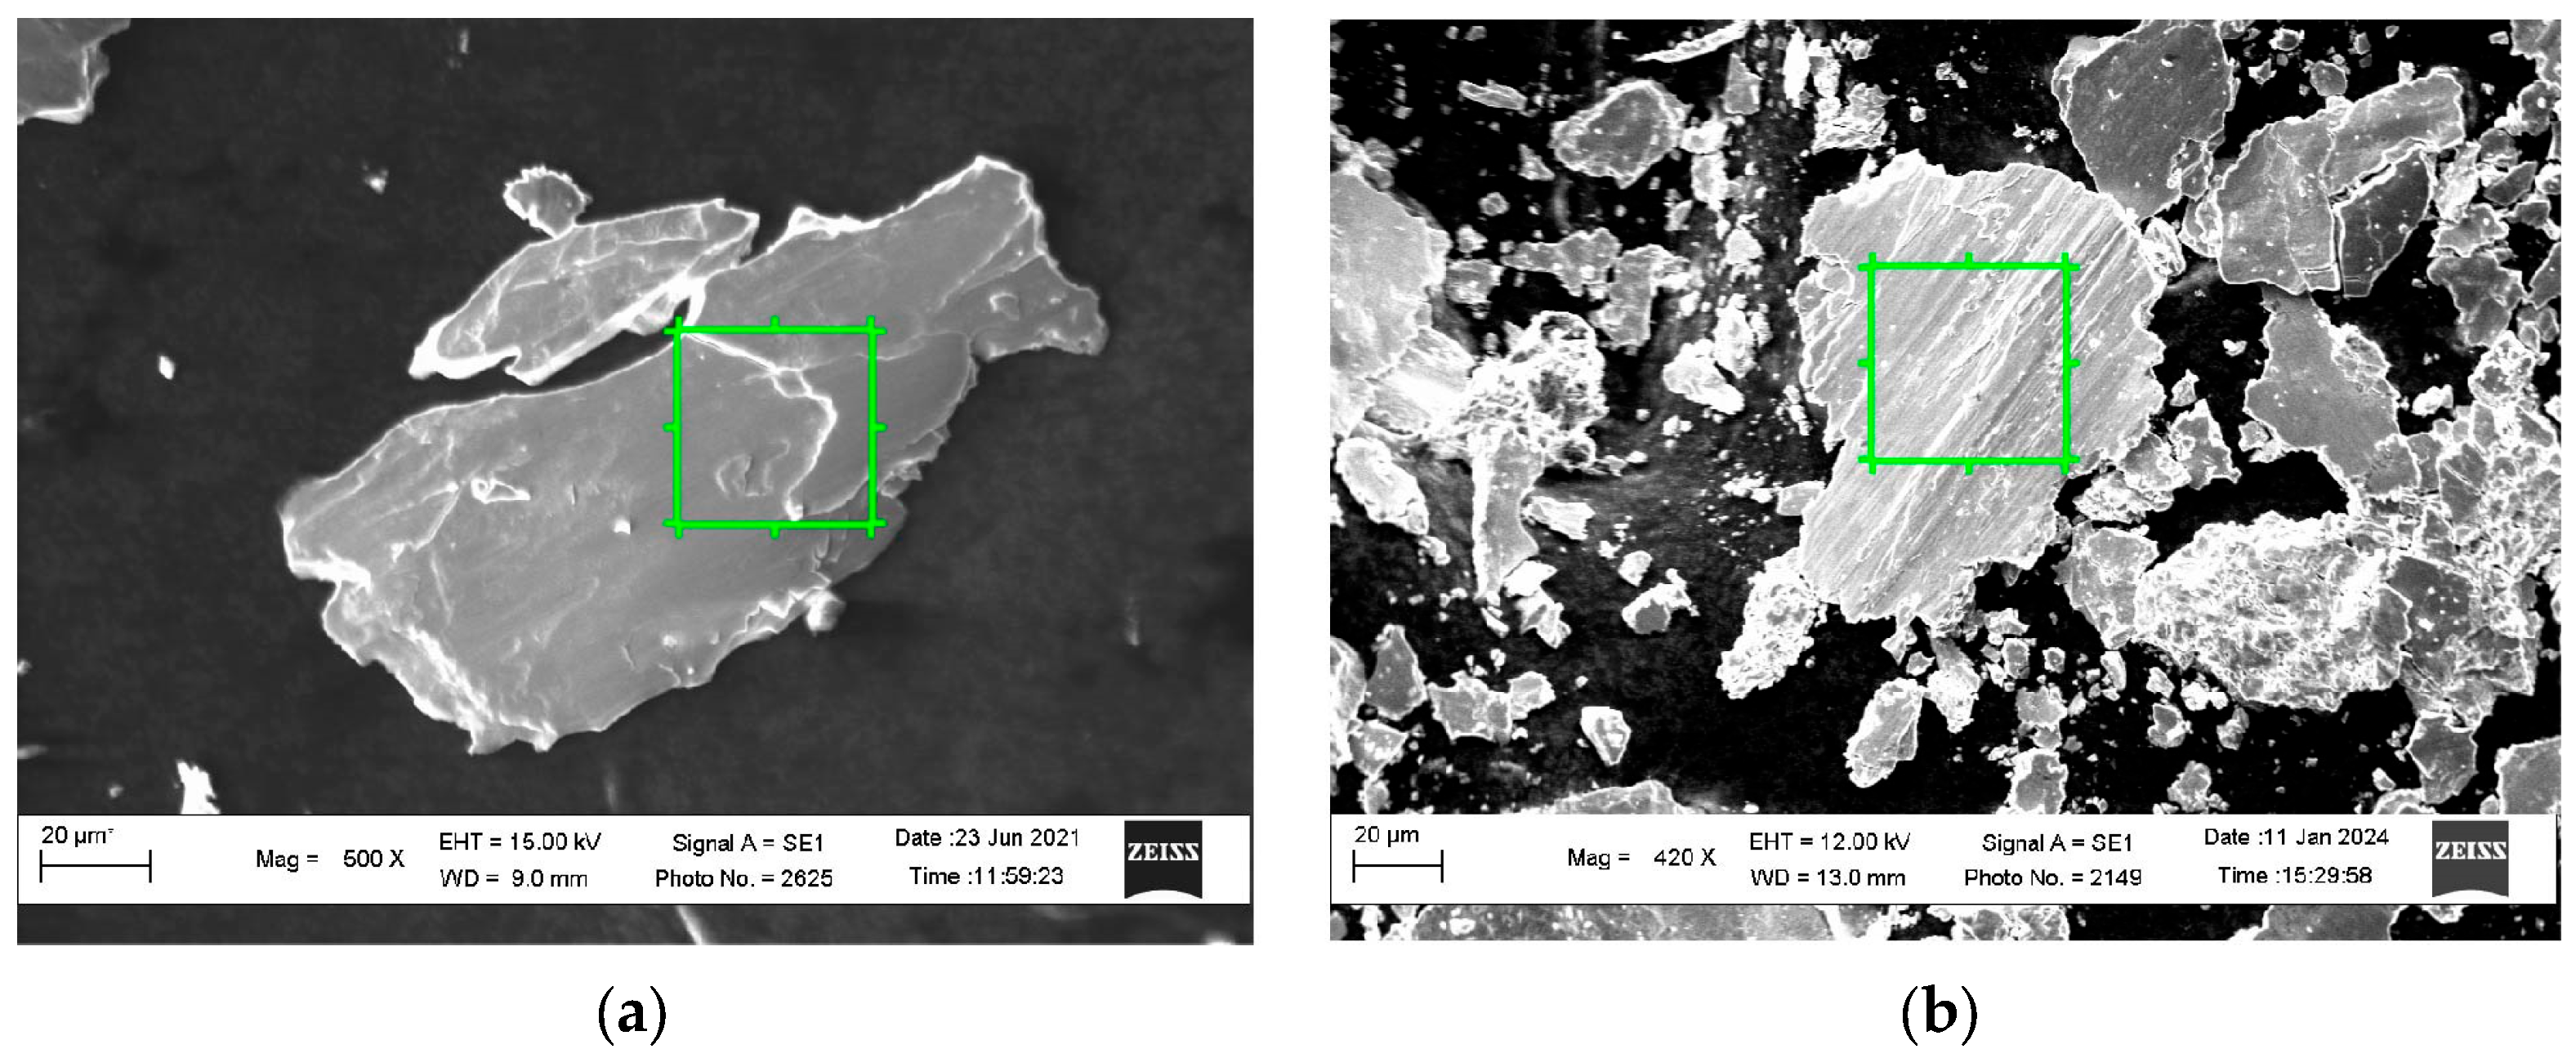
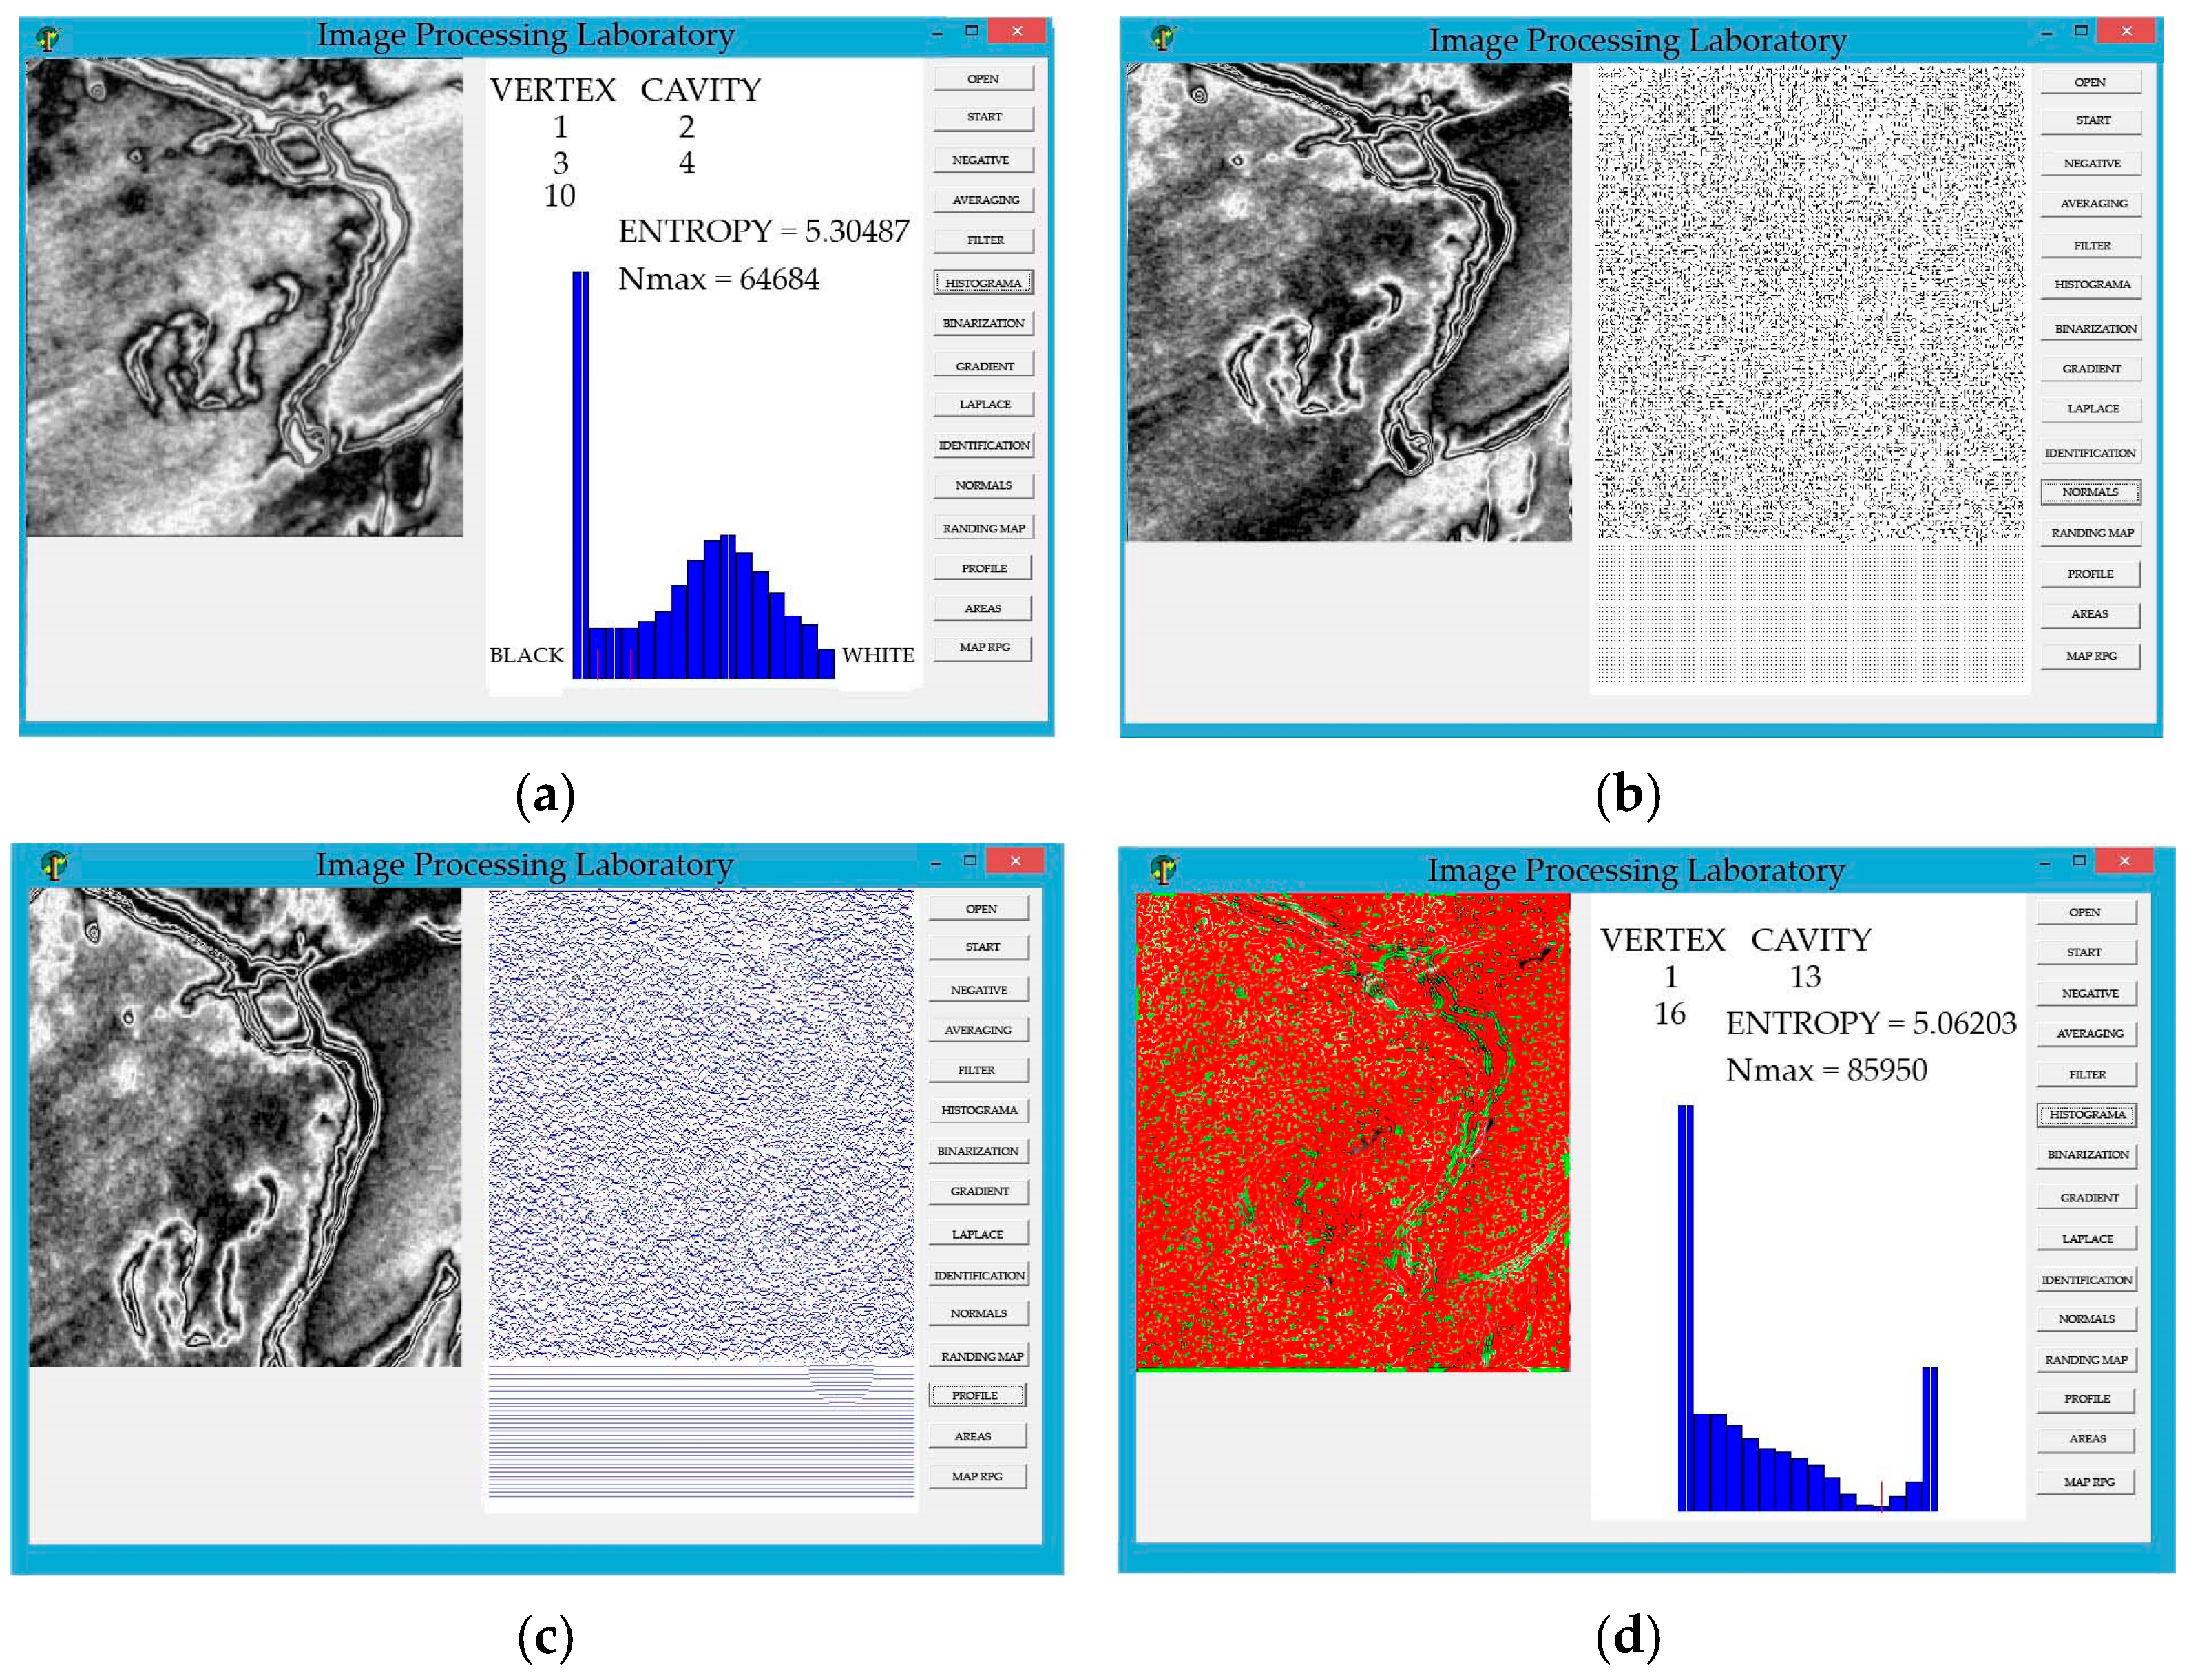
- An example study on high-nitrogen steel wear particles before and after flooding demonstrates software capabilities, including calculations for VERTEX, CAVITY, Nmax, and ENTROPY, describing surface morphology.
- We propose to continue scientific research on wear particles. The main paradigm is the use of the Python programming language. As for further research, the following can be distinguished: 1. Shape and distribution analysis. 2. Detecting defects. 3. Texture analysis. 4. Three-dimensional modeling. 5. Dynamic analysis. 6. Comparison with samples. 7. Semantic segmentation. 8. Integration with machine learning. 9. Modeling of the interaction with hydrogen.
- A framework for evaluating tribotechnical unit performance is proposed, using wear particle analysis and key metrics like the performance mode index and defect criteria.
- The CV methodology for analyzing wear particle surfaces is applicable to friction surfaces, corrosion products, and chips from manufacturing and repair processes, broadening its usability.
Author Contributions
Funding
Data Availability Statement
Acknowledgments
Conflicts of Interest
Nomenclature and Abbreviations
| CV | computer vision |
| WPs | wear particles |
| CP | computer program |
| H | hydrogen |
| GLCM | Gray-Level Co-occurrence Matrix; |
| LBPs | local binary patterns |
Appendix A
- from skimage import io, measure
- import matplotlib.pyplot as plt
- import pandas as pd
- # Uploading images
- image_path_1 = ‘/mnt/data/01.png’
- image_path_2 = ‘/mnt/data/02.png’
- image_1 = io.imread(image_path_1, as_gray=True)
- image_2 = io.imread(image_path_2, as_gray=True)
- # Image analysis function
- def analyze_image(image, title):
- # Image binarization (simple threshold)
- binary_image = image > image.mean()
- # Labeling binary images
- labeled_image = measure.label(binary_image)
- # Derivation of properties of markovaniye regions
- properties = measure.regionprops_table(
- labeled_image,
- properties=(‘area’, ‘perimeter’, ‘eccentricity’, ‘solidity’)
- )
- # Displaying a binary image
- plt.figure(figsize=(8, 6))
- plt.imshow(binary_image, cmap=‘gray’)
- plt.title(f’Binary Image: {title}’)
- plt.axis(‘off’)
- plt.show()
- return properties
- # Analyzing the first image
- properties_1 = analyze_image(image_1, “Image 1”)
- properties_2 = analyze_image(image_2, “Image 2”)
- # Convert results to a DataFrame for visualization
- df_1 = pd.DataFrame(properties_1)
- df_2 = pd.DataFrame(properties_2)
- # Displaying the results
- import ace_tools as tools
- tools.display_dataframe_to_user(name=“Analysis of Image 1”, dataframe=df_1)
- tools.display_dataframe_to_user(name=“Analysis of Image 2”, dataframe=df_2)
References
- Balyts’kyi, O.I.; Kolesnikov, V.O. Investigation of wear products of high-nitrogen manganese steels. Mater. Sci. 2009, 45, 576–581. [Google Scholar] [CrossRef]
- Balyts’kyi, O.I.; Kolesnikov, V.O. Investigation of the wear products of austenitic manganese cast irons. Mater. Sci. 2004, 40, 78–82. [Google Scholar] [CrossRef]
- Balyts’Kyi, O.I.; Kolesnikov, V.O.; Eliasz, J. Study of the wear resistance of high-nitrogen steels under dry sliding friction. Mater. Sci. 2013, 48, 642–646. [Google Scholar] [CrossRef]
- Balitskii, O.A.; Kolesnikov, V.O.; Balitskii, A.I. Wear resistance of hydrogenated high nitrogen steel at dry and solid state lubricants assist ant friction. Arch. Mater. Sci. Eng. 2019, 98, 57–67. [Google Scholar] [CrossRef]
- Balyts’kyi, O.I.; Kolesnikov, V.O.; Eliasz, Y.; Havrylyuk, M.R. Specific features of the fracture of hydrogenated high-nitrogen manganese steels under conditions of rolling friction. Mater. Sci. 2015, 50, 604–611. [Google Scholar] [CrossRef]
- Balitskii, A.I.; Syrotyuk, A.M.; Ivaskevich, L.M.; Balitskii, O.A.; Kochmanski, P.; Kolesnikov, V.O. Hydrogen accelerated nanopore nucleation, crack initiation and propagation in the Ni–Co superalloys. Int. J. Hydrogen Energy 2024, 82, 320–332. [Google Scholar] [CrossRef]
- Balitskii, O.; Kolesnikov, V. Identification of wear products in the automotive tribotechnical system using computer vision methods, artificial intelligence and Big Data. In Proceedings of the 2019 XIth International Scientific and Practical Conference on Electronics and Information Technologies (ELIT), Lviv, Ukraine, 16–18 September 2019; IEEE: Piscataway, NJ, USA, 2019; pp. 24–27. [Google Scholar] [CrossRef]
- Quintana, J.J.; Ferrer, M.A.; Diaz, M.; Feo, J.J.; Wolniakowski, A.; Miatliuk, K. Uniform vs. Lognormal Kinematics in Robots: Perceptual Preferences for Robotic Movements. Appl. Sci. 2022, 12, 12045. [Google Scholar] [CrossRef]
- Schlette, C.; Buch, A.G.; Hagelskjær, F.; Iturrate, I.; Kraft, D.; Kramberger, A.; Thulesen, T.N. Towards robot cell matrices for agile production—SDU Robotics’ assembly cell at the WRC. Adv. Robot. 2018, 34, 422–438. [Google Scholar] [CrossRef]
- Wolniakowski, A.; Trochimczuk, R.; Moulianitis, V.; Miatliuk, K. Kinematic Modeling of a Trepanation Surgical Robot System. Appl. Sci. 2023, 13, 9110. [Google Scholar] [CrossRef]
- Ellekilde, L.-P.; Wilm, J.; Nielsen, O.W.; Krogh, C.; Kristiansen, E.; Gunnarsson, G.G.; Stenvang, J.; Jakobsen, J.; Kristiansen, M.; Glud, J.A.; et al. Design of Automated Robotic System for Draping Prepreg Composite Fabrics. Robotica 2021, 39, 72–87. [Google Scholar] [CrossRef]
- Valsamos, C.; Miatliuk, K.; Wolniakowski, A.; Moulianitis, V.; Aspragathos, N. Optimal Kinematic Task Position Determination—Application and Experimental Verification for the UR-5 Manipulator. Appl. Sci. 2022, 12, 9352. [Google Scholar] [CrossRef]
- Cejnek, M.; Oswald, C. Machine vision object measurement in difficult industry environment. Proceedings 2019, 37, 26. [Google Scholar] [CrossRef]
- Buch, A.G.; Petersen, H.G.; Krüger, N. Local shape feature fusion for improved matching, pose estimation and 3D object recognition. SpringerPlus 2016, 5, 294. [Google Scholar] [CrossRef] [PubMed]
- Cardoso, B.; Silva, C.; Costa, J.; Ribeiro, B. Internet of Things Meets Computer Vision to Make an Intelligent Pest Monitoring Network. Appl. Sci. 2022, 12, 9397. [Google Scholar] [CrossRef]
- Fan, X.; Liu, T.; Bao, H.; Pan, W.; Liang, T.; Li, H. Long-Tail Instance Segmentation Based on Memory Bank and Confidence Calibration. Appl. Sci. 2022, 12, 9366. [Google Scholar] [CrossRef]
- Strelkova, T.A.; Lytyuga, A.P.; Kalmykov, A.S. Statistical characteristics of optical signals and images in machine vision sys-tems. In Examining Optoelectronics in Machine Vision and Applications in Industry 4.0; IGI Global: Hershey, PA, USA, 2021; pp. 134–162. [Google Scholar] [CrossRef]
- Javaid, M.; Haleem, A.; Singh, R.P.; Rab, S.; Suman, R. Exploring impact and features of machine vision for progressive Indus-try 4.0 culture. Sensors 2022, 3, 100132. [Google Scholar] [CrossRef]
- Miranda-Vega, J.E.; Rivera-Castillo, J.; Rivas-López, M.; Flores-Fuentes, W.; Sergiyenko, O.; Rodríguez-Quiñonez, J.C.; Her-nández-Balbuena, D. Reducing the optical noise of machine vision optical scanners for landslide monitoring. In Examining Op-toelectronics in Machine Vision and Applications in Industry 4.0.; IGI Global: Hershey, PA, USA, 2021; pp. 103–133. [Google Scholar] [CrossRef]
- Silva, R.L.; Rudek, M.; Szejka, A.L.; Junior, O.C. Machine vision systems for industrial quality control inspections. In Proceedings of the IFIP International Conference on Product Lifecycle Management, Turin, Italy, 2–4 July 2018; Springer: Cham, Switzerland, 2018; pp. 631–641. [Google Scholar] [CrossRef]
- Li, L.; Qiu, J.; Spratling, M. AROID: Improving Adversarial Robustness Through Online Instance-Wise Data Augmentation. Int. J. Comput. Vis. 2024, 1–22. [Google Scholar] [CrossRef]
- Graf, B.; Eckstein, J. Service Robots and Automation for the Disabled and Nursing Home Care. In Springer Handbook of Automation. Springer Handbooks; Nof, S.Y., Ed.; Springer: Cham, Switzerland, 2023; pp. 1331–1347. [Google Scholar] [CrossRef]
- Ryan, E.; Roshandelpoor, A.; Pollard, Z.; Goldfarb, J.L.; Vakili, P. Prospective on methods of design of experiments for limited data scenarios in materials design and engineering. MRS Commun. 2023, 13, 1087–1101. [Google Scholar] [CrossRef]
- Zou, L.; Cheng, H. Research on Wind Turbine Blade Surface Damage Identification Based on Improved Convolution Neural Network. Appl. Sci. 2022, 12, 9338. [Google Scholar] [CrossRef]
- Adeyeri, M.K.; Mpofu, K.; Olukorede, T.A. Integration of agent technology into manufacturing enterprise: A review and platform for Industry 4.0. In Proceedings of the 2015 International Conference on Industrial Engineering and Operations Management (IEOM), Dubai, United Arab Emirates, 3–5 March 2015; IEEE: Piscataway, NJ, USA, 2015; pp. 1–10. [Google Scholar] [CrossRef]
- Rai, R.; Tiwari, M.K.; Ivanov, D.; Dolgui, A. Machine learning in manufacturing and industry 4.0 Applications. Int. J. Prod. Res. 2021, 59, 4773–4778. [Google Scholar] [CrossRef]
- Varshney, A.; Garg, N.; Nagla, K.S.; Nair, T.S.; Jaiswal, S.K.; Yadav, S.; Aswal, D.K. Challenges in sensors technology for industry 4.0 for futuristic metrological applications. MAPAN 2021, 36, 215–226. [Google Scholar] [CrossRef]
- Moreno, A.; Velez, G.; Ardanza, A.; Barandiaran, I.; de Infante, Á.R.; Chopitea, R. Virtualisation process of a sheet metal punching machine within the Industry 4.0 Vision. Int. J. Interact. Des. Manuf. 2017, 11, 365–373. [Google Scholar] [CrossRef]
- Oztemel, E.; Gursev, S. Literature review of Industry 4.0 and related technologies. J. Intell. Manuf. 2020, 31, 127–182. [Google Scholar] [CrossRef]
- Barata, J.; Kayser, I. Industry 5.0—Past, Present, and Near Future. Procedia Comput. Sci. 2023, 219, 778–788. [Google Scholar] [CrossRef]
- Ghobakhloo, M.; Iranmanesh, M.; Tseng, M.L.; Grybauskas, A.; Stefanini, A.; Amran, A. Behind the definition of Industry 5.0: A systematic review of technologies, principles, components, and values. J. Ind. Prod. Eng. 2023, 40, 432–447. [Google Scholar] [CrossRef]
- Tzampazaki, M.; Zografos, C.; Vrochidou, E.; Papakostas, G.A. Machine Vision—Moving from Industry 4.0 to Industry 5.0. Appl. Sci. 2024, 14, 1471. [Google Scholar] [CrossRef]
- Valette, E.; El-Haouzi, H.B.; Demesure, G. Industry 5.0 and its technologies: A systematic literature review upon the human place into IoT- and CPS-based industrial systems. Comput. Ind. Eng. 2023, 184, 109426. [Google Scholar] [CrossRef]
- Demir, K.A.; Döven, G.; Sezen, B. Industry 5.0 and Human-Robot Co-Working. Procedia Comput. Sci. 2019, 158, 688–695. [Google Scholar] [CrossRef]
- Takazaki, D.; Tsuchiyama, T.; Komoda, R.; Dadfarnia, M.; Somerday, B.P.; Sofronis, P.; Kubota, M. Effect of Hydrogen on Creep Properties of SUS304 Austenitic Stainless Steel. Corrosion 2021, 77, 256–265. [Google Scholar] [CrossRef]
- Ogawa, Y.; Hosoi, H.; Tsuzaki, K.; Redarce, T.; Takakuwa, O.; Matsunaga, H. Hydrogen, as an alloying element, enables a greater strength-ductility balance in an Fe-Cr-Ni-based, stable austenitic stainless steel. Acta Mater. 2020, 199, 181–192. [Google Scholar] [CrossRef]
- Mytsyk, B.; Ivanytsky, Y.; Hembara, O.; Kost, Y.; Shtayura, S.; Sakharuk, O. Effects of hydrogen influence on strained steel 1020. Int. J. Hydrogen Energy 2020, 45, 10199–10208. [Google Scholar] [CrossRef]
- Dmytrakh, I.M.; Leshchak, R.L.; Syrotyuk, A.M.; Barna, R.A. Effect of hydrogen concentration on fatigue crack growth behaviour in pipeline steel. Int. J. Hydrogen Energy 2017, 42, 6401–6408. [Google Scholar] [CrossRef]
- Rao, G.S.; Seifert, H.-P.; Ritter, S.; Spätig, P.; Que, Z. Effect of hydrogen on tensile behavior of low alloy steel in the regime of dynamic strain ageing. Procedia Struct. Integr. 2016, 2, 3399–3406. [Google Scholar] [CrossRef]
- Sun, Y.; Chen, J.; Liu, J. Effect of hydrogen on ductility of high strength quenched and tempered (QT) Cr–Ni–Mo steels. Mater. Sci. Eng. A 2015, 625, 89–97. [Google Scholar] [CrossRef]
- Liu, Y.; Wang, M.; Liu, G. Effect of hydrogen on ductility of high strength 3Ni–Cr–Mo–V steels. Mater. Sci. Eng. A 2014, 594, 40–47. [Google Scholar] [CrossRef]
- Ostash, O.P.; Vytvyts’kyi, V.I. Duality of the action of hydrogen on the mechanical behavior of steels and structural optimization of their hydrogen resistance. Mater Sci. 2012, 47, 421–437. [Google Scholar] [CrossRef]
- Khatib Zadeh Davani, R.; Mohtadi-Bonab, M.A.; Yadav, S.; Entezari, E.; Cabezas, J.F.A.; Szpunar, J. Effect of Quench Tempering on Hydrogen Embrittlement and Corrosion Behavior of X100 Pipeline Steel. Metals 2023, 13, 841. [Google Scholar] [CrossRef]
- Martin, M.L.; Connolly, M.J.; DelRio, F.W.; Slifka, A.J. Hydrogen embrittlement in ferritic steels. Appl. Phys. Rev. 2020, 7, 12851. [Google Scholar] [CrossRef]
- Fan, Y.; Ma, C.; Li, S.; Ding, W.; Zhang, H. A review on the effect of microstructure on hydrogen induced cracking behaviour in pipeline and pressure vessel steels. In Proceedings of the 2020 6th International Forum on Engineering Materials and Manufacturing Technology (IFEMMT) 2020, Jilin, China, 17–19 July 2020; IOP Publishing: Bristol, UK, 2020. Available online: https://iopscience.iop.org/article/10.1088/1742-6596/1635/1/012055 (accessed on 17 October 2024).
- Sobola, D.; Dallaev, R. Exploring Hydrogen Embrittlement: Mechanisms, Consequences, and Advances in Metal Science. Energies 2024, 17, 2972. [Google Scholar] [CrossRef]
- Barrera, O.; Bombac, D.; Chen, Y.; Daff, T.D.; Galindo-Nava, E.; Gong, P.; Haley, D.; Horton, R.; Katzarov, I.; Kermode, J.R.; et al. Understanding and mitigating hydrogen embrittlement of steels: A review of experimental, modelling and design progress from atomistic to continuum. J. Mater. Sci. 2018, 53, 6251–6290. [Google Scholar] [CrossRef]
- Mohtadi-Bonab, M.A.; Szpunar, J.A.; Basu, R.; Eskandari, M. The mechanism of failure by hydrogen induced cracking in an acidic environment for API 5L X70 pipeline steel. Int. J. Hydrogen Energy 2015, 40, 1096–1107. [Google Scholar] [CrossRef]
- Dmytrakh, I.M.; Leshchak, R.L.; Syrotyuk, A.M. Effect of hydrogen concentration on strain behaviour of pipeline steel. Int. J. Hydrogen Energy 2015, 40, 4011–4018. [Google Scholar] [CrossRef]
- Bae, K.O.; Nguyen, T.T.; Park, J.; Park, J.S.; Baek, U.B. Temperature dependency of hydrogen-related impact energy degradation of type 304 austenitic stainless steel. J. Mech. Sci. Technol. 2023, 37, 2891–2901. [Google Scholar] [CrossRef]
- Pradhan, A.; Vishwakarma, M.; Dwivedi, S.K. A review: The impact of hydrogen embrittlement on the fatigue strength of high strength steel. Mater. Today Proc. 2020, 26, 3015–3019. [Google Scholar] [CrossRef]
- Hadi, M.S.; Saud, S.N.; Hamzah, E.; Mamat, M.F. Hydrogen embrittlement of 316L stainless steels exposed in 1.0M hydrochloric acid solution. Ann. Chim. Sci. Matériaux 2019, 43, 369–375. [Google Scholar] [CrossRef]
- Xing, X.; Pang, Z.; Hao Zhang, H.; Liu, J.; Cui, G. Study of temperature effect on hydrogen embrittlement in X70 pipeline steel. Corros. Sci. 2024, 230, 111939. [Google Scholar] [CrossRef]
- Sey, E.; Farhat, Z.N. Evaluating the Effect of Hydrogen on the Tensile Properties of Cold-Finished Mild Steel. Crystals 2024, 14, 529. [Google Scholar] [CrossRef]
- Toribio, J. Hydrogen embrittlement of pearlitic steel in the presence of notches: A kinematic fracture criterion based on the notch tip strain rate. Procedia Struct. Integr. 2022, 41, 736–743. [Google Scholar] [CrossRef]
- Badia, E.; Navajas, J.; Sala, R.; Paltrinieri, N.; Sato, H. Analysis of Hydrogen Value Chain Events: Implications for Hydrogen Refueling Stations’ Safety. Safety 2024, 10, 44. [Google Scholar] [CrossRef]
- Calabrese, M.; Portarapillo, M.; Di Nardo, A.; Venezia, V.; Turco, M.; Luciani, G.; Di Benedetto, A. Hydrogen Safety Challenges: A Comprehensive Review on Production, Storage, Transport, Utilization, and CFD-Based Consequence and Risk Assessment. Energies 2024, 17, 1350. [Google Scholar] [CrossRef]
- Sinay, J.; Brestovič, T.; Markovič, J.; Glatz, J.; Gorzás, M.; Vargová, M. Analysis of the Risks of Hydrogen Leakage from Hydrogen-Powered Cars and Their Possible Impact on Automotive Market Share Increase. Appl. Sci. 2020, 10, 4292. [Google Scholar] [CrossRef]
- Li, Q.; Ghadiani, H.; Jalilvand, V.; Alam, T.; Farhat, Z.; Islam, M.A. Hydrogen Impact: A Review on Diffusibility, Embrittlement Mechanisms, and Characterization. Materials 2024, 17, 965. [Google Scholar] [CrossRef] [PubMed]
- Chaves, I.A.; Richardson, P.J.; Lynch, S.; Allen, J.A. Impact of the Delay Period between Electrochemical Hydrogen Charging and Tensile Testing on the Mechanical Properties of Mild Steel. Corros. Mater. Degrad. 2024, 5, 265–275. [Google Scholar] [CrossRef]
- Ilyushechkin, A.; Schoeman, L.; Carter, L.; Hla, S.S. Material Challenges and Hydrogen Embrittlement Assessment for Hydrogen Utilisation in Industrial Scale. Hydrogen 2023, 4, 599–619. [Google Scholar] [CrossRef]
- Ahad, M.T.; Bhuiyan, M.M.H.; Sakib, A.N.; Becerril Corral, A.; Siddique, Z. An Overview of Challenges for the Future of Hydrogen. Materials 2023, 16, 6680. [Google Scholar] [CrossRef]
- Balitskii, A.I.; Havrilyuk, M.R.; Balitska, V.O.; Kolesnikov, V.O.; Ivaskevych, L.M. Increasing turbine hall safety by using fire-resistant, hydrogen-containing lubricant cooling liquid for rotor steel mechanical treatment. Energies 2023, 16, 535. [Google Scholar] [CrossRef]
- Bhutta, M.U.; Najeeb, M.H.; Abdullah, M.U.; Shah, S.R.; Khurram, M.; Mufti, R.A.; Ogawa, K.; Aslam, J.; Zahid, R.; Ali, M.A.; et al. Experimental Investigation of Engine Valve Train Friction Considering Effects of Operating Conditions and WPC Surface Treatment. Materials 2023, 16, 3431. [Google Scholar] [CrossRef]
- Sun, J.; Bai, L.; Guo, F.; Khan, Z.A. Experimental Study on the Effect of Micro-Texture on EHL Point-Contact Film Thickness Subject to Sliding Conditions. Materials 2022, 15, 7926. [Google Scholar] [CrossRef]
- Li, C.-D.; Wang, J.-S.; Han, X.; Du, F.-M.; Liu, G.-S.; Lin, R.-J. Wear Performance of Circular Shim against Cam in Engine Bench Test. Materials 2022, 15, 6293. [Google Scholar] [CrossRef]
- Żurawski, K.; Żurek, P.; Kawalec, A.; Bazan, A.; Olko, A. Modeling of Surface Topography after Milling with a Lens-Shaped End-Mill, Considering Runout. Materials 2022, 15, 1188. [Google Scholar] [CrossRef]
- Bai, L.; Sun, J.; Zhang, P.; Khan, Z.A. Friction Behavior of a Textured Surface against Several Materials under Dry and Lubricated Conditions. Materials 2021, 14, 5228. [Google Scholar] [CrossRef] [PubMed]
- Sawczuk, W.; Cañás, A.M.R.; Ulbrich, D.; Kowalczyk, J. Modeling the Average and Instantaneous Friction Coefficient of a Disc Brake on the Basis of Bench Tests. Materials 2021, 14, 4766. [Google Scholar] [CrossRef] [PubMed]
- Liu, Y.; Zhang, H.; Dong, G. A Design of Partial Textured Surface on Gear Washers for Reducing Friction and Wear under Low Speed and Heavy Load Conditions. Materials 2021, 14, 4666. [Google Scholar] [CrossRef] [PubMed]
- Wos, S.; Koszela, W.; Pawlus, P. Selected Methods and Applications of Anti-Friction and Anti-Wear Surface Texturing. Materials 2021, 14, 3227. [Google Scholar] [CrossRef]
- Wang, W.; Zhao, W.; Liu, Y.; Zhang, H.; Hua, M.; Dong, G.; Tam, H.-Y.; Chin, K.-S. A Pocket-Textured Surface for Improving the Tribological Properties of Point Contact under Starved Lubrication. Materials 2021, 14, 1789. [Google Scholar] [CrossRef]
- Lenart, A.; Pawlus, P.; Dzierwa, A.; Wos, S.; Reizer, R. The Effect of Surface Texture on Lubricated Fretting. Materials 2020, 13, 4886. [Google Scholar] [CrossRef]
- Ran, H.; Liu, D.; Wang, S. A Numerical Wear Simulation Method of Reciprocating Seals with a Textured Rod. Materials 2020, 13, 4458. [Google Scholar] [CrossRef]
- Qi, Y.; Sun, B.; Zhang, Y.; Gao, G.; Zhang, P.; Zheng, X. Study of Tribological Properties and Evolution of Morphological Characteristics of Transfer Films in PTFE Composites Synergistically Reinforced with Nano-ZrO2 and PEEK Particles. Polymers 2023, 15, 3626. [Google Scholar] [CrossRef]
- Liu, P.; Liu, J.; Gao, S.; Wang, Y.; Zheng, H.; Zhen, M.; Zhao, F.; Liu, Z.; Ou, C.; Zhuang, R. Calibration of Sliding Friction Coefficient in DEM between Different Particles by Experiment. Appl. Sci. 2023, 13, 11883. [Google Scholar] [CrossRef]
- Li, Q.; Heß, M. Experimental Investigation of Frictional Resistance in Sliding Contact between Undulating Surfaces and Third-Body Particles. Machines 2024, 12, 150. [Google Scholar] [CrossRef]
- Hagino, H.; Iwata, A.; Okuda, T. Iron Oxide and Hydroxide Speciation in Emissions of Brake Wear Particles from Different Friction Materials Using an X-ray Absorption Fine Structure. Atmosphere 2024, 15, 49. [Google Scholar] [CrossRef]
- Zhao, Y.; Yang, G.; Wang, Z.; Yuan, S. Research on the Effect of Particle Size on the Interface Friction between Geogrid Reinforcement and Soil. Sustainability 2022, 14, 15443. [Google Scholar] [CrossRef]
- Zhang, X.; Cao, Y.; Xue, B.; Hua, G.; Zhang, H. Method for Identifying Materials and Sizes of Particles Based on Neural Network. J. Mar. Sci. Eng. 2023, 11, 541. [Google Scholar] [CrossRef]
- Yin, S.; Peng, T.; Yang, C.; Yang, C.; Gui, W.; Liu, L. Dynamic-Projection-Integrated Particle-Filtering-Based Identification of Friction Characteristic Curve for Train Wheelset on Slipping Fault Condition. Lubricants 2024, 12, 38. [Google Scholar] [CrossRef]
- Di Maio, C.; Nunziati, G.; Mecocci, A. Deep-Learning-Based Action and Trajectory Analysis for Museum Security Videos. Electronics 2024, 13, 1194. [Google Scholar] [CrossRef]
- Chen, Q.; Xiong, Q.; Huang, H.; Tang, S.; Liu, Z. Research on the Construction of an Efficient and Lightweight Online Detection Method for Tiny Surface Defects through Model Compression and Knowledge Distillation. Electronics 2024, 13, 253. [Google Scholar] [CrossRef]
- Avianto, D.; Harjoko, A.; Afiahayati. CNN-Based Classification for Highly Similar Vehicle Model Using Multi-Task Learning. J. Imaging 2022, 8, 293. [Google Scholar] [CrossRef]
- Patel, K.; Bhatt, C.; Mazzeo, P.L. Deep Learning-Based Automatic Detection of Ships: An Experimental Study Using Satellite Images. J. Imaging 2022, 8, 182. [Google Scholar] [CrossRef]
- Sommerhoff, H.; Kolb, A. A Generic Framework for Depth Reconstruction Enhancement. J. Imaging 2022, 8, 138. [Google Scholar] [CrossRef]
- Yerram, V.; Takeshita, H.; Iwahori, Y.; Hayashi, Y.; Bhuyan, M.K.; Fukui, S.; Kijsirikul, B.; Wang, A. Extraction and Calculation of Roadway Area from Satellite Images Using Improved Deep Learning Model and Post-Processing. J. Imaging 2022, 8, 124. [Google Scholar] [CrossRef]
- Hu, G.; Dixit, C.; Qi, G. Discriminative Shape Feature Pooling in Deep Neural Networks. J. Imaging 2022, 8, 118. [Google Scholar] [CrossRef] [PubMed]
- El Shair, Z.; Rawashdeh, S.A. High-Temporal-Resolution Object Detection and Tracking Using Images and Events. J. Imaging 2022, 8, 210. [Google Scholar] [CrossRef] [PubMed]
- Gao, M.; Zou, G.; Li, Y.; Guo, X. Recent Advances in Computer Vision: Technologies and Applications. Electronics 2024, 13, 2734. [Google Scholar] [CrossRef]
- Wang, J.-Y.; Liu, S.-K.; Guo, S.-C.; Jiang, C.-Y.; Zheng, W.-M. PCNet: Leveraging Prototype Complementarity to Improve Prototype Affinity for Few-Shot Segmentation. Electronics 2024, 13, 142. [Google Scholar] [CrossRef]
- Yu, Q.; Zhu, G. Digital Restoration and 3D Virtual Space Display of Hakka Cardigan Based on Optimization of Numerical Algorithm. Electronics 2023, 12, 4190. [Google Scholar] [CrossRef]
- Available online: http://base.uipv.org/searchINV/search.php?action=viewdetails&IdClaim=225530 (accessed on 17 October 2024).
- Gonsales, R.S.; Woods, R.; Eddins, S. Digital Image Processing using MATLAB; Pearson Education: London, UK, 2004; p. 620. ISBN 8177588982, 9788177588989. Available online: https://www.cin.ufpe.br/~sbm/DEN/Digital%20Image%20Processing%20Using%20Matlab%20(Gonzalez).pdf (accessed on 17 October 2024).
- Forsyth, D.; Ponce, J. Computer Vision: A Modern Approach, 2nd ed.; Prentice Hall: Hoboken, NJ, USA, 2011. [Google Scholar]
- Horn, B.K.P. Robot Vision; MIT Press: Cambridge, MS, USA; McGraw-Hill: New York City, NY, USA, 1986; p. 509. ISBN 9780262537377. [Google Scholar]
- Ikeuchi, K.; Horn, B.K.P. Numerical shape from shading and occluding boundaries. Artif. Intell. 1981, 17, 141–184. [Google Scholar] [CrossRef]
- Kolesnikov, V.; Balytskyi, O.; Havryliuk, M.; Ivaskevych, L. Image Processing of Wear Products and Cutting of High-Strength Steels And Alloys, Certificate of Copyright Registration and Work No. 101853, 15 January 2021. Available online: https://ukrpatent.org/atachs/buleten-avt-pravo-63-2021-01.zip (accessed on 17 October 2024).
- Simmons, J.W. Overview: High-nitrogen alloying of stainless steels. Mater. Sci. Eng. A 1996, 207, 159–169. [Google Scholar] [CrossRef]
- Gavriljuk, V.G.; Berns, H. High Nitrogen Steels–Structure, Properties, Manufacture. Applications; Springer Science & Business Media: Berlin, Germany, 1999; p. 378. [Google Scholar]
- Thomann, U.I.; Uggowitzer, P.J. Wear–corrosion behavior of bio compatible austenitic stainless steels. Wear 2000, 239, 48–58. Available online: https://www.sciencedirect.com/science/article/abs/pii/S0043164899003725?via%3Dihub (accessed on 17 October 2024). [CrossRef]
- Büscher, R.; Fischer, A. Sliding wear behaviour of an electrochemically modified austenitic high-nitrogen steel surface. Wear 2003, 254, 1318–1325. [Google Scholar] [CrossRef]
- Stein, G.; Hucklenbroich, I. Manufacturing and Applications of High Nitrogen Steels. Mater. Manuf. Process. 2004, 19, 7–17. [Google Scholar] [CrossRef]
- Bregliozzi, G.; Schino, A.D.; Ahmed, S.I.-U. Cavitation wear behaviour of austenitic stainless steels with different grain sizes. Wear 2005, 258, 503–510. [Google Scholar] [CrossRef]
- Speidel, M.O. Nitrogen containing austenitic stainless steels. Materwiss Werksttech 2006, 37, 875–880. [Google Scholar] [CrossRef]
- Li, H.; Jiang, Z.; Zhang, Z.; Xu, B.; Liu, F. Mechanical Properties of Nickel Free High Nitrogen Austenitic Stainless Steels. J. Iron Steel Res. Int. 2007, 14, 330–334. [Google Scholar] [CrossRef]
- Mesa, D.H.; Garzón, C.M.; Tschiptschin, A.P. Influence of cold-work on the cavitation erosion resistance and on the damage mechanisms in high-nitrogen austenitic stainless steels. Wear 2011, 271, 1372–1377. [Google Scholar] [CrossRef]
- Saenarjhan, N.; Kang, J.-H.; Kim, S.-J. Effects of carbon and nitrogen on austenite stability and tensile deformation behavior of 15Cr-15Mn-4Ni based austenitic stainless steels. Mater. Sci. Eng. A 2019, 742, 608–616. [Google Scholar] [CrossRef]
- Liu, P.; Chu, Z.K.; Yuan, Y. Microstructures and Mechanical Properties of a Newly Developed Austenitic Heat Resistant Steel. Acta Metall. Sin. 2019, 32, 517–525. [Google Scholar] [CrossRef]
- Ferreira, V.H.M.M.; Coury, F.G.; de Araujo Santana, D.; Kogaz, G.Y. Novel high nitrogen austenitic stainless steels: From high-throughput screening to experimental validation and properties relationship. J. Mater. Res. Technol. 2024, 30, 640–656. [Google Scholar] [CrossRef]
- Balitskii, A.I.; Syrotyuk, A.M.; Havrilyuk, M.R.; Balitska, V.O.; Kolesnikov, V.O.; Ivaskevych, L.M. Hydrogen Cooling of Turbo Aggregates and the Problem of Rotor Shafts Materials Degradation Evaluation. Energies 2023, 16, 7851. [Google Scholar] [CrossRef]
- Balyts’kyi, O.I.; Kolesnikov, V.O.; Havrylyuk, M.R. Influence of lubricating liquid on the formation of the products of cutting of 38KhN3MFA steel. Mater. Sci. 2019, 54, 722–727. [Google Scholar] [CrossRef]
- Balyts’kyi, O.I.; Kolesnikov, V.O.; Havrylyuk, M.R. Influence of modification of 38KhN3MFA steel on the structural-phase state and cutting products under variable technological conditions. Mater. Sci. 2020, 55, 915–920. [Google Scholar] [CrossRef]
- Balyts’kyi, O.I.; Kolesnikov, V.O.; Kubicki, E. Enhancement of the crack resistance of manganese cast irons. Mater. Sci. 2005, 41, 67–73. [Google Scholar] [CrossRef]
- Balitskii, A.; Kolesnikov, V.; Abramek, K.F.; Balitskii, O.; Eliasz, J.; Havrilyuk, M.; Ivaskevych, L.; Kolesnikova, I. Influence of hydrogen-containing fuels and environmentally friendly lubricating coolant on nitrogen steels wear resistance for spark ingnition engine pistons and rings kit gasket set. Energies 2021, 14, 7583. [Google Scholar] [CrossRef]
- Balitskii, A.; Kindrachuk, M.; Volchenko, D.; Abramek, K.F.; Balitskii, O.; Skrypnyk, V.; Zhuravlev, D.; Bekish, I.; Ostashuk, M.; Kolesnikov, V. Hydrogen containing nano fluids in the spark engine’s cylinder head cooling system. Energies 2022, 15, 59. [Google Scholar] [CrossRef]
- Balitskii, A.A.; Kolesnikov, V.A.; Vus, O.B. Tribotechnical properties of nitrogen manganese steels under rolling friction at addition of (GaSe)xIn1-x powders into contact zone. Metallofiz. Noveishie Tekhnologii 2010, 32, 685–695. [Google Scholar]
- Balyts’kyi, O.I.; Kolesnikov, V.O.; Kawiak, P. Triboengineering properties of austenitic manganese steels and castirons under the conditions of sliding friction. Mater. Sci. 2005, 41, 624–630. [Google Scholar] [CrossRef]
- Kindrachuk, M.; Volchenko, D.; Balitskii, A.; Abramek, K.F.; Volchenko, M.; Balitskii, O.; Skrypnyk, V.; Zhuravlev, D.; Yurchuk, A.; Kolesnikov, V. Wear resistance of spark ignition engine piston rings in hydrogen-containing environments. Energies 2021, 14, 4801. [Google Scholar] [CrossRef]
- Balitskii, O.I.; Kolesnikov, V.O.; Ivaskevych, L.M.; Havrylyuk, M.R. The Influence of Specific Features of Load and Hydrogen Charging on Steel Tribotechnical Properties. Mater. Sci. 2023, 58, 502–512. [Google Scholar] [CrossRef]
- Balitskii, O.A.; Kolesnikov, V.O.; Balitskii, A.I.; Eliasz, J.J.; Havrylyuk, M.R. Hydrogen effect on the high-nickel surface steel properties during machining and wear with lubricants. Arch. Mater. Sci. Eng. 2020, 104, 49–57. [Google Scholar] [CrossRef]
- Glotka, O.A.; Haiduk, S.V. Distribution of elements in carbides of multicomponent superalloys. Metallofiz. Noveishie Tekhnol. 2020, 42, 869–884. [Google Scholar] [CrossRef]
- Glotka, A.A.; Moroz, A.N. Comparison of the effects of carbides and nonmetallic inclusions on formation of fatigue microcracks in steels. Metal Sci. Heat Treat. 2019, 61, 521–524. [Google Scholar] [CrossRef]
- Trzepieciński, T.; Szwajka, K.; Szewczyk, M.; Barlak, M.; Zielińska-Szwajka, J. Effect of Countersample Coatings on the Friction Behaviour of DC01 Steel Sheets in Bending-under-Tension Friction Tests. Materials 2024, 17, 3631. [Google Scholar] [CrossRef] [PubMed]
- Czapla, K.; Żaba, K.; Kot, M.; Nejman, I.; Madej, M.; Trzepieciński, T. Tribological Performance of Anti-Wear Coatings on Tools for Forming Aluminium Alloy Sheets Used for Producing Pull-Off Caps. Materials 2023, 16, 6465. [Google Scholar] [CrossRef] [PubMed]
- Kyryliv, V.; Maksymiv, O.; Gurey, V.; Hurey, I.; Kyryliv, Y.; Zvirko, O. The mode deformation effect on surface nanocrystalline structure formation and wear resistance of steel 41Cr4. Coatings 2023, 13, 249. [Google Scholar] [CrossRef]
- Nykyforchyn, H.; Kyryliv, V.; Maksymiv, O.; Zvirko, O. Mechanical fabrication methods of nanostructured surfaces. In Handbook of Modern Coating Technologies. Fabrication Methods and Functional Properties; Aliofkhazraei, M., Ali, N., Chipara, M., Laidani, N.B., De Hosson, J.T.M., Eds.; Elsevier: Amsterdam, The Netherlands, 2021; pp. 25–67. [Google Scholar] [CrossRef]
- Khoma, M.S.; Korniy, S.A.; Vynar, V.A.; Datsko, B.M.; Maksishko, Y.; Dykha, O.V.; Bukliv, R.L. Influence of hydrogen sulfide on the carbon-dioxide corrosion and the mechanical characteristics of high-strength pipe steel. Mater. Sci. 2022, 1, 805–812. [Google Scholar] [CrossRef]
- Pokhmurs’kyi, V.I.; Vasyliv, K.B. Influence of hydrogen on the friction and wear of metals (a survey). Mater. Sci. 2012, 48, 125–138. [Google Scholar] [CrossRef]
- Chernousenko, O.; Rindyuk, D.; Peshko, V.; Bednarska, I. Effect of Start-Up Operating Modes on the Cyclic Damage of Thermal Power Plant Units. In Proceedings of the 2022 IEEE 8th International Conference on Energy Smart Systems (ESS), Kyiv, Ukraine, 7–9 September 2022; pp. 233–238. [Google Scholar] [CrossRef]
- Hembara, O.V.; Chepil, O.Y.; Hembara, N.T.; Syrotyuk, A.M. Evaluation of the Influence of the Hydrogenation of Metal on the Durability of Heat-Exchanger Tubes of Steam Generators. Mater. Sci. 2022, 58, 325–330. [Google Scholar] [CrossRef]
- Bovsunovsky, A.; Shtefan, E.; Peshko, V. Modeling of the circumferential crack growth under torsional vibrations of steam turbine shafting. Theor. Appl. Fract. Mech. 2023, 2023, 103881. [Google Scholar] [CrossRef]
- Yasniy, P.V.; Okipnyi, I.B.; Maruschak, P.O.; Panin, S.V.; Konovalenko, I.V. Crack tip strain localisation on mechanics of fracture of heat resistant steel after hydrogenation. Theor. Appl. Fract. Mech. 2013, 63–68. [Google Scholar] [CrossRef]
- Onysko, O.; Kopei, V.; Vytvytskyi, V.; Vriukalo, V.; Lukan, T. Calculation of the accuracy of the drill-string nc13 thread profile turned from difficult-to-machine steel. Lect. Notes Mech. Eng. 2024, 182–192. [Google Scholar] [CrossRef]
- Tkach, P.; Reviakina, O.; Kryvosheia, A.; Ustynenko, O.; Protasov, R. Meshing characteristics of profile shifted cylindrical quasi-involute arc-tooth-trace gears. Part 1. Theor. Base. Stroj. Casopis. 2022, 72, 201–210. [Google Scholar] [CrossRef]
- Terniuk, M.E.; Kryvosheia, A.V.; Krasnoshtan, A.M.; Tkach, P.M.; Lutskii, S.V. Gear manufacturing accuracy prediction, control, and management. In Novikov/Conform. Gearing; Springer: Berlin/Heidelberg, Germany, 2023; pp. 215–323. [Google Scholar] [CrossRef]
- Andreikiv, O.Y.; Dolins’ka, I.Y.; Shtoiko, I.P.; Raiter, O.K.; Matviiv, Y.Y. Evaluation of the residual service life of main pipelines with regard for the action of media and degradation of materials. Mater. Sci. 2019, 54, 638–646. [Google Scholar] [CrossRef]
- Onysko, O.; Kopei, V.; Medvid, I.; Panchuk, V.; Pituley, L.; Vryukalo, V. Analytical investigations of the accuracy of the small diameter tool-joint tapered thread made by a lathe machining. New Trends Prod. Eng. 2019, 2, 1. [Google Scholar] [CrossRef]
- Permyakov, A.; Dobrotvorskiy, S.; Dobrovolska, L.; Basova, Y.; Ivanova, M. Computer modeling application for predicting of the passing of the high-speed milling machining hardened steel. In Advances in Design, Simulation and Manufacturing; Springer: Berlin/Heidelberg, Germany, 2019; DSMIE, Lecture Notes in Mechanical Engineering. [Google Scholar] [CrossRef]
- Santone, A.; De Vivo, R.; Recchia, L.; Cesarelli, M.; Mercaldo, F. A Method for Retina Segmentation by Means of U-Net Network. Electronics 2024, 13, 4340. [Google Scholar] [CrossRef]
- Zhang, Y.; Chu, J.; Leng, L.; Miao, J. Mask-Refined R-CNN: A Network for Refining Object Details in Instance Segmentation. Sensors 2020, 20, 1010. [Google Scholar] [CrossRef]
- Wang, H.; Liu, J.; Huang, C.; Yang, X.; Hu, D.; Chen, L.; Xing, X.; Jiang, Y. Semi-Supervised Instance-Segmentation Model for Feature Transfer Based on Category Attention. Sensors 2022, 22, 8794. [Google Scholar] [CrossRef]
- Terven, J.; Córdova-Esparza, D.-M.; Romero-González, J.-A. A Comprehensive Review of YOLO Architectures in Computer Vision: From YOLOv1 to YOLOv8 and YOLO-NAS. Mach. Learn. Knowl. Extr. 2023, 5, 1680–1716. [Google Scholar] [CrossRef]
- Moksyakov, A.; Wu, Y.; Gadsden, S.A.; Yawney, J.; AlShabi, M. Object Detection and Tracking with YOLO and the Sliding Innovation Filter. Sensors 2024, 24, 2107. [Google Scholar] [CrossRef]
- Karathanasopoulos, N.; Hadjidoukas, P. Deep learning based automated fracture identification in material characterization experiments. Adv. Eng. Inform. 2024, 60, 102402. [Google Scholar] [CrossRef]
- Bastidas-Rodriguez, M.X.; Polania, L.; Gruson, A.; Prieto-Ortiz, F. Deep Learning for fractographic classification in metallic materials. Eng. Fail. Anal. 2020, 113, 104532. [Google Scholar] [CrossRef]
- Engelhardt, A.; Decke, J.; Meier, D.; Dulig, F.; Ragunathan, R.; Wegener, T.; Sick, B.; Niendorf, T. On the Reliability of Automated Analysis of Fracture Surfaces Using a Novel Computer Vision-Based Tool. Adv. Eng. Mater. 2023, 25, 2300876. [Google Scholar] [CrossRef]
- Stachowiak, G.P.; Stachowiak, G.W.; Podsiadlo, P. Automated classification of wear particles based on their surface texture and shape features. Tribol. Int. 2008, 41, 34–43. [Google Scholar] [CrossRef]
- He, L.; Wei, H.; Gao, W. Research on an Intelligent Classification Algorithm of Ferrography Wear Particles Based on Integrated ResNet50 and SepViT. Lubricants 2023, 11, 530. [Google Scholar] [CrossRef]
- Wong, J.; Wei, H.; Zhou, D.; Cao, Z. The Target Detection of Wear Particles in Ferrographic Images Based on the Improved YOLOv8. Lubricants 2024, 12, 280. [Google Scholar] [CrossRef]
- He, L.; Wei, H.; Wang, Q. A New Target Detection Method of Ferrography Wear Particle Images Based on ECAM-YOLOv5-BiFPN Network. Sensors 2023, 23, 6477. [Google Scholar] [CrossRef]


Disclaimer/Publisher’s Note: The statements, opinions and data contained in all publications are solely those of the individual author(s) and contributor(s) and not of MDPI and/or the editor(s). MDPI and/or the editor(s) disclaim responsibility for any injury to people or property resulting from any ideas, methods, instructions or products referred to in the content. |
© 2024 by the authors. Licensee MDPI, Basel, Switzerland. This article is an open access article distributed under the terms and conditions of the Creative Commons Attribution (CC BY) license (https://creativecommons.org/licenses/by/4.0/).
Share and Cite
Balitskii, A.I.; Kolesnikov, V.O.; Balitska, V.O.; Ivaskevych, L.M.; Dowejko, J.M.; Pilecki, B.J.; Havrilyuk, M.R. Computer-Integrated Surface Image Processing of Hydrogen-Saturated Steel Wear Products. Appl. Sci. 2024, 14, 11762. https://doi.org/10.3390/app142411762
Balitskii AI, Kolesnikov VO, Balitska VO, Ivaskevych LM, Dowejko JM, Pilecki BJ, Havrilyuk MR. Computer-Integrated Surface Image Processing of Hydrogen-Saturated Steel Wear Products. Applied Sciences. 2024; 14(24):11762. https://doi.org/10.3390/app142411762
Chicago/Turabian StyleBalitskii, Alexander I., Valerii O. Kolesnikov, Valentina O. Balitska, Ljubomyr M. Ivaskevych, Jakub M. Dowejko, Bartosz J. Pilecki, and Maria R. Havrilyuk. 2024. "Computer-Integrated Surface Image Processing of Hydrogen-Saturated Steel Wear Products" Applied Sciences 14, no. 24: 11762. https://doi.org/10.3390/app142411762
APA StyleBalitskii, A. I., Kolesnikov, V. O., Balitska, V. O., Ivaskevych, L. M., Dowejko, J. M., Pilecki, B. J., & Havrilyuk, M. R. (2024). Computer-Integrated Surface Image Processing of Hydrogen-Saturated Steel Wear Products. Applied Sciences, 14(24), 11762. https://doi.org/10.3390/app142411762