1. Introduction
According to WHO data [
1], worldwide, more than 422 million people suffer from diabetes. This leads, either directly or by causing secondary health problems, to millions of deaths every year [
2]. In order to manage diabetes, patients are required to closely monitor their glucose levels throughout the day. Unfortunately, current measuring methods are invasive, requiring blood samples to accurately determine blood glucose levels. It has been determined that due to the pain associated with glucose level measurement, patient attendance to a rigorous monitoring schedule is low [
3]. Significant effort has been made to reduce the level of invasiveness of glucose monitoring (by decreasing the sample volume significantly and changing sampling sites to less pain-sensitive ones).
A lot of research is being directed towards the creation of a completely noninvasive measurement method. Such a method would allow for sampling glucose levels without patient discomfort (and the associated health risk of infection), leading to better monitoring of blood glucose levels. Ideally, this would lead to the creation of a continuous glucose monitoring system, which would highly improve patient outcomes by allowing continuous monitoring and control of glucose levels in blood [
4].
Non-invasive glucose monitoring is being actively researched and many different sensing approaches have been tested, including both direct measurement based on properties of the glucose module, as well as indirect measurement based on blood sugar effects on secondary processes like temperature or pH changes [
5].
Many non-invasive methods rely on the optical properties of glucose or tissues to determine the blood glucose concentration. Multiple different wavelengths have been used by various research teams from the visible spectrum up to wavelengths of 10 μm [
5]. The different methods developed have utilized multiple physical phenomena from absorption to optical polarization. Scattering and ToF have also been used, but with highly specialized equipment [
6].
This paper presents a novel low-cost sensor based on ToF measurement of infrared light through a sample. The authors’ goal was to determine the feasibility of this method, along with trying to minimize the cost and the need for specialized equipment.
This paper is organized as follows: the operating principle of the proposed sensor along with the experimental setup are presented in
Section 1, while in
Section 4, the experimental results are shown along with their evaluation.
Section 5 concludes the paper.
2. Operating Principle
In this paper, a novel sensor for the measurement of glucose in an aqueous solution is presented. The sensor created uses off-the-shelf parts and achieves detection of changes of glucose concentration, in a physiological saline sample.
The proposed sensor is based on the measurement of the change of ToF when light travels through a sample containing glucose.
ToF sensors are widely utilized in distance measurement due to their precision and versatility. The fundamental principle involves emitting a signal that travels to a target and reflects back to the sensor. The elapsed time, known as the time of flight, is directly related to the distance. While direct ToF measurement uses the travel time of the signal, phase-based ToF sensors utilize the phase difference between transmitted and received signals to infer distance, offering enhanced accuracy, particularly in short-range and high-precision applications.
In phase-based ToF sensors, such as the one used here, the transmitted signal is typically a continuous sinusoidal wave:
When this wave reflects off a target and is received back, it exhibits a phase shift:
The phase shift
is directly proportional to the propagation delay (
) of the signal:
Using this time delay, the distance
d can be computed as follows:
Here,
c represents the speed of the wave (e.g., speed of light for optical signals). This method is advantageous for achieving high precision as small changes in phase can be detected with sub-wavelength accuracy.
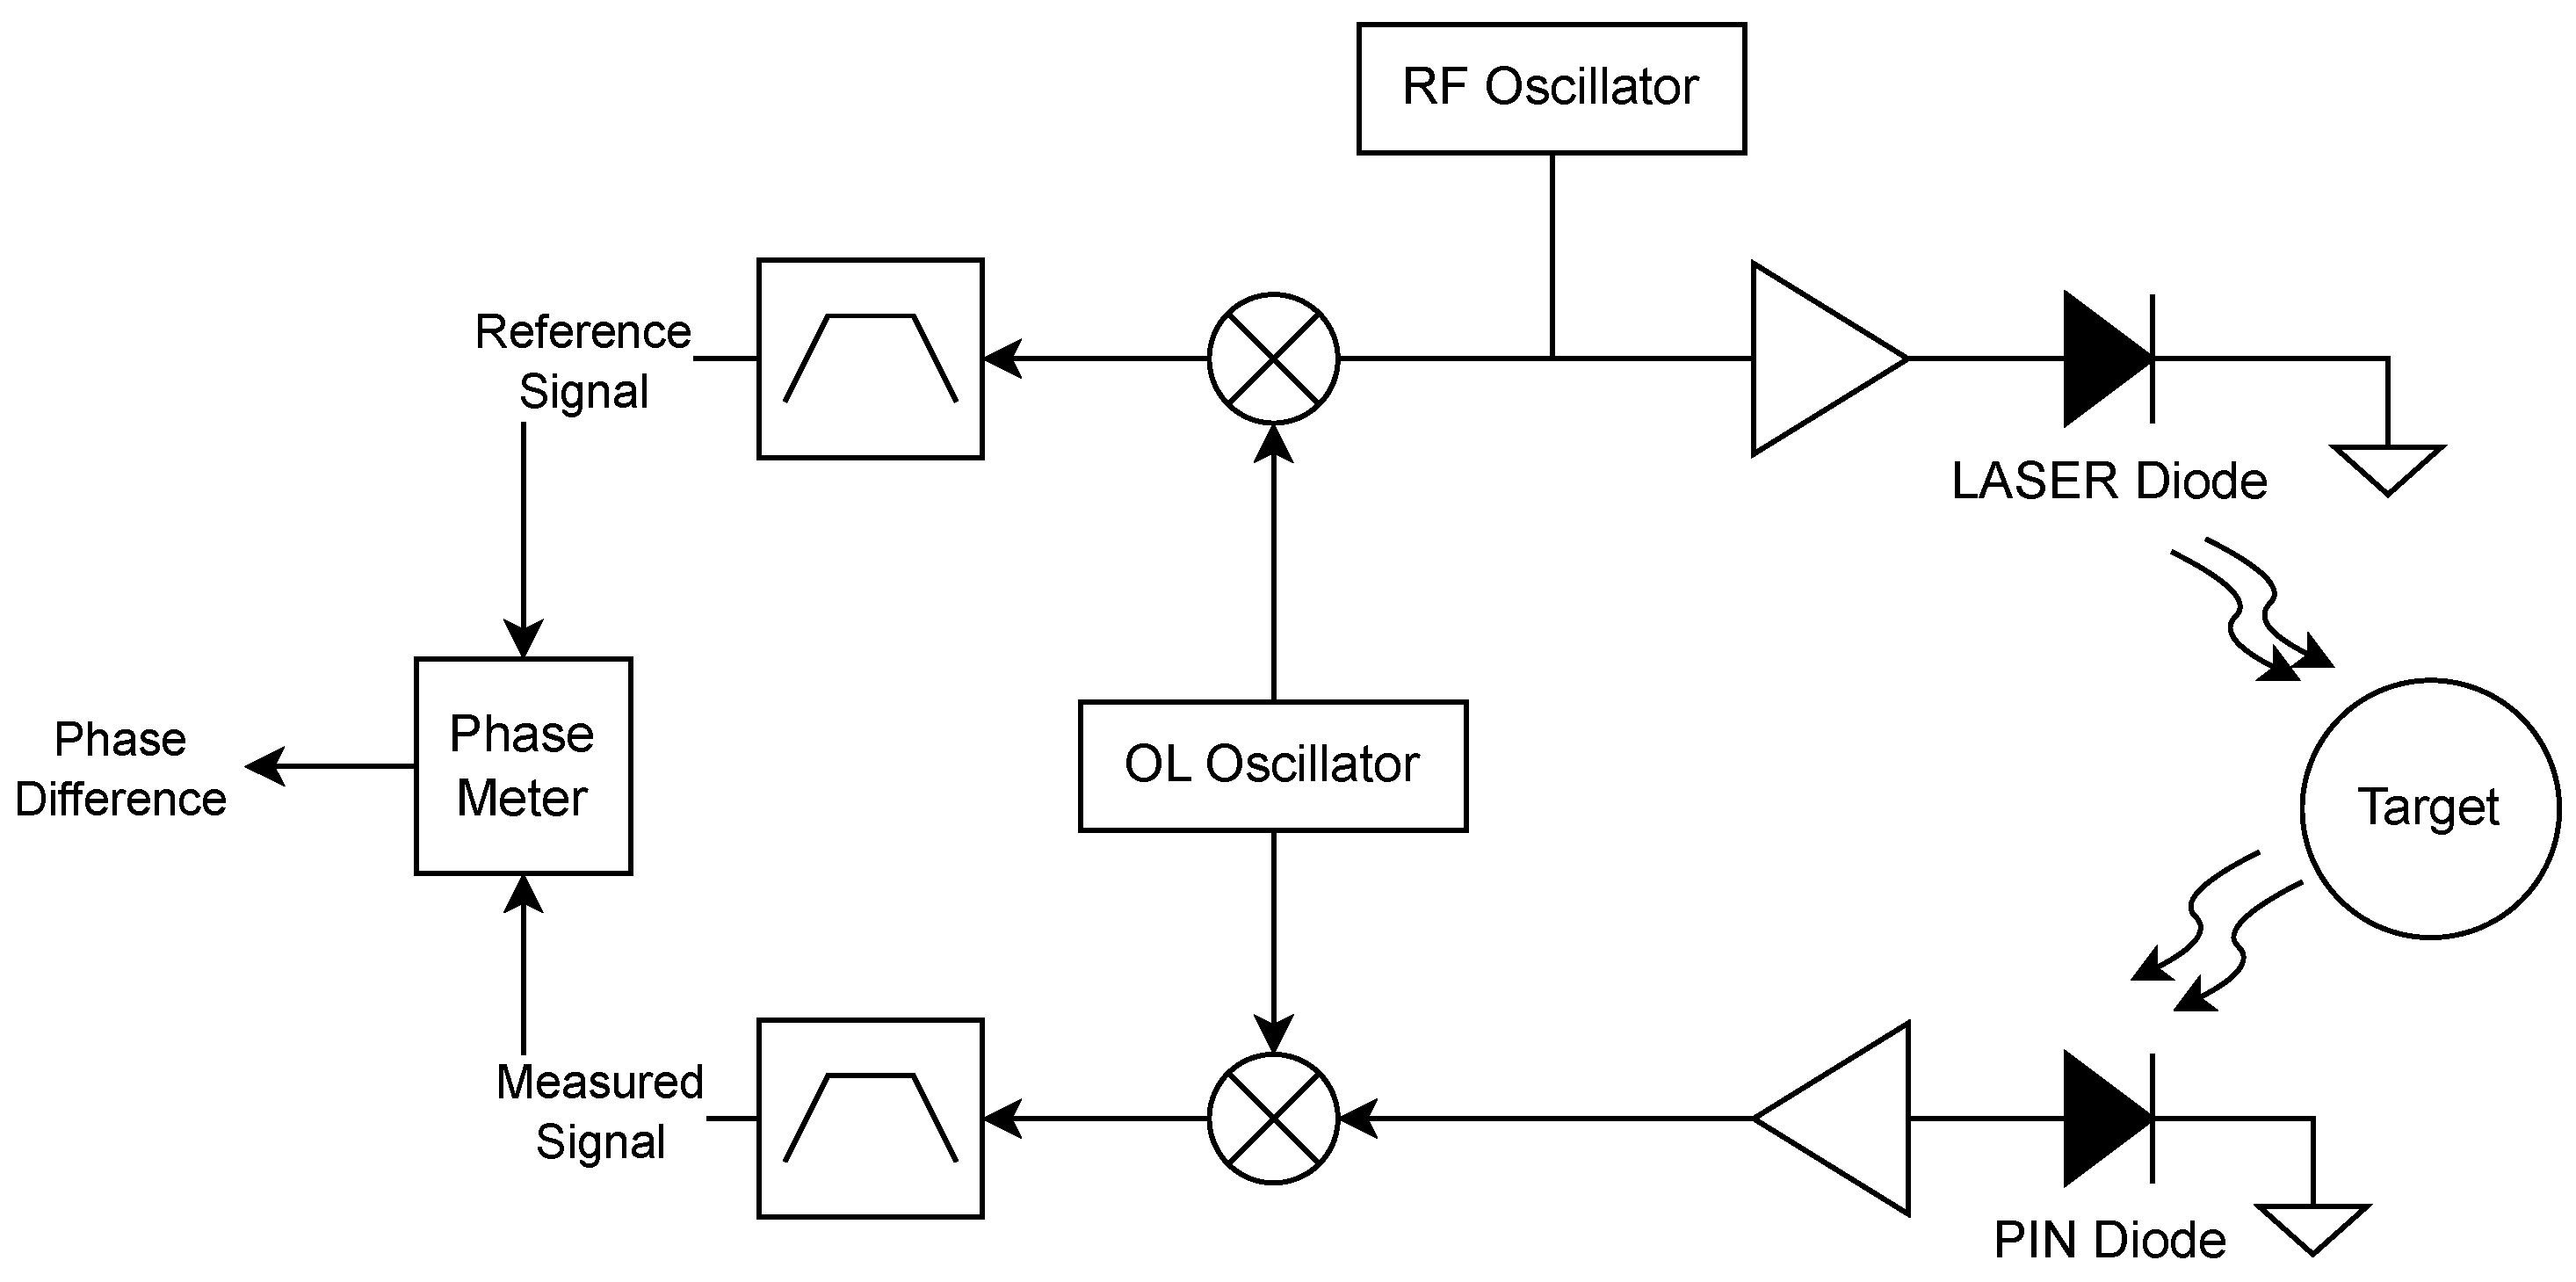
Phase-based ToF sensors offer high accuracy due to their sensitivity to small phase shifts, making them ideal for applications requiring fine resolution. Additionally, such sensors allow for high sampling rates, as they do not require measurement of a full signal round-trip time, enabling real-time applications. However, phase difference measurement also presents challenges. If the round-trip distance exceeds the signal wavelength, the phase shift may repeat, leading to ambiguity. This issue can be addressed using multiple modulation frequencies to distinguish between different phase cycles. A second challenge is their environmental sensitivity—optical ToF sensors can be affected by the presence of ambient light. This can be countered either with selective filters or with precise setups that decrease ambient light effects. A relatively simple technique for this would be a heterodyne receiver as the one shown in
Figure 1. (Additional information on ToF can be found in the work of Markus-Christian Amann et al. [
7]).
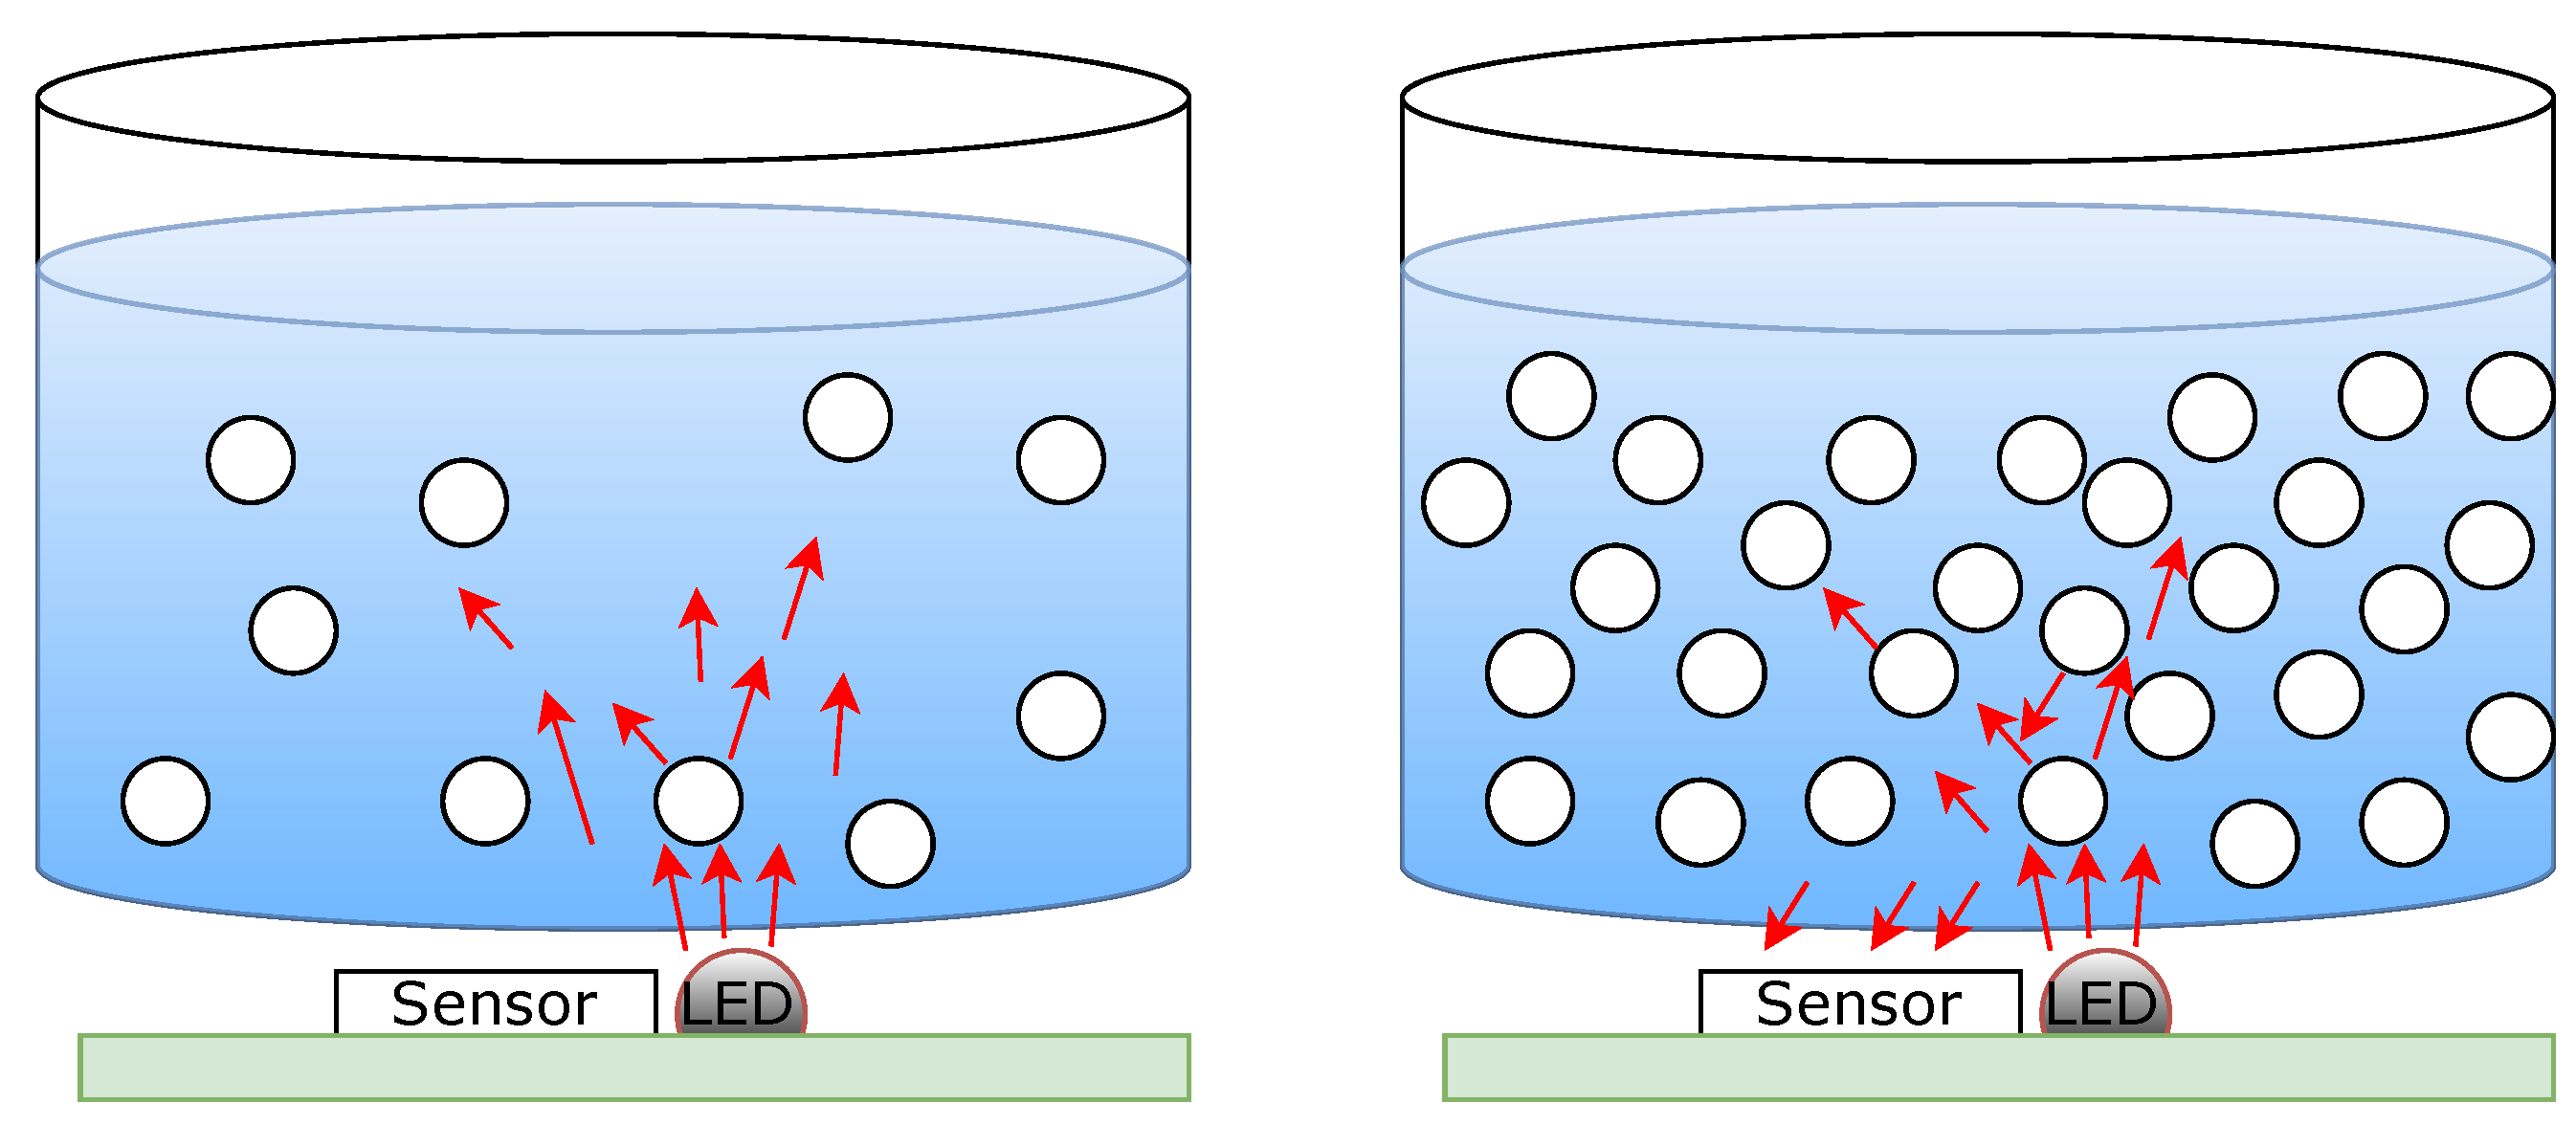
For the sensor presented here, modulated, non-polarized light of a narrow wavelength centered at 850 nm enters the sample where it is absorbed and scattered by the presence of glucose (
Figure 2). The optical properties of the tissue, including its scattering and absorption coefficients, are sensitive to changes in glucose concentration, making this a promising approach for non-invasive glucose monitoring. Kohl et al. demonstrated that glucose concentration significantly affects the velocity of light and the scattering coefficient in tissue-simulating phantoms, providing a critical understanding of how glucose alters light transport properties in biological tissues [
8]. This behavior directly impacts the intensity of light reaching the sensor due to the increased frequency of scattering events. Consequently, these scattering events influence the accuracy and sensitivity of the measurements taken by the developed sensor. Changes in blood glucose levels also affect the extracellular fluid (ECF), leading to modifications in the optical properties of the tissue. Maier et al. observed that the reduced scattering coefficient can be utilized to detect glucose level changes both in the ECF and the bloodstream, supporting the use of scattering-based optical techniques for glucose monitoring [
9]. This insight aligns with findings by Bruulsema et al., who established a correlation between blood glucose concentration and the tissue’s reduced scattering coefficient [
10]. Furthermore, studies by Larin et al. demonstrated the capability of optical coherence tomography (OCT—a technique dependent on scattering) to assess glucose-induced changes in tissue scattering properties with a high specificity, suggesting its utility for glucose sensing applications [
11]. These observations are further supported by the work of Amerov et al., who investigated glucose-induced alterations in light transport through blood, illustrating the significance of scattering dynamics in non-invasive glucose sensors [
12]. This body of work collectively underscores the critical role of light scattering in non-invasive glucose sensing technologies. However, the works available up to now were created using high complexity and cost equipment, usually only available in a laboratory setting. By leveraging these optical phenomena, as well as the low cost of the shelf sensing element, the presented sensor represents a promising step toward accurate, non-invasive glucose monitoring in clinical and daily use.
3. Experimental Setup
The experimental setup comprizes a custom-designed sensor, a sample holder, and a 3D printed adapter. The sensor is built around the Texas Instruments OPT8320 IC (Dallas, TX, USA), which utilizes a phase-based ToF approach to measure distance. This IC drives an external infrared LED (Wurth Elektronik (Waldenburg, Germany), Model 15411085A4570) emitting at 850 nm. This wavelength was chosen due to the sensor’s peak transmissivity at 850 nm (see also [
13]) and its position within the optical window of tissue, allowing for optimal light penetration (see also
Figure 1 in [
14]). Additionally, glucose concentration significantly affects scattering at this wavelength range [
8].
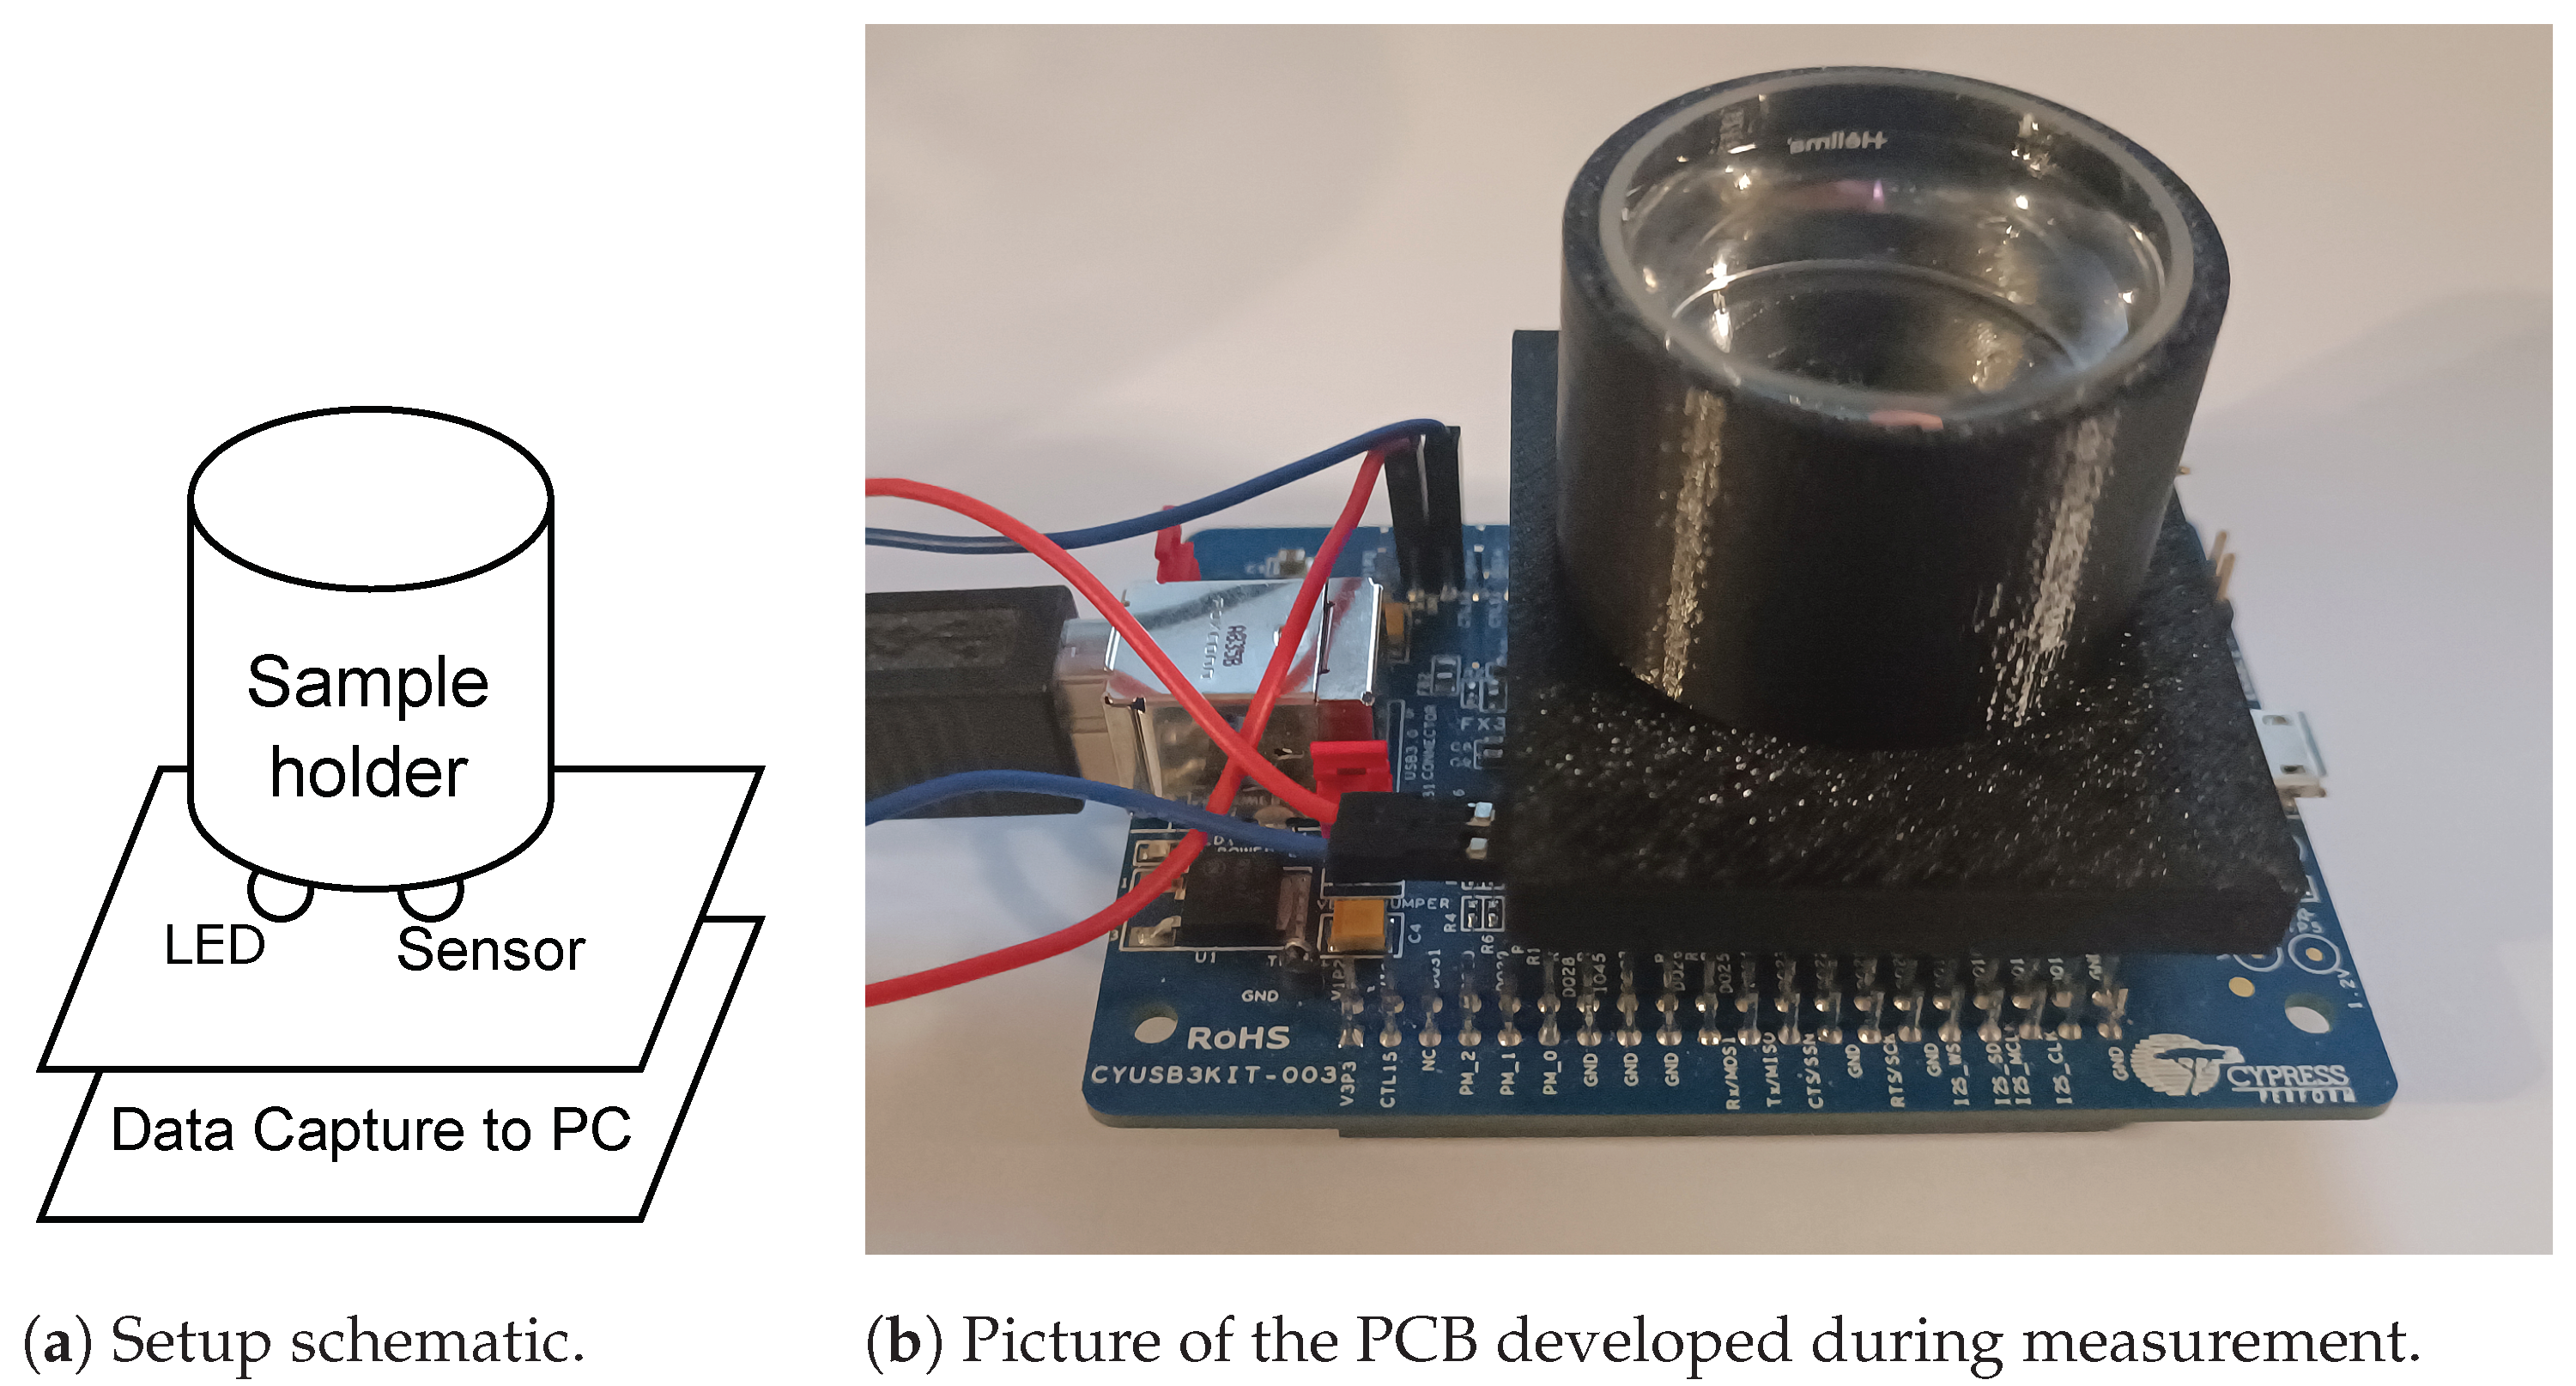
The OPT8320 features an 80 × 60 pixel sensing array accessible by its sensing engine, enabling individual measurement of each element. By exploiting the sensor’s high sensitivity and configurability, it is possible to indirectly measure the degree of light scattering by a sample placed on the sensing element. The experimental setup developed is shown in
Figure 3a.
Sensor data are output in a custom binary format over a 24 MHz parallel bus, matching the IC’s clock frequency. To capture this data, an interconnect circuit based on the Cypress FX3 USB 3.0 platform (Infineon Technologies, Neubiberg, Germany) was developed, which supports direct acquisition of up to 32 bits of parallel data at high clock rates and streams it to a host computer via USB 3.0. The FX3 platform also configures the OPT8320 over an I
2C interface. This circuit connects the OPT8320 to the FX3 and supplies all of the necessary power rails, derived from the USB power supply. Adequate power supply filtering was added to mitigate noise from the USB port, following guidelines from relevant application notes (FTDI and Micrel/Microchip [
15,
16]). The required voltages are generated using low-noise linear voltage regulators, and the negative bias voltage for the sensor is produced using a switched-capacitor inverter followed by a low-noise regulator. The OTP8320 schematic can be seen in
Figure 4. The schematic of the various power supplies used are not included for brevity.
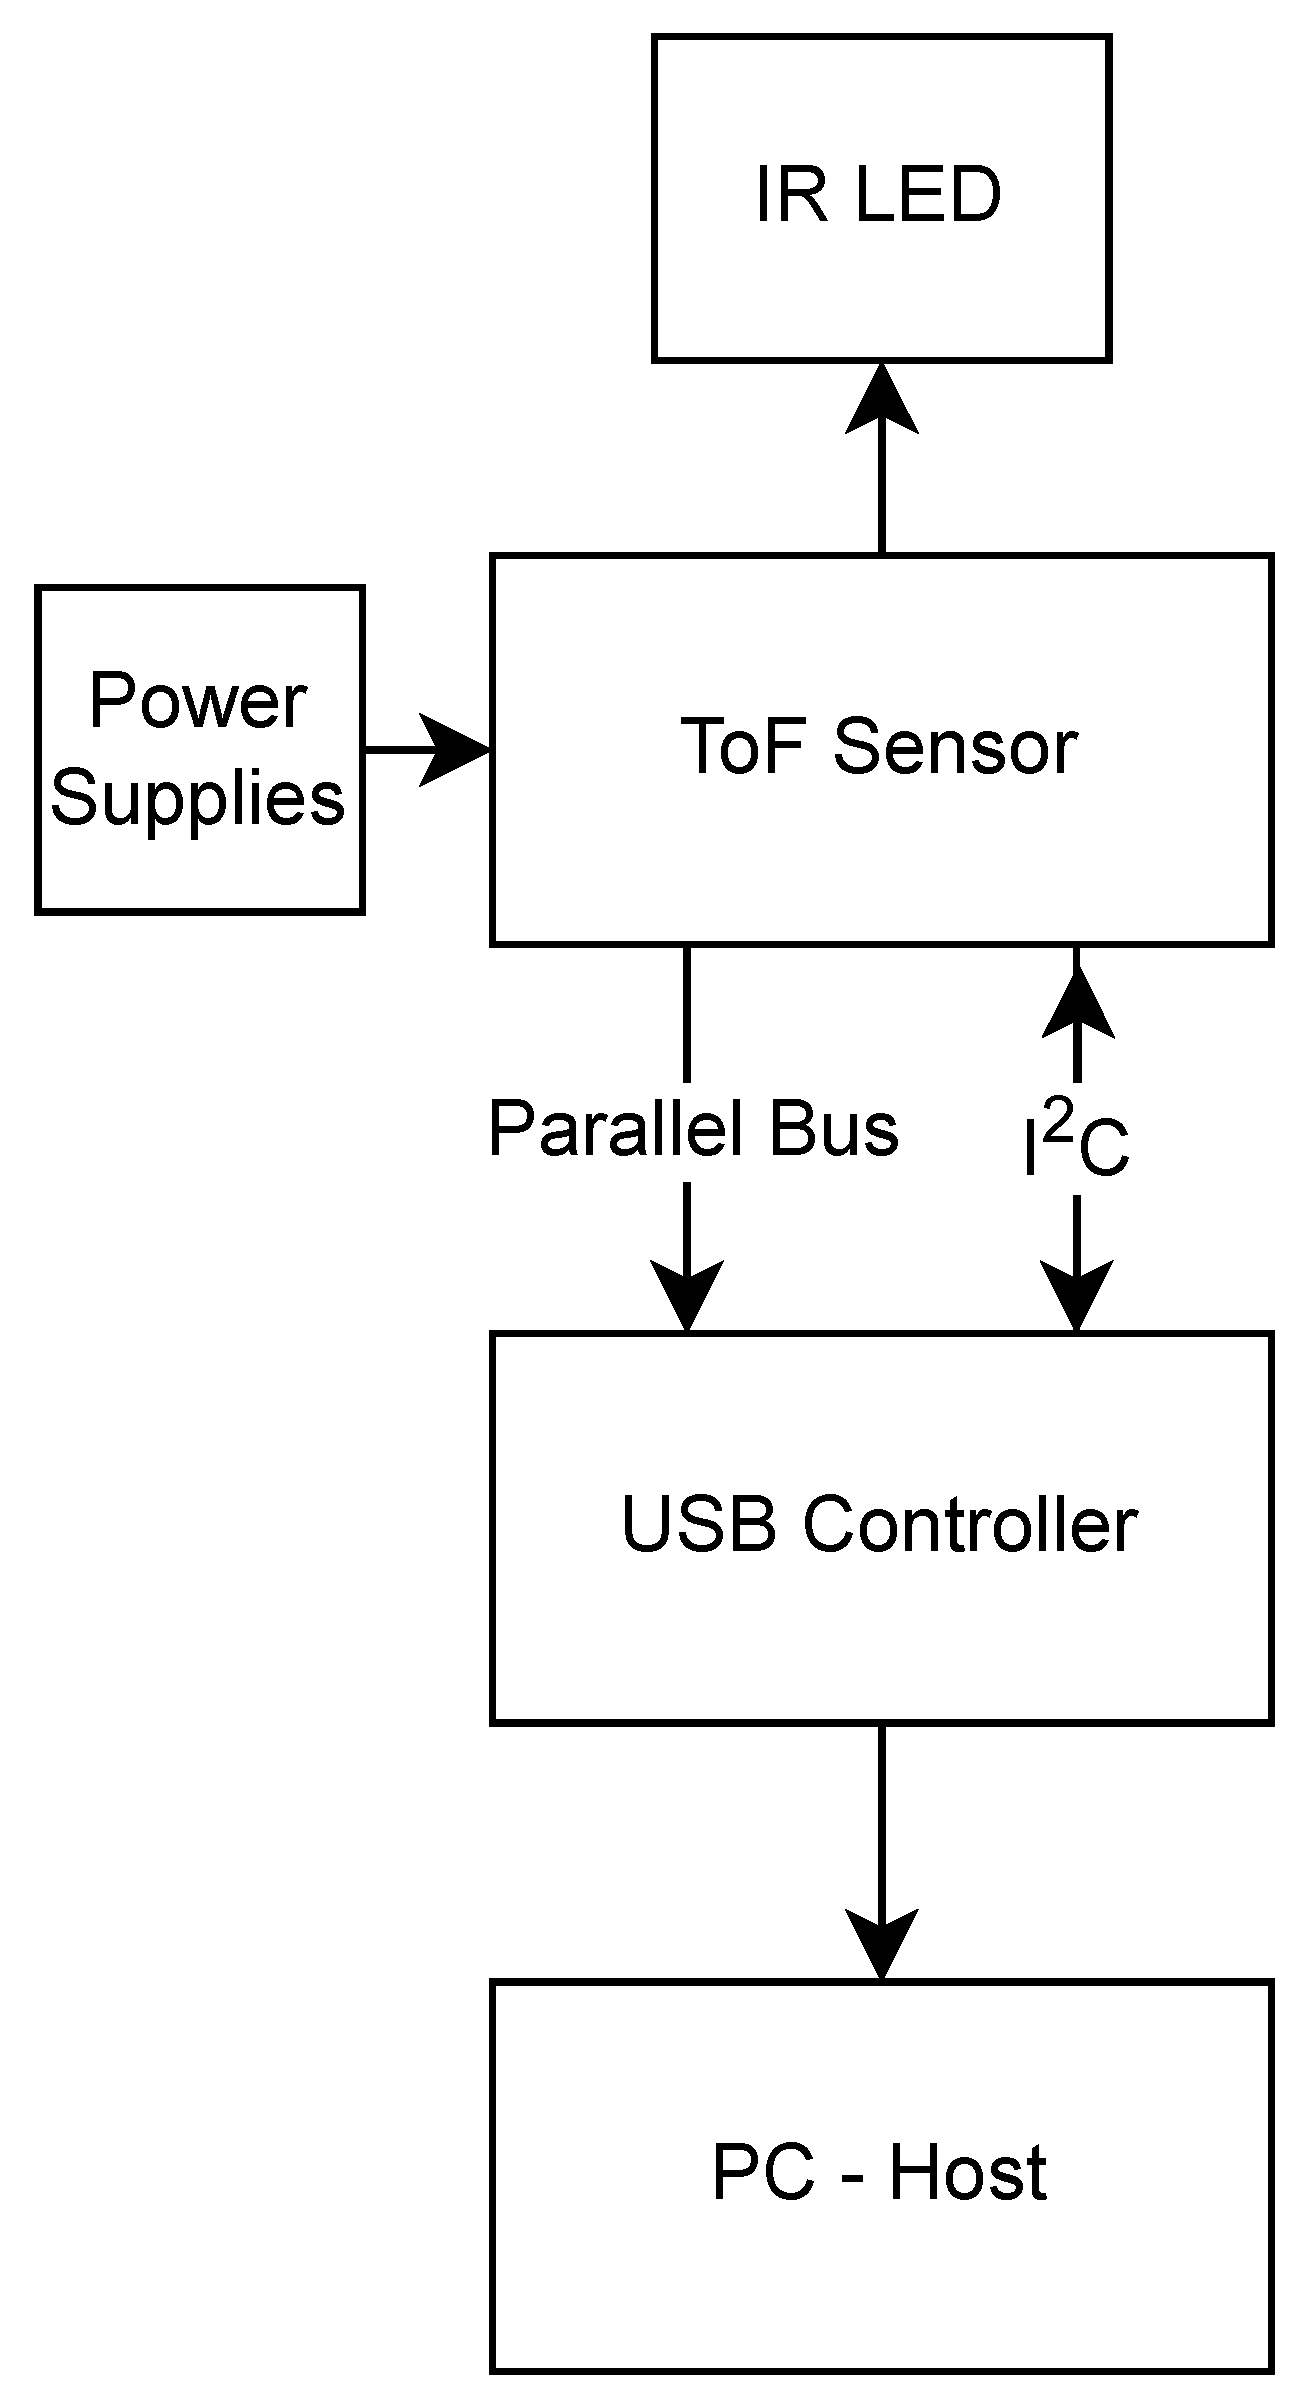
Software was developed to allow the FX-USB3 to initialize and control both the OPT8320 sensor. Custom software was also created to facilitate data capture from the FX-USB3 to a file on the PC. An example of the data provided, visualized as a grayscale image, is provided in
Figure 5. A high-level diagram of the circuit created is shown in
Figure 6 and the PCB manufactured and mounted on the FX-USB3 platform is shown in
Figure 3b.
The sample was contained within a cylindrical cuvette, carefully chosen for its high transparency in the targeted wavelength range (Hellma Analytics 692-091-12, Müllheim, Germany). To ensure it did not influence the measurements, the cuvette’s transparency was further validated by conducting tests on both an empty cell and one filled with saline.
4. Results
4.1. Measurement Post Processing
As has already been mentioned, the sensor used provides data in the form of a binary stream. This data are captured and transferred to a PC as a single file to simplify firmware development on the hardware side. On the host PC, the binary file is converted to four separate binary arrays that include the sensor phase and amplitude data. These were initially converted to simple grayscale images by mapping all possible sensor values to the 8 bit grayscale image space (with the expected loss of information) in order to verify correct sensor operation and communication. This was achieved by commanding the sensor to switch to the integrated testing mode, which switches the incoming data with a predictable array of increasing numbers (a simple binary counter). After successful verification of operation, the test mode functionality was disabled.
To decrease possible noise from the sensor, multiple samples were acquired for each sample. Each measurement from the sensing element consists of 4 arrays of 4800 cells. The cells of each array correspond to a pixel of the sensor array while the arrays represent the four different data types that the senor provides. These are the amplitude of the signal received, flags that provide data for the operation of the relevant pixel (e.g., if it has been saturated), ambient light data (in case of operation in an area with near infrared sources), and the phase data of the received signal. The last one is the data used in this work. This is the phase difference of the captured signal to the reference signal (as created by modulating the LED driving current) with higher values representing higher difference and thus greater distance traveled.
The multiple recorded samples were averaged to produce a single array for each measurement. The data produced thus were in turn further filtered using a moving window averaging function with a sample size of 1000 to remove noise. This value was selected so as to prevent excessive smoothing, but also remove spikes of noise in the produced data. The moving average filtering algorithm was selected over other possible algorithms (for example weighted averaging) due to several reasons—mainly the following:
The application allowed for a trade-off, between preserving fine details and simplicity. As a mean value was required, fine detail was not necessary.
As the data were a 1D array from a 2D image, there were a number of spikes and anomalies (e.g., due to local 2D irregularities that were converted to periodic irregularities in the array). The moving average filter effectively handled their removal.
At this stage of sensor development and to simplify testing, the moving average filter’s straightforward implementation was considered an ideal choice.
Finally, the sensor provided amplitude data was also compared between different measurements and found to differ within the detection limits of the sensor ().
4.2. Measurements Performed
The performance of the sensor was determined by multiple measurements of the produced samples. A buffer solution of physiological saline was used, to which different amounts of D-glucose (Sigma Aldrich G8270-1KG, St. Louis, MO, USA) were added. The quantity added was adjusted so as to create multiple solutions with glucose concentrations that initially covered the range of human normal blood glucose levels (70 mg/dL–140 mg/dL) [
17]. Additional samples were created to cover values up to an upper limit of 500 mg/dL.
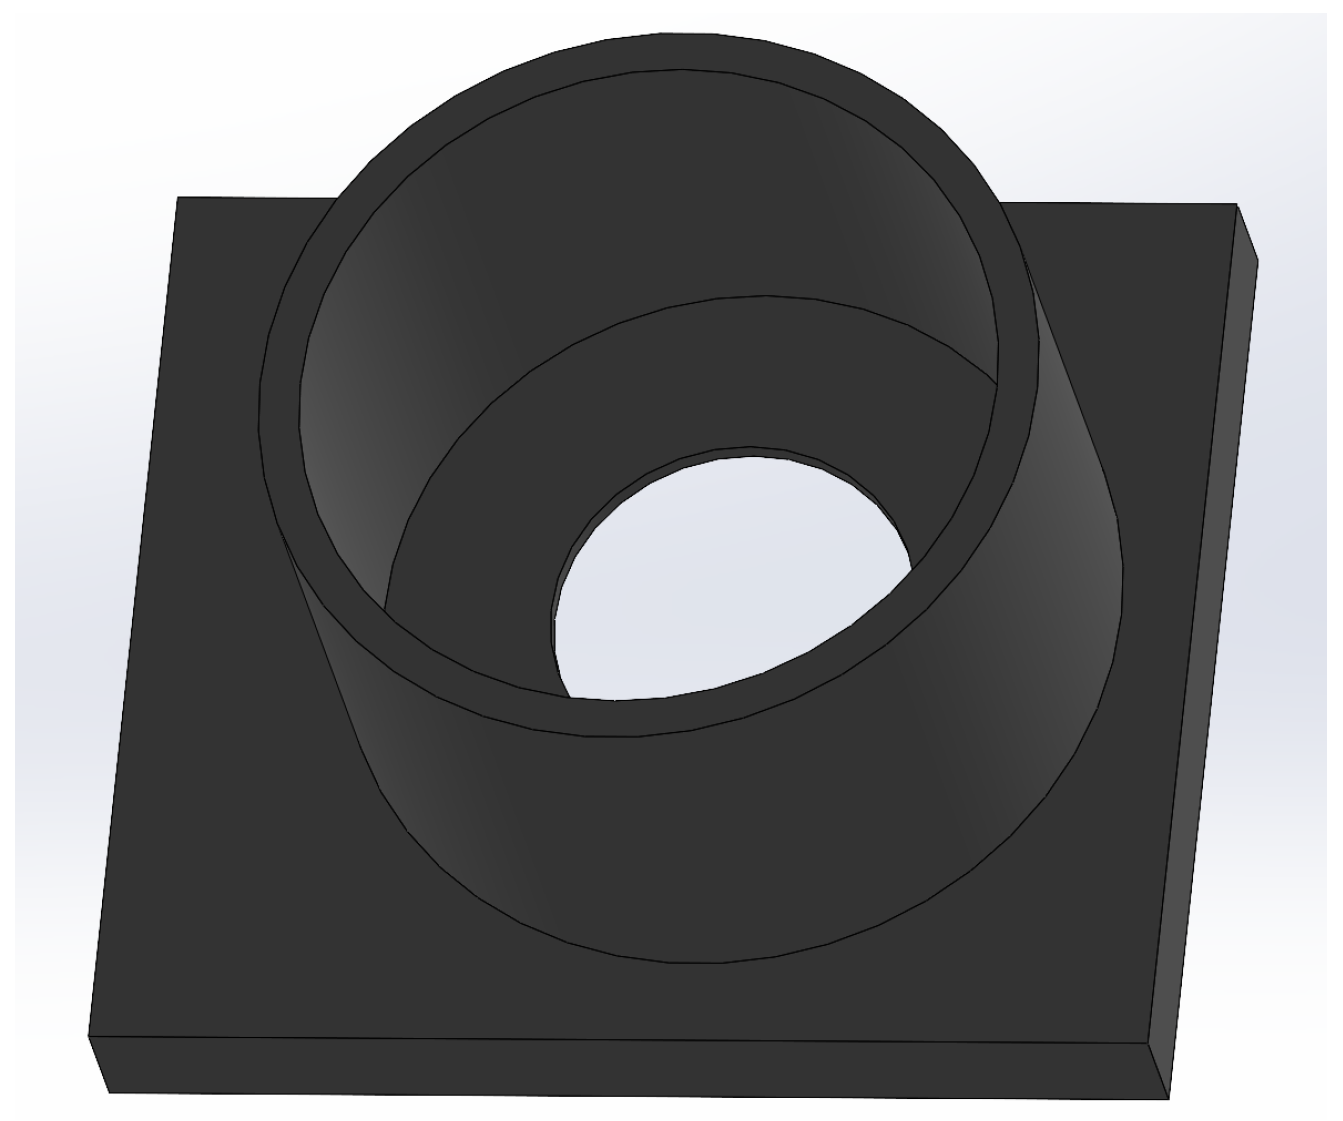
A cuvette holder was designed and 3D printed to prevent position changes during measurement and to attempt and preserve the cuvette placement while different samples were placed on the sensor (
Figure 7).
To verify that the sensor’s measurements were not affected by the sample container used, full measurements were acquired using just an empty container. The results showed that the sensor did not register significant signal change with or without the sample holder, that could not be attributed to ambient and system noise.
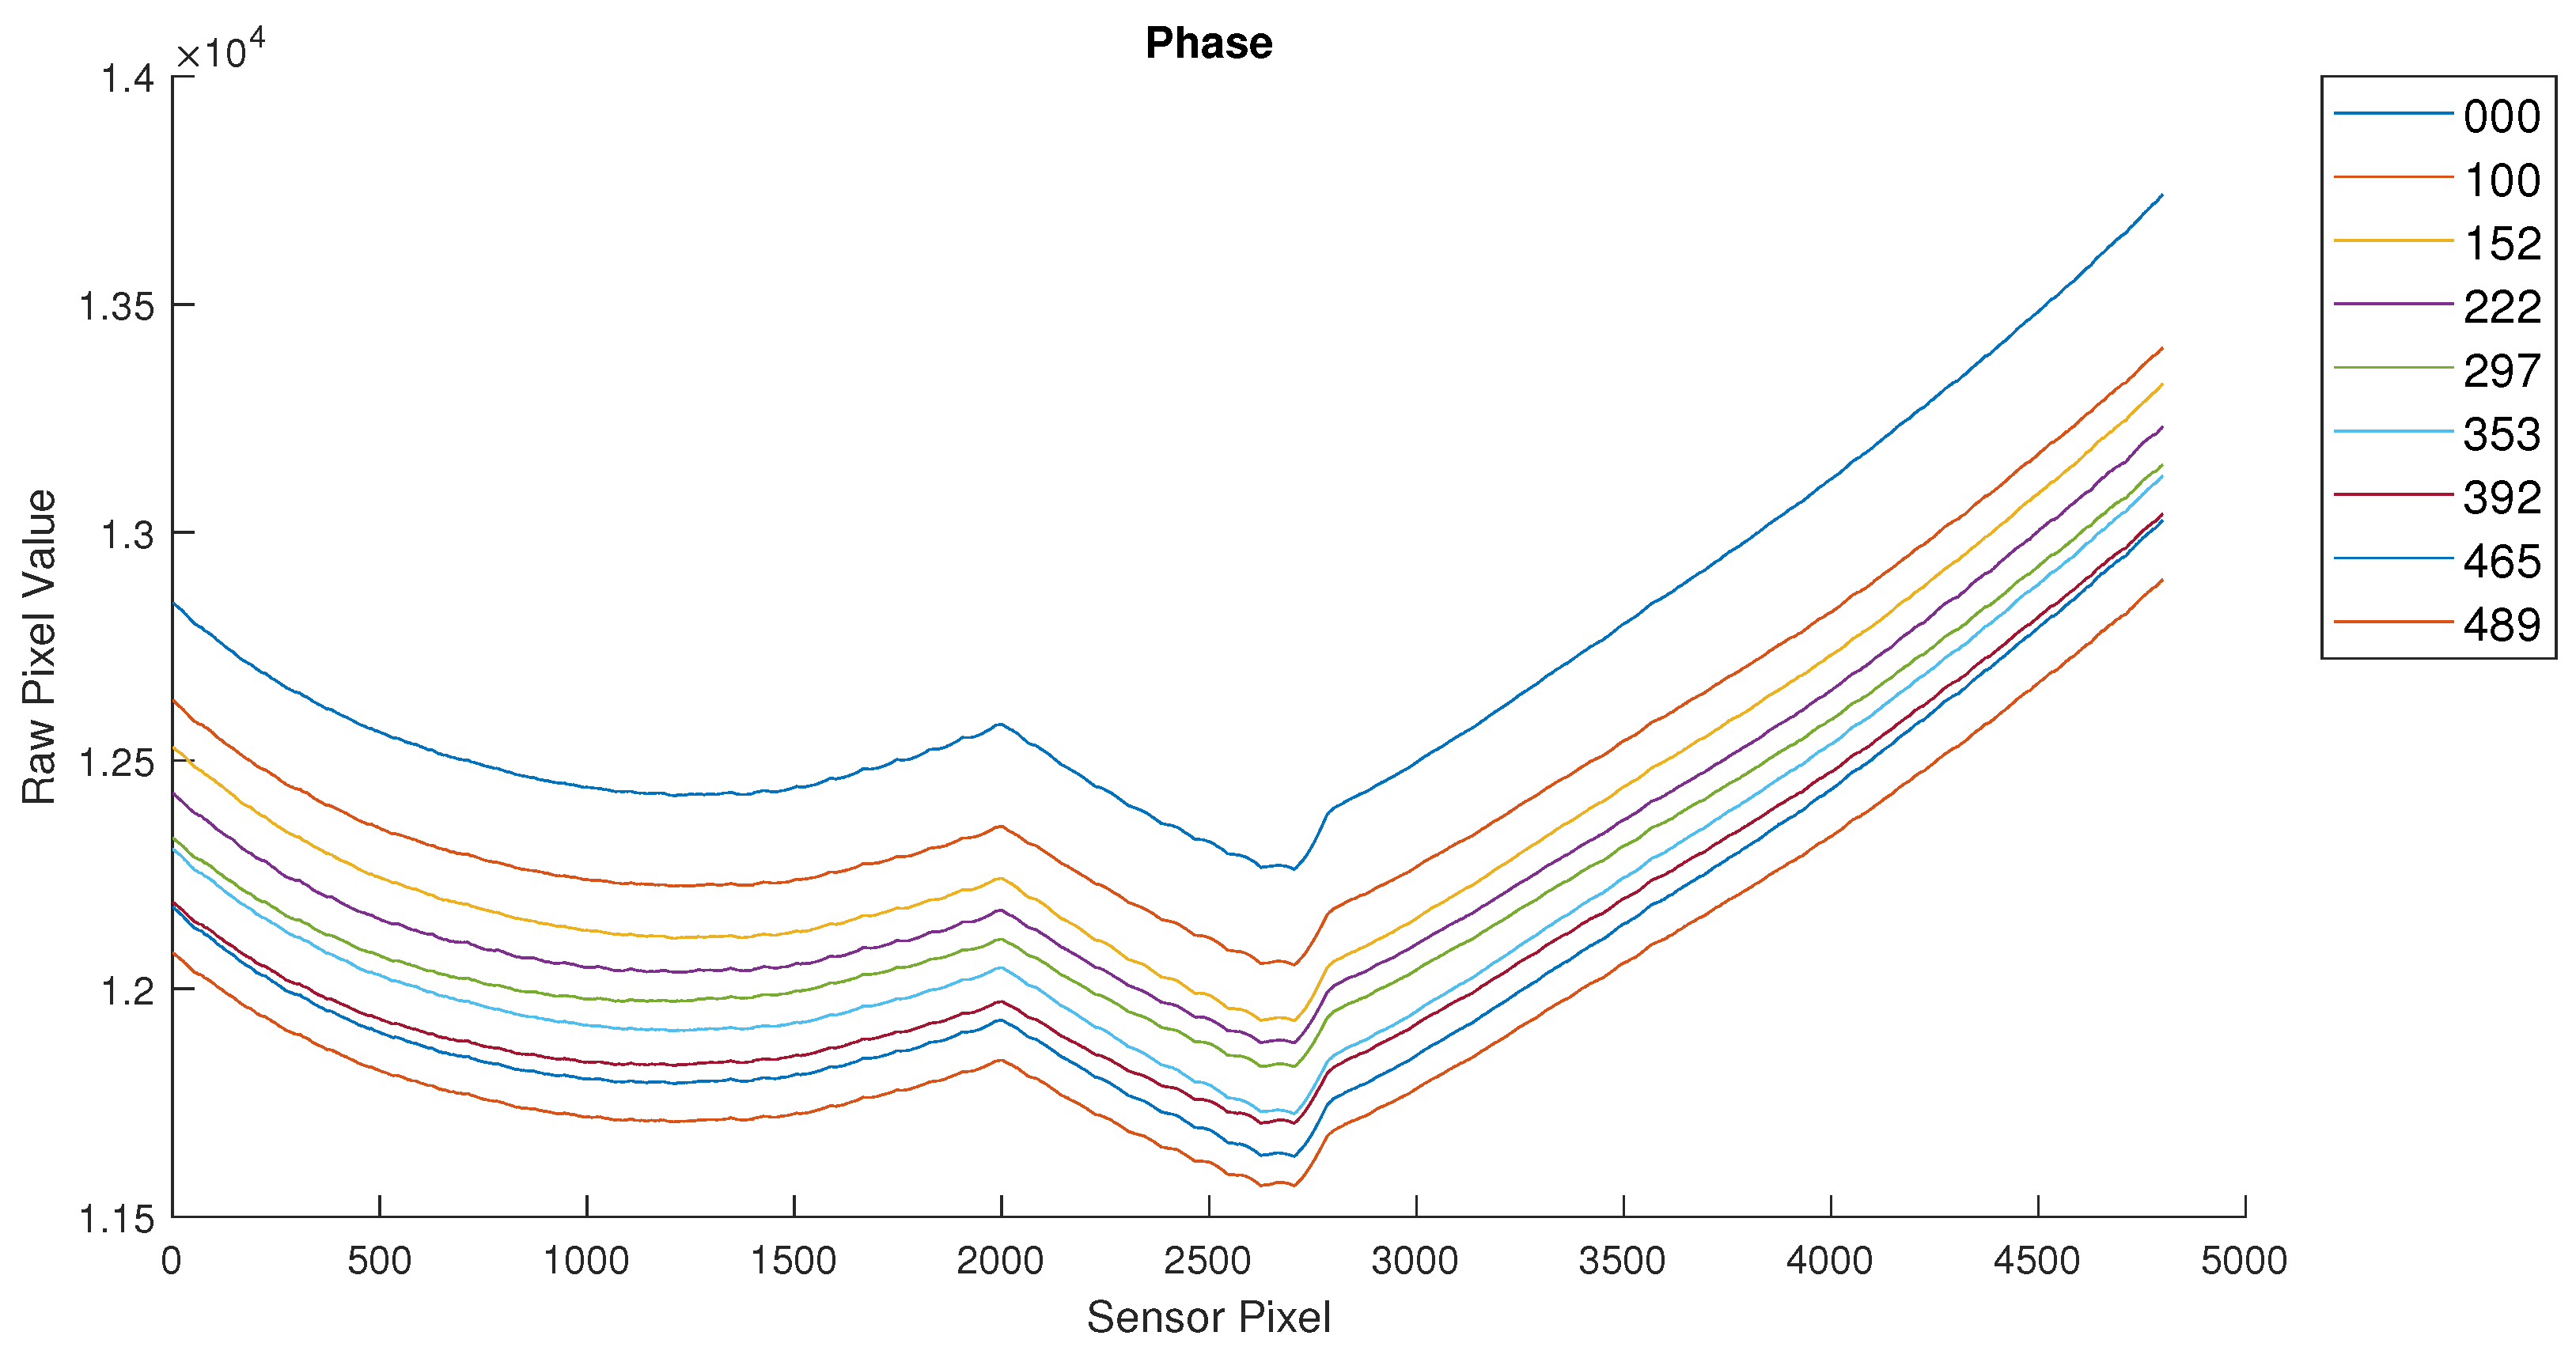
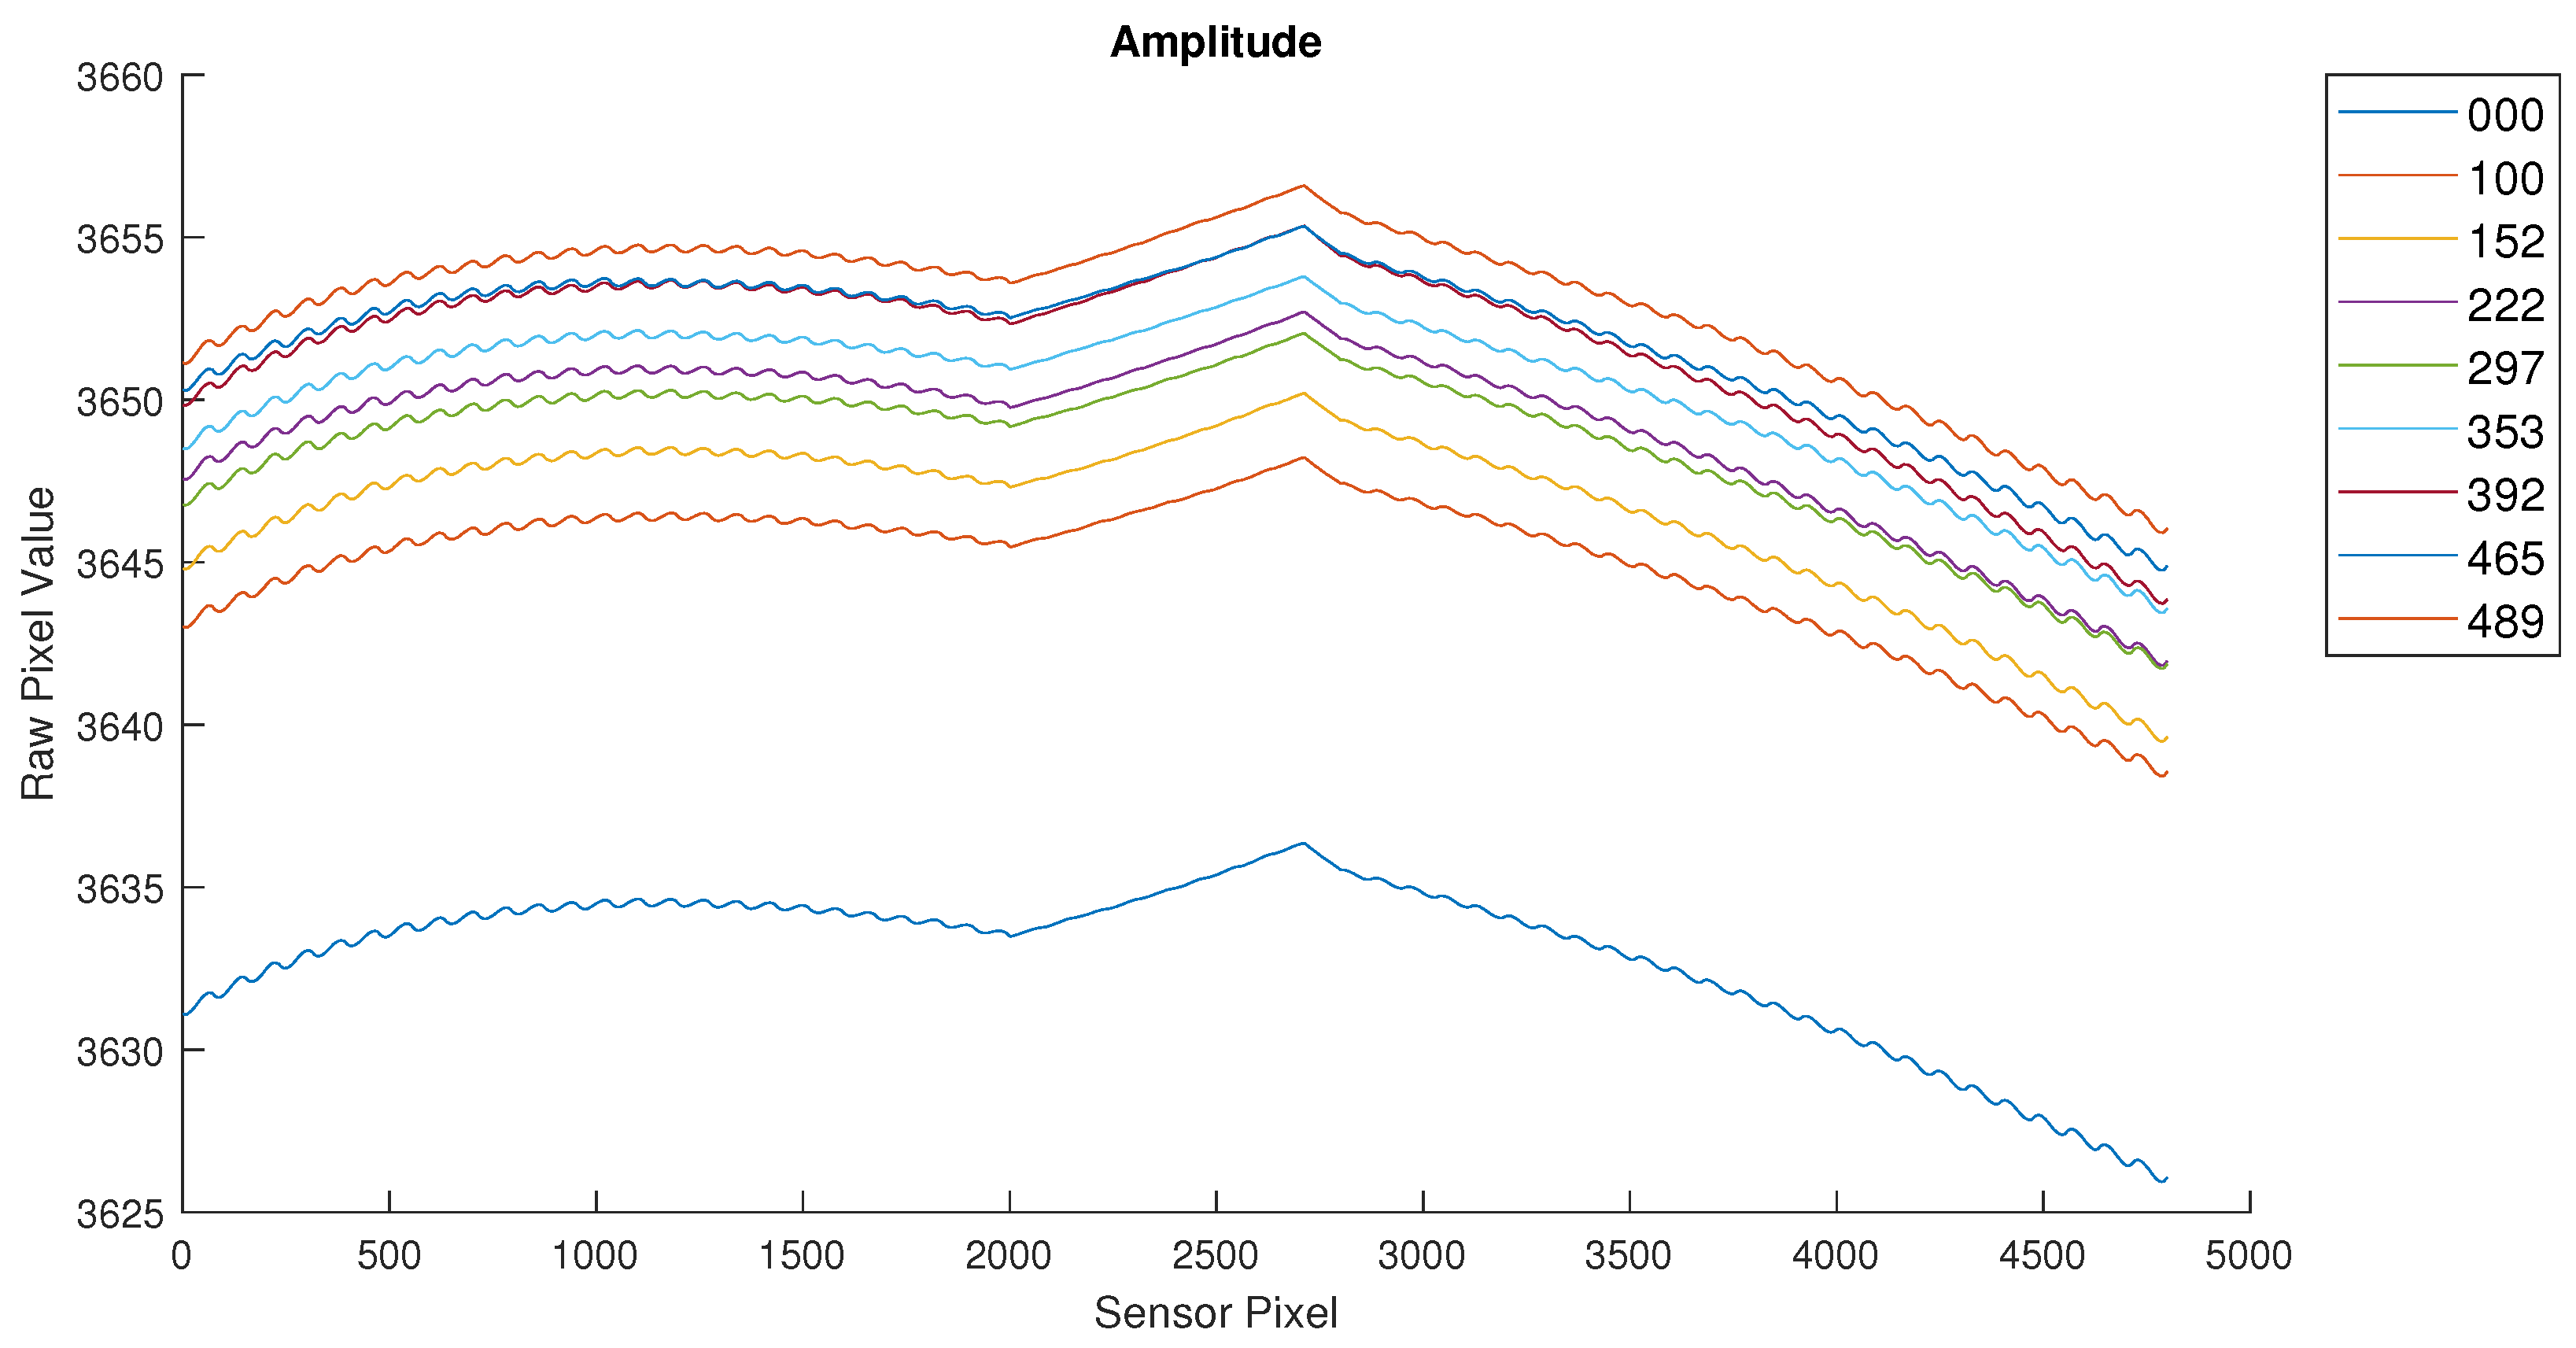
After initial verification of the sensor operation, the full samples were measured using the sensor developed. The initial results were not as expected and indicated that the samples did not have the expected glucose concentration. This led to their recreation and verification using laboratory instruments. The samples were then relabeled based on the measured glucose concentration. The final measurements are shown in
Figure 8 and
Figure 9.
The results shown in the previous figures are the raw sensor values for each pixel of the sensor (an array of 80 × 60 pixels). This sensor value is proportional to the phase difference of the received signal vs the emitted (reference) signal. An increased value for a sensor pixel represents an increased distance traveled by the light pulses emitted by the LED.
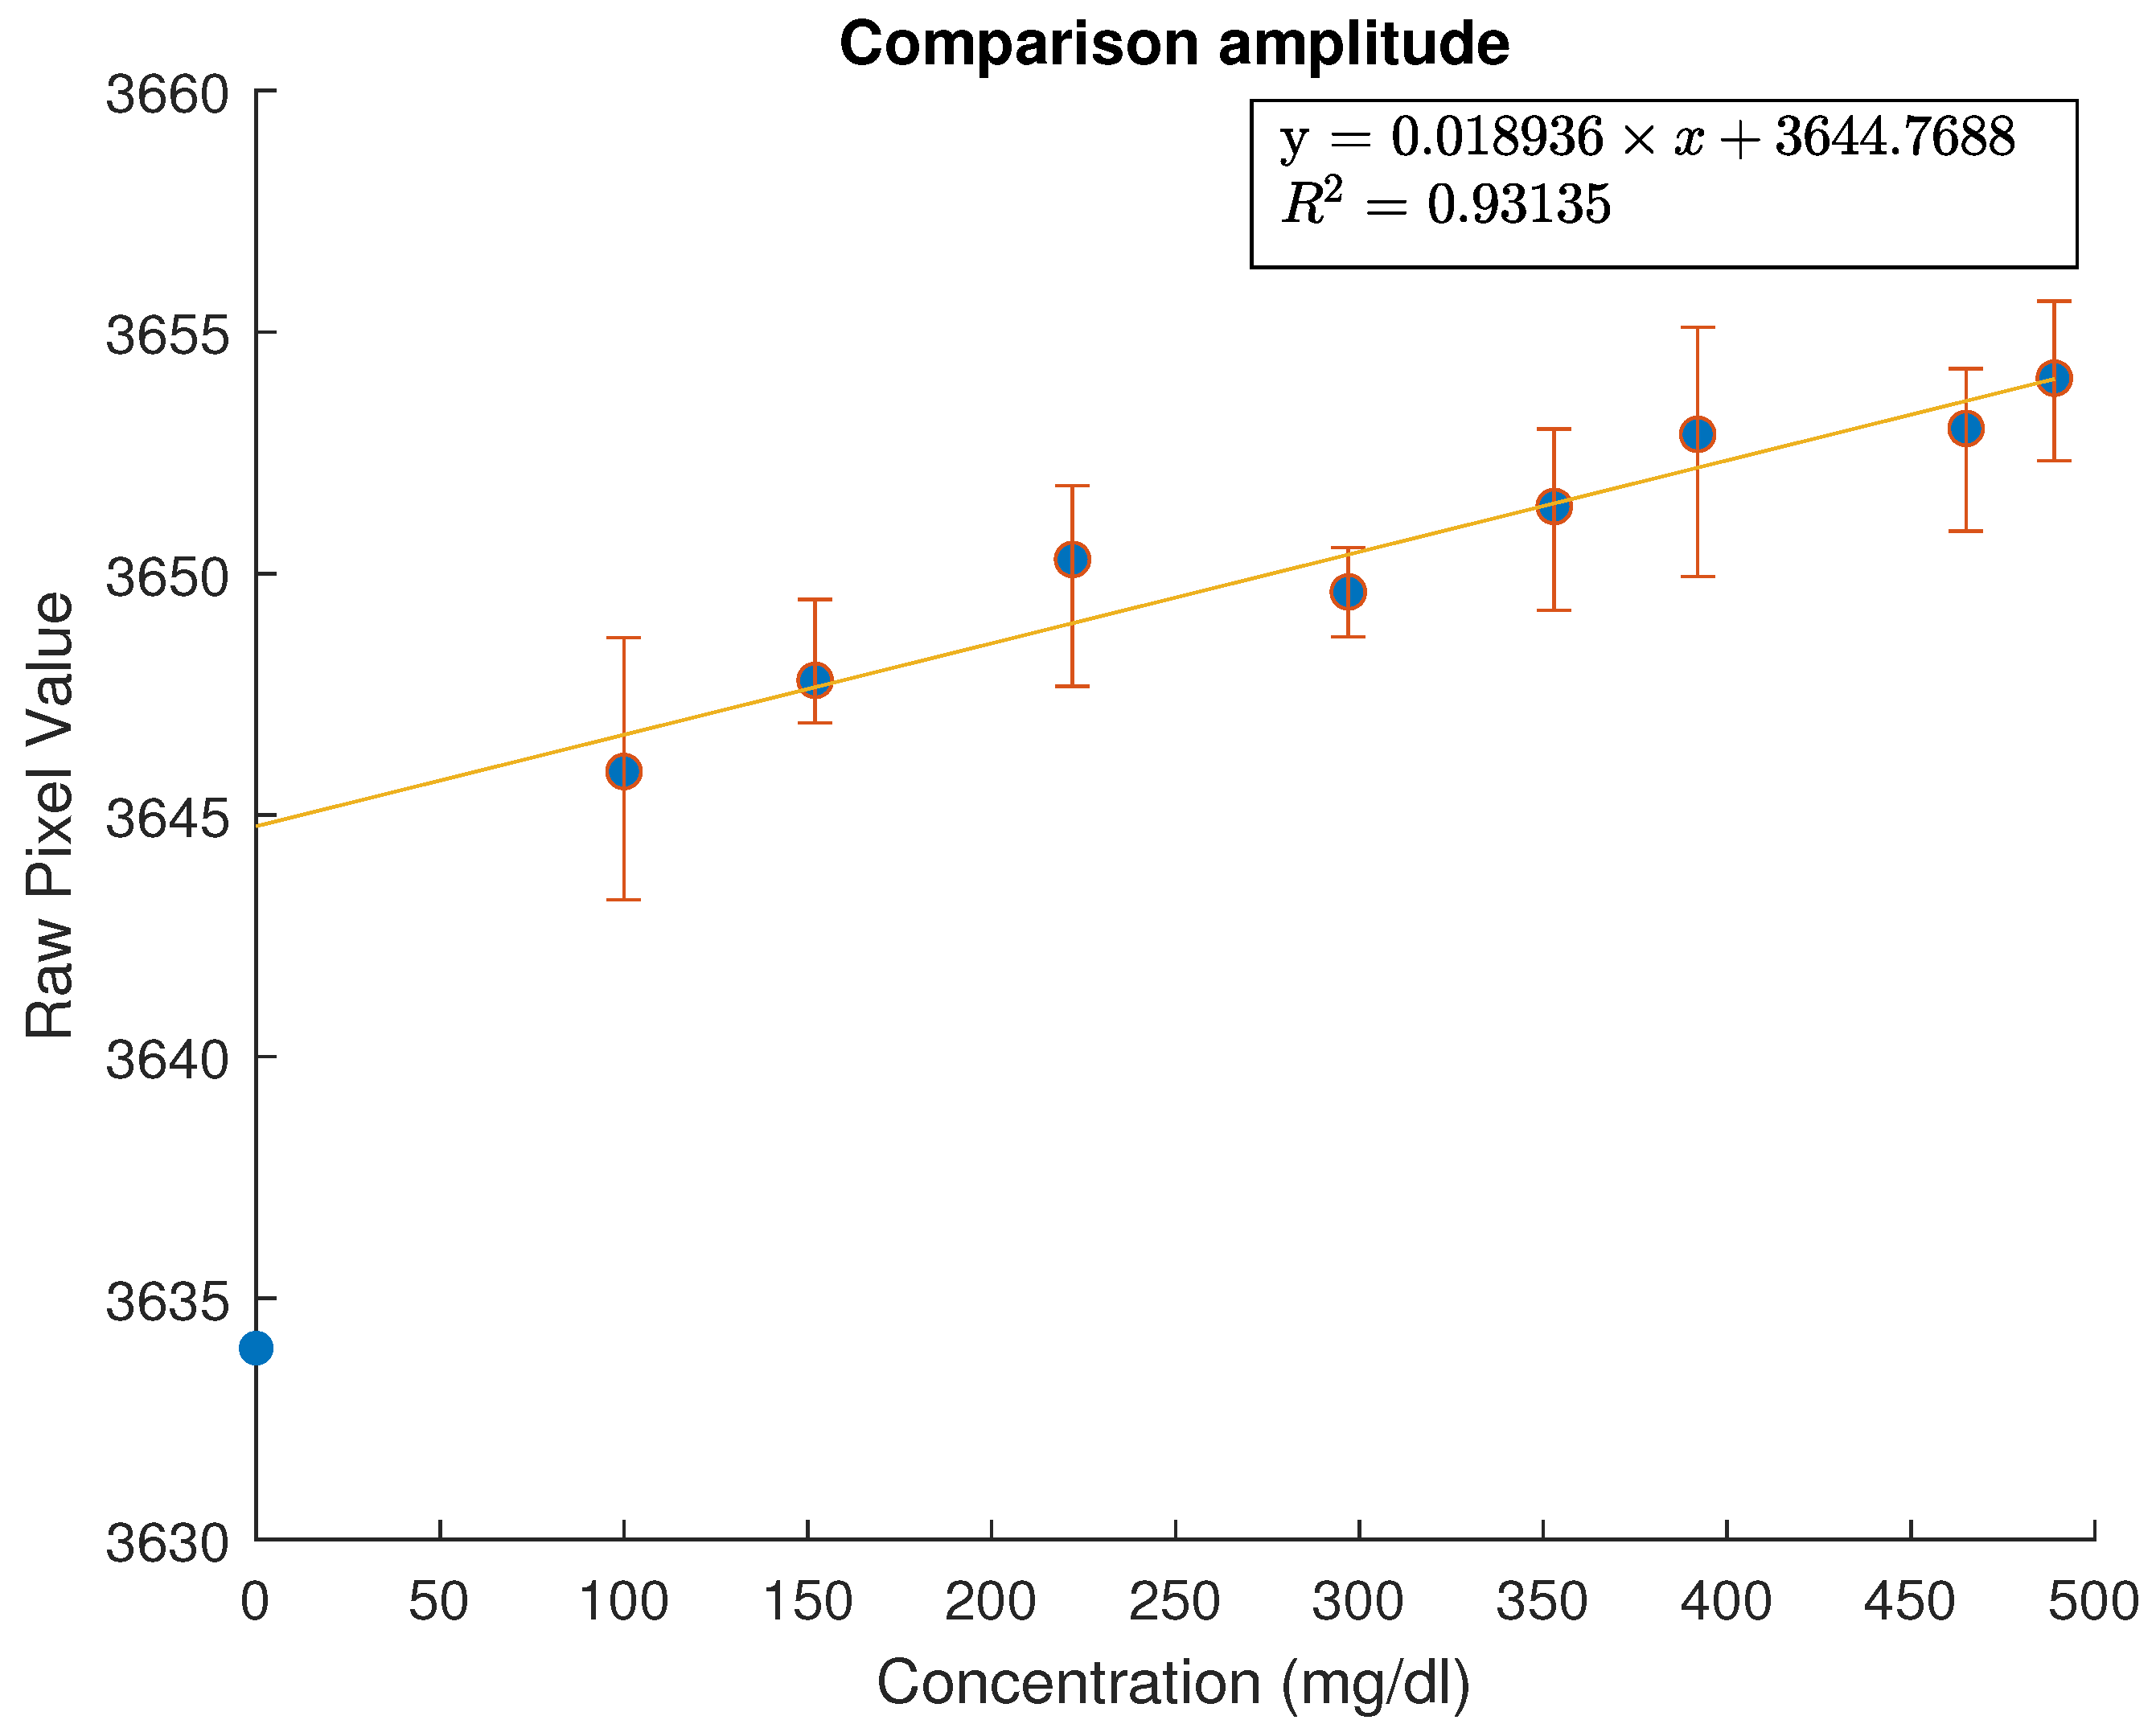
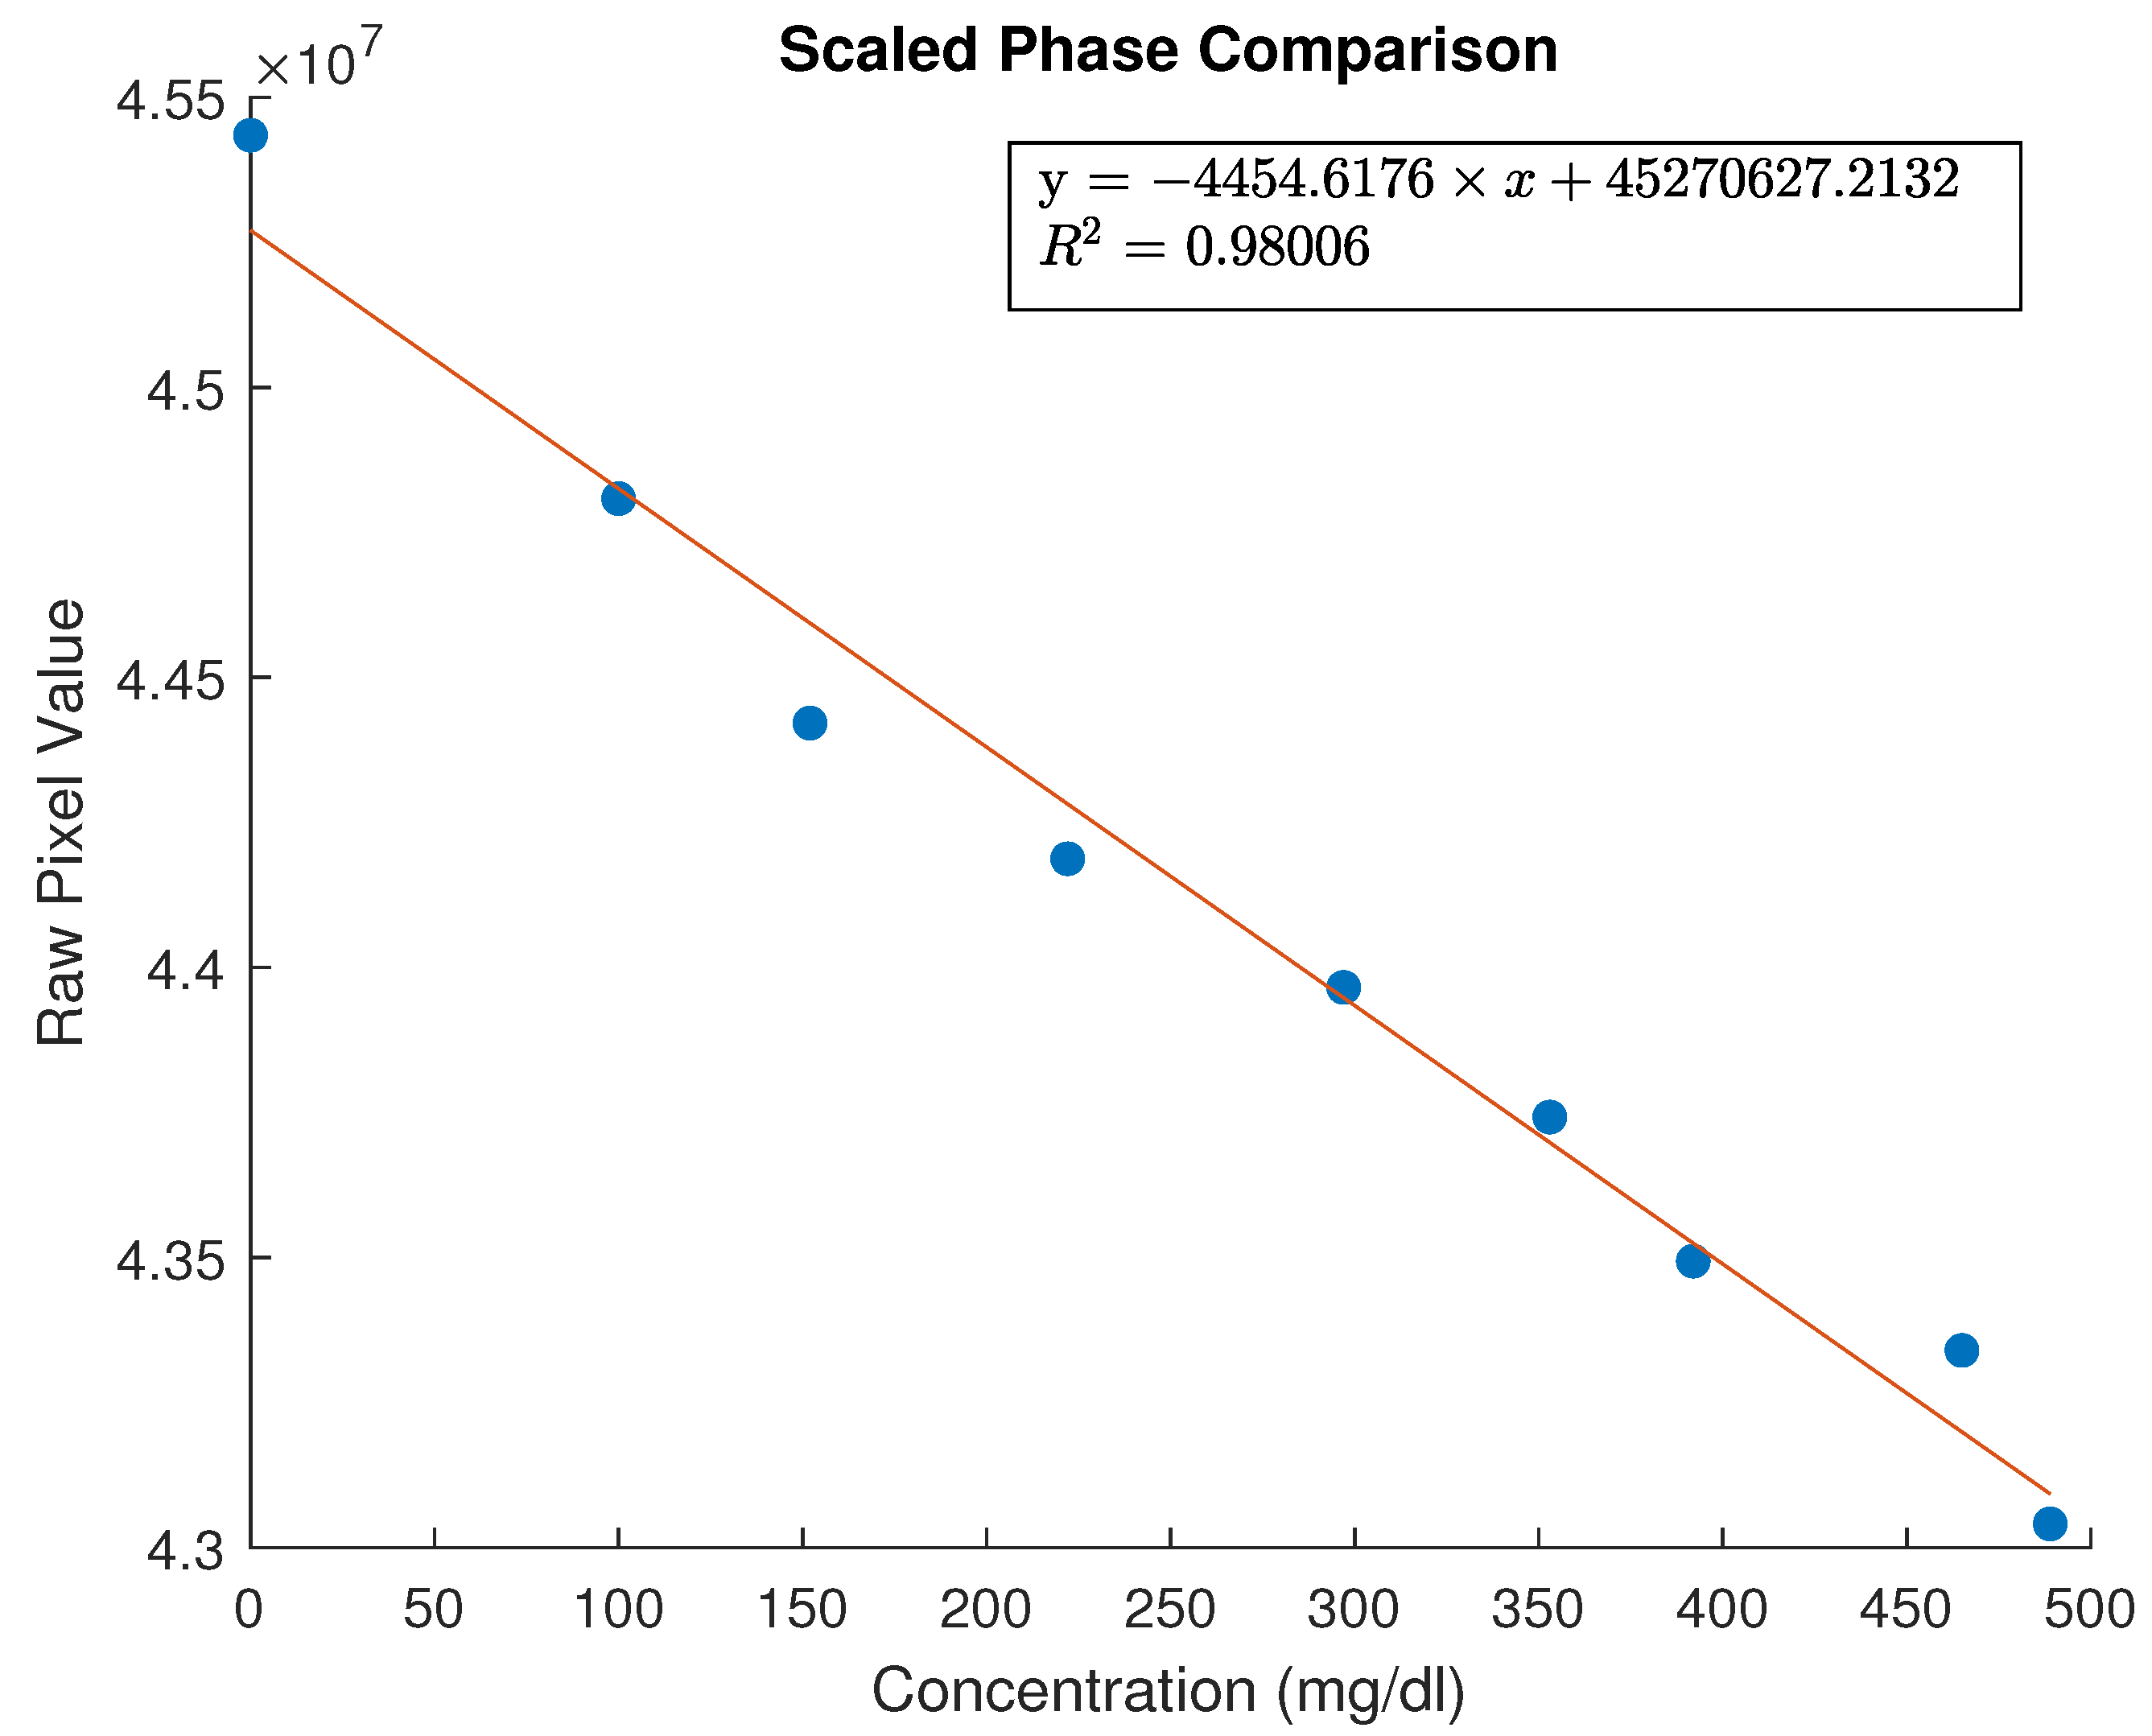
To correlate the measured values with the real glucose values, the moving average window was increased to 4000 samples. The result of plotting the mean value of data received versus the concentration is shown in
Figure 10,
Figure 11 and
Figure 12. Error bars were added using the values from multiple measurements performed on each sample (with the exception of
Figure 12). Error bars were added only on sensor measurements—glucose concentration of samples was verified with existing certified sensors. An initial linear fit was attempted—the polynomial degree was chosen so as to arrive to an
. Thus, a first degree polynomial was chosen for both the amplitude data and the phase data. The factors of those as well as the
values are shown in the relevant figures.
Additionally, the measured amplitude signal of the pure saline sample was used along with the amplitude signals of the rest of the samples to create scaling factors. These were applied to the phase measurements and the results are shown in
Figure 12.
5. Discussion and Future Work
Based on the above results, the developed sensing method shows promise in the measurement of glucose in aqueous solutions, based on the change in the optical properties. The developed sensor allowed for the detection of glucose changes based on the change in the Time-of-Flight of light through a sample using relatively inexpensive, off-the-shelf components. The results of the sensor show a correlation between the measured value and the sample glucose concentration. The error margins are relatively high, but it should be possible to improve these with further fine tuning of the different sensor variables and circuit design. The authors consider the developed sensor to be at TRL3—the sensor demonstrates basic functionality under in a research environment; however, further work is needed.
Future work on this TRL3 sensor should begin with an experimental design, integrating both in vitro and in vivo testing stages alongside direct comparisons to benchmark equipment. To this end, experiments will be structured to include baseline readings, dynamic environmental exposures, and testing in the presence of potential interferents. The sensor could be tested on a lipid emulsion to simulate skin optical properties (as has been tried by Kirillin et al. with good results [
18]). The sensing element used has multiple parameters that should be further adjusted to improve the sensor response—initial values based on datasheet recommendations were used in this work. These parameters could also affect the sensor response in different environments.
After reaching a well defined state for the sensor parameters, experimentation should be expanded to include live biological specimens or human subjects (where applicable) to finally observe the sensor’s behavior in a biological matrix and revealing any potential effects by other biological materials, response time variations, and other sensor–material interactions. Initial work has already been conducted to verify that the LED wavelength and light emitted are sufficient to achieve an acceptable penetration depth (using data and skin models from Anderson et al. and Bashkatov et al. [
19,
20]).
An additional experimental modification is the wavelenght used. Further work should increase the spectrum of wavelengths used—there have been promising results from using wavelengths in the NIR region between 1200 nm up to 2500 nm [
21]. To address this, revised versions of the sensor presented here are currently being designed that will operate in this region. Such sensors will probably have a decreased area of measurement, but will be based on the same principle. The authors are currently in the process of evaluating these updated sensing elements and optimizing the accompanying circuit design to enhance the sensor’s stability and sensitivity. However, LEDs of sufficiently high speed and photodiodes of a likewise high sensitivity able to operate in these wavelengths are prohibitively expensive when compared with devices tuned for wavelengths less than 1000 nm. Thus, while such a research direction could prove beneficial regarding the sensor operation, it should be heavily weighted with the current implementation, which is very low cost—with a complete sensor package costing about 100 EUR at the time of writing.
On the processing side, future work should focus on refining the quality of image-based data by employing advanced noise reduction algorithms. Adding to that, it is also important that the data processing workflow is further expanded and optimized or even improved upon. The moving average algorithm currently used, while effective in certain scenarios, has limitations and may not fully optimize noise reduction while preserving essential information. Techniques such as weighted averaging and bilateral filtering will be explored for their ability to preserve fine details while effectively mitigating noise, particularly in environments with high variability. Comparative studies will be conducted to identify the most suitable algorithm, balancing computational efficiency and performance. Prior research has demonstrated the utility of bilateral filtering in maintaining edge integrity in noisy medical images (as was done in general for images by Tomasi & Manduchi [
22]) and the applicability of weighted averaging for reducing noise in imaging data. Additionally, the nonlocal-means algorithm has been used with promising results (as has been shown in the work of Buades et al. [
23]). These insights will guide the optimization of the sensor’s data processing pipeline, aiming to enhance the reliability and accuracy of glucose concentration measurements.
Finally, the results of the sensor should be compared with a robust theoretical model to complement the experimental findings. This model will be based on finite element analysis (FEA). A method is currently being developed to simulate light scattering in a multilayered tissue model (based of the work of Vasudevan et al. [
24], Liemert et al. [
25], and Saidi et al. [
26]). The objective is to establish a predictive framework that accurately reflects the sensor’s performance, which will in turn should allow for optimization of the sensor design for diverse applications. Furthermore, integrating this model with experimental validation will enhance the reliability of the sensor, providing deeper insights into its operating principles and enabling its use in more complex scenarios.


