Article

Research on Damage Assessment Method for Reinforced Concrete T-Girder Bridges Under Munitions Strikes

Xi’an Modern Chemistry Research Institute, Xi’an 710000, China
*
Author to whom correspondence should be addressed.
Appl. Sci. 2024, 14(23), 11422; https://doi.org/10.3390/app142311422
Submission received: 1 October 2024 / Revised: 1 November 2024 / Accepted: 6 December 2024 / Published: 8 December 2024
(This article belongs to the Section Computing and Artificial Intelligence)

Abstract

:
As a transportation hub, the girder bridge is often an important target for both sides in combat, and it is very important for wartime decision-making and subsequent fire planning to carry out assessment on the effect of the damage to the bridge after the fight. The use of images for target damage assessment is more secure and efficient compared with the traditional method of manual inspection. However, the current image-based damage assessment of girder bridges has the problems of neglecting the damage to bridge piers and the poor stability of the damage features. To address these issues, this paper proposes a functional damage assessment method for beam bridges after being hit by ammunition based on visible light images. This method decomposes the girder bridge into two main sub-targets (the abutment and deck), analyzes its functional characteristics, designs the residual bearing capacity of the bridge and the number of passable lanes in the damage features, proposes an algorithm for conversion from image features to damage features and a fusion algorithm for the damage features, and establishes the rules for the evaluation of the damage level accordingly. The MATLAB experiment verifies that the method is able to extract the residual bearing capacity and the number of passable lanes from the image of the post-fighting girder bridge and to obtain the damage assessment results, which provides a new method for the assessment of the effect of damage to girder bridges.

1. Introduction

The girder bridge, as a modern urban transportation hub, is often an important target for both sides in combat to block the transportation of war materials, halt urban economic development, and paralyze the enemy, and it is important to to perform an assessment of the effects of the destruction of the bridge after the fight. It plays a very important role in the subsequent planning of fires [1]. The US Joint Chiefs of Staff defined the Battle Damage Assessment (BDA) as follows: The timely and accurate estimate of the damage resulting from the application of military force, either lethal or nonlethal, against a predetermined objective [2]. Since World War II, the US Army has continued to improve the means of damage assessment of strike targets, and since 2001, the US Army has held an annual Damage Battle Assessment conference, where new theories of and technology for damage assessment are discussed [3]. At present, the U.S. Army has formulated the “Target Damage Assessment Quick Guide” [4], “Target Damage Assessment Reference Manual”, and other special orders and manuals to move damage assessment toward standardization, quantification, and rapid development [5]. Today, most countries have formed a comprehensive assessment information collection network of multiple sources such as reconnaissance satellites, manned and unmanned reconnaissance aircraft, airborne sensors, ballistic sensors, human intelligence, etc. [6]. The use of imagery for the target’s damage assessment and the ability to remotely access the image to judge the target’s damage situation (with the advantage of ensuring the safety of the personnel and a rapid response on the battlefield) have become the main method of battlefield damage assessment [7,8].
The current image-based assessment of the effects of damage to a girder bridge is mainly focused on the components of the bridge deck; it is not possible to assess the overall state of the bridge after being hit, and only using the bridge in the image to calculate the damage level of the changing features, such as geometric features and texture features, is very susceptible to external conditions and minor noise interference, resulting in low credibility and poor accuracy in the damage assessment results. In addition, the small number of samples regarding bridge destruction makes it difficult to apply machine learning-type methods.
Based on the above problems, this paper proposes a method for assessing damaged girder bridges based on visible light images. The girder bridge is decomposed into two main sub-targets, the piers and the bridge deck, and an unmanned aerial vehicle (UAV) is used to capture the images, and the original images are pre-processed with image enhancement, image alignment, and change detection to identify and extract the pothole damage data. The damage characteristics of the remaining bearing capacity and the number of bridge through-lanes are proposed, the algorithm converting image features to damage features and the damage feature fusion algorithm are designed, and the damage level evaluation rules are established accordingly. These factors are combined with the pothole damage data, damage features, feature fusion results, and damage grade to calculate and complete the evaluation of the effect of the damage to the girder bridge.
The innovations of this paper are as follows. (1) We establish a transformation relationship between post-damage bridge images and residual bridge load capacity. (2) We propose a visible image-based method to detect the number of passable lanes on post-damage bridges. (3) We perform experimental simulations via MATLAB and prove the effectiveness of the proposed method.
This paper is organized as follows. Section 2 introduces the existing work on bridge damage assessment. Section 3 designs an algorithm for the extraction of damage indicators based on the characteristics of the image. The simulation system and experimental results are shown in Section 4. Section 5 concludes the paper.

2. Related Work

Currently, image-based damage assessment research is mainly categorized into change detection methods and machine learning-type methods.
In the first type of method, the images of the target area before and after the strike are detected by the change detection method, and the damage assessment is carried out by utilizing the change feature quantity or its variants. First, feature quantities such as change pixel value, change area mean value, and change area can be directly utilized to calculate the damage assessment results. For example, Zhang [9] used the percentage of effective change to effective area to judge the degree of target destruction. Secondly, the geometric and texture features, such as “quadratic distance”, can be calculated after the change detection and used to construct the damage assessment level calculation model. For example, Niu et al. [10] designed hierarchical assessment criteria, the use of the overall feature vector “similarity”, geometric and texture features, and “secondary distance” characteristics for the damage assessment of airports. Yu [11] designed different damage characteristics for different strike targets, the geometric features of the aircraft target, and the damage characteristics of the aircraft target. The following destruction characteristics are targeted to determine the degree of destruction of various types of targets: damage characteristics, the rate of change of geometric features of aircraft targets, texture features, etc.; the number of craters per unit length of the bridge target, the area of damage per unit length, the number of truncated areas, etc.; and after the runway target is damaged, whether there is a rectangular area on the runway target to meet the needs of aircraft takeoff. Li et al. [12], for the design of ship targets, extracted geometric features and texture features for the assessment of damage to airports. Li et al. [12] extracted geometric features and texture features for ship target design to carry out grading assessment. Again, we can also analyze the functional characteristics of the target based on the target characteristics and design and the conversion method between the target image change features and the target functional features so as to carry out functional damage assessment of the target. For example, Ji et al. [13] designed the longest takeoff length index of the airport runway based on the functionality of the airport. Pu et al. [14] judged the degree of damage by the number of effective takeoff and landing windows, the residual retention ratio of the number of takeoff and landing windows, and the length of the takeoff and landing window retention ratio, and Liu [15] designed the narrowest through-path based on the bridge’s functionality for through traffic in the literature. Finally, the feature quantities calculated by each method can be fused to design a feature fusion model to enhance the robustness of the damage assessment model. For example, Gu et al. [16] used the damage length ratio of the runway area, the percentage of damage in the contact area, and the damage area ratio of the airfield area to judge the degree of damage. Liu et al. [17] introduced the fuzzy consistency matrix-based fuzzy analytic hierarchy process (FAHP) method to determine the weights of physical damage, functional damage, and recovery ability indicators to derive the target’s damage level, and Wang et al. [18] classified the target into multiple regions of interest according to the importance of its components and then analyzed the target’s damage level according to the importance of the target’s functionality. Wang et al. [18] divided the target into several regions of interest and then independently calculated the damage indicators for each region and weighted them together to realize the damage assessment. For this class of methods, the core is to design the number of features that can accurately assess the target, and the current research lacks the extraction of functional features of the target and cannot scientifically and accurately assess the state that the target is in.
The second class of methods uses machine learning-type algorithms to build a damage assessment model based on existing data and to calculate the damage assessment results. Xu et al. [19] combine the YOLO v3 target detection algorithm and a lightweight VGG network to achieve target detection and damage assessment of typical moving ground targets. Polina et al. [20] use convolutional neural networks to generate building footprints from pre-hurricane satellite imagery and classify the damage caused. Zhang et al. [21] applied a genetic algorithm and BP neural network to construct a target damage tree and classify the damage level for damage assessment. Qu et al. [22] proposed an assessment method based on a GA-dynamic BP neural network for the problem of radar position damage assessment and simulated the realization of the damage assessment by radar position. This type of method is improved in accuracy, but it requires a certain number of samples to construct a high-precision model in the specific implementation process, and it is not applicable to small-sample target damage assessment.
For bridge targets, relevant studies at home and abroad are mainly divided into two aspects: damage effectiveness analysis and damage effect evaluation. The effectiveness analysis methods include the blockage algorithm for the bridge deck and simulation-based bridge state analysis research, and most of the application scenarios occur before the strike. The blockage algorithm for the bridge deck is a study of the bridge blocking effectiveness assessment model based on the probability model, using the Monte Carlo algorithm and other stochastic models of the bridge target for the strike simulation and then calculating the bridge blockage if there is a path through and other functional characteristics, finally using blocking probability or the probability of destruction as the destruction assessment index of the target bridge [23,24,25]. Based on the numerical simulation and the simulation analysis of bridge state analysis study, mainly by simulating the response and damage process of bridge structures in different strike situations, the mechanical changes after the strike are analyzed to provide a prediction of the destruction results for the actual strike situation [26,27,28,29,30].
The effect assessment method is mainly a study of the post-strike bridge destruction effect assessment method based on downward-looking images, and the application scenario is the assessment of the target status after the strike. With the development of technology, it is feasible and efficient to use images to analyze the condition of bridges. Duque et al. [31] used a UAV to inspect two wooden bridges and automatically identify defects in the structures from the images collected. Brandon et al. [32] used a UAV and machine learning algorithms to perform an assessment of the condition of the bridges by recording damage information and visualizing it. Standard image processing methods, including edge following, image thresholding, and morphological operations, have been used in [33,34,35] to detect cracks in bridge decks. On the other hand, refs. [36,37] built machine learning-based classifiers to form an automatic crack detection model. The analysis of the above literature reveals that it is possible to detect the state of bridges using images, but most of these studies focus on health monitoring and lack the assessment of the state of bridge damage under munitions strikes. For the assessment of bridge damage status under munitions strikes, Yu [11] proposes a method to judge the truncation of bridges based on image change detection but can only judge whether the bridge is truncated or not in two states. Liu [15] proposes an assessment index of the narrowest through-path using bridge images and searches for the narrowest through-path through scanning the binary image by means of a circular template, but it cannot judge the number of lanes that can be parallelized. Finally, Kang [38] proposes a maximum usable traffic lane model based on the idea of template matching and proposes the maximum number of available lanes and the maximum bearing capacity model method, but the information established in the data is known, and it is not possible to use images to complete the post-battle bridge damage assessmentt.
Based on the above analysis, for the problem of bridge munitions strikes, images are used to perform post-strike bridge damage assessment research. Due to the limitation of the number of samples, we use the traditional change detection class method. On this basis, in order to improve the scientificity and accuracy of the assessment results, we design the destruction features according to the function of the bridge, establish the conversion function between the image features and the functional features, and then carry out the destruction assessment of the bridge.

3. Image Feature-Based Extraction of Damage Indicators

Since damage assessment has certain requirements for image quality, drone images of bridge piers and bridge decks can be collected, and drone image collection has the advantages of operational flexibility and equipment selectability, which can ensure the quality of image data to a certain extent. After the acquisition of images, there are many factors that affect image quality due to this process, including weather, environment, shooting viewpoint, and so on. Therefore, in order to suppress the image noise and enhance the damage features, the image must be preprocessed to facilitate the distinction between the background and the bridge while accurately extracting the damage regions. The histogram equalization algorithm can improve the contrast between the bridge target and the background to facilitate the extraction of the target [39], and the image alignment algorithm can attenuate the effect of different shooting angles to facilitate change detection [11].
In bridge damage assessment, in order to ensure the accuracy of the assessment results, there are certain requirements for image acquisition. First, the distance between the camera and the bridge needs to be able to comprehensively cover the entire bridge structure and be able to recognize the crater features, while recognizing small weak features such as tiny cracks is not necessary. Second, the image resolution does not need to be very high. Too high a resolution, although richer in detail, increases the processing time and computational cost significantly, and 720 pixels is sufficient to detect an impact crater. Therefore, in order to obtain accurate damage assessment results, it is recommended that the appropriate distance and resolution be selected during image acquisition. Specifically, the distance between the camera and the bridge should be between 10 and 30 m (to capture the bridge structure in its entirety), and the image resolution should be kept in the 720p to 4K range.
When studying the damage assessment of bridges after a munitions strike, the state of the bridge prior to damage has a relatively small impact on the damage assessment. This is because munitions strikes are usually extremely high in energy density and usually result in fracture or collapse of critical parts of the structure (e.g., piers, abutments, etc.), and this macroscopic damage is far beyond the impact of the initial defects. The degree of damage and the pattern of damage of new and old bridges under the same munitions strikes are basically the same, and the difference may be reflected mainly in the subtle crack expansion rate, but it has little effect on the overall results of the assessment. In summary, although the state of the bridge before damage will have some influence on the structural performance, these effects are relatively small under the action of high-energy munitions strikes. Therefore, when assessing bridge damage after a bombing, more attention can be paid to key factors such as location and intensity of the explosion, without excessive consideration of the initial state of the bridge.
After using the UAV to take visible-light images, damage analysis of the bridge structure is carried out to identify the bridge pier and bridge deck, and the strike crater is simplified to a circle for the convenience of the analysis. Based on the above analysis, the abutments play the role of support and force transmission in the bridge structure, so the impact of the abutment damage on the bridge is primarily reflected in the change of bearing capacity, and the bridge deck mainly provides the passageway and transmits the load, so the impact of the bridge deck damage on the bridge is mainly reflected in the change of the path of the passageway and the remaining bearing capacity. At the same time, for the bridge blow, there may be penetration and loss of quality in two types of conditions and different conditions on the components of different impacts. The same location and size will also lead to the advantages and disadvantages of the state of the damage, so we need to distinguish between the different states and the assessment and then calculate the comprehensive results; the flowchart of the method is shown in Figure 1.

3.1. Residual Bearing Capacity Extraction Algorithm

3.1.1. Static Analysis of Bridge Piers and Decks

For the abutment and deck members of a girder bridge, which are simplified as two rectangular bodies without considering the mechanical influence brought by the natural environment, the abutment force is mainly composed of vertical loads, including the ground support force, the self-weight of the abutment, and the weight of the bridge deck and the loads such as the vehicles passing through the bridge, which will exert pressure on the connection between the abutment and the bridge deck. A measure of the bearing capacity of a bridge abutment can be expressed in terms of stress σ . The stress is calculated as:
σ = F / A ,
where F denotes the force applied to the stressed object and A denotes the cross-sectional area of the stressed object.
Since the abutment is a vertical structure, F is the combined force of the ground support force Fo, the abutment self-weight is G, and the bridge deck transfer load is Q. The force is manifested as pressure, and A is the horizontal cross-sectional area of the abutment. When the beam structure is complete, due to the existence of self-weight, in any transverse cross-section of stress with the height of the decrease and increase, when the abutment structure is missing, the missing part of the cross-sectional area decreases and will be in the missing part of the stress concentration. Therefore, the size of the residual bearing capacity of the bridge abutment is negatively correlated with the height of the strike location and positively correlated with the strike intensity, and the simplified force situation is shown in Figure 2.
Since the bridge deck is a transverse structure, F is the combined force of the reaction force of the pier support Fo, the self-weight of the bridge deck G, and the passing vehicle load Q on the bridge deck, and the force of the bridge deck manifests itself as a bending moment, calculated as:
M = F / x ,
where F denotes the shear force applied at a location and x denotes the distance from that location to the support surface.
When the bridge deck structure is complete, the bending stress in the bridge deck length direction is half the maximum, and when the bridge deck structure is missing, it will produce stress concentration in the missing parts. Therefore, the size of the residual bearing capacity of the bridge deck is negatively correlated with the distance of the strike location from the center of the bridge deck and positively correlated with the strike intensity, and the simplified stress situation is shown in Figure 3.

3.1.2. Residual Bearing Capacity Extraction

The residual bearing capacity (RBC) of the bridge is extracted from the image using template matching. According to the static analysis of the bridge pier and bridge deck, it is known that the bridge residual bearing capacity is affected by the combined effect of the two and will be affected by three factors: the strike location, damage status, and the strike size. Taking the impact crater size as the basis for the establishment of the template, ten types of residual bearing capacity after impact are established, and the residual bearing capacity of the bridge is calculated for the single-crater case. For the case of a multi-bomb crater, the strike location and state of the damage are the influencing parameters according to the weight value of the influence of the impact on the size of the bearing capacity. The weighted coupling is used to calculate the residual bearing capacity under the combined impact of each crater, and finally the calculation results of the pier and bridge deck are coupled. The specific calculation steps are as follows:
  • The results of the abutment and bridge deck image change detection are utilized to mark each strike zone.
  • The state of destruction of each strike region is identified to distinguish between penetration and absence, and the location of their destruction is determined; the abutment is divided into the upper and lower halves, and the bridge deck is divided into two parts, the end of the inward third of the bridge and the remaining middle region.
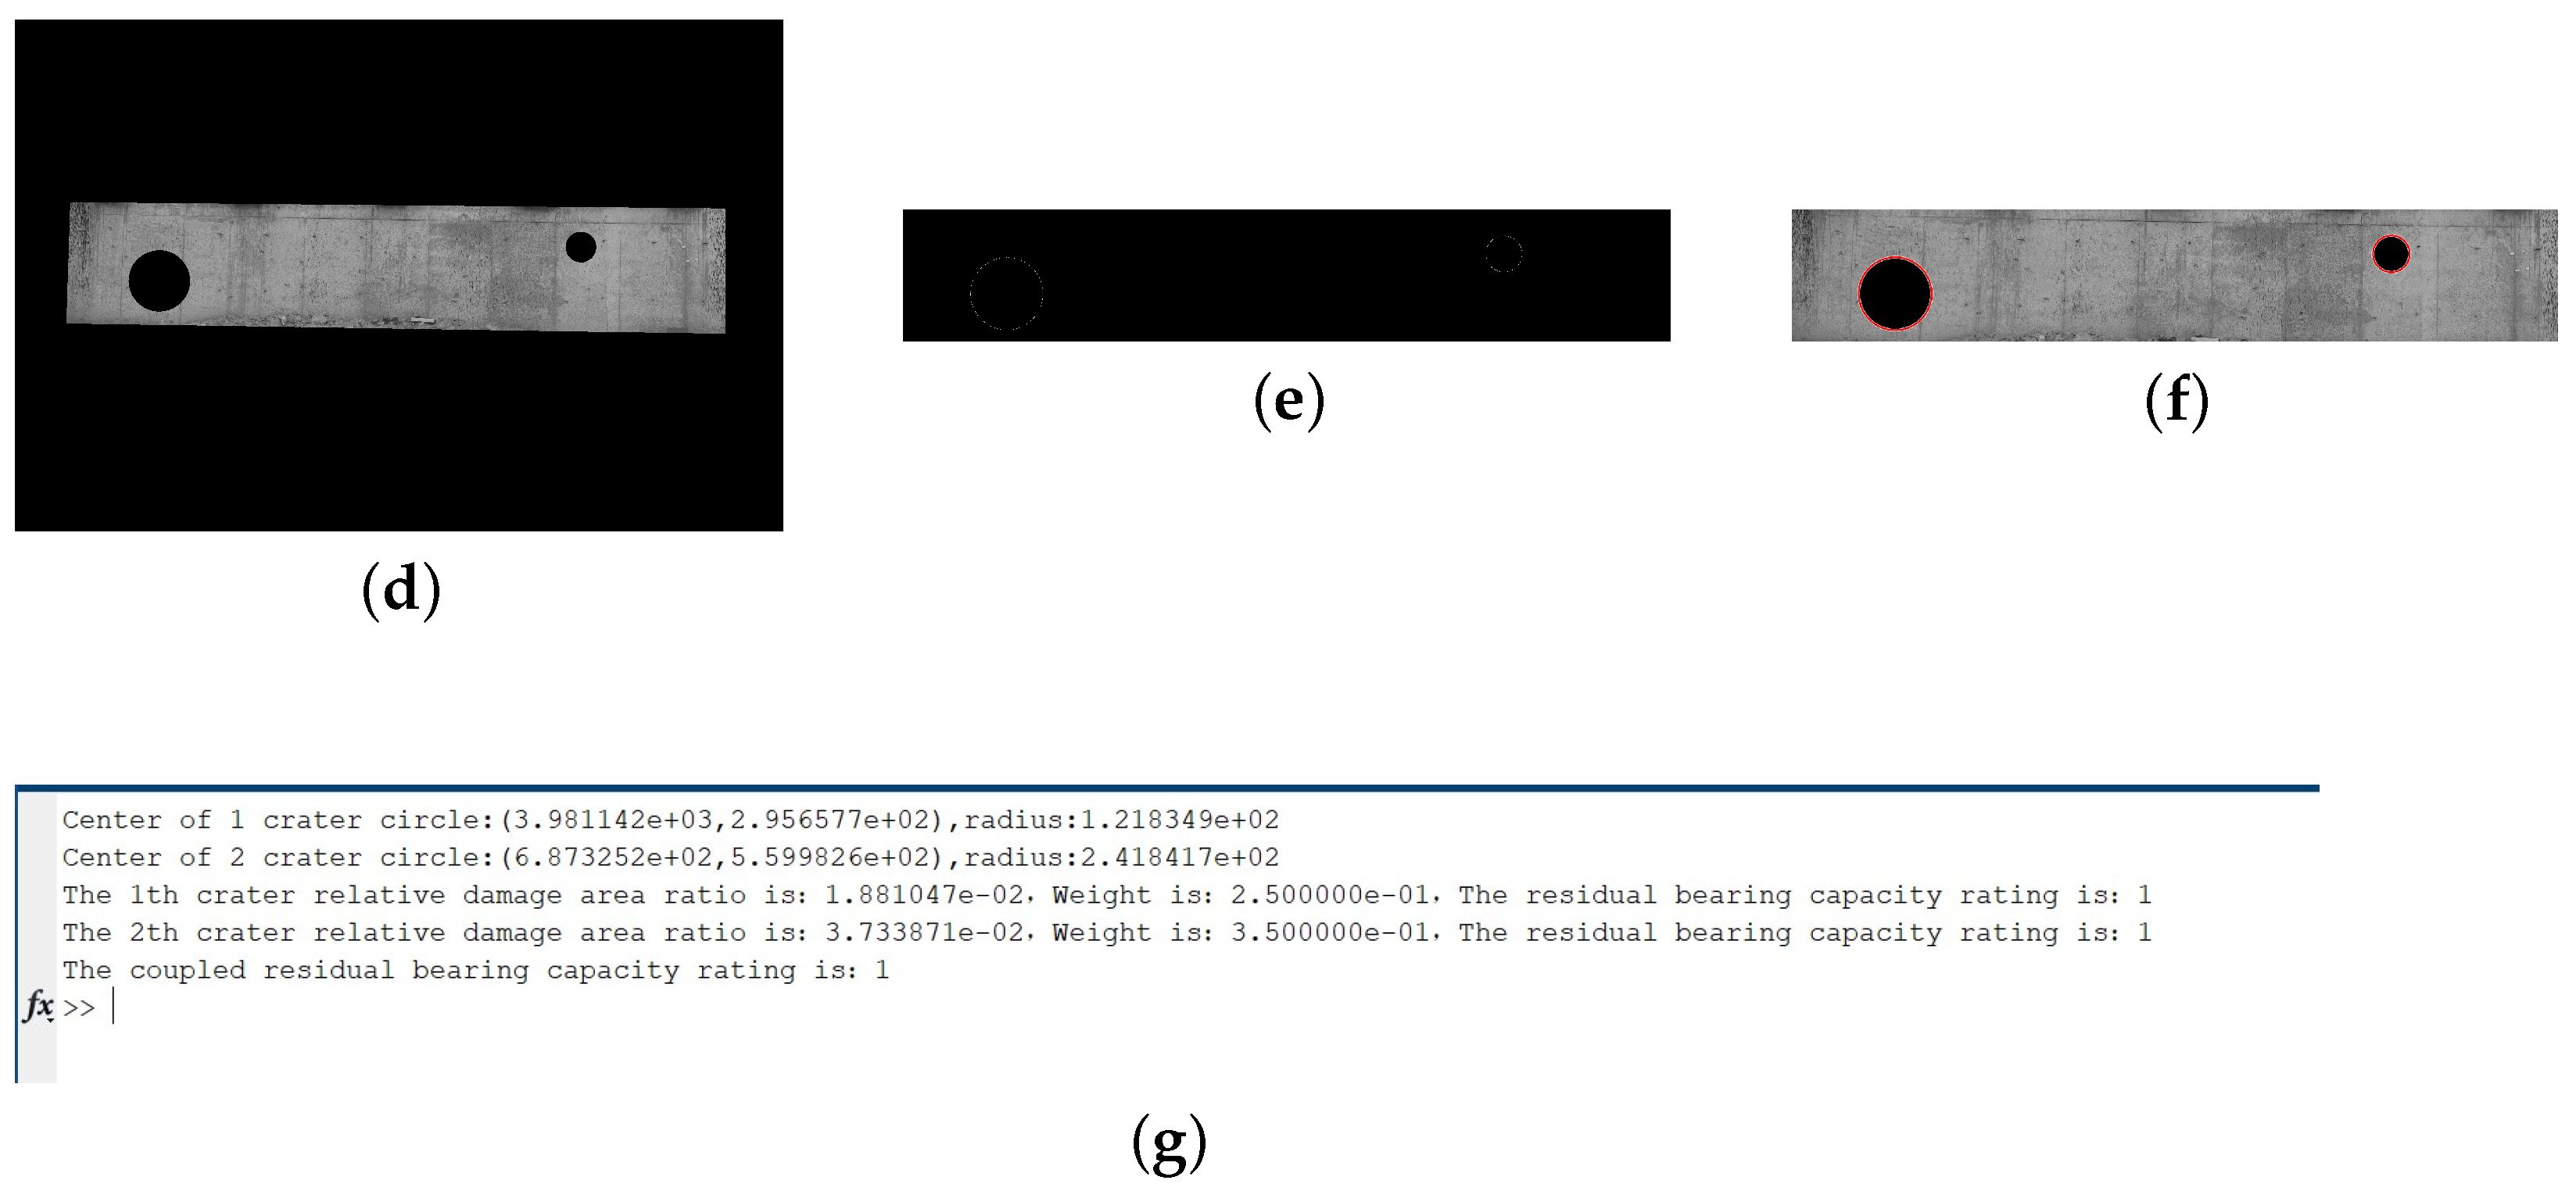
  • For the screened damaged area, the relative damaged area ratio is calculated, which is defined as the ratio of the area of the damaged area (crater) to the area of the smallest bridge lateral area containing the damaged area, as shown in Figure 4. When the relative damage area ratio exceeds 50%, the crater area is too large, and the bridge may collapse directly, which divides the relative damage area ratio into 0–0.05, 0.05–0.1, 0.1–0.15, 0.15–0.2, 0.2–0.25, 0.25–0.3, 0.3–0.35, 0.35–0.4, 0.4–0.45, and 0.45–0.5. The ten intervals correspond to residual bearing capacity classes 1–10, respectively.
  • According to the matching rule, the higher bearing capacity grade of the bridge abutment indicates that its residual bearing capacity is smaller and the degree of destruction is more serious according to the results of the third step of the calculation matching the residual bearing capacity grade of each strike position.
  • Combined with the damage state of each damaged area and the location of the damage, the results of the residual bearing capacity level of each damaged area are a weighted coupling in order to ensure that the coupling is positively correlated and the range of values is unchanged; the calculation method is given in the following equation:
    R B C = 10 i T ( 10 × 0.35 ) T × i T R B C i × Weight T ,
    where RBC denotes the final residual bearing capacity index value of the bridge abutment or bridge deck, T indicates the total number of damaged areas, R B C i indicates the residual bearing capacity index of the ith damaged area, and weight indicates the weight value of a certain type of damage.
    The functional destruction of the bridge abutment is equivalent to the structural destruction, and for the bridge abutment as a whole, its structural strength is consistent. According to the results of the static analysis, the size of the residual bearing capacity of the bridge abutment is negatively correlated with the strike height. Analyzed from the loading point of view, the stress underneath the bridge abutment is greater and the damage is more likely to cause collapse. It is assumed that the bridge deck and abutment cross-sectional area are of the same size. Considering only the case of self-weight, the stress magnitude at the height, h, of the abutment is:
    σ = ρ g ( H h ) + ρ g 0.5 L ,
    where ρ denotes the density of reinforced concrete, g denotes the acceleration of gravity, H is the height of the bridge abutment, and L is the length of the bridge deck.
    For this experimental bridge, L = 30 m, H = 3 m. To simplify the calculation, the abutment is divided into upper and lower parts, and as the stress ratio of the upper and lower parts is about 1.1, the weight ratio is 1.1. The calculation can obtain that the upper half of the weight value is 0.48, and the lower half of the weight value is 0.52. The penetration damage and damage to the missing areas are regarded as a complete penetration with a penetration through half of the thickness, so its weight ratio is 2. Therefore, the weights of the damage types of the bridge piers are obtained as shown in Table 1.
    For bridge decks, more factors need to be considered in the calculation of residual capacity due to the presence of girders. T-girder bridges consist of flanges, webs, and wet joints. The wet joints occupy a small area and are equivalent in strength to the flanges, so the deck can be equated to the flanges and the web. For the general case of munitions strikes, the web will not be completely destroyed and may occur in the upper part of the missing area, which has a small impact on its mechanics, so the web destruction can be ignored. Therefore, for T-girder bridges without prestressing technology, the main damaged structure from a munitions strike is the T-girder flange, so when dealing with it, according to the most unfavorable conditions, the craters will all damage the girders.
    Analyzed from the loading point of view, the simplified bridge deck is subjected to an evenly distributed load, and the middle bending moment of the bridge deck is the largest and the damage is more likely to cause collapse. In order to simplify the calculation, the bridge deck is divided into four blocks, the two blocks near the center are one part, and the two ends are the other part, so its bending moment ratio is 2; i.e., the weight ratio is 2. Calculations can obtain that the weight value of the middle part of the bridge deck is 0.67, and the value for the two ends of the bridge deck is 0.33. For the penetrating and missing damage, it is considered to be a complete penetration with penetration through half of the thickness, so its weight ratio is 2. Therefore, the obtained weight values for the bridge deck damage types are shown in Table 1.
  • Fusing the residual bearing capacity characteristics of the abutments and bridge decks, the method of taking the maximum value is used to ensure the accuracy and uniqueness of the final result, so it can be obtained that the residual bearing capacity characteristics of the bridge are calculated as follows:
    R B C = m a x ( R B C p , R B C d ) ,
    where RBC denotes the residual load rating after fusion, R B C p denotes the residual load rating of the abutment, and R B C d denotes the residual load rating of the deck.
The use of image features for the load-bearing capacity template matching can quantify the residual load-bearing capacity index of the bridge in the case of no contact and no damage, avoiding the complex load-bearing capacity formula calculation; the algorithm is stable and effective and can reflect the load-bearing capacity damage state of the girder bridge target in a more objective way.

3.2. Through-Lane Inspection

For the role of the bridge deck sub-goal function, the bridge deck provides a vehicle path if there is a path on the bridge deck that has a certain width and the paths across the bridge ends are always continuous so that vehicles can safely pass through the bridge (such a path can be called a vehicle path). For the traffic function sub-goal for bridge decks, the bridge deck provides multiple lanes for transit vehicles to run parallel to each other, with the number of parallel lanes varying for different widths of bridges, with the number of lanes being proportional to the width of the bridge deck and each lane being the same size in width. According to the AASHTO Green Book, the recommended lane width for general use is 12 feet (3.6 m) [40]. The existence of through-paths on the bridge deck and the number of lanes that can be parallel are intuitive parameters reflecting the capacity of the bridge deck. The through-lane detection algorithm is proposed, which simplifies the bridge deck as a rectangle and the crater as a circle, establishes a coordinate system, determines the bridge and crater locations and dimensions through image processing technology, merges craters that do not have through-paths between craters, and then detects the number of transverse lanes according to the relationship between the crater locations, dimensions, and spacing. The algorithm flow is as follows:
  • Take one side corner of the bridge deck as the coordinate origin; the width of the bridge is W and the length is L. Set the width direction of the bridge as the x-axis, the length direction as the y-axis, and the width of the vehicle is set as W′, as shown in Figure 5.
  • Combine the bridge deck change detection results to generate the crater location matrix P = [ ( x 1 , y 1 ) , ( x 2 , y 2 ) , , ( x M , y M ) ] and the diameter matrix d = [ d 1 , d 2 , , d M ] of the crater, where the order in the sample crater location matrix is sorted from smallest to largest according to the size of the x-coordinate; x i is the x-coordinate, y i is the y-coordinate, M is the number of craters, and d i is the diameter of the ith crater. Calculate the distance D j k ( j , k = 1 , 2 , , M ) between the centers of any two craters and form the distance square matrix D, where the elements of the square matrix can be calculated by the following equation:
    D j k = ( x j x k ) 2 + ( y j y k ) 2 ,
  • If square D does not exist, i.e., there is only one crater, skip to step 5.; if square D exists, compute the rows and columns of all elements in the lower triangular portion of square D (excluding the diagonal) that are smaller than d i 2 + d k 2 + W , i.e., the numbering of the non-existing through-paths between the two craters, and form the matrix ξ , in which each row contains the row numbering and the column numbering of the conforming elements, with the element on the left-hand side being the smaller numbered value, and the element on the right-hand side of the column being the numbering of the larger values; the different rows are sorted from smallest to largest according to the size of the elements on the left:
    ξ = ξ 11 ξ 12 ξ 21 ξ 22 ξ n 1 ξ n 2 ,
    where n is the number of elements less than d i 2 + d k 2 + W in the lower triangular part of the D-square matrix;
  • Combination of non-adjacent craters. Two craters with a distance between them of less than the width of the through-lane are referred to as immediate neighboring craters, and such craters are merged. Set a larger value of Lv, according to the read matrix of the consistency line of the left element ξ , obtain the position matrix of the crater P i = [ ( x K , y K ) , , ( x N , y N ) ] and the diameter matrix d i = [ d K , , d N ] , calculate the smallest external rectangle that contains the crater, the formation of the rectangle index id, id value for the natural number from 1, the position matrix P m a = [ x i , y i ] , and the length and width matrix of the rectangle S m a = [ w i , h i ] . Then, calculate the minimum outer circle of the rectangle to obtain the location of the new “crater” and the “diameter” d I ; the “diameter” is calculated as follows:
    d I = L v + i d
    Combine all rectangular length–width matrices S m a into a new matrix S in the order:
    S = w 1 h 1 w 2 h 2 ,
    Delete the read data from the original crater position and diameter matrix and add the new crater position and diameter data to form a new crater position matrix P = [ ( x 1 , y 1 ) , ( x 2 , y 2 ) , , ( x m , y m ) ] and diameter matrix d = [ d 1 , d 2 , , d m ] .
  • Render the bridge deck as a whole in white, and sequentially read the new crater position matrix P and diameter matrix d . If d i > i d 1 , it means that the crater is a rectangle; retrieve the length and width of the rectangle based on d i L v and render the rectangular region in black by combining positional information. If d i < i d 1 , it means that the crater is a circle; render the smallest outer rectangle of the circle in black based on positional and direct information.
  • Read the new crater position matrix P and the diameter matrix d . If d i > i d 1 , set the width of the retrieval bar to be min w i , h i and the length of the retrieval bar to be the width of the bridge deck and the retrieval bar to be rendered in white. Start from the bottom of the area, perform the “and” operation of the retrieval bar with the bridge deck, delete the white areas whose widths are smaller than the width of the retrieval bar, and calculate the sum of downward integer values of the length of the white areas divided by the width of the vehicle after the operation. Calculate the length of each white area after the operation divided by the width of the vehicle W’ and the downward integer value of OP. After retrieving this area, record the information of this crater and the minimum value of its OP; if d i < i d 1 , set the width of the retrieval bar to d i / 2 , and the rest of the operation is the same as above. Finally, compare the OP values and output the minimum value and its crater information.
  • Based on the crater information and OP values from the previous step, calculate whether the crater has any craters in the range W O P . If the crater exists, then O P = O P 1 ; if not, then O P = O P . The final calculated OP value is the number of lanes.
The algorithm is illustrated graphically in Figure 6.
The pass-through lane detection algorithm can quickly output the number of pass-through lanes on the bridge deck after the strike through the image, and the algorithm has a low complexity which calculates the number of pass-through lanes based on the relationship between the crater information, the effective distance between the craters, and the width of the vehicle, which ensures the validity of the output results.

3.3. Indicator Convergence

In most cases, bridges are not destroyed in a single situation, but often multiple situations coexist, so after extracting the indicators of residual bearing capacity and the number of passing lanes, a coupled analysis is needed to calculate a comprehensive destruction result.
  • Residual bearing capacity (RBC). According to the residual bearing capacity index extraction method proposed in Section 3.1, the residual bearing capacity grade of the girder bridge can be obtained, and the value range of the result is [0, 10], and the larger the value is, the lower the residual bearing capacity of the bridge is;
  • Number of lanes (OP). According to the through-lane detection algorithm proposed in Section 3.2, the number of parallel lanes of the bridge can be obtained as OP. The value is an integer starting from 0, and the maximum value is the downward rounding value of the bridge width divided by the vehicle width result. For bridges of different widths, the OP value has a different value range, so in order to ensure the consistency of the damage indicators, the number of lanes, OP, is converted to a value in the range of 0–10, and the larger the value, the lower the number of through-lanes; the conversion is as follows:
    O P = 10 O P W / W × 10
    where W denotes the width of the bridge deck and W denotes the width of the vehicle;
The weighted average method was used for the fusion of the damage indicators, and the weight values of both RBC and OP were set to 0.5, and any of the damage indicators were large enough to indicate a high degree of damage in the girder bridges, which resulted in the design of the bridge target of the integrated damage indicator values calculated as follows:
A G = R B C × 0.5 + O P × 0.5 if ( R B C 6 and O P 6 ) max { R B C , O P } if ( R B C > 6 or O P > 6 ) ,
The girder bridge damage results are designated as three light, medium, and heavy grades, and finally, the girder bridge damage assessment grade evaluation rules are established, as shown in Table 2.

4. Experimental Validation and Results

Images of bridge abutments and bridge decks were captured using a DJI Mavic 3 Cine drone equipped with a 20-megapixel 4/3-inch CMOS imaging system. In order to simulate the damage state of the bridge under munitions strikes, MATLAB R2014a was used to generate strike craters with random locations and sizes. In the experiment, the dimensions of the bridge were 30 m long and 12 m wide, and the height of the abutment was 3 m. Based on the lane width of 3.6 m, the number of original passable lanes of the bridge is calculated to be three. Penetrating strikes are simulated by randomly laying black circles of varying numbers, sizes, and locations on the bridge deck and abutments. The experimental process and results are shown in Figure 7 and Figure 8.
From the above experimental results, it can be calculated that the residual bearing capacity class of the bridge abutment is 1 and the residual bearing capacity class of the bridge deck is 2. According to Equation (4), the residual bearing capacity class of the bridge can be obtained as 2; the bridge can pass the number of lanes for 0, and according to Formula (9), the bridge can pass the number of lanes of the eigenvalue of (10). In summary, the above results, substituted into Formula (10) can be calculated so that the bridge is destroyed for the level of 10. In Table 2, it can be found that the bridge is destroyed under severe damage. Since the number of passable lanes on the bridge deck is zero, it is no longer passable for vehicles, so the bridge has lost its passable function and is a total destruction. The above experiments can verify that the bridge damage assessment algorithm based on the image features proposed in this paper is real and effective, and the damage assessment indexes given in this paper can reflect the damage information of the bridge more comprehensively, and the assessment results can reflect the damage situation of the bridge more accurately.

5. Conclusions

This paper proposes a visible-light image-based damage assessment method for girder bridges using image preprocessing-related methods to process the original image and then utilizing a change detection algorithm to extract the damaged area. At the same time, the girder bridge is decomposed into piers and bridge decks, its functional characteristics are analyzed, and the residual bearing capacity and the number of traffic paths associated with its function are proposed. On this basis, the conversion relationships between the image features and the residual load carrying capacity of the bridge, and the image features and the number of traffic paths of the bridge, are established, and a coupling calculation method is designed to synthesize the two damage features and calculate the target damage level of the girder bridge after the strike. Consequently, damage level assessment rules are formulated, providing a feasible method for the damage assessment of girder bridges. Finally, a test simulation is carried out to verify the feasibility and precision of the model, and the simulation results show that the algorithm can effectively evaluate the damage level of the girder bridge target.
Compared with the current studies on the destructive effects of bridge munitions strikes, our method has several main advantages: Accuracy: the residual bearing capacity feature and the number of passable lanes feature that respond to the function of the bridge were designed and calculated from the image, which is more intuitive and detailed compared to the destruction features in [11,15]. Feature extraction: the residual bearing capacity feature of the bridge after the strike was extracted by using images, and the number of passable lanes feature was extracted based on the principle of image logic operation, which ensures that the damage features accurately describe the function of the bridge and makes the damage assessment more scientific. Data scale: Compared with the machine learning-based damage assessment method, it does not need a large number of samples for model training, and the data volume requirement is low while ensuring the reliability of the results. Convenience: The method does not require high image quality and only requires long-distance shooting with a camera-equipped UAV to acquire images of bridge targets. This improves the convenience and efficiency of data acquisition.
This work also has some limitations. First, different image preprocessing algorithms may have different effects on the results of change detection, and further research on excellent image preprocessing algorithms is a hot topic in current research. Secondly, although this method can be used for war damage assessment of girder bridges, it is mainly aimed at the traffic performance of bridges, and further in-depth study of the functional characteristics of bridges, combined with mechanical calculations, should be undertaken in order to make our feature extraction method more accurate.

Author Contributions

Conceptualization, X.C.; methodology, X.C. and W.W.; software, X.C.; validation, H.Z., Q.X. and W.W.; formal analysis, X.C.; investigation, X.C.; resources, H.Z. and Q.X.; data curation, X.C.; writing—original draft preparation, X.C.; writing—review and editing, H.Z., Q.X. and W.W.; visualization, X.C.; supervision, H.Z., Q.X. and W.W.; project administration, H.Z.; funding acquisition, H.Z. and Q.X. All authors have read and agreed to the published version of the manuscript.

Funding

This research received no external funding.

Institutional Review Board Statement

Not applicable.

Informed Consent Statement

Not applicable.

Data Availability Statement

All data generated or analyzed during this study are included in this paper or are available from the corresponding authors on reasonable request.

Conflicts of Interest

The authors declare no conflicts of interest.

References

  1. Yan, Q.; Li, S.; Chen, Y.; Lv, C. Analysis and research on structural vulnerability of bridges under the effect of blast loads. Prot. Eng. 2022, 44, 71–78. [Google Scholar]
  2. Rauch, J.T., Jr. Assessing Airpower’s Effects: Capabilities and Limitations of Real-Time Battle Damage Assessment; Air Univ Maxwell Afb AI School of Advanced Airpower Studies: Montgomery, AL, USA, 2002; Available online: https://scholar.google.com/scholar_lookup?title=Assessing+Airpower%E2%80%99s+Effects:+Capabilities+and+Limitations+of+Real-Time+Battle+Damage+Assessment&author=Rauch,+J.T.,+Jr.&publication_year=2002 (accessed on 5 December 2024).
  3. Gou, T. Research on Key Technologies of Damage Assessment System Based on Image Analysis. Ph.D. Thesis, Jilin University, Changchun, China, 2019. Available online: https://scholar.google.com/scholar?hl=zh-CN&as_sdt=0%2C5&q=%E5%9F%BA%E4%BA%8E%E5%9B%BE%E5%83%8F%E5%88%86%E6%9E%90%E7%9A%84%E6%AF%81%E4%BC%A4%E8%AF%84%E4%BC%B0%E7%B3%BB%E7%BB%9F%E5%85%B3%E9%94%AE%E6%8A%80%E6%9C%AF%E7%A0%94%E7%A9%B6+%E5%8B%BE%E6%B6%9B&btnG= (accessed on 5 December 2024).
  4. DI-2820-4-03; Battle Damage Assessment (BDA) Quick Guide. Defense Intelligence Agency (DIA): Washington, DC, USA, 1996. Available online: https://media.defense.gov/2017/Dec/27/2001861489/-1/-1/0/T_0016_RAUCH_ASSESSING_AIRPOWERS_EFFECTS.PDF (accessed on 5 December 2024).
  5. Meade, T.E.; Hopkins, J.A.; Fujiwara, M.M. Battle damage assessment: The road to victory. Mil. Intell. Prof. Bull. 1998, 24, 38–41. Available online: https://search.ebscohost.com/login.aspx?direct=true&db=mth&AN=869277&lang=zh-cn&site=ehost-live (accessed on 5 December 2024).
  6. Zhang, C.; Shu, J.; Wu, J.; Su, G. Current status and development of target damage effect evaluation technology. Aerodyn. Missile J. 2017, 6, 68–72. [Google Scholar] [CrossRef]
  7. Tu, Z.; Lin, T. Research on Battle Damage Assessment System Based on Downward-looking Scene Image. Tactical Missile Technol. 2012, 5, 6–9. Available online: https://scholar.google.com/scholar_lookup?title=Research+on+Battle+Damage+Assessment+System+Based+on+Downward-looking+Scene+Image&author=Tu,+Z.&author=Lin,+T.&publication_year=2012&journal=Tactical+Missile+Technol.&volume=5&pages=6%E2%80%939 (accessed on 5 December 2024).
  8. Chen, P.; Ji, Z.; Yang, S.; Li, T. Analysis of Evaluation Method for Joint Operations of US Army. Ordnance Ind. Autom. 2023, 42, 71–75. [Google Scholar] [CrossRef]
  9. Zhang, J. Processing Method of Multi-Temporal Remote Sensing Images and the Use in Damage Assessment. Ph.D. Thesis, Shanghai Jiao Tong University, Shanghai, China, 2018. Available online: https://scholar.google.com/scholar?hl=zh-CN&as_sdt=0%2C5&q=%E5%A4%9A%E6%97%B6%E7%9B%B8%E5%9B%BE%E5%83%8F%E6%A3%80%E6%B5%8B%E6%96%B9%E6%B3%95%E5%8F%8A%E5%85%B6%E5%9C%A8%E6%AF%81%E4%BC%A4%E8%AF%84%E4%BC%B0%E7%B3%BB%E7%BB%9F%E4%B8%AD%E7%9A%84%E5%BA%94%E7%94%A8&btnG= (accessed on 5 December 2024). (In Chinese).
  10. Niu, P.; Li, W.; Li, X. An Airport Damage Assessment Algorithm Based on Change Detection. Electron. Opt. Control 2012, 19, 89–93. Available online: https://scholar.google.com/scholar?cluster=17850735731735192316&hl=zh-CN&as_sdt=0,5 (accessed on 5 December 2024). (In Chinese).
  11. Yu, T. Remote Sensing Image Change Detection and Damage Assessment Application Based on Multi-Scale Fusion. Ph.D. Thesis, University of Electronic Science and Technology of China, Chengdu, China, 2010. Available online: https://scholar.google.com/scholar?hl=zh-CN&as_sdt=0%2C5&q=%E5%9F%BA%E4%BA%8E%E5%A4%9A%E5%B0%BA%E5%BA%A6%E8%9E%8D%E5%90%88%E7%9A%84%E9%81%A5%E6%84%9F%E5%9B%BE%E5%83%8F%E5%8F%98%E5%8C%96%E6%A3%80%E6%B5%8B%E5%8F%8A%E5%85%B6%E6%AF%81%E4%BC%A4%E8%AF%84%E4%BC%B0%E5%BA%94%E7%94%A8&btnG= (accessed on 5 December 2024). (In Chinese).
  12. Li, W.; Chen, Q. Ship battle damage assessment based on remote sensing images. Ship Electron. Eng. 2014, 34, 50–52. [Google Scholar]
  13. Ji, H.; Yang, Q. Airport runway functional damage assessment based on image analysis. J. Comput. Appl. 2016, 36, 165–168. Available online: https://scholar.google.com/scholar?hl=zh-CN&as_sdt=0%2C5&q=Airport+runway+functional+damage+assessment+based+on+image+analysis&btnG= (accessed on 5 December 2024).
  14. Pu, G.; Xu, P.; Ren, P.; Xue, Z. Research on damage effect assessment of airport runways based on image analysis. Ship Electron. Eng. 2012, 32, 31–32. Available online: https://scholar.google.com/scholar?hl=zh-CN&as_sdt=0%2C5&q=%E5%9F%BA%E4%BA%8E%E5%9B%BE%E5%83%8F%E5%88%86%E6%9E%90%E7%9A%84%E6%9C%BA%E5%9C%BA%E8%B7%91%E9%81%93%E6%AF%81%E4%BC%A4%E6%95%88%E6%9E%9C%E8%AF%84%E4%BC%B0%E7%A0%94%E7%A9%B6&btnG= (accessed on 5 December 2024).
  15. Liu, J. Research and Implementation of Target Damage Assessment Based on Functional Characteristics Analysis. Ph.D. Thsis, Beijing University of Technology, Beijing, China, 2013. Available online: https://scholar.google.com/scholar?hl=zh-CN&as_sdt=0%2C5&q=%E5%9F%BA%E4%BA%8E%E5%8A%9F%E8%83%BD%E7%89%B9%E6%80%A7%E5%88%86%E6%9E%90%E7%9A%84%E7%9B%AE%E6%A0%87%E6%AF%81%E4%BC%A4%E8%AF%84%E4%BC%B0%E7%AE%97%E6%B3%95%E7%A0%94%E7%A9%B6%E4%B8%8E%E5%AE%9E%E7%8E%B0&btnG= (accessed on 5 December 2024). (In Chinese).
  16. Gu, D.; Zeng, L.; Yang, X. Study of target damage evaluation methods based on image. Comput. Eng. Appl. 2012, 48 (Suppl. 2), 417–421. Available online: https://scholar.google.com/scholar?hl=zh-CN&as_sdt=0%2C5&q=%E5%9F%BA%E4%BA%8E%E5%9B%BE%E5%83%8F%E7%9A%84%E7%9B%AE%E6%A0%87%E6%AF%81%E4%BC%A4%E8%AF%84%E4%BC%B0%E6%96%B9%E6%B3%95%E7%A0%94%E7%A9%B6&btnG= (accessed on 5 December 2024). (In Chinese).
  17. Liu, W.; Li, S.; Chi, D.; Li, M. Method and model of the airports battle damage assessment. J. Geomat. Sci. Technol. 2015, 32, 36–41. [Google Scholar] [CrossRef]
  18. Wang, Y.; Zhang, C.; Song, Y. Research on joint fire-strike battle damage assessment based on optical remote sensing image. In Proceedings of the 2014 China Conference on Command and Control, Nanjing, China, 4–5 August 2014; Volume 1, pp. 333–336. Available online: https://scholar.google.com/scholar?hl=zh-CN&as_sdt=0%2C5&q=%E5%9F%BA%E4%BA%8E%E5%85%89%E5%AD%A6%E5%9B%BE%E5%83%8F%E7%9A%84%E8%81%94%E5%90%88%E7%81%AB%E5%8A%9B%E6%89%93%E5%87%BB%E6%95%88%E6%9E%9C%E8%AF%84%E4%BC%B0%E7%A0%94%E7%A9%B6&btnG= (accessed on 5 December 2024). (In Chinese).
  19. Xu, Y.; Yu, Q.; Wang, Y.; Xiao, J.; Zhou, Z.; Lu, H. Ground target detection and damage assessment by patrol missiles based on YOLO-VGGNet. Appl. Sci. 2022, 12, 9484. [Google Scholar] [CrossRef]
  20. Berezina, P.; Liu, D. Hurricane damage assessment using coupled convolutional neural networks: A case study of hurricane Michael. Geomat. Nat. Hazards Risk 2022, 13, 414–431. [Google Scholar] [CrossRef]
  21. Zhang, Z.; Zhang, L.; Xie, C.; Zhang, B.; Yang, B. Battle damage effect assessment based on improved ga-bp neural network. Fire Control Command Control 2021, 46, 43–48. [Google Scholar] [CrossRef]
  22. Qu, W.; Xu, Z.; Liu, Y. Damage assessment of radar position based on ga-dynamic bp neural network. Tactical Missile Technol. 2016, 6, 51–57. [Google Scholar] [CrossRef]
  23. Jiang, H.; Wang, S.; Li, Z.; Zhang, Y.; Zhai, H. Effectiveness evaluation of blockade cluster warhead against bridge target. Acta Armamentarii 2016, 37 (Suppl. 1), 1–6. Available online: https://scholar.google.com/scholar?cluster=15179536351683300620&hl=zh-CN&as_sdt=0,5 (accessed on 5 December 2024). (In Chinese).
  24. Wu, Z.; Zhao, Z. Research on damage of common shell group to area target based on fuzzy system. J. Syst. Simul. 2013, 25, 1166–1169. Available online: https://scholar.google.com/scholar?cluster=5560032915788454815&hl=zh-CN&as_sdt=0,5 (accessed on 5 December 2024). (In Chinese).
  25. Gao, W.; Sun, G.; Chen, L.; Zhou, C.; Liu, R. Research on damage assessment technology of ground building. Prot. Eng. 2019, 41, 48–53. Available online: https://scholar.google.com/scholar?hl=zh-CN&as_sdt=0%2C5&q=%E5%9C%B0%E9%9D%A2%E5%BB%BA%E7%AD%91%E6%AF%81%E4%BC%A4%E8%AF%84%E4%BC%B0%E6%8A%80%E6%9C%AF%E7%A0%94%E7%A9%B6&btnG= (accessed on 5 December 2024). (In Chinese).
  26. Yuan, S.; Yang, K.; Liu, Z.; Zong, Z. Numerical simulation of damage mode and axial load effect of RC bridge columns under close-in explosion. J. Southeast Univ. (Nat. Sci. Ed.) 2023, 53, 76–85. [Google Scholar] [CrossRef]
  27. Li, H.; Mei, D.; Zhang, Y.; Chang, J. An analysis of the effect of the missile stricken position on the damage of a box girder. Traffic Eng. Technol. Natl. Def. 2019, 17, 20–23. [Google Scholar] [CrossRef]
  28. Yang, S.; Zhong, W.; Wang, S.; Kong, W.; Tang, Z.; Tian, Z.; Zhang, R.; Yao, X. On dynamic analysis and damage evaluation for bridge girders under high-energy air burst. Structures 2022, 41, 1488–1500. [Google Scholar] [CrossRef]
  29. Tong, C.; Zhang, J.; Ji, H. Residual resistance and bearing mechanism of RC beam after impact. J. Vib. Shock. 2023, 42, 122–130. (In Chinese) [Google Scholar] [CrossRef]
  30. Chen, S.; Zhao, H.; Li, J.; Zhu, C. Reliability assessment of a concrete beam bridge under actual traffic load. J. Vib. Shock. 2022, 41, 158–167. (In Chinese) [Google Scholar] [CrossRef]
  31. Duque, L.; Seo, J.; Wacker, J. Bridge deterioration quantification protocol using UAV. J. Bridge Eng. 2018, 23, 04018080. [Google Scholar] [CrossRef]
  32. Perry, B.J.; Guo, Y.; Atadero, R.; van de Lindt, J.W. Streamlined bridge inspection system utilizing unmanned aerial vehicles (UAVs) and machine learning. Measurement 2020, 164, 108048. [Google Scholar] [CrossRef]
  33. Yamaguchi, T.; Hashimoto, S. Fast crack detection method for large-size concretesurface images using percolation-based image processing. Mach 2010, 21, 797–809. [Google Scholar] [CrossRef]
  34. Yamaguchi, T.; Nakamura, S.; Hashimoto, S. An efficient crack detection method using percolation-based image processing. In Proceedings of the 2008 3rd IEEE Conference on Industrial Electronics and Applications, Singapore, 3–5 June 2008; pp. 1875–1880. [Google Scholar] [CrossRef]
  35. Nguyen, H.N.; Kam, T.Y.; Cheng, P.Y. A novel automatic concrete surface crack identification using isotropic undecimated wavelet transform. In Proceedings of the 2012 International Symposium on Intelligent Signal Processing and Communications Systems, Chiang Mai, Thailand, 2–4 December 2012; pp. 766–771. [Google Scholar] [CrossRef]
  36. Lee, B.Y.; Kim, Y.Y.; Yi, S.T.; Kim, J.K. Automated image processing technique for detecting and analysing concrete surface cracks. Struct. Infrastruct. Eng. 2013, 9, 567–577. [Google Scholar] [CrossRef]
  37. Prasanna, P.; Dana, K.J.; Gucunski, N.; Basily, B.B.; La, H.M.; Lim, R.S.; Parvardeh, H. Automated crack detection on concrete bridges. IEEE Trans. Autom. Sci. Eng. 2014, 13, 591–599. [Google Scholar] [CrossRef]
  38. Kang, Z.; Wang, M.; Jia, K.; Liu, S. Study on damage assessment for bridge based on template matching. J. Syst. Simul. 2008, 5, 1114–1117. Available online: https://scholar.google.com/scholar?cluster=3548604510601718793&hl=zh-CN&as_sdt=0,5 (accessed on 5 December 2024). (In Chinese).
  39. Siavash, K.; Mohsen, E.M. An impulse noise fading technique based on local histogram processing. In Proceedings of the IEEE International Symposium on Signal Processing and Information Technology (ISSPIT), Ajman, United Arab Emirates, 4–17 December 2009; Volume 24, pp. 190–195. [Google Scholar] [CrossRef]
  40. American Association of State Highway and Transportation Officials (AASHTO). Policy on Geometric Design of Highways and Streets, 7th ed.; American Association of State Highway and Transportation Officials: Washington, DC, USA, 2018; ISBN 978-1-56051-623-1. [Google Scholar]
Figure 1. Flowchart of damage assessment method for girder bridge.
Applsci 14 11422 g001
Figure 2. Simplified diagram of bridge abutment.
Applsci 14 11422 g002
Figure 3. Simplified diagram of bridge deck.
Applsci 14 11422 g003
Figure 4. Schematic diagram of relative damage area ratio.
Applsci 14 11422 g004
Figure 5. Simplified diagram of bridge deck.
Applsci 14 11422 g005
Figure 6. Simplified diagram of bridge deck.
Applsci 14 11422 g006
Figure 7. Schemes follow the same formatting: (a) Pre-damage target image. (b) Simulated post-damage target image. (c) Change detection results. (d) Target extraction results. (e) Target area crater detection. (f) Visualization of crater locations. (g) Combined results of immediately adjacent craters. (h) Lane retrieval visualization results. (i) Results of residual bridge deck load rating and number of passing lanes.
Applsci 14 11422 g007
Figure 8. Schemes follow the same formatting: (a) Pre-damage target image. (b) Simulated post-damage target image. (c) Change detection results. (d) Target extraction results. (e) Target area crater detection. (f) Visualization of crater locations. (g) Results of residual bridge abutment load rating.
Applsci 14 11422 g008aApplsci 14 11422 g008b
Table 1. Damage type weight value table.
Types of Bridge Pier DamageWeightsTypes of Bridge Deck DamageWeights
Upper part of the body is penetrated and destroyed0.32Penetrating damage to the center section of the bridge deck0.45
Upper part of the body is missing and destroyed0.16Missing and damaged center section of bridge deck0.22
Lower part of the body is penetrated and destroyed0.347Partial penetrating damage to both ends of the bridge deck0.22
Lower part of the body is missing and destroyed0.173Partial loss of damage to both ends of the bridge deck0.11
Table 2. Rules for evaluating the level of damage.
Girder Bridge Damage GradeComposite Damage Indicator Value
Slight damage 0 A G 3
Moderate damage 3 < A G 5
Severe damageAG > 5
Disclaimer/Publisher’s Note: The statements, opinions and data contained in all publications are solely those of the individual author(s) and contributor(s) and not of MDPI and/or the editor(s). MDPI and/or the editor(s) disclaim responsibility for any injury to people or property resulting from any ideas, methods, instructions or products referred to in the content.

