Article

Speciation Characteristics and Risk Assessment of Heavy Metals in Cultivated Soil in Pingshui Village, Zhaoping County, Hezhou City, Guangxi

1
College of Earth Sciences, Guilin University of Technology, Guilin 541006, China
2
Collaborative Innovation Center for Exploration of Nonferrous Metal Deposits and Efficient Utilization of Resources by the Province and Ministry, Guilin University of Technology, Guilin 541006, China
*
Authors to whom correspondence should be addressed.
Appl. Sci. 2024, 14(23), 11361; https://doi.org/10.3390/app142311361
Submission received: 23 October 2024 / Revised: 23 November 2024 / Accepted: 28 November 2024 / Published: 5 December 2024
(This article belongs to the Section Environmental Sciences)

Abstract

:
In order to comprehensively understand the content, source, speciation characteristics, and risk of heavy metals in cultivated soil of Pingshui Village, Zhaoping County, Hezhou City, this study conducted measurements on the total amounts of Cr, Ni, Cu, Zn, As, Cd, Pb, and Hg in 34 soil samples within the study area. Correlation analysis and principal component analysis were employed to investigate their sources. An improved BCR sequential extraction procedure was utilized to analyze the occurrence forms of eight heavy metals in soil samples. Ecological risks were evaluated using the geo-accumulation index (Igeo), potential ecological risk index (RI), and risk assessment code (RAC). The findings revealed that: (1) The soil heavy metals in the study area exhibited varying degrees of enrichment, primarily attributed to anthropogenic activities. (2) There was no significant difference in the speciation characteristics of the eight heavy metals in the soil of each sampling site in the study area, and the main components were all residual fraction, and the mild acid-soluble fraction of Cd and Zn accounted for a relatively high proportion in individual sampling sites, which should be paid attention to. (3) Through the results of three risk assessment methods, it is concluded that the heavy metal pollution of soil in the study area is serious, and continuous attention should be paid to the corresponding pollution prevention measures.

1. Introduction

Soil is an extremely valuable natural resource and a crucial supply for agricultural production and human survival. With the rapid development of today’s society, along with accelerated industrialization and urbanization, the quality of the soil environment is progressively deteriorating. Among these concerns, heavy metal pollution in soil stands out as one of the most severe issues related to soil contamination [1,2]. Heavy metals are persistent, latent, cumulative, biotoxic and irreversible, and their accumulation in arable soils changes the physical and chemical properties of the soil, affects the microbial community in the soil, thereby interfering with the self-purification and fertility of the soil and destroying the soil structure and ecosystem [3,4]. These changes can lead to a reduction in crop yield and quality, such as Cd, Pb affect photosynthesis and nutrient uptake in plants, affecting the nutritional value of the crop; Zn is an essential element for plant growth, but is toxic to plants when Zn concentrations are too high [5]. The accumulation of heavy metals in soil can lead to the accumulation of heavy metals in crops and enter the human body through the food chain, posing a threat to human health. For example, the accumulation of Cu can cause hypotension, jaundice, Menke’s disease, and so on [6]; the accumulation of As and Hg can induce a variety of cancers and Blackfoot disease [7]; the accumulation of Pb can affect human intelligence and bone development, damage renal function and immune function [8]; excessive Cr can cause respiratory diseases, causing emphysema and other diseases [9]; the accumulation of Cd can cause bone pain, and also pose a serious threat to human liver and kidney function [10]. At the same time, heavy metals in soil can pollute surface water and groundwater with surface runoff, rainfall infiltration, etc., and can also enter the atmosphere by wind, affecting the quality of the ecological environment. A multitude of studies have demonstrated that the migration, transformation, and toxicological impacts of heavy metals in soil are not solely dependent on their total quantity, but also intricately linked to their occurrence form and concentration. The analysis of heavy metal speciation forms in soil is particularly crucial for assessing soil heavy metal pollution [11,12,13]. Therefore, the improved BCR sequential extraction procedure with higher accuracy and stability was adopted in this study to analyze the content of various forms of heavy metals in soil in the study area and explore the distribution characteristics of their occurrence forms [11].
The Zhaoping County in Hezhou, Guangxi is abundant in mineral resources, with its gold reserves and exploitation playing a significant role in the southeastern region of Guangxi, which is recognized as a pivotal area for gold mining [14]. The former Jinzhuzhou gold mine in Pingshui Village, where the research area is located, has been subjected to unregulated mining practices for an extended period since its discovery. Consequently, the resulting waste gas, wastewater, and solid waste were discharged and discarded without proper treatment. This irresponsible behavior has led to severe pollution of the mine environment, downstream Pingshui flushing water quality, and cultivated land on both sides of the river. Moreover, it has had a detrimental impact on local production and livelihoods. The Pingshui flushing has a total length of approximately 8 km, with around nine tributaries. Wastewater generated from the mine flows out from the source of Pingshui flushing and merges with the Southwest Rush to flow into the Gui River, and the historical data show that the water quality of the mainstream of Pingshui flushing is relatively stable. However, the tributary streams frequently have exceeding levels of pH or As, and the water quality of the upstream tributaries of Pingshui flushing which flows through the mine is unstable. Therefore, it is imperative to address the issue of heavy metal soil pollution in the study area by analyzing the sources of heavy metal pollutants and conducting a comprehensive evaluation of soil contamination for effective remediation measures and safe agricultural production.
This study focused on the cultivated soil of Pingshui village, Zhaoping County, Hezhou, Guangxi as the research subject and analyzed the total amount and speciation characteristics of eight heavy metal elements in the soil. Correlation analysis and principal component analysis were employed to investigate the sources of heavy metals in the soil. Additionally, the geo-accumulation index method, potential ecological risk index method, and risk evaluation risk assessment code method were utilized to assess soil risks in the study area. The original sentence was polished to provide a more professional expression: “To establish a scientific foundation for agricultural development, ensure food safety production, and address heavy metal pollution in local and similar areas”.

2. Overview of the Study Area

The study area is located in Pingshui Village, Wujiang Town, Zhaoping County, Guangxi, China (Figure 1a–d), in the western part of the Nanling tectonic belt and the central and northern part of the Daya Oshan gold metallogenic belt, mainly exposed to the Cambrian Shuikou Group of strata, including shallow metamorphic sandstone, siltstone, siliceous rock and so on. Fracture structures are developed in the district, including siliciclastic layers, siliciclastic gold-bearing fracture zones and fault-crushing zones. The study area has a subtropical monsoon temperate climate, with high relief in the northeast and low relief in the south, and a hilly landscape in most of the area. The predominant soil type is red soil, characterized by a reddish hue, pronounced acidity, dense texture, abundant aluminum and iron content, as well as high levels of organic matter and nitrogen nutrients. Through field inspections, it was determined that 13.67% of the farmland in the research area had been abandoned, while the remaining land was utilized for cultivating crops such as cassava, corn, tea seed trees, oranges, peanuts, and other economic crops. Approximately 1.5 km upstream from the study area lies the Jinzhu State Gold Mine in Wujiang Town of Zhaoping County; its operations have impacted crop yields in the vicinity and resulted in soil abandonment. Furthermore, there have been significant changes in cultivation practices.

3. Materials and Methods

3.1. Sample Collection and Preservation

According to the principle of typicality and representativeness, 34 soil sampling points were established in the agricultural land plots downstream of the former Jinzhu State Gold Mine (Figure 1e). Soil samples were collected in July 2022 (non-rainy season), after the previous crop had matured and before the next crop had been primed and planted. Each sampling point was sampled using the plum sampling method, and five soil surface samples (0–20 cm in situ soil) were collected within a 1 m radius of each sampling point, and the five samples were mixed to form the sample for that point. Soil samples were collected from 34 sampling points at one time, debris was picked out, and 1.0–1.5 kg of soil samples were retained in sample bags using the tetrad method and taken back to the laboratory for processing.
The soil samples were placed in a ventilated place to dry naturally, the large soil samples were cracked with a wooden stick to prevent lumps, roots, stones, worms and other debris were removed, and the soil samples were fully sieved through a 2 mm (10 mesh) aperture sieve, and a portion of the samples was removed by the tetrad method to be stored in a container after passing through a 0.25 mm (60 mesh) aperture sieve, and then sealed for spare use. Soil samples were divided into two parts, the samples passed through 0.25 mm aperture sieve were used for the determination of the total amount of heavy metals in the soil and the analysis of the morphology, while the samples passed through 2 mm aperture sieve were used for the determination of its physical and chemical properties.

3.2. Experimental Methods

The pH value of the soil sample was determined using potentiometry. The concentrations of Cr, Ni, Cu, Zn, As, Cd, Pb, and Hg in the soil sample were analyzed following digestion by the four-acid method (HCl-HNO3-HF-HClO4). The speciation of the eight heavy metal elements in the soil sample was obtained through improved BCR sequential extraction procedure method [15] in the following order: mild acid-soluble fraction, reducible fraction, oxidizable fraction, residual fraction and water-soluble fraction. The specific procedures are detailed in Table 1. The content and morphological data of Cr, Ni, Cu, Zn, As, Cd and Pb were determined by inductively coupled plasma mass spectrometry (ICP-MS), and the content and morphological data of Hg were determined by atomic fluorescence spectrometry (AFS).
The determination of the total amount of heavy metals and the morphology of the soil samples was carried out by China Nonferrous Guilin Institute of Mining and Geology, and the digestion, morphology extraction experiments, and pH determination of the samples were performed in the laboratory of the prediction of hidden deposits of Guilin University of Science and Technology. The reagents used in the experiments were all of excellent purity grade, and the water used was ultrapure water. The sample testing process underwent rigorous quality control measures, including the implementation of three sets of parallel samples for each group during sample analysis, ensuring a relative standard deviation of <10%. The detection limits and reporting rates of total heavy metals and each form of determination were in accordance with the quality requirements for sample analysis.

3.3. Evaluation Methods

3.3.1. The Geo-Accumulation Index Method

The geo-accumulation index method, initially proposed by German scientist Muller [16] in 1969, was first employed in the analysis of metal pollutants present in water body sediments. This approach considers both natural and anthropogenic factors when assessing soil heavy metal levels, encompassing the natural background value of soil as well as the extent of human impact on it [17]. The Igeo was calculated using Formula (1).
I g e o = l o g 2 C n K × B n
where I geo is the geo-accumulation index of heavy metal “n”; C n is the content of element n in soil sediment;   B n is the geochemical background value of the element in the region, and in this paper, we refer to the background value of the soil environment in Guangxi Zhuang Autonomous Region [18]; and K is generally taken to be 1.5 and is a coefficient of reference to the change of background value caused by the difference of rocks in the natural state of each region [19]. The relationship between the heavy metal geo-accumulation index and the heavy metal pollution level is shown in Table 2 [19].

3.3.2. The Potential Ecological Risk Index Method

The potential ecological risk index method (RI) evaluation method was a collection of techniques devised by Swedish scientist Hakanson [20] in 1980 to assess the extent of heavy metal pollution and its ecological impact. This method is based on the nature of heavy metals and their degree of interference with the environment, and assesses heavy metal contamination in soil or sediment from a sedimentological point of view, which not only takes into account the content of heavy metals in soil, but also links the ecological and environmental effects of heavy metals with toxicology, and it is a more widely used method of assessment at present [21]. The formulae were as follows:
C f   i = C k   i C n   i
E r   i = T r   i × C f   i
RI =   i = 1   n   E r   i = i = 1   n T r   i C f   i   = i = 1   n T r   i   C k   i C n   i
In the formula, C k   i is the measured value of soil heavy metals, C k   i is the reference value of soil heavy metals, and the reference value is selected as the background value of soil environment in Guangxi Zhuang Autonomous Region [18]; E r   i is the potential risk index of individual heavy metals; RI is the integrated value of potential ecological risk; T r   i corresponds to the toxic response coefficient assigned to each heavy metal: Hg = 40, Cd = 30, As = 10, Pb = Ni = Cu = 5, Cr = 2 and Zn = 1 [21]. The potential ecological indexes and classification standards of heavy metals are shown in Table 3 [22].

3.3.3. The Risk Assessment Code Method

The risk assessment code method (RAC) [23] is a classical quantitative evaluation method to classify the degree of bioavailability and its risk to the environment based on the strength of the binding of heavy metals to the soil and the ability of heavy metals to be released from the soil and enter into the food chain, which quantifies the ecological risk of heavy metals by calculating the proportion of the active form of heavy metals (water-soluble fraction + mild acid-soluble fraction) in the total amount, and the higher the proportion, the greater the risk to the environment [24]. The formulae were as follows:
RAC = C i C o × 100 %
In the formula, C i   is the concentration of the active form of a heavy metal in the sample, and   C o is the total concentration of the heavy metal in the sample. The evaluation criteria are shown in Table 4 [25].

3.4. Data Processing Methods

The test data from 34 soil samples were analyzed using Excel2016; SPSS23.0 was used for descriptive statistical analysis, correlation analysis and principal component analysis; ArcGIS10.8, Origin2022 and Coreldraw2018 were used for the graphical drawing of the sampling point location maps, heavy metal endowment morphology characterization and pollution evaluation results.

4. Results and Discussion

4.1. Analysis of Total Heavy Metals

The results of soil heavy metal content and pH in the study area are shown in Table 5. The soil in the study area was acidic as a whole and with reference to the background value of the soil environment in Guangxi [18] with the value of pH < 5.5 in the screening value of “Soil Environmental Quality Risk Control Standard for Soil Contamination of Agricultural Land” (GB 15618-2018) [26], the average concentrations of Cr, Ni, Cu, Zn, As, Cd, Pb, and Hg in the study area’s soil exceeded the background value of soil in Guangxi, and the average concentrations of Cr, As, Cd and Hg exceeded the risk screening value (pH < 5.5). The coefficient of variation (CV) can reflect the dispersion of heavy metal contents and the influence of anthropogenic activities on the heavy metal contents, and the larger the value of its coefficient, the more uneven the spatial distribution of the content of the element and the greater the degree of interference by human activities, namely CV < 10% as weak variation, 10% ≤ CV ≤ 30% as moderate variation, and CV > 30% as strong variation [27,28]. The CV of the As, Cd and Hg elements in the soils of the study area reached 63.56%, 49.82% and 32.67%, respectively, which are strong variations, indicating that the As, Cd and Hg elements in the soils of the study area are highly influenced by anthropogenic activities. The remaining five heavy metal elements were moderately variable, indicating their uneven spatial distribution.

4.2. Analysis of Heavy Metal Sources

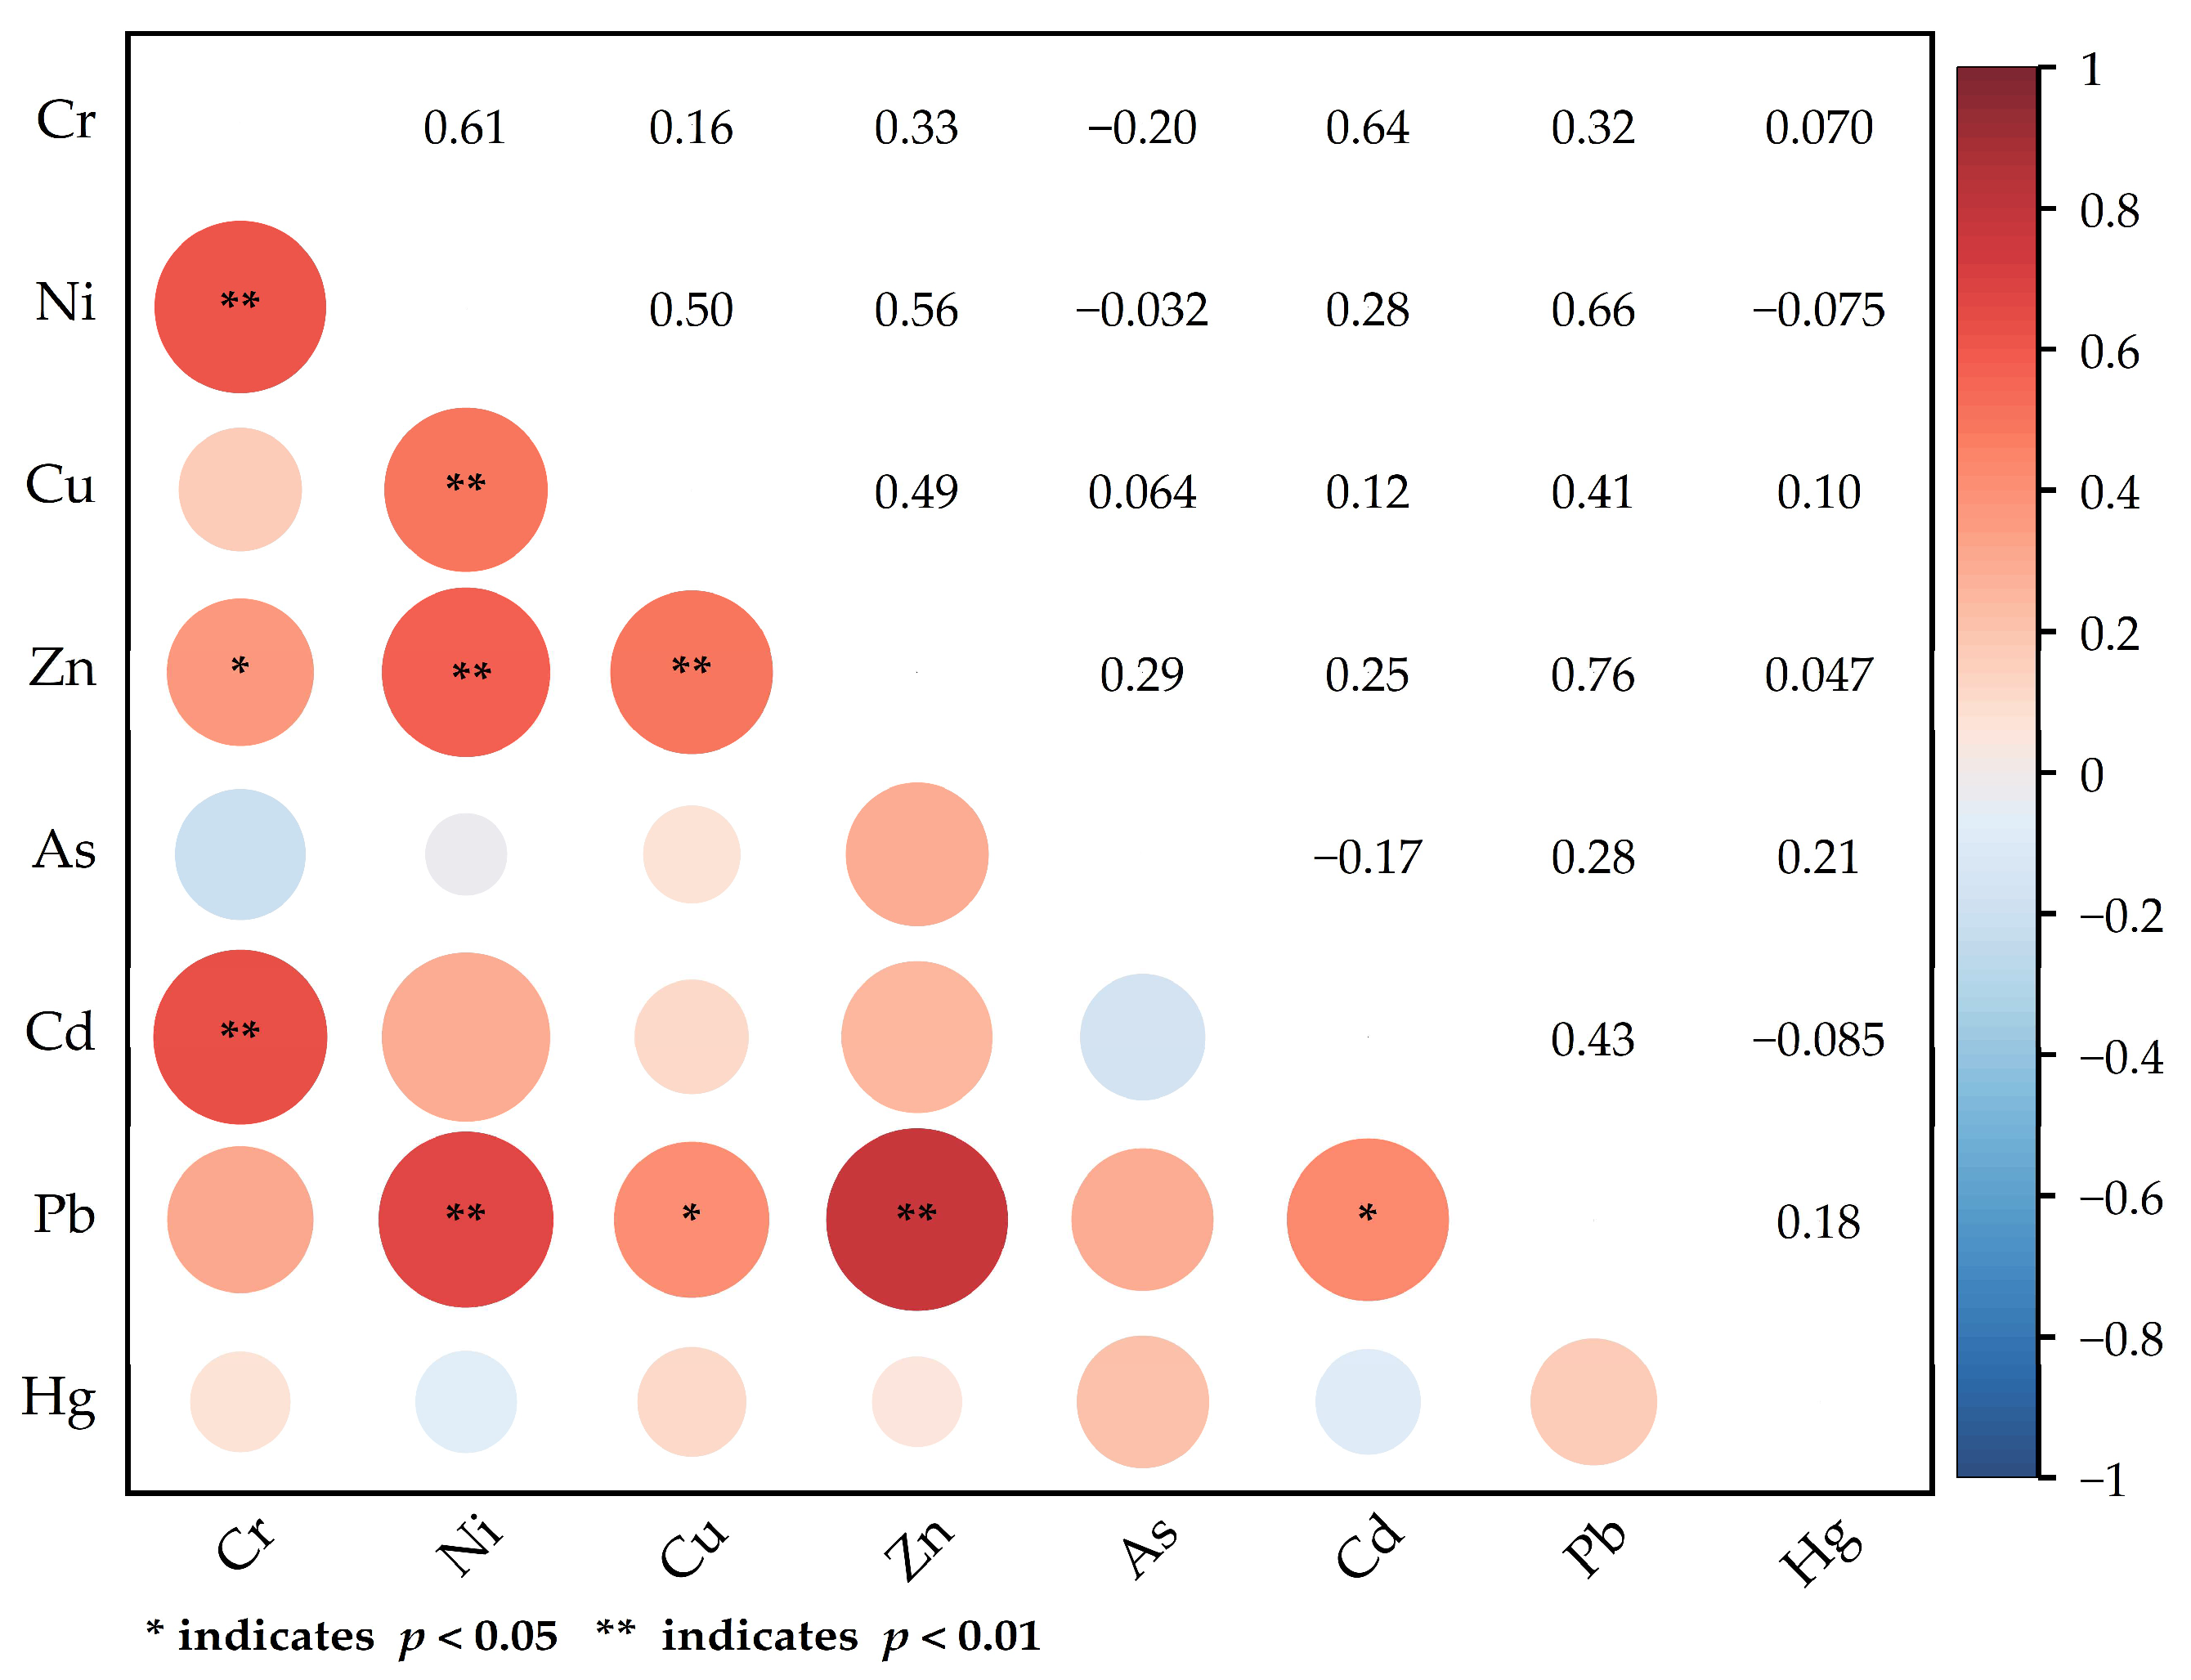
The results of the correlation analysis can reflect the degree of association between different elements and infer their potential homology. The higher the significance of the correlation, the stronger the likelihood that the sources of various heavy metal elements are consistent [29]. The results depicted in Figure 2 demonstrate a significant positive correlation (p < 0.01) among Ni, Cu, Pb, and Zn. Notably, the correlation between Pb and Zn is particularly strong with a coefficient of 0.76, indicating a common or similar source for these four heavy metal elements. There is also a significant correlation between Cr and Ni, Cd and Zn, suggesting that their sources are similar and potentially mixed. The negative or weak correlation (absolute value less than 0.3) observed between As and Hg with other elements implies that As and Hg are unlikely to share the same source as other heavy metals, indicating independent sources for these elements.
In order to further analyze the sources of heavy metal elements in the soil of the study area, principal component analysis of heavy metal elements in the soil of the study area was carried out, in which the results of KMO and Bartlett’s spherical test showed that the KMO = 0.619 > 0.5 for the sample data, and the significance of Bartlett’s spherical test was 0.00 < 0.05, which indicated that the principal component analysis could be carried out. The results of the analysis are shown in Table 6, where three principal component factors were extracted with Eigenvalues of 3.387, 1.062 and 0.972, respectively, with a cumulative contribution of 74.51 percent, so that the analytical study of these three principal components explains most of the heavy metal sources.
The contribution rate of factor 1 (PC1) was 42.34%, and Ni, Pb, Zn, Cd, Cr, and Cu had large loadings, indicating that the sources of these six heavy metals were similar. The average concentration of Ni, Pb, Zn, Cd, Cr, and Cu were higher than the background values of the Guangxi soils [18], suggesting that the sources originated mainly from anthropogenic sources, in addition to natural sources. Studies have indicated that the primary gold-bearing minerals found in the original Jinzhuzhou gold mine include pyrite, arsenopyrite, galena, sphalerite, and chalcopyrite, among others [30]. The accumulation of waste slag, wastewater and dust resulting from mining and smelting processes can exert a certain impact on the surrounding soil environment through long-term stacking, rain leaching and atmospheric deposition [31,32]. The study area is cultivated soil, where the use of organic fertilizers, chemical fertilizers, and pesticides in agricultural activities can lead to an increased accumulation of heavy metals such as Pd, Cd, and Cu on the soil surface.
The contribution rate of factor 2 (PC2) was 20.019%, and As had a large loading with a contribution of 79.70%. The average concentration of As exceeded the background values of the Guangxi soils [18], and the coefficient of variation reached 63.56%, suggesting that As was produced by a combination of natural and anthropogenic sources. Relevant data have indicated that the ores in the upper gold mining area of the study site predominantly consist of sulfide pyrite and exhibit a high concentration of arsenopyrite, an iron arsenic sulfide mineral [33]. The waste rock and tailings left behind by mining activities contain elevated levels of As, which gradually migrate into the surrounding soil over time, leading to pollution. The historical data indicate that the water quality of Pingshui flushing tributaries in the study area has exceeded the As standard (exceeding the limit value of As ≤ 0.05 mg/L in Class III standard of Environmental Quality Standard for Surface Water (GB3838-2002)), which is potentially attributed to ore separation and grinding during mining and smelting processes. This leads to the introduction of arsenic-containing powder into the water system, while particles containing arsenic in river water infiltrate surrounding soil through mechanisms such as flow, sedimentation, and adsorption, consequently resulting in soil pollution [34].
The contribution rate of factor 3 (PC3) was 12.154%, and Hg had a large loading with a contribution rate of 82.60%, with an average concentration exceeding the background value of Guangxi soils [18], while also displaying a high coefficient of variation. Correlation analysis results indicate that there exists a weak correlation between Hg and the other seven heavy metals. This suggests that Hg may have originated from the irregular selection and smelting methods employed in early small private workshops [35]. Since the 1980s, the Jinzhuzhou gold mine has been in a state of chaotic and disorderly mining for a long time, and small private workshops often use the low-cost amalgamation method to add metallic mercury in the process of extracting gold, and the wastewater, waste gas and solid waste produced are discharged and discarded without treatment, resulting in serious Hg contamination of Pingshui flushing and downstream cultivated land.

4.3. Speciation Distribution Characteristics of Heavy Metals

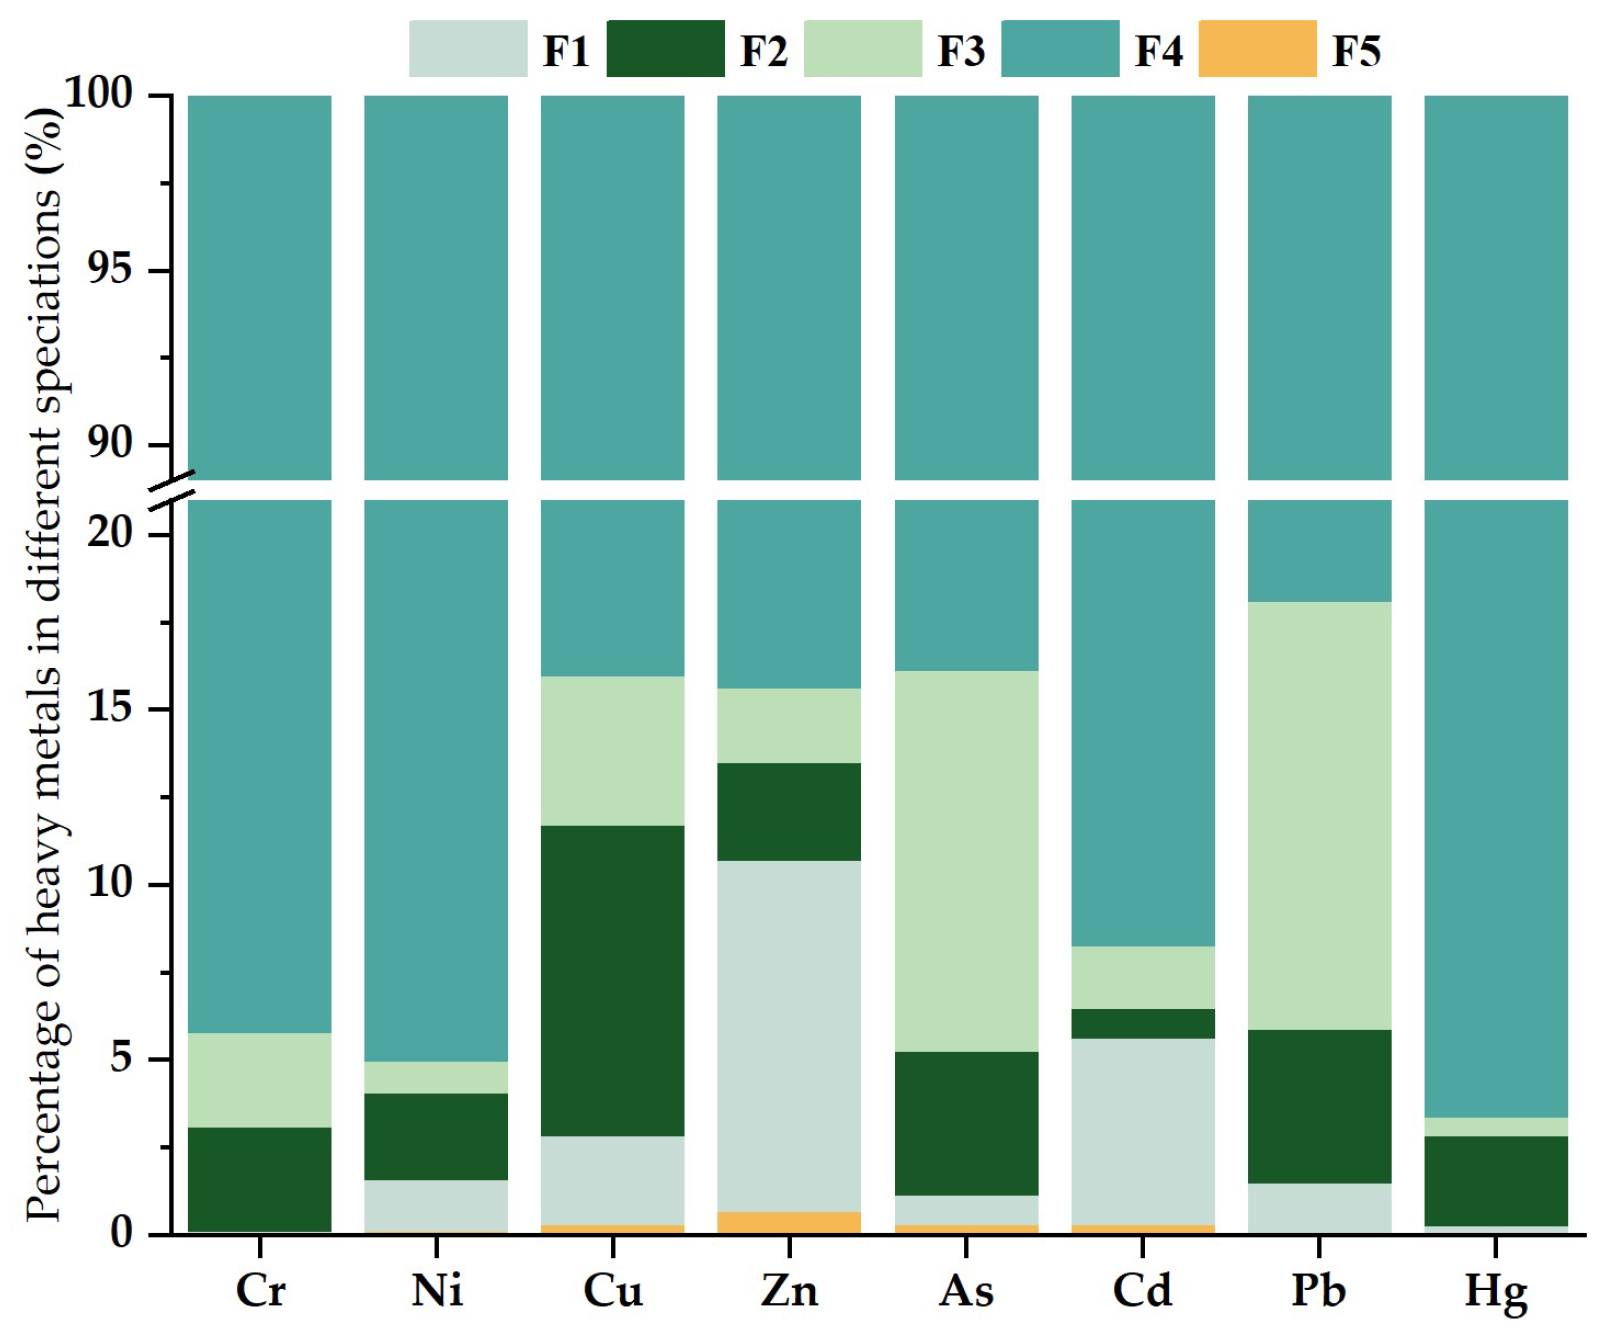
The speciation of various forms of heavy metals in soil and its distribution coefficient (that is, the ratio of the content of various forms of heavy metals to the total amount of heavy metals) is an important index to evaluate the environmental risk of heavy metals [36]. It was demonstrated that heavy metals in the water-soluble fraction and mild acid-soluble fraction easily migrate and transform in the soil, are absorbed by plants, and are more harmful to human beings and the environment; the reducible fraction is the form that is easier for plants to use; the oxidizable fraction is more stable and is the form that is harder to be used by plants, but it will be transformed under alkaline or oxidizing conditions and is potentially hazardous to organisms; and the residual fraction is originated from the soil minerals, which is stable in nature and can exist in the sediment for a long time, is not easy to be absorbed by plants, and is less potentially harmful to the whole soil ecosystem [37]. The distribution characteristics of heavy metal speciation forms in the soil of the study area are illustrated in Figure 3. Generally, there is little variation observed in the distribution characteristics of heavy metal speciation forms within the study area, the main components of Cr, Ni, Cu, Zn, As, Cd, Pb and Hg are all residual fractions. The residual fraction is a form of heavy metal that is not easily affected by changes in the physical and chemical properties of the soil and exists in the soil mainly in the form of layered silicates, which are blocked in the mineral lattice of primary and secondary minerals and are chemically very stable, making it difficult for them to be transported and transformed in the soil medium and have an impact on living organisms [38,39].
The speciation characteristics of different heavy metals at each sampling point are illustrated in Figure 4. In the study area, Cr predominantly exists in a residual fraction, accounting for an average of over 90%, followed by an oxidizable fraction. This indicates the relatively stable properties of Cr in the study area. The speciation distribution of Ni in the 34 soil sampling sites was more consistent, with a high percentage of residual fraction, higher stability, higher unavailability in the soil, and low risk of contamination. The residual fraction still dominates the speciation form of Cu in the soil at each sampling point in the study area, while the proportion of oxidizable fraction for Cu is significantly higher compared to that of Cr and Ni. This may be due to the fact that the study area belongs to cultivated land, which is richer in organic matter, Cu has a strong affinity for organic matter, and organic matter available for exogenous Cu binding to form the oxidizable fraction is richer, causing it to exist in the form of an oxidizable fraction [40]. The speciation of Zn at the sampling sites is dominated by the residual fraction, followed by the mild acid-soluble fraction. Heavy metals in the mild acid-soluble fraction are mostly adsorbed on the surfaces of clay, humus and other minerals and microorganisms, and are released when environmental conditions such as pH change and can be directly utilized by biological organisms [41]. The pH value of the soil in the study area is in the range of 3.42–5.16, with an average value of 4.02, and the whole is acidic, which makes it easy to accelerate the dissolution and migration of the mild acid-soluble fraction, and there is a certain ecological risk of Zn. Among them, the proportion of mild acid-soluble fraction reached 17.46% and 21.76% in points 3 and 5, which are the two sampling points with the highest proportion of mild acid-soluble fraction in each sampling point in the study area, and they should be paid proper attention. The As in the soil of each sampling point is mainly a residual fraction, and the potential ecological risk to the soil environment is minimal, which is different from the traditional view that gold mining areas easily cause As pollution [42]. Although the proportion of reducible fraction at sampling points 12, 14 and 33 exceeded 20%, and the proportion of oxidizable fraction at sampling points 16 and 33 reached 17.40% and 14.47%, respectively, the proportion of these two forms was far lower than that of residual fraction. Cd mainly exists in the residual fraction, followed by the mild acid-soluble fraction in the soils of the sampling points in the study area, and the proportion of the mild acid-soluble fraction reached 21.29% in the sampling point 19, which needs to be emphasized. In the study of heavy metal pollution in the mining area at home and abroad, Cd pollution widely exists and its biological effectiveness is very high, so further investigation into Cd pollution in our research area is imperative. In domestic and international studies of heavy metal pollution in mining areas, Cd pollution is widespread and highly bio-effective, and in-depth studies of Cd pollution in the study area should be carried out. The speciation of Pb in the soil of each sampling point in the study area was dominated by residual and reducible fractions, and the mild acid-soluble fraction accounted for a relatively small amount, this is due to the large presence of anions such as CO32− and OH in the soil will form ferromanganese oxides with Fe and Mn, which have a strong adsorption capacity of pb2+, and the Pb and the ferromanganese oxides are combined to form a stable complex, which is difficult to be released for migration [41,43]. The water-soluble fraction of Hg is not detected in all sampling sites in the study area, and the mild acid-soluble fraction of Hg is not detected in some of the sampling sites, and the main storage form was the residual fraction. Sampling site No.1 is different from the other sites in that the oxidizable fraction accounted for a higher percentage of the total, but the soil in the study area is acidic, and the oxidizable fraction is more stable, so the ecological hazards are lower.

4.4. Risk Assessment of Soil’s Heavy Metals

4.4.1. Evaluation Results of the Geo-Accumulation Index Method

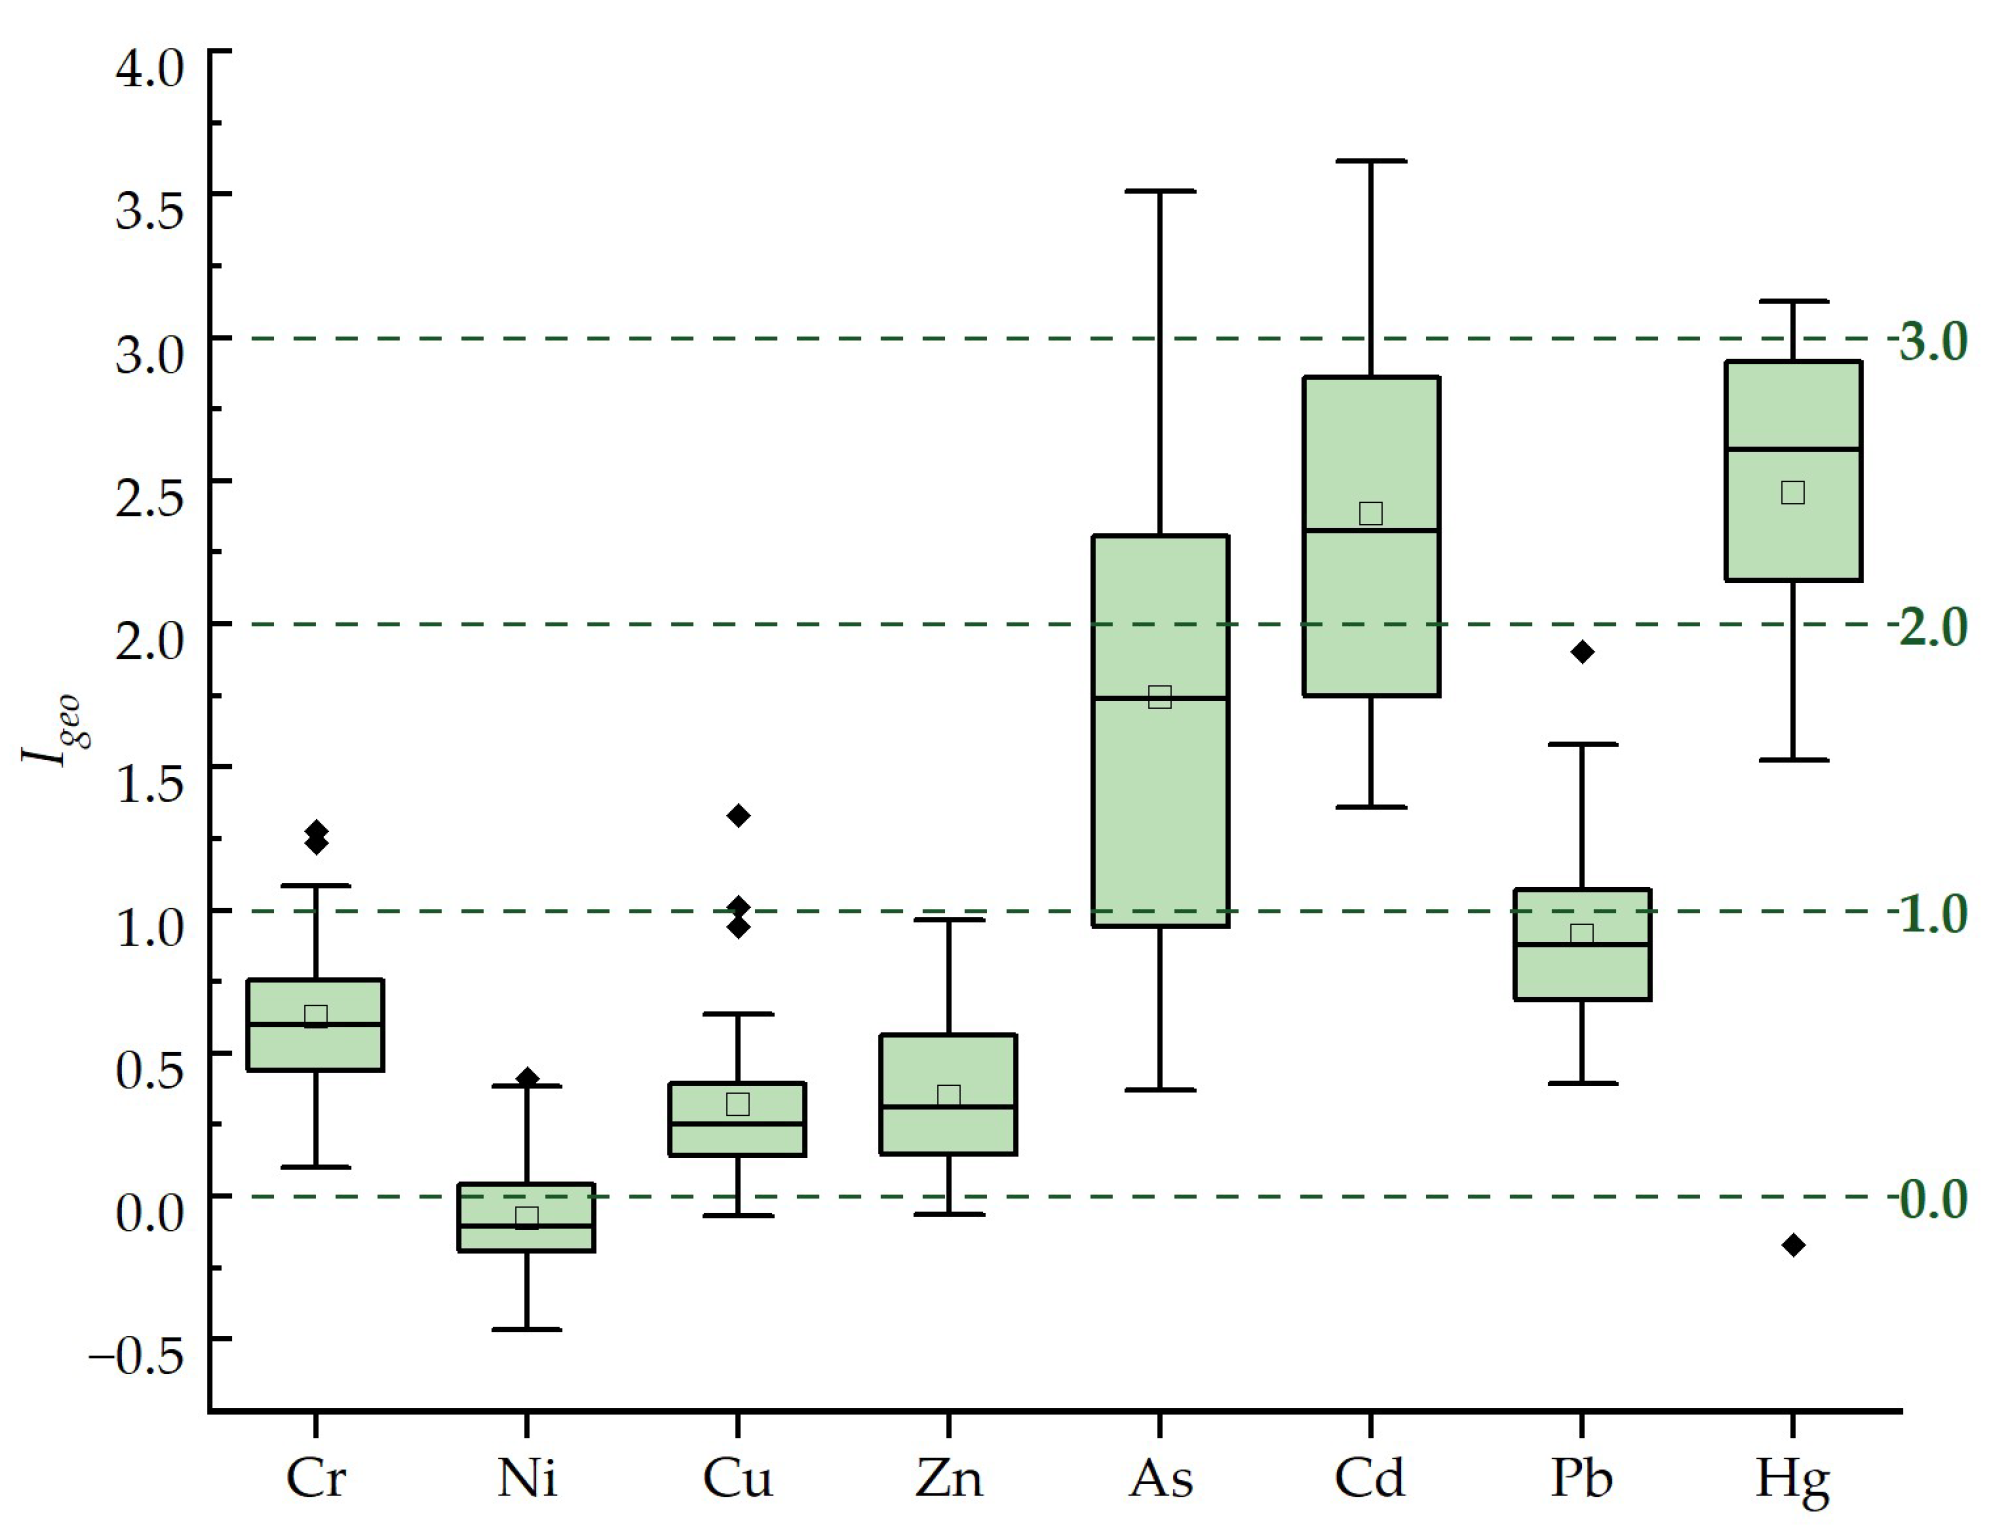
In this study, the background values of heavy metal elements were referred to as the background values of the soil environment in Guangxi Zhuang Autonomous Region [18], and the average Igeo value of heavy metals in the study area is calculated according to Formula (1). The evaluation results are shown in Table 7 and Figure 5. The order of Igeo of eight soil heavy metals in the study area was Hg > Cd > As > Pb > Cr > Zn > Cu > Ni. The overall view is that the study area contains Hg. On the whole, the soil in the study area was moderately-to-highly polluted by Hg and Cd, moderately polluted by As, slightly polluted by Pb, Cr, Zn and Cu, and not polluted by Ni.

4.4.2. Evaluation Results of the Potential Ecological Risk Index Method

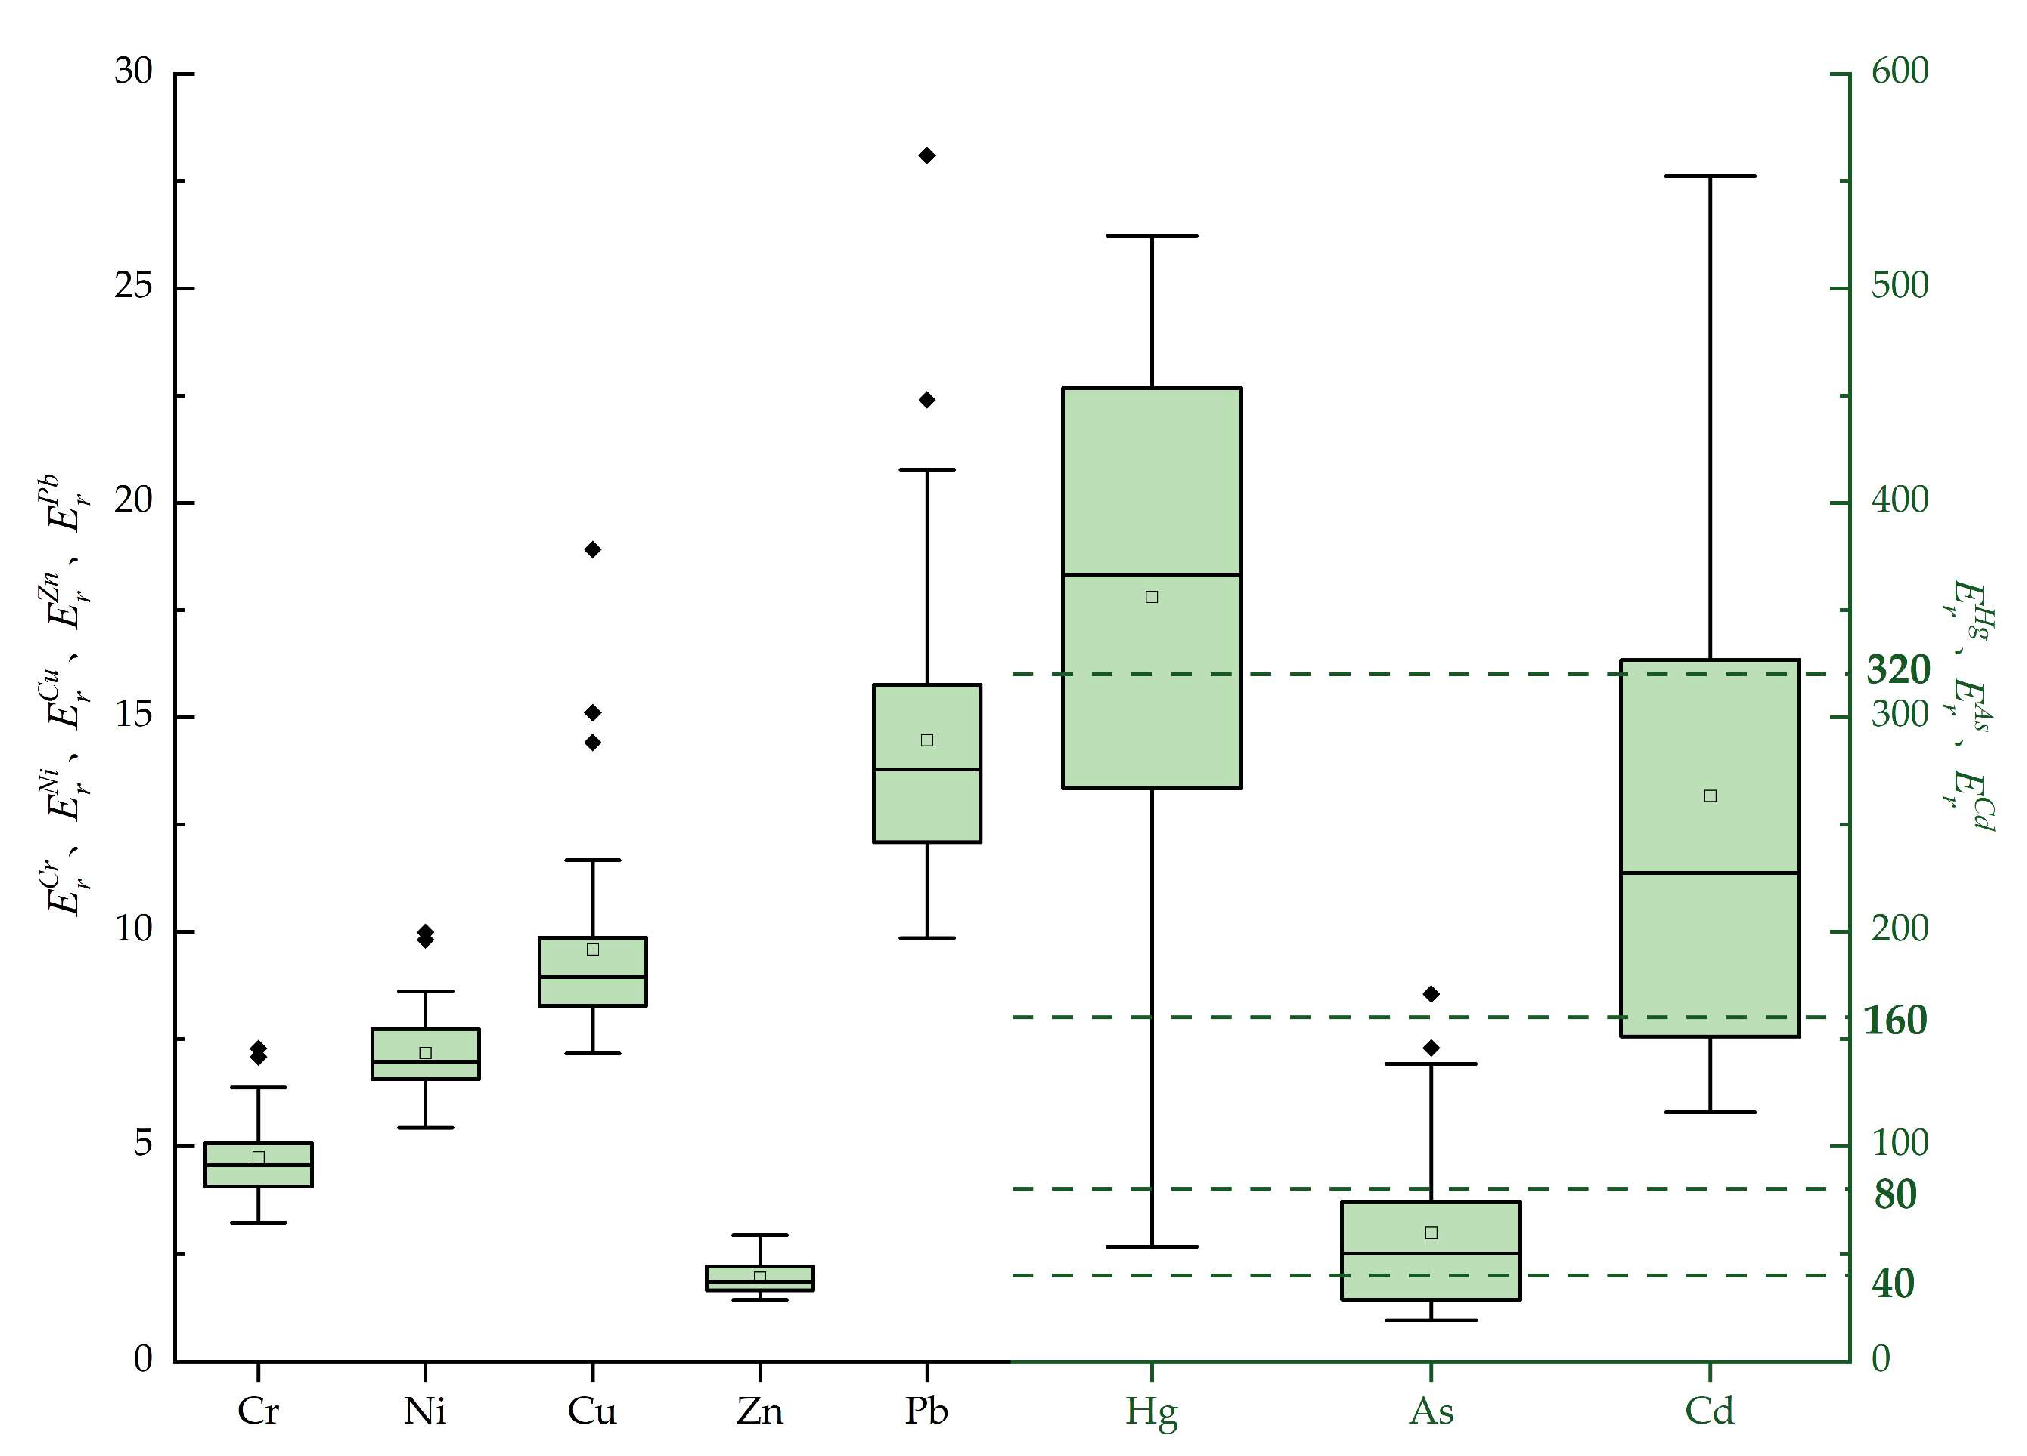
In this study, the reference value of soil heavy metal elements in the study area was referred to the background value of soil elements in the Guangxi Zhuang Autonomous Region [18], was used to calculate the potential ecological risk index (Eri) and comprehensive risk index (RI) for individual heavy metals in the study area using Formula (2). The evaluation results are shown in Table 8 and Figure 6. The results of the evaluation showed that the average value of Eri was in the order of Hg >Cd> As> Pb> Cu> Ni> Zn. Among them, 67.65% and 41.18% of the sampling sites of Hg and Cd were very high ecological risk, respectively; 47.06% of the sampling sites of As were medium ecological risk; and Pb, Cu, Ni, Cr, and Zn were slight ecological risk. The average value of the potential ecological risk index (RI) of soil heavy metals in the study area was 716.69, which is a very high ecological risk. Overall, the potential ecological risk of the soil in the study area was relatively significant, with Hg at a very high ecological risk level, Cd at a very high ecological risk level, As at a medium ecological risk level, and the combined ecological risk of the soil was very high.

4.4.3. Evaluation Results of the Risk Assessment Code Method

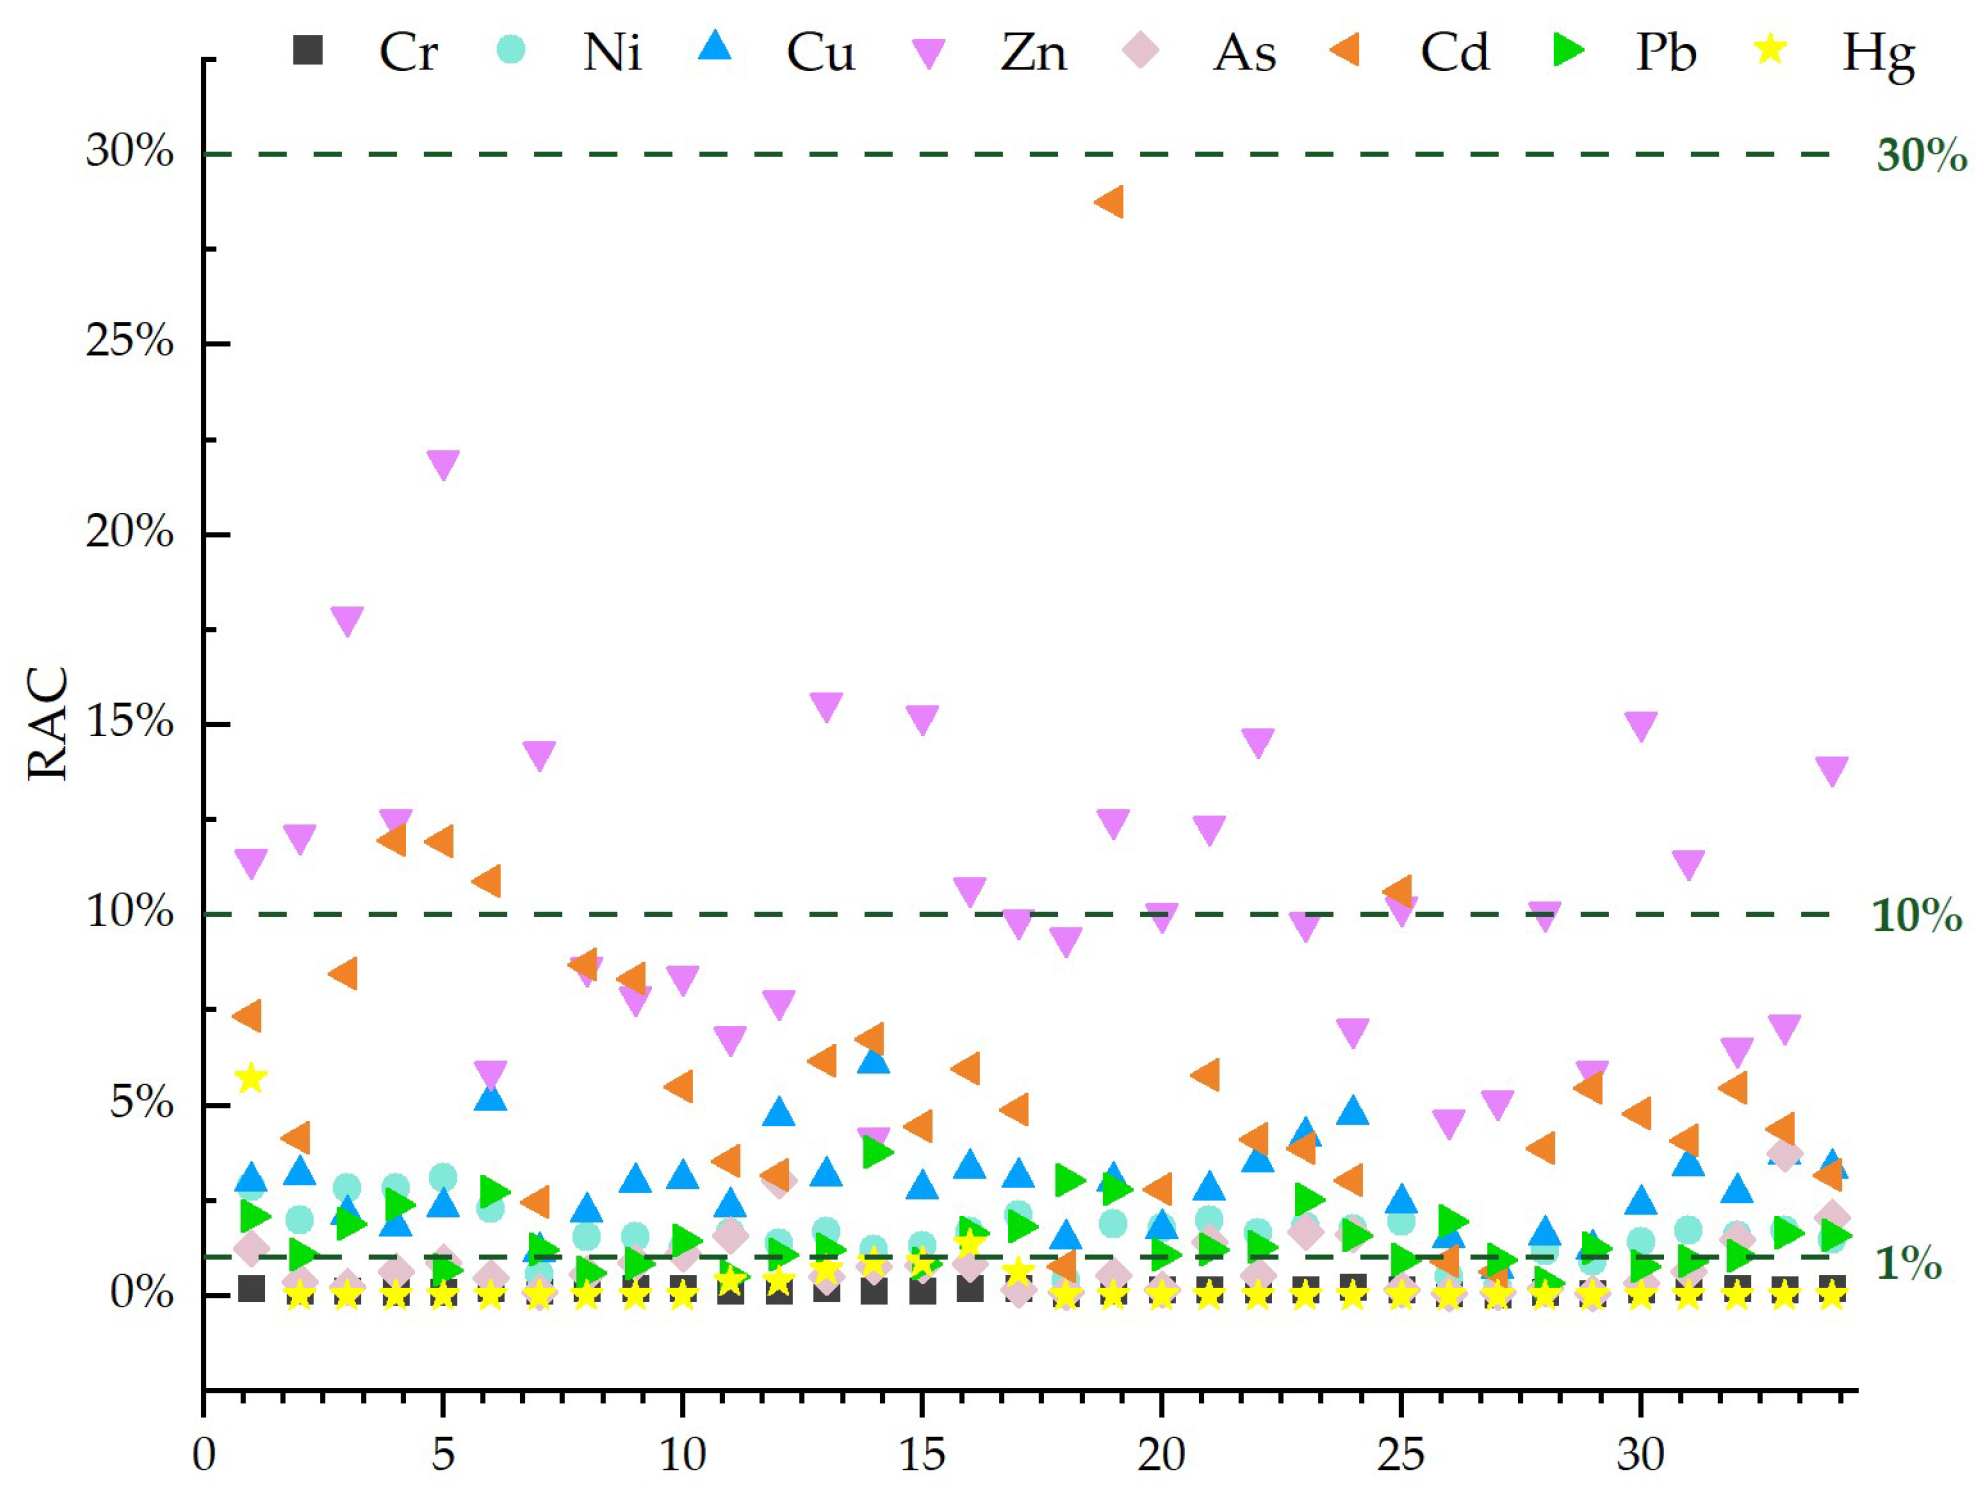
The evaluation results of the risk assessment code method for soil heavy metal risk assessment in the study area are presented in Table 9 and Figure 7. The average RAC index reveals that heavy metals in the soil of the study area are ranked as follows: Zn > Cd > Cu > Ni > Pb > As > Hg > Cr, indicating a significant pollution risk from As, Hg, and Cr. Cd, Cu, Ni, and Pb pose slight pollution risks while Zn poses a moderate pollution risk and represents the highest ecological environmental threat.

4.5. Comparative Analysis of Three Risk Assessment Methods

The results of the above three risk evaluation methods can be seen that there is a certain degree of variability between the results obtained by different evaluation methods. For instance, this study demonstrates that the Hg and Cd geo-accumulation index methods indicate a moderate to high pollution status, while the potential ecological risk index methods suggest an extremely high ecological risk level and a very high ecological risk level, respectively. Conversely, the risk assessment code method suggests a pollution-free fraction and a slightly polluted fraction.
The geo-accumulation index method reflects the regional enrichment characteristics of heavy metals and mainly considers the impact of the total amount of heavy metal elements on the environment but lacks the consideration of the bio-effectiveness of heavy metal elements The evaluation method of the potential ecological risk index combines the total amount of heavy metals, spatial heterogeneity of soil background value, and ecotoxicity to provide more reasonable evaluation results. However, this method places emphasis on the potential ecological harm caused by heavy metals to the environment, resulting in a higher level of ecological risk for heavy metals with higher toxicity coefficients [44]. The risk assessment code method evaluates the risk of heavy metals in soil from the perspective of the accumulation form of heavy metal elements and pays more attention to the relative content of the bio-directly available fraction of heavy metal elements, the mild acid-soluble fraction and water-soluble fraction, but the bio-toxicity of the elements does not depend entirely on the bio-efficacy [45]. For example, in this study, Zn had the highest percentage of the mild acid-soluble fraction and water-soluble fraction, but the toxicity coefficients of Zn were low and it was not easy to cause ecological risks.
When evaluating the risk of pollution by heavy metals in soil, the use of one evaluation method is prone to one-sidedness and deficiency; multiple evaluation methods should be selected, and based on the evaluation results of multiple evaluation methods, the influence of natural, anthropogenic, the nature of heavy metals, the characteristics of the distribution of heavy metals and other factors on the evaluation results should be comprehensively analyzed, in order to evaluate the pollution of the environment by heavy metals in soil in Pingshui Village, Zhaoping County, Hezhou, and the potential risk situation in the environment in a more objective manner.

5. Conclusions

(1)
The results of the three risk evaluation methods concluded that the soil’s heavy metal contamination level in the study area is high, and the combined potential ecological risk is high, with As, Hg and Cd as the main contaminating elements. Zn has the highest proportion of directly available biological state, which is a medium pollution risk, but the toxicity coefficient of Zn is low, which makes it difficult to cause ecological risk. It mainly originates from the waste rock and tailings left behind by the mines, Hg mainly originates from the early mining areas and from the chaotic and unorganized mining and gold extraction methods, and Cd mainly originates from mining activities and agricultural activities. In the process of mining and smelting, the direct discharge of waste residue, wastewater and waste gas will cause serious pollution, destroy the surrounding ecological environment and pose a potential threat to human health. Therefore, the international advanced mining and sorting process should be adopted, and the tailings should be treated and utilized in a timely manner to progress in the direction of non-waste mining. At the same time, the generated flue gas is sprayed and purified to reduce the risk of dry and wet settlement.
(2)
The predominant components of Cr, Ni, Cu, Zn, As, Cd, Pb and Hg in the soil within the study area are residues, accounting for 94.20%, 95.01%, 84.00%, 84.35%, 83.85%, 91.80%, 81.99% and 96.63%, respectively. The average proportion of the speciation of heavy metals in the soil is not much different, and the fraction of Cd and Zn mild acid-soluble is relatively high in individual sampling points, which needs to be paid attention to. In general, the soil’s heavy metal forms in the study area are relatively stable, and the change of soil pH should be monitored and the ecological risk situation of individual sampling sites should be paid attention to. It is recommended that further testing and research on citrus, maize and other crops grown in the study area should be carried out as a next step.

Author Contributions

Writing—original draft preparation, Y.M. and M.W.; Writing—review and editing, M.W. and P.L.; Collecting the samples, Y.M., Y.J. and M.W.; Software and data processing, Y.M., Y.J. and X.Z.; Funding acquisition, M.W. and P.L. All authors have read and agreed to the published version of the manuscript.

Funding

This research was funded by the Natural Science Foundation of Guangxi (2022GXNSFBA035548) and the National Natural Science Foundation of China (42163004 and 42203067).

Institutional Review Board Statement

Not applicable.

Informed Consent Statement

Not applicable.

Data Availability Statement

Further inquiries can be directed to the corresponding authors.

Conflicts of Interest

The authors declare no conflicts of interest.

References

  1. Li, X.; Pan, Y.; Zhu, C. Priority areas identification for arable soil pollution prevention based on the accumulative risk of heavy metals. Sci. Total Environ. 2024, 954, 176440. [Google Scholar] [CrossRef]
  2. Zhou, W.T.; Li, Z. Soil type data provide new methods and insights for heavy metal pollution assessment and driving factors analysis. J. Hazard. Mater. 2024, 480, 135868. [Google Scholar] [CrossRef]
  3. Wang, C.C.; Li, P.R. Spatial variability and risk assessment of heavy metals in the soil surrounding solid waste from coking plants in Shanxi, China. Environ. Monit. Assess. 2022, 195, 99. [Google Scholar] [CrossRef]
  4. Fei, X.F.; Lou, Z.H. Contamination and Health Risk Assessment of Heavy Metal Pollution in Soils Developed from Different Soil Parent Materials. Expo. Health 2023, 15, 395–408. [Google Scholar] [CrossRef]
  5. Renu, K.; Chakraborty, R. Molecular mechanism of heavy metals (Lead, Chromium, Arsenic, Mercury, Nickel and Cadmium)—induced hepatotoxicity—A review. Chemosphere 2021, 271, 129735. [Google Scholar] [CrossRef] [PubMed]
  6. Schlief, M.L.; West, T. Role of the Menkes copper-transporting ATPase in NMDA receptor-mediated neuronal toxicity. Proc. Natl. Acad. Sci. USA 2006, 103, 14919–14924. [Google Scholar] [CrossRef] [PubMed]
  7. Li, D.L.; Zhang, H.C. Environmental arsenic (As) and its potential relationship with endemic disease in southwestern China. J. Environ. Sci. 2024, 139, 46–59. [Google Scholar] [CrossRef] [PubMed]
  8. Balza, J. Hidden toxins: Bathtubs as a potential source of lead exposure in children. J. Toxicol. Environ. Health Part A 2022, 85, 376–380. [Google Scholar] [CrossRef] [PubMed]
  9. Xia, S.; Song, Z. A critical review on bioremediation technologies for Cr(VI)-contaminated soils and wastewater. Crit. Rev. Environ. Sci. Technol. 2019, 49, 1027–1078. [Google Scholar] [CrossRef]
  10. Iqbal, M. Vicia fababioassay for environmental toxicity monitoring: A review. Chemosphere 2016, 144, 785–802. [Google Scholar] [CrossRef]
  11. Chen, W.; Wei, Z.Y. Chemical evaluation methods for the phytoavailability of heavy metals in soils. J. Agro-Environ. Sci. 2024, 5, 1–19. [Google Scholar]
  12. Zhang, J.L.; Liu, Y.H. Speciation Analysis and Pollution Assessment of Heavy Metals in Farmland Soil of a Typical Mining Area: A Case Study of Dachang Tin Polymetallic Ore, Guangxi. Appl. Sci. 2023, 13, 708. [Google Scholar] [CrossRef]
  13. Sun, J.W.; Hu, G.R. Bioavailability of heavy metals in soil-tea plant system of Tieguanyin tea garden. Environ. Chem. 2020, 39, 2765–2776. [Google Scholar]
  14. Yang, E.L.; Li, H.P. Research on lightning protection design of gold mine. Technol. Innov. 2016, 118. [Google Scholar]
  15. GB/T 25282-2010; Soil and Sediment-Sequential Extraction Procedure of Speciation of 13 Trace Elements. Standardization Administration of China: Beijing, China, 2010.
  16. Muller, G. Index of Geoaccumulation in Sediments of the Rhine River. Acta Geol. Pol. 1969, 2, 109–118. [Google Scholar]
  17. Li, X.Y.; Zhang, J.Y. Status of chromium accumulation in agricultural soils across China (1989–2016). Chemosphere 2020, 256, 127036. [Google Scholar] [CrossRef] [PubMed]
  18. Environment Monitoring Total Station of China. Chinese Soil Element Background Values; China Environment Science Press: Beijing, China, 1990. (In Chinese) [Google Scholar]
  19. Chai, S.W.; Wen, Y. Application of index of geoaccumulation (Igeo) to pollution evaluation of heavy metals in soil. J. Tongji Univ. Nat. Sci. 2006, 34, 1657–1661. [Google Scholar]
  20. Hakanson, L. An ecological risk index for aquatic pollution control a sedimentological approach. Water Res. 1980, 14, 975–1001. [Google Scholar] [CrossRef]
  21. Xu, Z.Q.; Ni, S.J. Calculation of Heavy Metals Toxicity Coefficient in the Evaluation of Potential Ecological Risk Index. Environ. Sci. Technol. 2008, 31, 112–115. [Google Scholar]
  22. Zhang, J.; Peng, W. Environmental geochemical baseline determination and pollution assessment of heavy metals in farmland soil of typical coal-based cities: A case study of Suzhou City in Anhui Province, China. Heliyon 2023, 9, e14841. [Google Scholar] [CrossRef] [PubMed]
  23. Jain, C.K. Metal fractionation study on bed sediments of River Yamuna, India. Water Res. 2004, 38, 569–578. [Google Scholar] [CrossRef] [PubMed]
  24. Yang, X.M.; Zhuang, T. Fraction distribution and ecological risk assessment of soil heavy metals in the farmland soil from the sewage irrigated area of Xiaoqing River. Environ. Chem. 2019, 38, 644–652. [Google Scholar]
  25. Sundaray, S.K.; Nayak, B.B. Geochemical speciation and risk assessment of heavy metals in the river estuarine sediments-A case study: Mahanadi basin, India. J. Hazard. Mater. 2011, 186, 1837–1846. [Google Scholar] [CrossRef]
  26. GB 15618-2018; Soil Environmental Quality Risk Control Standard for Soil Contamination of Agricultural Land. China Environment Publishing Group: Beijing, China, 2018.
  27. Liu, P.F.; Wu, Z.Q. Pollution assessment and source analysis of heavy metals in acidic farmland of the karst region in southern China—A case study of Quanzhou County. Appl. Geochem. 2020, 123, 104764. [Google Scholar] [CrossRef]
  28. Hu, Z.X.; Wu, Z.Y. Spatial distribution, risk assessment, and source apportionment of soil heavy metals in a karst county based on grid survey. Sci. Total Environ. 2024, 953, 176049. [Google Scholar] [CrossRef]
  29. Chen, L.Y.; Ren, B.Z. Black shale bedrock control of soil heavy metal typical high geological background in China Loushao Basin: Pollution characteristics, source and Influence assessment based on spatial analysis. J. Hazard. Mater. 2024, 477, 135072. [Google Scholar] [CrossRef] [PubMed]
  30. Yang, C.Y.; Zhang, Y. Trace element geochemistry of pyrite from the Jinzhuzhou gold deposit in the Dayaoshan district, Qin-Hang Metallogenic Belt (South China): Implications for the metallogenesis. Geol. Bull. China 2024, 3, 1–23. [Google Scholar]
  31. Feng, Q.W.; Wang, B. Pollution Characteristics and Source Analysis of Heavy Metals in Soils of Typical Lead-zinc Mining Areas in Northwest Guizhou, China. Bull. Mineral. Petrol. Geochem. 2020, 39, 863–870. [Google Scholar]
  32. Zhao, L.Y.; Kong, L.H. Pollution characteristics, source analysis and risk assessment of heavy metals in soil around a gold mine in Jiaodong Peninsula. Geol. China 2024, 51, 1485–1500. [Google Scholar]
  33. Zhang, J.Y.; Zhang, X. Assessment and Source Apportionment of Heavy Metal Pollution in Soil of a Gold Ore Slag Muck Historical Remains Point. Shandong Chem. Ind. 2024, 53, 218–222. [Google Scholar]
  34. Cheng, X.D.; Sun, J.W. Pollution and source apportionment of heavy metals in the farmland soils of the gold mining area in Tantou Basin, western Henan metallogenic belt. East China Geol. 2022, 43, 313–323. [Google Scholar]
  35. Lian, H.B.; Li, P.F. Analysis of the sources of soil heavy metal pollution and remediation proposals in Tongguan gold mining area of the Little Qinling Mountains. South China Agriculture. 2018, 12, 184–185. [Google Scholar]
  36. Long, H.Y.; Wang, W.S. Speciation analysis and pollution risk assessment of heavy metals in the soils surrounding mine area. J. Guangxi Univ. Nat. Sci. Ed. 2016, 41, 1676–1682. [Google Scholar]
  37. Cong, Y.; Chen, Y.L. Chemical Forms of Heavy Metals in Soils and Potential Hazards to Ecosystem in Beijing Farmlands. Soils 2009, 41, 37–41. [Google Scholar]
  38. Cao, Q.Y.; Huang, Z.H. Review on speciation analysis of heavy metals in polluted soils and its influencing factors. Ecol. Sci. 2017, 36, 222–232. [Google Scholar]
  39. Jiang, S.H.; Hu, G.R. Evaluation of heavy metal accumulation and ecological risk in Anxi Tieguanyin tea plantation soils. Earth Environ. 2016, 44, 359–369. [Google Scholar]
  40. Ma, X.L.; Zuo, H. Assessment of heavy metals contamination in sediments from three adjacent regions of the Yellow River using metal chemical fractions and multivariate analysis techniques. Chemosphere 2016, 144, 264–272. [Google Scholar] [CrossRef] [PubMed]
  41. Lin, C.Q.; Huang, H.B.; Lin, Y. Assessment of the Speciation and Pollution of Heavy Metals in Paddy Soils from the Jiulong River Basin. Environ. Sci. 2019, 40, 453–460. [Google Scholar]
  42. Yu, J.; Zhang, H.; Cai, Y.B. Distribution and ecological risk of heavy metals in water and sediments of a river polluted by gold mining. Environ. Pollut. Control 2015, 37, 1–9. [Google Scholar]
  43. Wang, J.; Han, Z.Y. Morphological distribution characteristics and ecological risk assessment of heavy metal in the green soil of industrial zone in Chengdu. Ecol. Environ. Sci. 2021, 30, 1923–1932. [Google Scholar]
  44. Ji, L.; Ma, K. Evaluation of Heavy Metal Distribution Characteristics and Ecological Risk of Soil at Vegetable-land for Hong Kong in Ningxia. Environ. Sci. 2024, 45, 1–17. [Google Scholar]
  45. Wei, C.M.; Zhang, Y.H. Speciation Analysis and Bioavailability Evaluation of Heav Metals in Soil of a Decommissioned Coking Plant in Jiangxi Province. J. Soil Sci. 2024, 55, 810–818. [Google Scholar]
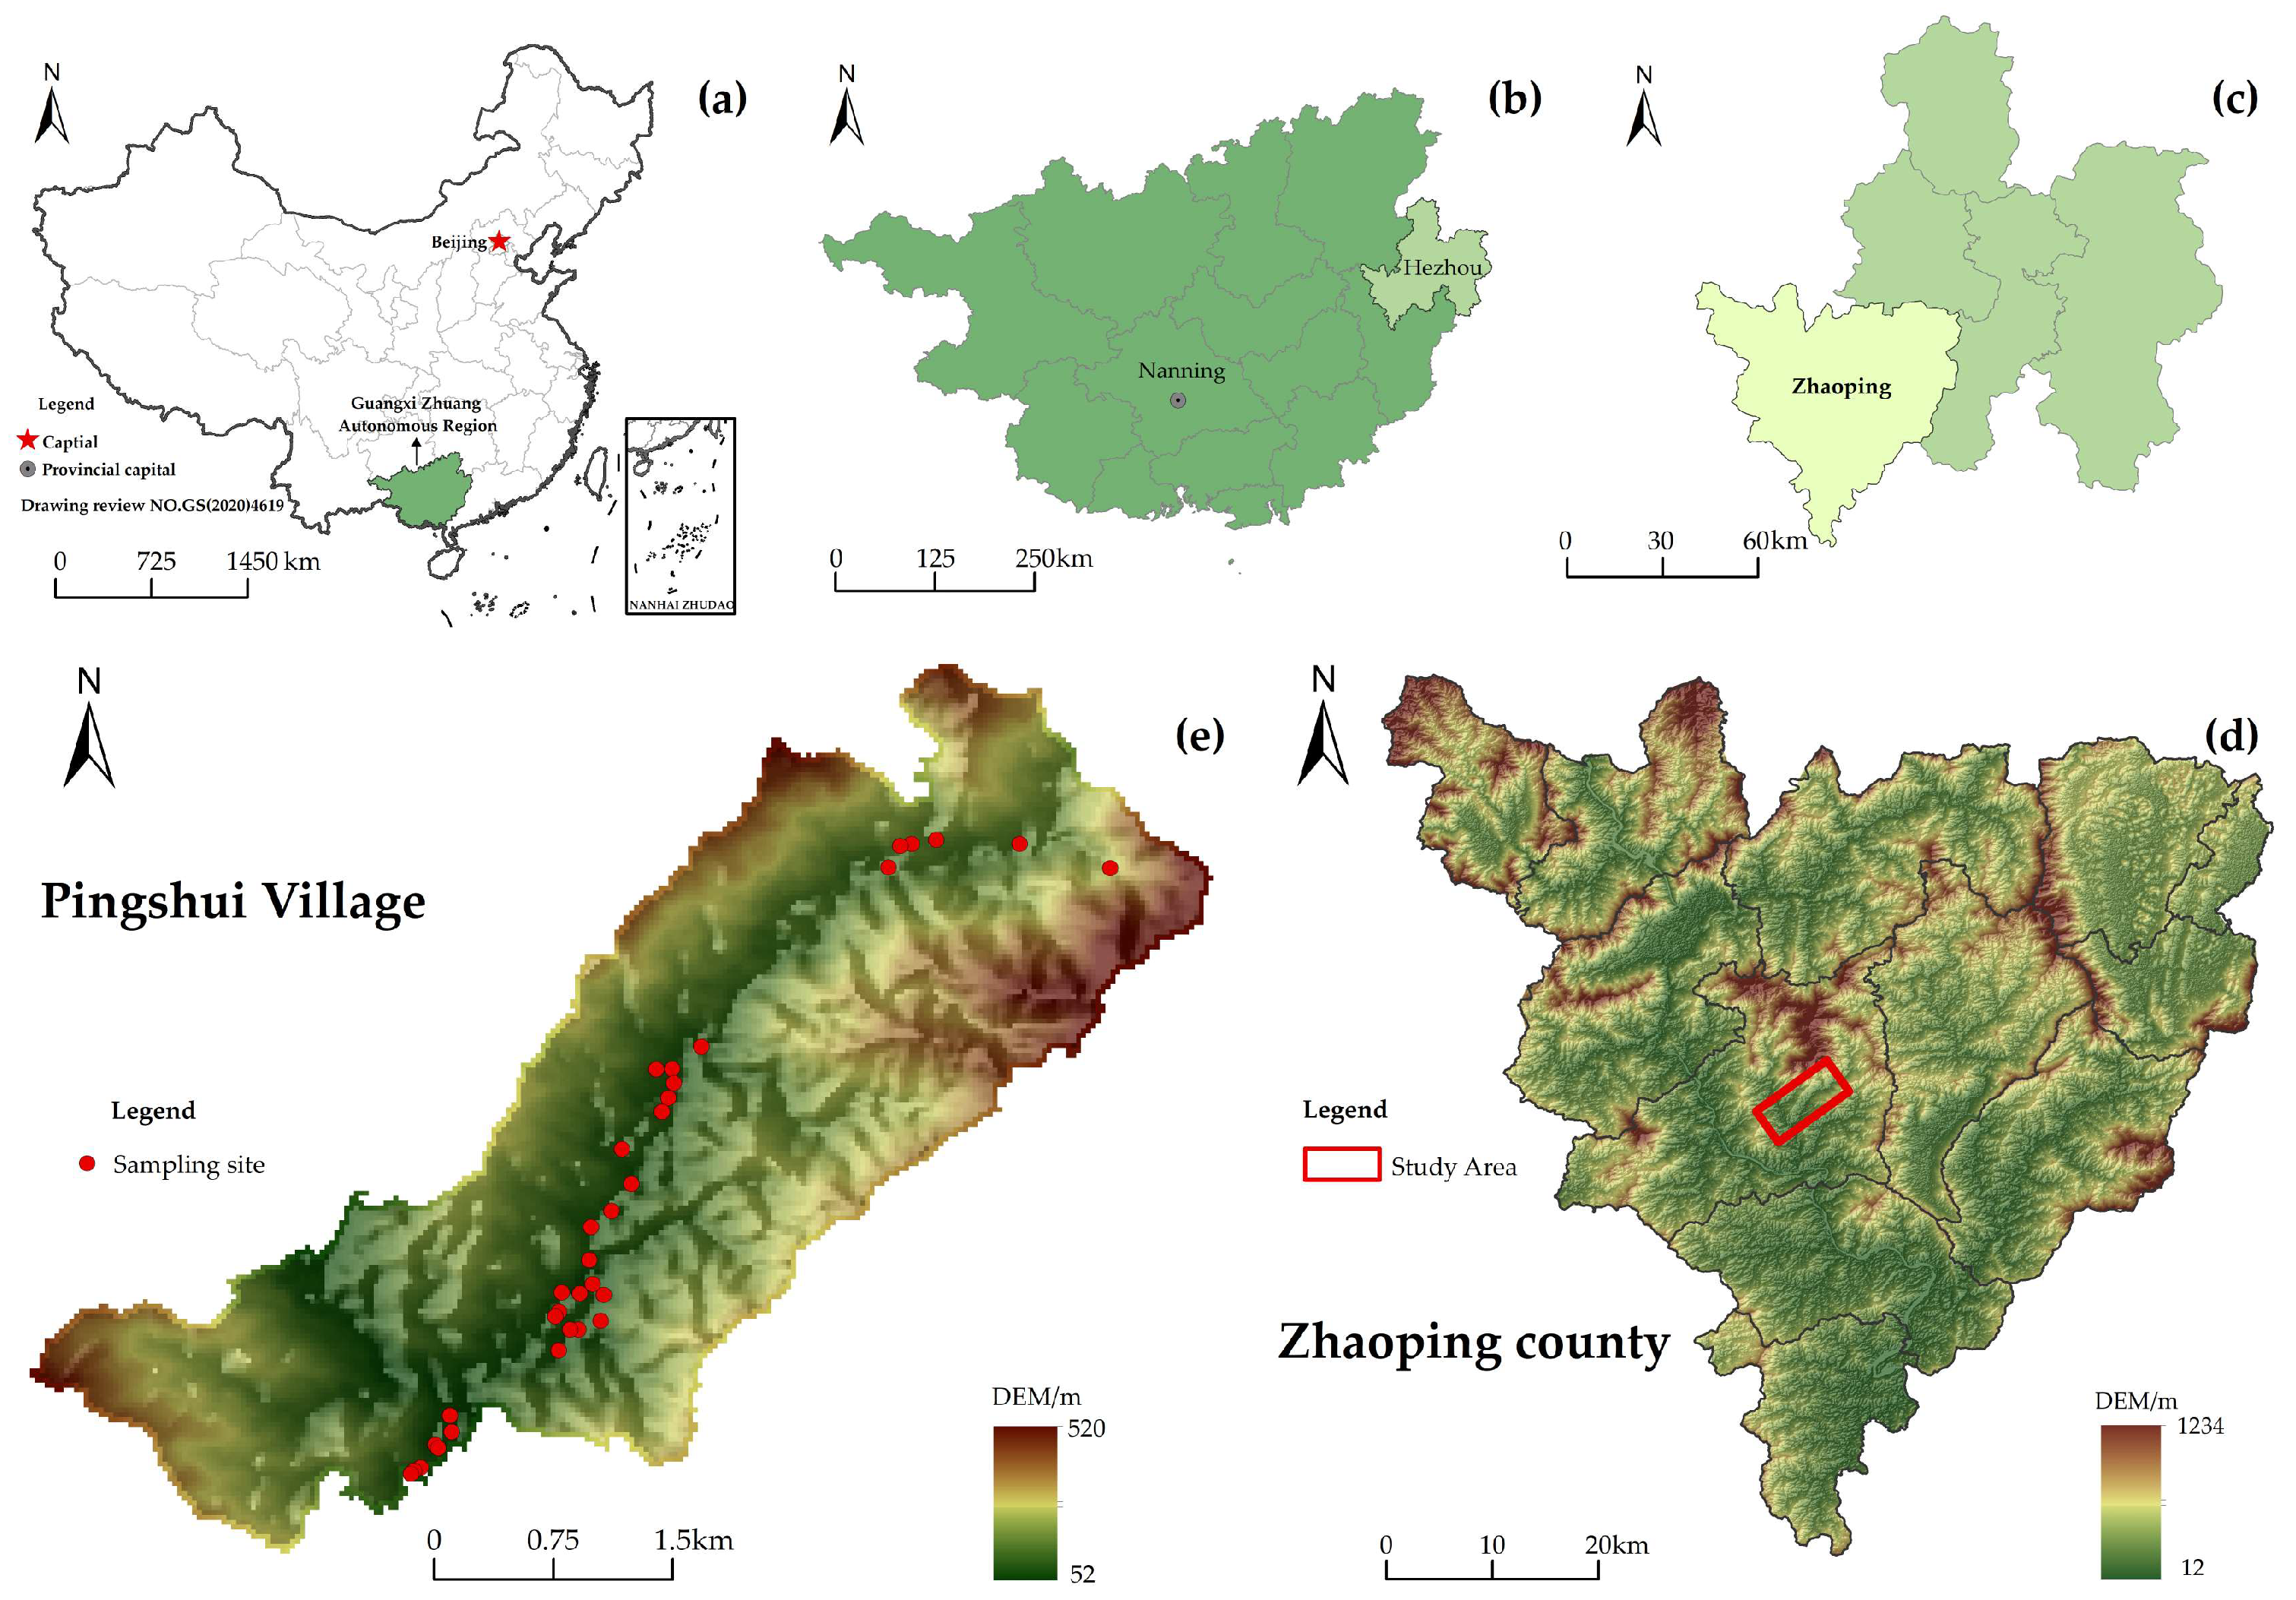
Figure 1. Location diagram of the study area in China and Guangxi (ad) and distribution of sampling points (e).
Applsci 14 11361 g001
Figure 2. Results of correlation analysis of soil’s heavy metal content in the study area.
Applsci 14 11361 g002
Figure 3. The percentage diagram of heavy metal soil speciation in the study area.
Applsci 14 11361 g003
Figure 4. The percentage diagram of different heavy metal speciation at each sampling points in the study area.
Applsci 14 11361 g004
Figure 5. Evaluation results of the geo-accumulation index method.
Applsci 14 11361 g005
Figure 6. Evaluation results of the potential ecological risk index method.
Applsci 14 11361 g006
Figure 7. Evaluation results of the risk assessment code method.
Applsci 14 11361 g007
Table 1. The experimental steps of improved BCR method.
StepSpeciationPretreatment
1mild acid-soluble fraction
(F1)
The soil sample was weighed at 1.00 g and transferred into a 250 mL polyethylene centrifuge tube with a lid. In total, 40 mL of 0.1 mol/L HAC solution was added to the sample, then shaken on a reciprocating shaker at 22 ± 5 °C and at a speed of 200 r/min for a duration of 16 h. Subsequently, the mixture was centrifuged at 3000× g for 20 min to extract the solution. The resulting solution was filtered through a 0.22 µm filter membrane and the supernatant was transferred into a 10 mL polyethylene tube. Then, 1 mL of concentrated HNO3 was introduced and stored in a refrigerator until analysis was conducted. Additionally, 20 mL of ultrapure water was added to the centrifuge tube, agitated for an additional period of 15 min, followed by another round of centrifugation for 20 min in order to discard the supernatant.
2reducible fraction
(F2)
In total, 40 mL of 0.5 mol/L NH2OH·HCl solution was added to the centrifuge tube and shaken for 16 h at 22 ± 5 °C and 200 r/min. The mixture was then centrifuged for 20 min, and the supernatant was transferred to a 10 mL polyethylene tube. A total of 1 mL of concentrated HNO3 was added, and it was stored in the refrigerator for testing. After shaking the centrifuge tube with 20 mL of ultrapure water for 15 min, it was centrifuged for another 20 min before discarding the supernatant.
3oxidizable fraction
(F3)
A total of 10 mL of 8.8 mol/L H2O2 solution (pH = 2.0) was slowly added into the centrifuge tube, covered with a lid and disintegrated at room temperature for 1 h, shaking manually every 10 min during the disintegration process. Then it was placed in an adjustable electrothermal thermostatic water bath (85 ± 2 °C) to disintegrate for 1 h, the lid was removed, and heating continued until the volume was less than 3 mL. The centrifuge tube was then removed, allowed to cool down, and another 10 mL of 8.8 mol/L H2O2 solution (pH = 2.0) was added, dissolved in the water bath for 1 h. The lid was again removed and heating continued until the volume was about 1 mL. After removing the centrifuge tube, 50 mL of 1 mol/L NH4AC solution (pH = 2.0) was added again, sealed and shaken for 16 h (22 ± 5 °C, 200 r/min), centrifuged for 20 min, and the extracted solution was filtered through 0.22 µm filter membrane, and then the supernatant was transferred to a 10 mL polyethylene tube, and added with 1 mL of concentrated HNO3, and then kept in refrigerator to wait for the measurement. Add 20 mL of ultrapure water to the centrifuge tube, shake for 15 min and centrifuge for 20 min, then discard the supernatant.
4residual fraction
(F4)
The centrifuge tube containing the solid residue was placed in a water bath at 60 °C until evaporation, and after constant weighing at 60 °C, it was transferred to a sample bag and preserved by grinding. A total of 0.1 g of the solid residue was taken and eliminated by HCl-HNO3-HF-HClO4 method and left to be measured.
5water-soluble fraction
(F5)
In total, 1.00 g of sample was weighed into a 100 mL capped polyethylene centrifuge tube, 20 mL of boiled and cooled ultrapure water pH = 7.0 was added, sealed and shaken for 16 h and then centrifuged for 30 min at a force of 4000 g. The extract was filtered through a 0.45 µm membrane, and the supernatant was pipetted into a 10 mL polyethylene tube and added with 1 mL of concentrated HNO3, stored under refrigeration and stored for measurement.
Table 2. Geo-accumulation index and the contamination level.
I geo Contamination Level
≤0Non-polluted
0 < I geo ≤ 1Slightly polluted
1 < I geo ≤ 2Moderately polluted
2 < I geo ≤ 3Moderately–highly polluted
3 < I geo ≤ 4Highly polluted
4 < I geo ≤ 5Highly–extremely polluted
>5Extremely polluted
Table 3. Classification standard of potential ecological risk of soil heavy metals.
E r   i Single Factor
Ecological Risk
Pollution Degree
RITotal Potential Ecological Risk
Degree
E r   i < 40SlightRI < 150Slight
40 ≤ E r   i < 80Mediate150 ≤ RI < 300Mediate
80 ≤ E r   i < 160High300 ≤ RI < 600High
160 ≤ E r   i < 320Very high600 ≤ RI < 1200Very high
E r   i < 320Extremely highRI > 1200Extremely high
Table 4. Evaluation criteria of risk assessment code method.
RAC<1%1–10%10–30%30–50%>50%
Evaluation criteriaNoneSlightModerateHighVery High
Table 5. Statistics of soil’s heavy metal content (mg/kg) and pH characteristic value.
ItemMaximumMinimumAverageCoefficient of
Variation (%)
Background Value of the Soil Environment in GuangxiScreening Value for Agricultural Land
Cr298.57132.29194.0520.3082.10150.00
Ni53.1028.8538.1414.5826.6060.00
Cu105.1239.8053.2924.9327.80150.00
Zn221.77108.58147.1119.8075.60200.00
As350.3339.75122.3563.5620.5040.00
Cd4.971.042.3749.820.270.30
Pb134.8547.2669.4025.4924.0070.00
Hg1.970.201.3332.670.151.30
pH5.163.424.028.23
Table 6. Factors matrix of soil heavy metals.
ItemPrincipal Components
PC1PC2PC3
Ni0.872−0.169−0.113
Pb0.8430.298−0.004
Zn0.8040.325−0.192
Cd0.691−0.4720.168
Cr0.664−0.4750.3620
Cu0.5770.272−0.285
As0.1030.797−0.019
Hg0.0790.4710.826
Eigenvalue3.3871.6020.972
Variance contribution rate (%)42.33520.01912.154
Cumulative variance
contribution rate (%)
42.33562.35474.509
Table 7. The evaluation results of the geo-accumulation index method of heavy metals in the study area.
ItemCrNiCuZnAsCdPbHg
Minimum0.10−0.47−0.07−0.060.371.360.39−0.17
Maximum1.280.411.330.973.513.621.913.13
Average0.63−0.080.320.351.742.380.912.46
Standard
deviation
0.280.200.300.280.850.700.320.65
contamination
degree
SlightNoneSlighSlightModerateModerate
–High
SlightModerate
–High
Table 8. The evaluation results of the potential ecological risk index method of heavy metals in the study area.
ItemEriRI
CrNiCuZnAsCdPbHg
Minimum3.225.427.161.4419.3115.659.8553.33344.42
Maximum7.279.9818.912.93170.89552.3128.01524.211109.18
Average4.737.179.581.9559.68263.1814.46355.94716.69
Hazard degreeSlightSlightSlightSlightMediateVery highSlightExtremely highVery high
Table 9. The evaluation results of the risk assessment code method of heavy metals in the study area.
ItemCrNiCuZnAsCdPbHg
Minimum0.02%0.22%0.69%4.14%0.06%0.06%0.34%0.00%
Maximum0.24%3.09%6.11%21.95%3.74%28.75%3.76%5.71%
Average0.15%1.64%2.84%10.46%0.85%6.08%1.49%0.32%
contamination degreeNoneSlightSlightMediateNoneSlightSlightNone
Disclaimer/Publisher’s Note: The statements, opinions and data contained in all publications are solely those of the individual author(s) and contributor(s) and not of MDPI and/or the editor(s). MDPI and/or the editor(s) disclaim responsibility for any injury to people or property resulting from any ideas, methods, instructions or products referred to in the content.