Article

Enhanced Biomechanical Risk Assessment in Manual Lifting: Comparing Inertial Measurement Units with Optoelectronic Systems for Composite Lifting Index Calculation

1
Department of Occupational and Environmental Medicine, Epidemiology and Hygiene, INAIL, Via Fontana Candida 1, Monte Porzio Catone, 00078 Rome, Italy
2
Department of Electronic, Information and Bioengineering, Politecnico di Milano, Via Ponzio 34/5, 20133 Milan, Italy
*
Author to whom correspondence should be addressed.
These authors contributed equally to this work.
Appl. Sci. 2024, 14(23), 11292; https://doi.org/10.3390/app142311292
Submission received: 5 November 2024 / Revised: 29 November 2024 / Accepted: 2 December 2024 / Published: 4 December 2024

Abstract

:
This study aims to improve the assessment of biomechanical risk in manual lifting tasks by introducing a method for calculating composite lifting index (CLI) using wearable inertial measurement units (IMUs). While the revised NIOSH lifting equation (RNLE) is widely used to evaluate the risk associated with lifting tasks, traditional methods often struggle with accuracy, especially in complex tasks. To address this, we compared the CLI values obtained using IMUs with those derived from a gold standard optoelectronic system during laboratory tests involving three levels of lifting risk. Ten participants performed standardized lifting tasks under controlled conditions, and the results showed that the IMU-based method provided comparable accuracy to the optoelectronic system, with negligible differences. Despite some variability in horizontal multiplier (HM) values, the IMU system demonstrated potential for real-world applications due to its ease of use and automatic calculation capabilities. Future improvements may include refining distance measurements and expanding the method for more complex lifting scenarios. This novel approach offers a practical and precise tool for ergonomic risk assessments, particularly in dynamic work environments.

1. Introduction

Musculoskeletal disorders represent a significant global issue, affecting over 1.71 billion people according to the World Health Organization (WHO). Among these, a substantial portion is attributable to work-related factors, with more than 50% of workers reporting suffering from work-related lower back disorders (WLBDs). This situation highlights the urgent need for effective strategies to assess and mitigate the risks associated with these conditions.
The revised NIOSH lifting equation (RNLE), which is integrated into the international standard ISO 11228-1 [1], serves as a widely adopted tool for assessing the biomechanical risks associated with lifting tasks. This method aims to reduce the incidence of WLBDs and evaluate the efficacy of ergonomic interventions [2,3,4]. The RNLE allows for the calculation of the recommended weight limit (RWL) and the lifting index (LI), which serves as a reliable indicator of WLBD risk. The lifting index is derived by dividing the actual load lifted (L) by the RWL [5,6], and ideally, lifting tasks are designed to maintain LI values below one, indicating a low risk.
The RNLE’s user-friendly nature contributes to its popularity among ergonomists and health and safety technicians, as the necessary task variables for RNLE calculations can typically be gathered using basic tools such as a weight scale, tape measure, goniometer, and timer [4]. However, despite its widespread application, critiques within the scientific literature have raised concerns regarding the accuracy and precision of measuring the operational variables required for RNLE application. These measurements can be influenced by various factors, including task complexity, task duration, and the level of training provided to users. Such elements can compromise the users’ ability to accurately measure the necessary variables [4,6,7,8].
Fortunately, advancements in industry 4.0 present new opportunities to address these challenges [9]. Wearable sensor networks and algorithm-based estimation engines are proving to be promising tools for biomechanical risk assessment [10,11]. These technologies facilitate both quantitative and direct instrumental evaluations [10,12,13,14] and a rating of standard methods [15,16,17]. In particular, leveraging technologies such as inertial measurement units (IMUs) and sensorized insoles or shoes, alongside automated algorithm design, can significantly enhance the measurement of RNLE variables—such as distances, displacements, angles, frequencies, and forces exchanged with the environment—during the execution of heavy lifting activities. This approach enables the calculation of an LI characterized by improved accuracy and precision, capturing real-time variations in the performance of lifting tasks.
On the other hand, while it has been demonstrated that real-time biomechanical risk assessments based on wearable sensor networks and adaptive algorithms are particularly effective in extremely simple lifting activities [18], their ability to estimate risks in more complex tasks has yet to be adequately explored. Therefore, it remains crucial to continue investigating and developing these technologies to ensure a comprehensive and precise approach to managing ergonomic risks in the workplace.
To verify this, the present study aims to elucidate the fundamental concepts and methodological principles underlying composite lifting index (CLI) calculation and to estimate the CLI estimation error using IMU networks. A composite lifting task consists of at least two liftings with different geometries but with equal load [2]; it represents a more flexible action than the mono-task index, which limits the analysis to only one geometry of motion. The CLI has been used as the base for the creation of a new ‘variable lifting index’ [19,20] capable of monitoring more complex tasks. CLI has also been used as a risk predictor for lower back pain [21].
Although the LI was meant to be calculated by hand-taken measurements, this is not feasible, since it does not consider the actual motion carried out by the subjects, which could deviate from the theoretical one. This is why in this study we aimed to compare the values estimated with IMUs with those obtained by the gold standard approach in motion analysis, the optoelectronic system [17]. The IMU- and optoelectronic-based methods were tested in a laboratory setting in standardized tasks with 3 levels of CLI. It was hypothesized that the estimate made with IMU sensor networks provides comparable results with those obtained using the optoelectronic system [22].

2. Materials and Methods

This study was carried out under the aegis of the SOPHIA (Socio-Physical Interaction Skills for Cooperative Human–Robot Systems in Agile Production, http://www.project-sophia.eu, accessed on 4 November 2024) Project.

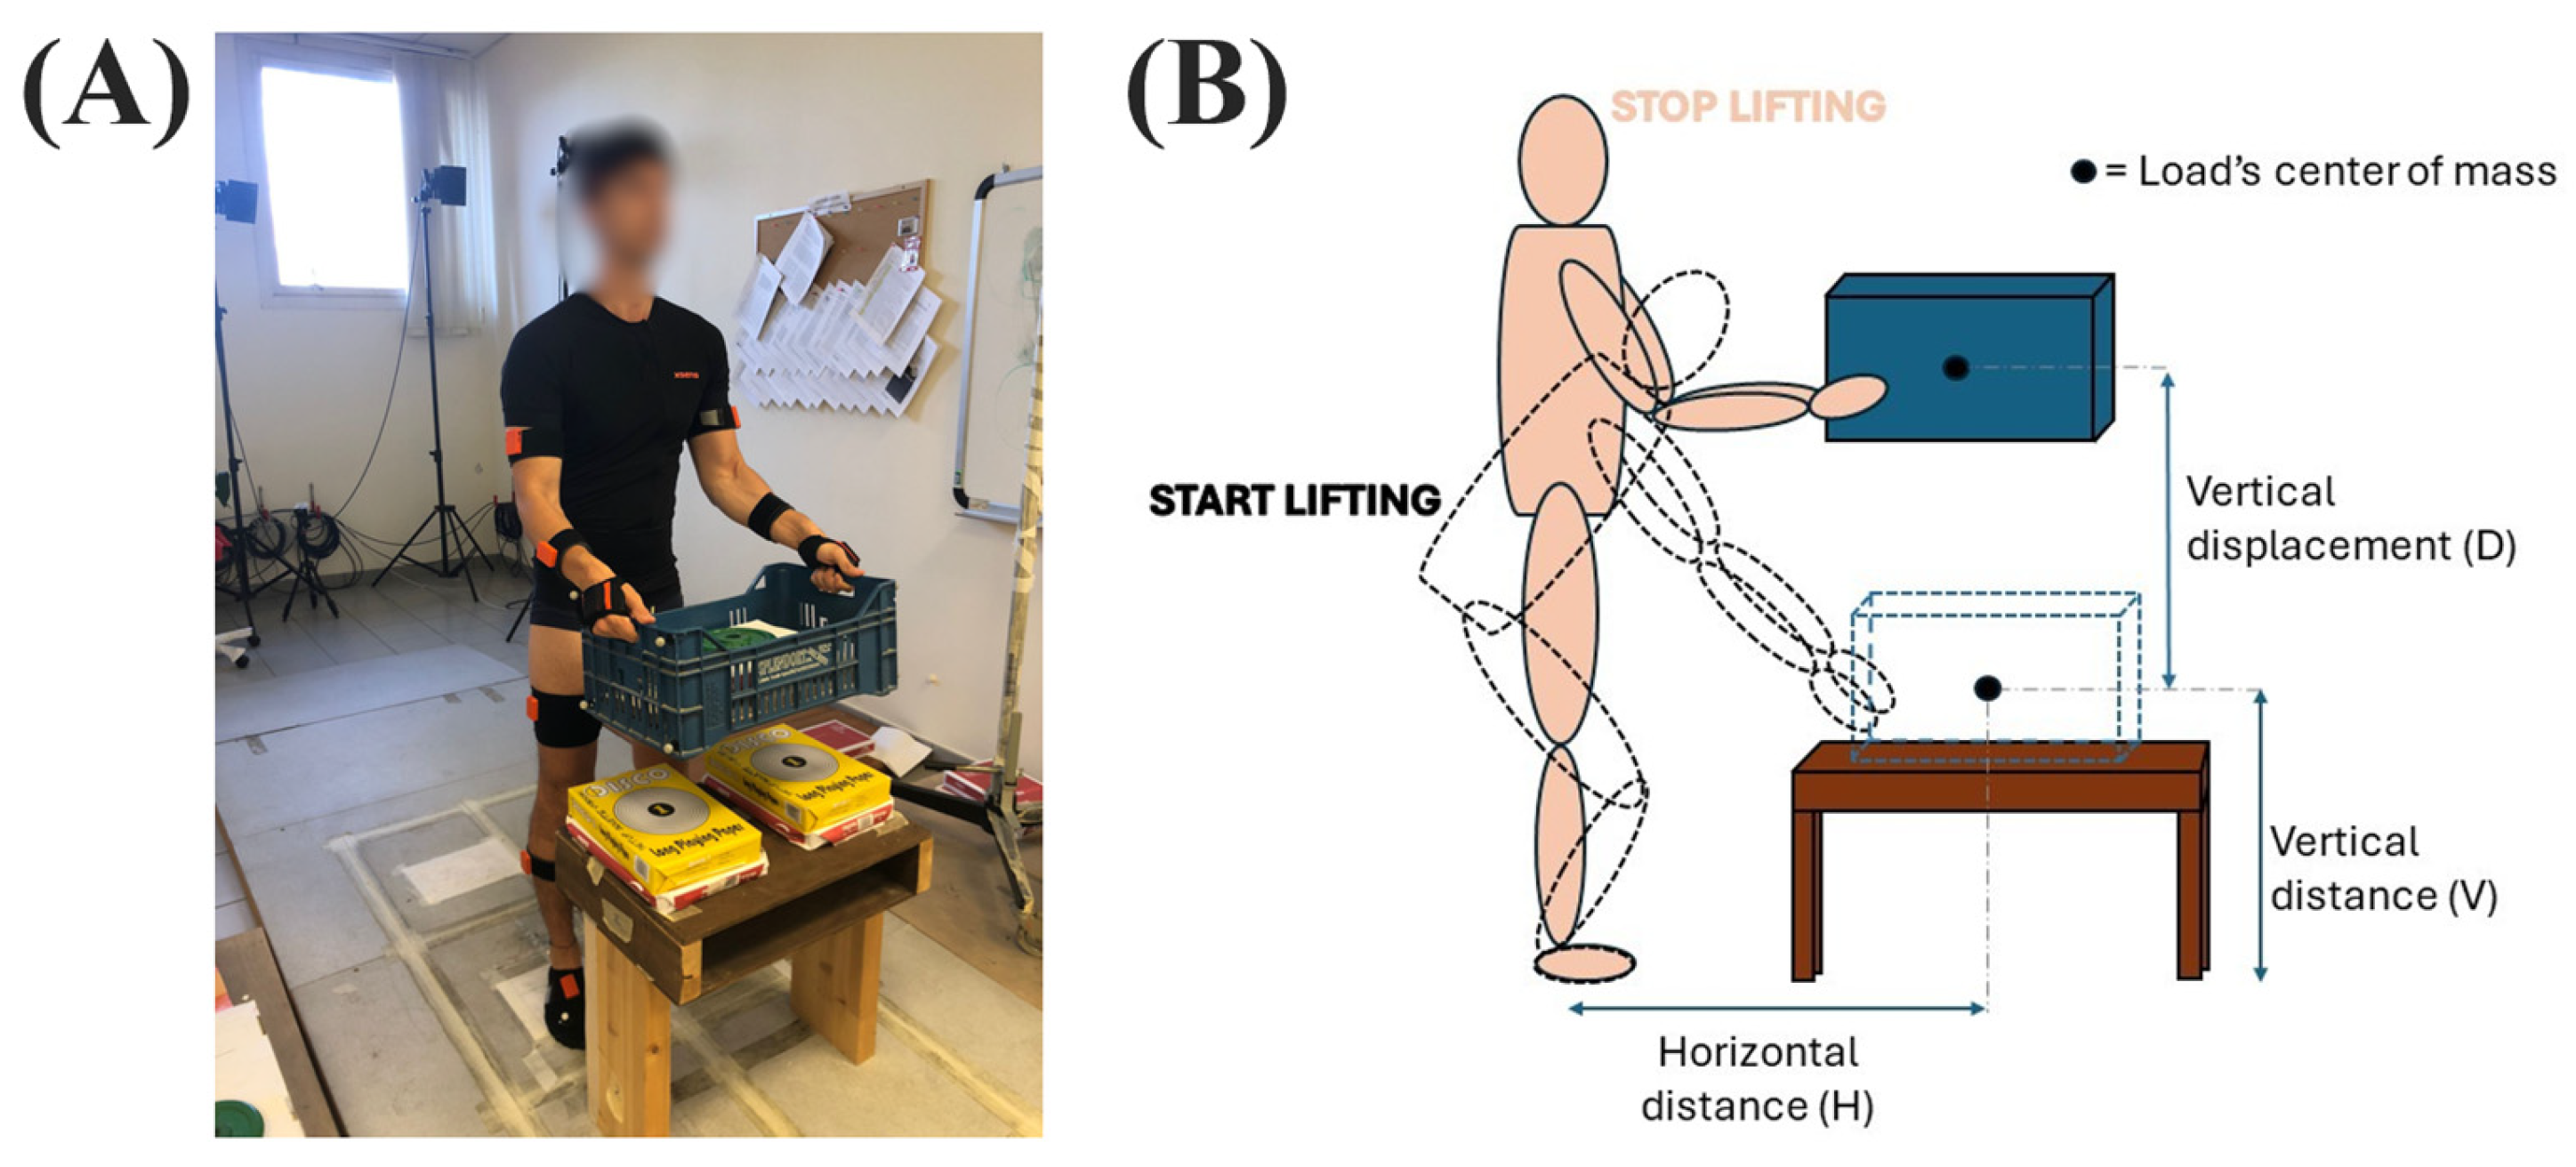
2.1. Data Recordings

Two systems for kinematic analysis were employed: the gold standard optoelectronic system (Opto) and an IMU system, specifically for predicting variables related to RNLE tasks. The optoelectronic system (SMART-DX 6000 System, BTS, Milan, Italy) comprises 10 infrared cameras that, acquiring data at a frequency of 340 Hz, track the movements of markers positioned on the subject’s body, and it was used to detect the motion of 6 spherical markers (15 mm in diameter) covered with reflective aluminum powder material placed bilaterally over the cutaneous projections of the spinous processes of the radial processes, the head of the third metacarpal bone, and the malleoli [23,24].
The Xsens MVN Link system (Xsens, Enschede, The Netherlands), which operates at a sampling rate of 60 Hz, was also used to record the whole-body kinematics of participants. The MVN motion analysis system includes a protocol for whole-body kinematic measurement, employing 17 IMUs positioned across various body segments [18]. These segments include the bilateral scapulae, upper arms, forearms, hands, thighs, shanks, and feet; one on the head; one on the sternum; and one on the pelvis (at the L5/S1 level). Xsens MVN whole-body Lycra suits in sizes ranging from M to XXL were utilized to ensure accurate sensor placement. Synchronization of the systems during the concurrent collection of data was achieved using a trigger signal generated by a synching device (BTS Trigger Box, BTS, Milan, Italy).

2.2. Experimental Procedure

Ten healthy participants (5F and 5M), with a mean age of 36.70 ± 7.09 years, a height of 1.69 ± 0.08 m, a weight of 70.35 ± 13.53 kg, and a body mass index (BMI) of 24.45 ± 3.30 kg/m2 were enrolled in the study. All participants were not taking part in any clinical medication trials and had no history of back pain, upper or lower limb or trunk surgery, neurological or orthopedic diseases, or problems with the vestibular system. Participants provided written informed consent for the study, which followed the Helsinki Declaration and was approved by the local ethics committee (Comitato Etico ‘LAZIO 2’, N.0078009/2021) after it received a thorough description of the experimental process. There was no mention of the expected results to prevent potential bias.
Before measurements started, the optoelectronic system was calibrated, obtaining a spatial accuracy of 0.2 mm in the x, y, and z dimensions. After marker and IMU placement, the MVN system was calibrated for each participant, using the ‘N-pose and walk’ technique before starting recordings. To record, MVN Analyse (version 2018.0. 0) was utilized. Furthermore, participants underwent a training session to become familiar with the assessment procedures. This allowed all subjects to perform the lifting tasks correctly.
The participants were asked to perform a manual material lifting task, on the sagittal plane without trunk rotation, of a plastic crate with handles, using both hands, according to the RNLE. A representative subject who performed the lifting task (Figure 1A) and a graphical representation of the task and experimental setup (Figure 1B) is depicted in Figure 1. After every lift, the load was repositioned at the starting point by two operators. Each lifting task was composed of two subtasks that had the same load but different geometry. For every minute of the experiment, the subject performed first all the liftings of a subtask and then the ones of the other, and the order of the subtasks was randomized. Table 1 shows, for each task, the reference values of the load weight (L), the horizontal (H) and vertical (V) locations, the vertical travel distance (D), the asymmetry angle (A), the lifting frequency (F), and the corresponding reference values of the multipliers. The hand-to-object coupling was defined as ‘good’ for all lifting tasks. The values of the single-task lifting index ( S T L I ) and frequency-independent lifting index ( F I L I ) are also reported [2]. The lifting tasks are designed to obtain reference CLI values of 0.5, 1.5 and 2.5. Each participant was required to perform all three tasks, each lasting 4 min, performing their subtask at the described frequencies. A metronome was utilized to trigger the lifting frequency: each time the acoustic signal was received, the participants raised the load to the set height. These acoustic signals administered to the subjects to impose the desired lifting frequency did not imply specific problems, as the imposed rhythms were not such as to induce execution errors. In detail, for example, during task 1, in each minute, the subjects lifted the load 3 times under the conditions of subtask A (F = 3, see Table 1) and 2 times under the conditions of subtask B. A rest period of 5 min was used between tasks. The lifting tasks and subtasks were assigned to each participant in a random order.

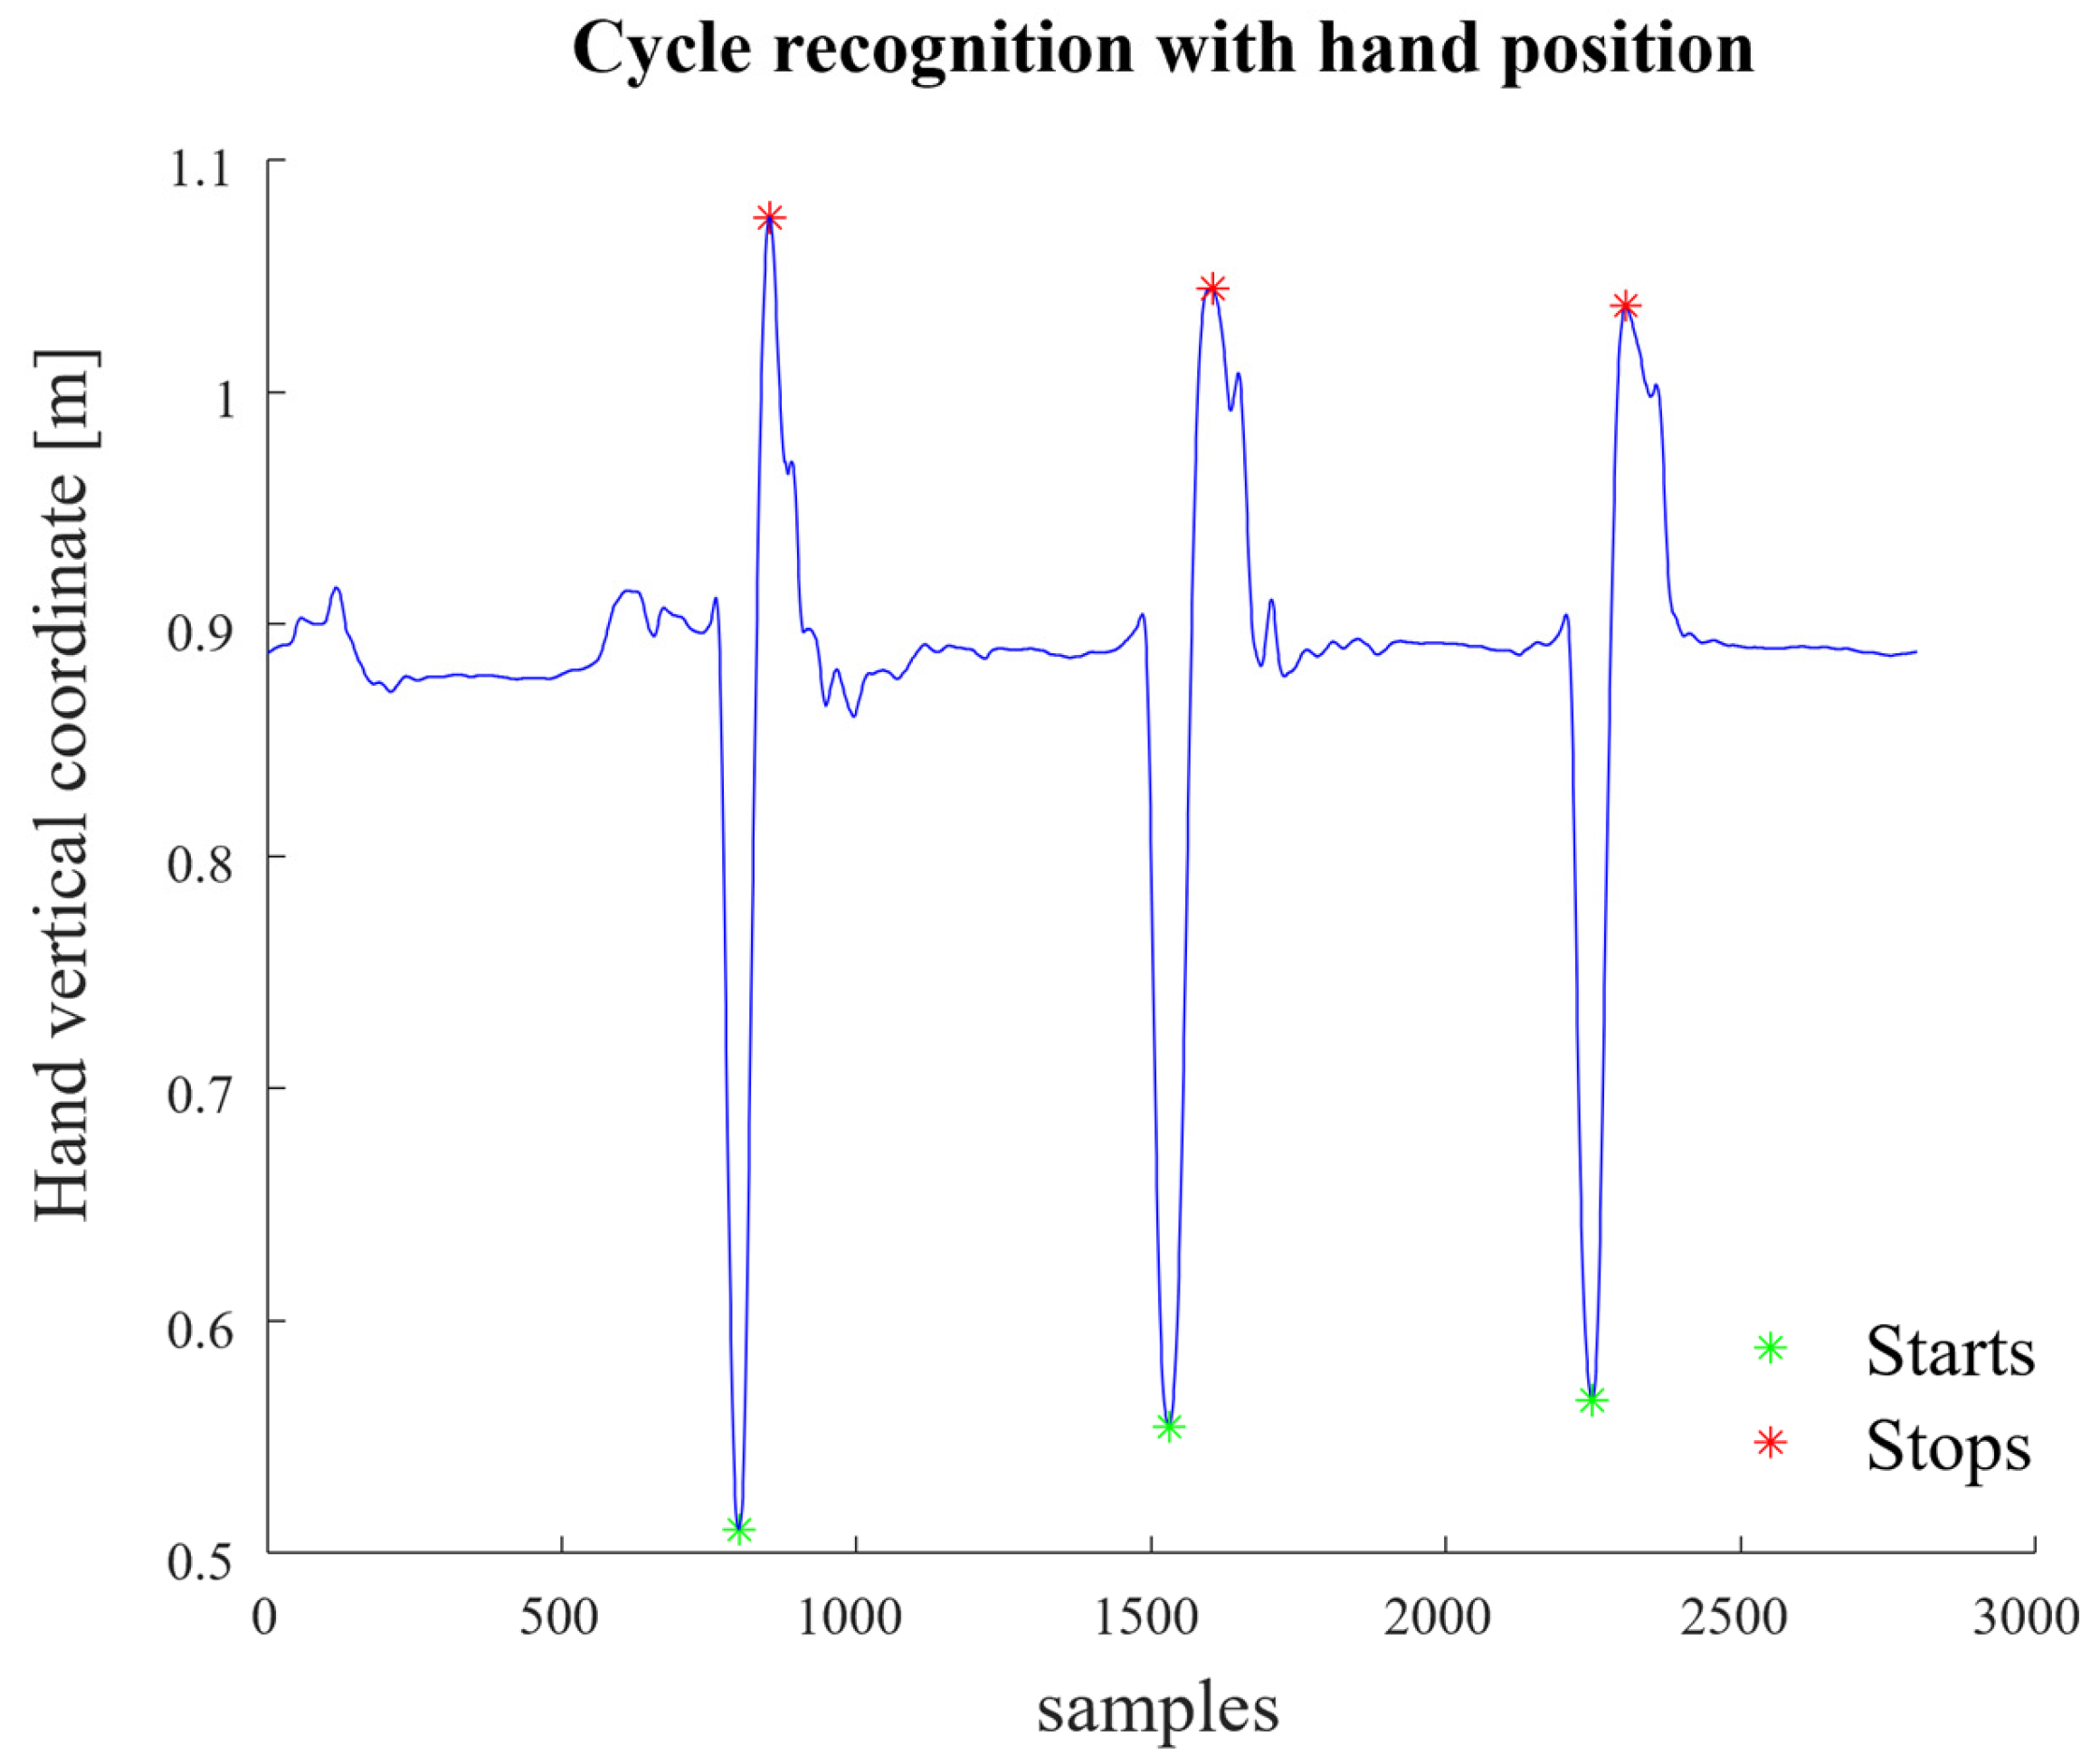
2.3. Composite Lifring Index Algorithm

Each lifting cycle was identified by determining a ‘start’ and a ‘stop’ instant. These time frames were identified using the vertical position of the hands: the ‘start’ and ‘stop’ instants correspond to the minimum and maximum values of the vertical coordinates, respectively, [18] as shown in Figure 2. Since the motion is symmetrical, the identification was carried out only in the right-hand position.
Once every cycle was identified, the multipliers of the RNLE for the computation of the F I L I of every cycle were calculated using the data about the position of the optoelectronic system’s markers and the IMUs.
F I L I ( n ) = L ( n ) L C · H M ( n ) · V M ( n ) · D M ( n ) · A M ( n ) · C M ( n )
where L(n) is the load value, manually inserted by the operator; LC is the load constant equal to 23, as requested by the RNLE [2]. The other multipliers were calculated as presented in [18]; therefore only a brief presentation is given here.
HM(n) is the horizontal multiplier calculated at the beginning of the nth lifting, using the following equation [2]:
H M n = 0.25 H n = 0.25 H a n d s m p n A n k l e m p n
H(n) represents the horizontal location (Figure 1B), measured in centimeters, at the beginning of the nth lifting cycle. It was calculated as the distance in the anterior–posterior direction between the midpoint of the left and right third knuckle ( H a n d s m p ( n ) ) and the midpoint between the ankles ( A n k l e m p ( n ) ). This parameter, as well as all the multipliers that needed kinematic data about the hands, we corrected using the XSens kinematic model to obtain the wrist position. In order to determine the precise location of the hands’ center, we employed a trigonometric method, which involved adding the distance between the wrist and the third metacarpal from the wrist position (measured for each considered subject) [18].
The vertical multiplier VM(n) was computed using the following equation [2]:
V M n = 1 0.3 · | 0.75 V n |
where V(n) is the vertical location (Figure 1B), measured in centimeters, of the nth lifting cycle, defined as the height of the hands (midpoint of the left and right third knuckle) from the floor at the beginning of the nth lifting.
The distance multiplier DM(n) was calculated using the following equation [2]:
D M n = 0.82 + 0.045 D n = 0.82 + 0.045 V s t o p n V s t a r t n
where D(n) is the vertical travel distance (Figure 1B), measured in centimeters, defined as the absolute value of the difference between the vertical height of the hands (midpoint of the left and right third knuckle) from the floor at the end of the nth lifting task and at the beginning.
In the present case, all the liftings took place completely in the sagittal plane; therefore, the asymmetry angle was always equal to 0, and AM(n) was equal to 1.
CM(n) is the coupling multiplier of the nth lifting task, indicating the quality of gripping and ranging between 0.9 and 1 [2]. In the present case, all the liftings took place with excellent subject–load coupling; therefore, CM(n) was always set as equal to 1.
A k-means clustering method was used to assign every cycle to a subtask automatically, and then the number of liftings assigned to each cluster defined the frequency of that subtask (F(k)). Subsequently, for every kth subtask, the S T L I was computed using the following equation [2]:
S T L I ( k ) = m e a n _ F I L I ( k ) F M ( k )
where mean_FILI(k) is the average of the values of the FILI of all the cycles assigned to the kth subtask in the entire duration of the acquisition, and FM(k) is the frequency multiplier of the kth subtask, calculated using a reference table presented in the RNLE documentation [2]. Then, for every task, the subtask with the highest STLI was automatically determined and the composite lifting index (CLI) of the task was automatically computed using this equation [2]:
C L I = S T L I s u b t a s k 1 + F I L I s u b t a s k 2 ( 1 F M t o t 1 F M s u b t a s k 2 )
where S T L I s u b t a s k 1 is the STLI of the subtask with the highest value, F I L I s u b t a s k 2 is the average value of FILI of the other subtask, F M t o t is the frequency multiplier of the sum of the frequencies of the two subtasks, and F M s u b t a s k 2 is the value of FM of the second subtask.

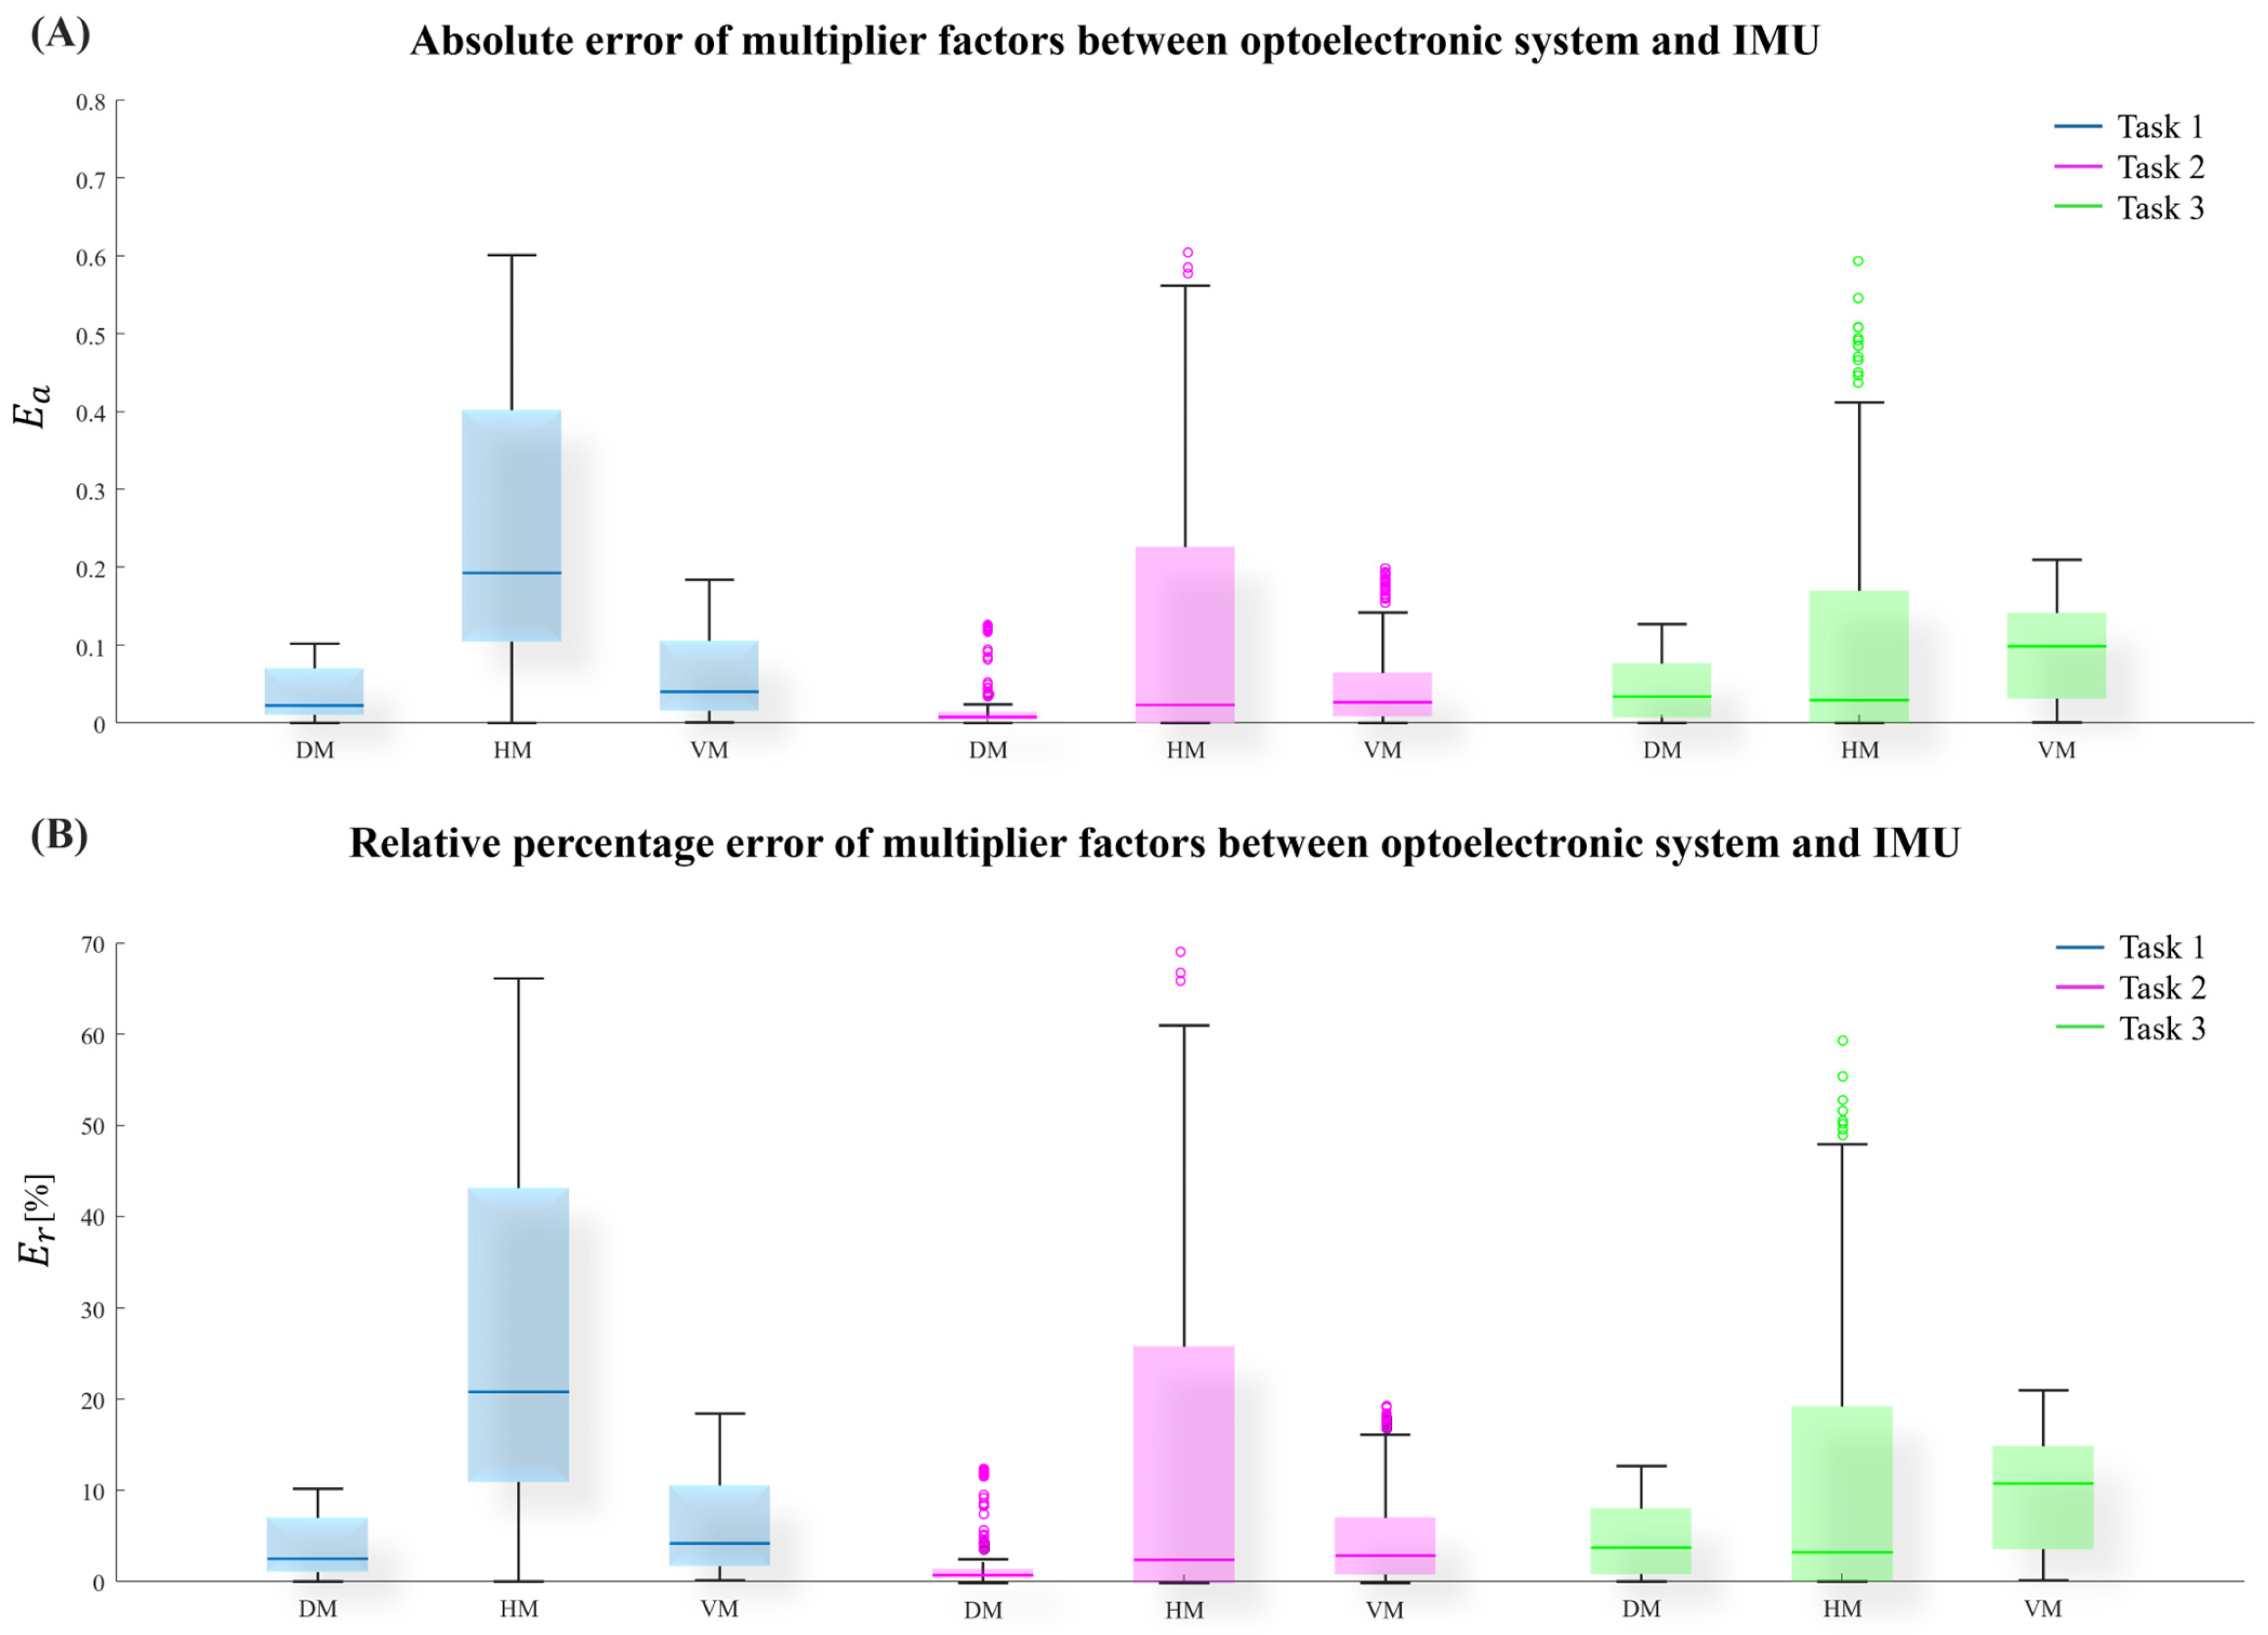
2.4. Errors of Measured Variables

The presented algorithm was applied to the data acquired by the optoelectronic and IMU systems. The resulting CLI from the optoelectronic system was considered the true value, even though they are still different from the theoretical reference values. This is because the theoretical reference values presented in Table 1 may not be the actual values of the executed lifting task, since the subject could mistakenly modify the geometrical variables. Therefore, to take a more rigorous approach to the validation of the new method, the values of the IMU system are compared to the optoelectronic ones, evaluating the absolute error (Ea) and the relative percentage error (Er) as follows:
E a = m u l t i p l i e r I M U m u l t i p l i e r O p t o  
E r = 100 × m u l t i p l i e r I M U m u l t i p l i e r O p t o m u l t i p l i e r O p t o   [ % ]

2.5. Statistical Analysis
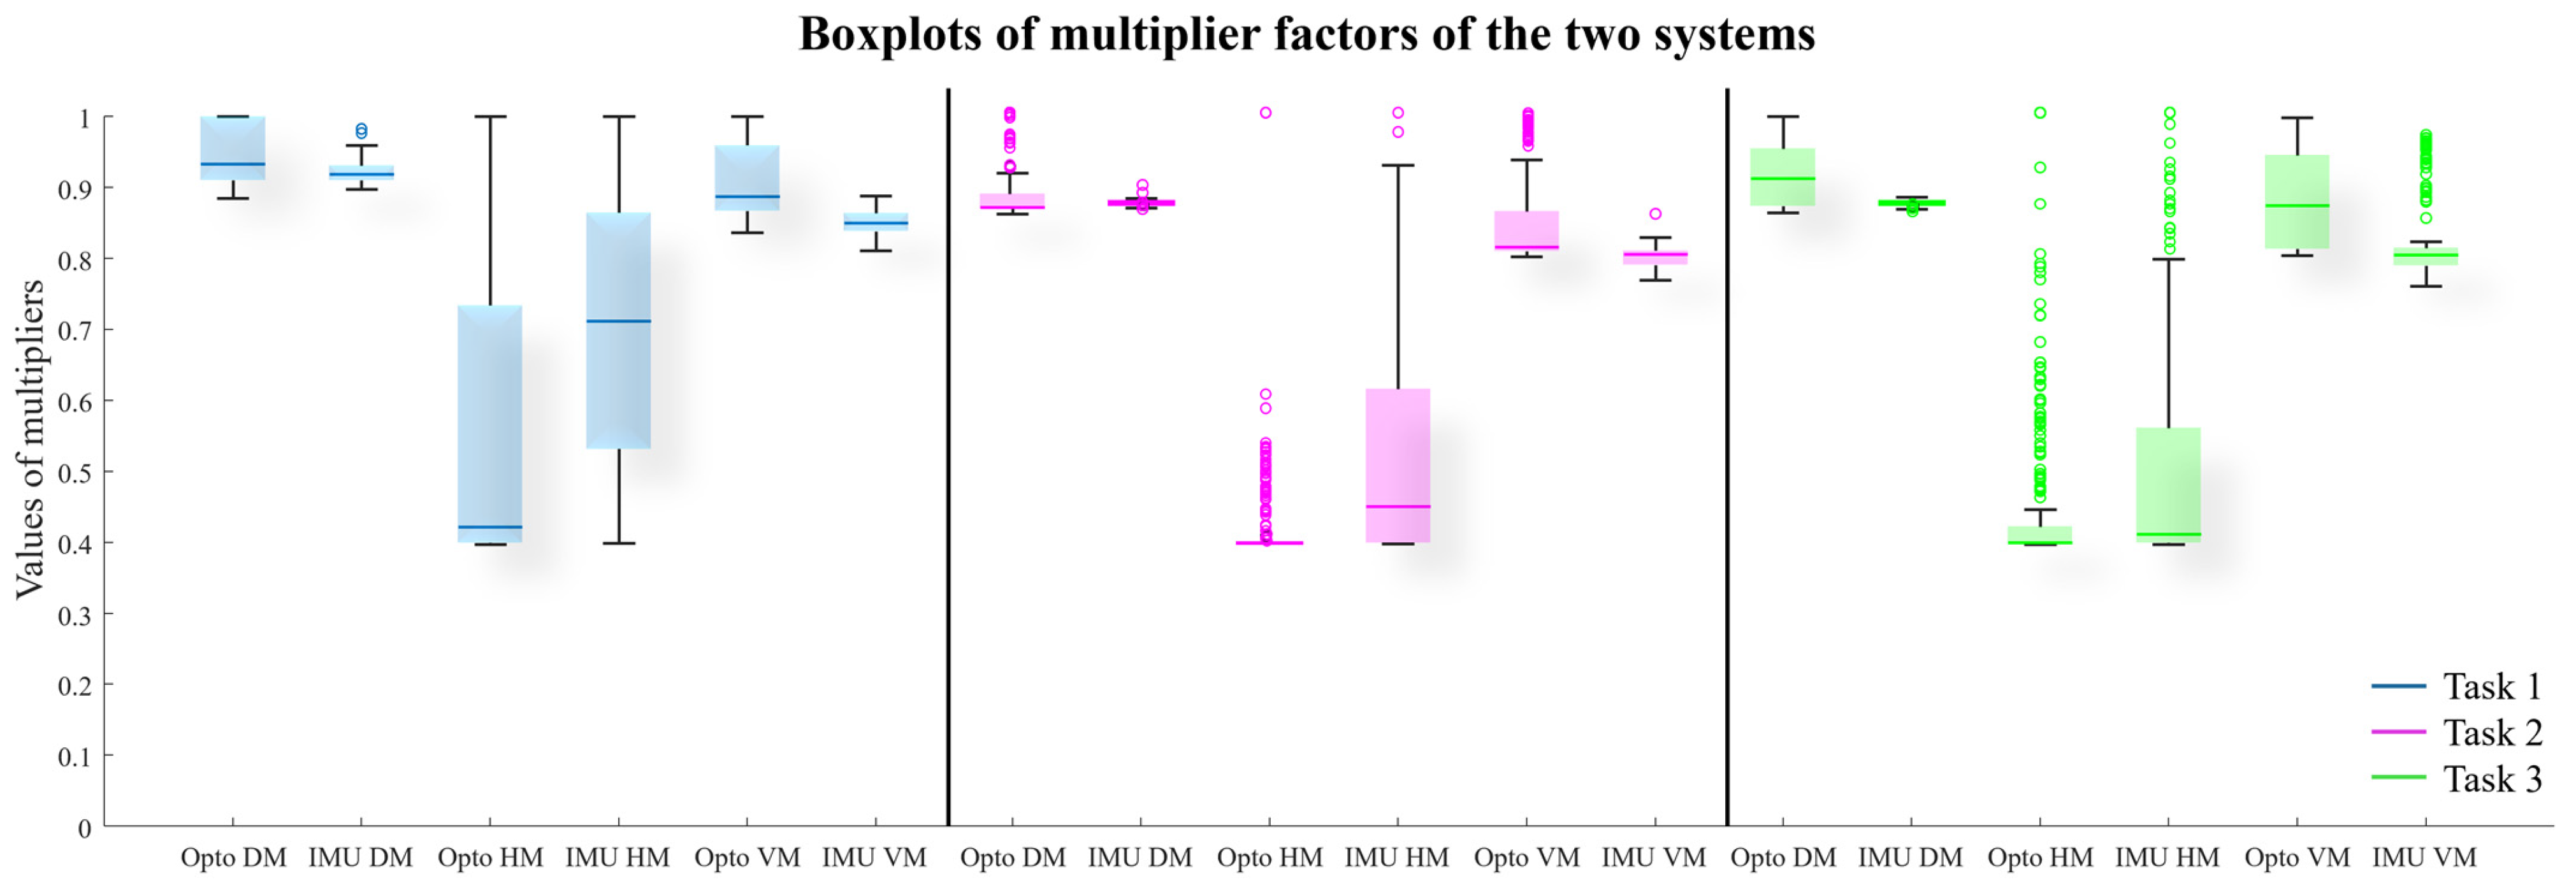
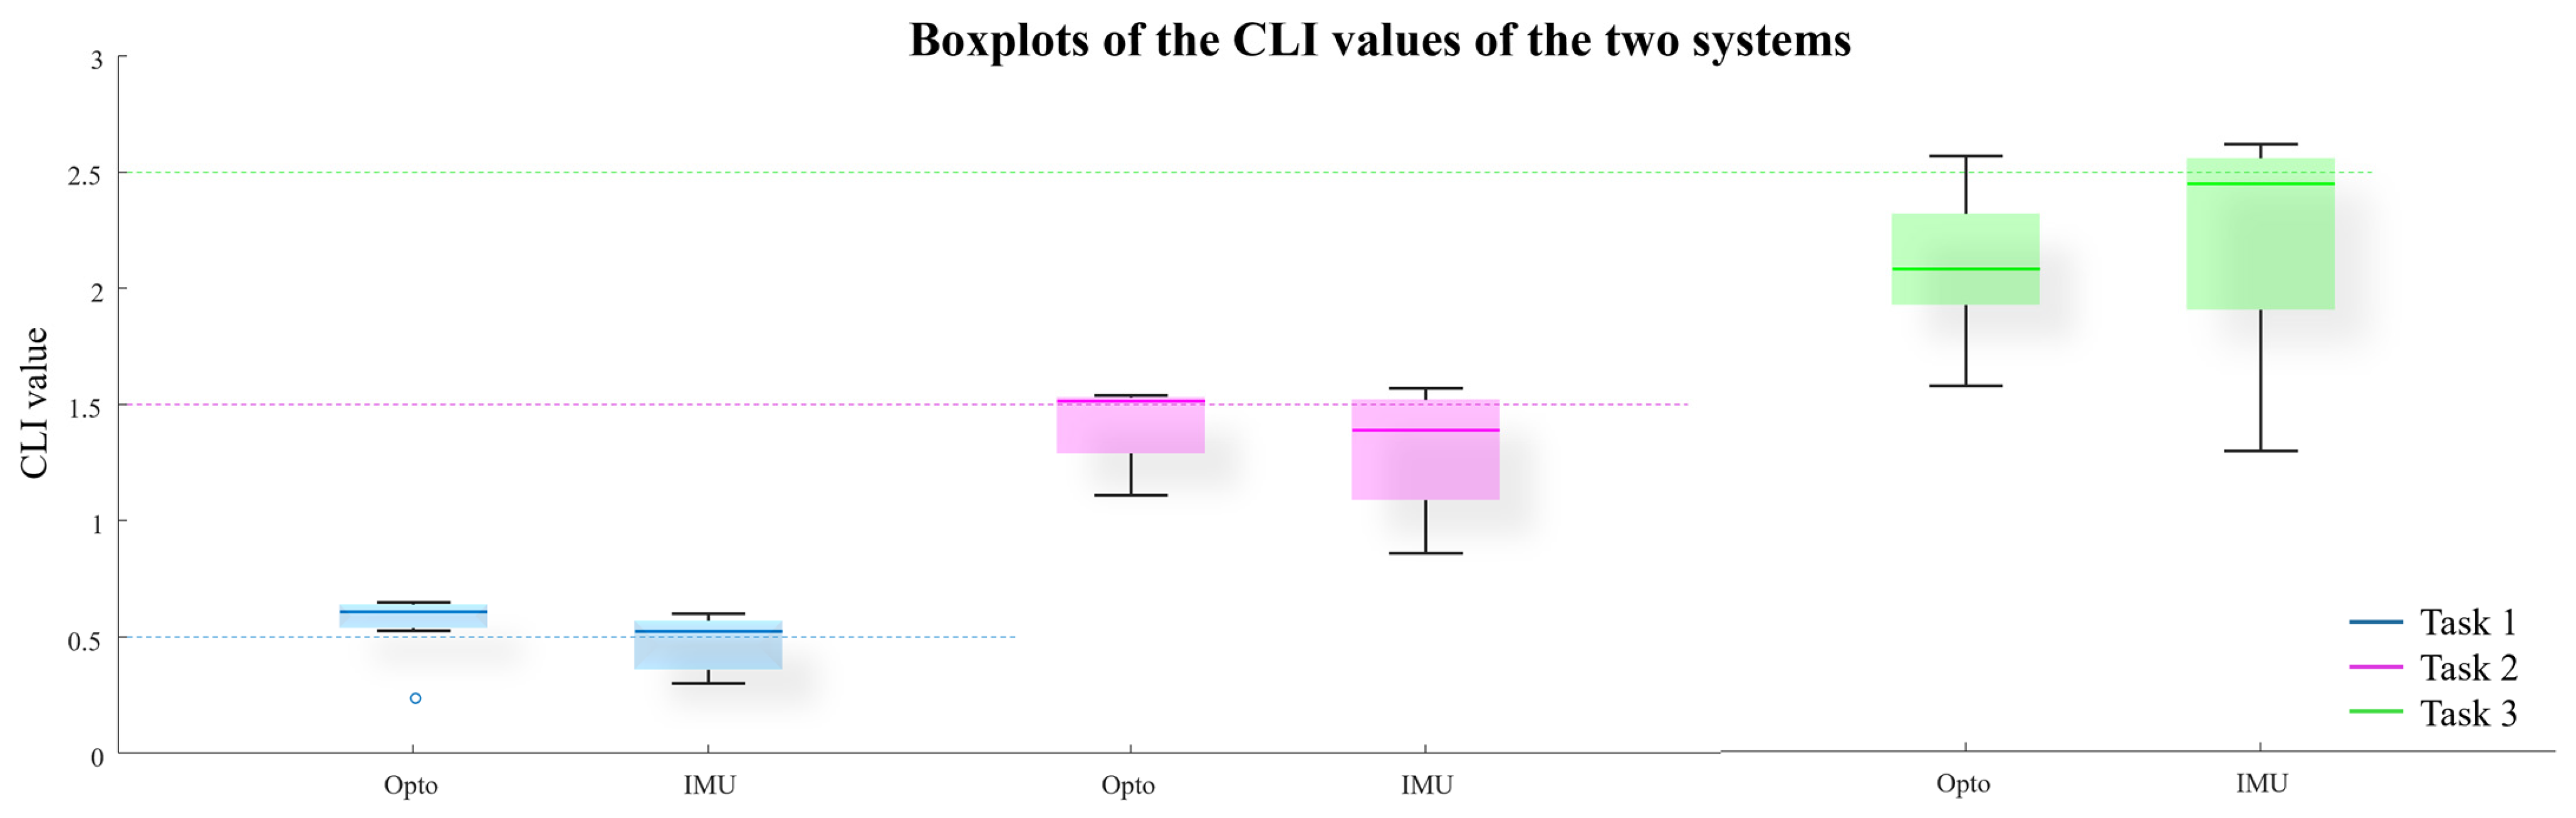
The statistical analysis was performed with SPSS 20.0 (IBM SPSS) software. The resulting CLI values and single multipliers were tested with a Kolmogorov–Smirnov test to check their distribution. A two-way repeated measure ANOVA (rANOVA) was performed to determine if there was any significant effect on the multipliers and CLI values among the three risk levels and between the two acquisition methods. A p-value of less than 0.05 was considered statistically significant.

3. Result

Figure 3 presents the boxplots showing the difference between the values of the DM, HM, and VM computed from the optoelectronic and the IMU systems for the three tasks. The other multipliers are not reported, since they were either fixed or perfectly equal between the two methods.
To further investigate the differences between the multipliers’ values from the two systems, Figure 4 depicts the boxplots of the E a and E r values of each multiplier computed by the optoelectronic and IMU systems for each task. For each task and multiplier (DM, HM, VM), the line in the box is the median value, the upper and lower limits of the box are the 25th and 75th percentiles, and the circles are outliers.
Figure 5 reports the resulting CLI values for the three tasks of the ten subjects calculated from the optoelectronic and IMU data as boxplots. In detail, the dotted lines refer to the theoretical values of the tasks, the line in the box is the median value, the upper and lower limits of the box are the 25th and 75th percentiles, and the circles are outliers. The repeated measures analysis of variance (rANOVA) did not show any statistically significant difference between the IMU and the optoelectronic system (F = 0.278 and p-value = 0.611).

4. Discussion

This study presents a novel method for computing the composite lifting index (CLI), which is part of NIOSH’s ergonomic index as outlined in ISO 11228-1 [1]. The innovative approach employs IMUs and is rigorously validated through a comparison with the gold standard in human motion analysis: the optoelectronic system. This validation encompasses three distinct lifting tasks, each representing different levels of risk. Importantly, this research serves as a continuation of a previous study that focused on the mono-task lifting index [18], with a specific emphasis on the more complex nature of the CLI [2].
The method introduced in this study facilitates a fully automated computation of the CLI, which is very important because a correct classification of the lifting task can be used to improve working conditions. As demonstrated by the statistical analysis, the discrepancies observed between the results obtained from the IMUs and those derived from the optoelectronic system are negligible. The application of IMUs for evaluating a composite lifting index, as opposed to merely a mono-task lifting index, positions this study as a novel contribution to the field when compared to other existing works [25,26]. Furthermore, a direct comparison of results with similar studies [27] is not feasible, as to the authors’ knowledge, there are no prior investigations specifically focused on assessing a composite-task lifting index.
An examination of the boxplots in Figure 5 reveals that both methods tend to underestimate the CLI values in relation to the theoretical ones. The only exception to this trend occurs with the optoelectronic system during task 1, where there is an overestimation of the theoretical CLI. This general underestimation may stem from the data acquisition methods employed or from subjects not executing the tasks according to the precise theoretical geometry. Even though participants received thorough instructions and engaged in a training session to familiarize themselves with the tasks, the dynamic nature of the lifting activities—characterized by a medium duration (4 min)—meant that subjects were not always perfectly accurate in their execution. Moreover, in Figure 5, the CLI values of the IMUs have bigger variability with respect to the optoelectronic ones. To investigate this distinction, Figure 3 reports the difference between the single multipliers of the two systems, and it can be seen how the DM and VM values are similar between the two methods, while the HM has a larger error mean and variability, affecting the accuracy of the estimated CLI obtained by IMUs. Moreover, from the boxplots in Figure 4, it can be seen how the IMU system tends to be more variable and has a higher number of outliers, especially in the HM. The error on the HM is due to IMUs’ technical limitations such as the fact that the distance values result from a double integration procedure starting from the accelerometer data and not from a direct measurement and that this value suffers from drifting effect [28,29,30]. In addition to that, the error in distance has a bigger effect on the HM because it has a shorter range of possible distance (25–63 cm) compared to DM (0–175 cm) and VM (25–175 cm). Still, all three can have values from 0 to 1; therefore, in HM, each centimeter has a bigger impact on the resulting values of the multiplier. The great variability of this multiplier could also be associated with the need to apply a trigonometric correction factor that bridges the distance between the wrists and the load. This correction factor depends on the overall characteristics of the task and therefore on the level of risk. To mitigate this critical aspect, it will be necessary to provide a complete kinematic model of the upper limb which originally includes the geometric information of the hands.
Despite the inaccuracies noted in the HM values, the IMU-based system is still capable of computing the CLI with a negligible difference from the optoelectronic system, as confirmed by repeated measure ANOVA (rANOVA). This finding suggests that the IMU system represents a more applicable solution for real-world workplace scenarios, where such technologies could be easily integrated.
The methodology presented herein focuses on tasks that consist of only two subtasks; however, it can be readily adapted for more complex lifting scenarios, thereby providing a flexible framework for assessing work tasks, provided that the load remains constant. The main limitations of this study include the fact that all tasks were executed in a controlled laboratory environment rather than in actual field conditions and the necessity for manual input of the load values. For this reason, it will be necessary in the future to design and execute further experimental sessions to analyze further combinations of lifting activities in different real-world scenarios. Future studies could aim to address these limitations by investigating the possibility of acquiring the geometrical variables using a markerless motion capture system. Indeed, although the sensors used are miniaturized (reduced size and weight) and wireless, it will be necessary to explore the possibility of using, at least for the kinematic component, new approaches that do not interfere with the natural motor strategy of workers during the execution of the manual material handling activities. Therefore, such a system would alleviate the need for sensor placement on workers, potentially enhancing both the accuracy and practicality of biomechanical assessments in workplace settings. Further developments of this study should also concern the exploration of options to reduce the dependence of the whole approach for CLI estimation on the load weight values which have been entered manually here. For this reason, instrumental assessment tools for biomechanical risk assessment must include countless wearable devices, insoles, and sensorized shoes for an accurate, precise, and automatic estimate of weight.

5. Conclusions

Although more studies are needed to generalize the results, the findings of this study suggest a very promising use of tools based on wearable sensor networks and automated algorithms for real-time biomechanical risk assessment not only, as already demonstrated, in extremely simple lifting tasks [18], but also in more complex tasks. In fact, the introduced method facilitates fully automatic composite lifting index (CLI) calculation. This ability to have real-time risk indices available could allow for the rapid administration of feedback stimuli such as auditory, visual, or vibrotactile stimuli to workers to alert them that they are exposing themselves to a high risk [31,32]. This approach also could be very useful in new industry 4.0 scenarios, where manual material handling tasks can be performed by hybrid human–robot teams: indices available in real time could allow robots to intervene when risk exposure is high.

Author Contributions

Conceptualization, F.M., T.V., G.C. and A.R.; methodology, F.M., T.V., G.C. and A.R.; software, F.M., T.V. and G.C.; validation, F.M., T.V. and G.C.; formal analysis, F.M., T.V. and G.C.; investigation, F.M., T.V. and G.C.; resources, T.V. and G.C.; data curation, F.M.; writing—original draft preparation, F.M., T.V., G.C., M.G. and A.R.; writing—review and editing, F.M., T.V., G.C., M.G. and A.R.; visualization, F.M., M.G. and A.R.; supervision, M.G. and A.R.; project administration, A.R. All authors have read and agreed to the published version of the manuscript.

Funding

The research presented in this article was carried out as part of the SOPHIA Project, which received funding from the European Union’s Horizon 2020 Research And Innovation Program under Grant Agreement No. 871237. This research was also funded by INAIL, Bando Ricerche in Collaborazione (BRiC) 2022 program, ID 57.

Institutional Review Board Statement

The study was conducted in accordance with the Declaration of Helsinki and approved by the Ethics Committee of ‘LAZIO 2’, N.0078009/24 February 2021.

Informed Consent Statement

Informed consent was obtained from all subjects involved in the study.

Data Availability Statement

Data are available in a publicly accessible repository that does not issue DOIs. Publicly available datasets were analyzed in this study. These data can be found here: https://humandatacorpus.org/lifting-and-carrying-iso-11228/, accessed on 10 October 2024.

Conflicts of Interest

The authors declare no conflicts of interest.

References

  1. UNI-ISO 11228-1:2022; Ergonomics-Manual Handling. International Organization for Standardization: Geneva, Switzerland, 2022. Available online: https://standards.iteh.ai/catalog/standards/sist/365f8b92-113b-493f-b06f- (accessed on 20 June 2024).
  2. Waters, T.R.; Putz-Anderson, V.; Garg, A. Application Manual for the Revised NIOSH Lifting Equation. Available online: https://www.cdc.gov/niosh/ergonomics/about/RNLE.html (accessed on 20 June 2024).
  3. Fox, R.R.; Lu, M.L.; Occhipinti, E.; Jaeger, M. Understanding outcome metrics of the revised NIOSH lifting equation. Appl. Ergon. 2019, 81, 102897. [Google Scholar] [CrossRef] [PubMed]
  4. Lu, M.L.; Putz-Anderson, V.; Garg, A.; Davis, K.G. Evaluation of the Impact of the Revised National Institute for Occupational Safety and Health Lifting Equation. Hum. Factors 2016, 58, 667–682. [Google Scholar] [CrossRef] [PubMed]
  5. Garg, A.; Boda, S.; Hegmann, K.T.; Moore, J.S.; Kapellusch, J.M.; Bhoyar, P.; Thiese, M.S.; Merryweather, A.; Deckow-Schaefer, G.; Bloswick, D.; et al. The NIOSH lifting equation and low-back pain, part 1: Association with low-back pain in the BackWorks prospective cohort study. Hum. Factors 2014, 56, 6–28. [Google Scholar] [CrossRef] [PubMed]
  6. Sesek, R.; Gilkey, D.; Drinkaus, P.; Bloswick, D.S.; Herron, R. Evaluation and quantification of manual materials handling risk factors. Int. J. Occup. Saf. Ergon. 2003, 9, 271–287. [Google Scholar] [CrossRef]
  7. Dempsey, P.G.; Burdorf, A.; Fathallah, F.A.; Sorock, G.S.; Hashemi, L. Influence of measurement accuracy on the application of the 1991 NIOSH equation. Appl. Ergon. 2001, 32, 91–99. [Google Scholar] [CrossRef]
  8. Waters, T.R.; Lu, M.L.; Occhipinti, E. New procedure for assessing sequential manual lifting jobs using the revised NIOSH lifting equation. Ergonomics 2007, 50, 1761–1770. [Google Scholar] [CrossRef]
  9. Ajoudani, A.; Albrecht, P.; Bianchi, M.; Cherubini, A.; Del Ferraro, S.; Fraisse, P.; Fritzsche, L.; Garabini, M.; Ranavolo, A.; Rosen, P.H.; et al. Smart Collaborative Systems for Enabling Flexible and Ergonomic Work Practices [Industry Activities]. IEEE Robot. Autom. Mag. 2020, 27, 169–176. [Google Scholar] [CrossRef]
  10. Ranavolo, A.; Draicchio, F.; Varrecchia, T.; Silvetti, A.; Iavicoli, S. Wearable monitoring devices for biomechanical risk assessment at work: Current status and future challenges—A systematic review. Int. J. Environ. Res. Public Health 2018, 15, 2001. [Google Scholar] [CrossRef]
  11. CWA17938; Guideline for Introducing and Implementing Real-Time Instrumental-Based Tools for Biomechanical Risk Assessment. CEN-CENELEC Management Centre: Brussels, Belgium, 2023.
  12. Chini, G.; Varrecchia, T.; Conforto, S.; De Nunzio, A.M.; Draicchio, F.; Falla, D.; Ranavolo, A. Trunk stability in fatiguing frequency-dependent lifting activities. Gait Posture 2023, 102, 72–79. [Google Scholar] [CrossRef]
  13. Ranavolo, A.; Varrecchia, T.; Rinaldi, M.; Silvetti, A.; Serrao, M.; Conforto, S.; Draicchio, F. Mechanical lifting energy consumption in work activities designed by means of the “revised NIOSH lifting equation. Ind. Health 2017, 55, 444–454. [Google Scholar] [CrossRef]
  14. Varrecchia, T.; De Marchis, C.; Draicchio, F.; Schmid, M.; Conforto, S.; Ranavolo, A. Lifting activity assessment using kinematic features and neural networks. Appl. Sci. 2020, 10, 1989. [Google Scholar] [CrossRef]
  15. Cherubini, A.; Navarro, B.; Passama, R.; Tarbouriech, S.; Elprama, S.A.; Jacobs, A.; Niehaus, S.; Wischniewski, S.; Tönis, S.J.; Siahaya, P.L.; et al. Interdisciplinary evaluation of a robot physically collaborating with workers. PLoS ONE 2023, 18, e0291410. [Google Scholar] [CrossRef] [PubMed]
  16. Vignais, N.; Miezal, M.; Bleser, G.; Mura, K.; Gorecky, D.; Marin, F. Innovative system for real-time ergonomic feedback in industrial manufacturing. Appl. Ergon. 2013, 44, 566–574. [Google Scholar] [CrossRef]
  17. Peppeloni, L.; Filippeschi, A.; Ruffaldi, E. Assessment of task ergonomics with an upper limb wearable device. In Proceedings of the Mediterranean Conference on Control and Automation, Palermo, Italy, 16–19 June 2014. [Google Scholar]
  18. Ranavolo, A.; Ajoudani, A.; Chini, G.; Lorenzini, M.; Varrecchia, T. Adaptive Lifting Index (aLI) for Real-Time Instrumental Biomechanical Risk Assessment: Concepts, Mathematics, and First Experimental Results. Sensors 2024, 24, 1474. [Google Scholar] [CrossRef]
  19. Waters, T.; Occhipinti, E.; Colombini, D.; Alvarez-Casado, E.; Fox, R. Variable Lifting Index (VLI). Hum. Factors 2016, 58, 695–711. [Google Scholar] [CrossRef]
  20. Waters, T.; Occhipinti, E.; Columbini, D.; Alvarez, E.; Hernandez, A. The Variable Lifting Index (VLI): A New Method for Evaluating Variable Lifting Tasks Using the Revised NIOSH Lifting Equation. In Proceedings of the 17th Triennial Congress of the International Ergonomics Association, Beijing, China, 9–14 August 2009. [Google Scholar]
  21. Lu, M.L.; Waters, T.R.; Krieg, E.; Werren, D. Efficacy of the revised NIOSH lifting equation to predict risk of low-back pain associated with manual lifting: A one-year prospective study. Hum. Factors 2014, 56, 73–85. [Google Scholar] [CrossRef]
  22. Di Marco, R.; Rossi, S.; Patanè, F. Cappa Technical quality assessment of an optoelectronic system for movement analysis. J. Phys. Conf. Ser. 2015, 588, 012030. [Google Scholar] [CrossRef]
  23. Davis, R.B. Reflections on Clinical Gait Analysis. J. Electromyogr. Kinesiol. 1997, 7, 251–257. [Google Scholar] [CrossRef]
  24. Rab, G.; Petuskey, K.; Bagley, A. A Method for Determination of Upper Extremity Kinematics. 2002. Available online: https://www.elsevier.com/locate/gaitpost (accessed on 20 June 2024).
  25. Donisi, L.; Cesarelli, G.; Coccia, A.; Panigazzi, M.; Capodaglio, E.M.; D’Addio, G. Work-related risk assessment according to the revised niosh lifting equation: A preliminary study using a wearable inertial sensor and machine learning. Sensors 2021, 21, 2593. [Google Scholar] [CrossRef]
  26. Lu, M.L.; Feng, S.; Hughes, G.; Barim, M.S.; Hayden, M.; Werren, D. Development of an algorithm for automatically assessing lifting risk factors using inertial measurement units. In Proceedings of the Human Factors and Ergonomics Society, Seattle, WA, USA, 8 October–1 November 2019; SAGE Publications Inc.: New York, NY, USA, 2019; pp. 1334–1338. [Google Scholar] [CrossRef]
  27. Gutierrez, M.; Gomez, B.; Retamal, G.; Peña, G.; Germany, E.; Ortega-Bastidas, P. Aqueveque Comparing Optical and Custom IoT Inertial Motion Capture Systems for Manual Material Handling Risk Assessment Using the NIOSH Lifting Index. Technologies 2024, 12, 180. [Google Scholar] [CrossRef]
  28. Pang, G.; Liu, H. Evaluation of a low-cost MEMS accelerometer for distance measurement. J. Intell. Robot. Syst. 2001, 30, 249–265. [Google Scholar] [CrossRef]
  29. Zandbergen, M.A.; Reenalda, J.; van Middelaar, R.P.; Ferla, R.I.; Buurke, J.H.; Veltink, P.H. Drift-Free 3D Orientation and Displacement Estimation for Quasi-Cyclical Movements Using One Inertial Measurement Unit: Application to Running. Sensors 2022, 22, 956. [Google Scholar] [CrossRef] [PubMed]
  30. Wittmann, F.; Lambercy, O.; Gassert, R. Magnetometer-Based Drift Correction During Rest in IMU Arm Motion Tracking. Sensors 2019, 19, 1312. [Google Scholar] [CrossRef]
  31. Lorenzini, M.; Gandarias, J.M.; Fortini, L.; Kim, W.; Ajoudani, A. ErgoTac-Belt: Anticipatory Vibrotactile Feedback to Lead Centre of Pressure during Walking. In Proceedings of the IEEE RAS and EMBS International Conference on Biomedical Robotics and Biomechatronics, Seoul, Republic of Korea, 21–24 August 2022; pp. 1–6. [Google Scholar]
  32. Aggravi, M.; Salvietti, G.; Prattichizzo, D. Haptic wrist guidance using vibrations for Human-Robot teams. In Proceedings of the 25th IEEE International Symposium on Robot and Human Interactive Communication (RO-MAN), New York, NY, USA, 26–31 August 2016; pp. 113–118. [Google Scholar]
Figure 1. A representative subject who performed the lifting task (A) and a graphical representation of the task and experimental setup (B).
Applsci 14 11292 g001
Figure 2. Start and stop events are identified using the vertical position of the hand.
Applsci 14 11292 g002
Figure 3. Boxplots of the values of the DM, HM, and VM multipliers of the three tasks for the two methods (optoelectronic and IMU systems). The line in the box is the median value, the upper and lower limits of the box are the 25th and 75th percentiles, and the circles are outliers.
Applsci 14 11292 g003
Figure 4. Boxplots of the absolute error (Ea in (A)) and the relative percentage error (Er in (B)) multipliers’ values by the two systems (optoelectronic and IMU systems) in the three tasks. The line in the box is the median value, the upper and lower limits of the box are the 25th and 75th percentiles, and the circles are outliers.
Applsci 14 11292 g004
Figure 5. Boxplots of the CLI values of the ten subjects on the three tasks from the two systems; the dotted lines refer to the theoretical values of the tasks. The line in the box is the median value, the upper and lower limits of the box are the 25th and 75th percentiles and the circles are outliers.
Applsci 14 11292 g005
Table 1. Lifting task parameters. For each task (1, 2, and 3): the reference values of the load weight (L), the horizontal (H) and vertical (V) locations, the vertical travel distance (D), the asymmetry angle (A), the lifting frequency (F), the hand-to-object object coupling (C), the corresponding reference values of the multipliers obtained from the revised NIOSH lifting equation, recommended weight limit (RWL), single task lifting index (STLI), and composite lifting index (CLI).
TaskSubtaskLC [kg]H [cm]HMV [cm]VMD [cm]DMA [°]AMF [Lift/Min]FMCCMLoad [kg]RWLFILISTILICLI
1A2344.50.56200.84500.910130.88Good148.640.400.460.50
B2344.50.56300.87400.930120.91Good149.480.380.42
2C2361.50.41100.81820.870140.84Good175.531.061.271.50
D23560.45100.81820.870130.88Good176.360.961.10
3E2361.50.41100.81820.870140.84Good1105.531.511.812.50
F2358.50.43100.81820.870140.84Good1105.811.441.72
Disclaimer/Publisher’s Note: The statements, opinions and data contained in all publications are solely those of the individual author(s) and contributor(s) and not of MDPI and/or the editor(s). MDPI and/or the editor(s) disclaim responsibility for any injury to people or property resulting from any ideas, methods, instructions or products referred to in the content.

