Article

Less Is More: Influence of Cross-Linking Agent Concentration on PFOS Adsorption in Chitosan

1
Division 4.3 Contaminant Transfer and Environmental Technologies, BAM Federal Institute for Materials Research and Testing, Unter den Eichen 87, 12205 Berlin, Germany
2
Division 1.1 Inorganic Trace Analysis, BAM Federal Institute for Materials Research and Testing, Richard-Willstätter-Straße 11, 12489 Berlin, Germany
3
Division 4.2 Material-Microbiome Interactions, BAM Federal Institute for Materials Research and Testing, Richard-Willstätter-Straße 11, 12489 Berlin, Germany
*
Author to whom correspondence should be addressed.
Appl. Sci. 2024, 14(23), 11145; https://doi.org/10.3390/app142311145
Submission received: 4 November 2024 / Revised: 21 November 2024 / Accepted: 27 November 2024 / Published: 29 November 2024

Abstract

:
As a result of the continuous use of persistent per- and polyfluoroalkyl substances (PFAS), e.g., in aviation firefighting foams, contamination with PFAS has been found in soil, groundwater, and surface water around thousands of industrial and military installations. Due to their harmful (environmental) potential, further dispersion in the environment needs to be stopped, which can be achieved by appropriate absorption materials. In this work, the influence of the cross-linking agent epichlorohydrin (ECH) concentration on the perfluorooctanesulfonic acid (PFOS) adsorption capacity of chitosan gel was investigated. It was found that higher ECH concentration during the cross-linking step decreases the PFOS adsorption capacity of the cross-linked chitosan gel from 0% to 4% ECH solution by about 15%. Using a concentration of 1%, ECH resulted still in an acid-stable material, and a maximum PFOS loading capacity of 4.04 mmol/g was obtained, one of the highest described in the literature. Furthermore, we used a rapid small-scale column test to compare the PFOS adsorption capacity of chitosan and activated carbon, each in both milled and unmilled form. Unmilled chitosan showed the highest PFOS adsorption capacity considering adsorption material dry masses (>0.9 and <0.4 mmol/g for both types of chitosan and activated carbon, respectively). Milled activated carbon proved to be the better adsorption material, considering the fixed volume of the adsorber (>99.9% PFOS adsorbed). Overall, the cross-linking agent concentration in chitosan is a crucial factor influencing its PFOS absorption potential. Our results feature cross-linked chitosan as an effective economic and ecologic alternative for PFOS adsorption in aqueous solutions.

1. Introduction

Per- and polyfluoroalkyl substances (PFAS) are a group of >12,000 substances that were and still are widely used in industrial and consumer products due to their high thermal and chemical stability and advantageous surface properties [1,2,3,4,5]. However, the high stability of the C-F bond is also responsible for why this compound class is such a problem nowadays. The stability inhibits degradation in the environment or by metabolization, as well as making remediation difficult due to the lack of interactions with other chemical groups. Perfluorinated carbon chains lack strong interactions like hydrogen bonding or ionic charges; only comparatively weak intermolecular Van der Waals forces are known for them.
Thus, PFAS is currently one of the most researched challenges in the remediation of soil and water since there are no established standard practices for PFAS destruction yet, and natural degradation, if happening, is far too slow [6]. Many different degradation approaches have been investigated, but they are mostly for a liquid matrix and require high contaminant concentrations to be practical [7,8,9,10]. In contrast, the regulation levels set by governments in the past years are far below those ranges (EU regulation for the sum of 20 PFAS compounds in drinking water is set at 0.1 µg/L) [11]. Therefore, PFAS enrichment through adsorption is an important step prior to degradation.
Various substances have been tested in their PFAS adsorption potential, like activated carbon (AC) or ion exchange resins [7,12,13,14,15,16,17,18,19]. However, ion exchange resins have the constraint that they can only remove opposite-charged ionic species. In contrast, PFAS are such a diverse group that neutral compounds also need to be considered. Therefore, materials like AC, which can adsorb a broad range of compound classes, are better suited. There seem to be multiple mechanisms by which PFAS can bind to carbon-based materials, thereby broadening their usability [20]. In addition to these considerations, biologically derived materials have the advantage that they are renewable sources and biodegradable. Since chitosan, as a bio-derived material, is cheap and already known as an adsorption material for other pollutants [21,22], it is not surprising that it was also investigated regarding its PFAS adsorption potential [23,24,25,26,27,28]. Figure 1 shows the adsorption mechanism of perfluorosulfonic acids on chitosan.
In the beginning, electrostatic and hydrophobic interaction takes place on the protonated amino group of chitosan. Higher perfluorooctanesulfonic acid (PFOS) concentrations promote bilayer sorption, and sorption of micelles occurs on the porous chitosan surface [22,24]. Unmodified chitosan is not acid-stable, but it can be cross-linked to make it stable at low pH values. Deng et al. investigated the PFOS adsorption potential of chitosan, which was synthesized as a molecular imprinted polymer (MIP) by adding PFOS as a template molecule in the cross-linking step [23]. They found that the MIP process enhanced the PFOS adsorption capacity more than 2 times. In a later publication, they optimized the synthesis protocol of the cross-linking step and reported a higher adsorption capacity. However, the molecular imprinting was not included in their later study [24]. Based on their work, our starting point was to test the possibility of enhancing the PFOS adsorption capacity even more by combining MIP and the new cross-linking protocol. Further, we investigated the cross-linking agent concentration on the PFOS adsorption capacity.

2. Materials and Methods

2.1. Chemical and Reagents

The following chemicals and materials were used for the experimental work: perfluorooctanesulfonic acid (PFOS, 97%, abcr, Karlsruhe, Germany), NH4F (p.a., Supelco®, Merck, Darmstadt, Germany), acetic acid (>99%, glacial, J.T.Baker, Deventer, the Netherlands), methanesulfonic acid (99.5%, Roth, Karlsruhe, Germany), Chitosan (99%, Fluorochem, Frankfurt, Germany), NaOH (99.5%, Chemsolute, Renningen, Germany), epichlorohydrin (racemate, >99%, Merck, Darmstadt, Germany), granular activated carbon (IntraPlex B, Intrapore, Essen, Germany). A Labostar DI 2 system (Siemens Evoqua Water Technologies GmbH, Günzburg, Germany) generating ultra-pure water (<0.056 µS/cm) was used for all applications and combustion ion chromatography (CIC) experiments.

2.2. Preparation of Chitosan

The synthesis protocol for chitosan gel synthesis was slightly adapted from Zhang et al. [24]. In short, 1.5 g chitosan flakes were dissolved in 50 mL of 2% (v/v) acetic acid over 2 h with occasional stirring. The viscous mixture was transferred into a 50 mL syringe equipped with a shortened cannula (1 cm) with 0.9 mm diameter at the top (care must be taken while shortening the cannula so as not to clog the cannula). Subsequently, the mixture was quickly squeezed into a 500 mL NaOH (0.5 M) solution stirred with a 3 cm stir bar at 300 rpm and was left stirring for 2 h. Afterwards, the precipitated chitosan was washed three times with deionized water, and the stir bar was exchanged for a smaller one with max 2 cm length. To cross-link the chitosan, 300 mL of (0, 1, 2, or 4% (v/v)) epichlorohydrin (ECH) solution was added to the chitosan. Consequently, the pH of the mixture turned alkaline (~pH 11) due to the excess NaOH in the chitosan polymer. After that, the mixture was stirred at 40 °C for 18 h at 200 rpm. Please note that faster stirring and using a bigger stir bar can lead to milled chitosan instead. The cross-linked chitosan is then thoroughly washed with 150 mL deionized water in the beaker at least 4 times till the pH value of the washing solution is below 8 after contact with the chitosan for at least a minute.
To increase the reactive surface, “milled” chitosan was produced. Therefore, the stir rate of the suspension after the cross-linking step was increased to 1000 rpm with a 3 cm stir bar for 18 h to produce a milky white suspension, which slowly precipitated after stirring was stopped. For storage, the chitosan gel was left under water to prevent drying. Before the chitosan gel was weighed, the supernatant water was decanted, and the gel was put between two paper towels with gentle pressure to remove excess water.
To produce molecular imprinted chitosan polymer, the above-described method was changed in the following way: the non-branched chitosan was shaken for 3 d with a PFOS (0.4 mmol/L) solution to which then later ECH was added to reach a 2% ECH solution during the crosslinking step. The washing step following the cross-linking was done twelve times with 80 mL 0.1 mmol/L NaOH/Acetone (1:1, v/v) to remove all PFOS from the polymer and afterward six times with 80 mL deionized water. The non-imprinted polymer for the control experiment was treated the same but without the addition of PFOS to the solution.

2.3. PFAS Analysis

PFAS analysis was performed with a combustion ion chromatography (CIC) instrument. The CIC combines a combustion and absorption unit (AQF-2100H, GA-210, Mitsubishi Chemical Analytech, Tokyo, Japan) connected to an ion chromatograph (IC; ICS Integrion, Thermo Fisher Scientific GmbH, Dreieich, Germany) controlled by the software Chromeleon 7.2.10 (Thermo Fisher Scientific GmbH, Dreieich, Germany). The combustion unit consisted of an autosampler (ASC-210) connected to the induction furnace (AQF-2100H) operating between 1000 and 1050 °C. Prior to combustion, all ceramic boats were prebaked for at least 5 min at 1000 °C to avoid organic contamination. All samples were hydro-pyrolyzed in the horizontal combustion furnace operating at 1050 °C under a flow of O2 (300 mL/min) Ar (150 mL/min) using a specific boat program (see further details to the CIC analysis in the Supplementary Materials). The results of the CIC are obtained as fluoride equivalents of all fluorine-containing compounds of the sample.

2.4. Adsorption Tests

All adsorption experiments were performed as follows (for the exact protocol regarding specific experiments, see each corresponding entry in Supplementary Materials): 100 mg of chitosan polymer was placed into 125 mL brown non-transparent polypropylene bottles and 100 mL PFOS solution (see Supplementary Materials for concentration) was added. The bottles were turned on their sides and shaken in a circular motion at 150 rpm for the specified time (see Supplementary Materials). Then, the supernatant solution was analyzed via CIC. All experiments were executed in triplicates.

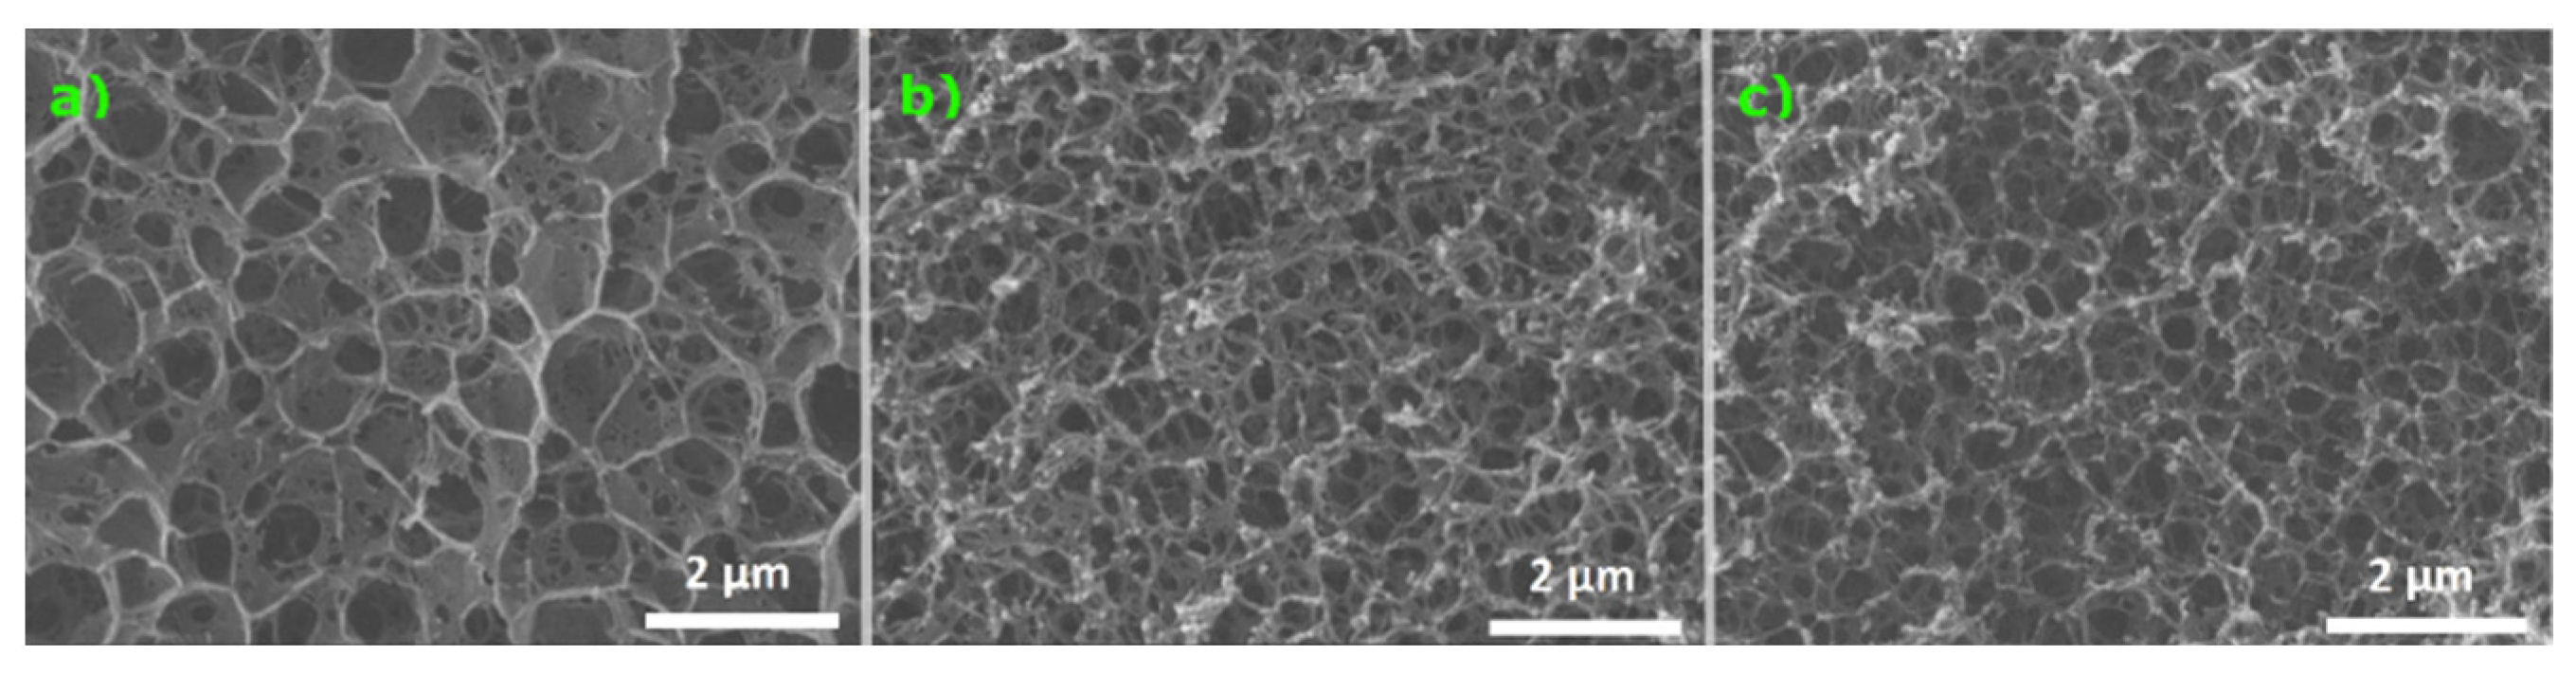
2.5. Scanning Electron Microscopy (SEM)

The SEM characterization of the chitosan samples was conducted on an XL 30 ESEM equipped with a tungsten cathode (FEI, Eindhoven, in 2020 electronic upgrade by point electronic GmbH, Halle, Germany).

2.6. Rapid Small-Scale Column Test

For the column test, five different columns C1C5 were prepared using a self-made setup to guarantee fluorine-free conditions (see Supplementary Materials): C1: a blank column with just the stopper material and tubing, but without an adsorption material; C2: a column filled with granular activated carbon (GAC); C3: a column filled with same GAC as C2 but after milling (see Supplementary Materials for milling protocol and particle size distribution done via PARIO [29]); C4: a column filled with chitosan polymer which was synthesized with 1% (v/v) epichlorohydrin (ECH1) in string form; C5: a column filled with ECH1 in milled form. Those materials were filled into the columns till a bed volume of 0.7 mL was reached after compression. The columns were connected to an Ismatec™ IPC24 peristaltic pump using the Tygon® LMT55 tubes at the lowest possible power setting (0.171 mL/min) with upstream flow direction inside the columns (bottom to the top). The eluate was collected in polypropylene tubes or bottles of different sizes, depending on the volume to be collected.

3. Results and Discussion

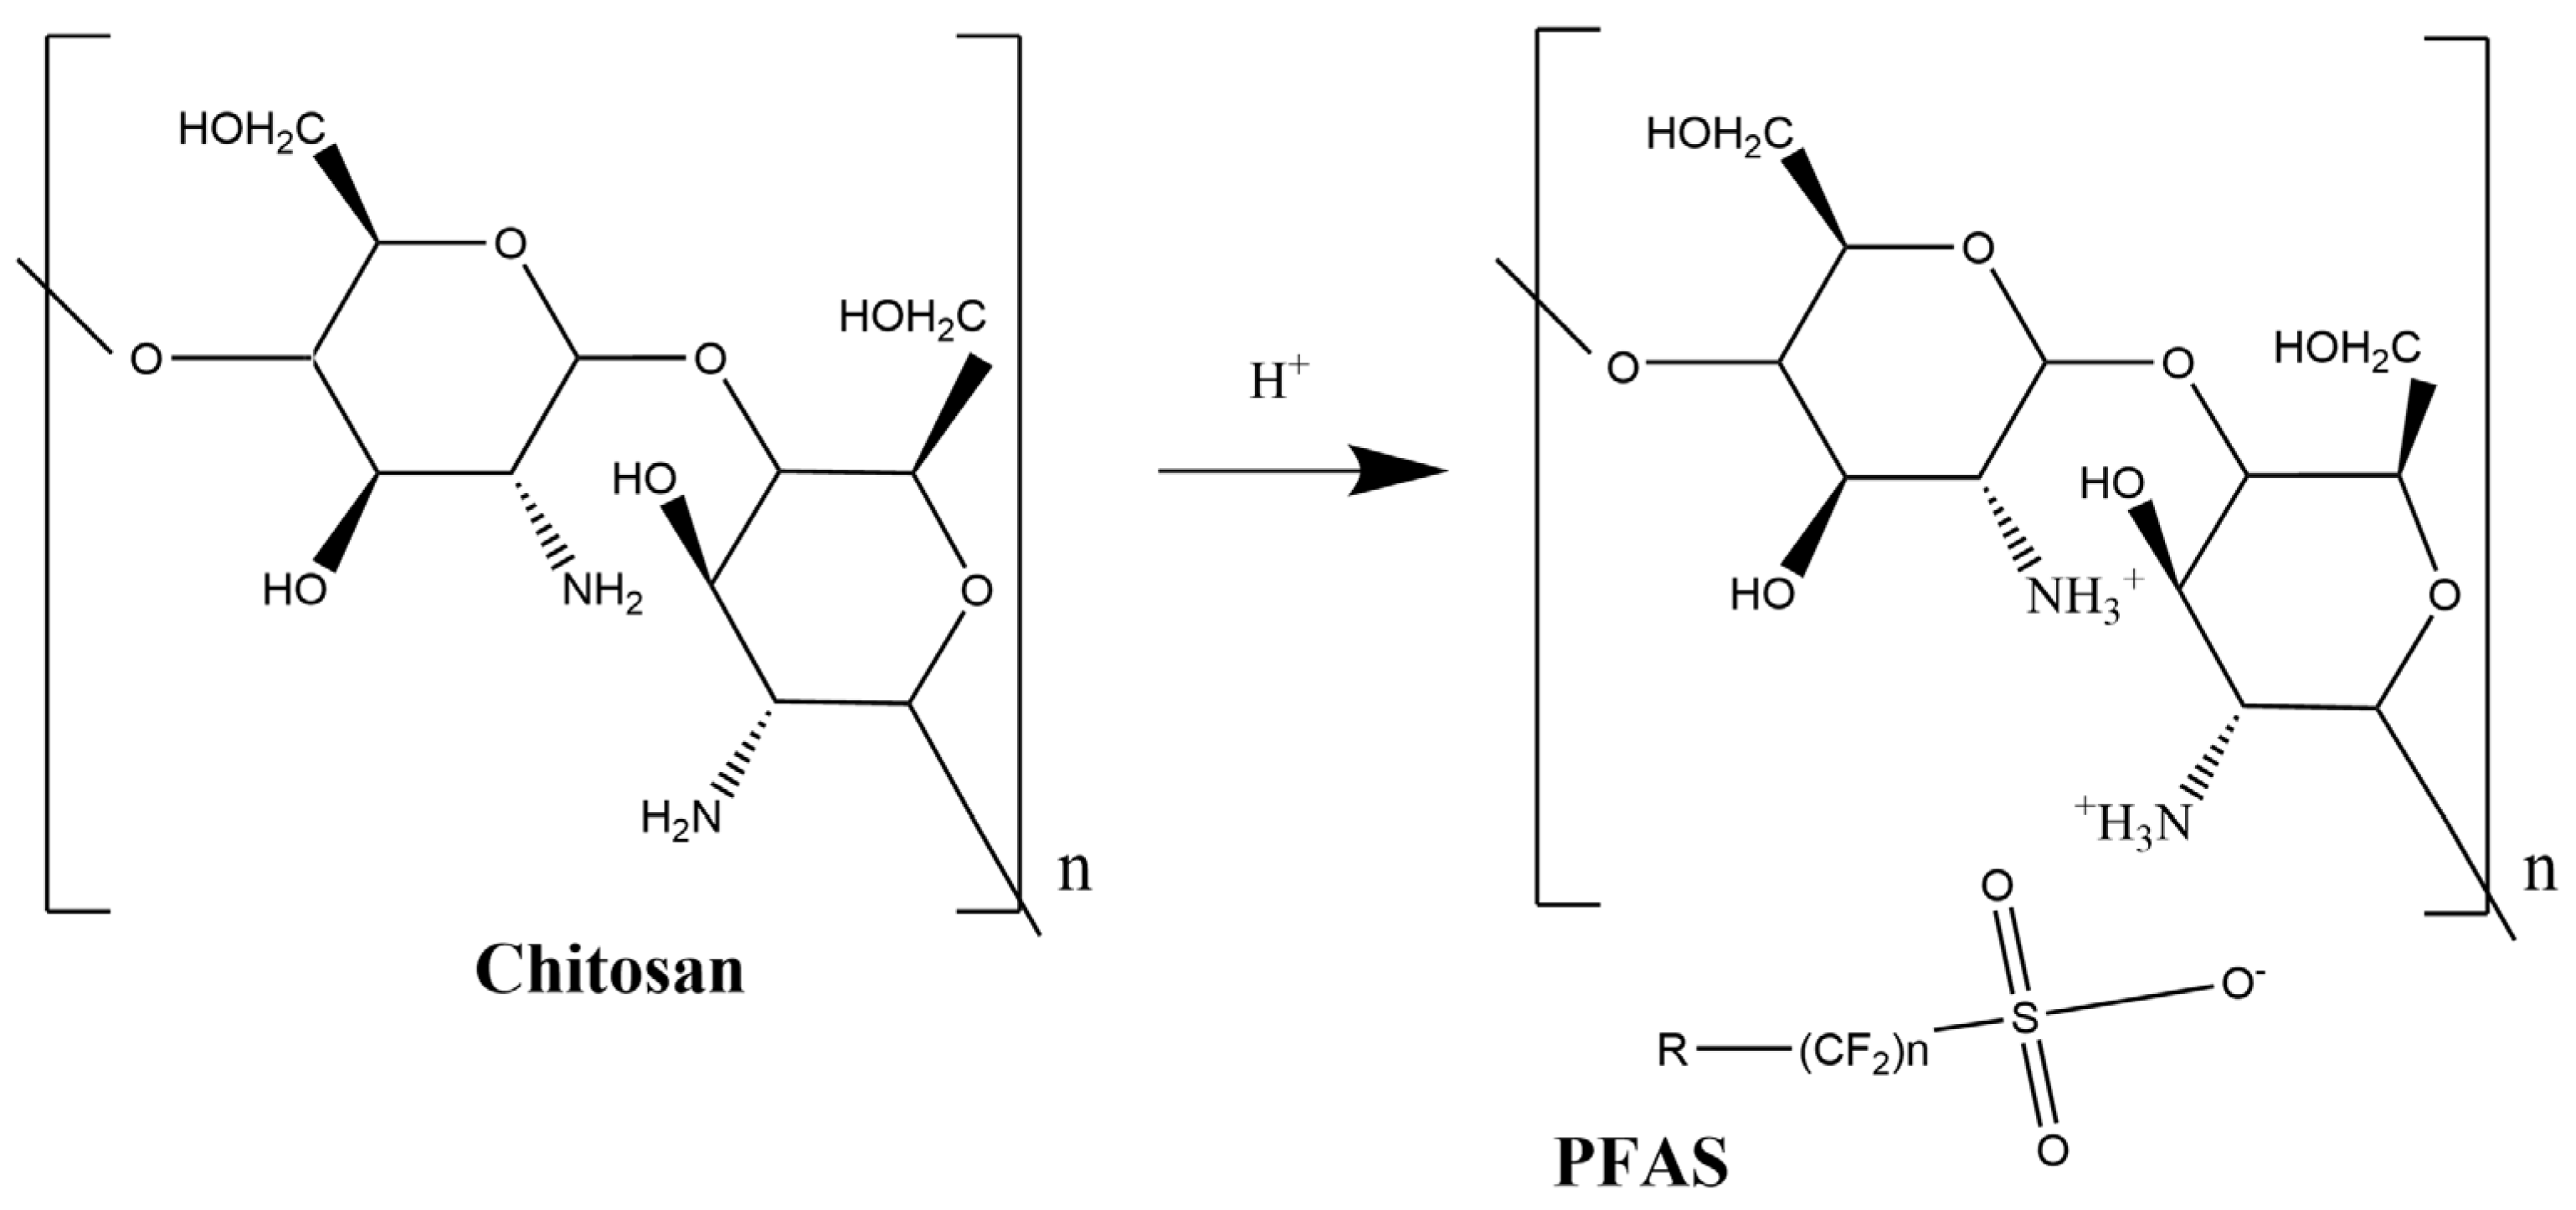
3.1. Molecular Imprinting on Chitosan

The synthesized chitosan polymer used in this work differs from many other published forms in polymer shape. Due to the lack of machines and tools to make small (<5 mm) uniform chitosan beads, we decided to alter the synthesis protocol and focus on string-shaped chitosan polymers, as documented in the following. After dissolving chitosan in acetic acid, the resulting viscous mixture was quickly injected into the NaOH solution using a short syringe cannula. Subsequently, the strings were cut to an appropriate length (~1 cm) and used in the adsorption experiments. To check if the adsorption kinetics of the polymer strings were comparable to the work described by Deng et al. [23], the adsorption at two different PFOS concentrations (0.1 & 0.01 mmol/L) at neutral pH was monitored at different times. The results showed a similar behavior regarding the adsorption kinetics as described by Deng et al., with negligible adsorption happening after 48 h (see Figure S1). Therefore, for the following experiments, an adsorption time of 72 h was chosen to ensure no kinetic influence on the results.
After confirming that the shape change did not affect the adsorption kinetics negatively, the next step was testing whether the molecular imprinting method used in an older work by Deng et al. [23] improves the PFOS adsorption even more combined with their updated cross-linking protocol [24]. However, no significant difference in adsorption capacity between molecular imprinted and non-imprinted chitosan could be observed in the experiment (see Figure 2). As the difference between the two polymers was better visible at the higher concentration, a concentration of 0.1 mmol/L PFOS was chosen in the following experiments.
In addition to this adsorption experiment, we also investigated the microscopic structure of the polymers via a scanning electron microscope (SEM) to investigate the influence of the cross-linking with and without molecular imprinting on the internal structure of the chitosan polymer (see Figure 3).
Consistent with the adsorption experiment, there was no difference observable in the internal structures between fresh fracture edges of non-imprinted and imprinted polymers (Figure 3b,c). However, the pre-cross-linked polymer showed a noticeably different structure from those two in Figure 3a. While all three materials showed a homogenous micropore scaffold structure on the micrometer level, the cavities for pre-cross-linked chitosan were bigger on average. Additionally, there are membranes partly filling the pores of the scaffold structure. In the SEM images published by the Deng group, the same structural motive as in Figure 3b,c can be seen below the collapsed outer surface layers as they likely did not create fresh fracture edges but looked at the outside layers of the chitosan gel after drying (which as shown later influences the morphology) [23]. Other reports on chitosan focused on the external surface of the particles rather than the internal structure, making a comparison with the internal structure found in our study difficult (e.g., [30,31,32,33,34,35,36]). There is, however, one work that showed an inner structure for ammonium hydroxide cross-linked chitosan. The results from this study were consistent with the inner structures shown in Figure 3b,c [37].

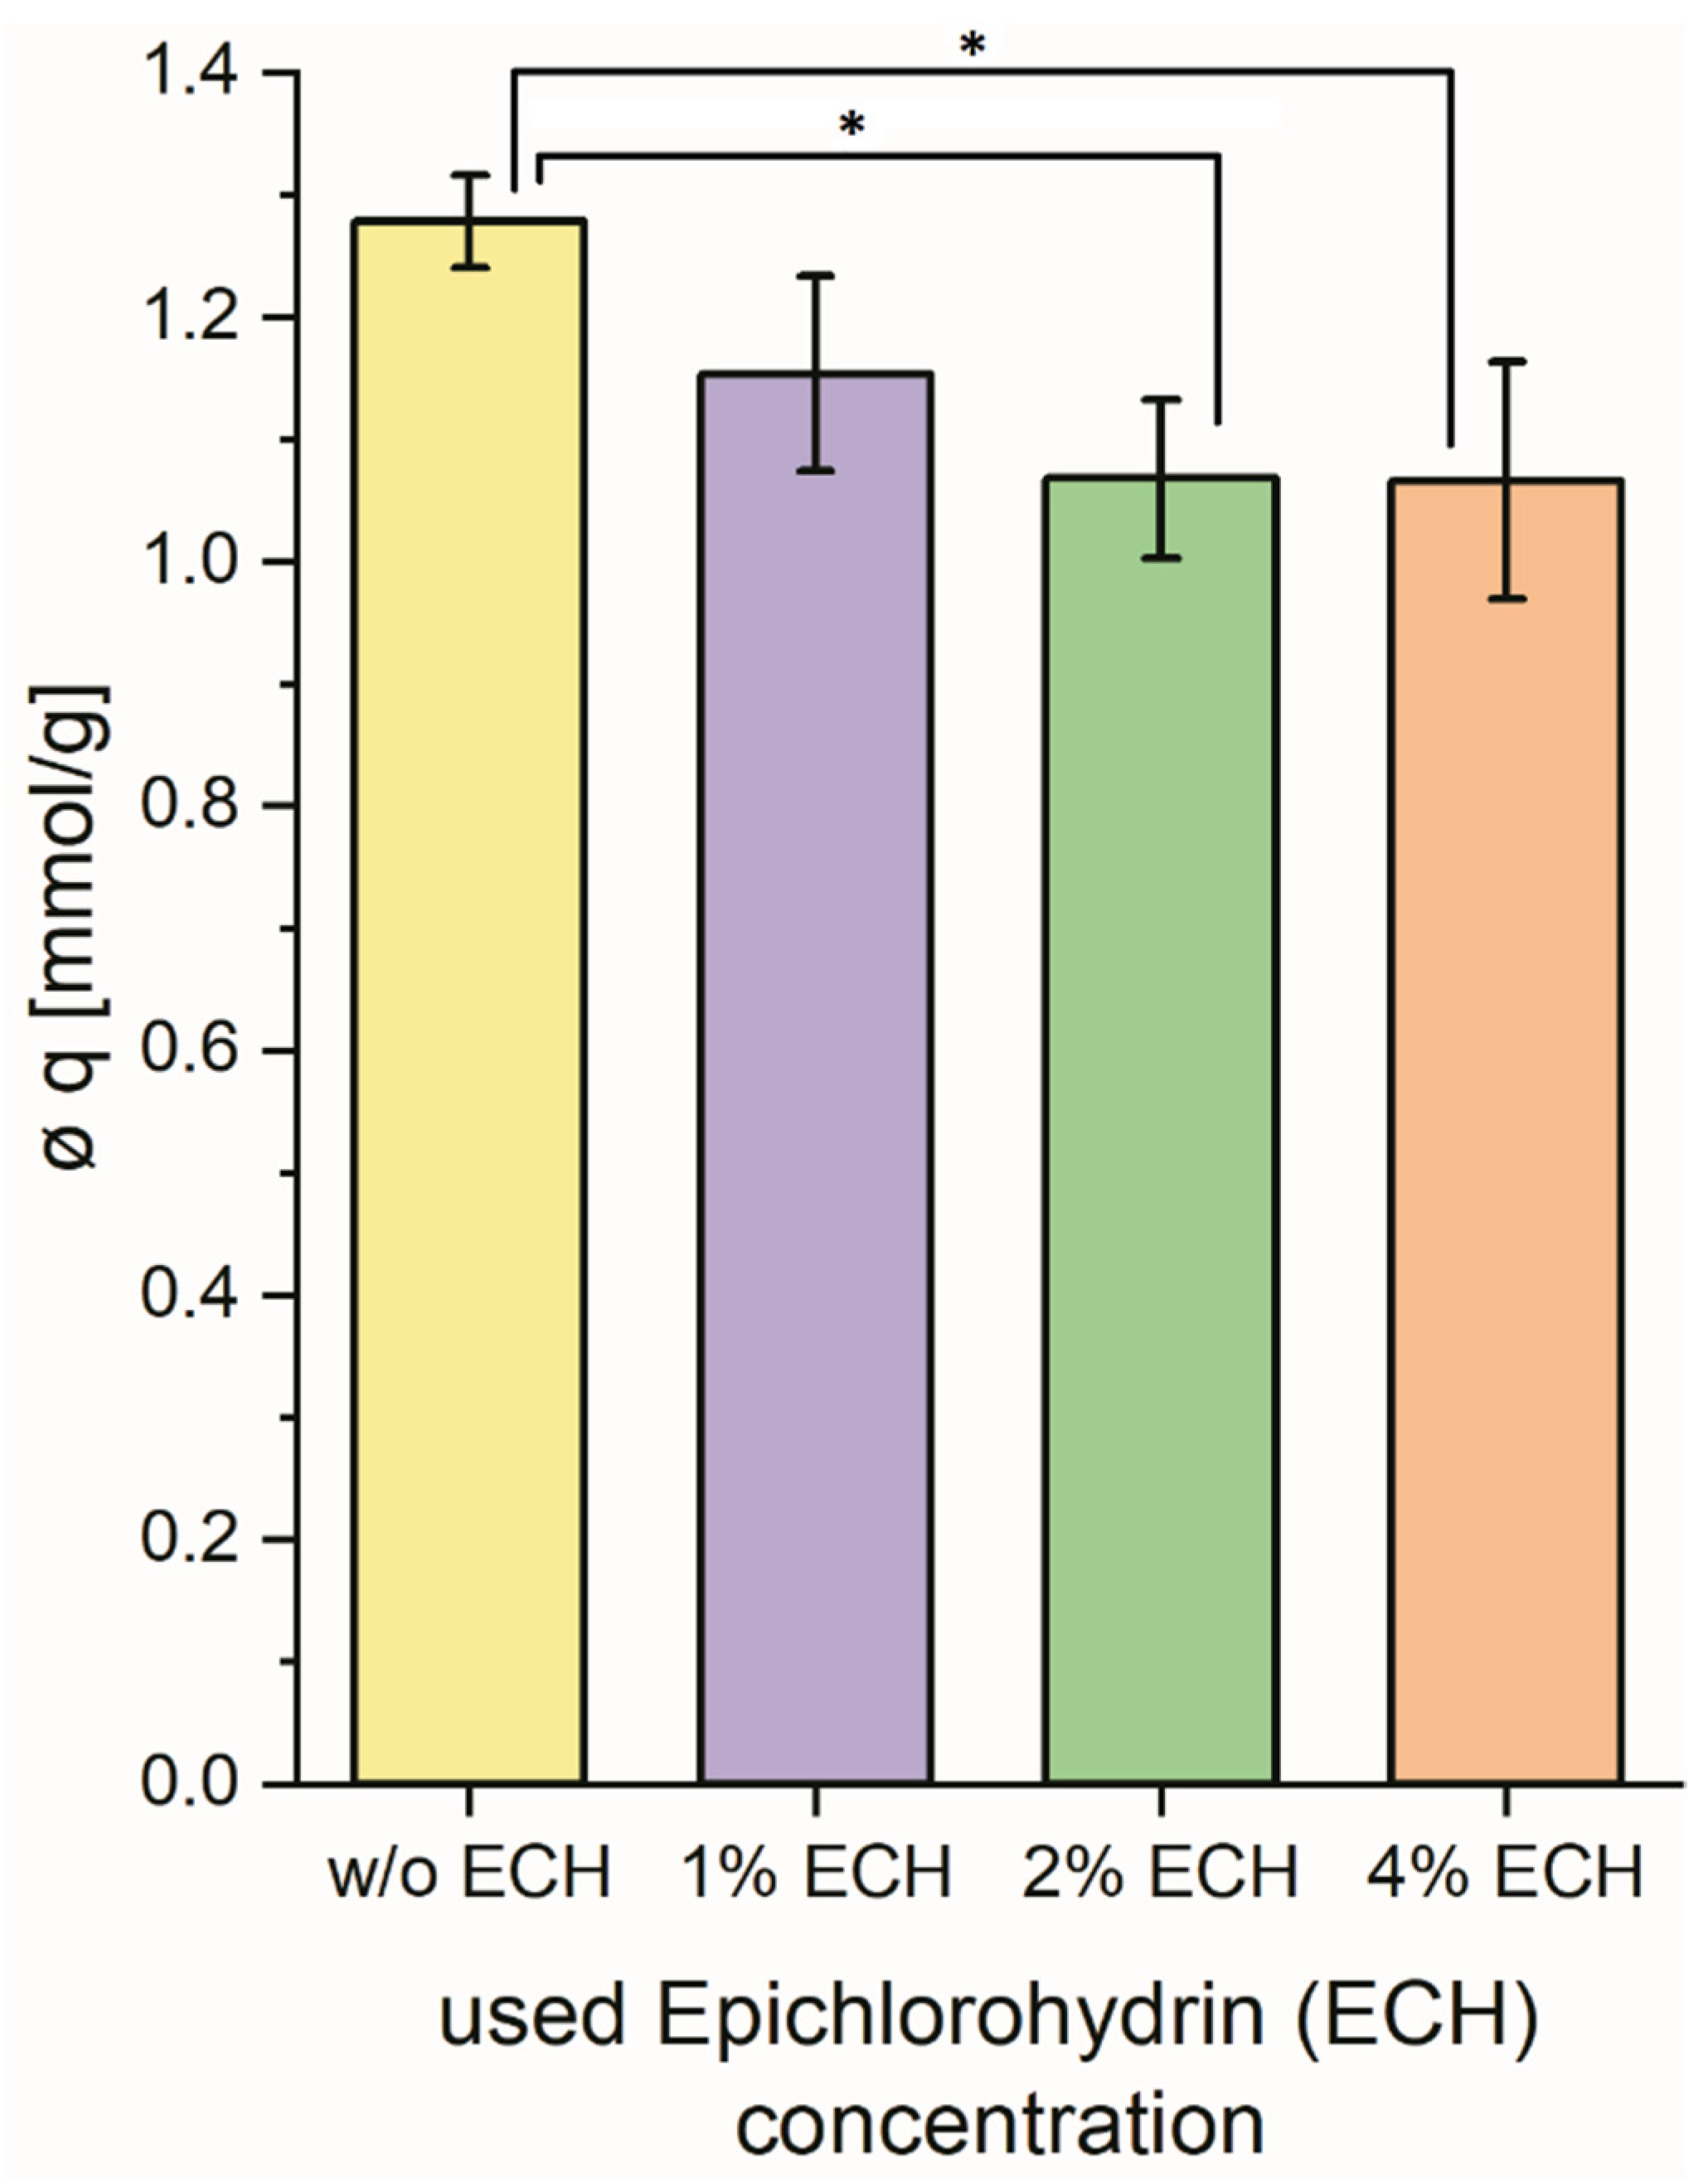
3.2. Varying the ECH Concentration During Synthesis

Those differences in the polymer structure revealed by SEM between the cross-linked and non-cross-linked chitosan then led us to investigate the influence of the cross-linker concentration on the PFOS adsorption. Therefore, four different chitosan polymers were synthesized using 0, 1, 2, or 4% (v/v) epichlorohydrin (ECH0, ECH1, ECH2, ECH4) solutions in the cross-linking step, respectively. The results of those adsorption experiments are presented in Figure 4.
While the non-cross-linked chitosan ECH0 showed the highest PFOS adsorption in the batch experiments after 72 h, this material is not acid-stable in contrast to the three other chitosan gels (see Supplementary Materials) and thus of limited use in real-life applications. The data further showed that a decrease in the used ECH concentration in the cross-linking step resulted in higher adsorption of PFOS. The Student’s t-test showed significant differences between ECH0 and ECH2 as well as ECH4 (p < 0.05, see Table S8). As there is no further decrease from ECH2 to ECH4, it seems that already at 2% ECH concentration, all possible cross-linking connections are made. Thus, no further PFOS adsorption decrease occurs by adding more ECH during the cross-linking step It is known that higher cross-linking of chitosan can negatively impact the adsorption capacity of metal ions due to decreased availability of free amine and hydroxyl groups [21,38]. A similar correlation between ECH concentration and PFOS adsorption has not yet been investigated so far. The internal structure of the polymer ECH1 observed by SEM (see Figure S29) is indistinguishable from the ones seen before in Figure 3b for the polymers produced by the 2% ECH solution. Considering that the internal structures are not visibly different, the decrease of PFOS adsorption with higher ECH concentration is likely explainable by a lower number of free amine and hydroxyl groups instead of a change in structure, as seen in Figure 3a.
The chitosan samples synthesized for this series of experiments showed lower adsorption capacities than those used for the molecular imprinting experiments (see Figure 2). The reason for this could not be completely revealed. However, the first set of experiments (Molecular imprinting) was done with a different batch of chitosan, while all other experiments afterward were done with a newly delivered lot of chitosan after the first was completely used. Therefore, the later ones are all consistent with each other, but as is visible in the difference in Figure 2, not with the first one. In this set of experiments, only the difference between imprinted and non-imprinted was important, not the absolute value. Moreover, we also measured the BET (Brunauer Emmet Teller) surface areas of all four materials, but these findings were inconclusive, as no clear correlation between ECH concentration and surface area could be determined (see Table S5). Kamari et al. reported lower BET surface areas for non-cross-linked chitosan than for ECH cross-linked chitosan. However, instead of applying freeze-drying, their polymer samples were desiccated at elevated temperatures under vacuum, resulting in surface area sizes an order of magnitude lower than in this work [33]. It has been shown by Rinki et al. that the drying method determines the measured BET surface area [34].

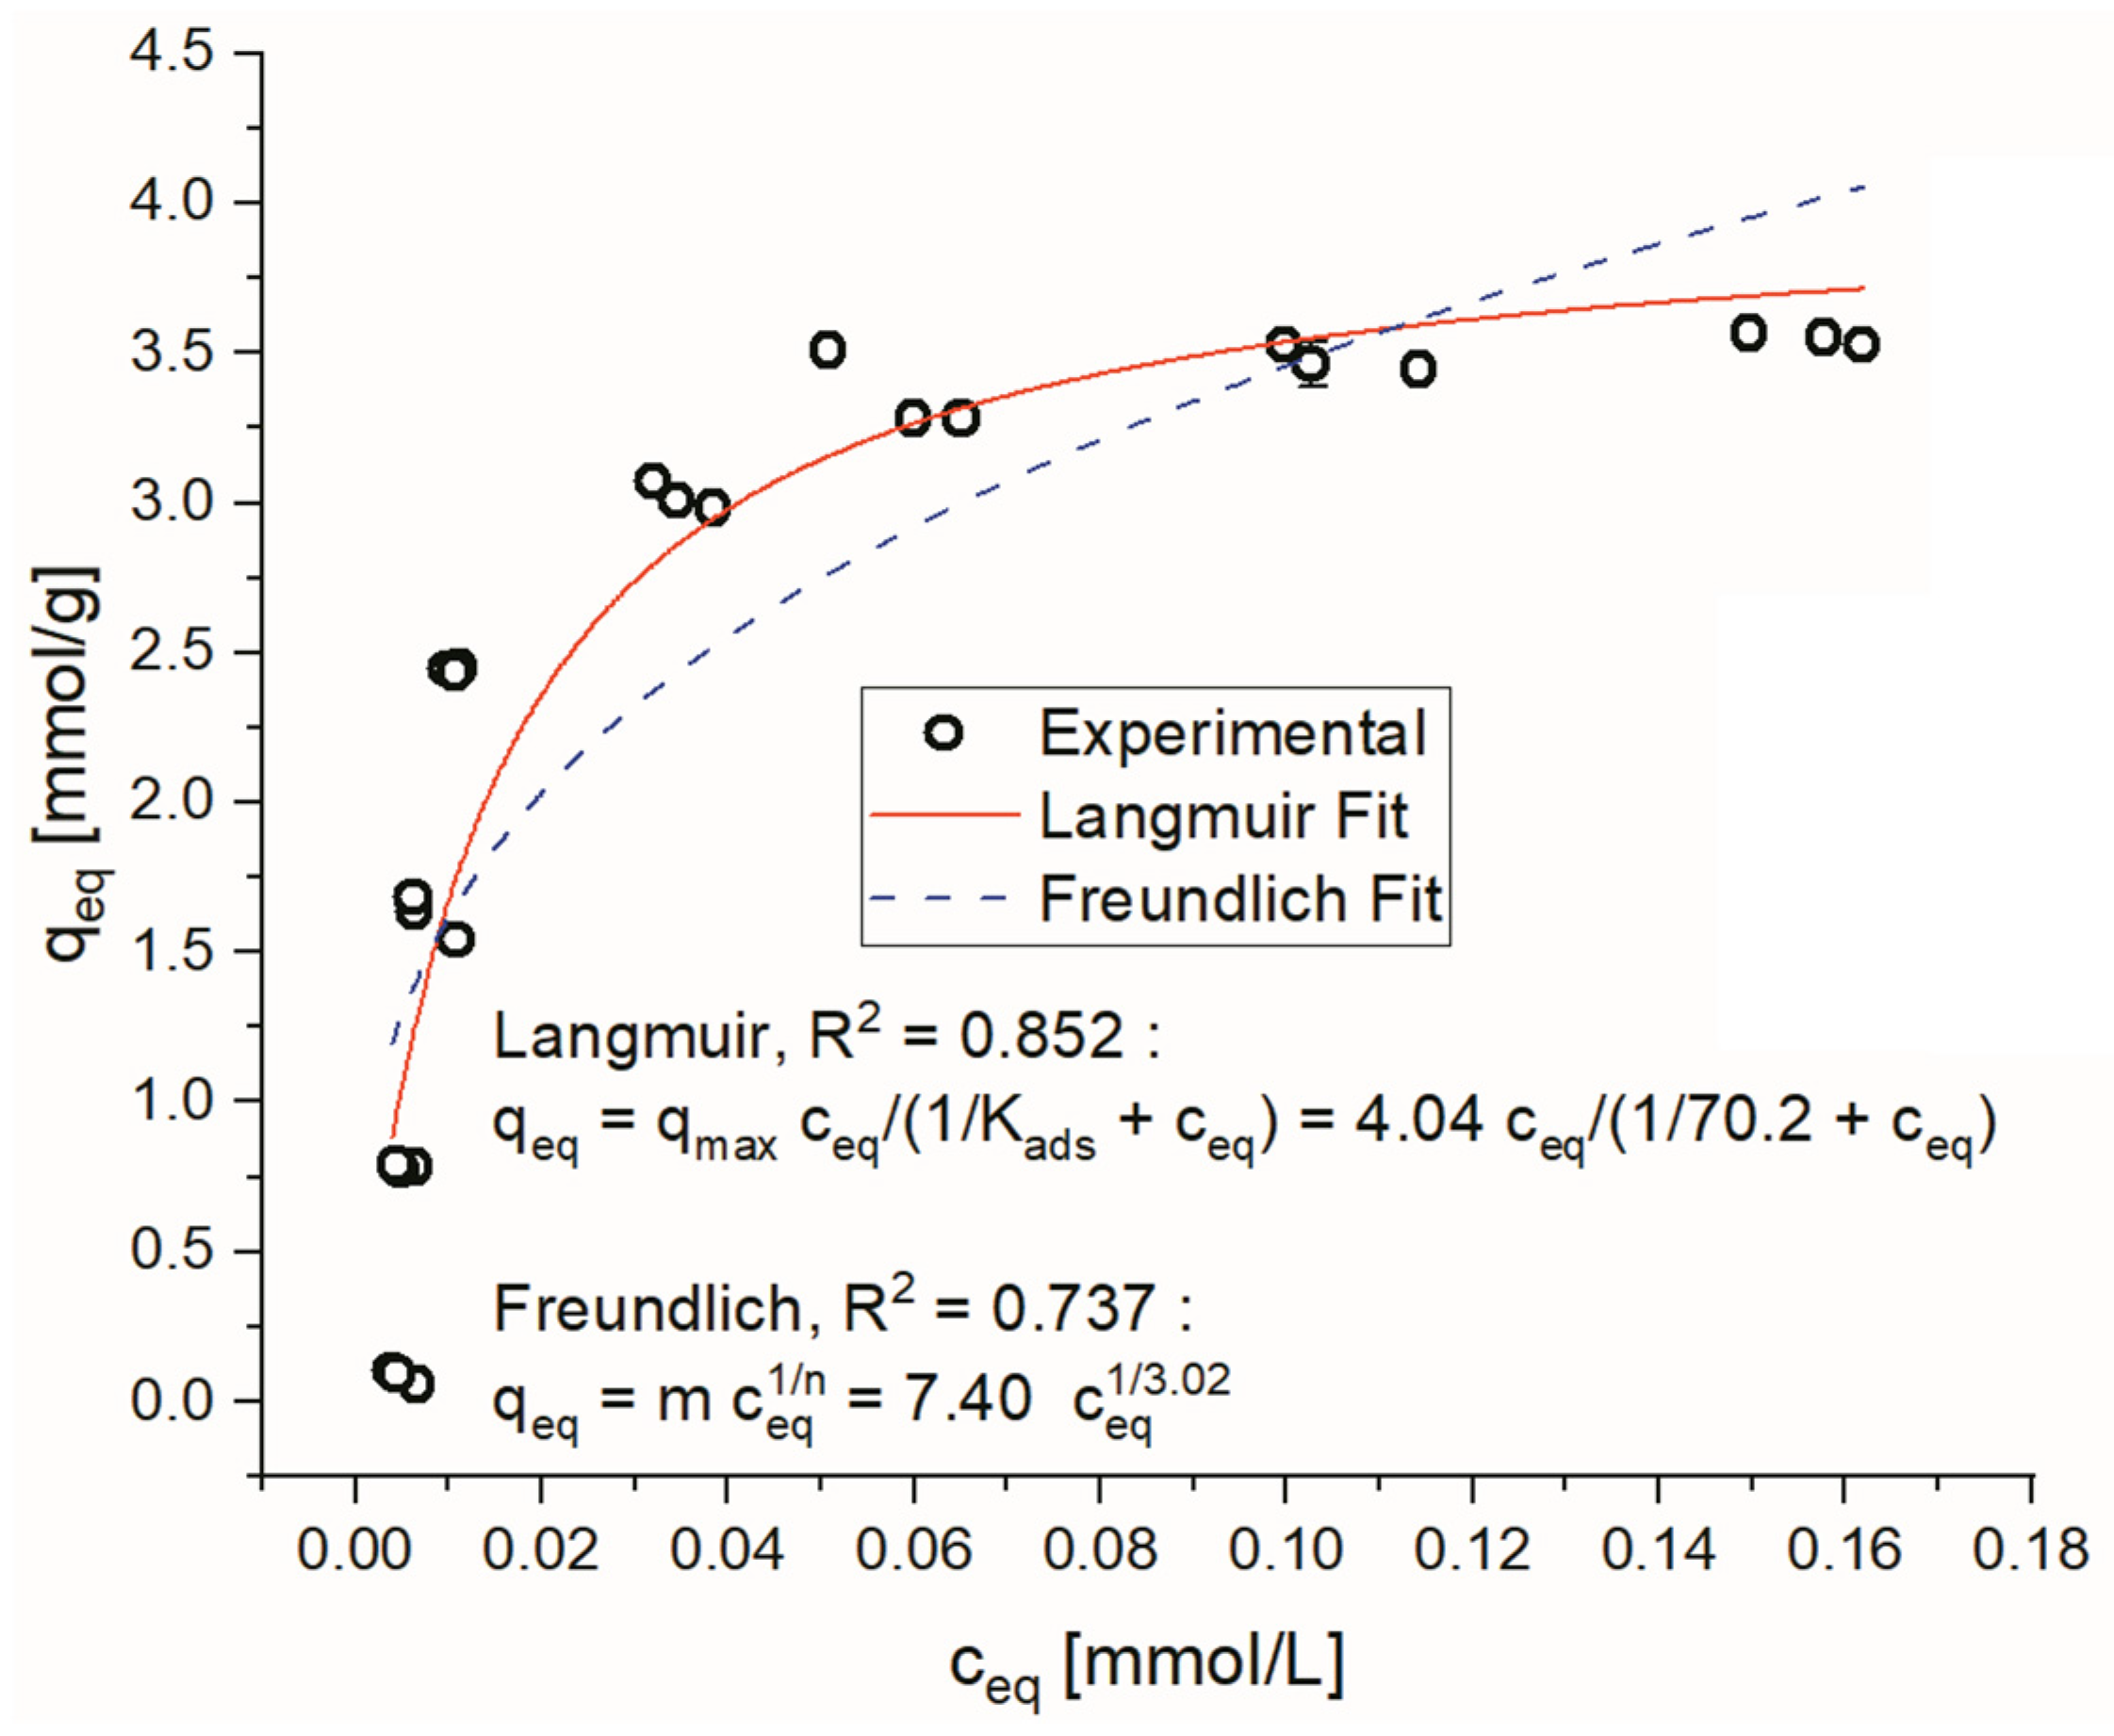
3.3. Adsorption Isotherms

Next, we investigated the adsorption isotherms of ECH1 to see if the Langmuir or Freundlich theory describes the PFOS adsorption process best. To obtain a more robust basis for the fits, three experiments per condition were prepared without averaging them. The results of those experiments are shown in Figure 5.
The adsorption time was increased compared to the earlier experiments in order to ensure that even at the highest concentrations, the adsorption reached its equilibrium. Fitting of the experimental data to the respective equations was performed using Origin and is explained in more detail in the Supplementary Materials chapter 2.3.
The sorption behavior in the investigated concentration range is better described by the Langmuir (R2 = 0.852) than the Freundlich (R2 = 0.737) model, implying a 1:1 stoichiometry between adsorbate and binding site. Deng et al. came to the conclusion that the adsorption of PFOS on chitosan was described slightly better by the Freundlich model (R2 = 0.961 vs. 0.937), albeit at roughly double the equilibrium concentration of this work and under acidic conditions [24]. The maximum sorption capacity of PFOS, according to the Langmuir model in the present work, is 4.04 mmol/g, while Deng et al. reported 5.21 mmol/g with a pH below 3. Considering that they reported a sorption capacity of PFOS that was two times higher for the acidic conditions compared to the neutral pH, the maximum sorption capacity reported in this work at a neutral pH value can also be expected to be even higher at the same acidic conditions used in the work of the Deng group. We selected neutral pH adsorption conditions for our experiments to better reflect common real-world applications of PFAS adsorption. In a recent work, the Deng group investigated a mixture of non-cross-linked chitosan with a covalent organic framework (COF) structure [27]. The maximum adsorption capacity reported in their work was 2.8 mmol/g for such a mixture, albeit with a much quicker PFOS uptake. Compared to other materials (activated carbon (0.35–1.0 mmol/g), minerals (0.3 × 10⁻³–0.23 mmol/g, biochar (0.27–0.34 mmol/g), ion exchange resins (0.4–5.1 mmol/g)) in the literature, the herein presented chitosan showed one of the highest adsorption capacities for PFOS [7,12,13,16,39,40,41,42], with the exception of the results discussed above and for selected ion exchange resins, but those were all tested at strongly acidic pH conditions. One notable caveat for the chitosan results is that they are all based on the dry weight of chitosan. However, in practice (typical application), the chitosan polymer contains about 95% (w/w) water (see Table S6), which implies that the weight of the wet polymers used in the experiments is approximately 20 times higher.

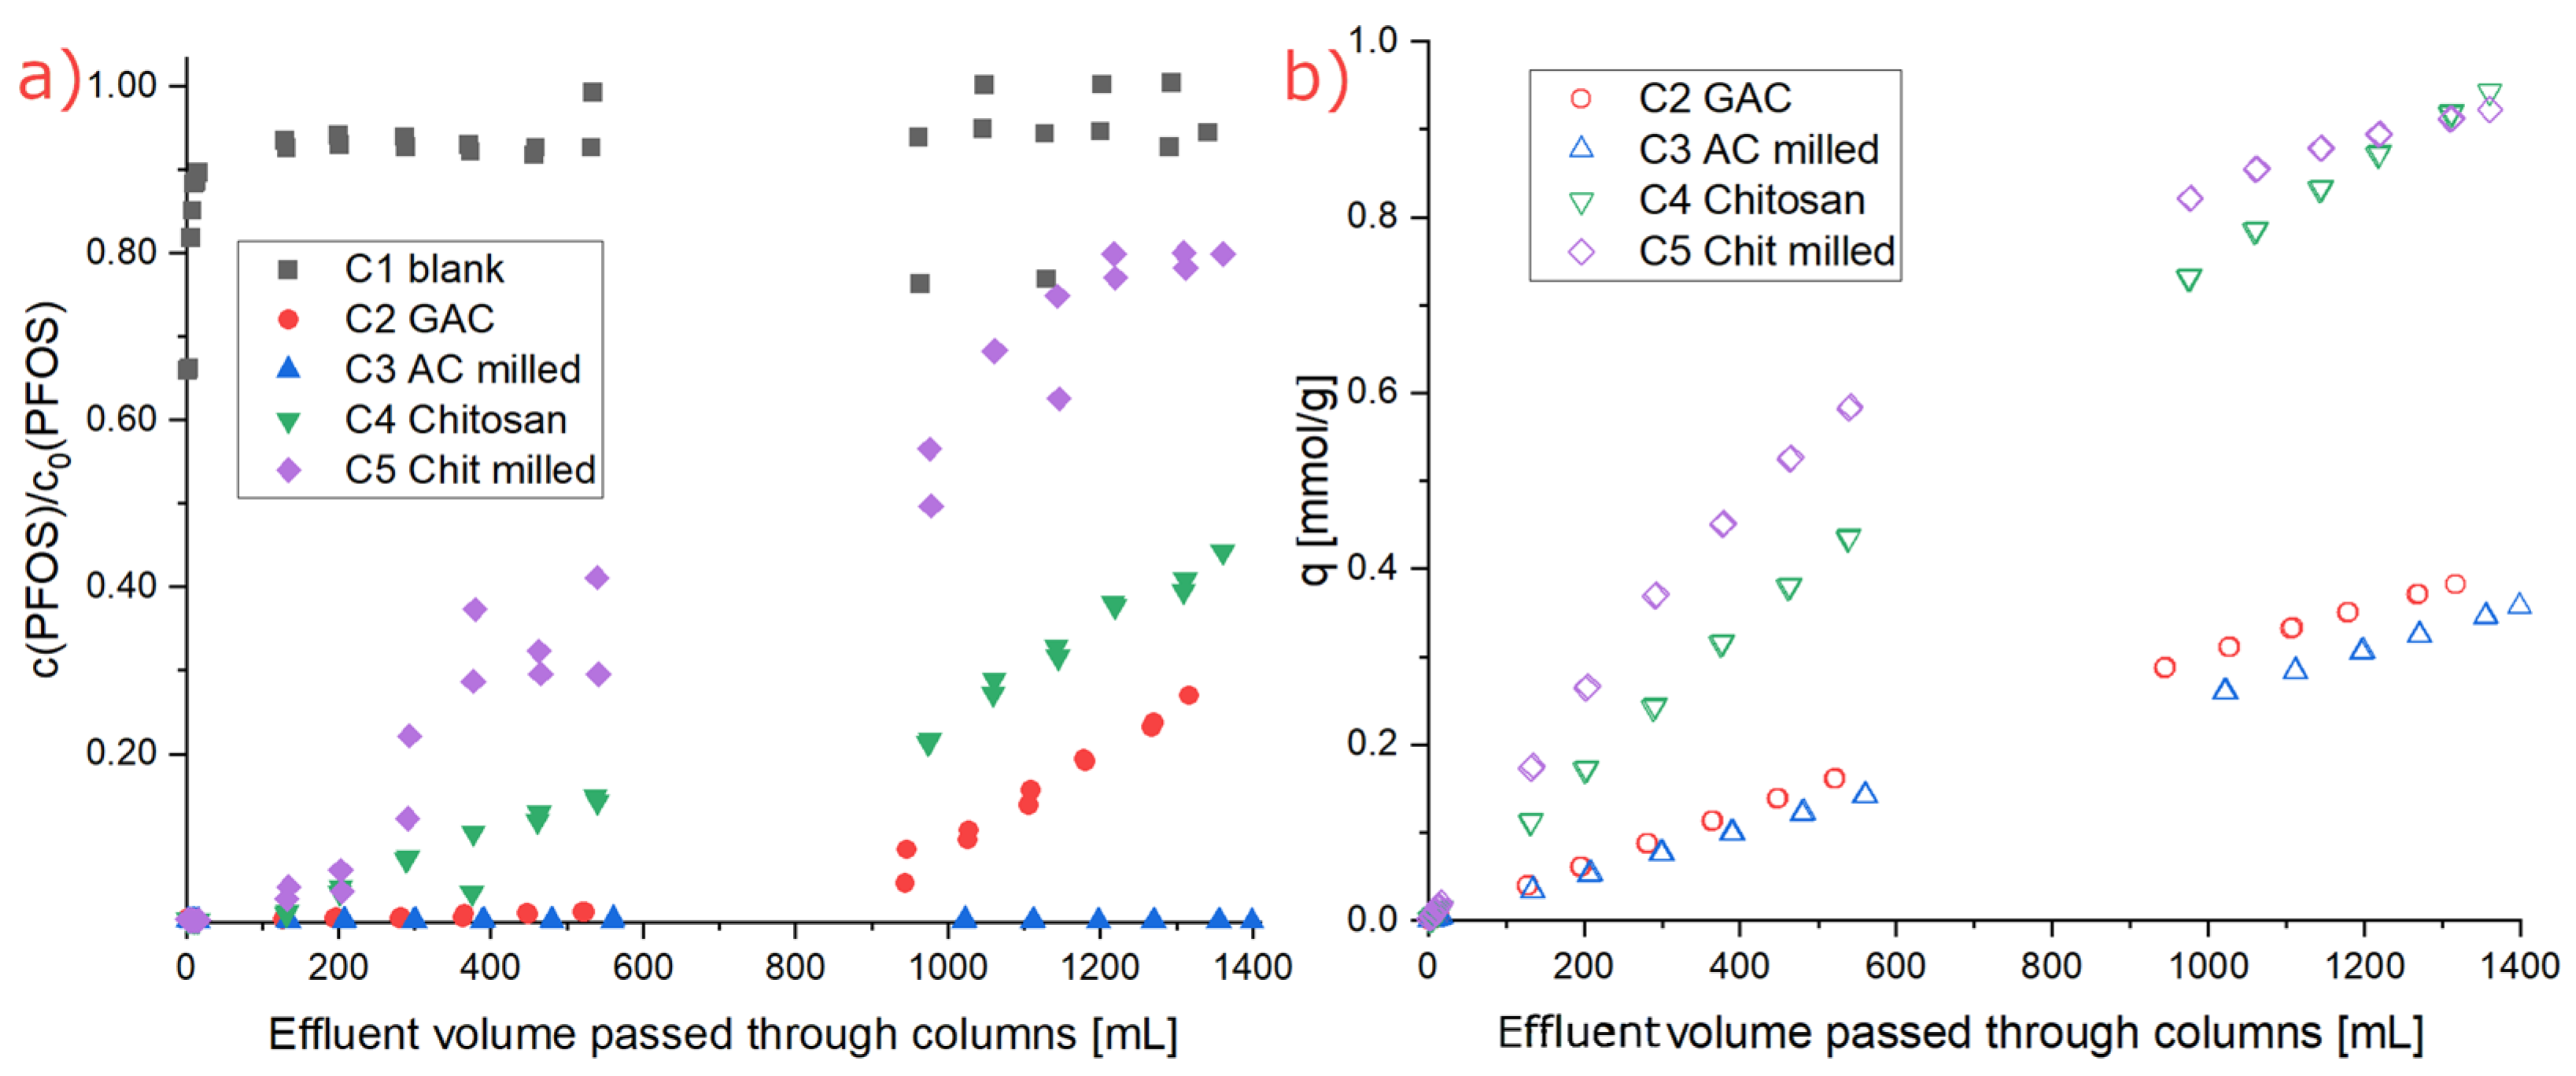
3.4. Rapid Small-Scale Column (RSSC) Test

Finally, we compared the chitosan polymer ECH1 with activated carbon in a rapid small-scale column (RSSC) test regarding their PFOS adsorption behavior. In order to quickly see a PFOS breakthrough for the investigated materials, a very high PFOS sorbate concentration of around 40 mg/L (~80 mmol/L) was used as artificial wastewater. In preparation for this experiment, various materials were tested regarding their fluorine leaching and PFOS adsorption behavior to determine their suitability as a tube or stopper for the adsorbent material in the columns (see Figure S3). The adsorption tests showed that of the tested materials, only the paper filter adsorbed PFOS. The release of fluorine-containing species was observed for the fluorinated ethylene propylene (FEP) tube and both glass wool types. For the glass wool, it could be shown that inorganic fluoride was released, while the FEP tube released organic fluorine species. After considering all results, polypropylene fleece was chosen as the filter material, and Tygon® LMT55 was used for the tubing.
To get a better understanding of the used adsorption materials, their BET surface areas were determined, and the results are shown in Table 1. Additionally, the size distribution of the milled GAC was determined by the suspension pressure method (see Table S10), which revealed that according to weight, two-thirds of the material had a particle size between 200–630 µm and one-third between 20–200 µm.
The GAC had an inner surface area of almost 1300 m2/g, regardless of whether it was milled or not. The unmilled ECH1 had roughly one order of magnitude less surface area with 94.1 m2/g. Milled ECH1 had around one order of magnitude less BET area (3.4 m2/g) in comparison to unmilled ECH1. SEM images of the freeze-dried, milled ECH1 showed only two-dimensional flakes remaining after the freeze-drying process in contrast to the visible particles for the milled activated carbon (see Figure 6) and thereby confirmed that the three-dimensional scaffold in the chitosan structure got destroyed. For the unmilled ECH1 in string form, this collapse of the scaffold structure was only visible in the SEM images for the outside layers of the strings, while the inner structure of the unmilled ECH1 is preserved (see Figure S29). The unmilled ECH1, therefore, showed a similar behavior as seen before for the chitosan polymers shown in Figure 3b,c (which was equivalent in synthesis to ECH2). Thus, it is likely that the main reason for the surprisingly small BET surface area of milled ECH1 is the freeze-drying process, and it was not possible to determine the surface area in the wet state. The influence of the drying method is further confirmed by air-dried ECH1 polymer strings, which are much thinner than freeze-dried ones and show a complete loss of scaffold structure in SEM images (see Figures S30–S32).
For the column test, five different columns were filled with almost identical column volumes: C1: a blank column with just the stopper material and tubing, but without any adsorption material; C2: a column filled with granular activated carbon (GAC); C3: a column filled with the same GAC as C2 but after milling (see Supplementary Materials for milling protocol and particle size distribution); C4: a column filled with ECH1 in string form as obtained from the synthesis protocol described above; C5: a column filled with ECH1 in milled form. The same volume of adsorber was used in all four columns to better compare the performance of the four adsorbent materials under field conditions. The results of the RSSC test are shown in Figure 7.
The RSSC test was conducted in such a way that all five columns were connected to different channels of the same peristaltic pump, which pumped the PFOS solution from the same reservoir. After percolating the columns, the effluent was collected and then analyzed via CIC. The measured PFOS concentrations in the effluent are shown in Figure 7a, while the loading capacity based on the dry mass of the adsorber is shown in Figure 7b.
From a practical point of view, column C3, filled with milled GAC, showed the highest PFOS retention, considering the absolute PFOS reduction since no breakthrough was observed. Even after nearly 1400 mL effluent passed the column, the measured PFOS concentration in the effluent was around the LOQ for the CIC. Column C5, filled with milled chitosan, on the other hand, showed the fastest increase of PFOS concentration in the effluent after roughly 300 mL passed the column. After 1400 mL passed the column, the PFOS effluent concentration of C5 was similar to the PFOS effluent concentrations found for the blank column C1. The PFOS concentration in the effluent for the GAC in C2 and the chitosan in string form in C4 were similar. However, PFOS effluent concentrations for both GAC columns were systematically lower compared to the chitosan columns.
While it might be confusing at first glance that the loading capacity of the milled GAC in C3 is lower than that of the GAC in C2, it can be easily explained by the experimental setup. As all four columns were filled with the same volume of material, a higher mass of the milled GAC could be fitted into that volume, thereby decreasing q (for similar amounts of adsorbed PFOS). Results of the RSSC test (Figure 7b) showed that for the applied experimental conditions, the milling did not alter the PFOS loading capacity and behavior in a major way for either chitosan or activated carbon. The results for the milled chitosan in C5 showed a faster increase of the PFOS loading q in the beginning than for the unmilled chitosan in C4. However, the data points of C5 at the end indicate an asymptotic behavior, which is not observable for C4. So, it appears to be, that the maximum PFOS loading capacity of the chitosan is reduced by the milling.
The results show that milling improved the adsorption of PFOS for GAC but decreased it for chitosan. One potential reason for this finding might be the different rigidities of the materials. For GAC, milling significantly reduced the particle size, thereby improving the PFOS adsorption kinetics and homogenizing the liquid flow profile without destroying the surface structure necessary for adsorption. In contrast, the unmilled chitosan strings are already permeable for the solution, so the PFOS adsorption kinetics are only slightly improved by the smaller particle size. However, due to the softness of the material, the scaffold structure of the chitosan gel probably gets impaired by the necessary force to mill it, thus lowering the PFOS adsorption capacity of the material.

4. Conclusions

We could show that cross-linking chitosan with ECH negatively affects its ability to adsorb PFOS at a neutral pH value. This decrease is accompanied by the loss of membranes, as revealed by scanning electron microscopy images of the inner scaffold structure of the chitosan polymers. However, the modification of chitosan is necessary because there are some drawbacks to common chitosan in practical use, such as low mechanical strength and solubility in acidic mediums. Therefore, to obtain acid-stable chitosan, the lowest necessary concentrations of ECH should be used. Compared to other materials in the literature, the herein-presented chitosan showed one of the highest adsorption capacities for PFOS.
In the scope of this study, the rapid small-scale column tests showed that milled activated carbon was the best adsorber material for the decontamination of a highly concentrated PFOS solution. On the contrary, the least capable adsorption material was milled chitosan. The unmilled chitosan and activated carbon columns showed similar results with regard to their clean-up potential. However, comparing the PFOS loading capacity of the adsorption materials (which is calculated based on the dry mass of the adsorber) revealed that in this experiment, chitosan has a much higher PFOS adsorption per dry mass than activated carbon. Future studies should, therefore, look at ways to utilize this advantage of chitosan by finding a process to remove the water content from the PFAS-loaded chitosan polymer without releasing the contaminants, thereby making it the economically advantageous method.

Supplementary Materials

The following supporting information can be downloaded at: https://www.mdpi.com/article/10.3390/app142311145/s1, Figure S1: Concentration of supernatant solution in relation to time after addition of chitosan adsorber, Figure S2: Combustion Ion chromatography (IC) results of leaching tests (left) and PFOS adsorption test (right), Figure S3: Single parts of the column prior to assembly, Figure S4: The syringe parts were glued together with a double-sided heating plate: The heat should be just high enough to tightly seal the connection, without deforming the plastic too much, Figure S5: Column prior to (left) and after cutting of the cannula connectors (right top: outlet of column; right bottom: inlet), Figure S6: Column connected with tube and heat shrink tube to seal the connection, Figure S7: Finished column with all tubes connected and sealed, Figure S8: Finished column setup before start of the measurement, Figure S9: Pre-Cross-linked Chitosan Polymer, Figure S10: Pre-Cross-linked Chitosan Polymer, Figure S11: Pre-Cross-linked Chitosan Polymer, Figure S12: Cross-linked Non-MIP Chitosan, Figure S13: Cross-linked Non-MIP Chitosan, Figure S14: Cross-linked Non-MIP Chitosan, Figure S15: Cross-linked MIP Chitosan, Figure S16: Cross-linked MIP Chitosan, Figure S17: Milled activated Carbon, Figure S18: Milled activated Carbon, Figure S19: Milled activated Carbon, Figure S20: Unmilled activated Carbon, Figure S21: Unmilled activated Carbon, Figure S22: Unmilled activated Carbon, Figure S23: Unmilled activated Carbon, Figure S24: Milled ECH1, Figure S25: Milled ECH1: Figure 6a in main text, Figure S26: Milled ECH1, Figure S27: Unmilled ECH1, Figure S28: Unmilled ECH1, Figure S29: Unmilled ECH1, Figure S30: Air dried ECH1, Figure S31: Air dried ECH1, Figure S32: Air dried ECH1, Table S1: Combustion parameters, Table S2: Ion chromatography parameters, Table S3: Boat program for combusting solutions, Table S4: IC eluent gradient program, Table S5: BET surface area for chitosan with different ECH concentration during the crosslinking step, Table S6: Calculation of chitosan and water content in the wet polymer, Table S7: PFOS Loading capacity q of chitosan polymers made with different ECH concentrations, Table S8: Results of Student’s t-test regarding PFOS adsorption between chitosan polymers made with different ECH concentrations, Table S9: Results of size distribution determination by sieve analysis, Table S10: Parameters and results of size distribution determination by ISP, Table S11: Amount of materials used for leaching and adsorption test, Table S12: Parameters for RSSC columns.

Author Contributions

Conceptualization, P.W. and F.-G.S.; methodology, P.W., P.R. and C.V.; investigation, P.W. and I.F.; validation, P.W., P.R. and C.V.; formal analysis, P.W. and C.V.; data analysis, F.S. and L.G.; writing—original draft preparation, P.W.; writing—review and editing, P.W., P.R., C.V., F.S., L.G., I.F. and F.-G.S.; funding acquisition, F.-G.S. All authors have read and agreed to the published version of the manuscript.

Funding

This research was funded by the German Federal Ministry of Economic Affairs and Energy (BMWi; ZIM program 16KN076702 “PerFluSan-PFTSan” and 16KN076724 “MIDRAPA”).

Institutional Review Board Statement

Not applicable.

Data Availability Statement

The raw data supporting the conclusions of this article will be made available by the authors on request.

Acknowledgments

We thank Annett Zimathies (BAM) for the BET measurements. Furthermore, we thank Clara Marshall (FHI) for providing the possibility to freeze-dry the samples for BET measurements and Guido Söhring (BAM) for helping with the preparation of the micro-columns.

Conflicts of Interest

The authors declare no conflicts of interest.

References

  1. Grabda, M.; Oleszek, S.; Matsumoto, M. Per- and polyfluoroalkyl substances: Problematic emerging pollutants of aquatic environment. Arch. Environ. Prot. 2020, 46, 3–21. [Google Scholar] [CrossRef]
  2. Glüge, J.; Scheringer, M.; Cousins, I.T.; DeWitt, J.C.; Goldenman, G.; Herzke, D.; Lohmann, R.; Ng, C.A.; Trier, X.; Wang, Z. An overview of the uses of per- and polyfluoroalkyl substances (PFAS). Environ. Sci. Process. Impacts 2020, 22, 2345–2373. [Google Scholar] [CrossRef] [PubMed]
  3. Stoiber, T.; Evans, S.; Naidenko, O.V. Disposal of products and materials containing per- and polyfluoroalkyl substances (PFAS): A cyclical problem. Chemosphere 2020, 260, 127659. [Google Scholar] [CrossRef]
  4. Vo, H.N.P.; Ngo, H.H.; Guo, W.; Nguyen, T.M.H.; Li, J.; Liang, H.; Deng, L.; Chen, Z.; Nguyen, T.A.H. Poly-and perfluoroalkyl substances in water and wastewater: A comprehensive review from sources to remediation. J. Water Process Eng. 2020, 36, 101393. [Google Scholar] [CrossRef]
  5. Reinhart, D.R.; Bolyard, S.C.; Chen, J. Fate of Per- and Polyfluoroalkyl Substances in Postconsumer Products during Waste Management. J. Environ. Eng. 2023, 149, 03123002. [Google Scholar] [CrossRef]
  6. Arvaniti, O.S.; Stasinakis, A.S. Review on the occurrence, fate and removal of perfluorinated compounds during wastewater treatment. Sci. Total Environ. 2015, 524–525, 81–92. [Google Scholar] [CrossRef]
  7. Wanninayake, D.M. Comparison of currently available PFAS remediation technologies in water: A review. J. Environ. Manage. 2021, 283, 111977. [Google Scholar] [CrossRef]
  8. Longendyke, G.K.; Katel, S.; Wang, Y. PFAS fate and destruction mechanisms during thermal treatment: A comprehensive review. Environ. Sci. Process. Impacts 2022, 24, 196–208. [Google Scholar] [CrossRef] [PubMed]
  9. Wang, J.; Lin, Z.; He, X.; Song, M.; Westerhoff, P.; Doudrick, K.; Hanigan, D. Critical Review of Thermal Decomposition of Per- and Polyfluoroalkyl Substances: Mechanisms and Implications for Thermal Treatment Processes. Environ. Sci. Technol. 2022, 56, 5355–5370. [Google Scholar] [CrossRef]
  10. Bolan, N.; Sarkar, B.; Yan, Y.; Li, Q.; Wijesekara, H.; Kannan, K.; Tsang, D.C.W.; Schauerte, M.; Bosch, J.; Noll, H.; et al. Remediation of poly- and perfluoroalkyl substances (PFAS) contaminated soils—To mobilize or to immobilize or to degrade? J. Hazard. Mater. 2021, 401, 123892. [Google Scholar] [CrossRef]
  11. Council of the European Union; European Parliament. Directive (EU) 2020/2184 on the quality of water intended for human consumption (recast). Off. J. Eur. Union 2020, 63, L 435/1. [Google Scholar]
  12. Boyer, T.H.; Fang, Y.; Ellis, A.; Dietz, R.; Choi, Y.J.; Schaefer, C.E.; Higgins, C.P.; Strathmann, T.J. Anion exchange resin removal of per- and polyfluoroalkyl substances (PFAS) from impacted water: A critical review. Water Res. 2021, 200, 117244. [Google Scholar] [CrossRef] [PubMed]
  13. Dixit, F.; Dutta, R.; Barbeau, B.; Berube, P.; Mohseni, M. PFAS removal by ion exchange resins: A review. Chemosphere 2021, 272, 129777. [Google Scholar] [CrossRef] [PubMed]
  14. Garg, S.; Wang, J.; Kumar, P.; Mishra, V.; Arafat, H.; Sharma, R.S.; Dumée, L.F. Remediation of water from per-/poly-fluoroalkyl substances (PFAS)—Challenges and perspectives. J. Environ. Chem. Eng. 2021, 9, 105784. [Google Scholar] [CrossRef]
  15. Militao, I.M.; Roddick, F.A.; Bergamasco, R.; Fan, L. Removing PFAS from aquatic systems using natural and renewable material-based adsorbents: A review. J. Environ. Chem. Eng. 2021, 9, 105271. [Google Scholar] [CrossRef]
  16. Teymourian, T.; Teymoorian, T.; Kowsari, E.; Ramakrishna, S. A review of emerging PFAS contaminants: Sources, fate, health risks, and a comprehensive assortment of recent sorbents for PFAS treatment by evaluating their mechanism. Res. Chem. Intermed. 2021, 47, 4879–4914. [Google Scholar] [CrossRef]
  17. Lei, X.; Lian, Q.; Zhang, X.; Karsili, T.K.; Holmes, W.; Chen, Y.; Zappi, M.E.; Gang, D.D. A review of PFAS adsorption from aqueous solutions: Current approaches, engineering applications, challenges, and opportunities. Environ. Pollut. 2023, 321, 121138. [Google Scholar] [CrossRef]
  18. Parker, B.A.; Kanalos, C.A.; Radniecki, T.S.; Massey Simonich, S.L.; Field, J.A. Evaluation of sorbents and matrix effects for treating heavy metals and per- and polyfluoroalkyl substances as co-contaminants in stormwater. Environ. Sci. Water Res. Technol. 2023, 9, 3281–3289. [Google Scholar] [CrossRef]
  19. Wei, Z.; Xu, T.; Zhao, D. Treatment of per- and polyfluoroalkyl substances in landfill leachate: Status, chemistry and prospects. Environ. Sci. Water Res. Technol. 2019, 5, 1814–1835. [Google Scholar] [CrossRef]
  20. Kabiri, S.; Monaghan, C.L.; Navarro, D.; McLaughlin, M.J. Hydrophobic interaction is the dominant mechanism of zwitterionic PFAS adsorption to carbon-based sorptive materials in water and soil. Environ. Sci. Water Res. Technol. 2024, 10, 420–430. [Google Scholar] [CrossRef]
  21. Guibal, E. Interactions of metal ions with chitosan-based sorbents: A review. Sep. Purif. Technol. 2004, 38, 43–74. [Google Scholar] [CrossRef]
  22. Wang, J.; Zhuang, S. Removal of various pollutants from water and wastewater by modified chitosan adsorbents. Crit. Rev. Environ. Sci. Technol. 2017, 47, 2331–2386. [Google Scholar] [CrossRef]
  23. Yu, Q.; Deng, S.; Yu, G. Selective removal of perfluorooctane sulfonate from aqueous solution using chitosan-based molecularly imprinted polymer adsorbents. Water Res. 2008, 42, 3089–3097. [Google Scholar] [CrossRef]
  24. Zhang, Q.; Deng, S.; Yu, G.; Huang, J. Removal of perfluorooctane sulfonate from aqueous solution by crosslinked chitosan beads: Sorption kinetics and uptake mechanism. Bioresour. Technol. 2011, 102, 2265–2271. [Google Scholar] [CrossRef]
  25. Jiao, Z.; Li, J.; Mo, L.; Liang, J.; Fan, H. A molecularly imprinted chitosan doped with carbon quantum dots for fluorometric determination of perfluorooctane sulfonate. Mikrochim. Acta 2018, 185, 473. [Google Scholar] [CrossRef]
  26. Sörengård, M.; Östblom, E.; Köhler, S.; Ahrens, L. Adsorption behavior of per- and polyfluoralkyl substances (PFASs) to 44 inorganic and organic sorbents and use of dyes as proxies for PFAS sorption. J. Environ. Chem. Eng. 2020, 8, 103744. [Google Scholar] [CrossRef]
  27. Zhang, X.; Wang, S.; Zhu, X.; Zhu, D.; Wang, W.; Wang, B.; Deng, S.; Yu, G. Efficient removal of per/polyfluoroalkyl substances from water using recyclable chitosan-coated covalent organic frameworks: Experimental and theoretical methods. Chemosphere 2024, 356, 141942. [Google Scholar] [CrossRef] [PubMed]
  28. Cagnetta, G.; Yin, Z.; Qiu, W.; Vakili, M. Mechanochemical Synthesis of Cross-Linked Chitosan and Its Application as Adsorbent for Removal of Per- and Polyfluoroalkyl Substances from Simulated Electroplating Wastewater. Materials 2024, 17, 3006. [Google Scholar] [CrossRef]
  29. Durner, W.; Iden, S.C.; von Unold, G. The integral suspension pressure method (ISP) for precise particle-size analysis by gravitational sedimentation. Water Resour. Res. 2017, 53, 33–48. [Google Scholar] [CrossRef]
  30. Kosaraju, S.L.; D’ath, L.; Lawrence, A. Preparation and characterisation of chitosan microspheres for antioxidant delivery. Carbohydr. Polym. 2006, 64, 163–167. [Google Scholar] [CrossRef]
  31. Paulino, A.T.; Simionato, J.I.; Garcia, J.C.; Nozaki, J. Characterization of chitosan and chitin produced from silkworm crysalides. Carbohydr. Polym. 2006, 64, 98–103. [Google Scholar] [CrossRef]
  32. Wan Ngah, W.S.; Hanafiah, M.A.K.M.; Yong, S.S. Adsorption of humic acid from aqueous solutions on crosslinked chitosan-epichlorohydrin beads: Kinetics and isotherm studies. Colloids Surf. B 2008, 65, 18–24. [Google Scholar] [CrossRef] [PubMed]
  33. Kamari, A.; Pulford, I.D.; Hargreaves, J.S. Chitosan as a potential amendment to remediate metal contaminated soil—A characterisation study. Colloids Surf. B 2011, 82, 71–80. [Google Scholar] [CrossRef]
  34. Rinki, K.; Dutta, P.K.; Hunt, A.J.; Macquarrie, D.J.; Clark, J.H. Chitosan Aerogels Exhibiting High Surface Area for Biomedical Application: Preparation, Characterization, and Antibacterial Study. Int. J. Polymer. Mater. 2011, 60, 988–999. [Google Scholar] [CrossRef]
  35. Vakili, M.; Rafatullah, M.; Salamatinia, B.; Ibrahim, M.H.; Abdullah, A.Z. Elimination of reactive blue 4 from aqueous solutions using 3-aminopropyl triethoxysilane modified chitosan beads. Carbohydr. Polym. 2015, 132, 89–96. [Google Scholar] [CrossRef] [PubMed]
  36. Guo, X.; Qu, L.; Tian, M.; Zhu, S.; Zhang, X.; Tang, X.; Sun, K. Chitosan/Graphene Oxide Composite as an Effective Adsorbent for Reactive Red Dye Removal. Water Environ. Res. 2016, 88, 579–588. [Google Scholar] [CrossRef] [PubMed]
  37. Reyna-Urrutiaa, V.A.; Mata-Harob, V.; Cauich-Rodrigueza, J.V.; Herrera-Kaoa, W.A.; Cervantes-Uc, J.M. Effect of two crosslinking methods on the physicochemical and biological properties of the collagen-chitosan scaffolds. Eur. Polym. J. 2019, 117, 424–433. [Google Scholar] [CrossRef]
  38. Hsien, T.-Y.; Rorrer, G.L. Effects of Acylation and Crosslinking on the Material Properties and Cadmium Ion Adsorption Capacity of Porous Chitosan Beads. Sep. Sci. Technol. 1995, 30, 2455–2475. [Google Scholar] [CrossRef]
  39. Du, Z.; Deng, S.; Bei, Y.; Huang, Q.; Wang, B.; Huang, J.; Yu, G. Adsorption behavior and mechanism of perfluorinated compounds on various adsorbents—A review. J. Hazard. Mater. 2014, 274, 443–454. [Google Scholar] [CrossRef]
  40. Gagliano, E.; Sgroi, M.; Falciglia, P.P.; Vagliasindi, F.G.A.; Roccaro, P. Removal of poly- and perfluoroalkyl substances (PFAS) from water by adsorption: Role of PFAS chain length, effect of organic matter and challenges in adsorbent regeneration. Water Res. 2020, 171, 115381. [Google Scholar] [CrossRef]
  41. Vu, C.T.; Wu, T. Recent progress in adsorptive removal of per- and poly-fluoroalkyl substances (PFAS) from water/wastewater. Crit. Rev. Environ. Sci. Technol. 2020, 52, 90–129. [Google Scholar] [CrossRef]
  42. Zhang, D.Q.; Zhang, W.L.; Liang, Y.N. Adsorption of perfluoroalkyl and polyfluoroalkyl substances (PFASs) from aqueous solution—A review. Sci. Total Environ. 2019, 694, 133606. [Google Scholar] [CrossRef] [PubMed]
Figure 1. Adsorption mechanism of PFAS on chitosan.
Applsci 14 11145 g001
Figure 2. Comparison of PFOS sorption capacity between molecular imprinted and non-imprinted chitosan at two different PFOS concentrations. The inset figure shows the error bars for the 0.01 mmol/L PFOS experiment. The error bars show the standard deviation (n = 3). 72 h adsorption time, 100 mg adsorption material, 100 mL solution.
Applsci 14 11145 g002
Figure 3. Scanning electron microscopy (SEM) image of chitosan polymer: (a) before ECH cross-linking, (b) after cross-linking but without PFOS-based molecular imprinting (MIP), and (c) after cross-linking and with MIP. The Supplementary Materials contains the pictures with higher resolution.
Applsci 14 11145 g003
Figure 4. Influence of epichlorohydrin (ECH) concentration in the cross-linking step on the loading q of PFOS on the adsorber (dry mass). The data is also shown in Table S7. The error bars represent the standard deviation from three adsorption experiments. The asterisk above the line linking the two data sets shows significant differences between those according to Student’s t-test (p < 0.05). 72 h adsorption time, 100 mg adsorption material, 100 mL solution.
Applsci 14 11145 g004
Figure 5. Sorption Isotherms of PFOS on chitosan and results of modeling according to Freundlich and Langmuir models on ECH1. The error bars show the standard deviation from 3 CIC measurements per adsorption experiment. If no error bars are shown, they are smaller than the symbols. 108 h adsorption time, 100 mg adsorption material, 100 mL solution.
Applsci 14 11145 g005
Figure 6. Scanning electron microscopy (SEM) image of (a) milled chitosan ECH1 and (b) milled GAC. The Supplementary Materials contains these pictures and other SEM images with higher resolution.
Applsci 14 11145 g006
Figure 7. (a) Dependence of the eluent volume on the PFOS effluent concentration (filled symbols; c0(PFOS) = 83 mmol/L) and (b) dependence of the eluent volume on the PFOS loading q on the adsorber material (dry mass) as calculated from the data shown in (a) (hollow symbols). The gap in data points between 600 and 900 mL was due to the weekend, but the effluent was continuously pumped and collected the whole time.
Applsci 14 11145 g007
Table 1. BET surface area for the adsorption materials used in rapid small-scale column test. For experimental conditions, see Supporting Information.
MaterialGAC (C2)GAC Milled (C3)ECH1 String (C4)ECH1 Milled (C5)
BET area [m2/g]1291127294.13.4
Disclaimer/Publisher’s Note: The statements, opinions and data contained in all publications are solely those of the individual author(s) and contributor(s) and not of MDPI and/or the editor(s). MDPI and/or the editor(s) disclaim responsibility for any injury to people or property resulting from any ideas, methods, instructions or products referred to in the content.

