Article

Modeling and Parameter Calibration of Morchella Seed Based on Discrete Element Method

1
College of Mechanical and Electronic Engineering, Tarim University, Alar 843300, China
2
Xinjiang Production and Construction Corps Key Laboratory of Utilization and Equipment of Special Agricultural and Forestry Products in Southern Xinjiang, Alar 843300, China
3
Modern Agricultural Engineering Key Laboratory, Universities of Education Department of Xinjiang Uygur Autonomous Region, Tarim University, Alar 843300, China
*
Author to whom correspondence should be addressed.
Appl. Sci. 2024, 14(23), 11134; https://doi.org/10.3390/app142311134
Submission received: 15 October 2024 / Revised: 22 November 2024 / Accepted: 27 November 2024 / Published: 29 November 2024

Abstract

:
Studies on the discrete element method (DEM) parameters of Morchella seeds are limited due to their high moisture content and weak inter-particle adhesion. However, accurate DEM simulations are crucial for the design of agricultural machinery. Physical experiments were conducted to measure the fundamental properties of Morchella seeds, and a DEM model was established using the Hertz–Mindlin with JKR contact model. Subsequently, Plackett–Burman, steepest ascent, and Box–Behnken experiments were employed. They were used to analyze the significance of key contact parameters. A second-order polynomial regression model for the repose angle was developed, and significant contact parameters were optimized and calibrated. The results showed that the seed-to-seed rolling friction coefficient, seed-to-seed surface energy, and seed-to-steel rolling friction coefficient significantly impacted the repose angle. The simulation results using the optimized contact parameters closely matched the repose angle measured in physical experiments. The relative error was only 0.16%, validating the accuracy of the parameter calibration.

1. Introduction

Morchella (morel mushrooms) holds significant economic value, primarily due to its rich nutritional content, remarkable medicinal properties, and strong market demand. As a rare edible fungus, Morchella is widely used in high-end cuisine, health products, and pharmaceuticals. Its abundance of proteins, amino acids, vitamins, and minerals gives it a prominent position in the health food market. Moreover, advances in artificial cultivation techniques and the growing demand in international markets have created substantial economic benefits and promising commercial prospects for the Morchella industry. Known for its unique flavor and rich nutrients, Morchella is recognized globally as a rare edible fungus [1]. With the advent and continuous innovation of exogenous nutrient bag technology [2], the cultivation area of Morchella in China has rapidly expanded, making it one of the most popular cultivated fungi [3,4]. China has now become the world’s largest outdoor cultivation base for Morchella [5]. Currently, Morchella sowing is mainly performed manually, highlighting the importance of developing intelligent machinery specifically designed for Morchella sowing to meet the growing demand.
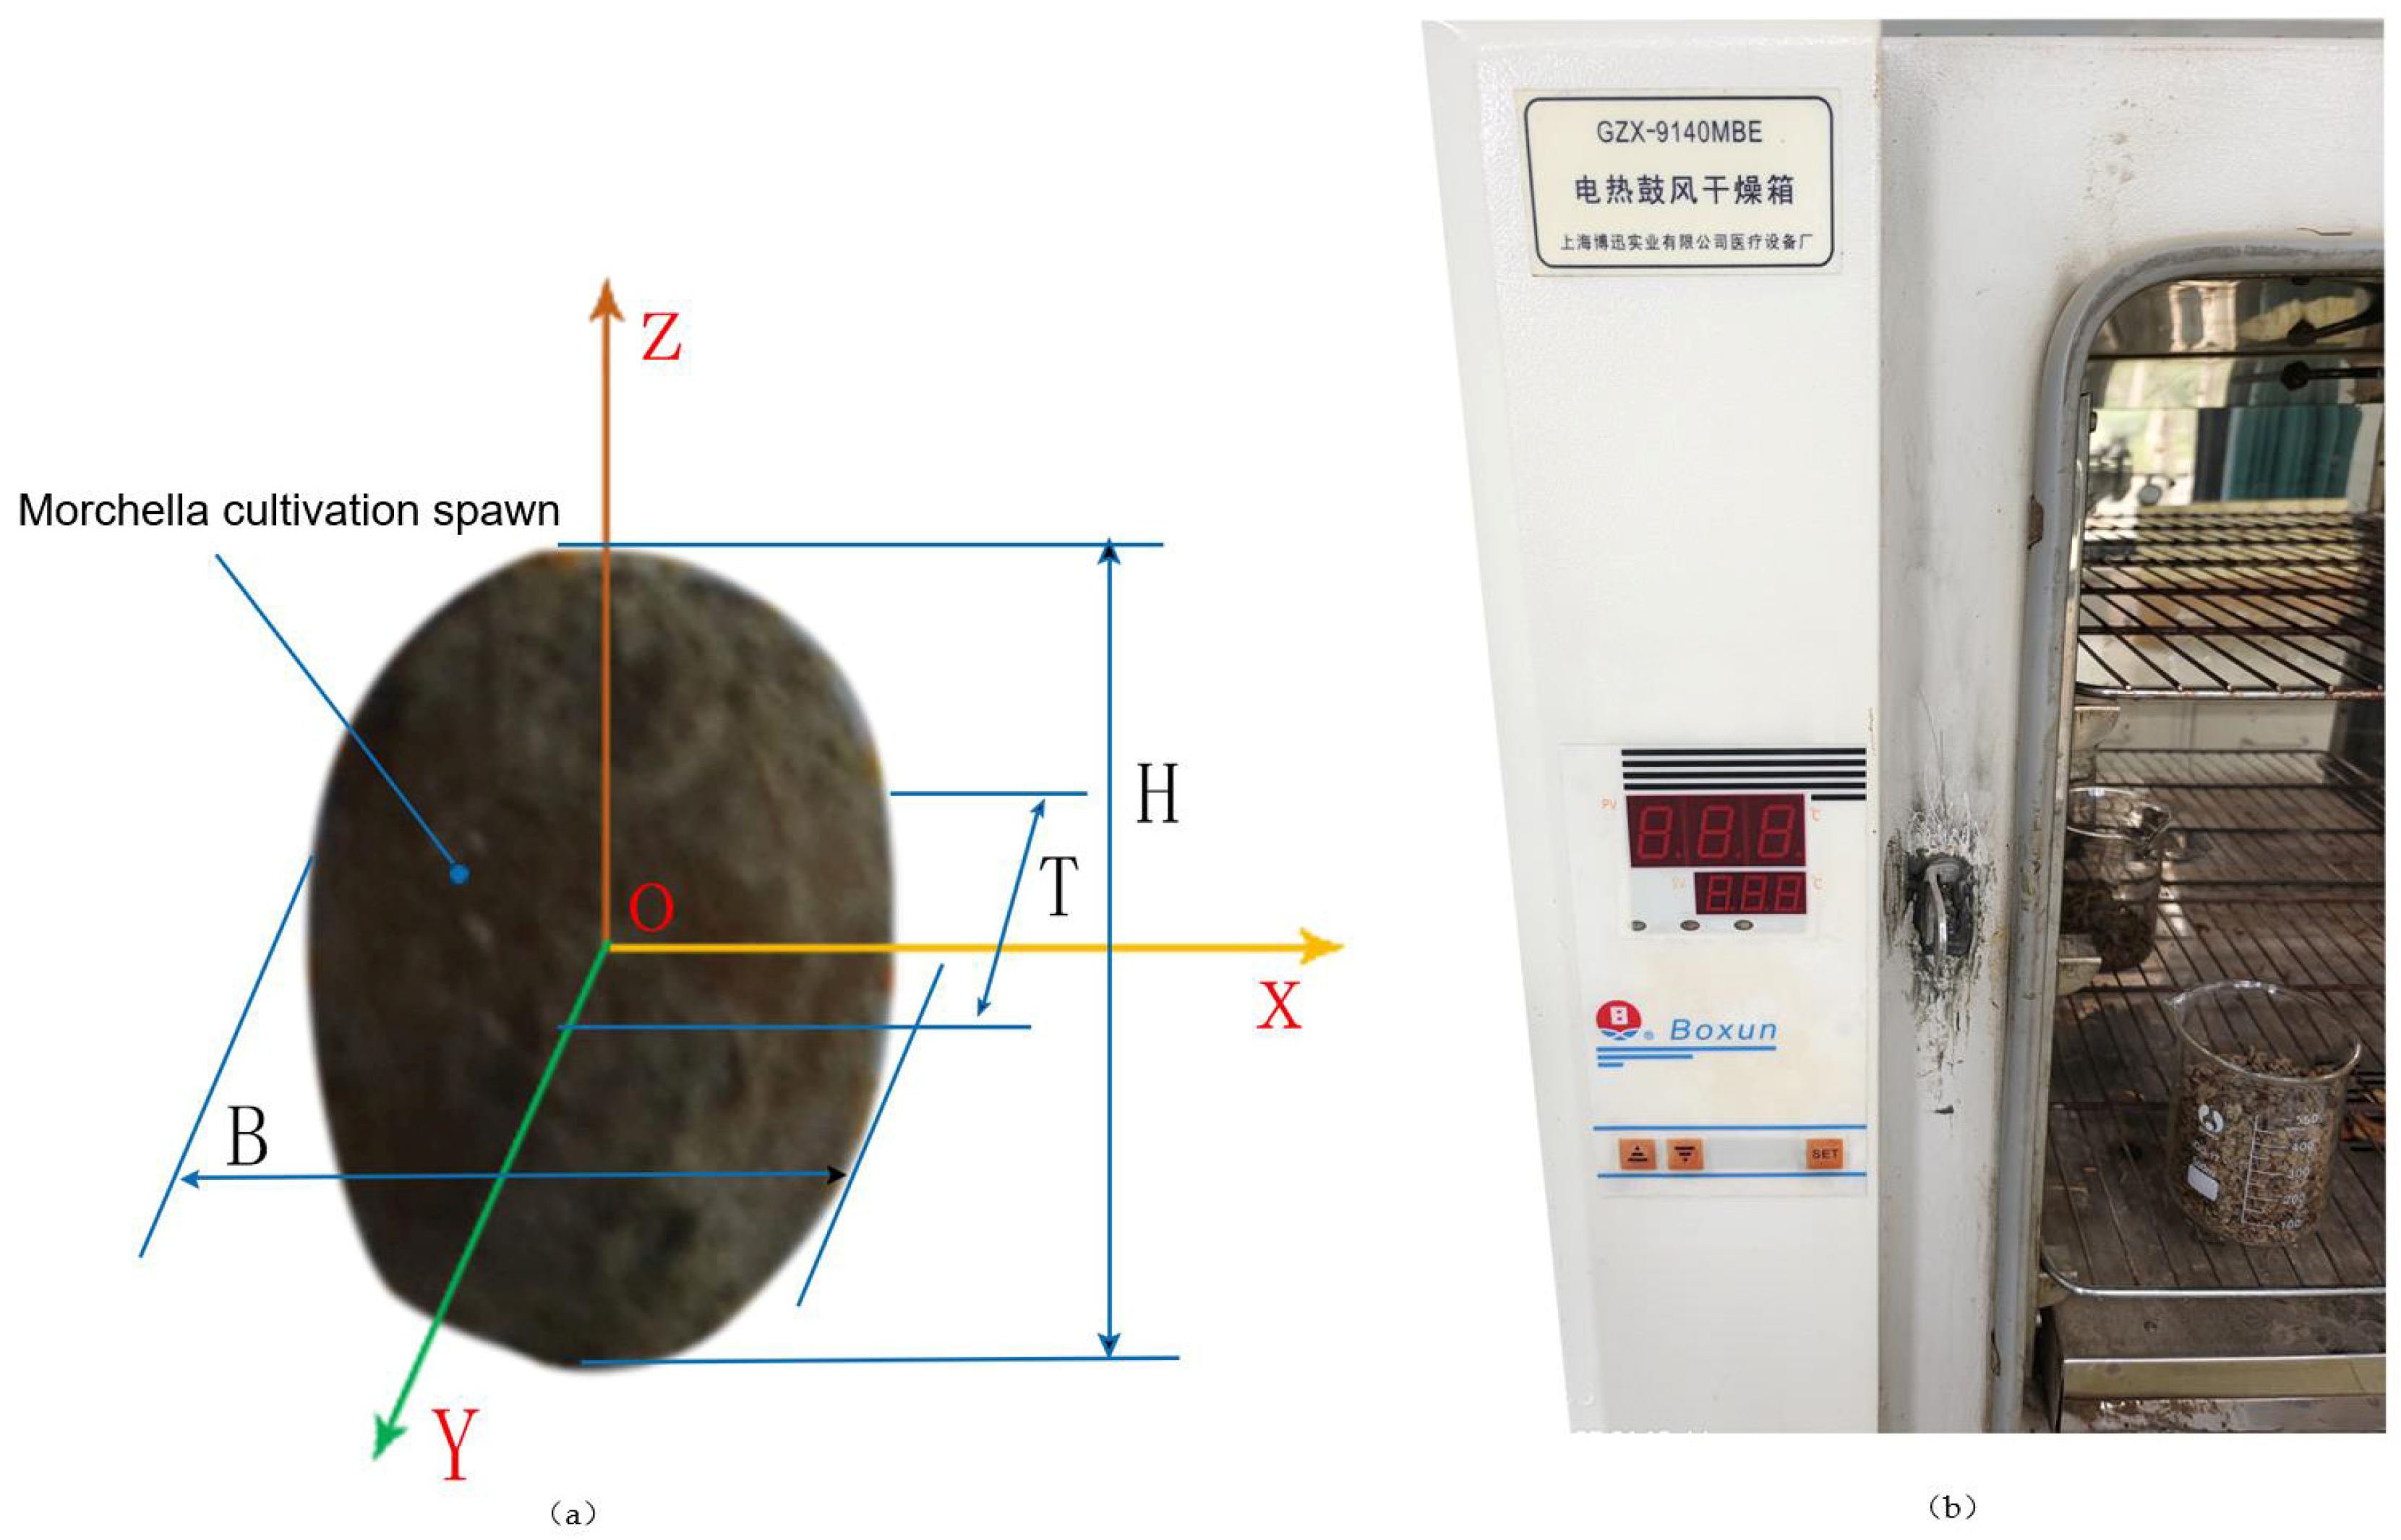
Morchella seeds, as a type of low-temperature fermentation fungus, exhibit cohesive particle behavior due to moisture and particle stickiness, forming agglomerated structures, which are characteristic of bulk materials. Currently, there is limited research on the contact parameters of cohesive particulate materials. With advancements in computer technology, the discrete element method (DEM) has been widely applied in agricultural equipment research [6,7]. DEM is a method for analyzing the contact interactions between particles and between particles and boundaries, as well as their different physical and mechanical properties [8]. Since DEM simulation was first applied to material parameter calibration, it has been introduced by many scholars into various particle calibration models, providing a valuable reference for the design and optimization of seeding machinery [9]. This approach effectively enhances production efficiency and reduces costs. In the production and processing of Morchella, accurately calibrating the DEM parameters of Morchella seeds is of great significance. Through DEM simulation, characteristics such as seed flowability and piling behavior can be optimized, which helps improve the efficiency of equipment design, streamline production processes, and reduce experimental costs and time. Parameter calibration not only enhances simulation accuracy but also provides data support for automated production and planting systems, promoting the scale and modernization of the Morchella industry.
In countries such as the United States and France, many scholars have conducted calibration studies on DEM parameters for various agricultural materials. Adilet et al. [10] and his team used a rotating drum apparatus to calibrate the particle-to-particle and particle-to-material interactions of wheat seeds, successfully measuring static and rolling friction coefficients, which were effectively applied in DEM simulations of wheat. However, this method has limitations when applied to the calibration of Morchella seeds. The morphology, softness, and adhesiveness of Morchella spores are significantly different from those of wheat seeds, making it difficult for the rotating drum to accurately capture their interactions. Additionally, Morchella cultivation requires strict control over environmental factors such as temperature and humidity, which the rotating drum cannot accommodate. Benjamin et al. [11] and his team developed a near-infrared reflectance spectroscopy (NIRS) calibration method to estimate fiber content in rapeseed, revealing significant genetic differences across genotypes. While this NIRS-based calibration method succeeded in measuring fiber content, it may not be suitable for Morchella seed calibration. Firstly, the physical properties of Morchella seeds, including their shape, adhesiveness, and softness, differ greatly from rapeseed, making it challenging for NIRS to capture the complex interaction characteristics. Secondly, the dynamic environmental conditions required for Morchella growth cannot be adequately assessed by NIRS calibration, making it difficult to reflect its actual growth and interaction dynamics. Jan et al. [12] and his team proposed the differential evolution (DE) algorithm, which improved the calibration accuracy of soil models. However, its application to Morchella seed calibration may be limited. The growth of Morchella involves complex biological traits and dynamic environmental conditions, while DE algorithms are better suited for optimizing continuous physical parameters and are less effective in handling multivariable biological systems and environmental fluctuations. On the other hand, Salavat Mudarisov et al. [13] and his team’s Hertz–Mindlin with JKR model calibration method proved promising for Morchella seed calibration. This method accurately describes the adhesion and contact behavior between seeds and substrate, while optimizing substrate particle size to ensure aeration and drainage, better simulating the growth environment of Morchella.
Domestic scholars have proposed a “virtual calibration” method using the DEM to address the challenge of timely and accurate acquisition of contact parameters for small cohesive particles with high moisture content. Yu et al. and Jun et al. [14,15], among others, used DEM to study the interactions between key components of seeders and seeds, providing valuable insights for the calibration of Morchella seeds. Firstly, their research emphasized the mechanical properties during the contact process between mechanical components and seeds, offering a reference for modeling the movement and interaction behavior of Morchella seeds within the substrate. Secondly, the precise seed positioning and seeding control strategies in seeder design can help optimize the distribution and nutrient absorption of Morchella seeds in the substrate. By applying similar DEM techniques, it is possible to better simulate the complex interactions between Morchella seeds and the substrate. The JKR (Johnson–Kendall–Roberts) sphere adhesion model proposed by Wang et al., Yi et al. [16,17], and others has been widely applied in DEM simulations and has successfully completed material calibration experiments. This model, which accounts for the adhesive forces and contact behaviors between particles, is particularly suited for materials with high surface energy and adhesion properties. This method provides important insights for the calibration of Morchella seeds. Firstly, the JKR model can accurately describe the adhesive behavior between particles, which is similar to the adhesive interactions between Morchella seeds and the substrate during cultivation. Therefore, the application of this model can help precisely simulate the complex contact processes between Morchella seeds and the substrate. Secondly, the model allows for the study of the impact of particle surface energy on their mechanical behavior, which is crucial for optimizing the growth conditions of Morchella seeds in various substrates. By adjusting the contact parameters and surface characteristics between particles, the accuracy of Morchella seed calibration can be improved, enabling a more accurate simulation of its growth behavior in real environments. Liu et al. [18], Wang et al. [19], Zhao et al. [20], Yuan et al. [21], and Bai et al. [22] conducted DEM parameter calibration studies on grains, soil, and organic fertilizers, providing references for the calibration of Morchella seeds. Their research methods can be used to measure the physical parameters of Morchella seeds and simulate their interactions with the substrate, particularly in terms of aeration and drainage, which are key for optimizing the growth environment of Morchella seeds. In Lin et al. and Luo et al. [23,24], the rolling friction coefficient of earthworm casting particles was studied at different moisture contents, indicating that moisture content has a significant impact on the rolling friction coefficient of particles. This has important implications for the calibration of Morchella seeds. Changes in moisture content may similarly affect the adhesiveness and flowability of Morchella seeds in the substrate, making it essential to consider the mechanical behavior and flow characteristics under different humidity conditions during the calibration process to study simulations that more accurately reflect the actual growth environment.
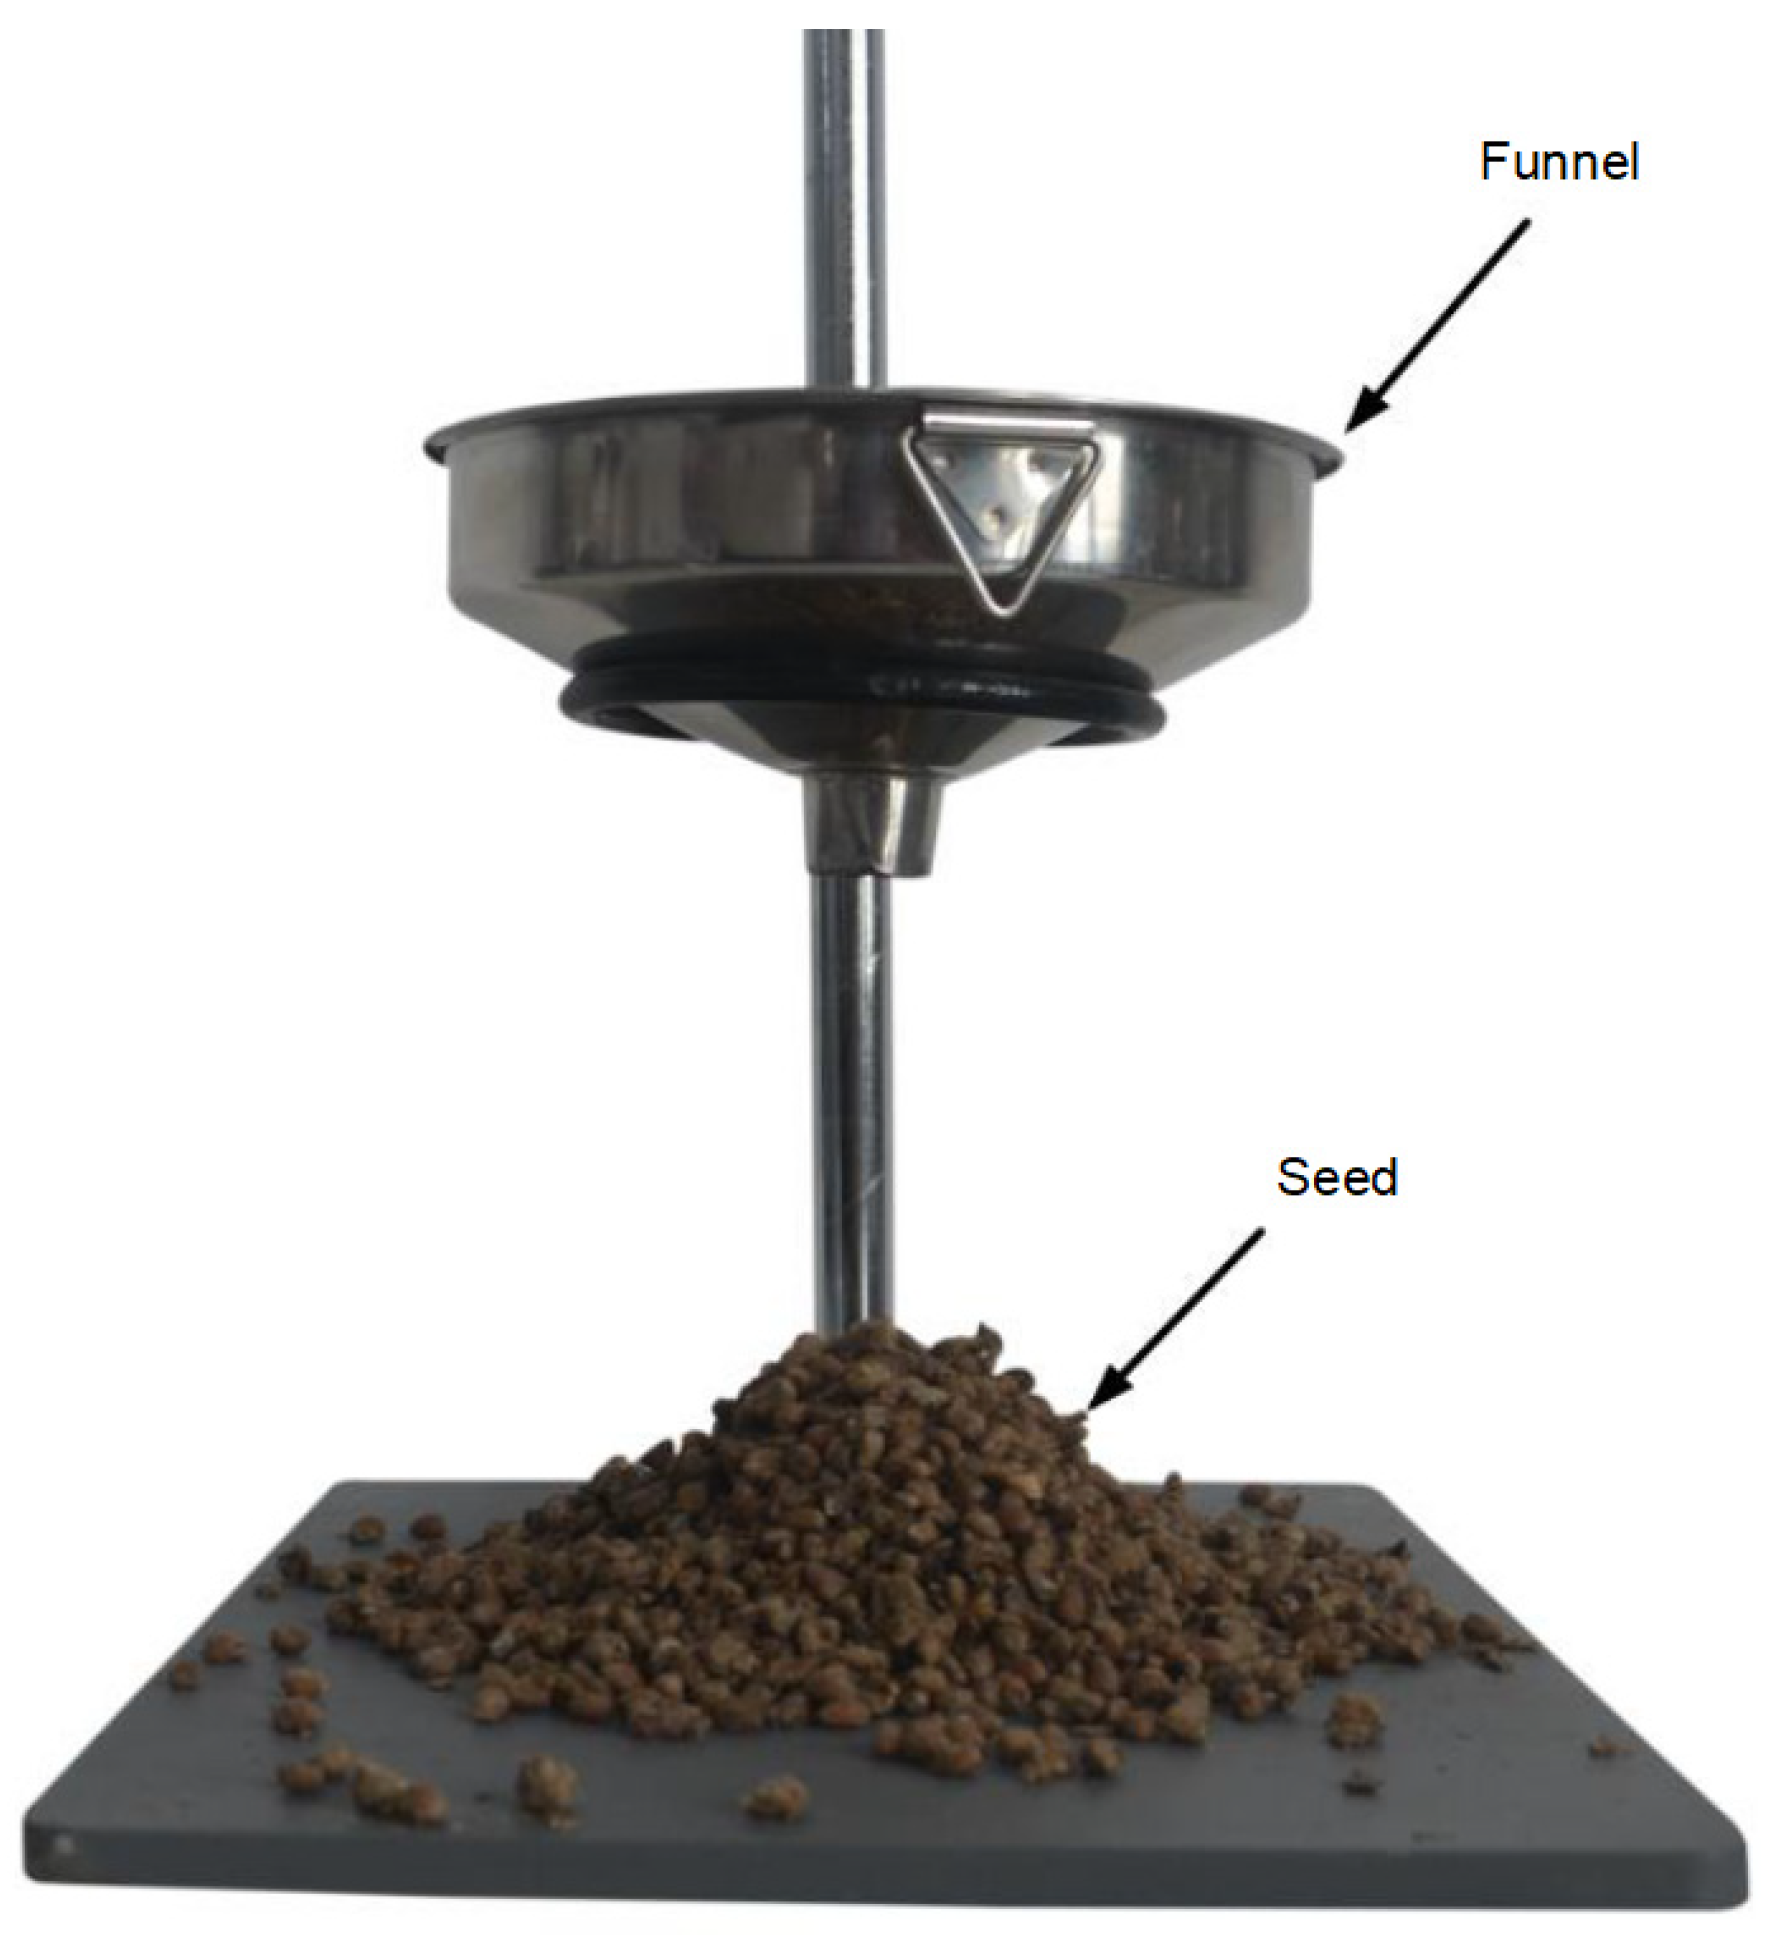
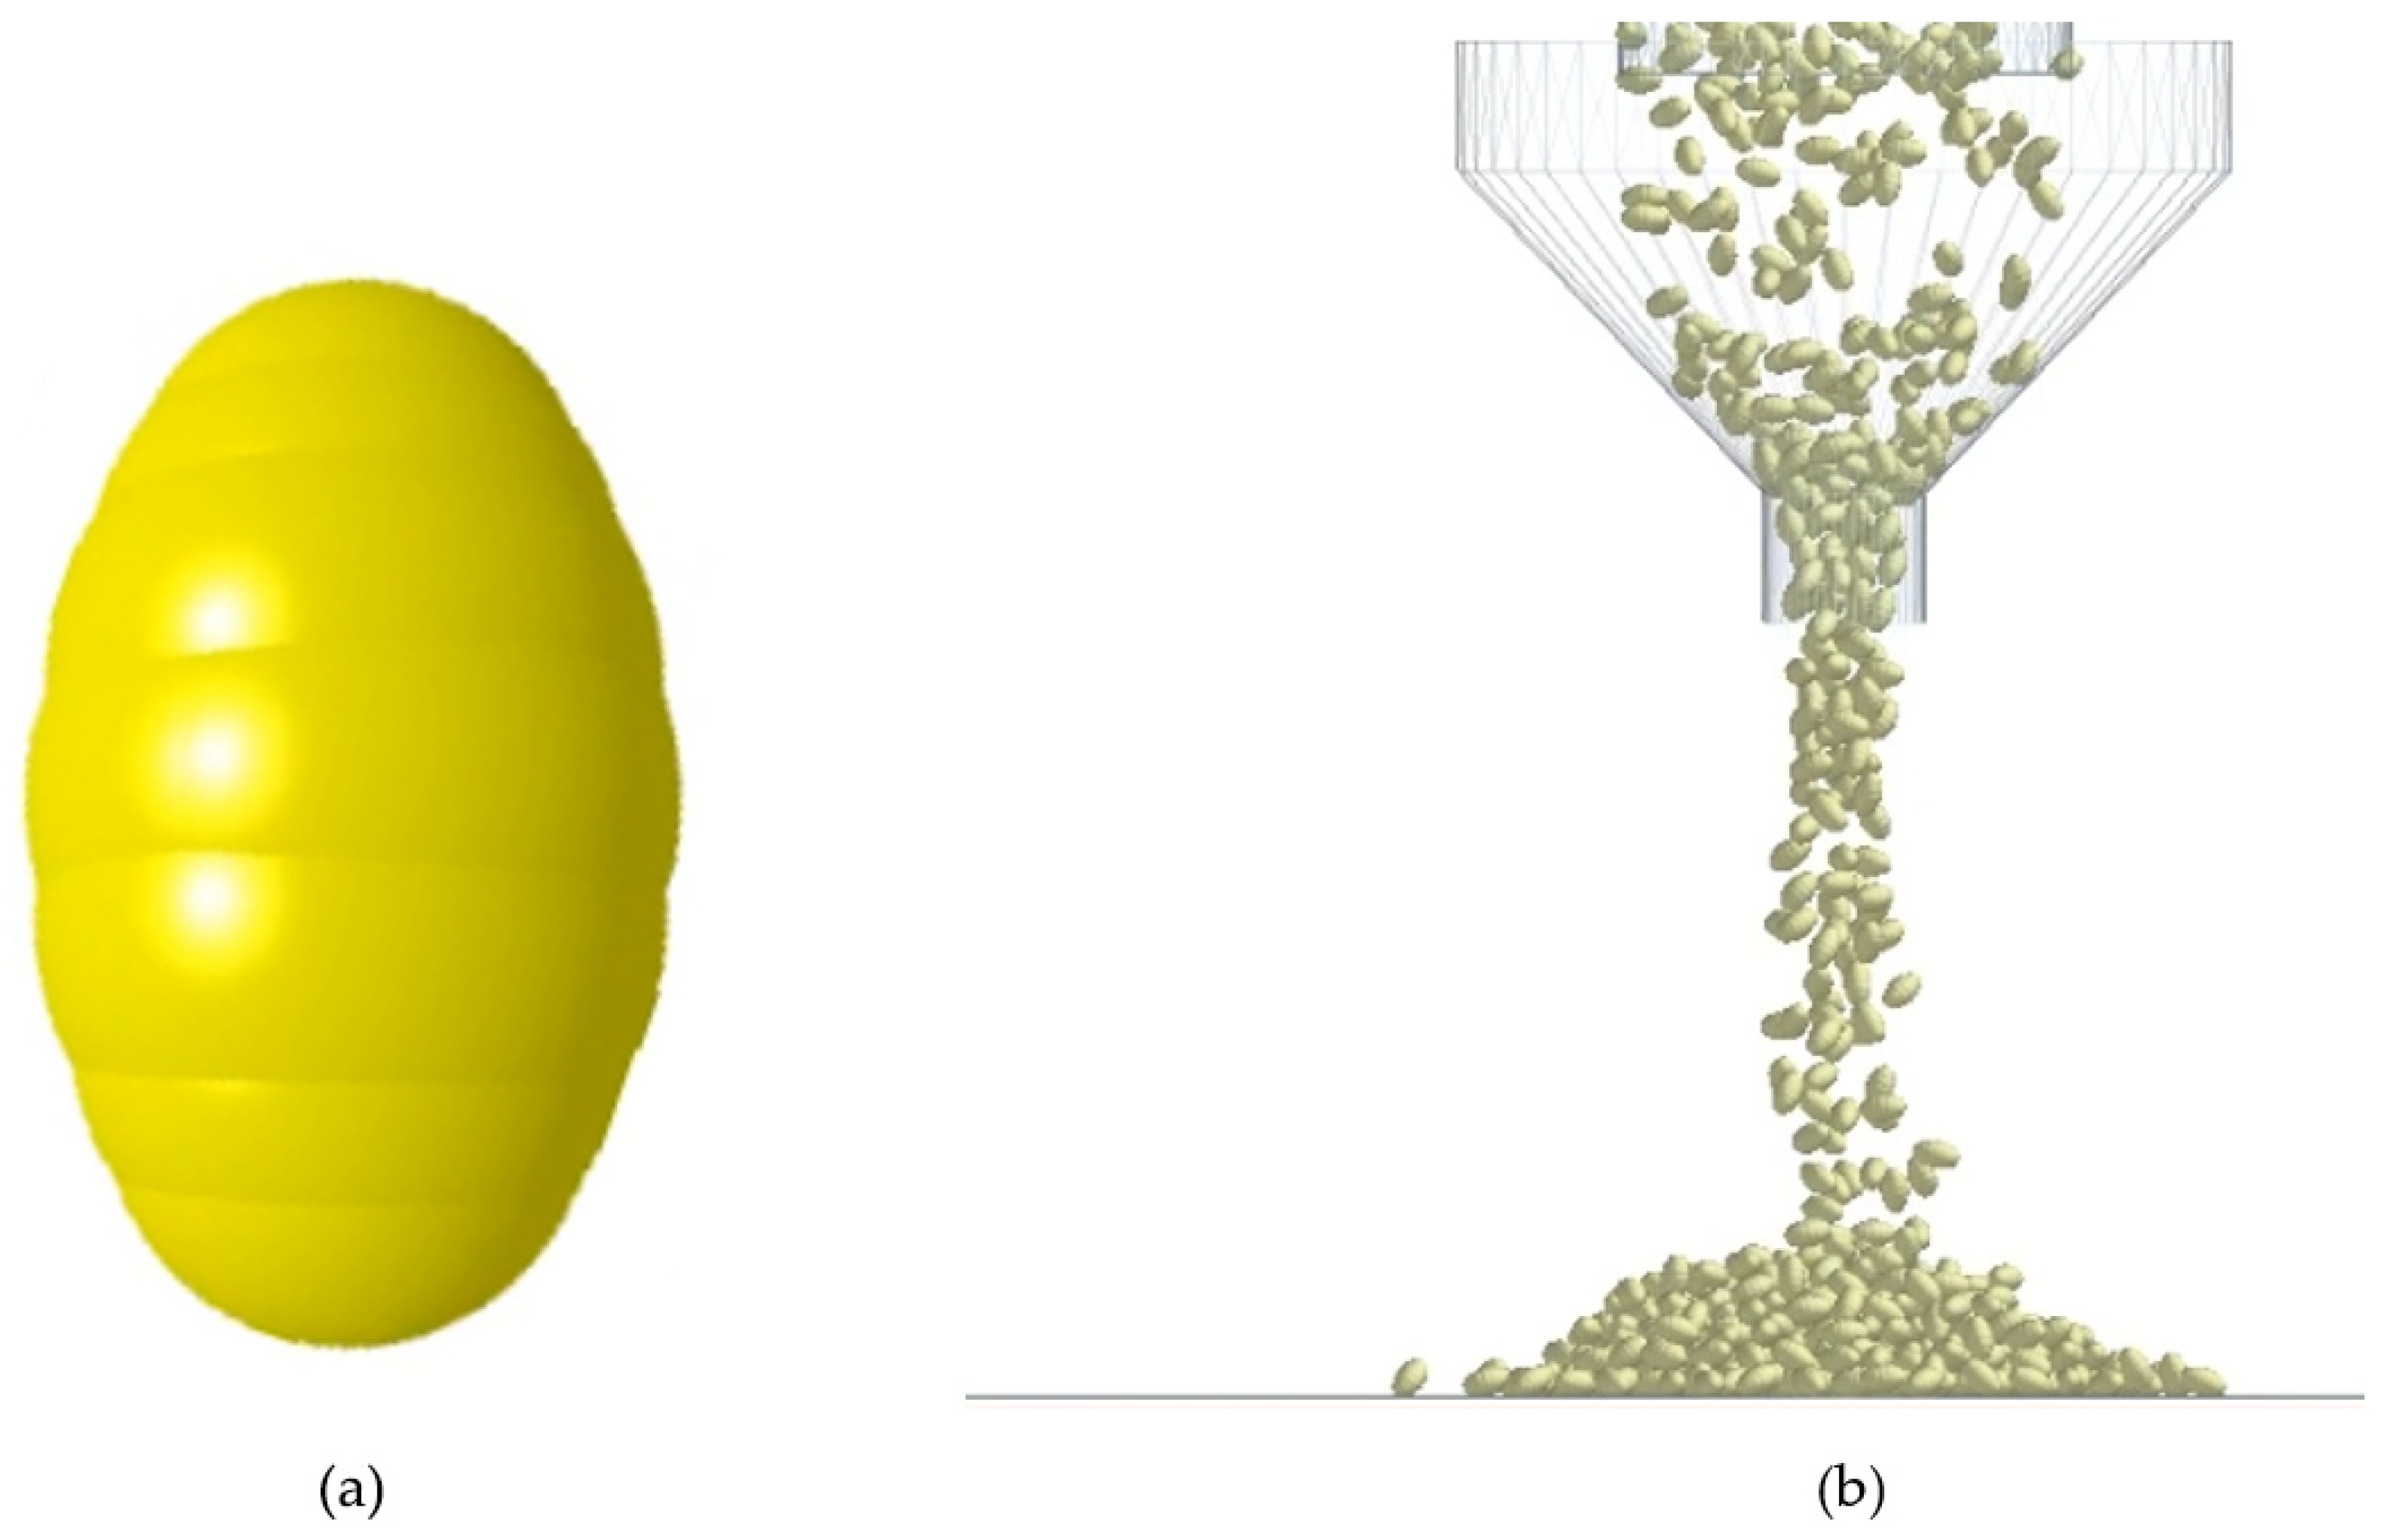
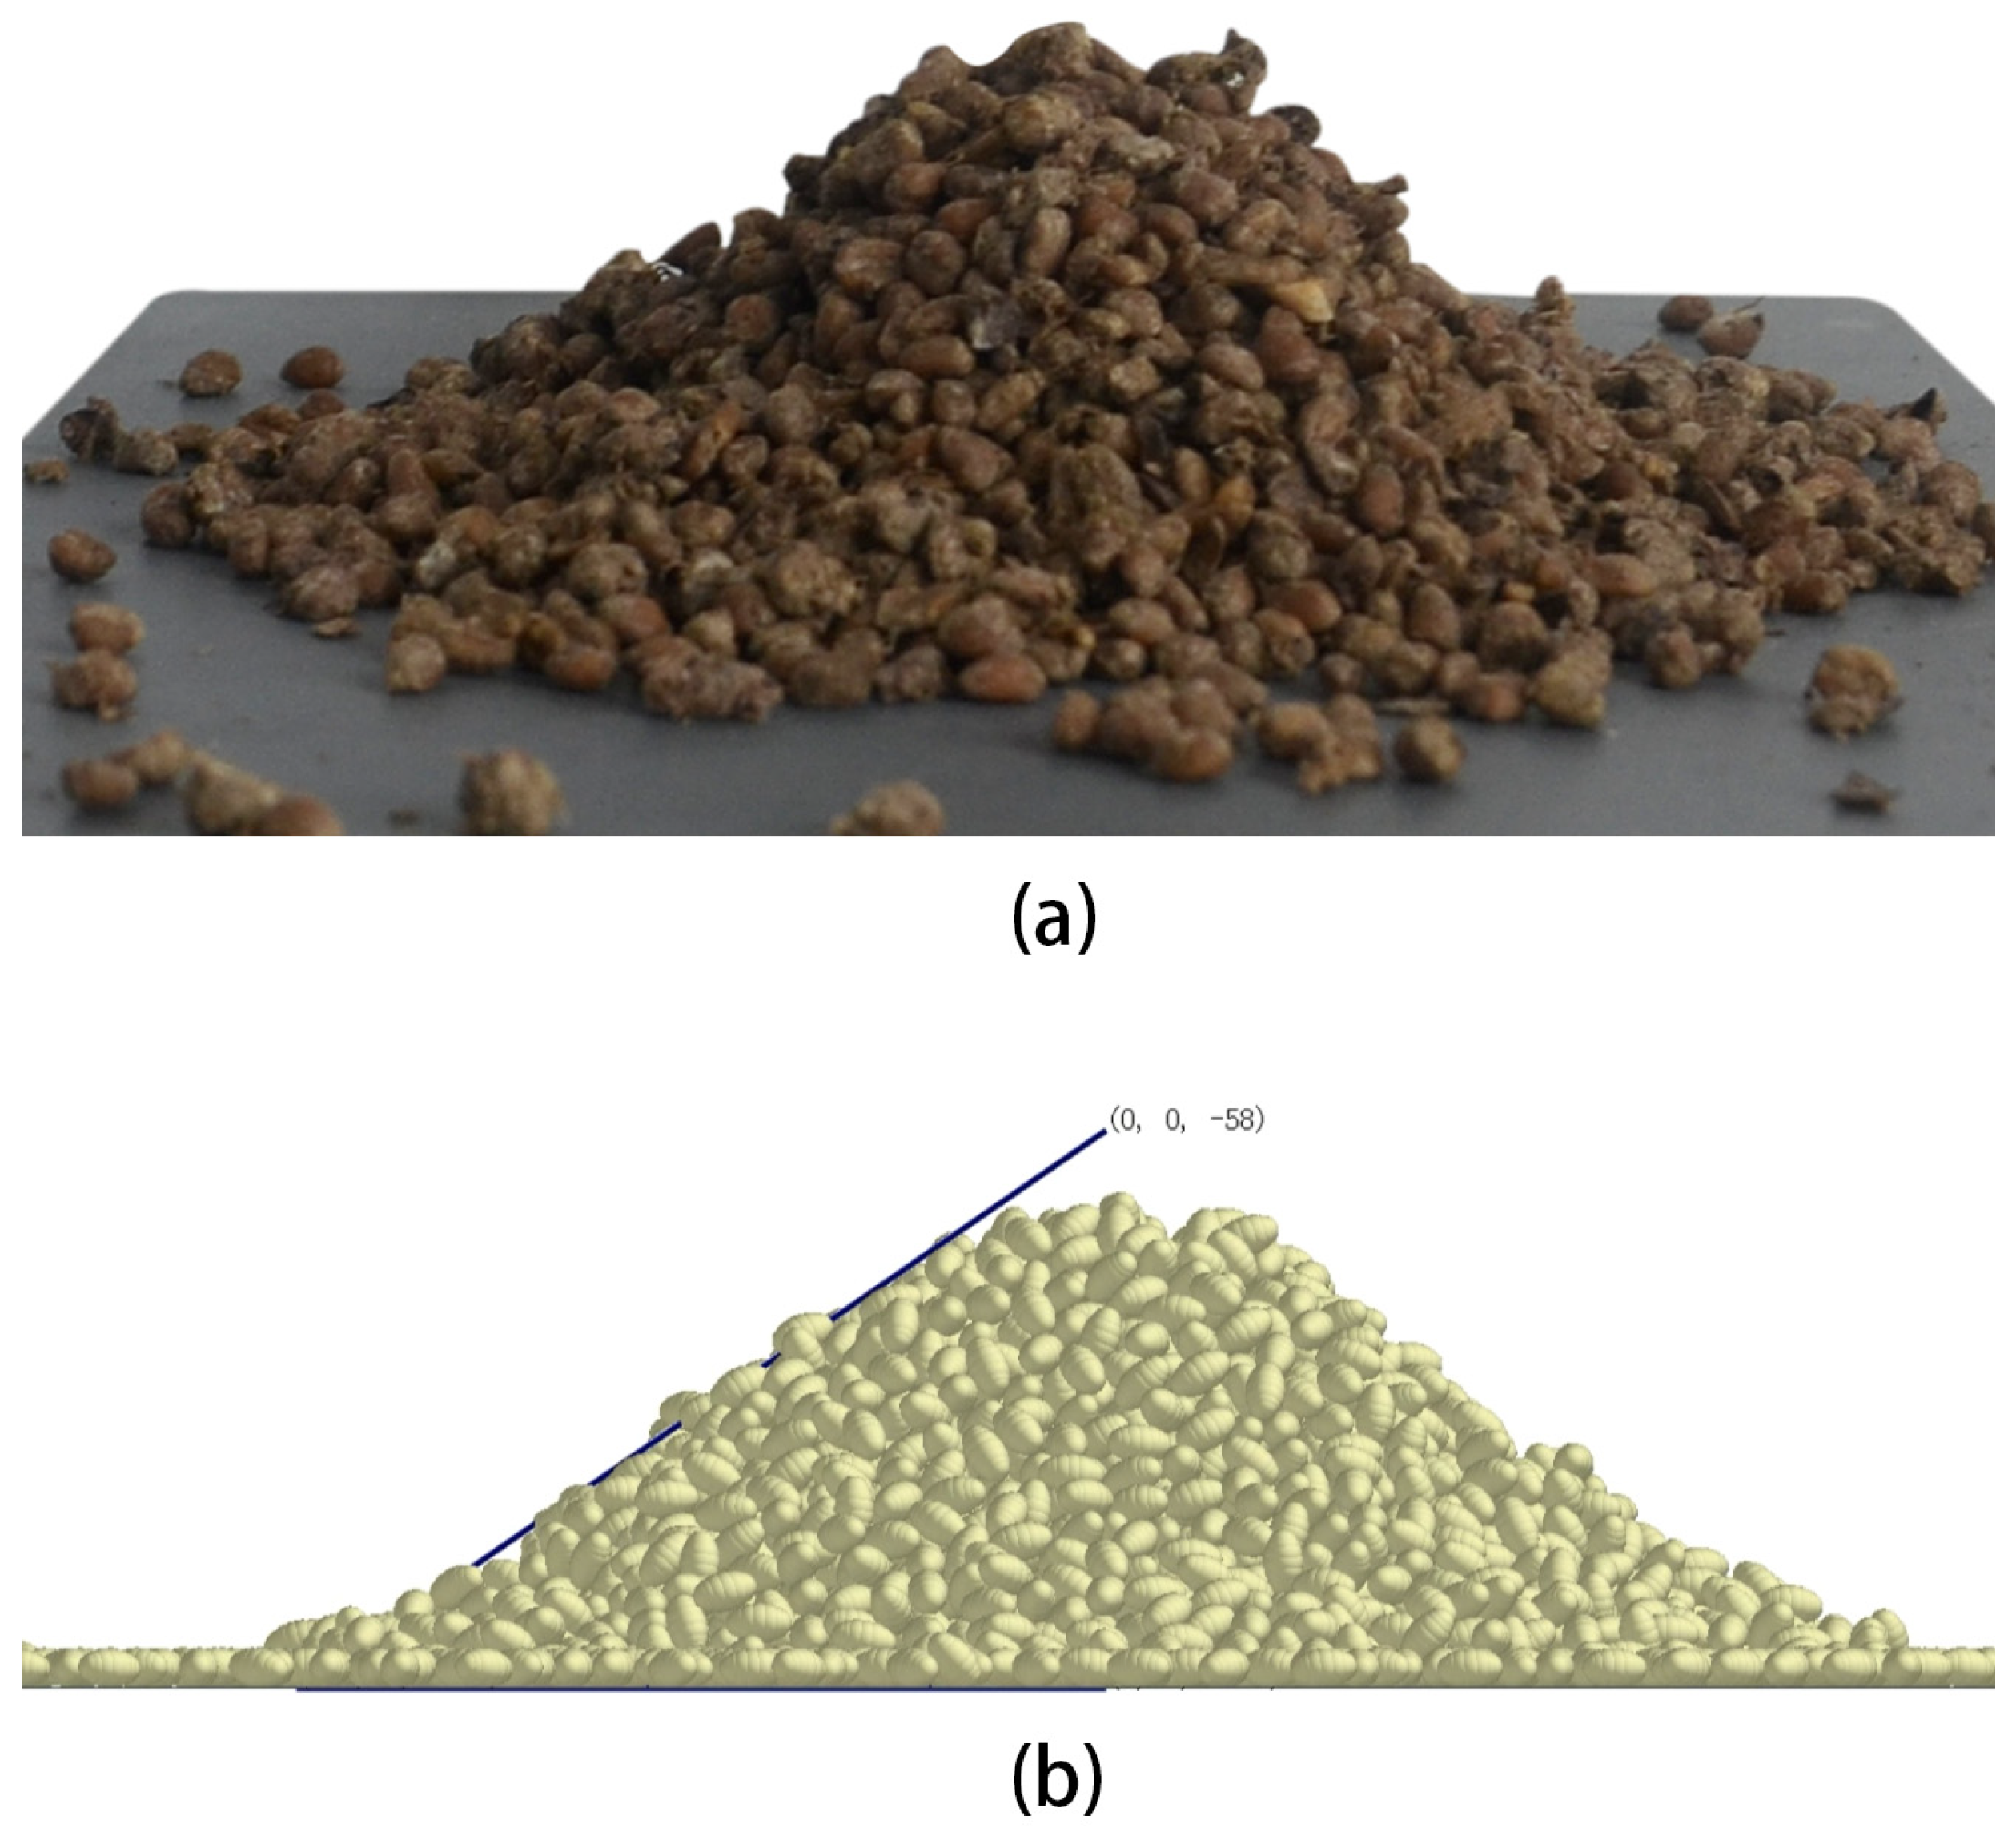
In summary, this study aims to calibrate the contact parameters of Morchella seeds as cohesive particulate materials under high moisture content. By measuring the repose angle of the seeds and optimizing the parameters using the DEM simulation, a regression model was established to describe the relationship between the contact parameters and the repose angle using experimental design methods. The optimal parameter combination was then obtained. Finally, by comparing the simulation results with the physical experimental values in order to verify the reliability of the calibration parameters, this study provides fundamental data support for the design and simulation optimization of key components in Morchella seeding machinery.

2. Materials and Methods

2.1. Agronomic Requirements for Cultivating Morchella Seeds

The agronomic requirements for cultivating Morchella seeds involve several key steps. First, wheat and corn grains are selected as the primary substrate or nutrient source. These grains must be thoroughly cleaned and sterilized to provide an environment rich in carbohydrates and essential nutrients. During inoculation, the spores must be introduced aseptically into the substrate to ensure proper attachment and nutrient absorption. Under optimal temperature and humidity conditions, the spores begin to germinate, forming mycelium that quickly spreads through the substrate, creating a mycelial network. As the mycelium grows, it is critical to strictly control environmental factors, including temperature, humidity, and oxygen supply, to support the healthy development of the mycelial clumps. Finally, under favorable conditions, the mycelium develops into fruiting bodies, completing the lifecycle from spores to mature Morchella mushrooms. This structured process ensures the successful cultivation of Morchella and highlights the importance of maintaining precise environmental conditions throughout the growth stages.

2.2. Experimental Materials

The Morchella seeds used in this experiment were sourced from the Morchella Cultivation Laboratory at Tarim University. The physical parameters tested included both physical properties (such as triaxial dimensions, moisture content, and density) and mechanical properties (such as Poisson’s ratio, elastic modulus, and shear modulus). A random sample of 50 seeds was selected and placed in a three-dimensional coordinate system, where length, width, and thickness were defined along the respective axes. The triaxial dimensions were measured using a digital caliper with a precision of 0.01 mm. Seed density was determined using an electronic balance with 0.001 g precision and a graduated cylinder with 0.1 mL accuracy [25]. The moisture content was measured following the standard procedure outlined in the “Testing Rules for Crop Seeds—Moisture Determination (GB/T 3543.6-1995)” [26], using a low-temperature drying method at 103 °C for 8 h [27]. The moisture content was calculated using a thermostatic drying oven and beakers. Each parameter was measured 10 times, and the average values were recorded. The detailed results are presented in Table 1 and Figure 1.

2.3. Experiment on Determination of Repose Angle

The repose angle of Morchella seeds was measured using the classic funnel method [28], with the experimental setup shown in Figure 2. To ensure the seeds were not influenced by external forces during free fall, a funnel with an upper diameter of 140 mm, a lower diameter of 20 mm, a lower tube length of 20 mm, and a total height of 70 mm was used for precise seed piling experiments. The distance between the funnel’s lower opening and the collection plate was set at 120 mm, ensuring that the seeds fell freely under the influence of gravity, forming a stable conical pile. During the experiment, a predetermined volume of Morchella seed samples was released through the funnel, and the geometric features of the resulting cone were recorded to calculate the repose angle. The experimental setup included a handle, support rod, precision millimeter ruler, collection plate, beaker, funnel, stirring rod, and funnel clamp, ensuring standardized operation and measurement precision throughout the experiment. To minimize experimental errors, each sample was measured 10 times, and the average repose angle was calculated using the following formula:
φ = a r c t a n   H R
where H is the height of the species cone (mm) and R is the radius of the horizontal base of the species cone (mm). The average value was 37.63° after 10 tests.

2.4. Friction Coefficient

The static friction coefficient of Morchella seeds was measured using the inclined plane contact method [29], which defines the coefficient as the ratio of maximum static friction force to the normal force exerted on the contact surface. The roughness and moisture content of the seed surface are considered the primary factors affecting the static friction coefficient. The experimental setup is shown in Figure 3, with a test material of an inclined steel plate measuring 300 mm × 110 mm × 3 mm. To determine the sliding friction coefficient between Morchella seeds and the steel plate, the seed samples were evenly distributed on transparent adhesive tape to ensure proper contact between the seed surface and the steel plate. During the test, the right end of the inclined plane was gradually raised until the Morchella seed samples began to exhibit signs of sliding. At this point, the elevation of the inclined plane was stopped. A precision level was used to record the inclination angle of the plane, and photographs were taken to ensure the accuracy and reproducibility of the data.
f = tan θ
where f is the coefficient of friction; θ is the inclination of the slope.

2.5. Poisson’s Ratio

Poisson’s ratio is one of the fundamental mechanical characteristics of materials [30], used to describe the relationship between lateral and longitudinal strain under stress. In this study, a texture analyzer (Food Technology Corporation, Sterling, VA, USA) with a cylindrical probe was employed to conduct compression tests on Morchella seeds to measure their Poisson ratio. Specifically, during the compression process, the analyzer recorded the absolute value of the ratio between the lateral strain caused by longitudinal stress and the corresponding longitudinal strain within the proportional limit [31]. This method allows for an accurate representation of the deformation behavior of Morchella seeds under external force, ensuring the measurement of Poisson’s ratio with high precision and repeatability. The calculation is given by Equation (3).
μ = ε x ε y = T / T B / B
where μ is Poisson’s ratio. εx is the strain in the direction of seed width. εy is the strain in the direction of seed thickness. T is the deformation in the direction of seed width, mm. T is the width before seed compression, mm. B is the deformation in the direction of seed thickness, mm. B is the thickness before seed compression, mm.
In this experiment, a texture analyzer was used to measure the Poisson’s ratio of Morchella seeds. The load range was set from 0 to 1000 N, and a cylindrical probe with a diameter of 50 mm was selected to match the seed size. The single compression deformation program was chosen for operation on the computer. Before compression, the probe was zeroed and then applied compression along the seed’s thickness. The initial load force was set at 1.5 N, with a loading speed of 60 mm/min, and the compression distance was 50% of the sample’s height.
After compression, a digital caliper with 0.01 mm precision was used to measure the width and thickness of the compressed seeds. The experiment was repeated 5 times, and the average value was taken as the final measurement result. The data are shown in Figure 4, and the Poisson ratio of the Morchella seeds was calculated to be 0.34 using Equation (3).

2.6. Modulus of Elasticity

The elastic modulus of Morchella seeds was determined using a texture analyzer in a compression test [32]. The elastic modulus measurement program was selected, and the compression was applied along the seed’s thickness. The loading speed was set at 10 mm/min. After the loading was completed, the software automatically recorded the displacement and load data. Each sample was tested 10 times, and the average value was taken as the final result to ensure the precision and reliability of the data.
E = F / s d B / B
where E is the modulus of elasticity (Pa), F is the loading force (N), s is the contact area (m2), dB is the amount of deformation (mm), B is the sample height (mm).

2.7. Shear Modulus

Shear modulus is one of the crucial parameters in seed simulation [33], as the seeds are subjected to shear forces when in contact with the walls of the seeding machine. The shear modulus of Morchella seeds can be calculated using Formula (5), allowing for precise simulation of their mechanical behavior during the contact process. This provides reliable parameter support for subsequent simulations.
G = E 2   ( 1 + μ ) °
where G is the shear modulus (Pa) of the seeds.

2.8. Modeling and Simulation

Based on the measured average size parameters, a particle model of Morchella seeds was generated using EDEM software (v.2.6), where the seeds were dynamically created within the software [34]. In the simulation, the distance between the funnel’s lower opening and the center of the collection plate was set to 120 mm, and the collection plate was a circular flat plate with a diameter of 175 mm. A particle generation region was established above the funnel, and a total of 4000 particles were generated during the simulation, with a generation rate of 500 particles per second. Under the influence of gravity, the particles fell freely and moved vertically downward. The total simulation time was set to 10 s, with a time step of 1.01205 × 10⁻⁵ seconds, and the grid size was set to 3 times the minimum particle radius. The setup is shown in Figure 5.

3. Results and Discussion

3.1. Plackett–Burman Test

The Plackett–Burman (PB) experiment is based on the relationship between the target response and various factors, determining the significant impact of each factor on the response value by comparing the differences at different levels [35]. In this study, an orthogonal testing method was used to construct the regression equation, and Design-Expert software (v.23.1) was employed for parameter optimization to obtain the optimal parameter combination [36]. To quickly and efficiently identify the parameters that significantly affect the repose angle, the range of contact parameters obtained from physical experiments was used as the basis, with each factor set at two levels for analysis. The minimum value was designated as the low level (−1), and the maximum value as the high level (+1). The level coding for each parameter is shown in Table 2.
There are seven design factors of Plackett–Burman trial. Based on the Plackett–Burman trial scheme, 12 groups of trials were conducted, as shown in Table 3.
The significance analysis of the Plackett–Burman experiment results provided the effects, mean squares, influence rates, and significance rankings for the seven test parameters, as detailed in Table 4. The analysis revealed that the seed-to-seed rolling friction coefficient (C) had the highest influence rate, followed by the seed-to-seed surface energy (D) and the seed-to-steel rolling friction coefficient (G), which also showed a significant impact on the response value. The other parameters did not have a significant effect on the repose angle.

3.2. Steepest Ascent Test

Using the three significant parameters identified from the Plackett–Burman experiment, a steepest ascent experiment was conducted [37], with five groups of tests designed to quickly approach the optimal parameter values. Within the range of significant contact parameters, increments of 0.05, 0.015, and 0.07 were applied to the respective parameters, while the other parameters were maintained at their mid-levels. In the simulation, the following settings were used for the other parameters: seed-to-seed restitution coefficient was set at 0.4, seed-to-seed static friction coefficient at 0.45, seed-to-steel restitution coefficient at 0.4, and seed-to-steel static friction coefficient at 0.6. The steepest ascent experiment calculated the relative error between the simulated repose angle and the actual repose angle. The test plan and results are shown in Table 5, and the formula for calculating the relative error (N, %) is provided in Equation (4).
N = σ θ θ × 100 %
where σ is the repose angle (°) of the simulation test.
As shown in Table 5, with the incremental increase in the significant parameter values, the simulated repose angle gradually increased, while the relative error initially decreased and then increased. In the second group of tests, the simulated repose angle was closest to the repose angle from the physical experiment, with the smallest relative error. This indicates that the optimal values for the significant parameters are likely near those used in the second group of tests.

3.3. Box-Behnken Design

According to the results of the steepest ascent (SA) test, the Box–Behnken Design (BBD) test was carried out. Two levels were taken for each of the three significant factors. Five central points were selected for error estimation, and a total of 17 tests were carried out. The test results are shown in Table 6.
As shown in Table 6, Box–Behnken Design and its results, the second-order regression model of Morchella cultivation spawn particle repose angle, and three significant parameters were established by using Design-Expert, as shown in Formula (7).
θ = 39.41 + 64.95C − 353.74D − 98.91G + 1240.00CD + 185.00CG + 2023.81DG − 191.10C2 + 3221.11D2 + 192.30G2
Significance ranking: C > D > DG > G > G2 > CD > D2 > CG > C2
The variance analysis results of the regression model are shown in Table 7. The JKR surface energy, seed-to-seed rolling friction coefficient, and seed-to-seed restitution coefficient had extremely significant effects on the repose angle of the seed particles. The model’s p-value was less than 0.0001, indicating a highly significant relationship between the dependent and independent variables. The p-value for the lack of fit was 0.1943, suggesting a good fit for the equation. The determination coefficient R2 = 0.9841 and the adjusted R2 = 0.9637, both of which are close to 1, demonstrate the high reliability of the model. Additionally, a precision value of 24.05 further confirms the model’s good accuracy.
For the Box–Behnken experiment results, variance analysis was conducted, where a larger F-value and a smaller p-value indicate a more significant effect of the factor. A p-value less than 0.01 indicates a highly significant effect, a p-value between 0.01 and 0.05 indicates a significant effect, and a p-value greater than 0.05 indicates a non-significant effect. As shown in Table 7, C, D, G, and DG had a significant positive impact on the repose angle, while CD and G2 also had a significant influence. However, CG, C2, and D2 did not have a significant effect on the repose angle.
According to the variance analysis results, the interaction terms CD and DG have significant effects on the repose angle of Morchella seeds, indicating that multi-factor interactions play a key role in particle accumulation behavior. The CD interaction term shows that when both the seed-to-seed rolling friction coefficient and seed surface energy increase, the repose angle gradually rises, suggesting that these two factors together enhance the stability between particles. On the other hand, the DG interaction term (seed surface energy and seed-to-steel rolling friction coefficient) exhibits a nonlinear trend, initially decreasing and then increasing. This indicates that when the parameters increase at first, friction between the particles and the steel plate reduces, causing the repose angle to decrease. However, once the parameters exceed a critical point, the adhesion between particles intensifies, leading to an increase in the repose angle. The effect of DG on the repose angle is greater than that of CD, highlighting that the interaction between the particles and external materials plays a more significant role in accumulation behavior. This analysis underscores the importance of prioritizing the complex effects of multi-parameter interactions, particularly the interaction between particles and the external environment, when optimizing particle systems, as shown in Figure 6, for example.

3.4. Parameter Optimization and Verification Test

Using the repose angle of 37.63° measured from physical experiments as the target value, the regression model was optimized to obtain various parameter combinations, which were then individually validated through simulation. During the simulations, the remaining contact parameters were kept consistent with those used in the Plackett–Burman experiments. After multiple comparisons with the physical experiment results, the contact parameter combination that most closely matched the repose angle from the physical tests was determined as follows: the seed-to-seed rolling friction coefficient (C) was 0.092, the seed-to-seed surface energy (D) was 0.015, and the seed-to-steel rolling friction coefficient (G) was 0.086. By applying these optimized calibrated contact parameters to the discrete element model, and after conducting three repeated simulations, the average simulated repose angle was 37.69°. This value had a relative error of only 0.16% compared to the physical experiment result of 37.6°, indicating a high degree of consistency between the simulated and physical repose angles, as shown in Figure 7.
min | θ ( C , D , G ) 37.63 | 0.05     C     0.15 0.01     D     0.04 0.05     G     0.19
Error: (37.69 − 37.63)/37.63 × 100% = 0.16%.

3.5. Discussion

The seeds of morel mushrooms have the characteristics of soft surface and adhesive flow, involving complex interaction environments. This study used a combination of theoretical, simulation, and experimental methods, including “experimental determination of seed material properties”, “discrete element simulation of seed group contact parameters”, “quadratic regression model study of contact parameter significance”, and “physical experiments for reliability verification”, to calibrate the three most significant influencing parameters of morel seeds on the angle of repose: seed−seed rolling friction coefficient, seed−seed surface energy, and seed−steel rolling friction coefficient. The results showed similar patterns to those of Luo et al. [24], Wang et al., and Cao et al. [16,38]. However, comparative studies have found that unlike wheat seeds, rapeseed seeds, etc., the static friction coefficient between morel seeds has no significant effect on the angle of repose, which can provide a reference for studying particles with surface softness and adhesive flowability, and further improve the regularity model of particle contact parameters.

4. Conclusions

(1)
Through physical experiments, the relevant physical parameters of Morchella cultivation spawn were measured: size, density, Poisson’s ratio, shear modulus, repose angle of 37.63°. The moisture content of the seeds was relatively high, and there was a small amount of viscosity between particles.
(2)
Through the Plackett–Burman test, the three contact parameters that had the most significant effect on the seed repose angle were selected, and the significant order was as follows: the rolling friction coefficient between seed and seed, the Hertz–Mindlin with JKR between seed and seed, and the rolling friction coefficient between seed and steel. Other contact parameters had no significant effect on the seed repose angle.
(3)
The Hertz–Mindlin with JKR bond model was applied to the seeds, and the Discrete Element Method was used to calibrate the related parameters of the seed particles. Through the Box–Behnken response surface experiment, the quadratic regression model between the repose angle and three significant parameters was established and optimized, and the optimal solution combination of the three significant parameters was obtained. The seed–seed rolling friction coefficient was 0.092, the seed–seed JKR was 0.015 j/m2, and the seed–steel rolling friction coefficient was 0.086. The relative error between the model and test results was only 0.61%, demonstrating good agreement.

Author Contributions

Conceptualization, M.L., X.H., J.L., G.Z. and X.W.; Methodology, M.L., X.H. and G.Z.; Software, M.L. and K.G.; Validation, M.L., X.H. and X.W.; Formal analysis, M.L., K.G. and X.W.; Investigation, M.L.; Resources, X.W.; Data curation, M.L. and G.Z.; Writing—original draft, M.L. and G.Z.; Writing—review and editing, M.L., X.H., X.W. and J.L.; Supervision, X.W., X.H. and J.L. All authors have read and agreed to the published version of the manuscript.

Funding

This research was supported by The Science and Technology Planning Project of First Division of the City of Alar (Grant No. 2023ZB02), The Science and Technology Planning Project of Xinjiang Production and Construction Corps (Grant No. 2023AB005), The Agriculture Bureau Project (Grant No. 2023AA304), The Tarim University President Fund Project (Grant No. TDZKSS202113), and The Vegetable Industry System (XJARS-07-25). We extend our heartfelt gratitude to these funding agencies for their generous support, which was crucial for the successful completion of our study.

Institutional Review Board Statement

Not applicable.

Informed Consent Statement

Not applicable.

Data Availability Statement

The original contributions presented in the study are included in the article, further inquiries can be directed to the corresponding author.

Acknowledgments

The authors would like to thank their schools and colleges, as well as the funding providers of the project. All support and assistance are sincerely appreciated.

Conflicts of Interest

The authors declare no conflicts of interest.

References

  1. Zipora, T.; Segula, M. True morels (Morchella)—Nutritional and phytochemical composition, health benefits and flavor: A review. Crit. Rev. Food Sci. Nutr. 2017, 58, 1888–1901. [Google Scholar] [CrossRef]
  2. Tan, F. To explain the development history of bag cultivation of sheep belly bacteria in our country. Edible Med. Bact. 2019, 27, 257–263. [Google Scholar]
  3. Li, C.; Wu, L.; Wang, S.; Ma, B. Production scale and field planting techniques of Morchella in China. Edible Med. Bact. 2021, 29, 461–465. [Google Scholar]
  4. Liu, W.; He, P.; Shi, X.; Zhang, Y.; Perez-Moreno, J.; Yu, F. Large-Scale Field Cultivation of Morchella and Relevance of Basic Knowledge for Its Steady Production. Fungi 2023, 9, 855. [Google Scholar] [CrossRef]
  5. Masaphy, S. First Report on Purpureocillium lilacinum Infection of Indoor-Cultivated Morel Primordia. Agriculture 2022, 12, 695. [Google Scholar] [CrossRef]
  6. Hor, A.; Abik, J.; Molenda, M. Parameters and contact models for DEM simulations of agricultural granular materials: A review. Biosyst. Eng. 2016, 147, 206–225. [Google Scholar]
  7. Li, Y.; Fan, J.; Hu, Z.; Luo, W.; Yang, H.; Shi, L.; Wu, F. Calibration of Discrete Element Model Parameters of Soil around Tubers during Potato Harvesting Period. Agriculture 2022, 12, 1475. [Google Scholar] [CrossRef]
  8. Li, J.; Li, H.; Chen, Y.; Lin, P.; Zhang, Q.; Cheng, Y.; Yang, Z.; Huang, G. Research on Ditching Mechanism of Self-Excited Vibration Ditching Machine. Agronomy 2023, 13, 905. [Google Scholar] [CrossRef]
  9. Yang, J.; Wu, H.; Guo, A.; Rugerinyange, R.; Liu, C.; Zhao, Z.; Han, W.; Yin, L. Performance Optimization and Simulation Test of No-Tillage Corn Precision Planter Based on Discrete Element Method (DEM). Machines 2024, 12, 465. [Google Scholar] [CrossRef]
  10. Sugirbay, A.; Hu, G.-R.; Chen, J.; Mustafin, Z.; Muratkhan, M.; Iskakov, R.; Chen, Y.; Zhang, S.; Bu, L.; Dulatbay, Y. A Study on the Calibration of Wheat Seed Interaction Properties Based on the Discrete Element Method. Agriculture 2022, 12, 1497. [Google Scholar] [CrossRef]
  11. Wittkop, B.; Snowdon, R.J.; Friedt, W. New NIRS Calibrations for Fiber Fractions Reveal Broad Genetic Variation in Brassica napus Seed Quality. J. Agric. Food Chem. 2012, 60, 2248–2256. [Google Scholar] [CrossRef] [PubMed]
  12. Jan, M.; Patrick, S.; Carlos, E.; Torsten, W.; Hauke, Z. On the automatic parameter calibration of a hypoplastic soil model. Acta Geotech. 2022, 17, 5253–5273. [Google Scholar] [CrossRef]
  13. Mudarisov, S.; Farkhutdinov, I.; Khamaletdinov, R.; Khasanov, E.; Mukhametdinov, A. Evaluation of the significance of the contact model particle parameters in the modelling of wet soils by the discrete element method. Soil Tillage Res. 2022, 215, 105228. [Google Scholar] [CrossRef]
  14. Yu, Q.; Liu, Y.; Chen, X. Simulation Parameter Calibration and Test of Panax Notoginseng Seed Based on Discrete Element. J. Agric. Mach. 2020, 51, 123–132. [Google Scholar]
  15. Jun, G.; Yue, Y.; Memon, M.S. Design and simulation for seeding performance of high-speed inclined corn metering device based on discrete element method (DEM). Sci. Rep. 2022, 12, 19415. [Google Scholar] [CrossRef]
  16. Wang, L.; Fan, S.; Cheng, H.; Meng, Y.; Shen, Y.; Wang, J.; Zhou, H. Calibration of contact parameters for pig manure based on EDEM. Trans. Chin. Soc. Agric. Eng. Trans. CSAE 2020, 36, 95–102. [Google Scholar]
  17. Zeng, Y.; Chen, C.; Quan, W.; Xie, S.; Shi, F.; Ma, Z.; Wu, M. Calibration parameter of soil discrete element based on area difference method. Agriculture 2023, 13, 648. [Google Scholar] [CrossRef]
  18. Liu, F.; Zhang, J.; Li, B. Calibration of parameters of wheat required in discrete element method simulation based on repose angle of particle heap. Trans. Chin. Soc. Agric. Eng. Trans. CSAE 2016, 32, 247–253, (In Chinese with English Abstract). [Google Scholar]
  19. Wang, X.; Hu, H.; Wang, Q. Parameter calibration method for soil model based on discrete element method. J. Agric. Mach. 2017, 48, 78–85. [Google Scholar]
  20. Zhao, L.; Zhang, X.; Yuan, Y.; Hou, L.; Yang, Y. Design and Experiment of Powder Organic Fertilizer Strip Fertilizer Application and Discharge Device. J. Agric. Mach. 2022, 53, 98–107. [Google Scholar]
  21. Yuan, Q.; Xu, L.; Xing, J.; Duan, Z.; Ma, S.; Yu, C.; Chen, C. Parameter calibration of discrete element model for machine applied organic fertilizer bulk particles. J. Agric. Eng. 2018, 34, 21–27. [Google Scholar]
  22. Bai, Z.; Meng, H.; Peng, H.; Wei, J.; Li, Y. Calibration of discrete element simulation parameters for Cistanche seed. Res. Agric. Mech. 2025, 47, 19–26+53. [Google Scholar] [CrossRef]
  23. Lin, J.; Luo, S.; Yuan, Q.; Cao, H. Study on the flowability of earthworm castings particles with different moisture contents. J. Agric. Eng. 2019, 35, 221–227. [Google Scholar]
  24. Luo, S.; Yuan, Q.; Shaban, G.; Yang, L. Parameters Calibration of Vermicomposting Nursery Substrate with Discrete Element Method Based on JKR Contact Model. J. Agric. Mach. 2018, 49, 343–350. [Google Scholar]
  25. Qiu, Z.; Luo, X.; Lin, Z.; Chang, P.; Chen, G.; Yang, W. Calibration of tobacco nutrient soil parameters based on EDEM. China Agric. Mach. Chem. News 2024, 45, 146–151. [Google Scholar]
  26. Wang, L.; Wang, Z.; Li, H.; Zhang, X. Review of seed quality testing methods for cotton commodities. China’s Seed Ind. 2012, 6–7. [Google Scholar] [CrossRef]
  27. GB/T 3543.6-1995; Regulations for Inspection of Crop Seeds—Determination of Moisture Content. The State Bureau of Quality and Technical Supervision: Beijing, China, 1995.
  28. Gong, F.; Hu, M.; Bao, A.; Li, D.; Gao, T. Parameter calibration and significance analysis of rice straw based on Hertz Mindlin model. J. S. Univ. Nat. Sci. Ed. 2022, 44, 186–196. [Google Scholar]
  29. Li, H.; Zeng, R.; Niu, Z.; Zhang, J. A Calibration Method for Contact Parameters of Maize Kernels Based on the Discrete Element Method. Agriculture 2022, 12, 664. [Google Scholar] [CrossRef]
  30. Ucgul, M.; Fielke, J.M.; Saunders, C. Three-dimensional Discrete Element Modelling (DEM) of tillage: Accounting for soil cohesion and adhesion. Biosyst. Eng. 2015, 129, 298–306. [Google Scholar] [CrossRef]
  31. Zhou, H.; Li, K.; Qin, Z.; Wang, S.; Wang, X.; Sun, F. Discrete Element Model of Oil Peony Seeds and the Calibration of Its Parameters. Agriculture 2024, 14, 1092. [Google Scholar] [CrossRef]
  32. Zhang, X.; Wang, R.; Wang, B.; Chen, J.; Wang, X. Parameter Calibration of Discrete Element Model of Wine Lees Particles. Appl. Sci. 2024, 14, 5281. [Google Scholar] [CrossRef]
  33. Zheng, J.; Wang, L.; Wang, X.; Shi, Y.; Yang, Z. Parameter Calibration of Cabbages (Brassica oleracea L.) Based on the Discrete Element Method. Agriculture 2023, 13, 555. [Google Scholar] [CrossRef]
  34. Li, G.; Li, H.; Li, X.; Gong, Z.; Yang, Q.; Huang, Y.; Fu, Z. Establishment and calibration of discrete element model for buckwheat seed based on static and dynamic verification test. Agriculture 2023, 13, 1024. [Google Scholar] [CrossRef]
  35. Li, D.; Wang, R.; Zhu, Y.; Chen, J.; Zhang, G.; Wu, C. Calibration of Simulation Parameters for Fresh Tea Leaves Based on the Discrete Element Method. Agriculture 2024, 14, 148. [Google Scholar] [CrossRef]
  36. Liu, Y.; Mi, G.; Zhang, S.; Li, P.; Huang, Y. Determination of discrete element modelling parameters of adzuki bean seeds. Agriculture 2022, 12, 626. [Google Scholar] [CrossRef]
  37. Chen, X.; Bai, J.; Wang, X.; Fang, W.; Hong, T.; Zang, N.; Fang, L.; Wang, G. Calibration and testing of discrete elemental simulation parameters for pod pepper seeds. Agriculture 2024, 14, 831. [Google Scholar] [CrossRef]
  38. Cao, B.; Li, W.; Wang, N.; Bai, X.; Wang, C. Calibration of discrete element parameters of the wet barrel finishing abrasive based on JKR model. Surf. Technol. 2019, 48, 249–256, (In Chinese with English Abstract). [Google Scholar]
Figure 1. (a) Schematic diagram of three-dimensional sizes. (b) Electric hot blower dry box (Shanghai Boxun Medical Biological Instrument Corp, Shanghai, China).
Applsci 14 11134 g001
Figure 2. Determination of the repose angle.
Applsci 14 11134 g002
Figure 3. Determination of the friction coefficient. (a) Actual test. (b) Test principle (Dongguan Huaguo Precision Instrument Co., Ltd., Dongguan, China).
Applsci 14 11134 g003
Figure 4. (a) Compression test of seed. (b) Texture lab (force).
Applsci 14 11134 g004
Figure 5. (a) The three-dimensional model used for simulations of the seed particles. (b) The simulation process of the angle repose.
Applsci 14 11134 g005
Figure 6. Response surface of the interaction between factors on the repose angle: (a) BA interaction; (b) CB interaction.
Applsci 14 11134 g006
Figure 7. Test results: (a) Measured repose angle. (b) Simulated repose angle.
Applsci 14 11134 g007
Table 1. Basic physical parameters of Morchella cultivation spawn.
ParametersMean Value
Three axis dimensions (length × width × thickness)/mm7.33 × 4.51 × 4.43
Density/(kg/m3)400
Moisture content%41
Table 2. Plackett–Burman test parameters of Morchella cultivation spawn.
Test Serial NumberSymbolParametersParameter Levels
Low Level (−1)High Level (+1)
1Aseed–seed collision restitution coefficient0.300.50
2Bseed–seed static friction coefficient (SFC)0.200.70
3Cseed–seed rolling friction coefficient (RFC)0.050.40
4Dseed–seed Johnson–Kendall–Roberts (JKR)(J/m2)0.010.10
5Eseed–steel collision recovery coefficient (CRC)0.300.50
6Fseed–steel static friction coefficient0.500.70
7Gseed–steed rolling friction coefficient0.050.50
Table 3. Results of Plackett–Burman Design (P-BD) test.
Test Serial NumberFactorsRepose Angle/(°)
ABCDEFG
10.500.200.050.010.500.500.5035.84
20.500.700.050.100.500.700.0543.15
30.500.700.050.010.300.700.0534.56
40.300.200.050.010.300.500.0531.41
50.300.200.400.010.500.700.0548.37
60.500.200.400.100.500.500.0552.59
70.300.700.050.100.500.500.5044.66
80.300.700.400.010.500.700.5055.36
90.300.200.050.100.300.700.5045.68
100.500.700.400.010.300.500.5053.67
110.300.700.400.100.300.500.0548.01
120.500.200.400.100.300.700.5052.43
Table 4. Analysis of significance parameters in Plackett–Burman experiment.
Test Serial NumberParametersEffectsMean SquareInfluence Rate/%Significance Ranking
1A−0.2080.1300.0187
2B2.18214.2792.0056
3C12.522470.37666.0391
4D4.55262.1538.7263
5E2.36816.8272.3624
6F2.22814.8962.0915
7G4.92572.76710.2162
Table 5. Design and results of climbing test.
Test Serial NumberFactorsSimulation Repose Angle σ/(°)Relative Error/%
CDG
10.050.010.0532.2814.22
20.10.0250.1235.425.87
30.150.040.1942.1712.06
40.20.0550.2648.9930.19
50.250.070.3351.3436.43
Table 6. Results of Box–Behnken Design test.
RunCDGSimulation Repose Angle/(°)
10.100.0250.1238.89
20.050.0100.1234.56
30.100.0400.0541.03
40.100.0100.1936.97
50.150.0250.0542.10
60.050.0400.1236.84
70.150.0400.1246.71
80.100.0250.1239.35
90.050.0250.0535.42
100.150.0100.1240.71
110.100.0250.1239.00
120.150.0250.1945.72
130.050.0250.1936.45
140.100.0100.0538.97
150.100.0250.1239.87
160.100.0400.1947.53
170.100.0250.1240.18
Table 7. ANOVA of Box–Behnken Design quadratic model.
SourceSum of SquaresdfMean SquareF-Valuep-ValueSignificance
Model222.92924.7748.26<0.0001Very Significant
C127.761127.76248.91<0.0001Very Significant
D54.6154.6106.38<0.0001Very Significant
G10.47110.4720.390.0027Very Significant
CD3.4613.466.740.0356Significant
CG1.6811.683.270.1136Not Significant
DG18.06118.0635.190.0006Very Significant
C20.96110.9611.870.2135Not Significant
D22.2112.214.310.0766Not Significant
G23.7413.747.280.0307Significant
Residual3.5970.5133
Lack of Fit2.3630.7862.550.1943Not Significant
Pure Error1.2440.3088
Cor Total226.5216
Disclaimer/Publisher’s Note: The statements, opinions and data contained in all publications are solely those of the individual author(s) and contributor(s) and not of MDPI and/or the editor(s). MDPI and/or the editor(s) disclaim responsibility for any injury to people or property resulting from any ideas, methods, instructions or products referred to in the content.

