Abstract
Rodent infestation has become one of the important factors in grassland degradation on the Qinghai–Tibet Plateau, one of the hindrances to ecological and environmental protection, and a threat to the balance and development of the ecosystem in the Sanjiangyuan region. Based on the need for the scientific planning for ecological protection, this paper designs a method for detecting rodent infestation in plateau scenarios. Firstly, data were collected and annotated, and a dataset of plateau rodent distribution in the Qinghai region was constructed. The collected data include videos captured through drone-based field surveys, which were processed using OpenCV and annotated with LabelMe. The dataset is categorized into four specific types: ungobbled rat holes, gobbled rat holes, rocks, and cow dung. This categorization allows the model to effectively differentiate between rodent-related features and other environmental elements, which is crucial for the segmentation task. Secondly, the latest segmentation algorithm provided by YOLO v8 is improved to design a segmentation algorithm that can accurately detect the distribution of rodent infestation in the plateau scene. The specific improvements are as follows: firstly, the Contextual Transformer module is introduced in YOLO v8 to improve the global modeling capability; secondly, the DRConv dynamic region-aware convolution is introduced in YOLO v8 to improve the convolutional representation capability; thirdly, the attention mechanism is incorporated in the backbone of YOLO v8 to enhance the feature extraction capability of the network capability. A comparison test with the original algorithm on the plateau rodent distribution dataset showed that the new algorithm improved the detection accuracy from 77.9% to 82.74% and MIoU from 67.65% to 72.69% on the plateau rodent distribution dataset. The accuracy of the evaluation of plateau rodent damage levels has been greatly improved.
1. Introduction
The Qinghai–Tibet Plateau is the birthplace of the Yangtze and Yellow Rivers and is known as the water tower of Asia. Protecting the ecological environment of the Qinghai–Tibet Plateau region (Zhao, Chen, and Fan 2020) is related to the water security of many Asian countries [1]. In recent years, grassland degradation (Jiyuan, Xinliang, and Quanqin 2008) and soil erosion have become serious in Qinghai Province [2], and the grassland diversity (Wen et al., 2013) is rapidly decreasing [3]. In the new era, in order to implement the concepts of green water, green mountains, golden mountains, and the system of mountain, water, forest, lake, lake, grass, and sand management, it is especially important to scientifically and effectively manage the problem of grassland degradation in the Sanjiangyuan area.
In grassland ecosystems, rodents occupy an extremely important position. A moderate number of rats and rabbits play a positive role in the biological chain, but an excess of rats and rabbits can cause damage to grasslands and thus lead to rodent infestations. The proliferation of grassland rodents is often accompanied by many hazards, such as the degradation of grasslands, with reduced livestock carrying capacity; the sanding of grasslands, with severe soil erosion; and the spread of diseases, which threatens the health of farmers and herders (Zhou Yang et al., 2021) [4]. The highland sage-grouse is widely distributed in the Qilian Mountains, and excessive feeding and digging activities threaten the grassland ecosystem in the region (HAN Ruiying et al., 2022) [5]. In addition to the large amount of forage and grazing animals competing for food, the damaging effects of the grassland are mainly due to the damage to the soil structure on which the grass plants grow and the reduction in the available area for grazing (LIU Wei et al., 2003) [6]. Therefore, there is a need for a more scientific program to determine the level of damage caused by plateau sage-grouse and to take timely measures for precise management.
Deep learning plays an essential role in the vast field of ecological resource monitoring. For instance, in classification tasks, Mohanty et al. utilized deep learning methods to classify images of 38 plant diseases, some of which may be related to rodent infestations, thereby establishing a potential connection for detecting rodent-related damage in plants (Mohanty, Hughes, and Salathe, 2016) [7]. In another study, Norouzzadeh et al. (2018) applied deep learning to automatically classify and count images captured by camera traps [8], effectively enabling animal population monitoring, which could be adapted for rodent monitoring in the future [9]. In terms of detection and localization, Pound et al. (2017) focused on detecting and localizing parts like wheat ears and leaf tips, showcasing deep learning’s potential in precise plant feature recognition [10]. This approach has applications in identifying rodent-damaged regions within vegetation, such as recognizing plant features impacted by rodent activity. Additionally, Weinstein et al. (2019) used RetinaNet (Lin et al., 2017) to achieve canopy detection, attaining significant improvements in speed and accuracy, which may prove helpful in the large-scale monitoring of rodent disruptions [11,12]. Furthermore, deep learning has made notable advances in animal monitoring (Kellenberger, Marcos, and Tuia, 2018), cloud detection (Shi et al., 2016), and plant disease detection Mohanty, Hughes, and Salathe, 2016), supporting the efficient processing and accurate identification of ecological data [7,13,14]. In semantic segmentation, Douarre et al. (2019) achieved segmentation of soil and plant roots in images, providing an effective approach for analyzing plant–soil interactions [15]. Although instance segmentation has been relatively underexplored, Romera-Paredes and Torr (2016) successfully achieved segmentation and counting of each leaf of Arabidopsis thaliana based on Fully Convolutional Networks (FCN) and Long Short-Term Memory (LSTM) methods [16]. This approach could be applied to identify rodent-related features, such as burrows and damaged vegetation. The YOLO family, a very mature framework in target detection, has incorporated instance segmentation in the version of YOLO v5, and in the latest YOLO v8 algorithm, the performance of instance segmentation has become outstanding. The authors’ team has been working on the ecology of grasslands in the Qinghai region and has used deep learning techniques to study wolfsbane flowers. Most of the studies on plateau rodent infestation (Wu et al., 2019; Qi et al., 2022) are based on the Maxent model in machine learning, which cannot determine the current erosion status of grasslands through images [17,18]. Therefore, this paper aims to achieve plateau rodent hazard recognition through the YOLO v8 algorithm, combined with the rodent damage situation in the Qinghai region.
The population density of plateau sage-grouse is closely related to the number of holes (Yan et al., 2019) [19]. Using deep learning techniques (Christin, Hervet, and Lecomte 2019), for the plateau grassland scenario in the Qinghai region, the proportion of effective sage-grouse holes was used to infer the degree of sage-grassland encroachment by sage-grouse and to give the corresponding hazard level, to provide a reference for grassland degradation management in Qinghai region (Yang Xingkang 2011) [20,21]. In this context, the authors collected and established a dataset of the distribution of sage-grouse holes in the plateau grassland through fieldwork and designed an improved sage-grouse hole segmentation algorithm based on the YOLO v8 segmentation algorithm. In this paper, firstly, the Contextual Transformer module is introduced to improve the global modeling capability; secondly, the DRConv dynamic region-aware convolution is introduced to improve the representation capability of convolution; finally, the attention mechanism was fused in the backbone to enhance the feature extraction capability of the network. After experimental comparison, the effectiveness of the improved algorithm was thus verified and applied to practical scenarios.
2. Improvements to the YOLO v8 Segmentation Algorithm
The YOLO family is a very popular set of algorithmic frameworks in the field of target detection and has been widely used in various fields such as traffic (Lin and Sun 2018; Dong et al., 2021) [22,23], medicine (Sindhu et al., 2018; Huang et al., 2020; Ronneberger, Fischer, and Brox 2015) [24,25,26], and water monitoring (Wu Xinghui et al.) [27]. In recent years, many researchers have tried to apply the YOLO algorithm to segmentation (Diaz-Zapata, Erkent, and Laugier 2021; Mohamed et al., 2021) [28,29], and the YOLO v5 team integrated the segmentation module into the official project when they released version 7.0 and stated that YOLO v5 segmentation was fast and good. YOLO v8 is one of the latest versions of the YOLO family, developed by the v5 team, and it includes the image segmentation module. Therefore, this paper chooses to improve on YOLO v8 and apply the latest technology to the environmental protection of the Sanjiangyuan region.
Recent modifications to YOLO have significantly enhanced its performance across various application scenarios. A notable example is YOLO-Facev2 (Yu et al., 2024), which introduces the Receptive Field Enhancement (RFE) module and the Separation and Enhancement Attention Module (SEAM) [30]. These innovations address challenges such as scale variation and occlusion, improving face detection accuracy in complex environments. This approach could inspire similar improvements for rodent detection in ecological environments, especially in the presence of scale variation and occlusion. Additionally, YOLO-FD (Li et al., 2024) integrates a multi-task learning framework, combining object detection and semantic segmentation tasks, achieving excellent performance in fish disease detection, surpassing traditional models like YOLO v8 and Deeplabv3+ [31]. This method has significantly improved the performance in complex multi-task applications and incorporates techniques like PCGrad and weight uncertainty optimization, offering valuable insights for enhancing the multi-task framework for rodent detection and segmentation on the Qinghai Plateau. Furthermore, studies such as drone-based weed detection and Sunflower-YOLO illustrate how YOLO architectures can be further optimized for specific applications. For instance, Rehman et al. (2024) improved real-time weed detection accuracy through enriched feature extraction layers, such as Ghost Convolutions and BottleNeckCSP [32]. This innovation inspired us to integrate similar techniques into our YOLO v8 modifications to enhance the model’s ability to detect small features, such as rodent burrows or plant damage, in large-scale ecological environments. Similarly, Sunflower-YOLO Jing et al., 2024) addresses challenges posed by different plant growth stages and environmental conditions through the introduction of deformable convolutions and the SimAM attention mechanism [33]. While this method was not directly applied in our study, it provided valuable inspiration for optimizing our approach to detecting rodent-induced damage in various vegetation types across the Qinghai Plateau. These recent studies demonstrate how YOLO versions have been tailored to specific fields to achieve substantial performance improvements. For example, YOLO v8 itself includes several upgrades, such as replacing the C3 module with the gradient-rich C2f module and shifting from anchor-based detection to anchor-free detection. These changes collectively enhance the overall performance of the model.
The YOLO series has used mosaic data augmentation since v4 (Bochkovskiy, Wang, and Liao 2020) to improve data diversity [34]. v8 also uses this data augmentation series and turns off mosaic data augmentation in the last 10 epochs, thus effectively improving the accuracy. The backbone and neck section of YOLO v8 replaces the C3 Module in v5 with the more gradient-rich C2f Module and designs different parameters for different scales of the model to significantly improve the performance of the model. The classification and detection heads are separated, and the anchor-based idea is abandoned and replaced with the anchor-free idea.
These recent advancements highlight the importance of adjusting YOLO architectures to meet specific application needs. By drawing on these modifications, this study leverages the latest improvements in YOLO v8 and further customizes the architecture for detecting rodent damage in grasslands. The improvements in YOLO v8—such as the integration of dynamic region-aware convolution and Contextual Transformer modules—are aimed at enhancing feature extraction and modeling capabilities, making the model more adaptable and effective for ecological protection tasks in the Sanjiangyuan region.
In this paper, a series of improvements are made to the original model, and the structure of the improved model is shown in Figure 1. Based on the original model, all the convolution modules are replaced with dynamic region-aware convolution modules. Such a change improves the representation capability of the convolution while maintaining the computational cost and the translation invariance of the standard convolution. The Bottleneck in the c2f module is then replaced with the CoTBottleneck, i.e., the Contextual Transformer module is introduced into the backbone network to make full use of the contextual information and improve the global modeling capability. Finally, the Convolutional Block Attention Mechanism module (CBAM) is added to the backbone network of YOLO v8 to enhance the feature extraction capability of the backbone network.
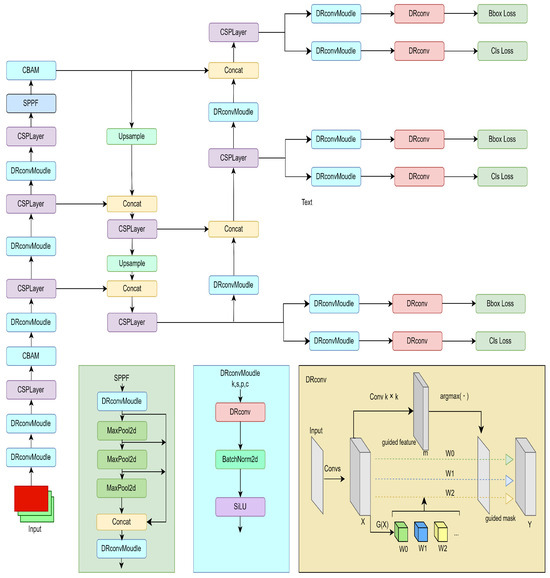
Figure 1.
Structure of the improved YOLO v8.
2.1. Introduction of the Contextual Transformer Module
In recent years, transformers have been used in numerous computer vision (Dosovitskiy et al., 2020) fields with good results [35]. However, most designs directly use self-attention on the feature map to obtain the attention matrix of isolated queries and keys at each spatial location, without making full use of the contextual information between adjacent keys. Therefore, a new Transformer-based Contextual Transformer (CoT) block has been designed by some researchers (Lin et al., 2017) [12]. This design makes full use of contextual information to guide the learning of dynamic attention matrices, thereby improving the visual representation.
In the traditional self-attentive mechanism, the learning between query and key is independent of each other, but the adjacent contextual information is ignored, thus making the 2D feature graph under-expressed. Therefore, researchers (Li et al., 2021) designed a CoT module, as shown in Figure 2, to efficiently facilitate self-attentive learning and enhance feature graph representation [36]. As shown in Figure 2, the input 2D feature graph , and keys, queries, and values are denoted as K, Q, and V, respectively, where , , and . The CoT block first extracts contextual information using a k × k group convolution to Obtain , a static contextual representation that responds to the contextual information between adjacent key values. Next, is concatenated with Q. The result after concatenation is obtained by two successive 1 × 1 convolutions to obtain the attention matrix based on query and keys learning:
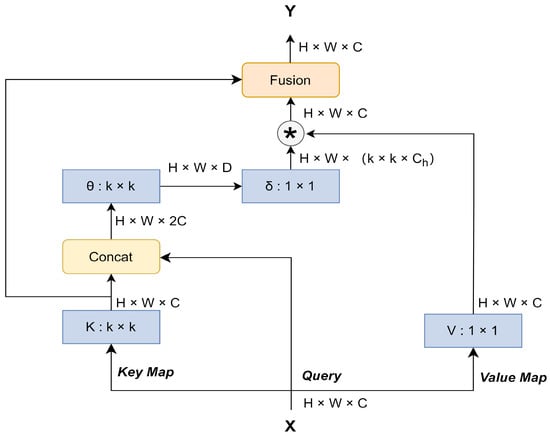
Figure 2.
Contextual Transformer (CoT) block.
In this way the learning capacity of the self-attentive mechanism is enhanced, resulting in the feature mapping:
That is the dynamic context representation. Finally, the output Y of the CoT module is obtained by fusing the static context representation and the dynamic context representation through the attention mechanism.
2.2. Introduction of DRConv Dynamic Region-Aware Convolution
DRConv (Chen et al., 2021) can automatically assign multiple filters to the corresponding spatial domains with similar feature representations; so, DRConv outperforms standard convolution in modeling semantic variation [37]. The standard convolution can extract more visual features by adding filters to achieve better results but at a higher computational cost. DRConv improves the representation of the convolution by adding channel filters while maintaining similar computational cost and translation invariance as the standard convolution. Moreover, the plug-and-play feature of DRConv can directly replace the standard convolution in existing networks, thus achieving a performance gain.
The DRConv dynamic region-aware convolution model is shown in Figure 3, and it is divided into two main steps, i.e., using a learnable guided mask module to divide the features into regions in the spatial dimension and then customizing the filters in each shared region to perform the convolution operation. In Figure 3, the number of regions is m. First, the guided feature is obtained from X using the standard k × k convolution, and then m filters are obtained using the filter generator module. The region of the guided mask is divided into m regions, each of which has a corresponding filter. Finally, a k × k convolution is performed in these regions using the respective filters, and the final output Y is obtained.
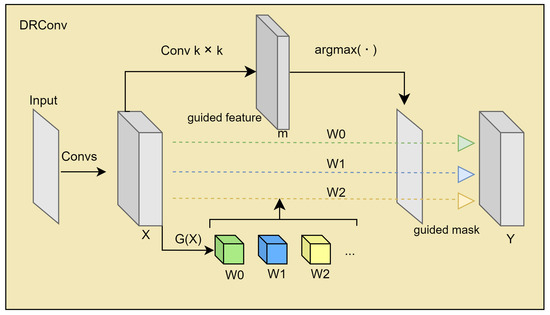
Figure 3.
DRConv.
2.3. Inclusion of CBAM Attention Mechanism Module
Due to the influence of various flora and fauna in the grassland scene, the recognition of rat holes is affected by various complex backgrounds, and because the unchewed rat holes and cow dung are similar in appearance and color, the two instances are often confused during segmentation; so, the CBAM attention mechanism (Woo et al., 2018) is added to the backbone network of YOLO v8 again to improve the feature extraction ability of the segmentation algorithm and reduce the influence of irrelevant elements on the accuracy of the model, thus improving the accuracy of the segmentation algorithm [38].
The structure of the CBAM attention module is shown in Figure 4. The channel attention mechanism compresses the feature map in the spatial dimension, and the compression uses average pooling and maximum pooling to aggregate the spatial information of the feature map to produce the channel attention map. In this process, the average pooling has feedback on all pixel points on the feature map, while the maximum pooling only has feedback on the gradients in the feature map where the response is greatest. The spatial attention mechanism, on the other hand, compresses the channels and uses average pooling and maximum pooling in the channel dimension, extracting the high times, the width submaximum, and the mean, respectively, on the channels and merging the extracted feature maps, both with a channel count of 1, into a single feature map with a channel count of 2. After two attention mechanisms, the results were weighted to obtain the results.
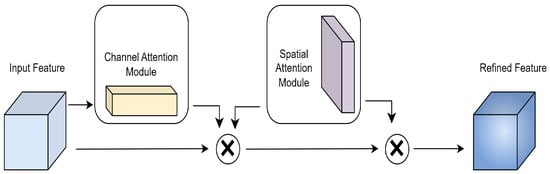
Figure 4.
CBAM model.
3. Introduction to the Dataset
Under the leadership of experts from the Qinghai Provincial Grassland General Station, the author’s team carried out fieldwork and filming by drones, screened the data, and finally obtained a set of video data with suitable angles, obvious features, and relative clarity; then, we used OpenCV to process the video, labelme to label the processed data, and integrated them to obtain the plateau sage-grouse hole dataset used in this paper.
The data distribution of the training and validation sets is shown in Table 1, where there are 5840 images in the training set and 648 images in the validation set. In addition, several sets of test images were prepared to test the effect of the model. The four categories from top to bottom are ungobbled rat holes, gobbled rat holes, rocks, and cow dung. Examples of the data are shown in Figure 5, from top to bottom, stone, ungobbled rat hole, cow dung, and gobbled rat hole. As can be seen from Table 1, the number of tags varies considerably between categories, with cow dung being less numerous; however, the shape of cow dung is extremely similar to that of a gnawed mouse hole, which also places a high demand on the improvement of the algorithm.

Table 1.
Distribution of the number of upland sage-grouse hole datasets.
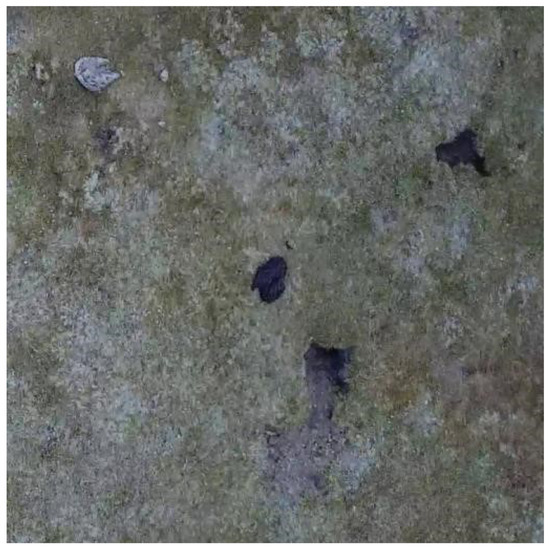
Figure 5.
Example of data.
4. Analysis of Experimental Results
4.1. Experimental Conditions
This experiment was based on the PyTorch 1.13 framework to build a deep learning model, dividing the dataset into a training set and a testing set in the ratio of 9:1. The GPU was Nvidia RTX3060, the CUDA version was 11.6, and the CPU model was i7-12700F.
For training, the mosaic data enhancement strategy used in YOLO v8 was still retained, with the epoch set to 120 and the batch_size set to 32, and DFL_loss was used to allow the network to quickly focus on the distribution of locations that were closer to the target location. To effectively prevent overfitting, we employed the hyperparameter settings summarized in Table 2.
Table 2.
Hyperparameter settings.
Experiments were conducted to evaluate the recognition ability of the model by the evaluation metrics mPrecision, mAP50, mRecall, and mIoU in the example segmentation.
4.2. Analysis of Experimental Results
By monitoring the loss and accuracy curves during training, we further validated the effectiveness of the hyperparameter settings in preventing overfitting.
To better understand the computational complexity and performance trade-offs of different YOLOv8 versions tested in this study, we summarize the key metrics (parameters, gradients, GFLOPs) for each model version in Table 3. This comparison highlights the impact of additional modules on the model size and computational demand.
Table 3.
Model comparison for YOLOv8 variants.
In Table 3, the standard lightweight version of YOLOv8n has fewer parameters, making it suitable for real-time applications. By adding the CoT module to YOLOv8n, the model’s ability to capture contextual information is enhanced, although this slightly increases the parameters and computational load. Additionally, using the DRConv module in two convolutional layers significantly improves the model’s performance while maintaining reasonable computational complexity. As observed from Table 3, adding the CoT and DRConv modules increases the computational complexity in terms of parameters and GFLOPs. Specifically, the DRConv module significantly raises the GFLOPs (from 11.9 to 46.1), reflecting the added computational cost. Despite this, both modules contribute to improved performance metrics, as shown in the results of Table 4 and Figure 6, Figure 7 and Figure 8. This trade-off between computational cost and performance improvement is critical in real-world applications where model efficiency is as important as accuracy.
Table 4.
Experimental data.
These findings highlight the importance of balancing the computational complexity with the performance gains. While the additional computational cost might seem significant, the improvements in model accuracy and feature recognition capabilities justify the trade-off, especially in the context of complex tasks such as rodent detection and environmental monitoring. The ability to enhance performance without severely compromising efficiency is essential for deploying models in large-scale real-time applications.
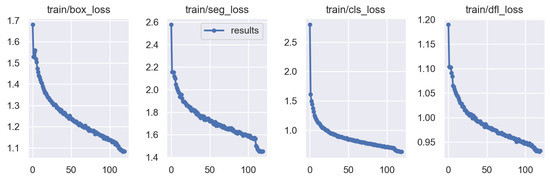
Figure 6.
Training loss curve.
This figure illustrates the various losses on the training set, including the box loss, segmentation loss, classification loss, and DFL loss. These curves show that the model effectively learned the data features during training, with all losses significantly decreasing.
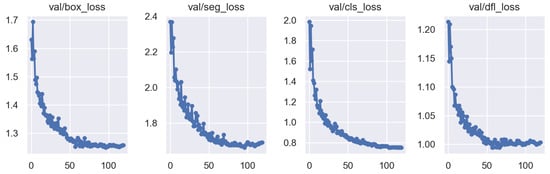
Figure 7.
Validation loss curve.
This figure presents the variations in various losses on the validation set, including the box loss, segmentation loss, classification loss, and DFL loss. As training progresses, the losses gradually decrease, demonstrating good convergence of the model.
This figure shows the changes in precision, recall, and mean average precision (mAP50 and mAP50-95) over time during training. As the training progresses, these metrics steadily improve, indicating that the model’s detection capability continues to be enhanced.
In this work, three improvements were made to the YOLO v8 model, the network was trained in the order of improvement, the best weights obtained from the training were tested, and the experimental results are shown in Table 4.
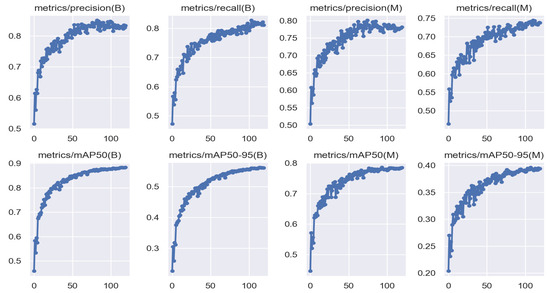
Figure 8.
Precision and recall curves.
As can be seen from Table 4, the three improvement strategies proposed in this paper led to a certain degree of improvement in the YOLO v8 model on the plateau mouse rabbit hole dataset. Among them, the CBAM attention mechanism achieved the most obvious improvement, and according to the experimental data demonstration, the CBAM module mainly improved the recognition rate of gnawed mouse holes, and the boundary depiction of gnawed mouse holes in the validation set was closer to the actual value. The DRConv module also improves the model, as it improves the representation of the convolution so that the recognition accuracy of all categories is improved accordingly. Using the three improvement strategies simultaneously, the best performance was achieved for all metrics, with the average accuracy rate increasing from 77.9% to 82.74%, the mAP50 increasing from 76.55% to 83.54%, and the average recall rate increasing from 71.53% to 81.39%. The mIoU increased from 67.65% to 72.69%. The change in mIou for each of these categories is shown in Table 5.
Table 5.
Lifting effects by category.
In Table 5, the segmentation accuracy of each category has been improved to some extent, among which the improvement in the gnawed mouse holes is the most obvious, but the improvement in the stone category is not satisfactory. This paper mainly focuses on mouse holes; so, we will not investigate the reason why the stone category has no obvious improvement here.
Figure 9 shows the comparison of the prediction effect of the algorithm before and after the improvement of Figure 5. From the figure, it can be seen that the accuracy of all categories of segmentation has been improved, and the small stones that were not originally identified in the upper left corner are identified in the improved model. It can therefore be seen that the improved algorithm has a higher detection rate and has a much better overall segmentation performance.
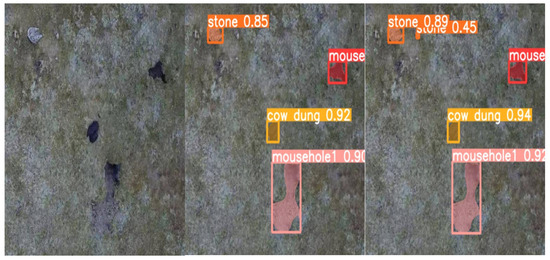
Figure 9.
Comparison of algorithm predictions.
4.3. Real-World Testing
After completing the debugging of the algorithm model, the model was deployed to the server and traveled to the field to test the model’s effectiveness. Under the guidance of experts from the Qinghai Grassland General Station, the author’s team visited areas where plateau sage-grouse are active, photographed them with a drone, uploaded the results to the server, and tested the model. Comparing the two figures, there is not much difference in the number of sage-grouse holes present in the same height shot, but most of the holes in Figure 10 are ungnawed sage-grouse holes, whereas in Figure 10 there are more gnawed sage-grouse holes and a larger area of gnawed sage-grouse holes, accounting for more than 35% of the area, which is a severely eroded grassland. For the corresponding area in Figure 11, prevention and reasonable guidance are needed, while for the corresponding area in Figure 11, measures such as grassland restoration and rodent eradication are needed.
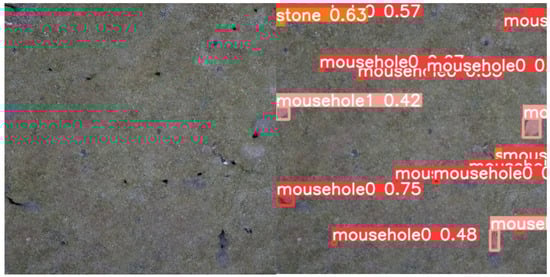
Figure 10.
Low hazard meadow scene segmentation.
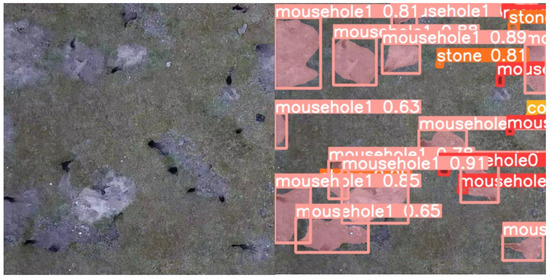
Figure 11.
High hazard meadow scene segmentation.
To evaluate the model’s generalizability and robustness, we also conducted cross-dataset validation, testing the model on multiple datasets to verify its applicability in various scenarios. These datasets include a private dataset containing three plant species: Thermopsis lanceolata, jjc, and zmc. Although the dataset is currently confidential, we have provided sample images in Figure 12, Figure 13 and Figure 14 to demonstrate the model’s detection performance across different plant types. By testing the model on these datasets with varying environmental conditions and object characteristics, we validated the model’s generalizability across diverse real-world scenarios. The results show that the model effectively handles different plant species and demonstrates strong robustness in diverse conditions, further enhancing our confidence in its broad applicability in practical use.
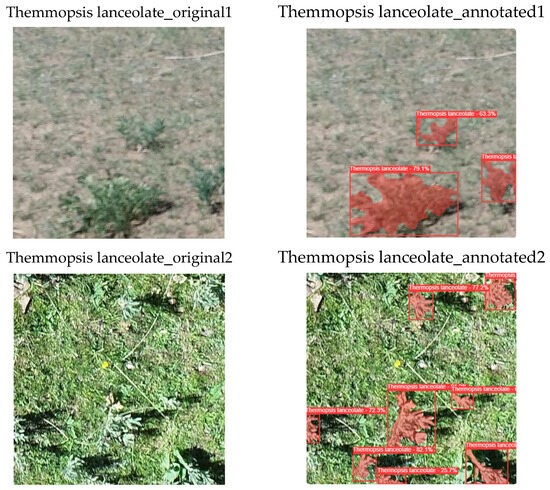
Figure 12.
Plant detection on Thermopsis lanceolata.
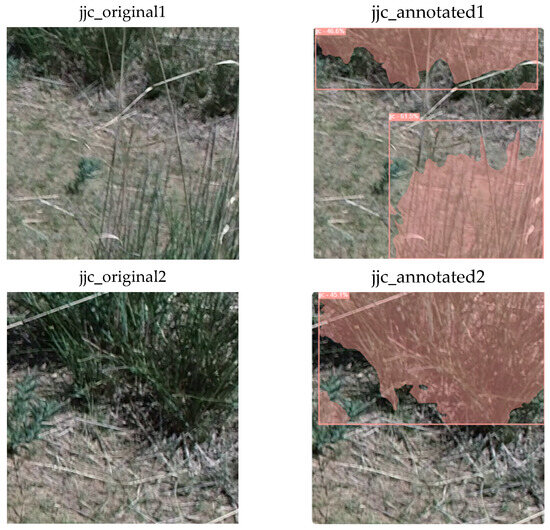
Figure 13.
Plant detection on jjc.
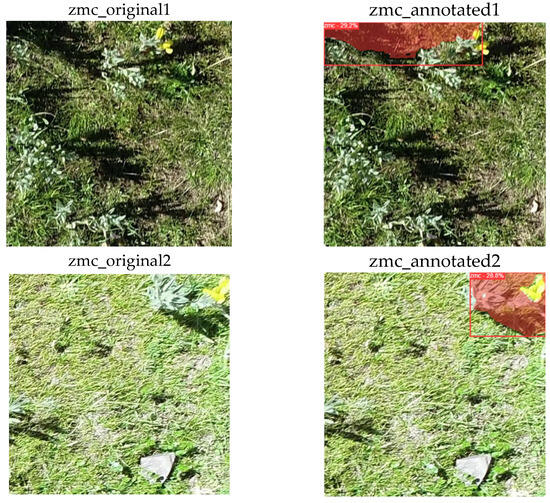
Figure 14.
Plant detection on zmc.
5. Conclusions
This paper focused on the degradation management of plateau grassland and developed a dataset specifically for plateau sage-grouse holes in the Qinghai region. Three different improvements were made to the YOLO v8 algorithm to enhance its effectiveness in practical tests. The improved model demonstrated superior performance compared to the original model and proved effective in detecting the degree of sage-grouse erosion in real-world scenarios. However, these improvements introduced additional parameters, which increased the model’s complexity and made it less lightweight.
In future research, the paper acknowledges the need for more lightweight improvement modules to strike a balance between model performance and real-time segmentation with low latency. The goal is to explore techniques that can further enhance the model’s performance while maintaining efficient and real-time segmentation capabilities. By incorporating lightweight improvements, the model can be optimized for practical applications in the field of plateau grassland degradation management.
Author Contributions
Conceptualization, Y.J. and Y.H.; methodology, Y.H., Y.J. and C.L.; software, Y.H., Y.J. and X.H.; validation, Y.J. and X.H.; formal analysis, X.H. and Y.H.; investigation, Y.H., Y.J., C.L. and X.H.; resources, Y.H. and X.H.; data curation, X.H. and Y.H.; writing—original draft preparation, Y.H.; writing—review and editing, Y.H., X.H. and C.L.; supervision, C.L.; project administration, C.L.; funding acquisition, C.L. All authors have read and agreed to the published version of the manuscript.
Funding
This research was funded by the National Natural Science Foundation of China (grant No. 62166033) and the Basic Research Project of Qinghai Province, China (grant No. 2024-ZJ-788). This research was supported by the High-performance Computing Center of Qinghai University.
Data Availability Statement
The datasets generated and analyzed during the current study are available from the corresponding author upon reasonable request. The data are not publicly available due to confidentiality requirements, as the project is currently in a confidential phase.
Acknowledgments
The authors thank the High-Performance Computing Center of Qinghai University for its support.
Conflicts of Interest
The authors declare no conflicts of interest.
Abbreviations
The following abbreviations are used in this manuscript:
| YOLO | You Only Look Once |
| FCN | Fully Convolutional Networks |
| LSTM | Long Short-Term Memory |
| DRConv | Dynamic Region-aware Convolution |
| C3 Module | Convolutional Block |
| C2f Module | Convolutional Block with 2 Filters and Skip Connection |
| CBAM | Convolutional Block Attention Module |
| box_loss | Bounding Box Loss |
| CoT | Contextual Transformer |
| 2D | Two-Dimensional |
| OpenCV | Open Source Computer Vision Library |
| GPU | Graphics Processing Unit |
| CUDA | Compute Unified Device Architecture |
| Cls_loss | Classification Loss |
| SPPF | Spatial Pyramid Pooling Fast |
| CSPLayer | Cross Stage Partial Layer |
| DFL_loss | Distribution Focal Loss |
| mAP50 | Mean Average Precision at IoU Threshold 0.5 |
| mPrecision | Mean Precision |
| mRecall | Mean Recall |
| mIoU | Mean Intersection over Union |
References
- Zhao, Y.; Chen, D.; Fan, J. Sustainable development problems and countermeasures: A case study of the Qinghai-Tibet Plateau. Geogr. Sustain. 2020, 1, 275–283. [Google Scholar] [CrossRef]
- Liu, J.; Xu, X.; Shao, Q. Grassland degradation in the “three-river headwaters” region, Qinghai province. J. Geogr. Sci. 2008, 18, 259–273. [Google Scholar] [CrossRef]
- Wen, L.; Dong, S.; Li, Y.; Li, X.; Shi, J.; Wang, Y.; Liu, D.; Ma, Y. Effect of degradation intensity on grassland ecosystem services in the alpine region of Qinghai-Tibetan Plateau, China. PLoS ONE 2013, 8, e58432. [Google Scholar] [CrossRef]
- Zhou, Y.; Li, X.; Song, S.; Wu, X.; Li, F.; Xiang, H.; Tan, Q.; Cheng, F. The Current Situation and Control Measures of Rodent Infestation in the Grasslands of the Western Sichuan Plateau. Mod. Agric. Sci. Technol. 2021, 16, 132–134. [Google Scholar]
- Han, R.y.; Luo, Z.l.; Zhao, Z.p.; Xiao, N.w.; Shi, N.n.; Sun, G. Simulation of potential habitat and prediction of dispersal route of plateau pika (Ochotona curzoniae) in Qilian Mountains (Qinghai region). J. Fujian Agric. For. Univ. (Natural Sci. Ed.) 2022, 51, 546–554. [Google Scholar] [CrossRef]
- Liu, W.; Wang, X.; Zhou, L.; Zhou, H. Studies on destruction, prevention and control of plateau pikas in Kobresia pygmaea meadow. Acta Theriol. Sin. 2006, 23, 214–219. [Google Scholar] [CrossRef]
- Mohanty, S.P.; Hughes, D.P.; Salathé, M. Using deep learning for image-based plant disease detection. Front. Plant Sci. 2016, 7, 1419. [Google Scholar] [CrossRef]
- Trolliet, F.; Vermeulen, C.; Huynen, M.C.; Hambuckers, A. Use of camera traps for wildlife studies: A review. Biotechnol. Agron. Soc. Environ. 2014, 18, 446–454. [Google Scholar]
- Norouzzadeh, M.S.; Nguyen, A.; Kosmala, M.; Swanson, A.; Palmer, M.S.; Packer, C.; Clune, J. Automatically identifying, counting, and describing wild animals in camera-trap images with deep learning. Proc. Natl. Acad. Sci. USA 2018, 115, E5716–E5725. [Google Scholar] [CrossRef] [PubMed]
- Pound, M.P.; Atkinson, J.A.; Townsend, A.J.; Wilson, M.H.; Griffiths, M.; Jackson, A.S.; Bulat, A.; Tzimiropoulos, G.; Wells, D.M.; Murchie, E.H.; et al. Deep machine learning provides state-of-the-art performance in image-based plant phenotyping. Gigascience 2017, 6, gix083. [Google Scholar] [CrossRef] [PubMed]
- Weinstein, B.G.; Marconi, S.; Bohlman, S.; Zare, A.; White, E. Individual tree-crown detection in RGB imagery using semi-supervised deep learning neural networks. Remote Sens. 2019, 11, 1309. [Google Scholar] [CrossRef]
- Lin, T. Focal Loss for Dense Object Detection. arXiv 2017, arXiv:1708.02002. [Google Scholar]
- Kellenberger, B.; Marcos, D.; Tuia, D. Detecting mammals in UAV images: Best practices to address a substantially imbalanced dataset with deep learning. Remote Sens. Environ. 2018, 216, 139–153. [Google Scholar] [CrossRef]
- Shi, M.; Xie, F.; Zi, Y.; Yin, J. Cloud detection of remote sensing images by deep learning. In Proceedings of the 2016 IEEE International Geoscience and Remote Sensing Symposium (IGARSS), Beijing, China, 10–15 July 2016; pp. 701–704. [Google Scholar]
- Douarre, C.; Schielein, R.; Frindel, C.; Gerth, S.; Rousseau, D. Deep learning based root-soil segmentation from X-ray tomography images. BioRxiv 2016. preprint. [Google Scholar] [CrossRef]
- Romera-Paredes, B.; Torr, P.H.S. Recurrent instance segmentation. In Proceedings of the Computer Vision—ECCV 2016: 14th European Conference, Amsterdam, The Netherlands, 11–14 October 2016; Proceedings, Part VI 14. Springer: Berlin/Heidelberg, Germany, 2016; pp. 312–329. [Google Scholar]
- Wu, Y.N.; Ma, Y.J.; Liu, W.L.; Zhang, W.Z. Modeling the spatial distribution of plateau pika (Ochotona curzoniae) in the Qinghai Lake Basin, China. Animals 2019, 9, 843. [Google Scholar] [CrossRef]
- Qi, Y.; Pu, X.; Li, Y.; Li, D.; Huang, M.; Zheng, X.; Guo, J.; Chen, Z. Prediction of Suitable Distribution Area of Plateau pika (Ochotona curzoniae) in the Qinghai—Tibet Plateau under Shared Socioeconomic Pathways (SSPs). Sustainability 2022, 14, 12114. [Google Scholar] [CrossRef]
- Yan, X.; Jiang, Y.; Chen, S.; He, Z.; Li, C.; Xia, S.T.; Dai, T.; Dong, S.; Zheng, F. Automatic Grassland Degradation Estimation Using Deep Learning. In Proceedings of the IJCAI, Macao, 10–16 August 2019; pp. 6028–6034. [Google Scholar]
- Christin, S.; Hervet, É.; Lecomte, N. Applications for deep learning in ecology. Methods Ecol. Evol. 2019, 10, 1632–1644. [Google Scholar] [CrossRef]
- Xingkang, Y. A Brief Discussion on the Causes and Management Strategies of Grassland Degradation. J. Grassl. Forage Sci. 2011, 38–39. Available online: https://kns.cnki.net/kcms2/article/abstract?v=ubvk7Q5sd3w03lyI_iSgZXOIMl9dGsbKe81s3iHROwr25fvjf65kn40LwM-eVg3SWtPsLhRuFS08Tl6jSiCElKeFFk4K9ir1sG3z7KDxTBFKUh4xDke9cinWlWGMduN_AHq2liN-7HaMKNfObdaFD1nnT0KgzD79&uniplatform=NZKPT (accessed on 16 October 2024).
- Lin, J.P.; Sun, M.T. A YOLO-based traffic counting system. In Proceedings of the 2018 Conference on Technologies and Applications of Artificial Intelligence (TAAI), Taichung, Taiwan, 30 November–2 December 2018; pp. 82–85. [Google Scholar]
- Dong, G.; Yan, Y.; Shen, C.; Wang, H. Real-time high-performance semantic image segmentation of urban street scenes. IEEE Trans. Intell. Transp. Syst. 2020, 22, 3258–3274. [Google Scholar] [CrossRef]
- Sindhu, R.S.; Jose, G.; Shibon, S.; Varun, V.V. Using YOLO based deep learning network for real time detection and localization of lung nodules from low dose CT scans. In Proceedings of the Medical Imaging 2018: Computer-Aided Diagnosis, SPIE, Houston, TX, USA, 12–15 February 2018; Volume 10575, pp. 347–355. [Google Scholar]
- Huang, H.; Lin, L.; Tong, R.; Hu, H.; Zhang, Q.; Iwamoto, Y.; Han, X.; Chen, Y.W.; Wu, J. Unet 3+: A full-scale connected unet for medical image segmentation. In Proceedings of the ICASSP 2020-2020 IEEE International Conference on Acoustics, Speech and Signal Processing (ICASSP), Barcelona, Spain, 4–8 May 2020; pp. 1055–1059. [Google Scholar]
- Ronneberger, O.; Fischer, P.; Brox, T. U-net: Convolutional networks for biomedical image segmentation. In Proceedings of the Medical Image Computing and Computer-Assisted Intervention—MICCAI 2015: 18th International Conference, Munich, Germany, 5–9 October 2015; Proceedings, part III 18. Springer: Berlin/Heidelberg, Germany, 2015; pp. 234–241. [Google Scholar]
- Wu, X.; He, Y.; Zhou, H.; Cheng, L.; Ding, M. Research on the personnel recognition in monitored water area based on improved YOLO v7 algorithm. J. Electron. Meas. Instrum. 2023, 37, 20–27. [Google Scholar]
- Diaz-Zapata, M.; Erkent, Ö.; Laugier, C. Yolo-based panoptic segmentation network. In Proceedings of the 2021 IEEE 45th Annual Computers Software, and Applications Conference (COMPSAC), Madrid, Spain, 12–16 July 2021; pp. 1230–1234. [Google Scholar]
- Mohamed, E.; Shaker, A.; El-Sallab, A.; Hadhoud, M. Insta-yolo: Real-time instance segmentation. arXiv 2021, arXiv:2102.06777. [Google Scholar]
- Yu, Z.; Huang, H.; Chen, W.; Su, Y.; Liu, Y.; Wang, X. Yolo-facev2: A scale and occlusion aware face detector. Pattern Recognit. 2024, 155, 110714. [Google Scholar] [CrossRef]
- Li, X.; Zhao, S.; Chen, C.; Cui, H.; Li, D.; Zhao, R. YOLO-FD: An accurate fish disease detection method based on multi-task learning. Expert Syst. Appl. 2024, 258, 125085. [Google Scholar] [CrossRef]
- Rehman, M.U.; Eesaar, H.; Abbas, Z.; Seneviratne, L.; Hussain, I.; Chong, K.T. Advanced drone-based weed detection using feature-enriched deep learning approach. Knowl.-Based Syst. 2024, 303, 112655. [Google Scholar] [CrossRef]
- Jing, R.; Niu, Q.; Tian, Y.; Zhang, H.; Zhao, Q.; Li, Z.; Zhou, X.; Li, D. Sunflower-YOLO: Detection of sunflower capitula in UAV remote sensing images. Eur. J. Agron. 2024, 160, 127332. [Google Scholar] [CrossRef]
- Bochkovskiy, A.; Wang, C.Y.; Liao, H.Y.M. Yolov4: Optimal speed and accuracy of object detection. arXiv 2020, arXiv:2004.10934. [Google Scholar]
- Dosovitskiy, A. An image is worth 16x16 words: Transformers for image recognition at scale. arXiv 2020, arXiv:2010.11929. [Google Scholar]
- Li, Y.; Yao, T.; Pan, Y.; Mei, T. Contextual transformer networks for visual recognition. IEEE Trans. Pattern Anal. Mach. Intell. 2022, 45, 1489–1500. [Google Scholar] [CrossRef]
- Chen, J.; Wang, X.; Guo, Z.; Zhang, X.; Sun, J. Dynamic region-aware convolution. In Proceedings of the IEEE/CVF Conference on Computer Vision and Pattern Recognition, Nashville, TN, USA, 20–25 June 2021; pp. 8064–8073. [Google Scholar]
- Woo, S.; Park, J.; Lee, J.Y.; Kweon, I.S. Cbam: Convolutional block attention module. In Proceedings of the European Conference on Computer Vision (ECCV), Munich, Germany, 8–14 September 2018; pp. 3–19. [Google Scholar]
Disclaimer/Publisher’s Note: The statements, opinions and data contained in all publications are solely those of the individual author(s) and contributor(s) and not of MDPI and/or the editor(s). MDPI and/or the editor(s) disclaim responsibility for any injury to people or property resulting from any ideas, methods, instructions or products referred to in the content. |
© 2024 by the authors. Licensee MDPI, Basel, Switzerland. This article is an open access article distributed under the terms and conditions of the Creative Commons Attribution (CC BY) license (https://creativecommons.org/licenses/by/4.0/).