Article

Study on Steady Flow Force of a Bidirectional Throttling Slide Valve and Its Compensation Optimization

1
National Key Laboratory on Ship Vibration and Noise, China Ship Scientific Research Center, Wuxi 214082, China
2
Department of Fluid Control and Automation, Harbin Institute of Technology, Harbin 150006, China
3
The 28th Research Institute of China Electronics Technology Group Corporation, Nanjing 210007, China
*
Author to whom correspondence should be addressed.
Appl. Sci. 2024, 14(23), 11037; https://doi.org/10.3390/app142311037
Submission received: 21 October 2024 / Revised: 19 November 2024 / Accepted: 26 November 2024 / Published: 27 November 2024

Abstract

:
This paper focuses on a typical pressure-controlled slide valve, utilizing momentum analysis and computational fluid dynamics to simulate and analyze the asymmetry of steady flow force curves under bidirectional throttling patterns. The entropy production theory is employed to reveal the causes of nonlinearity in the steady flow force of an inlet throttling slide valve. Based on flow field analysis, a flow force compensation scheme is proposed by adding a guiding shoulder and matching it with a suitably sized inner annular cavity. The study reveals that fluid momentum at the non-throttling valve port is the primary cause of the bidirectional throttling flow force difference, and under large-opening inlet throttling conditions, it may reverse the direction of the flow force. Vortex separation caused by turbulent pulsations is one of the intrinsic reasons for the nonlinearity of steady flow force.

1. Introduction

When high-speed jets flow within hydraulic valves, the force exerted on the spool due to changes in fluid momentum is referred to as flow force. This force is one of the key factors determining the performance of many hydraulic components, including power output, stability, and dynamic characteristics [1,2,3]. For instance, in servo proportional valves used in high-performance applications, the presence of flow force impedes the opening of the valve port, limiting the improvement of both performance and control precision [4]. In the case of widely used single-stage electro-hydraulic valves, flow force significantly reduces spool stability under conditions of high pressure differentials or large flow rates, thus restricting the applicable flow and bandwidth range of such valves [5]. Over the past decades, extensive research has been conducted on the theoretical, numerical, and experimental aspects of valve flow force characteristics, continuously exploring effective ways to compensate or control the flow forces acting on the spool.
The flow force acting on the spool can be divided into steady and transient flow forces, with the transient force typically being much smaller than the steady force [6]. There are three main approaches to studying steady flow force: theoretical methods, experimental methods, and numerical simulation methods [7]. Theoretical methods typically separate the calculation of pressure and viscous flow forces, estimating the forces on the spool using the momentum theorem [8]. However, theoretical methods rely on a series of simplifications and assumptions, often leading to discrepancies compared to actual scenarios. The application of simulation environments and optimization procedures (software) gives designers information about the optimal structure. Such approaches allow to one to avoid building many prototypes and save the design costs [9]. In fact, using CFD to optimize the structure of various hydraulic valves before conducting experimental validation has become the mainstream approach for studying spool flow force characteristics and compensation methods.
In terms of flow force characteristics, several scholars have investigated the behavior of spool flow forces under different throttling types and operating conditions. Amirante et al. [10,11] compared the peak flow force at the initial opening of spools in open- and closed-center directional control valves. Their study showed that, in open-center valves, the flow force increases with pump flow, with the peak force occurring when recirculation flow disappears, while its position remains constant. In closed-center valves, the position of the flow force peak depends on the pump flow rate and pressure drop. Yuan and Li [5] analyzed the effects of viscosity and non-metering momentum flux on steady flow forces, noting that viscosity increases the steady flow force for positive damping lengths, while it tends to reduce the force for negative damping lengths. Aung et al. [12], considering seven different flow conditions, studied the flow force characteristics of a nozzle–flapper pilot valve. The results showed that during the reattachment process of the radial jet forming a vortex within the pilot valve annulus, undesirable flow forces causing flapper instability arise, in addition to the main flow forces acting on the flapper. Ye et al. [13] examined the influence of groove geometry on the flow characteristics of slide valves, finding that the groove shape significantly affects flow area, jet angle, steady flow forces, and throttling stiffness. In particular, the throttling stiffness of a U-shaped valve port lies between that of spherical and triangular valve ports. Han et al. [14] conducted numerical studies on the flow forces within three typical conical valve structures used in water hydraulic valves, revealing that cavitation slightly reduces flow forces. However, two-stage throttle valves can effectively suppress cavitation, though their flow forces are much larger than those of other valves.
For the purpose of weakening steady flow forces to improve valve performance and operational limits, many scholars have proposed compensation methods for spool steady flow forces in various hydraulic valves. These methods mainly focus on optimizing the design of the spool, valve sleeve, and valve body flow paths, typically by adding or removing certain structures or merely modifying the parameters of the original valve design [3]. Simic and Herakovic [15] optimized all the geometric parameters of the spool to minimize steady flow forces, significantly enhancing the overall performance of a small hydraulic seat valve. Chen et al. [16] reduced steady flow forces by adjusting the shoulder angle of the spool, thereby changing the outlet jet angle, and demonstrated that this compensation method had a negligible effect on the flow capacity of a servo proportional valve. Li et al. [17,18,19] reduced the steady flow forces in hydraulic slide valves by designing jet guide grooves on the spool shoulder and adopting tapered valve stems. Wu et al. [20] compensated for steady flow forces by altering the angle between the inlet of the valve sleeve and the spool axis, improving the dynamic response of a two-dimensional water hydraulic servo valve. Tan et al. [21,22] introduced damping flanges and damping tail structures on the spool to compensate for steady flow forces in diverged-flow and converged-flow cartridge proportional valves. Amirante et al. [23,24] redesigned the lateral surface of the spool by cutting notches into the spool end face, significantly reducing the driving force of a direct proportional valve, a method also used by Lisowski et al. [25] to improve the flow characteristics during the opening phase of a proportional valve. Additionally, Lisowski et al. [26] introduced extra compensating flow paths within the valve body, causing the flow forces from multiple flow streams on the spool to cancel each other out, increasing the flow range by about 45% without requiring changes to springs or solenoids. Furthermore, some researchers have attempted to utilize, rather than reduce, flow forces. For instance, Lisowski et al. [27] employed the flow forces on the spool to provide pressure compensation for multi-section proportional directional control valves.
Despite numerous studies on the flow forces in hydraulic valves, the detailed mechanism of flow force formation on the valve spool, particularly its fluid dynamic causes, remains an unresolved fundamental issue. The asymmetric phenomenon of steady flow forces in hydraulic slide valves operating in bidirectional throttling mode and its underlying causes remain unclear. Investigating this phenomenon holds significant implications for mitigating steady flow forces in bidirectional throttling mode. The organization of this paper is as follows: In Section 2, we introduce the momentum analysis of the steady flow forces in the slide valve and the flow field simulation methods. Section 3 presents a detailed numerical study on the asymmetry of steady flow force characteristics in the inlet and outlet throttling modes of the slide valve. In Section 4, based on the analysis results, a steady flow force compensation scheme is proposed, and an automatic optimization platform for structural parameters is established. Section 5 describes the design of a steady flow force measurement test bench to validate the effectiveness of the proposed compensation structure. Section 6 provides a summary of the paper.

2. Numerical Simulation of Flow Forces in Slide Valves

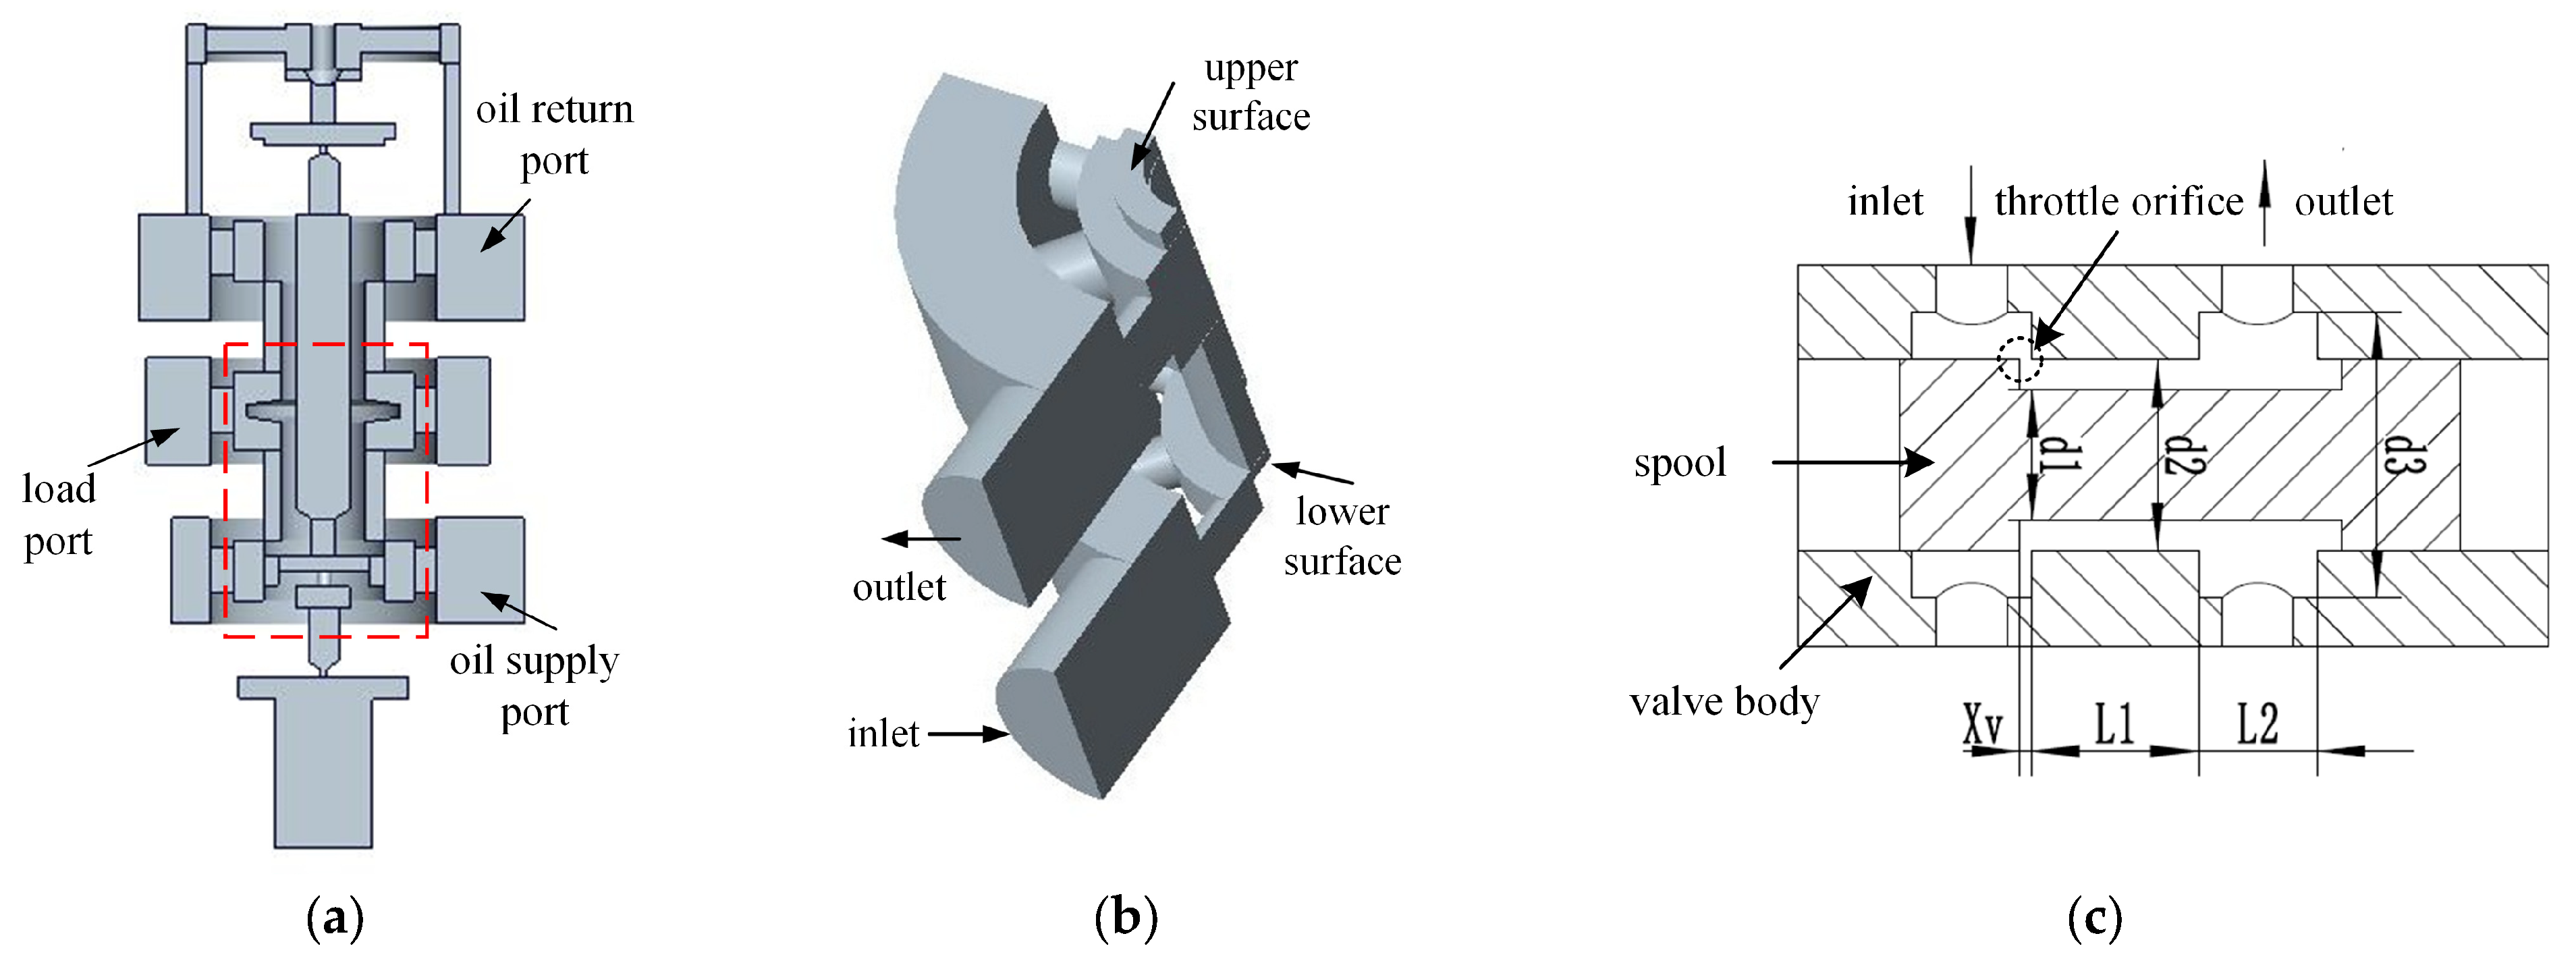
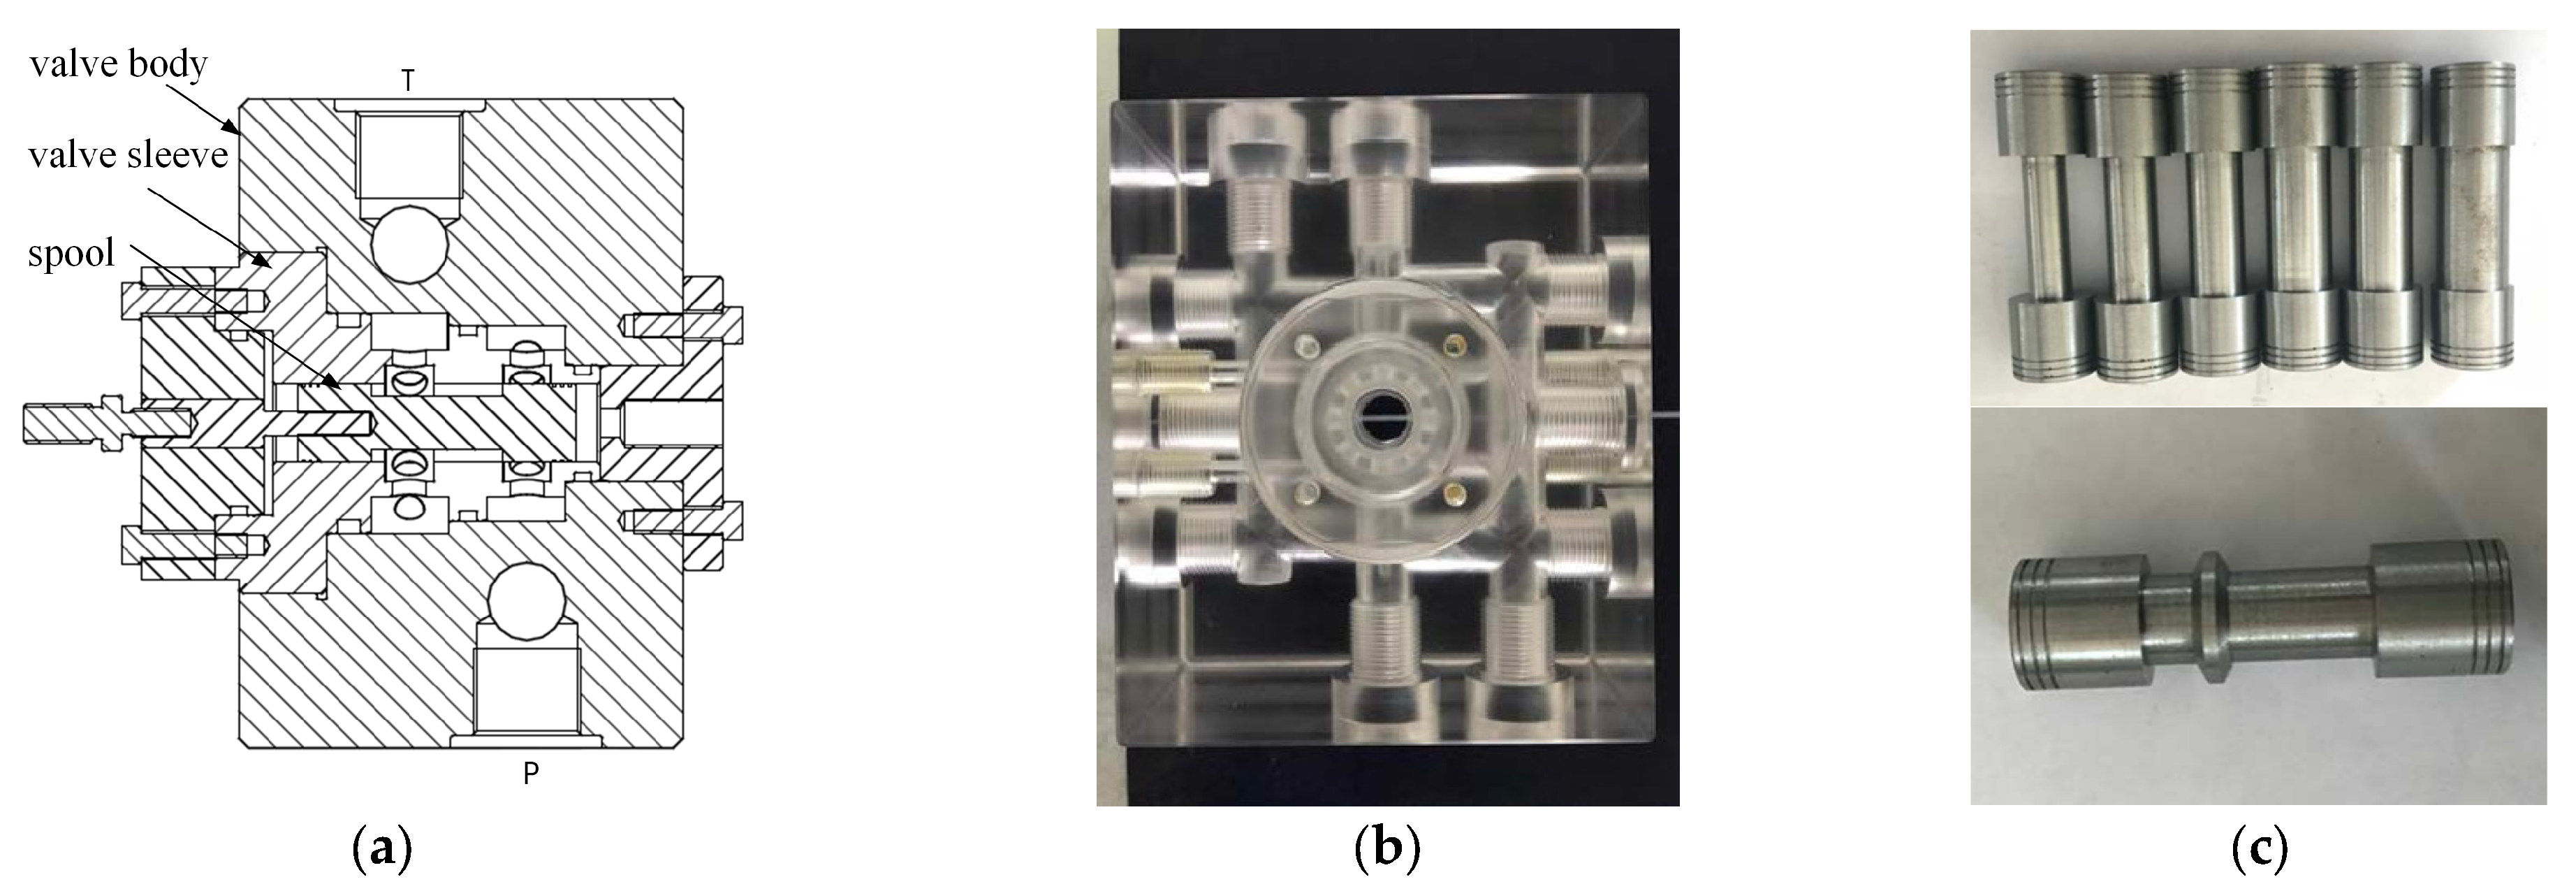
2.1. Slide Valve Structure and Flow Path Modeling

Figure 1a shows the flow path model of a pressure relief valve used in a type of armored vehicle. When the valve is in operation, hydraulic oil flows from the supply port through the slide valve chamber to the load port, making the segment between the supply and load ports the primary area of interest for flow field analysis. Considering that one of the main objectives of this study is to investigate the differences in flow force characteristics of the slide valve under bidirectional flow and their causes, the inlet and outlet are idealized as double openings to minimize the disturbance effects of flow at both ends. Figure 1b presents the simplified quarter model of the flow path. Figure 1c illustrates the structural schematic of the slide valve chamber under inlet throttling mode, with reversing the flow direction representing the outlet throttling mode. Here, xv denotes the valve opening, and d1, d2, and d3 represent the diameters of the valve stem, inner annular chamber, and outer annular chamber, respectively.

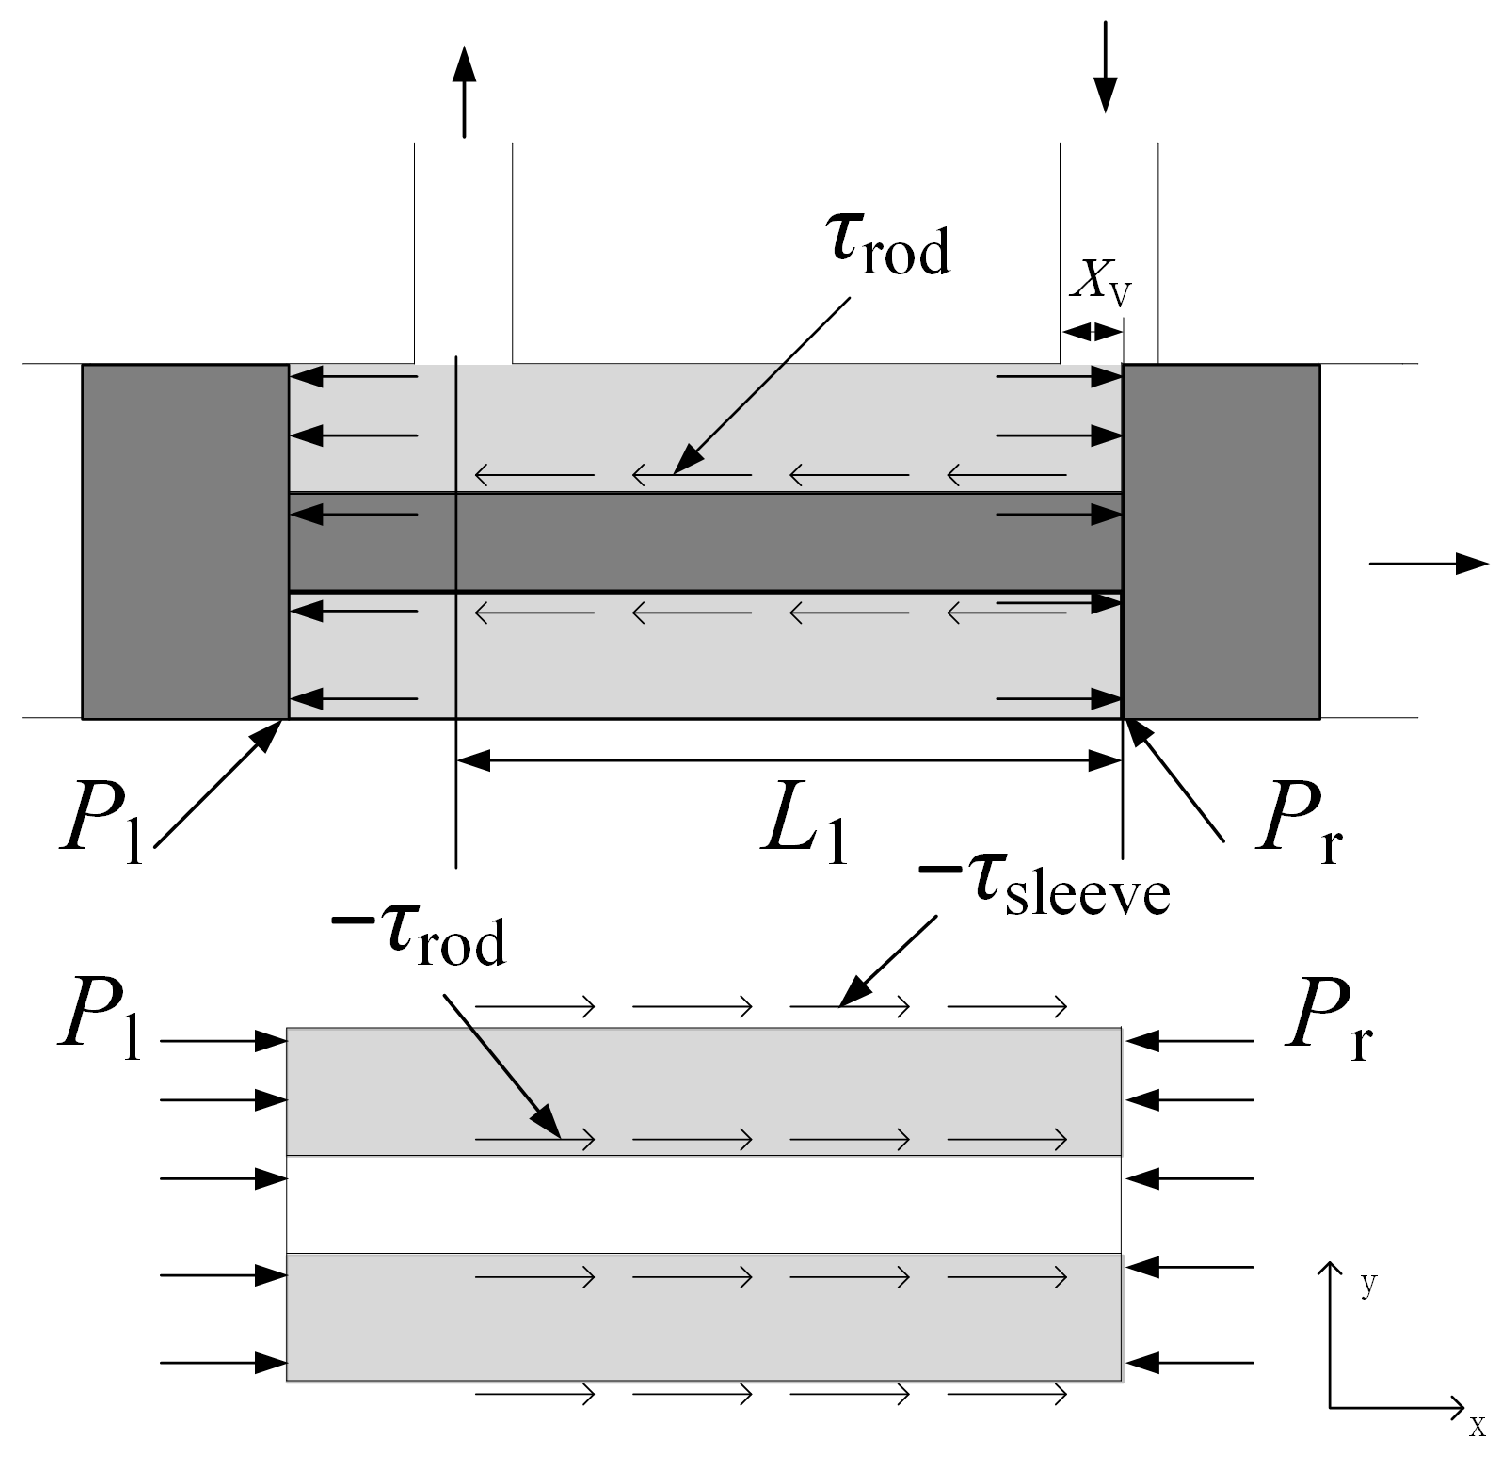
2.2. Calculation of Steady Flow Force

The calculation of steady flow force can be performed either by integrating the pressure on the valve spool or by calculating the momentum of the fluid within the control volume. Figure 2 shows a schematic of the forces acting on the valve chamber in the inlet throttling mode. Focusing on the spool and considering the fluid viscosity, the steady flow force is the sum of the pressure differential across the shoulders of the spool and the viscous force acting on the valve stem:
F s p o o l = A l P l d A A r P r d A + A s t e m τ s t e m d A
where Fspool represents the steady flow force acting on the spool, in N; Pl is the pressure on the left shoulder, in Pa; Pr is the pressure on the right shoulder, in Pa; τstem is the viscous shear force acting on the valve stem, in N; Al is the annular area of the left shoulder, in m2; Ar is the annular area of the right shoulder, in m2; and Astem is the cylindrical surface area of the valve stem, in m2.
Considering the control volume (CV) formed by the inlet and outlet flow cross-sections of the valve chamber and the inner wall of the chamber, the momentum theorem is applied as follows:
F s p o o l A s l e e v e τ s l e e v e d A = d d t CV ρ v x d V + CV ρ v x v n d A
where v is the fluid velocity, in m/s; vx is the axial component of the fluid velocity, in m/s; n is the normal vector of the area element dA; and Asleeve is the cylindrical surface area of the valve body in m2. The left-hand side of the equation represents the force exerted by the spool and valve body on the fluid within the control volume, while the right-hand side represents the rate of change in fluid momentum over time and the net flux within the control volume. For steady flow, neglecting the instantaneous change in fluid momentum, we have
F s p o o l = i n l e t ρ v x v n d A + o u t l e t ρ v x v n d A A s l e e v e τ s l e e v e d A
The steady flow force of a slide valve is usually estimated in engineering using an empirical formula based on the momentum theorem:
F s p o o l = ρ q v 1 cos θ 1 ρ q v 2 cos θ 2
where v1 and v2 are the inflow and outflow velocities of the fluid and θ1 and θ2 are the inflow and outflow jet angles, respectively. Additionally, it is commonly assumed that one of the fluid inflow or outflow angles approaches 90° (depending on the throttling type). Combined with the valve flow equation, we have
q = A v = C q A x v 2 Δ p / ρ
F s p o o l ρ q v i cos θ i = 2 C q A x v Δ p cos θ i
where i = 1,2; Cq is the flow coefficient, typically taken as 0.62; A is the flow area; Δp is the pressure differential across the valve port; and the jet angle is commonly taken as 69°.

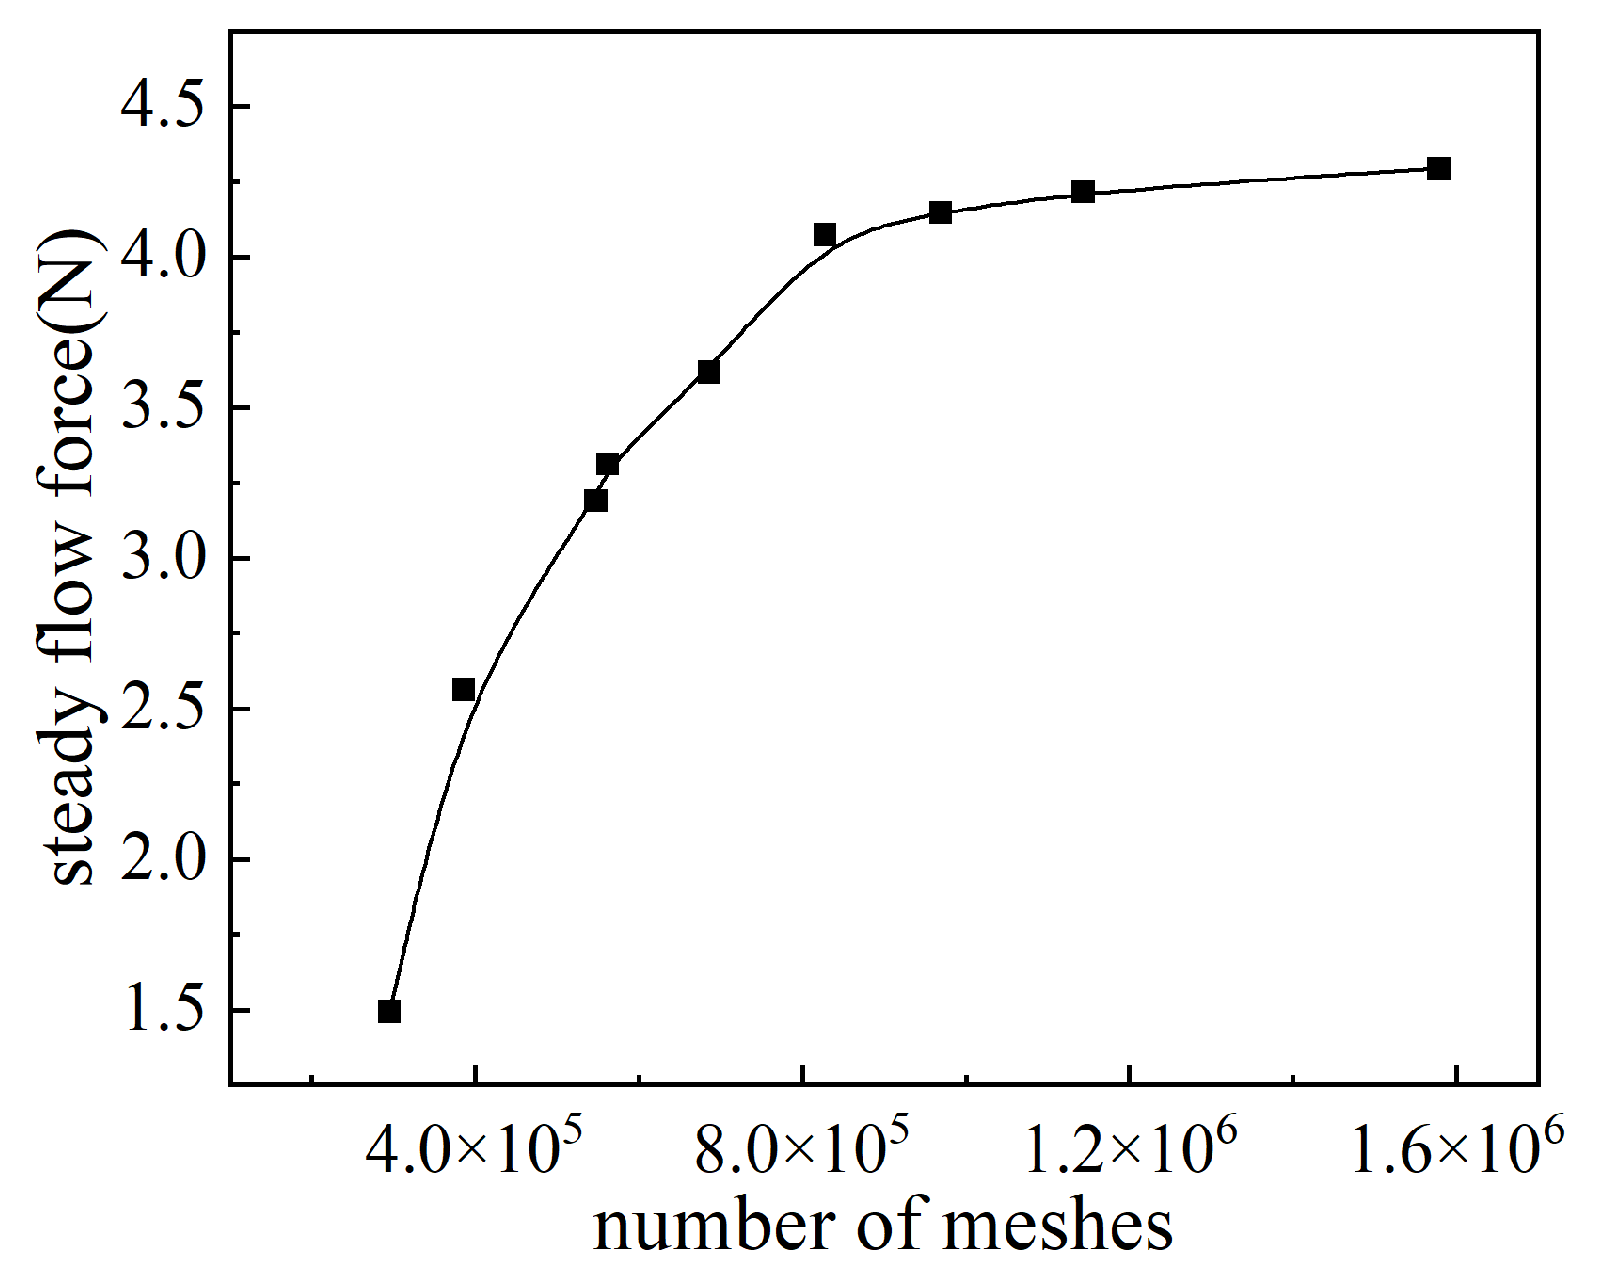
2.3. CFD Simulation of Flow Force

The flow channel model of the pressure relief valve is created in the 3D modeling software ProE 5.0 and imported into ANSYS/Fluent 17.0 for fluid domain numerical simulation. ANSYS/Fluent 17.0 provides various turbulence models, including k-ε, k-ω, and Reynolds models. Due to the throttling effect at the valve port, the velocity gradient of the fluid in the valve chamber is significant, with a high Reynolds number flow at the center of the valve chamber and low Reynolds number flow near the wall. According to Pan et al. [28], the k-ε model performs well in hydraulic flow fields, and it has been successfully used in numerous studies of steady flow forces on valve spools, such as those by Lisowski et al. [25,26,29], Tan et al. [21,22] and Li et al. [18,19]. The governing equations of the k-ε turbulence model are as follows:
t ρ k + x i ρ k u i = x i [ μ + μ t σ k k x j ] + G k + G b ρ ε Y M + S k
t ρ ε + x i ρ ε u i = x j [ μ + μ t σ ε ε x j ] + C 1 ε ε k G k + C 3 ε G b C 2 ε ρ ε 2 k + S ε
where Gk represents the turbulent kinetic energy generated by the mean velocity gradient; Gb denotes the turbulent kinetic energy generated by buoyancy; YM is the contribution of compressible turbulence expansion to the total dissipation rate; C1ε, C2ε, and C3ε are model constants; σk and σε are turbulent Prandtl numbers; Sk and Sε are user-defined source terms; and μt is the turbulent viscosity, which is related to k and ε as follows:
μ t = ρ C μ k 2 ε
where Cμ is a model constant. The coefficients in the k-ε turbulence model adopt the following recommended values [30]: C1ε = 1.44, C2ε = 1.92, C3ε = 0.09, σk = 1.0, and σε = 1.3.
In the low Reynolds number boundary layer region near the wall, viscous forces dominate momentum, mass, and heat transfer, and turbulence models cannot accurately resolve the flow field in the boundary layer. In this study, the enhanced wall treatment method in ANSYS/Fluent 17.0 is employed to handle boundary layers. This approach combines the two-layer zonal model with enhanced wall functions, making it independent of wall-law assumptions and well suited for complex flows, particularly low Reynolds number flows. When the near-wall mesh is sufficiently refined (the y+ of the first node near the wall close to 1), it can resolve the entire turbulent boundary layer, including the viscous sublayer [8].
The working fluid is hydraulic oil with a density of 870 kg/m3 and a dynamic viscosity of 0.04 Pa·s, while the mating clearance between the valve spool and sleeve is neglected. Pressure boundary conditions are applied at the inlet and outlet, with a typical pressure difference of 1 MPa, where the inlet pressure is 2.5 MPa and the outlet pressure is 1.5 MPa. Using the aforementioned CFD settings, the model is solved, and the obtained velocity, pressure, and other flow field information in the valve chamber are substituted into pressure Equation (1) and momentum Equation (3) to achieve a numerical solution for the steady flow force on the spool of the slide valve.
The geometric model of the flow path is discretized using an unstructured mesh, with five layers of boundary layer mesh near the walls and local refinement applied around the throttle valve port area. A grid independence study is performed for the spool valve under operating conditions of a 0.2 mm valve opening and a 1 MPa pressure drop. The internal flow field within the valve chamber is simulated for various mesh densities, with the steady flow force on the spool serving as the evaluation criterion for grid independence. The results, as shown in Figure 3, indicate that when the number of mesh elements exceeds 8 × 10⁵, the steady flow force remains essentially unchanged, with the deviation within 1%. This confirms that the mesh resolution meets the grid independence requirement. Therefore, subsequent calculations of the slide valve flow field are conducted using a mesh configuration with 8.27635 × 10⁵ elements.

3. Analysis of Flow Force Characteristics of Slide Valves

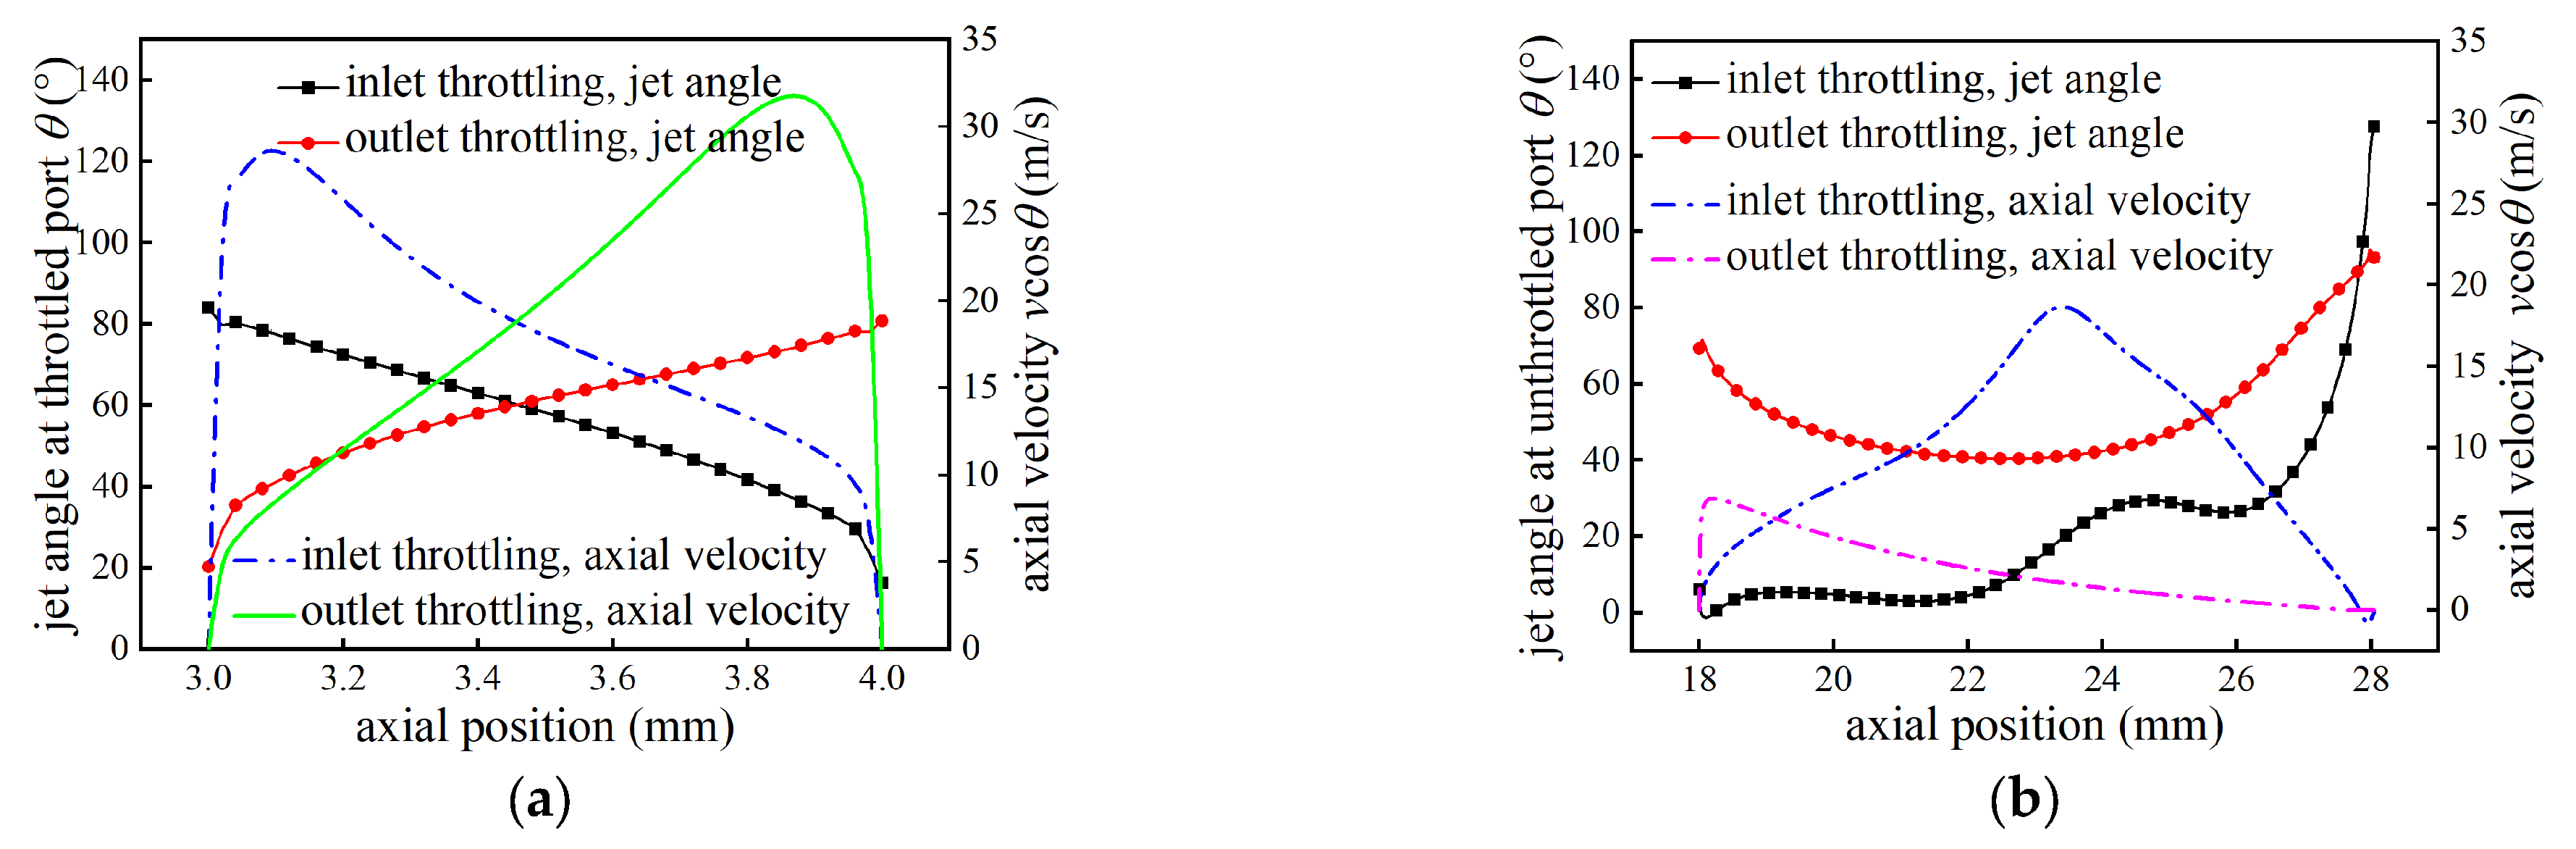
3.1. Flow Force Characteristics of Two Throttling Modes at a Fixed Opening

A numerical simulation was conducted for the two throttling modes of the slide valve under the typical pressure conditions described in the previous section, with a valve opening of 1 mm. Figure 4 shows the distribution of the jet angle and axial velocity of the fluid at the valve port along the axial position of the spool for both throttling modes. The jet angles of the fluid at the throttling valve port are nearly symmetrical in both modes, and the axial velocities are approximately equal, indicating that the fluid momentum at the throttling port is nearly identical. However, at the non-throttling valve port, the jet angle and axial velocity of the fluid differ significantly. Under inlet throttling conditions, the fluid’s jet angle at the non-throttling outlet is significantly lower than 90° and exhibits large fluctuations along the axial direction, primarily influenced by the vortices within the valve chamber, as shown in Figure 5. Consequently, the jet angle only approaches 90° at the outlet tail section, far from the vortex region. Since the downstream throttling port has less impact, the fluid flow at the non-throttling inlet is more uniform under the outlet throttling mode, resulting in a jet angle closer to 90° with smaller fluctuations. Moreover, the axial velocity of the fluid in the non-throttling valve port region is significantly lower under the outlet throttling mode compared to the inlet throttling mode.

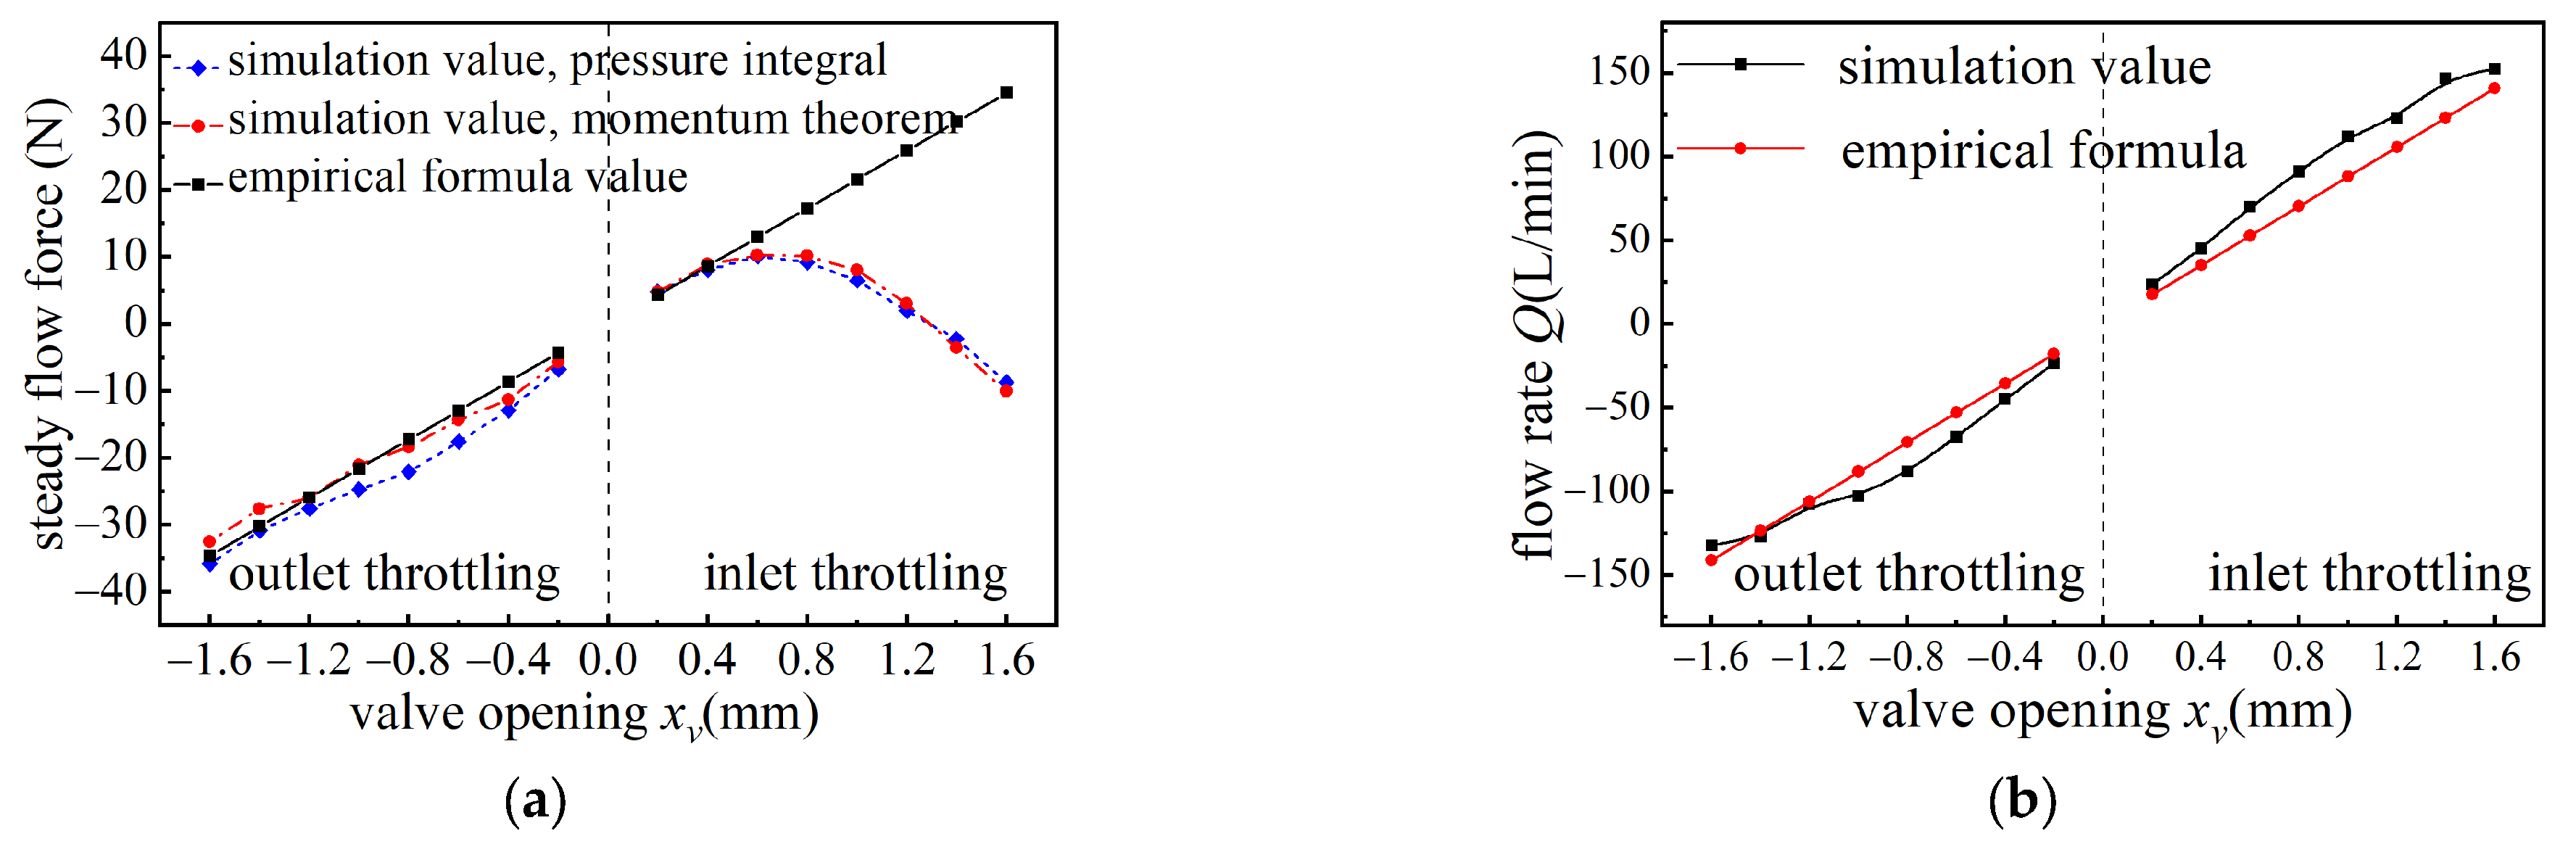
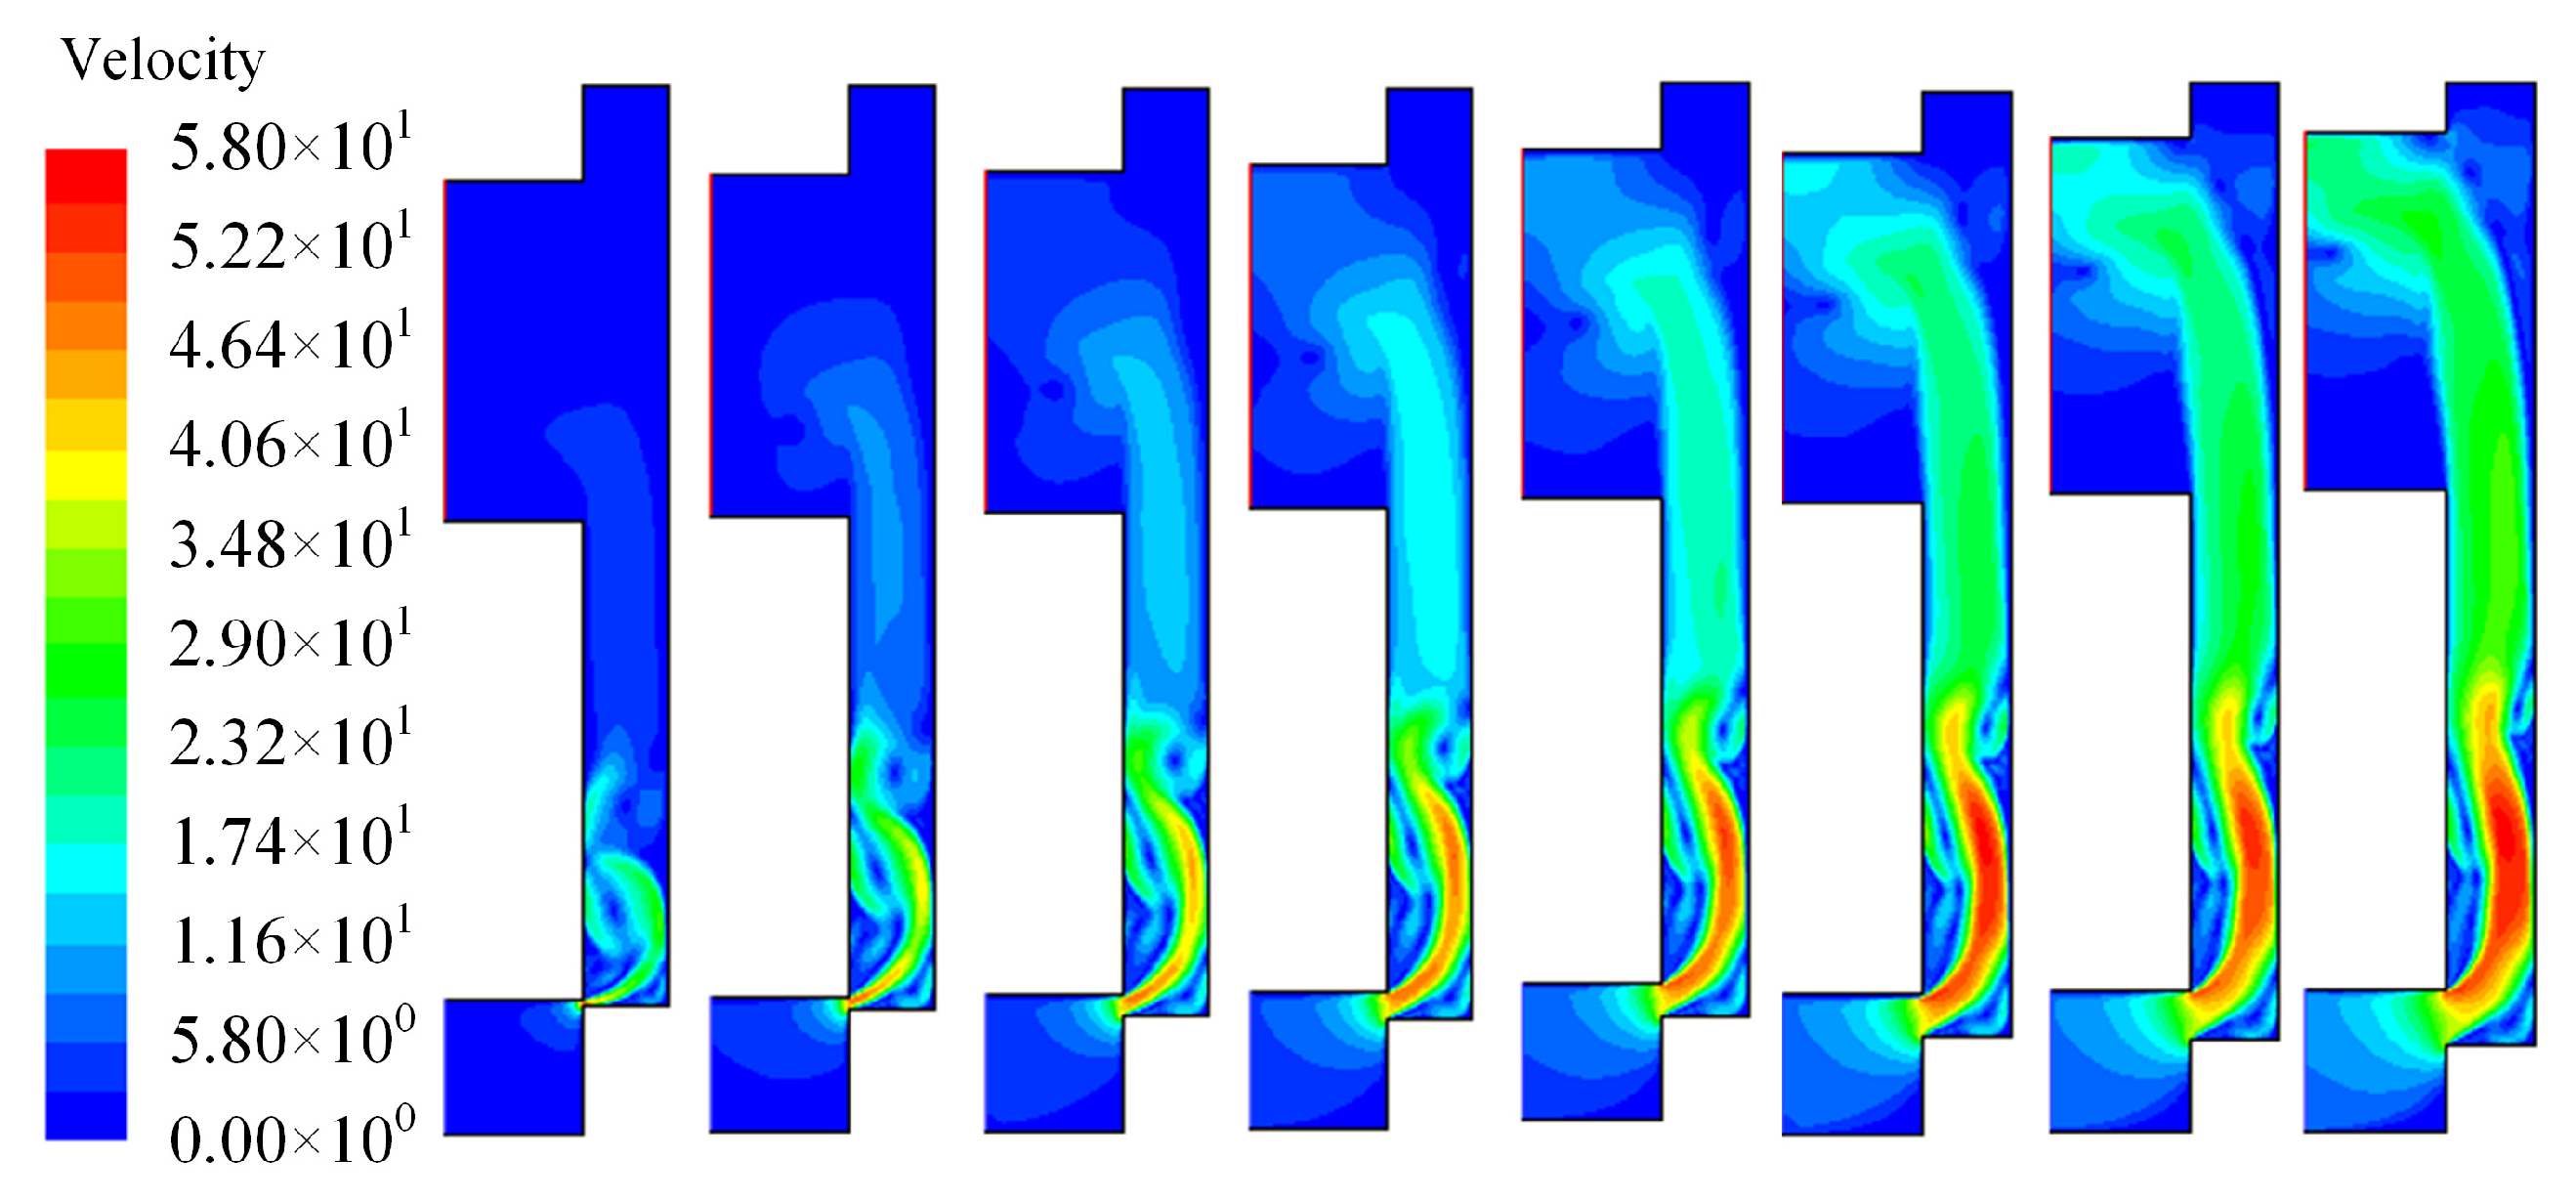
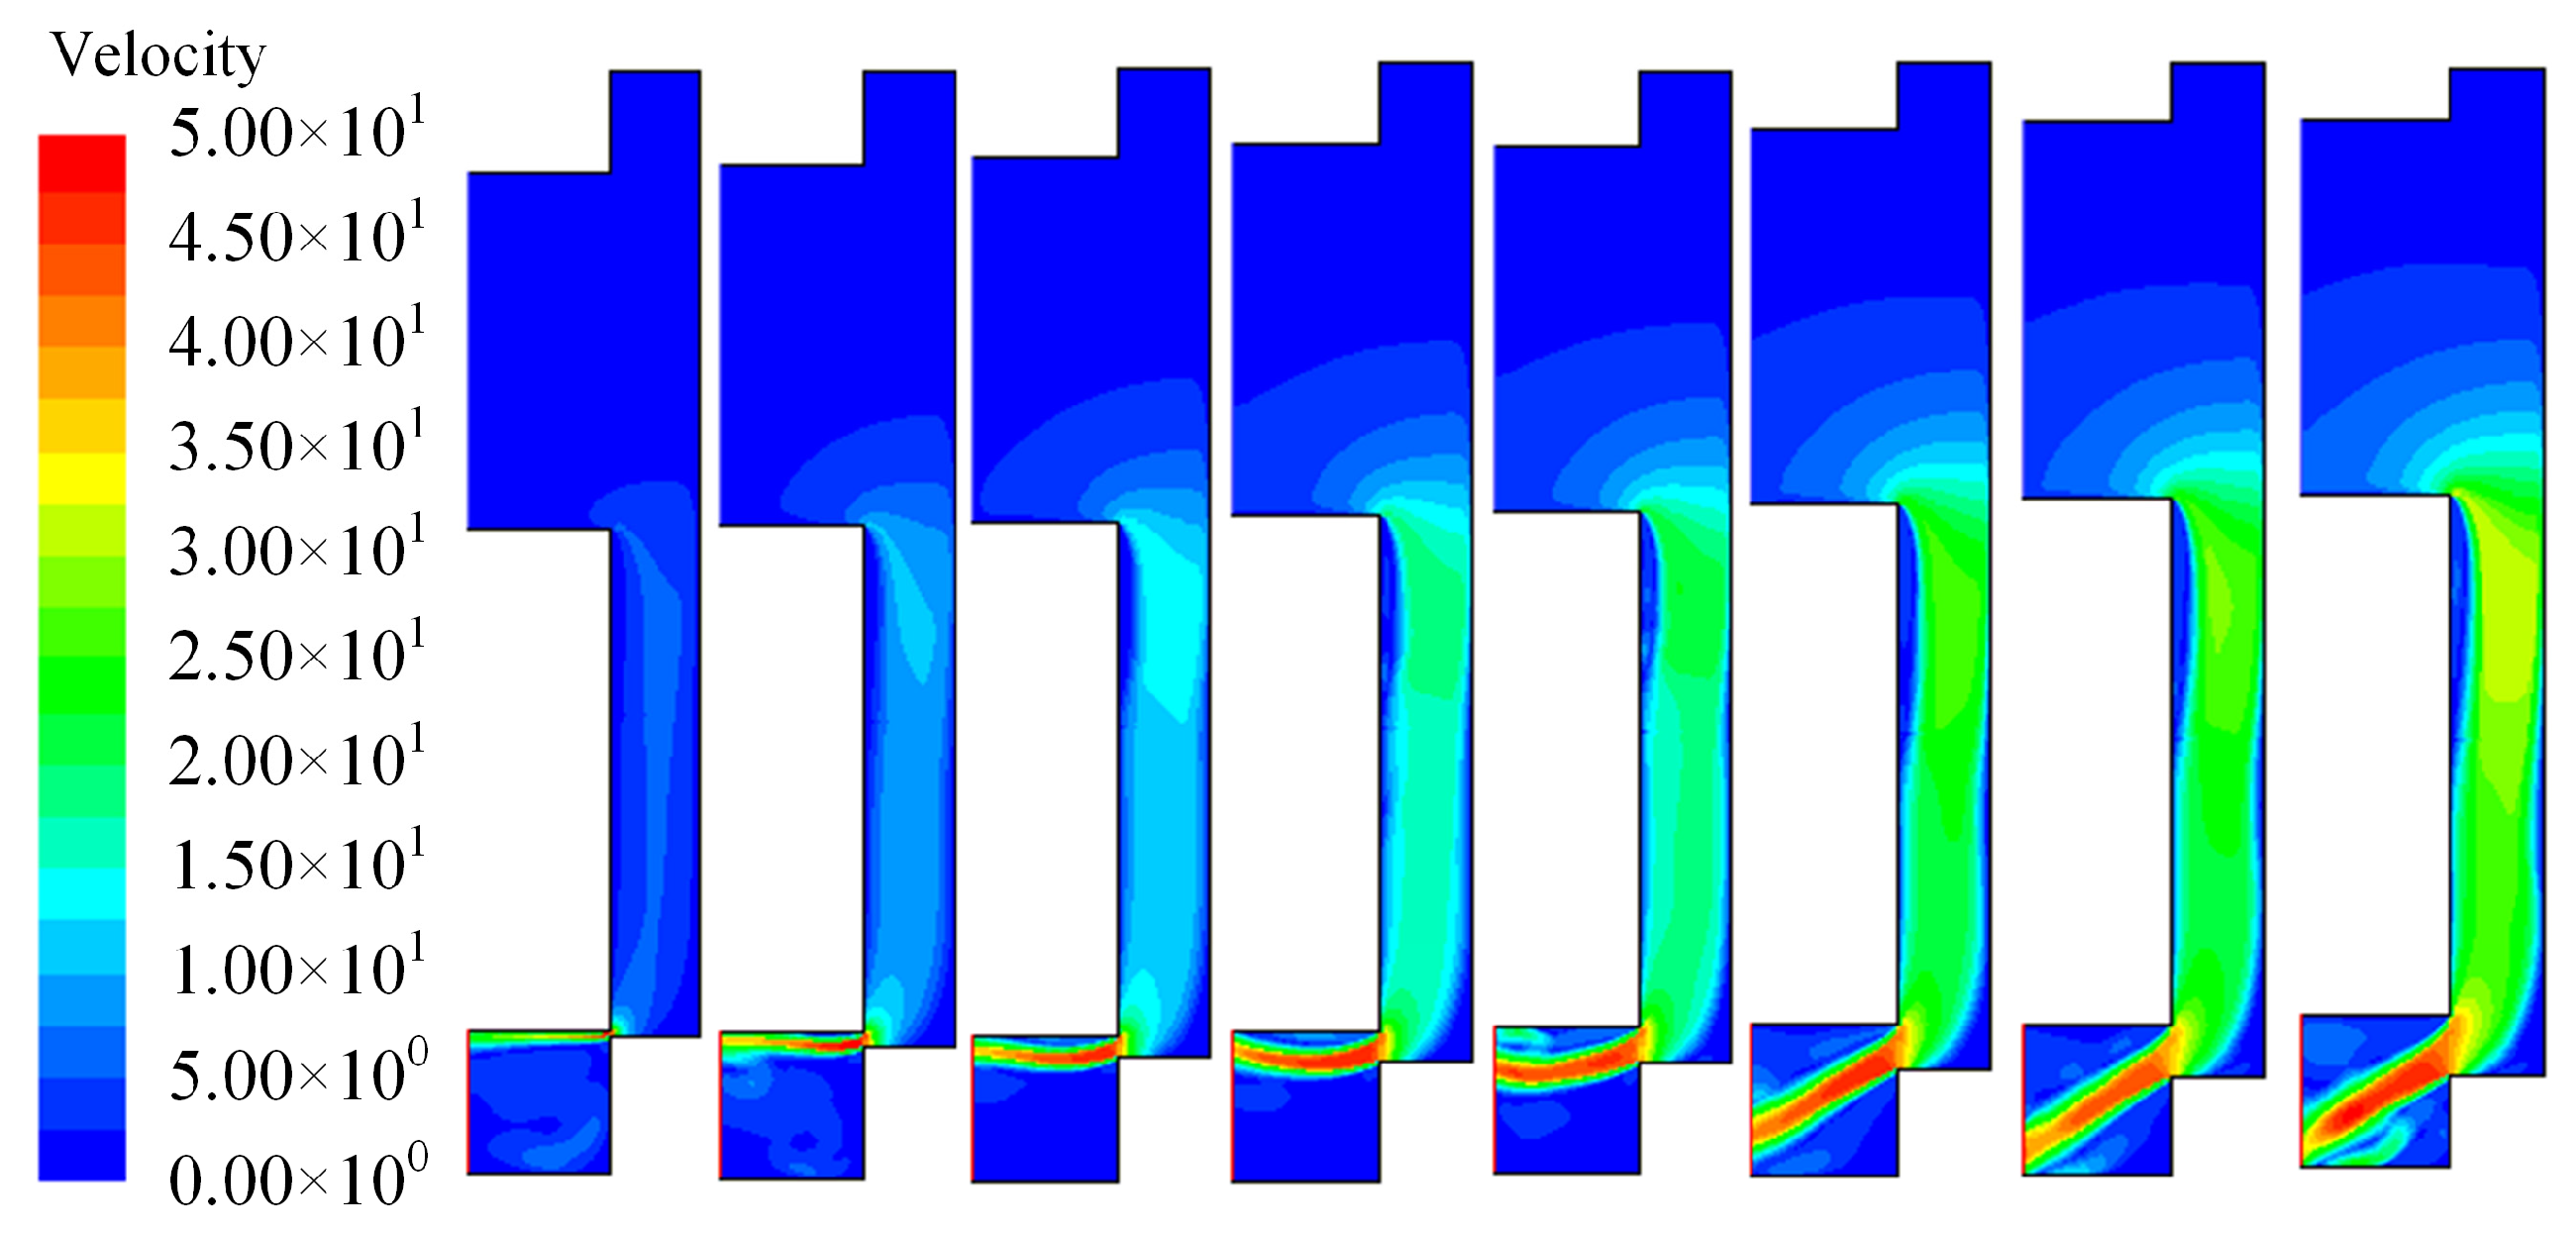
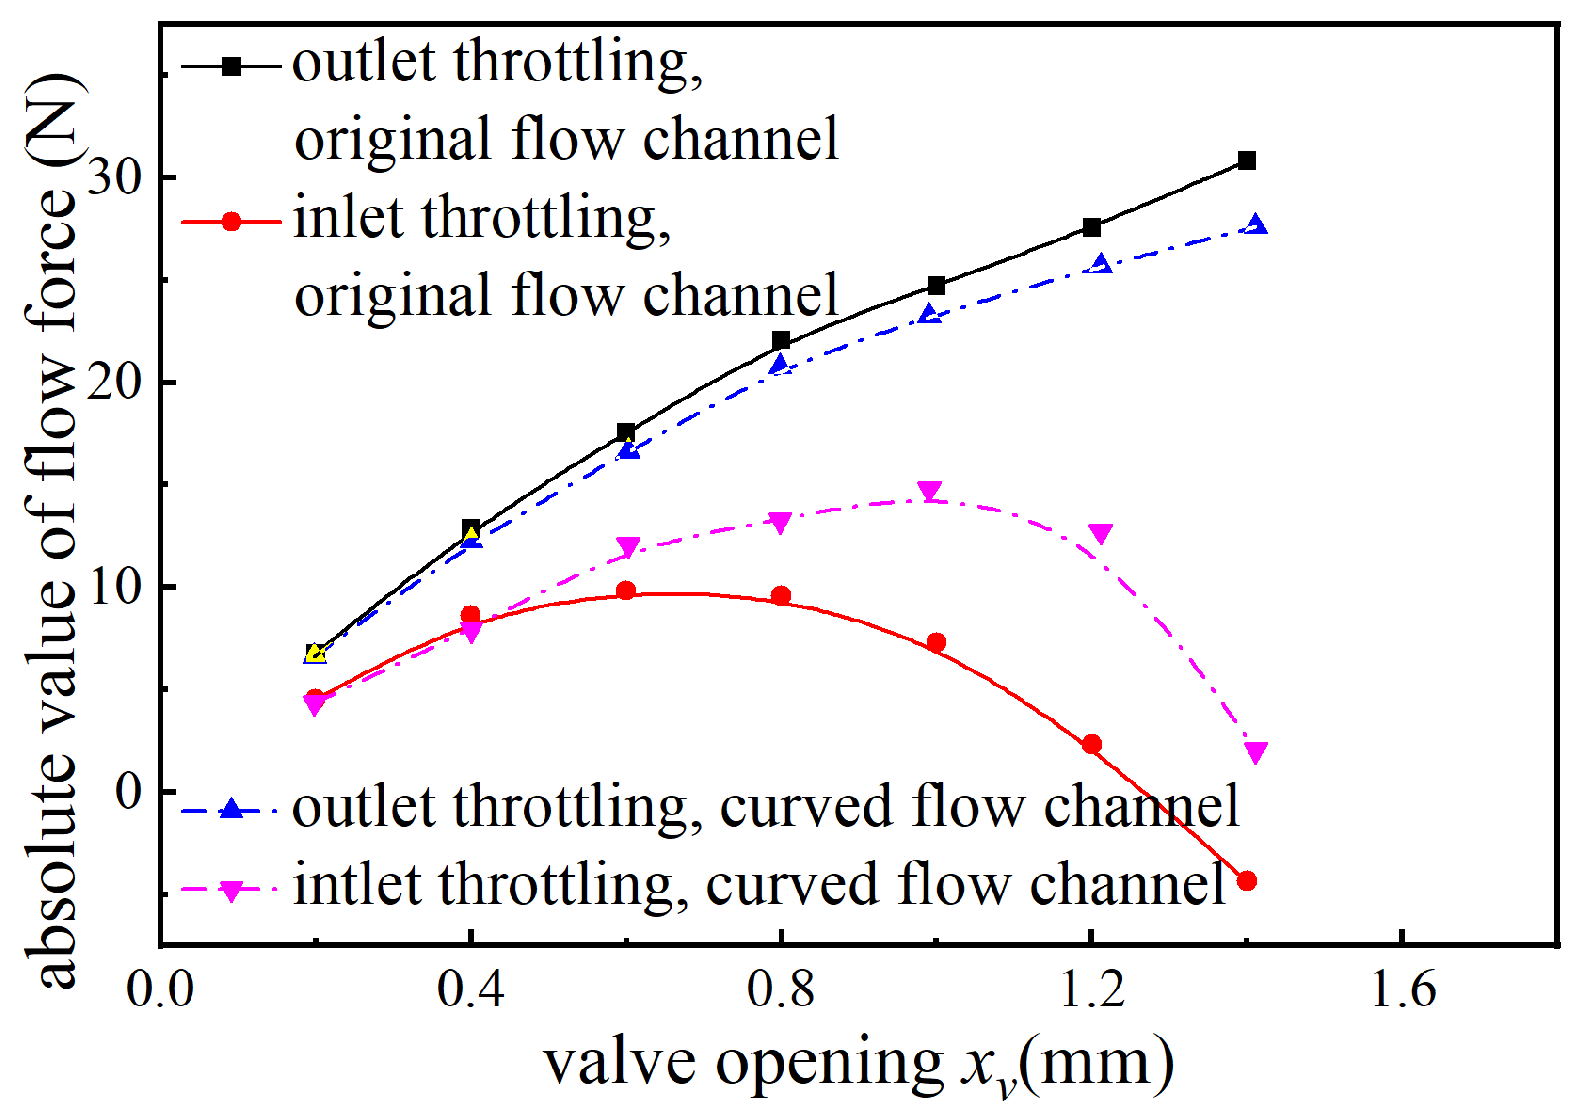
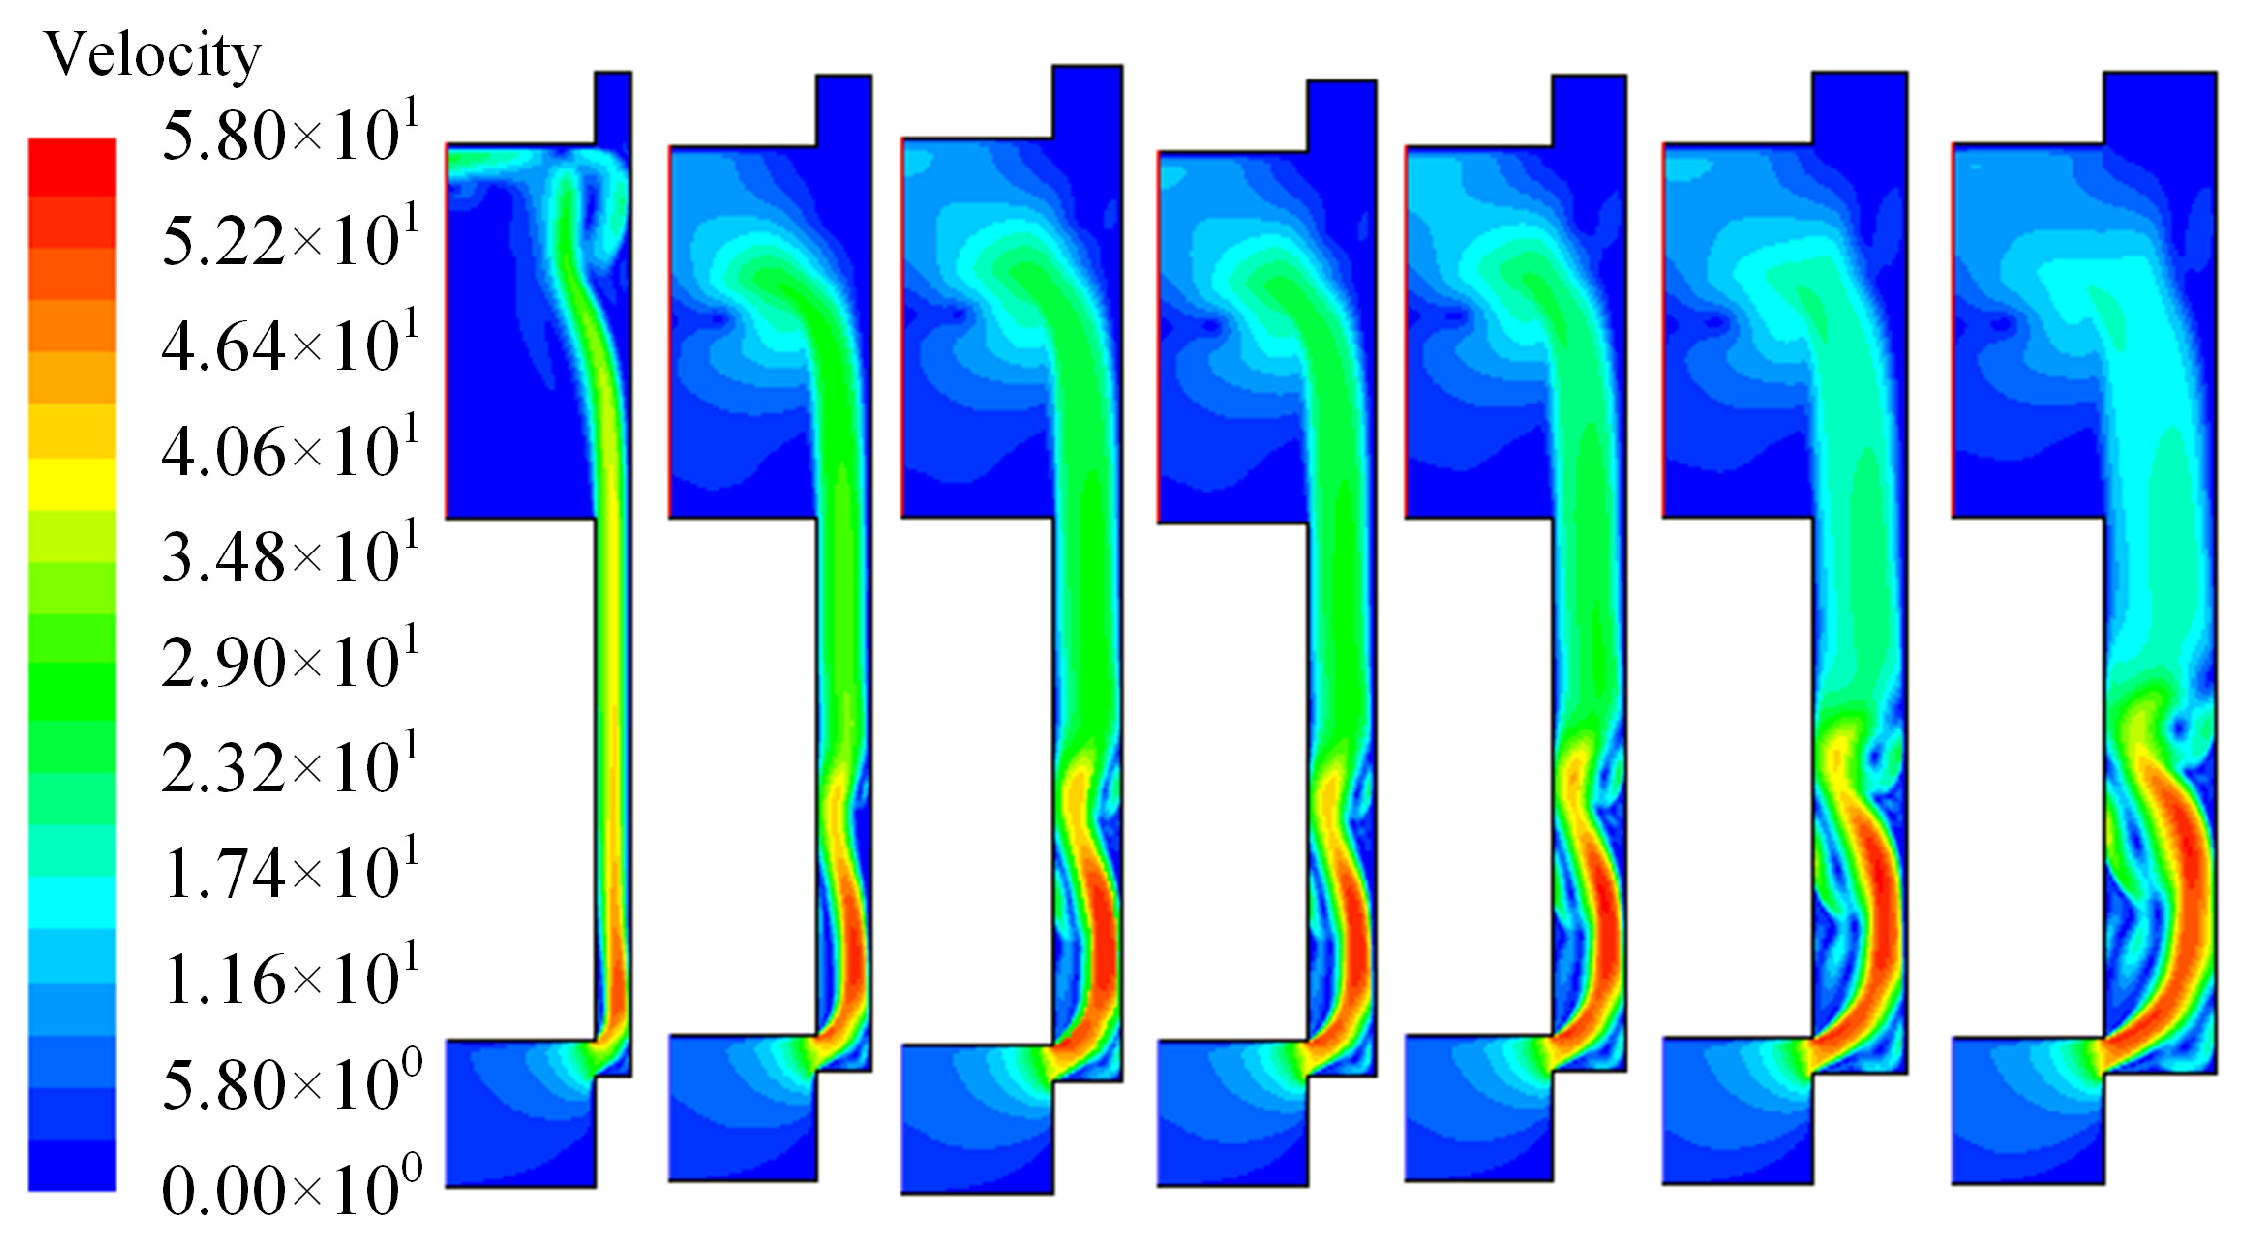
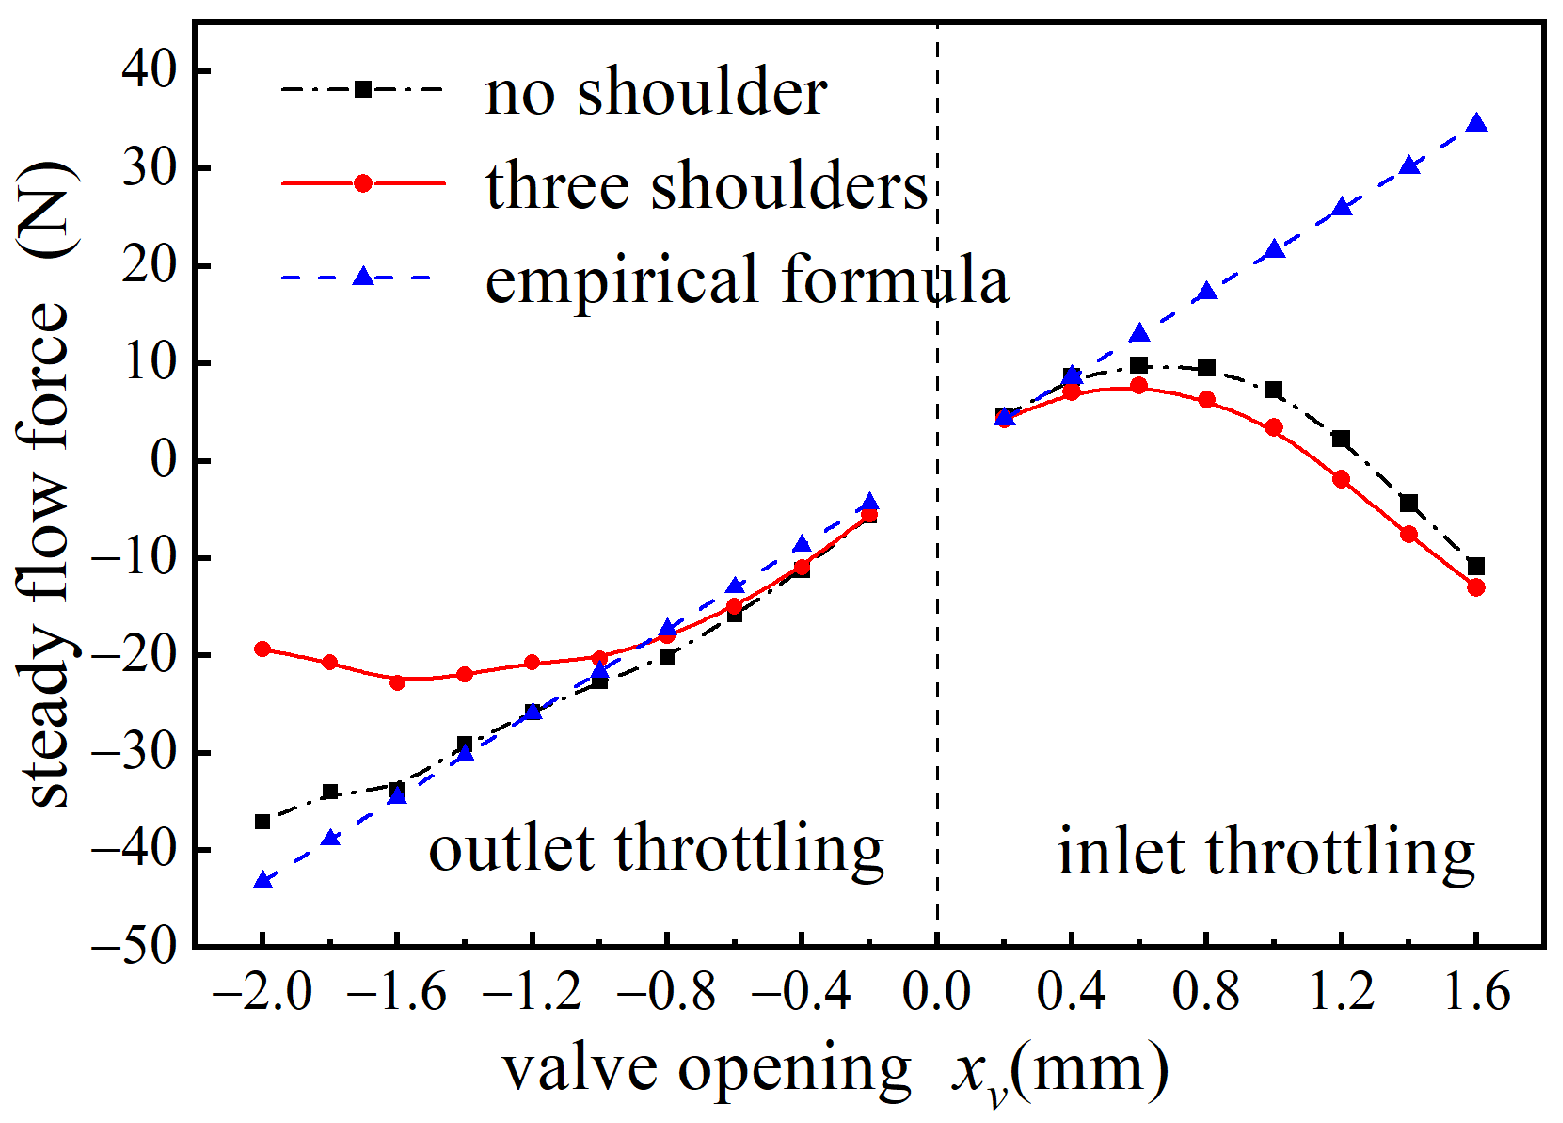
3.2. Flow Force Characteristics of Two Throttling Modes at Variable Openings

The impact of valve opening on the steady flow force in the two throttling modes was investigated, with the valve opening varying from 0.2 mm to 1.6 mm in increments of 0.2 mm. The valve opening is considered positive for inlet throttling and negative for outlet throttling. Figure 6 presents the variation curves of steady flow force and flow rate with respect to valve opening for both throttling modes. The simulation results obtained from the pressure integration and momentum theorem align closely, with a maximum deviation of approximately 10%, thereby validating the accuracy of the algorithm. The flow rate characteristics for both throttling modes exhibit a near-theoretical linear variation, indicating that the mass flow rate through the valve is not the primary reason for the significant differences in flow force between the two throttling modes.
The predicted results of steady flow force from the empirical formula closely match those obtained under the outlet throttling mode, with steady flow force linearly correlated to valve opening and a maximum deviation of approximately 13%. In contrast, under the inlet throttling mode, the steady flow force exhibits a nonlinear variation with increasing valve opening, showing significant differences from the empirical formula. The analysis from the previous section indicates that, at a fixed opening, the fluid momentum at the throttling valve port remains approximately equal for both throttling modes. Therefore, it is initially determined that this discrepancy arises from the momentum of the fluid at the non-throttling valve port.
To further elucidate the reasons for the flow force differences, Figure 7 illustrates the variation in steady flow force at each valve port with valve opening under the two throttling modes. As the valve opening changes, the flow forces at the throttling valve ports are approximately equal for both modes. In the outlet throttling mode, the steady flow force at the non-throttling valve port exhibits a linear increase with valve opening and is comparatively smaller than that at the throttling valve port. In the inlet throttling mode, the flow force at the non-throttling valve port exhibits a nonlinear increase with valve opening. Once the opening reaches a certain threshold, the flow force at the non-throttling valve port can even exceed that at the throttling valve port, resulting in a shift in the overall direction of the flow force acting on the spool, causing the valve port to transition from a tendency to close to a tendency to open. Thus, it is concluded that the fluid momentum at the non-throttling valve port significantly impacts the steady flow force of the sliding valve, particularly in the inlet throttling mode at larger openings, where the fluid momentum at the non-throttling valve cannot be neglected.
Figure 8 and Figure 9 illustrate the flow velocity clouds corresponding to different valve ports under the two throttling modes. Figure 10 presents the variation curves of the fluid jet angles and axial velocities at the two valve ports in the inlet throttling mode as a function of valve opening. The figures clearly visualize the fluid velocity and jet angles within the valve chamber. In the inlet throttling mode, the jet angle of the fluid at the throttling valve port remains around 60°, showing little dependence on the valve opening. In contrast, the jet angle at the non-throttling valve port significantly decreases as the opening increases, while the axial velocity exhibits an opposite trend. Compared to the inlet throttling mode, the outlet throttling mode features fewer vortices within the chamber, resulting in a more orderly flow of the fluid, with very low velocities observed at the non-throttling valve port. Therefore, neglecting the fluid momentum at the non-throttling valve port in the outlet throttling sliding valve is deemed reasonable.

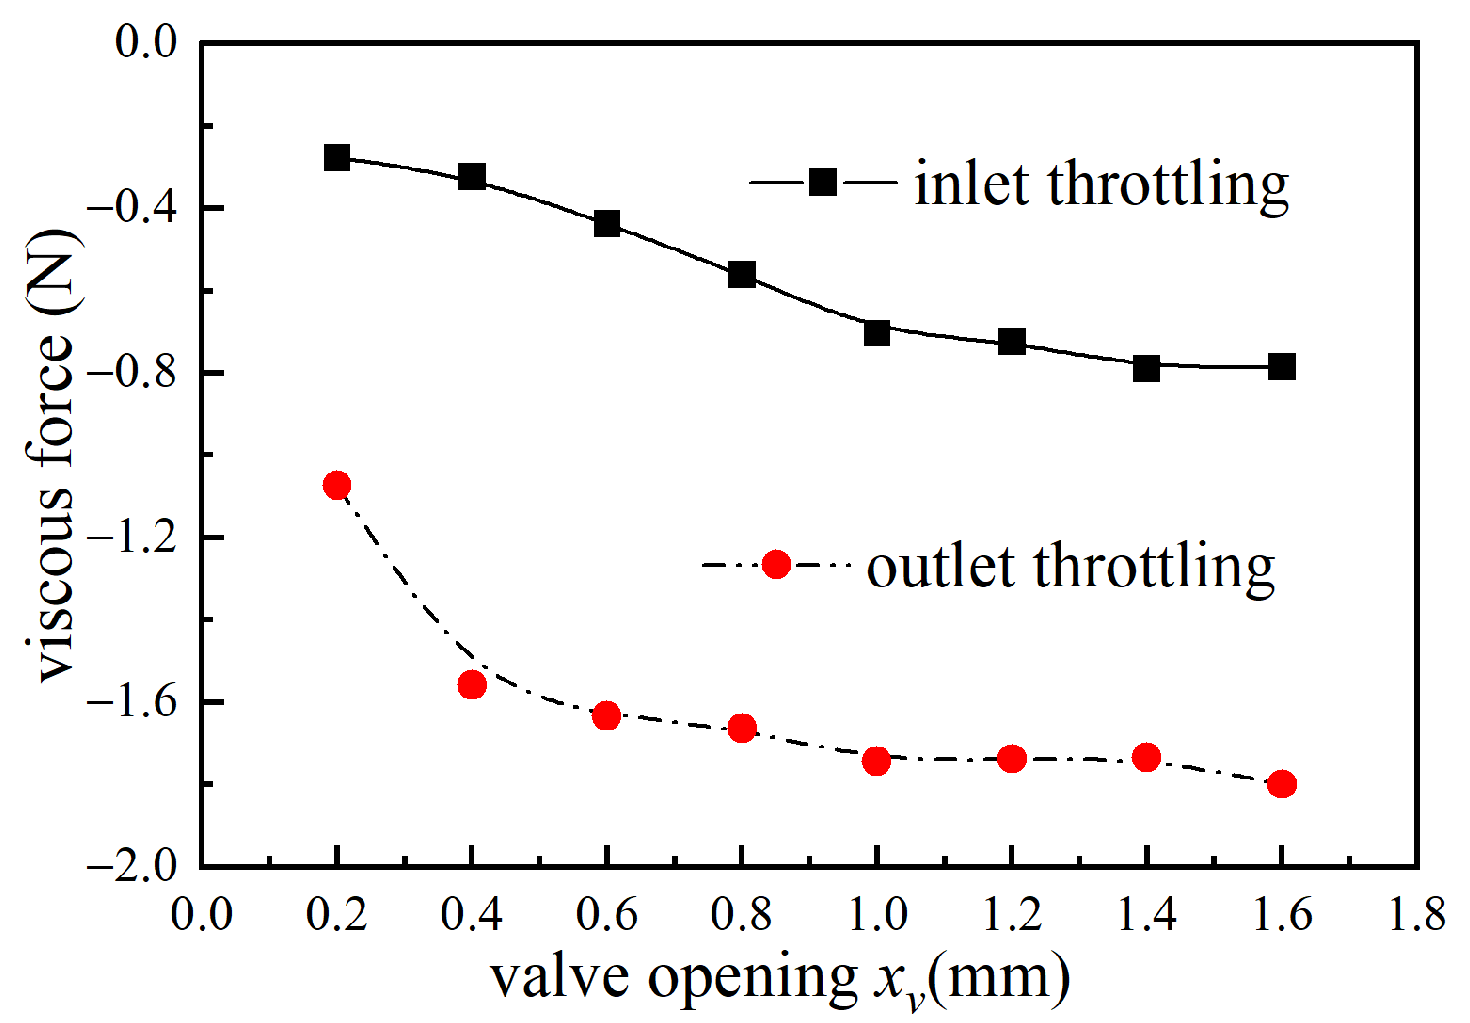
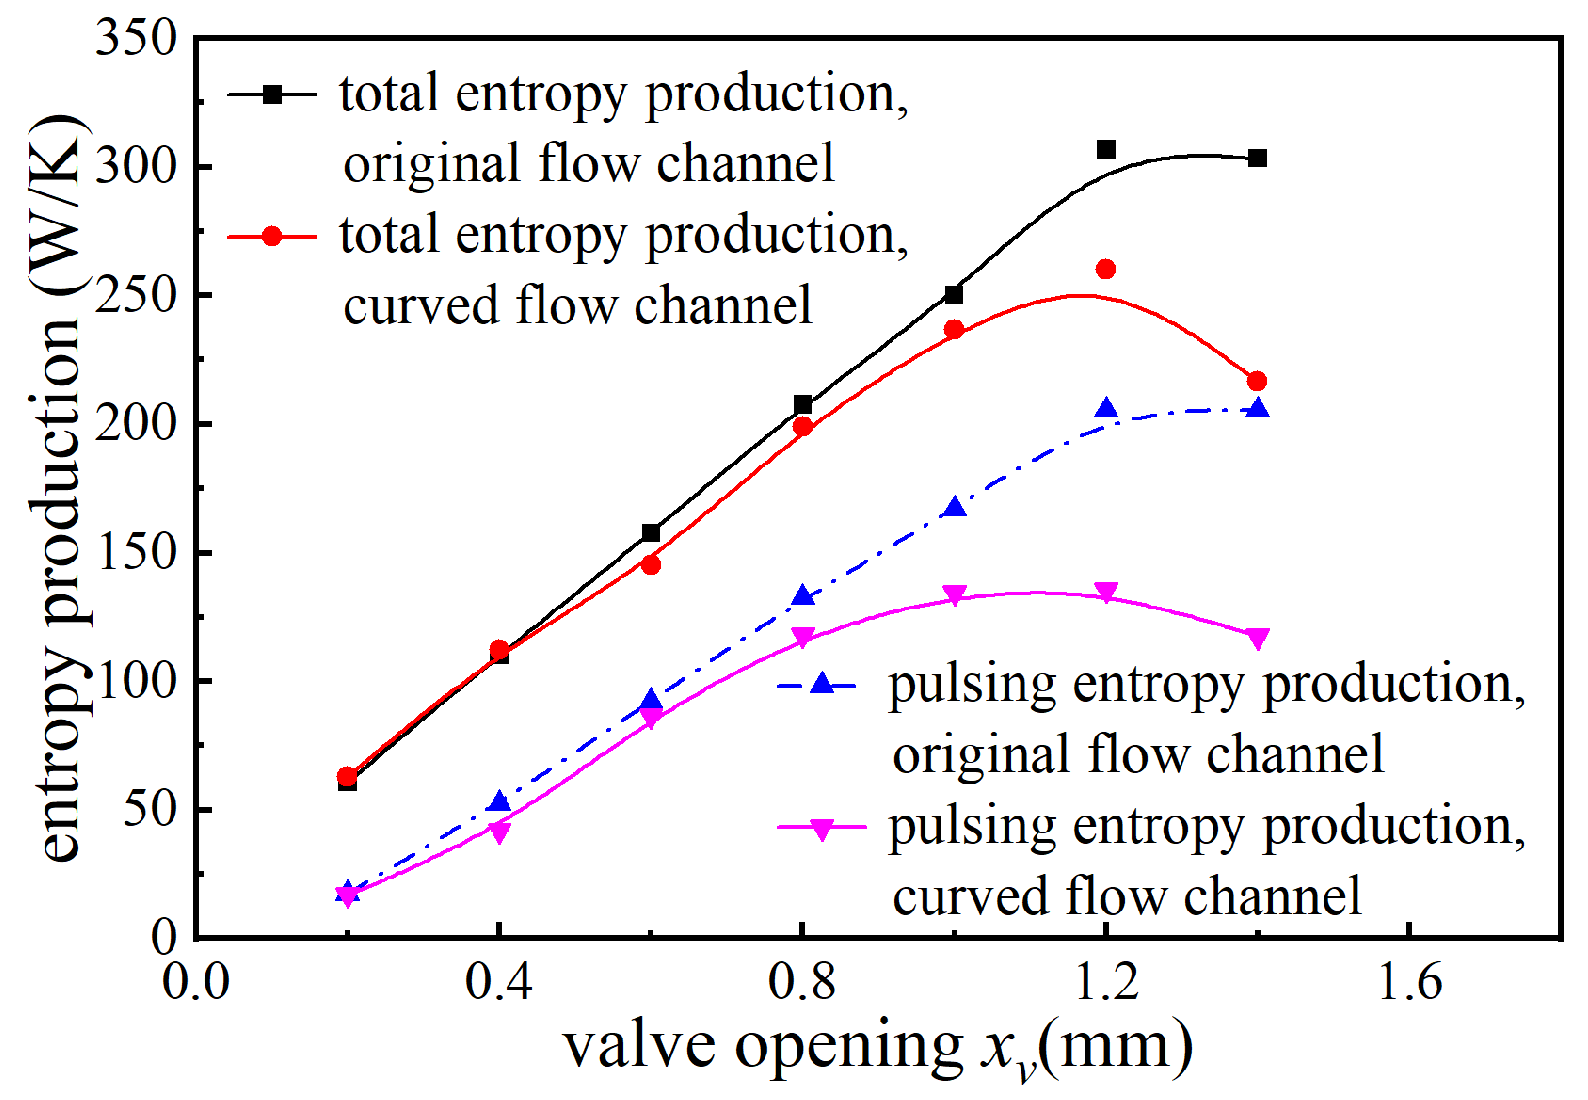
3.3. Effects of Viscous Forces and Vortex Dissipation

It is worth noting that the steady flow force includes viscous forces. To verify that the fluid momentum at the non-throttling valve port is the primary factor causing the differences in flow force between the two throttling modes, it is essential to determine the contribution of viscous forces to the total fluid force. Figure 11 shows the variation in viscous forces with valve opening for both throttling modes. The results indicate that the viscous forces on the valve body wall in the inlet throttling mode are greater than those in the outlet throttling mode, but remain very small. Therefore, viscous forces are not the main cause of the asymmetry in steady flow force characteristics.
In addition, the inlet throttling mode of the slide valve contains a significant number of vortices; the presence of these vortices has a substantial impact on the jet angle of the fluid within the valve chamber. It is therefore necessary to discuss the relationship between the fluid vortices and the steady flow force characteristic curves. Considering that vortex dissipation is an irreversible process associated with an increase in entropy, this paper employs entropy production theory to analyze the hydraulic losses caused by the vortices in the valve. The flow inside the slide valve is turbulent, and the entropy production rate of fluid particles consists of two parts:
S D = S D ¯ + S D
S D ¯ = μ T 2 u ¯ 1 x 1 2 + u ¯ 2 x 2 2 + u ¯ 3 x 3 2 + u ¯ 2 x 1 + u ¯ 1 x 2 2 + u ¯ 3 x 1 + u ¯ 1 x 3 2 + u ¯ 2 x 3 + u ¯ 3 x 2 2
S D = ρ ε T
where S D ¯ represents the entropy production caused by turbulent time-averaged velocity; S D denotes the entropy production due to turbulent pulsation velocity; μ is the effective dynamic viscosity of the flowing medium, in Pa·s; T is the temperature of the flow field, in K; u ¯ is the Reynolds average velocity, in m/s; ρ is the density of the fluid, in kg/m3; and ε is the turbulent kinetic energy dissipation rate, in m2/s3.
Figure 12 illustrates the entropy production distribution within the sliding valve for the two throttling modes. The distinction between the two throttling modes lies in the position and intensity of the vortices. In the inlet throttling slide valve, the fluid accelerates through the throttling orifice, rapidly impacting the spool and subsequently transitioning to axial flow under the constraints of the wall, with vortices primarily forming within the control volume. In contrast, for the outlet throttling slide valve, the fluid exits the valve after passing through the throttling orifice, with vortices predominantly appearing outside the control volume.
To investigate the impact of vortices on the asymmetry of flow force performance in the two throttling modes, modifications were made to the flow channel of the slide valve. An arc-shaped flow channel was implemented to suppress the formation of vortices within the valve chamber, as illustrated in Figure 13. The arc-shaped flow channel constrains the cross-sectional area of the annular cavity, enhancing the jet velocity, and the arc transition concentrates the outlet jet. By integrating the entropy production rate over the volume, the pulsation and total entropy production for both the original and arc-shaped flow channel were calculated, as shown in Figure 14. The results indicate that the entropy production corresponding to the arc-shaped flow channel is significantly lower, particularly at larger openings, effectively suppressing the formation of oil vortices within the valve chamber.
Figure 15 presents the absolute values of the steady flow forces for the two flow channels under inlet and outlet throttling modes. As the valve opening increases, the introduction of the arc-shaped flow channel reduces the flow force in the outlet throttling mode, while increasing the flow force in the inlet throttling mode. This results in the diminished asymmetry of the steady flow forces between the inlet and outlet throttling modes. Therefore, it is concluded that suppressing the vortices within the chamber contributes to weakening the differences in steady flow forces of the slide valve under bidirectional throttling modes.

4. Steady Flow Force Compensation Optimization

The above study indicates that the fluid momentum at the non-throttling port helps to reduce the steady flow force on the valve spool, which is more pronounced in the inlet throttling mode. Therefore, adjusting the jet angle and flow velocity of the fluid at the non-throttling port is an important means of compensating for the steady flow force. Compensating for steady flow force in hydraulic valves has been a longstanding issue due to the involvement of various valve structures, and numerous compensation designs have been proposed. Considering that the axial dimensions of the spool are not easily modified, this paper introduces a novel approach to further compensate for the steady flow force of the spool by matching it with an inner chamber with appropriate radial dimensions, building on the traditional multi-shoulder compensation structure.

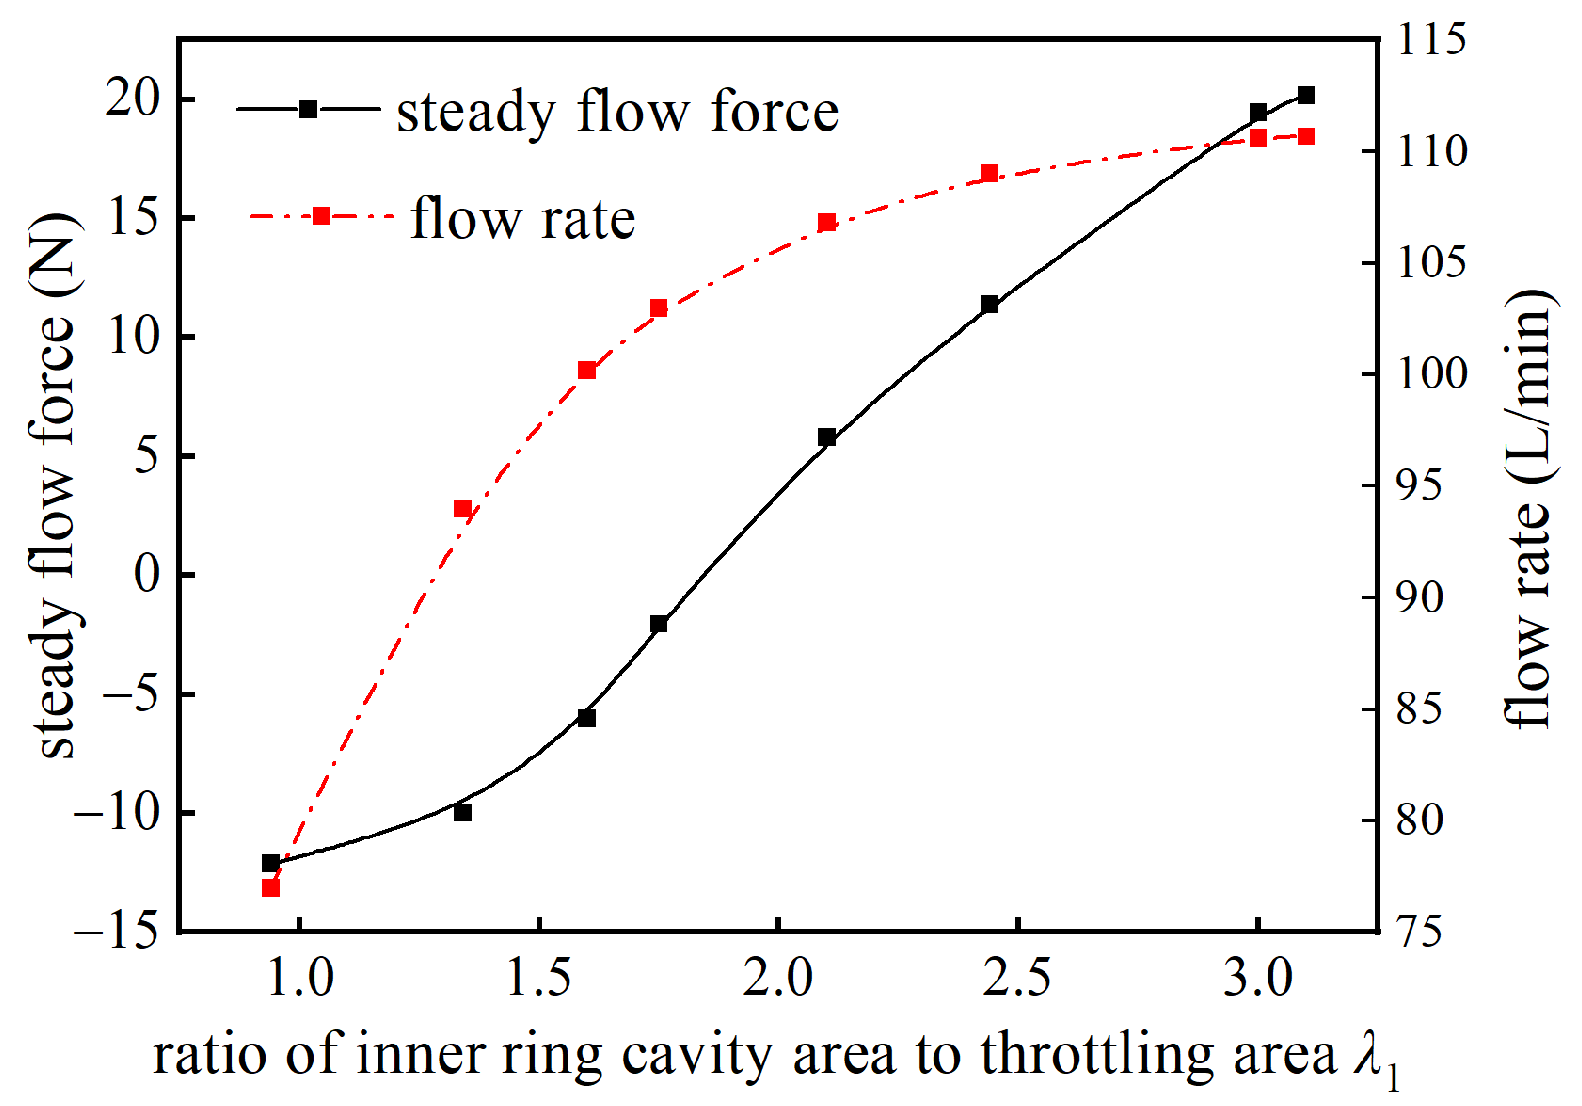
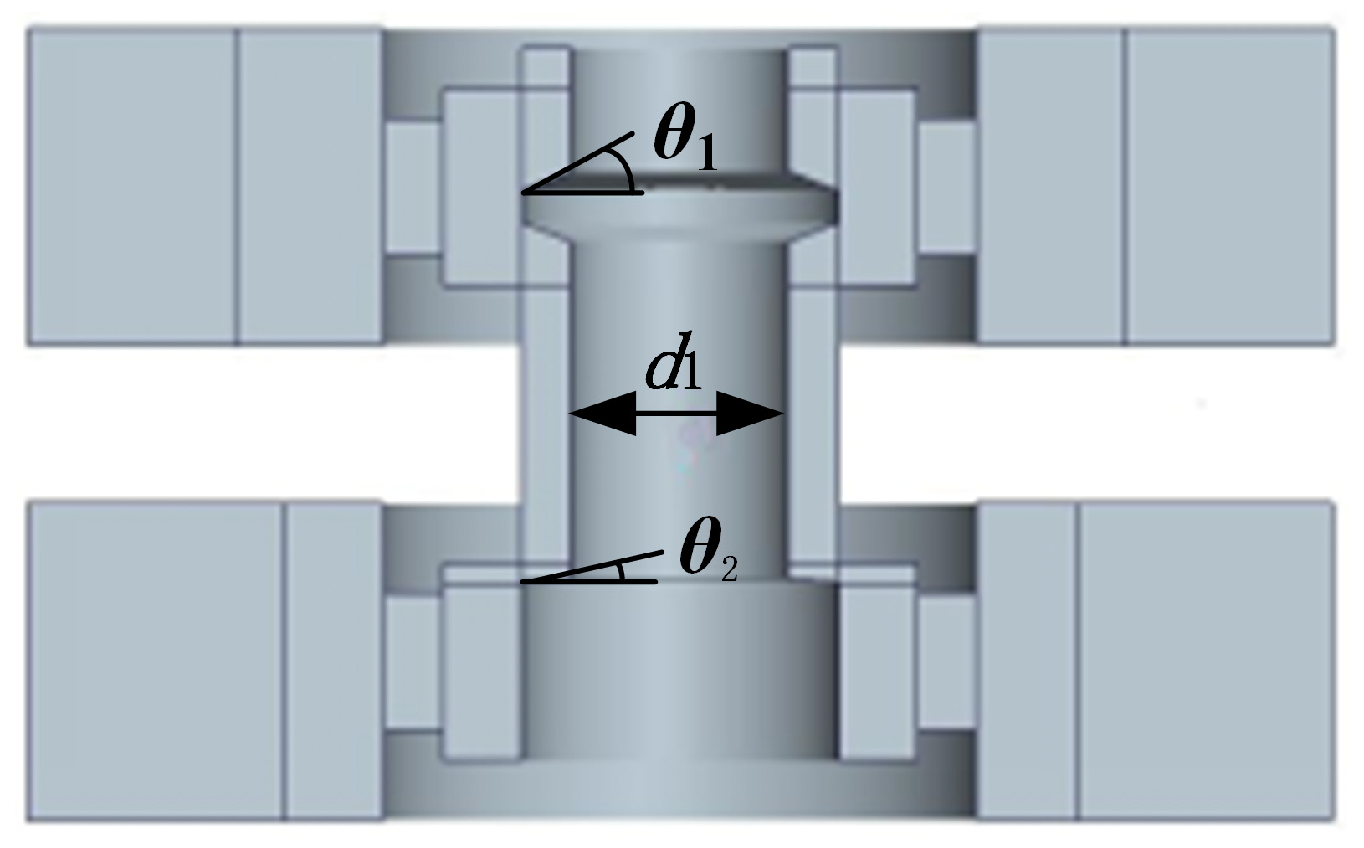
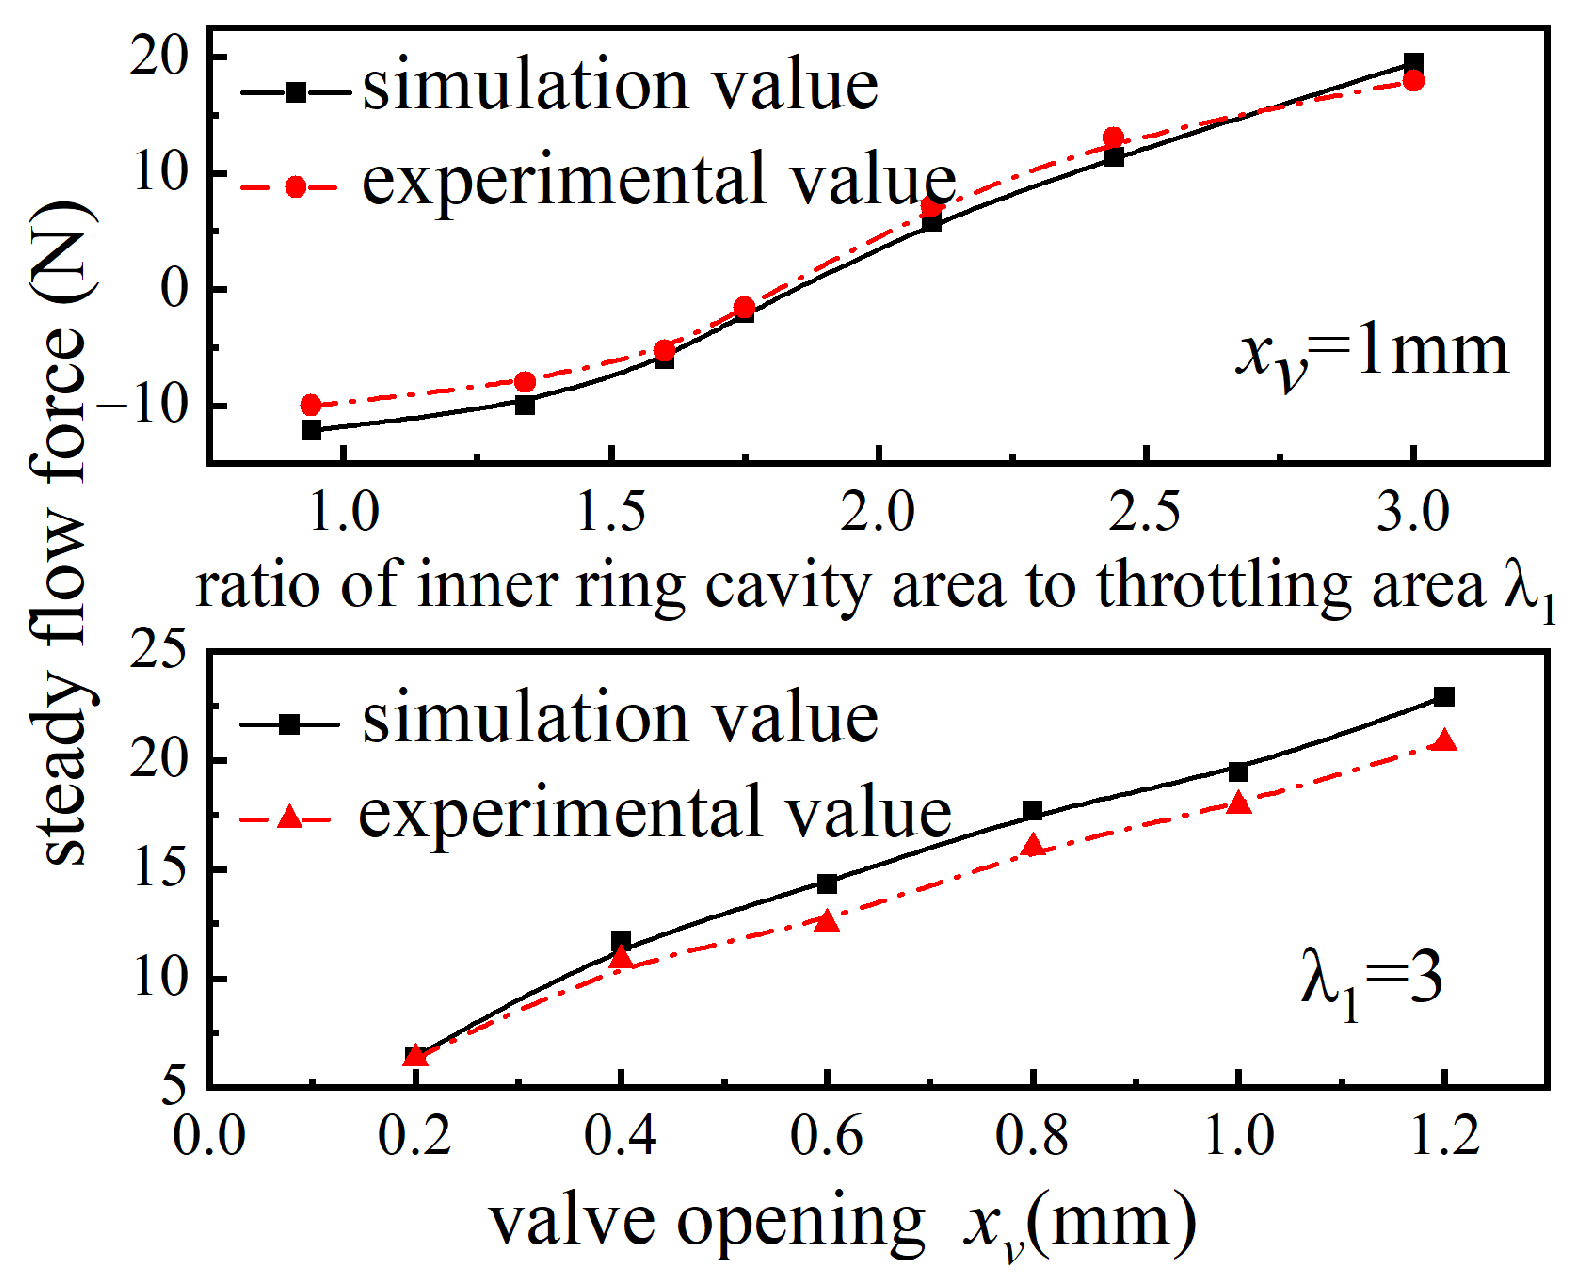
4.1. Influence of Inner Chamber Dimensions on Flow Force Characteristics

The ratio of the inner chamber area to the throttling area is defined as λ1, expressed as λ1 = π(d22d12)/4πd2xv. Before investigating the compensation effect of matching an inner chamber with a shoulder structure on the steady flow force of the spool, we first discuss the influence of λ1 on the steady flow force independently. The analysis uses a typical valve opening of xv = 1 mm and adjusts λ1 by varying the spool diameter d1.
Figure 16 presents the velocity contour plots of the internal flow field of the slide valve under different λ1 values. After being accelerated through the throttling valve port, the fluid enters the valve chamber and flows out in a relatively uniform flow pattern. Due to the restriction of the chamber walls, an axial adjustment flow occurs, and the length of this adjustment flow increases with an increase in λ1. In the case of a small λ1, the inner chamber functions as a throttling mechanism, causing the fluid to flow at high speed within the annular chamber, resulting in a concentrated outlet jet. On the other hand, as λ1 increases, the vortex region within the flow path gradually expands, leading to a reduction in both the outlet jet angle and velocity.
Figure 17 illustrates the relationship between the slide valve’s steady flow force and flow rate as a function of λ1. When λ1 exceeds 2, the flow rate through the valve chamber changes slowly. This is due to the weakened throttling effect of the annular chamber at high λ1 values, making the flow primarily influenced by the throttling valve port. However, under the same conditions, the steady flow force increases rapidly. Since the inlet flow pattern remains largely unchanged, the increase in hydrodynamic force can be attributed to changes in the fluid momentum at the outlet. This is confirmed by the flow force curves for the throttling and non-throttling valve ports under high λ1 conditions, as shown in Figure 18. When λ1 increases from 2.0 to 3.0, the flow force at the throttling valve port changes by 2.92%, while at the non-throttling valve port, it changes by 55.82%. Therefore, the size of the inner annular chamber has a significant impact on the fluid momentum at the non-throttling valve port, theoretically making it a viable method for compensating for the steady flow force of the slide valve.

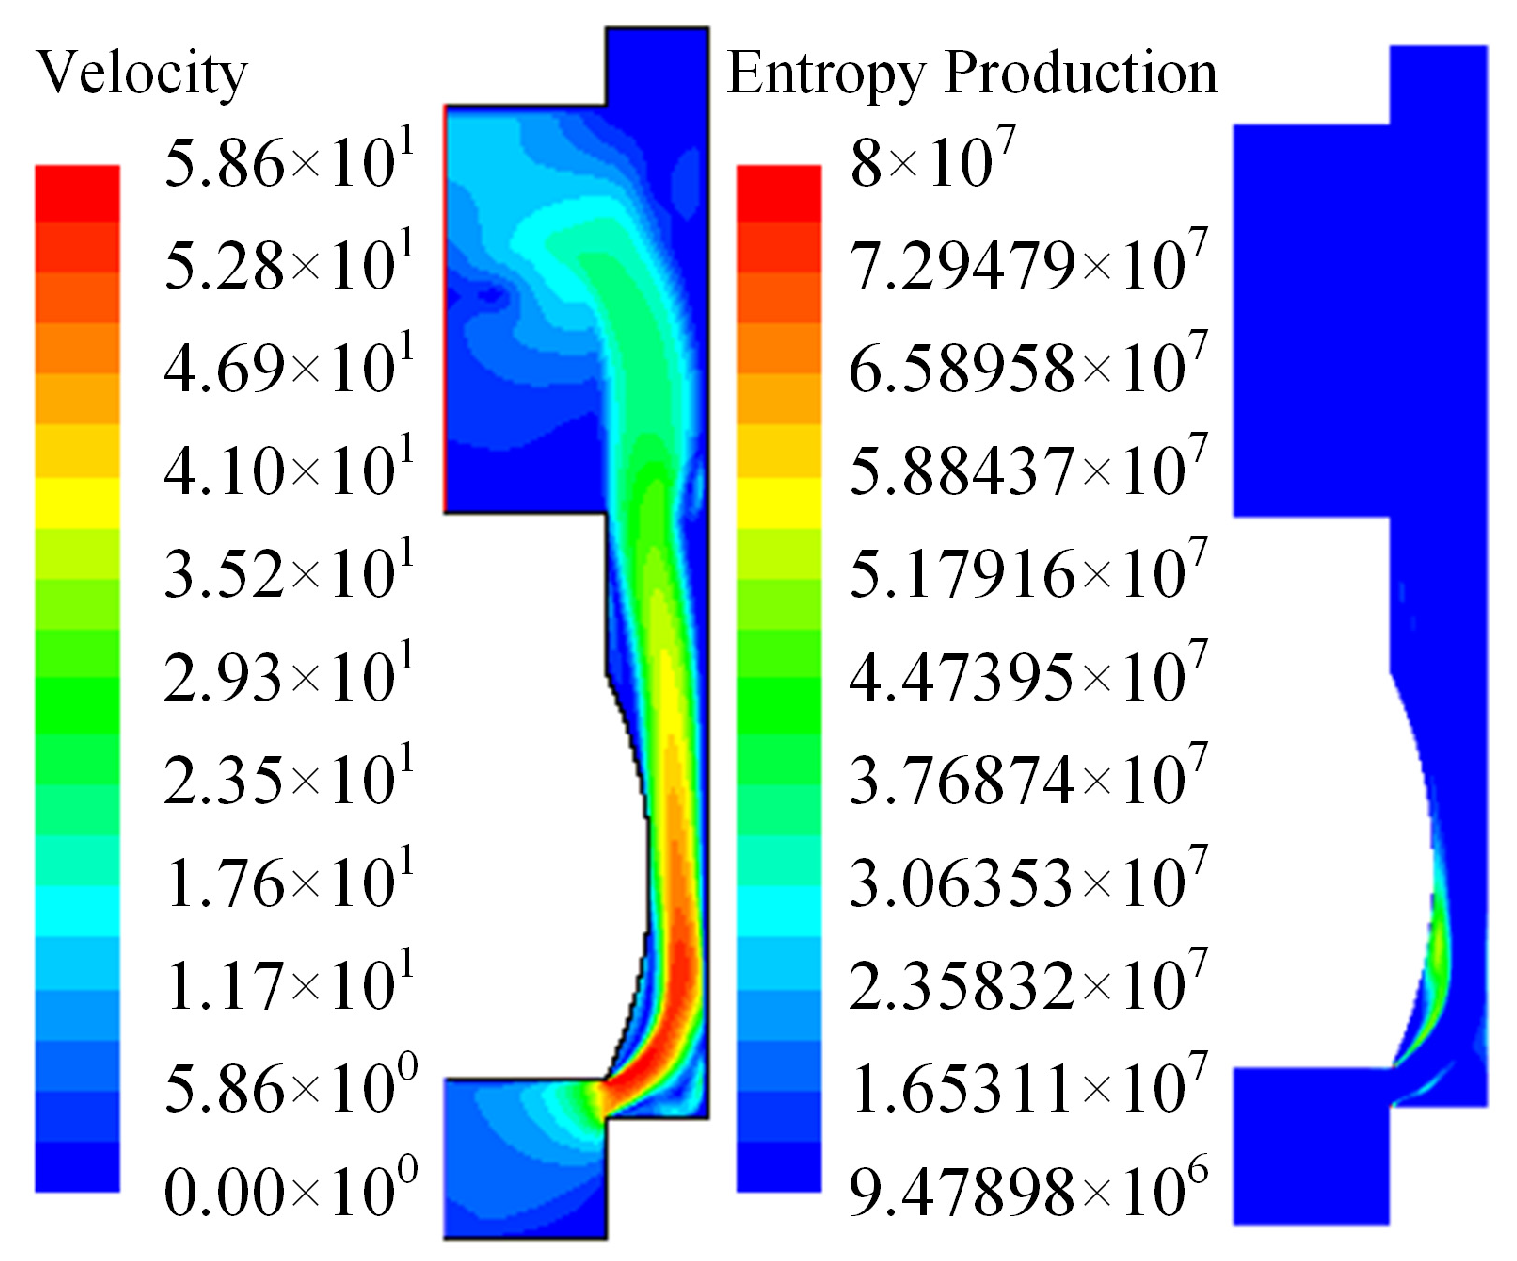
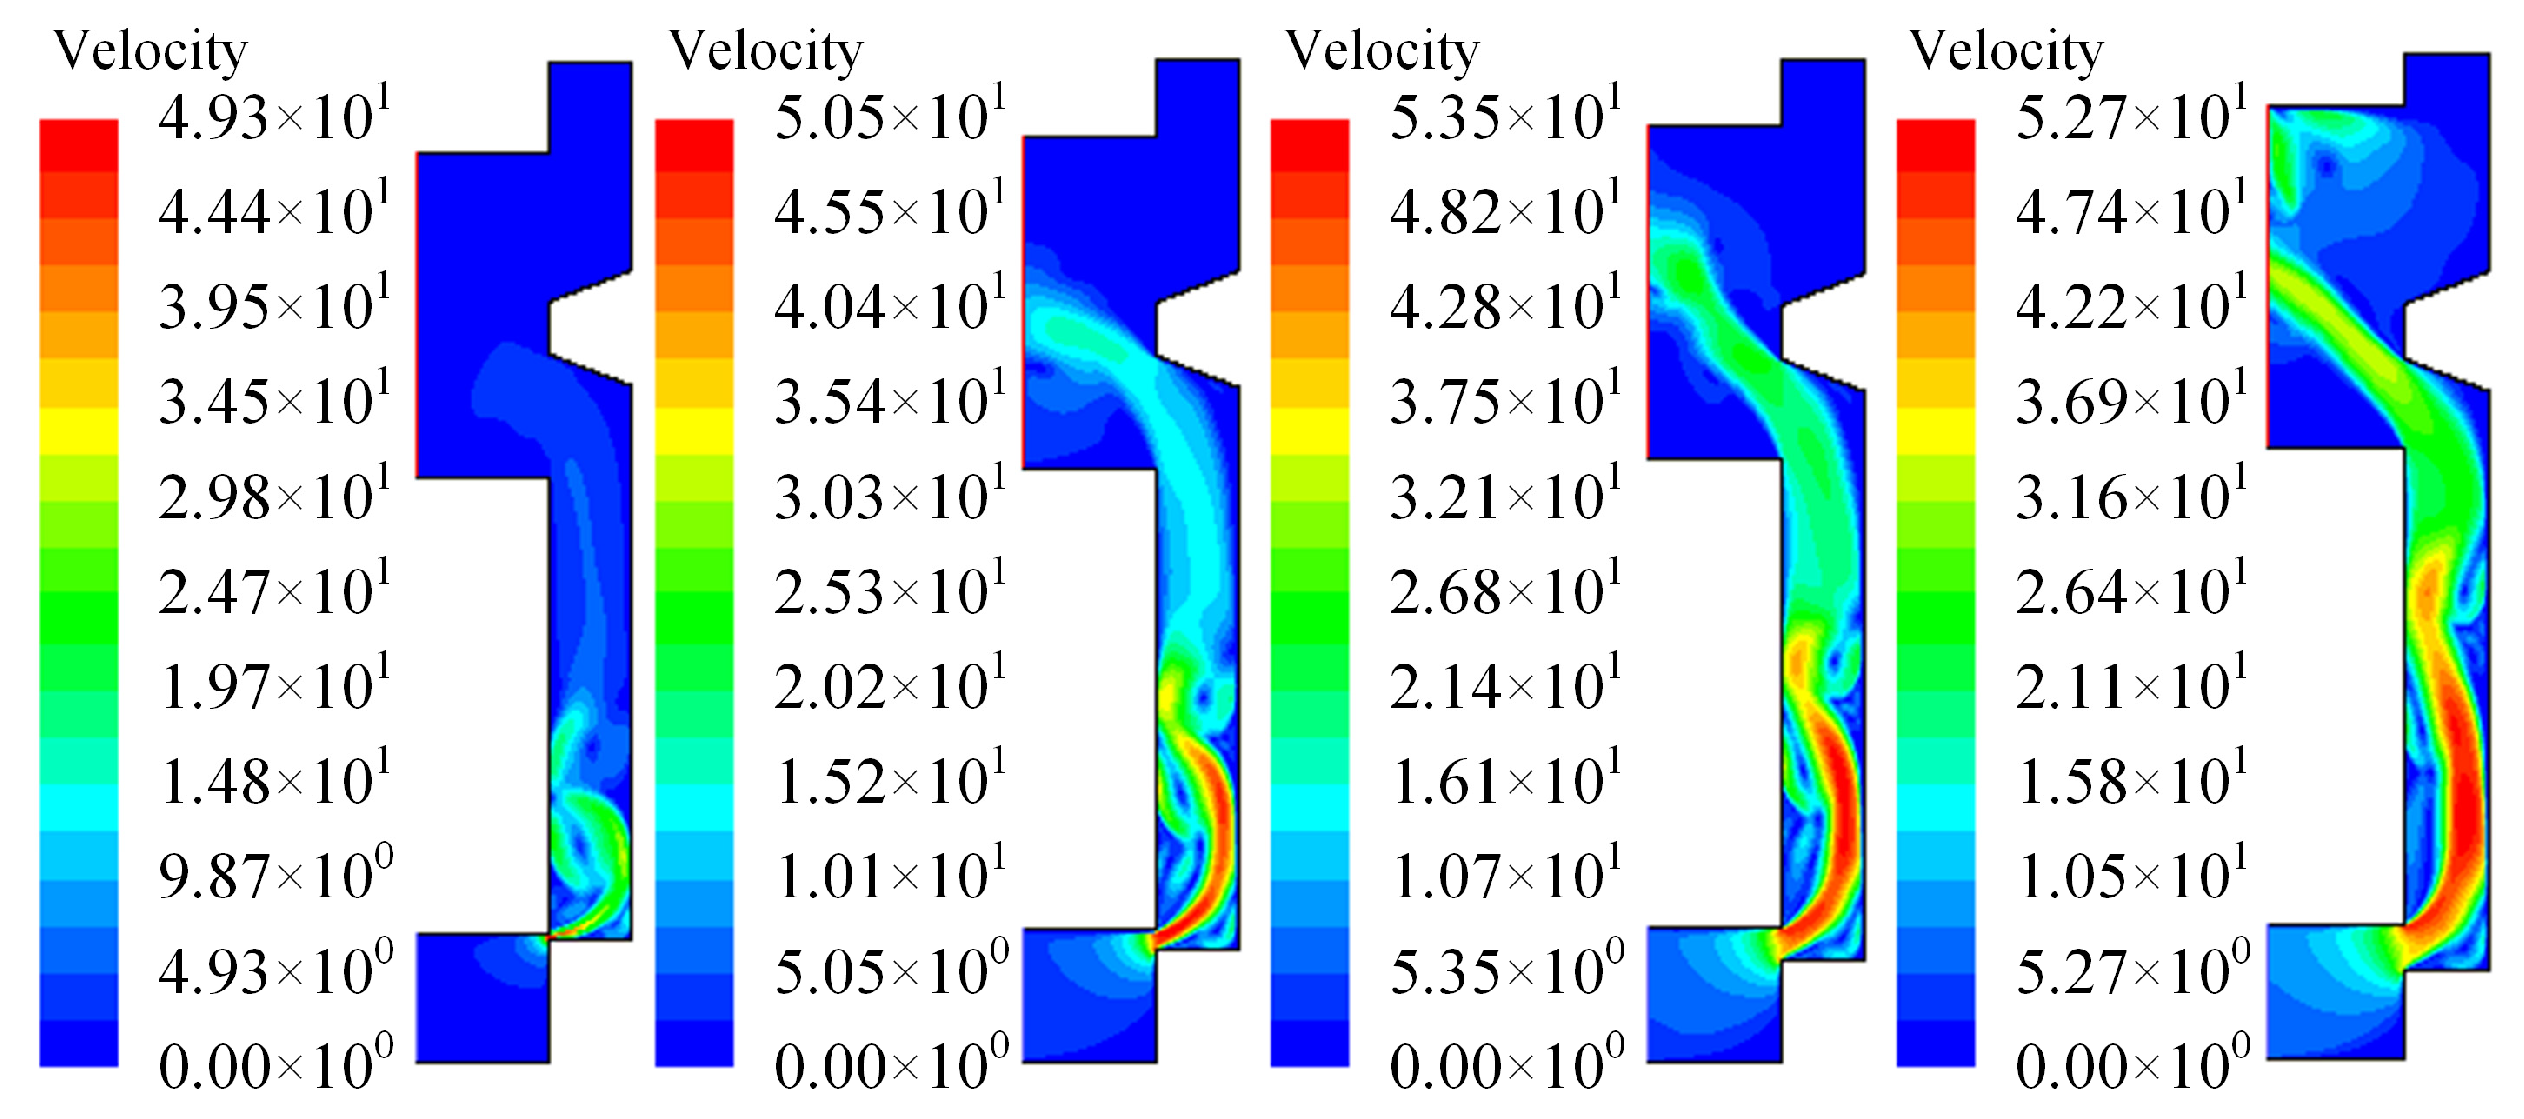
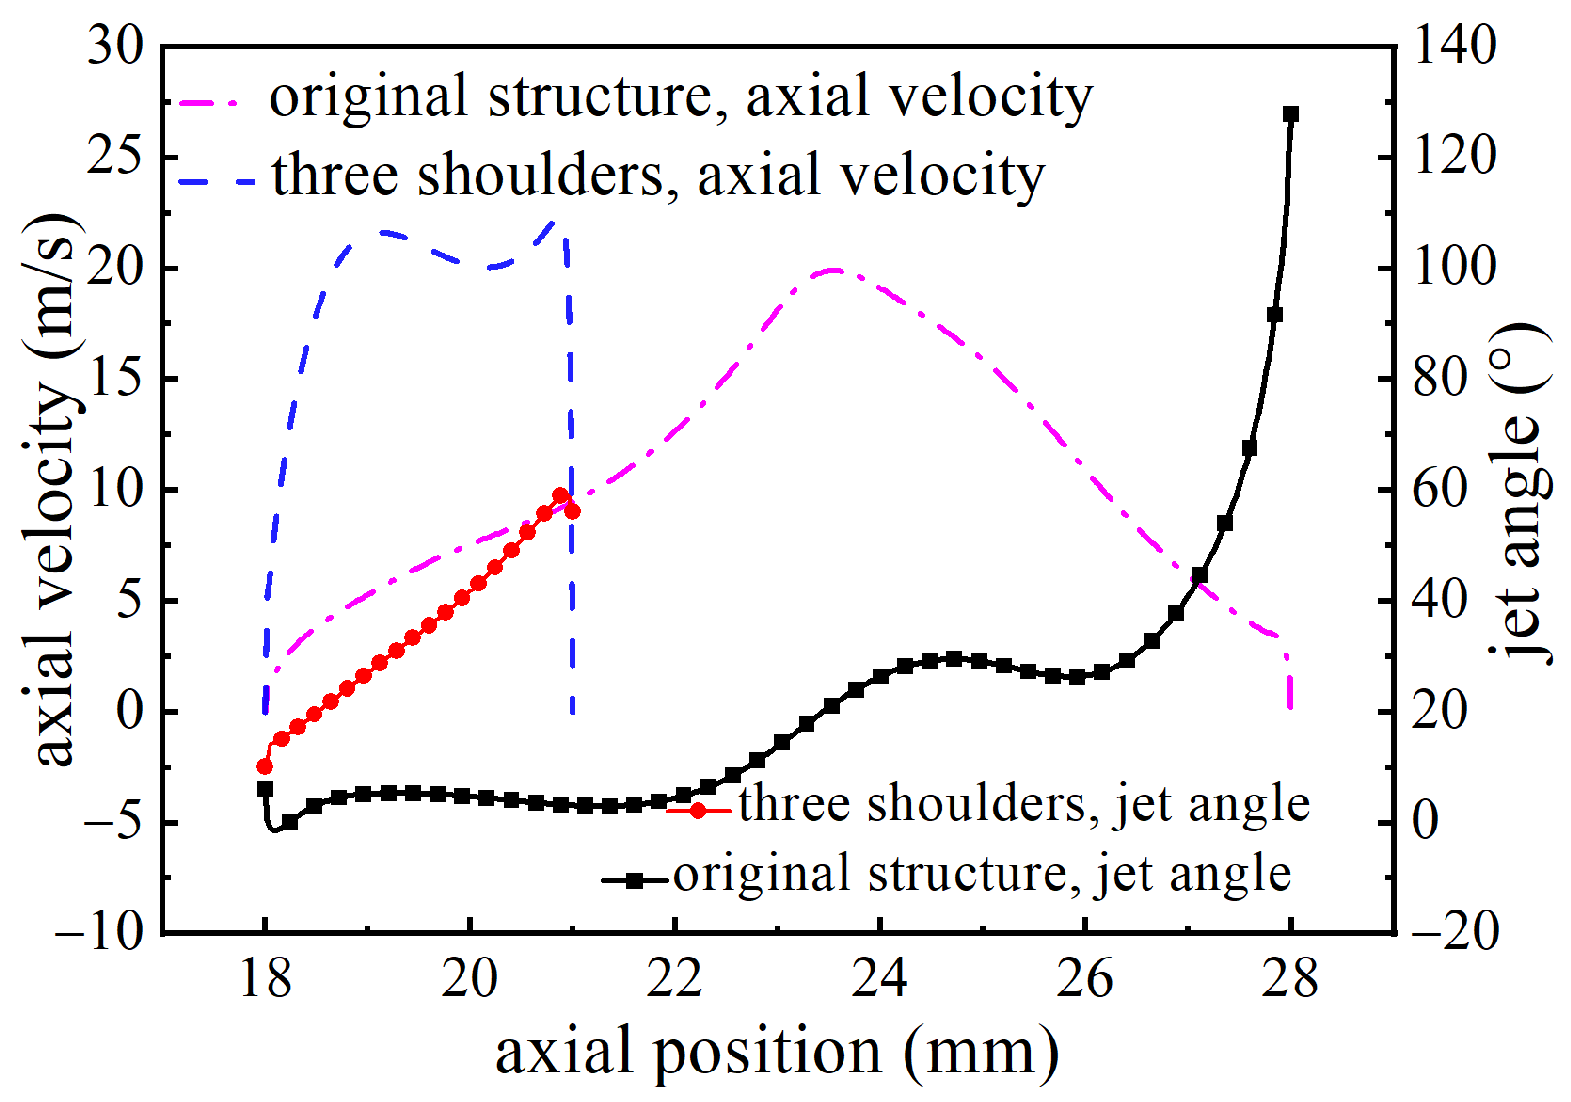
4.2. Flow Field Analysis of Convex Shoulder Compensation Structures

The convex shoulder structure is widely used in hydrodynamic compensation. This section analyzes the flow field of a slide valve that utilizes only the convex shoulder structure. Considering that the jet angle of the fluid in the ideal slide valve model is 69°, a shoulder with an additional 21° is added at the non-throttling valve port for this study. Figure 19 illustrates the flow field velocity contours for the three-shoulder compensation structure at different openings. Compared to the original structure, the added shoulder significantly guides the fluid within the chamber, resulting in a concentrated exit jet. As the valve opening increases, the jet velocity increases while the jet angle decreases.
Figure 20 presents the simulated flow force values for the slide valve with the three-stage shoulder compensation structure and the original structure, compared with the empirical formula values. The three-shoulder design reduces steady flow forces in both the inlet throttling and outlet throttling modes. To further understand the compensation mechanism of the shoulder structure, Figure 21 illustrates the jet angle and axial velocity of the fluid at the non-throttling outlet in the inlet throttling mode. From the figure, it can be observed that the newly added shoulder structure shortens the axial length of the jet at the non-throttling outlet, significantly increasing the fluid velocity along this axial length. In the original structure, the jet angle of the fluid only elevates near the end of the chamber flow path where the velocity is lower (close to the chamber wall). The three-shoulder structure enables a rapid increase in the jet angle of the fluid in the axial direction, thereby enhancing the momentum of the fluid at the non-throttling outlet and effectively compensating for the steady flow forces.

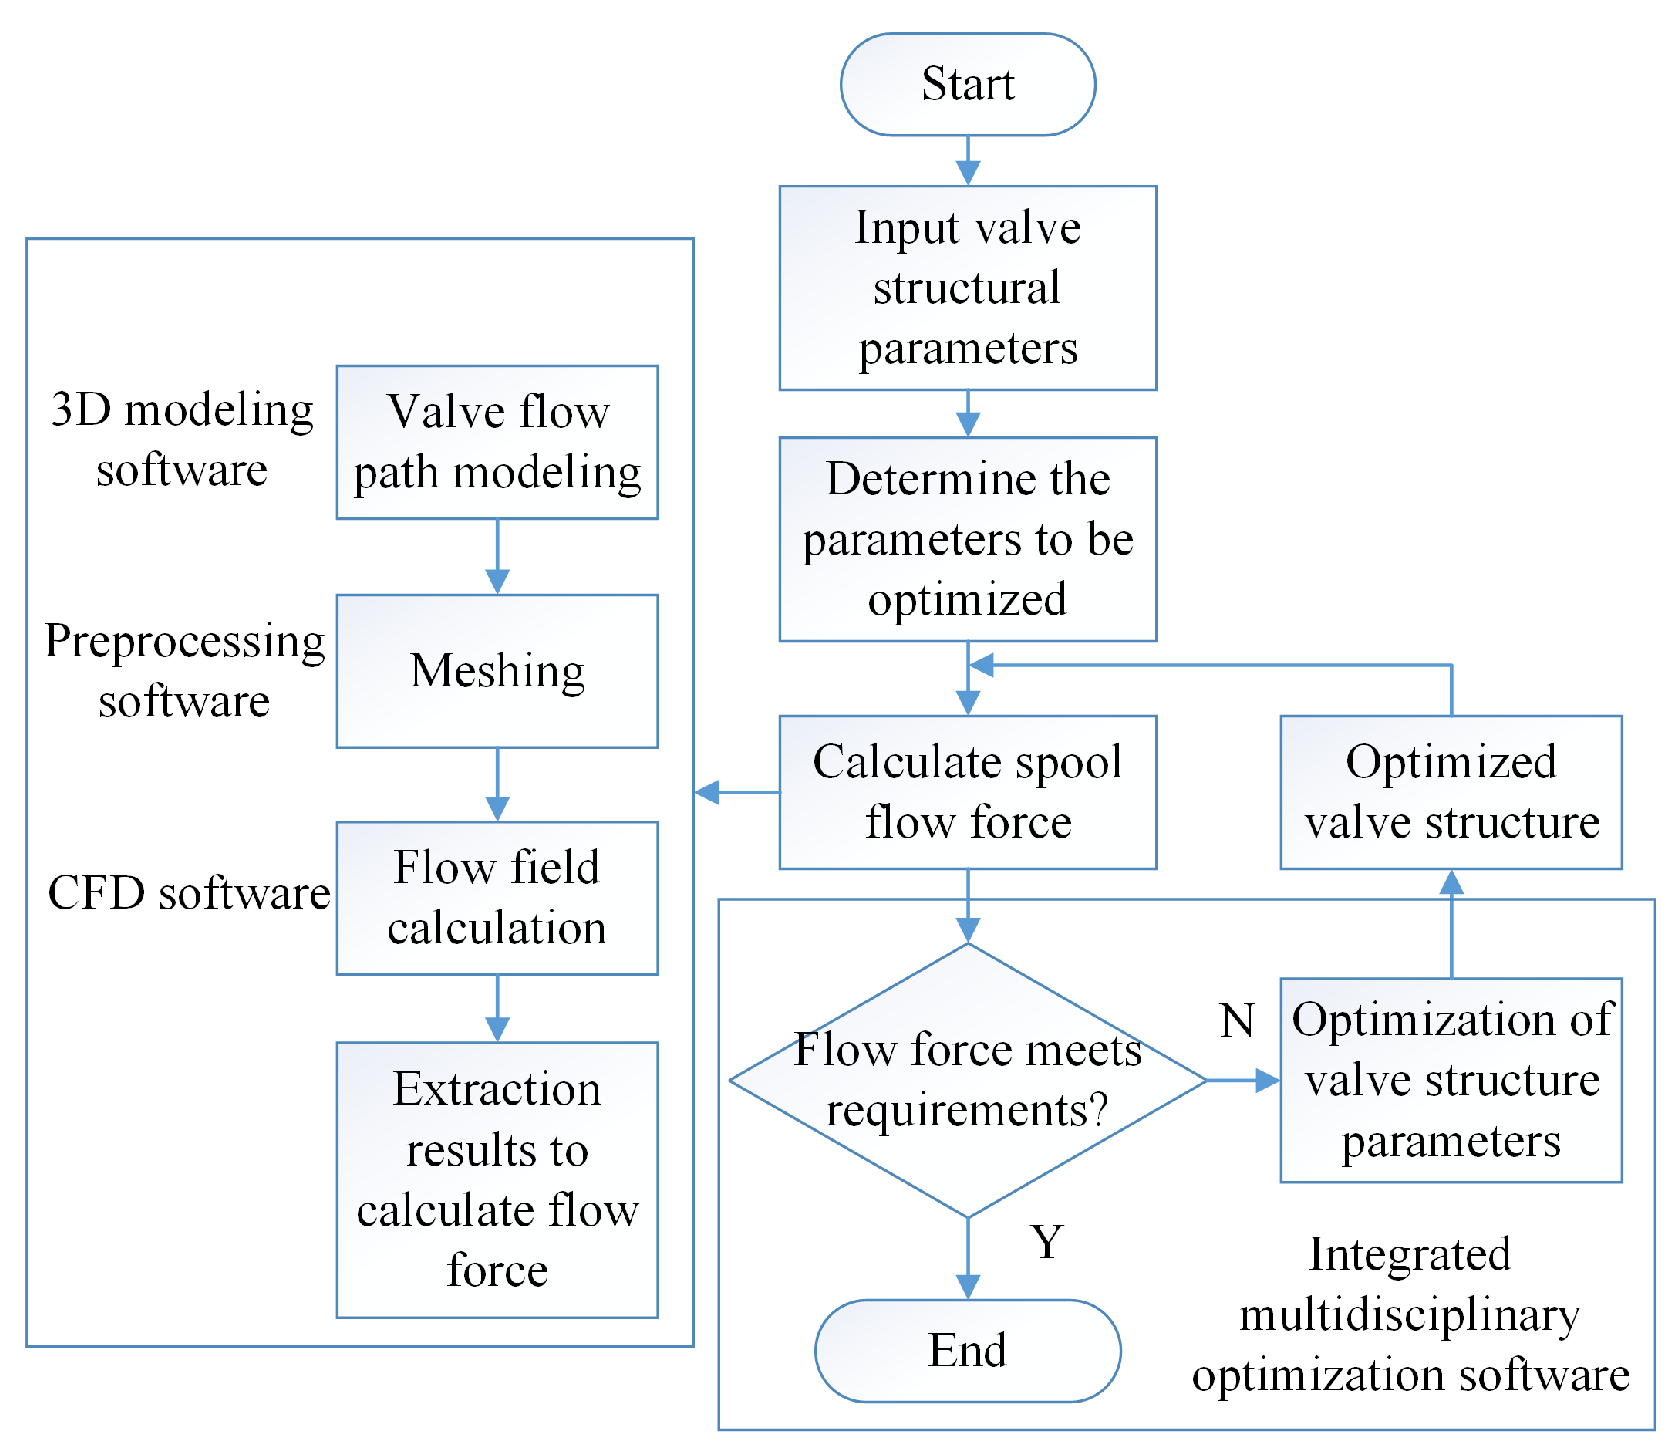
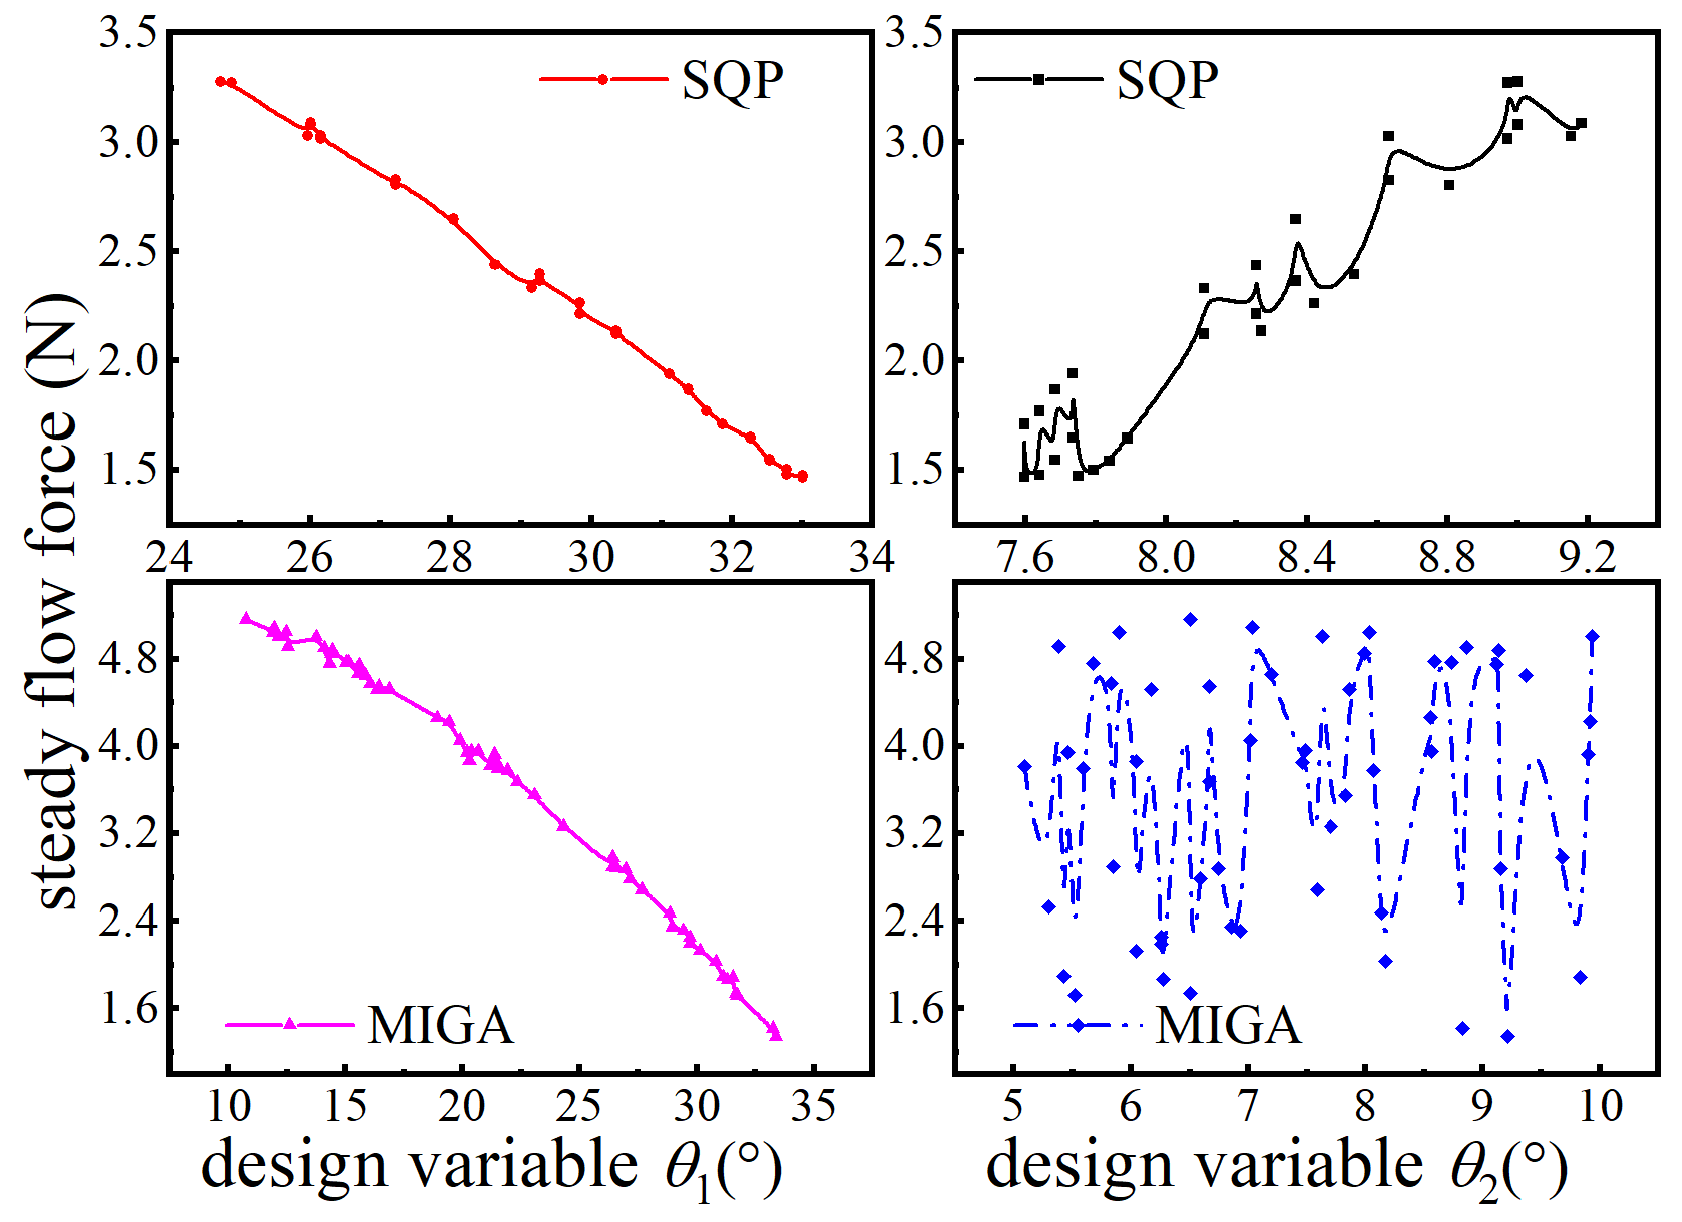
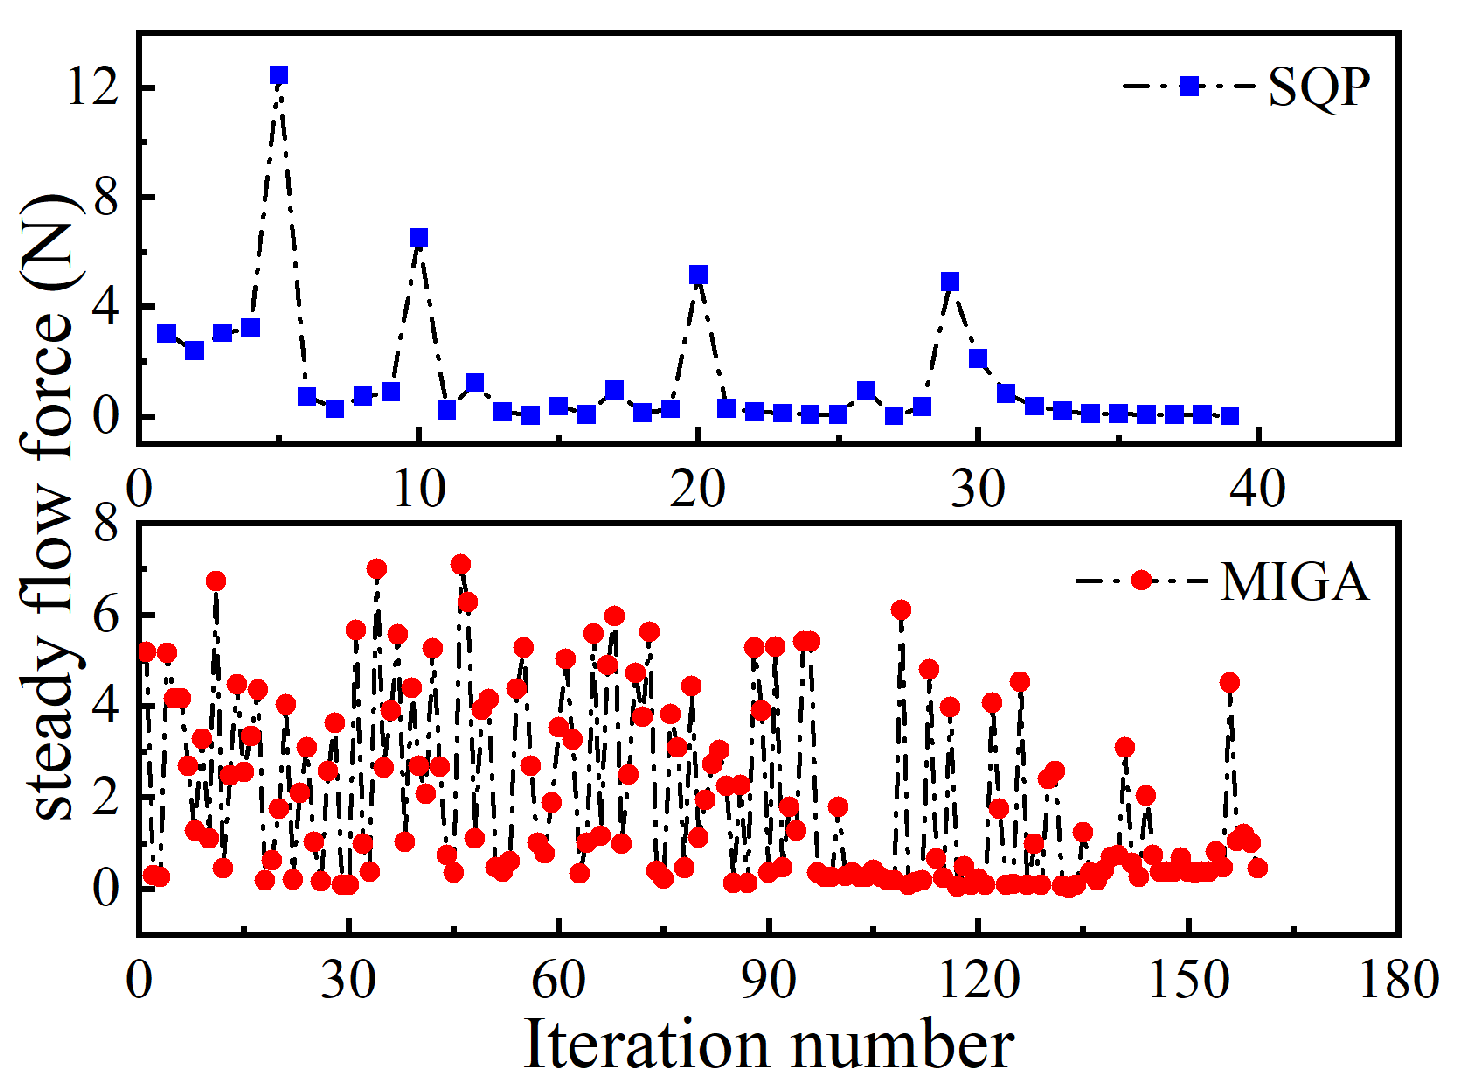
4.3. Optimization of Compensation Structure Parameters

The steady flow force optimization design for the spool of a slide valve involves multiple objectives and constraints. The mathematical model for this optimization can be expressed as follows:
min i W i S F i × F i X , i = 1 , 2 , , n o b j
h j X Target × W j S F j = 0 , j = 1 , 2 , , n c o n
where Fi(X) represents the i-th objective function, hj(X) denotes the j-th constraint function, and X = [θ1, θ2, d1] is the vector of design variables. SF is the scaling factor, with a default value of 1.0, and W is the weighting factor, also set to 1.0 by default.
Objective function: in the optimization process, the magnitude of the steady flow force serves as a direct indicator of the superiority of the compensation structure. Design variables: the primary parameters involved in the optimization include the cone angle of the guiding shoulder θ1, the cone angle of the throttling shoulder θ2, and the diameter of the stem d1, as illustrated in Figure 22. To highlight the advantages of the optimization of the superimposed inner ring cavity over the conventional convex shoulder optimization, two optimization schemes were performed: one involving θ1 and θ2 and the other involving θ1, θ2, and d1.
Constraints: the compensation for steady flow force must not come at the expense of a reduced flow rate. Constraints on the structural parameters are determined based on the geometric interference relationships of the slide valve and the results of the flow field analysis: 10° < θ1 < 35°, 1° < θ2 < 15°, and 10 mm < d1 < 13 mm. The initial values of θ1, θ2, and d1 are 21°, 10°, and 12 mm, respectively.
This paper implements the automatic optimization of flow force compensation structure parameters based on CFD and parametric optimization techniques. The iSIGHT platform is utilized to integrate the flow field simulation software Fluent 17.0, the 3D modeling software ProE 5.0, and the mesh generation software Gambit 2.4, coordinating the processes of 3D dimension design, mesh generation, and flow field analysis. Built-in optimization algorithms are employed to optimize structural parameters, and the automated optimization process is illustrated in Figure 23.
Two optimization algorithms are selected: Sequential Quadratic Programming (SQP) and the Multi-Island Genetic Algorithm (MIGA). The SQP method utilizes the gradient of the objective function for optimization, which enhances efficiency and classifies it as a numerical optimization algorithm. The MIGA is a global exploration optimization algorithm that demonstrates good adaptability for discrete problems, although it requires a larger number of iterations to achieve convergence.
Figure 24 illustrates the relationship curves between the objective function and design variables under two-parameter optimization. In both optimization algorithms, the relationship between the angle of the guiding convex shoulder and steady flow force appears nearly linear, while the angle of the throttling shoulder does not exhibit a clear relationship with steady flow force. Thus, variable θ1 is identified as the primary factor influencing hydraulic dynamics. Table 1 presents the results of the two-parameter structural optimization, indicating that the maximum error in the steady flow force obtained from both optimization algorithms is 8%.
Figure 25 displays the convergence curves for the two optimization algorithms, indicating that the number of iterations for the MIGA is significantly higher than that of the SQP. Considering the convergence, accuracy, and stability of the optimization, the results obtained from the SQP are utilized. Table 2 presents the outcomes of the three-parameter structural optimization, demonstrating that, compared to the optimization of the spool convex shoulder alone, the matching of the annular cavity has further reduced the steady flow dynamics of the slide valve.

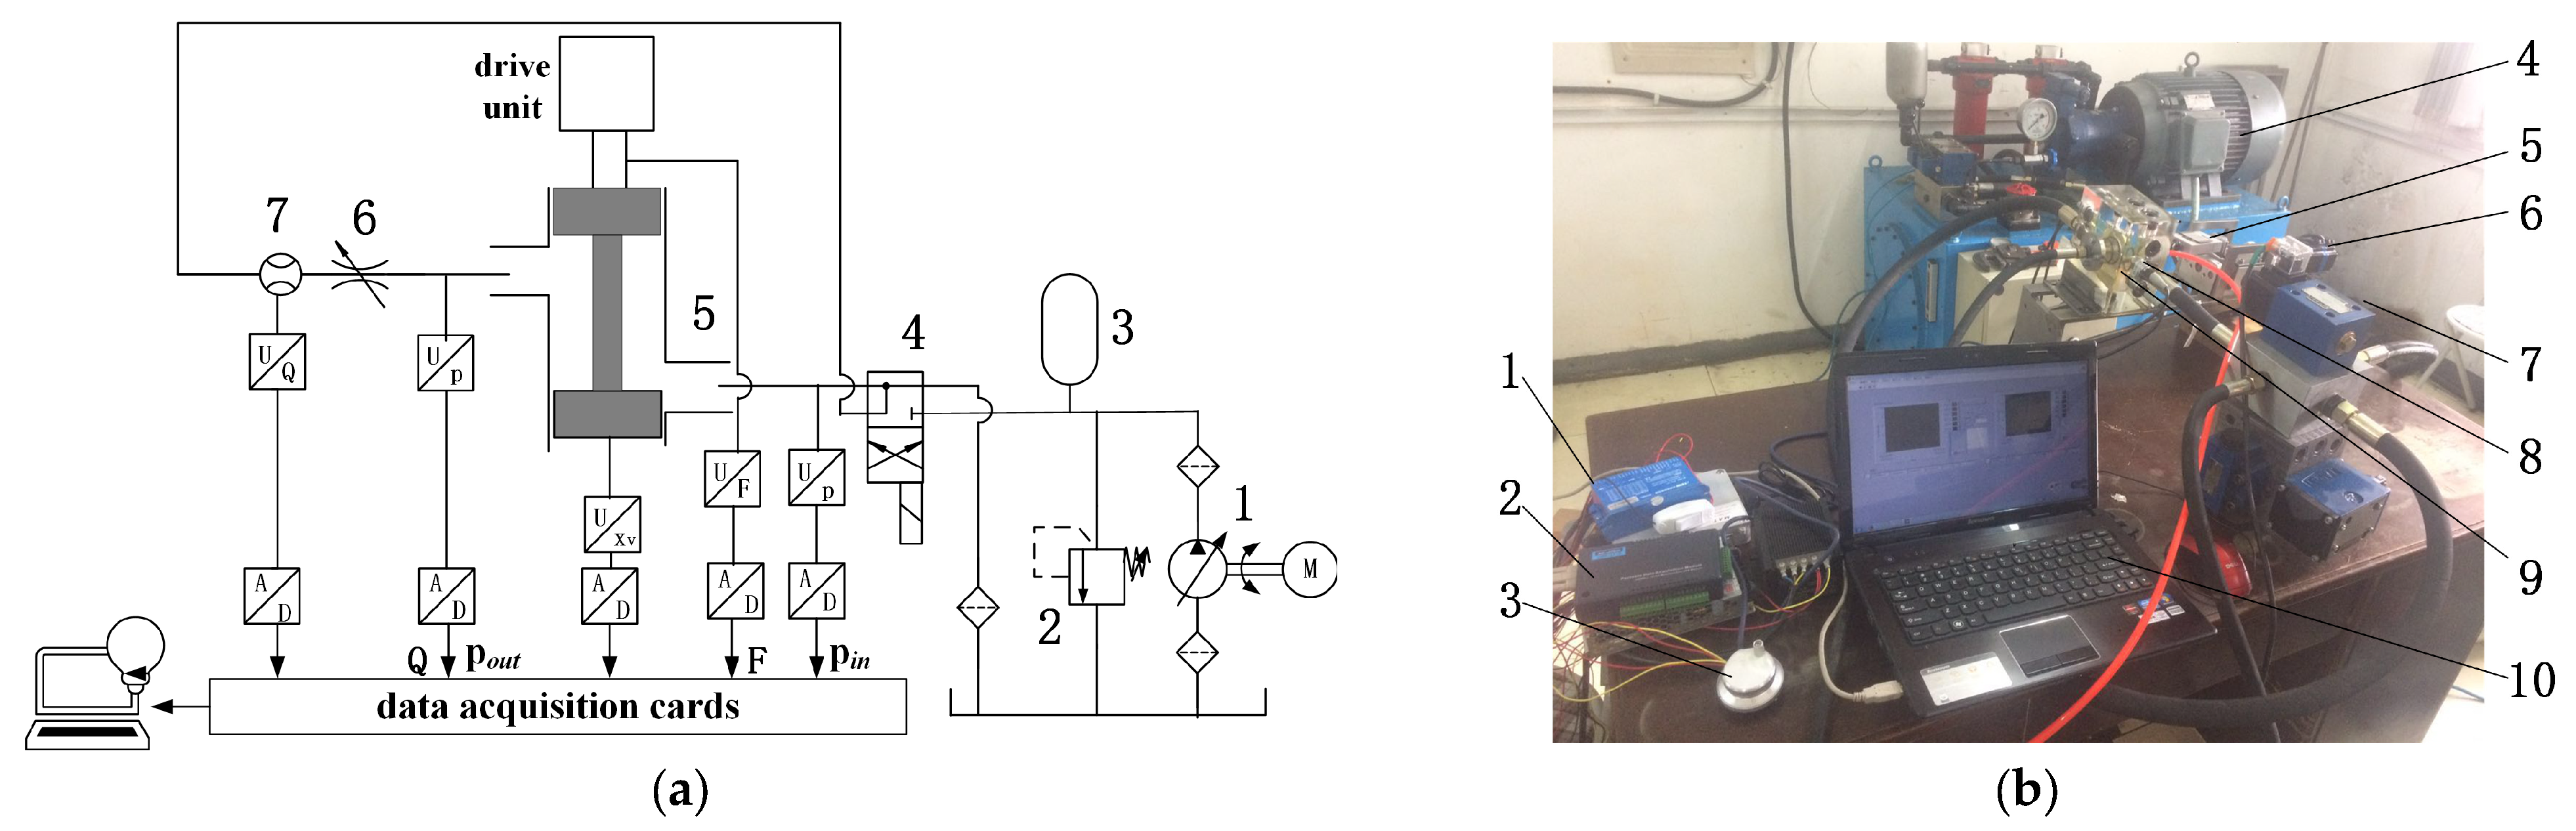
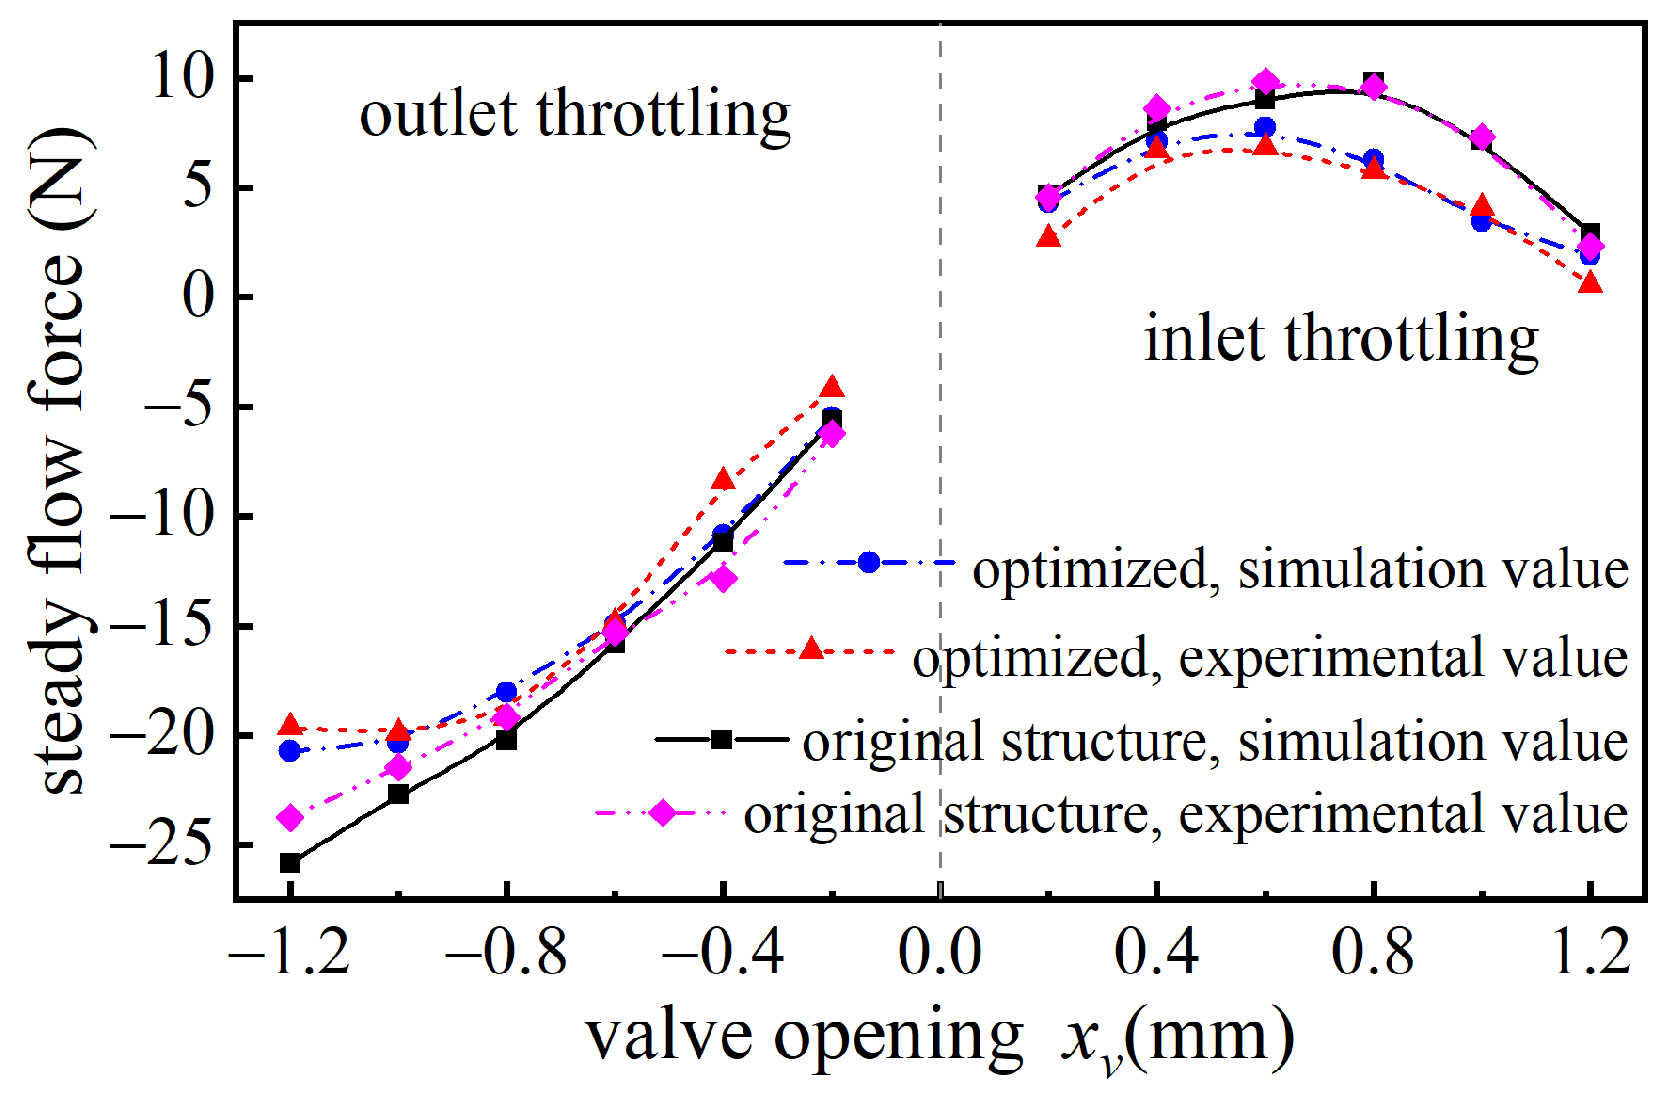
5. Experimental Verification

To validate the correctness of the previous analysis on flow force characteristics and to assess the effectiveness of the proposed compensation structure in reducing steady flow force, a measurement experiment of the steady flow force of the slide valve is required. Figure 26 illustrates the hydraulic circuit schematic of the testing system and the setup of the testing device. A low-pressure, high-flow hydraulic pump station is selected based on the pressure and flow conditions defined in the simulations. The hydraulic circuit is configured as an outlet throttling speed control loop, maintaining a certain back pressure at the outlet to adjust the pressure differential between the inlet and outlet. An accumulator is utilized to mitigate pressure fluctuations in the hydraulic oil. A pulse signal generator, in conjunction with a driver, controls a stepper motor, while a ball screw converts the motor’s rotation into linear motion to actuate the spool. Force and pressure sensors are employed to measure the oil pressure within the valve chamber and the flow forces exerted on the tested spool.
Figure 27 presents a structural diagram, physical image, and actual view of the spool being tested. To facilitate observation of the spool’s movement, the tested valve is made of acrylic. To ensure a uniform flow of the hydraulic fluid, the slide valve chamber features a dual inlet and dual outlet arrangement, consistent with the 3D geometric model. To avoid the influence of radial binding forces on the flow force measurement of the spool, two circumferential grooves are machined in the annular chamber to balance the radial pressure on the spool. The spool and valve sleeve are fitted with a clearance fit, and an oil drain port is provided on the valve cover to minimize friction as much as possible. Furthermore, to reduce the pressure losses in the hydraulic oil, pressure measurement holes are directly drilled into the valve body for oil pressure measurement. The spool, designed for verifying the steady flow force characteristics, features a valve stem diameter ranging from 8 to 14 mm, with the original stem diameter being 11 mm.
The experiment measured the impact of the inner annular chamber’s radial dimensions on the flow force characteristics, with the corresponding flow force curves illustrated in Figure 28. At a valve opening of 1 mm, there was a good consistency between the experimental results and simulations, with the error increasing as the opening widened, reaching a maximum of 17.55% within the experimental range. The results demonstrate that reducing the radial dimensions of the inner annular chamber can increase the fluid momentum at the non-throttling valve port, thereby suppressing the steady flow force of the slide valve. Figure 29 compares the experimental and simulated curves of steady flow force for the original spool and the optimized spool. The experimental results first validate the asymmetry in steady flow force characteristics under the bidirectional throttling mode, with a maximum deviation of 15.83% between the experiments and simulations. For outlet throttling, the average compensation rate for hydraulic dynamics within the experimental range was 15.78%, with a maximum compensation rate of 34.45%. For the inlet throttling mode, the average and maximum compensation rates were 42.58% and 76.47%, respectively.

6. Conclusions

This paper combines theoretical analysis with CFD numerical simulations to investigate the issue of asymmetric flow force characteristics in slide valves under inlet and outlet throttling modes. Based on the found steady flow force characteristics, a compensation method is proposed by introducing a guiding shoulder and matching it with an appropriately sized inner annular chamber. The main conclusions are as follows:
(1)
The primary cause of the asymmetry in steady flow force curves under bidirectional throttling modes is the difference in fluid flow conditions at the non-throttling valve port. For slide valves with large openings in inlet throttling mode, the fluid momentum at the non-throttling valve port significantly influences the steady flow force and can even reverse its direction;
(2)
Vortices caused by turbulent flow are an intrinsic reason for the nonlinearity of flow forces in inlet throttling slide valves. Suppressing vortex formation helps reduce the asymmetry in steady flow forces under bidirectional throttling conditions;
(3)
Increasing the fluid momentum at the non-throttling valve port is an effective means to reduce the steady flow force in slide valves. Experimental results show that the proposed compensation structure reduces steady flow forces by 34.45% and 76.47% for the inlet and outlet throttling modes, respectively.
Notably, the standard k-ε model combined with enhanced wall treatment is a common approach for simulating spool flow forces. However, this method has limitations in handling anisotropy and complex turbulence. Future research could explore large eddy simulation, detached eddy simulation, or the development of more accurate wall treatment methods for improved analysis.

Author Contributions

Conceptualization, Q.M. and Q.Y.; methodology, Q.M. and X.J.; software, X.J.; validation, Z.L. and G.L.; formal analysis, Q.M.; investigation, X.J.; resources, Y.C.; data curation, Y.C.; writing—original draft preparation, X.J.; writing—review and editing, Q.M.; visualization, G.L.; funding acquisition, Z.L. All authors have read and agreed to the published version of the manuscript.

Funding

This work was supported in part by the National Defense Science and Technology Fund (2022-JCJQ-JJ-1065).

Institutional Review Board Statement

Not applicable.

Informed Consent Statement

Not applicable.

Data Availability Statement

The original contributions presented in the study are included in the article, further inquiries can be directed to the corresponding author.

Conflicts of Interest

Author Yichi Cao was employed by the company China Electronics Technology Group Corporation. The remaining authors declare that the research was conducted in the absence of any commercial or financial relationships that could be construed as a potential conflict of interest.

References

  1. Tamburrano, P.; Plummer, A.R.; Distaso, E.; Amirante, R. A Review of Direct Drive Proportional Electrohydraulic Spool Valves: Industrial State-of-the-Art and Research Advancements. J. Dyn. Syst. Meas. Control 2019, 141, 020801. [Google Scholar] [CrossRef]
  2. Stosiak, M.; Karpenko, M.; Deptuła, A.; Urbanowicz, K.; Skačkauskas, P.; Cieślicki, R.; Deptuła, A.M. Modelling and Experimental Verification of the Interaction in a Hydraulic Directional Control Valve Spool Pair. Appl. Sci. 2022, 13, 458. [Google Scholar] [CrossRef]
  3. Li, R.; Sun, Y.; Wu, X.; Zhang, P.; Li, D.; Lin, J.; Xia, Y.; Sun, Q. Review of the Research on and Optimization of the Flow Force of Hydraulic Spool Valves. Processes 2023, 11, 2183. [Google Scholar] [CrossRef]
  4. Herakovič, N. CFD simulation of flow force reduction in hydraulic valves. Teh. Vjesn. 2015, 22, 453–463. [Google Scholar] [CrossRef]
  5. Yuan, Q.; Li, P.Y. Using steady flow force for unstable valve design: Modeling and experiments. J. Dyn. Syst. Meas. Control 2005, 127, 451–462. [Google Scholar] [CrossRef]
  6. Manring, N.D.; Zhang, S. Pressure Transient Flow Forces for Hydraulic Spool Valves. J. Dyn. Syst. Meas. Control 2012, 134, 034501. [Google Scholar] [CrossRef]
  7. Li, Q.; Zong, C.; Liu, F.; Zhang, A.; Xue, T.; Yu, X.; Song, X. Numerical and experimental analysis of fluid force for nuclear valve. Int. J. Mech. Sci. 2023, 241, 107939. [Google Scholar] [CrossRef]
  8. Valdés, J.R.; Miana, M.J.; Núñez, J.L.; Pütz, T. Reduced order model for estimation of fluid flow and flow forces in hydraulic proportional valves. Energy Convers. Manag. 2008, 49, 1517–1529. [Google Scholar] [CrossRef]
  9. Knypiński, Ł.; Kurzawa, M.; Wojciechowski, R.; Gwóźdź, M. Application of the Salp Swarm Algorithm to Optimal Design of Tuned Inductive Choke. Energies 2024, 17, 5129. [Google Scholar] [CrossRef]
  10. Amirante, R.; Del Vescovo, G.; Lippolis, A. Evaluation of the flow forces on an open centre directional control valve by means of a computational fluid dynamic analysis. Energy Convers. Manag. 2006, 47, 1748–1760. [Google Scholar] [CrossRef]
  11. Amirante, R.; Vescovo, G.D.; Lippolis, A. Flow forces analysis of an open center hydraulic directional control valve sliding spool. Energy Convers. Manag. 2006, 47, 114–131. [Google Scholar] [CrossRef]
  12. Aung, N.Z.; Yang, Q.; Chen, M.; Li, S. CFD analysis of flow forces and energy loss characteristics in a flapper–nozzle pilot valve with different null clearances. Energy Convers. Manag. 2014, 83, 284–295. [Google Scholar] [CrossRef]
  13. Ye, Y.; Yin, C.-B.; Li, X.-D.; Zhou, W.-J.; Yuan, F.-F. Effects of groove shape of notch on the flow characteristics of spool valve. Energy Convers. Manag. 2014, 86, 1091–1101. [Google Scholar] [CrossRef]
  14. Han, M.; Liu, Y.; Wu, D.; Zhao, X.; Tan, H. A numerical investigation in characteristics of flow force under cavitation state inside the water hydraulic poppet valves. Int. J. Heat Mass Transf. 2017, 111, 1–16. [Google Scholar] [CrossRef]
  15. Simic, M.; Herakovic, N. Reduction of the flow forces in a small hydraulic seat valve as alternative approach to improve the valve characteristics. Energy Convers. Manag. 2015, 89, 708–718. [Google Scholar] [CrossRef]
  16. Chen, L.; Zhang, C.; Jin, B.; Yuan, T. Simulation and experimental research on steady flow force compensation for a servo proportional valve. Flow Meas. Instrum. 2023, 94, 102457. [Google Scholar] [CrossRef]
  17. Li, R.; Ding, X.; Lin, J.; Chi, F.; Xu, J.; Cheng, Y.; Liu, J.; Liu, Q. Study on the Influence of Triangular Groove Structure on Steady-State Flow Force Compensation Characteristics. Appl. Sci. 2021, 11, 11354. [Google Scholar] [CrossRef]
  18. Ding, X.; Li, R.; Xu, J.; Liu, Q.; Cheng, Y.; Liu, J. Study on flow force compensation characteristics and optimization design of jet guiding groove. Flow Meas. Instrum. 2022, 86, 102194. [Google Scholar] [CrossRef]
  19. Li, R.; Wang, Z.; Xu, J.; Yuan, W.; Wang, D.; Ji, H.; Chen, S. Design and optimization of hydraulic slide valve spool structure based on steady state flow force. Flow Meas. Instrum. 2024, 96, 102568. [Google Scholar] [CrossRef]
  20. Wu, D.; Wang, X.; Ma, Y.; Wang, J.; Tang, M.; Liu, Y. Research on the dynamic characteristics of water hydraulic servo valves considering the influence of steady flow force. Flow Meas. Instrum. 2021, 80, 101966. [Google Scholar] [CrossRef]
  21. Xie, H.; Tan, L.; Liu, J.; Chen, H.; Yang, H. Numerical and experimental investigation on opening direction steady axial flow force compensation of converged flow cartridge proportional valve. Flow Meas. Instrum. 2018, 62, 123–134. [Google Scholar] [CrossRef]
  22. Tan, L.; Xie, H.; Chen, H.; Yang, H. Structure optimization of conical spool and flow force compensation in a diverged flow cartridge proportional valve. Flow Meas. Instrum. 2019, 66, 170–181. [Google Scholar] [CrossRef]
  23. Amirante, R.; Moscatelli, P.G.; Catalano, L.A. Evaluation of the flow forces on a direct (single stage) proportional valve by means of a computational fluid dynamic analysis. Energy Convers. Manag. 2007, 48, 942–953. [Google Scholar] [CrossRef]
  24. Amirante, R.; Distaso, E.; Tamburrano, P. Sliding spool design for reducing the actuation forces in direct operated proportional directional valves: Experimental validation. Energy Convers. Manag. 2016, 119, 399–410. [Google Scholar] [CrossRef]
  25. Lisowski, E.; Filo, G.; Rajda, J. Analysis of Flow forces in the initial phase of throttle gap opening in a proportional control valve. Flow Meas. Instrum. 2018, 59, 157–167. [Google Scholar] [CrossRef]
  26. Lisowski, E.; Czyżycki, W.; Rajda, J. Three dimensional CFD analysis and experimental test of flow force acting on the spool of solenoid operated directional control valve. Energy Convers. Manag. 2013, 70, 220–229. [Google Scholar] [CrossRef]
  27. Lisowski, E.; Filo, G.; Rajda, J. Pressure compensation using flow forces in a multi-section proportional directional control valve. Energy Convers. Manag. 2015, 103, 1052–1064. [Google Scholar] [CrossRef]
  28. Pan, X.; Wang, G.; Lu, Z. Flow field simulation and a flow model of servo-valve spool valve orifice. Energy Convers. Manag. 2011, 52, 3249–3256. [Google Scholar] [CrossRef]
  29. Lisowski, E.; Filo, G. Analysis of a proportional control valve flow coefficient with the usage of a CFD method. Flow Meas. Instrum. 2017, 53, 269–278. [Google Scholar] [CrossRef]
  30. Launder, B.; Spalding, D. The numerical computation of turbulent flows. Comput. Methods Appl. Mech. Eng. 1974, 3, 269–289. [Google Scholar] [CrossRef]
Figure 1. Pressure relief valve model use in a type of armored vehicle. (a) flow path model; (b) simplified model; (c) structural schematic.
Applsci 14 11037 g001
Figure 2. Force schematic of inlet throttling slide valve chamber.
Applsci 14 11037 g002
Figure 3. Verification of grid independence.
Applsci 14 11037 g003
Figure 4. Jet angle and axial velocity of hydraulic oil during bidirectional flow. (a) Throttling valve port; (b) non-throttling valve port.
Applsci 14 11037 g004
Figure 5. Streamline diagrams of the flow field inside the sliding valve chamber. Left: inlet throttling mode; right: outlet throttling mode.
Applsci 14 11037 g005
Figure 6. Variation curves of (a) steady flow force and (b) flow rate with valve opening.
Applsci 14 11037 g006
Figure 7. Variation in steady flow forces with opening at throttled and unthrottled valve ports.
Applsci 14 11037 g007
Figure 8. Flow velocity clouds of the inlet throttling slide valve at different valve openings xv, from left to right: valve openings xv are 0.2, 0.4, 0.6, 0.8, 1.0, 1.2, 1.4, and 1.6, respectively.
Applsci 14 11037 g008
Figure 9. Flow velocity clouds of the outlet throttling slide valve at different valve openings xv, from left to right: valve openings xv are 0.2, 0.4, 0.6, 0.8, 1.0, 1.2, 1.4, and 1.6, respectively.
Applsci 14 11037 g009
Figure 10. Inlet throttling slide valve jet angle and jet velocity.
Applsci 14 11037 g010
Figure 11. Variation curve of viscous force with valve opening.
Applsci 14 11037 g011
Figure 12. Cloud plot of entropy production rate for two throttling modes. Left: outlet throttling, right: inlet throttling.
Applsci 14 11037 g012
Figure 13. Flow velocity cloud (left) and entropy production rate cloud (right) for a slide valve with an arc-shaped flow channel.
Applsci 14 11037 g013
Figure 14. Entropy production curves for two flow channels.
Applsci 14 11037 g014
Figure 15. Absolute value of steady flow force versus valve opening for two flow channels.
Applsci 14 11037 g015
Figure 16. Velocity contour plots of the internal flow field within the slide valve chamber under different λ1 values, from left to right: λ1 = 0.94, 2.34, 1.6, 1.75, 2.1, 2.44, and 3, respectively.
Applsci 14 11037 g016
Figure 17. Variation in steady flow force and flow rate with respect to λ1.
Applsci 14 11037 g017
Figure 18. Variation in steady flow forces with λ1 for throttling and non-throttling valve ports.
Applsci 14 11037 g018
Figure 19. Velocity clouds of three shoulder-compensated structures at different openings xv, from left to right: xv = 0.2, 0.6, 1, 1.4, respectively.
Applsci 14 11037 g019
Figure 20. Compensating effect of three shoulder structures on steady flow force.
Applsci 14 11037 g020
Figure 21. Jet angle and flow rate at unthrottled valve port before and after compensation.
Applsci 14 11037 g021
Figure 22. Parameters of the compensation structure.
Applsci 14 11037 g022
Figure 23. Automatic optimization of structural parameters for flow force compensation.
Applsci 14 11037 g023
Figure 24. Curve of design variables versus objective function.
Applsci 14 11037 g024
Figure 25. Convergence curves of two optimization algorithms.
Applsci 14 11037 g025
Figure 26. (a) Hydraulic circuit schematic: 1—hydraulic pump, 2—relief valve, 3—accumulator, 4—solenoid switching valve, 5—valve under test, 6—throttle valve, 7—flow meter. (b) Test bench: 1—step motor driver, 2—data acquisition card, 3—pulse generator, 4—hydraulic pumping station, 5—force transducer, 6—step motor, 7—solenoid switching valve, 8—pressure transducer, 9—experimental valve, 10—computer.
Applsci 14 11037 g026
Figure 27. (a) Main cross-section of valve under test; (b) top view of valve under test; (c) spools with different λ1 and final compensated spool.
Applsci 14 11037 g027
Figure 28. Variation curve of steady flow force with λ1 and valve opening xv.
Applsci 14 11037 g028
Figure 29. Comparison of steady flow force for original and optimized structures.
Applsci 14 11037 g029
Table 1. Two-parameter structure optimization results.
Optimization Algorithmθ1θ2Fspool/N
SQP7.6331.46
MIGA9.233.41.34
Table 2. Three-parameter structure optimization results.
Optimization Algorithmθ1θ2d1/mmFspool/N
SQP9.12611.80.12
MIGA6.825.611.80.34
Disclaimer/Publisher’s Note: The statements, opinions and data contained in all publications are solely those of the individual author(s) and contributor(s) and not of MDPI and/or the editor(s). MDPI and/or the editor(s) disclaim responsibility for any injury to people or property resulting from any ideas, methods, instructions or products referred to in the content.

