Article

Modeling of Phosphate Sorption Process on the Surface of Rockfos® Material Using Langmuir Isotherms

1
Department of Environmental Engineering and Geodesy, University of Life Sciences in Lublin, Leszczyńskiego 7, 20-069 Lublin, Poland
2
Mirosław Zalewski MONT-SAN, Rogoźnica 75, 21-560 Międzyrzec Podlaski, Poland
3
Institute of Environmental Engineering, Warsaw University of Life Sciences−SGGW, Nowoursynowska 159, 02-787 Warsaw, Poland
*
Author to whom correspondence should be addressed.
Appl. Sci. 2024, 14(23), 10996; https://doi.org/10.3390/app142310996
Submission received: 27 August 2024 / Revised: 4 November 2024 / Accepted: 16 November 2024 / Published: 26 November 2024
(This article belongs to the Special Issue Wastewater Treatment Technologies—3rd Edition)

Abstract

:
In this study, we aimed to develop a mathematical description of the process of phosphate sorption on Rockfos® material using the Langmuir isotherm and determine the basic parameters for modeling this process. The Rockfos® material was formed through the thermal treatment of opoka at 980 °C and is highly reactive due to its significant calcium and silicon compound content. This study included an evaluation of the phosphate retention efficiency on the material as a function of the phosphate concentration in the initial solution (0.5 mg/L, 1.0 mg/L, and 2.0 mg/L), sorbent grain size (1.0–1.6 mm, 1.6–2.5 mm, and 2.0–5.0 mm), and process temperature (5 °C, 10 °C, 15 °C, 20 °C, and 25 °C). It was found that an increase in the process temperature and the phosphate concentration in the solution favored sorption, while the effect of the sorbent grain size was ambiguous. It was determined that sorption can be described well using the Langmuir linearization of the Langmuir model. Thermodynamic analysis and the separation coefficient suggest that phosphorus sorption on Rockfos® material is primarily based on chemisorption, and the process is endothermic and spontaneous over the entire temperature range. The determined parameters of the tested material, especially the qmax (maximum sorption capacity), provide a basis for the design of a filter for removing phosphate from wastewater, assuming that the load is equal to the inflow to the filter and adheres to the specified requirements for treated wastewater.

1. Introduction

Phosphorus is an element that is found in wastewater in various forms [1]. It most commonly occurs as organic phosphorus from fecal matter and food residues as well as in the form of phosphates as a residue from detergents and from anaerobic transformations of organic phosphorus [2]. Ortho- and monophosphates are predominant in both the dissolved and molecular forms and cumulatively account for about 40% of total P [3]. Due to its strong biogenicity, phosphorus can negatively affect the environment, especially the water quality in lakes and ponds. A significant source of phosphorus in water bodies is wastewater, so legislation on the discharge of wastewater into the environment stipulates stricter criteria, conditioned primarily by the amount of wastewater according to the population equivalent (p.e.) [4]. These characteristics necessitate the use of various methods of phosphorus removal, among which are biological methods, which involve the use of anaerobic and aerobic activated sludge, and chemical methods, which involve the use of chemical compounds that, with phosphates, form insoluble, easily sedimented sludge [5]. The low abundance of phosphorus as a fossil resource with high industrial and agricultural value [6] requires measures to be taken to recover phosphorus from various sources, including wastewater and sewage sludge [7,8,9] and, wherever possible, the use of circulating cycles [10]. One method of extracting phosphorus from a stream of flowing wastewater is to filter it through a specific material. In this process, apart from various types of flow physical phenomena [11], chemical reactions of phosphate ions with cations constituting the adsorbent, one of the most important roles is played by the adsorption process [12]. Additionally, sorption materials saturated with previously retained phosphorus can be used as an agricultural fertilizer [13].
Sorption is a process that has been known for many years and is used in a wide range of chemical-engineering process lines [14], water treatments [15,16], and wastewater treatments [17,18,19,20,21].
Published studies on the parameters and phenomena occurring during sorption concern isotherms, kinetics, and the removal efficiencies of various contaminants. The most common studies concern the sorption of lead [22,23,24,25], nickel [26], cadmium [27], surfactants [28], dyes [18], etc. The independent variables that affect sorption efficiency the most are the grain sizes of the deposits [29], process temperature [22], water pH [23,25,26,27], and, most importantly, the type of adsorbent [30,31,32]. In batch studies, the dose of the adsorbent is a critical parameter [25,27]. Sufficient results have been obtained using amorphous calcium silicate hydrates (A-CSHs) with a molar ratio of calcium to silicon greater than 2 [33] or a single-phase calcium silicate hydrate (C-S-H) [34]. Extensive research has been conducted concerning opoka [35] and a derived material called Polonite® [36,37]. A similar material is a product called Rockfos®, which is formed after firing carbonate–silica rock (opoka) at a high temperature (980 °C) [38].
To date, Rockfos® material has been used to improve the efficiency of removing phosphorus from effluents flowing out from hydrophytic treatment plants [39,40,41]. Studies analyzing the phosphorus removal efficiency at different firing temperatures and hydraulic loading rates were performed by Jóźwiakowski et al. [42] and Jucherski et al. [43]. These studies showed that a filter material with finer granulation and a longer retention time of the wastewater in the filter provided better phosphorus removal results. It was also shown that when used at a full technical scale in filters at the outflow area of hydrophytic wastewater treatment plants, the material did not provide a significant phosphorus removal effect, at about 30% [44]. Previous studies on the Langmuir isotherms of phosphate sorption on opoka and opoka-based manufactured materials showed inconsistencies with regards to the relevant parameters due to variations in sorbent sourcing [12], process parameters (the initial concentration of phosphorus in the solution, the mass of sorbents, etc.) [45], and the use of different methods for linearizing the general equation [8,33,46,47,48,49].
In this study, we aimed to develop and analyze a mathematical description of the process of phosphate sorption on Rockfos® material using Langmuir isotherms and determine the corresponding model parameters. In developing the description, the influence of the initial concentration of phosphate in the solution, the sorbent’s grain size, and the process’s temperature were considered. The parameters determined using Langmuir isotherms, especially the maximum absorbency of the sorbent, can provide a basis for the design of final wastewater treatment filters for use in small wastewater treatment plants, including the determination of the volume of the filter bed and the total operating time.

2. Materials and Methods

2.1. Material

The Rockfos® material used in this study was produced from an opoka rock quarried near Piaski in Lublin Province, Poland. The material was formed by heat treating the quarried rock at 980 °C. It is characterized by a CaO content of 43.336% by weight, a SiO2 content of 36.047%, and an Al2O3 content of approximately 6%. Detailed information is provided in other publications [11,38,44]. Before the tests, the material was sifted through the appropriate sieves, and fractions with grain sizes of 1.0 ÷ 1.6, 1.6 ÷ 2.5, and 2.0 ÷ 5.0 mm were used for testing.

2.2. Method

A 50.00 mg/L stock solution of synthetic phosphate was prepared by dissolving 0.220 g of Chempur’s analytical-grade anhydrous potassium dihydrogen phosphate (KH2 PO4) in distilled water in a 1000 mL volumetric flask. The stock solution was then diluted with distilled water to obtain the desired concentration of the experimental working solution, i.e., 0.5, 1.0, and 2.0 mg/L.
Studies of sorption isotherms were carried out in a set of Erlenmeyer flasks (200 mL) in which increasing masses of sorbent were weighed, viz., 0.05, 0.100, 0.200, 0.300, 0.400, 0.500, 0.600, 0.700, and 0.800 g, with granulations of 1.0 ÷ 1.6, 1.6 ÷ 2.5, and 2.0 ÷ 5.0 mm. To each series of flasks, 100 ml of potassium dihydrogen phosphate (KH2 PO4) solution at concentrations of 0.5, 1.0 and 2.0 mg/L were added. The samples were shaken in a laboratory shaker and placed in a thermostatic cabinet at 5, 10, 15, 20, and 25 °C for 24 h. The shaking amplitude was 230 rpm. The solutions were then filtered on a blotting paper filter. Aqueous samples were taken from the filtrate, and their total phosphorus content and pH were determined. The total hardness and calcium concentration of the selected samples were also determined. Each series of tests was performed in triplicate, and the arithmetic mean of the results was used for calculations. As a result, analyses were conducted on nine adsorbent samples, three different granulations, three initial KH2PO4 concentrations, and five temperatures. A total of 405 experiments were performed.
Total phosphorus was determined using a spectrophotometric method, with the oxidation of the test sample performed in a thermoreactor at 120 °C for 30 min based on the international standard PN-EN ISO 6878: 2006 + Ap1:2010 + Ap2:2010 [50]. In each sample, we also determined the pH value via a potentiometric method using an ORION Star A329 multi-parameter meter (Thermo Scientific, Waltham, MA, USA). The international standard, PN-EN ISO 10523: 2012 [51], was adhered to when measuring the pH values. Total hardness and calcium content were determined using phthalein red and NANOCOLOR tube tests (Macherey-Nagel, Düren, Germany).

2.3. Evaluation of Phosphate Retention Efficiency

The efficiency of phosphate removal from the solution was determined based on the initial concentration (C0) and the final concentration (after the sorption process) (Ck) using Formula (1):
E f = C 0 C k C 0 · 100 % ,
in which the numerator is the equilibrium concentration, Ce = C0 − Ck.

2.4. Models

The Langmuir model in the general form and linear form according to the Langmuir, Lineweaver–Burk, Scatchard, and Eadie–Hoffsie linearization methods were used to model isotherms. These models are shown in Table 1. The models in linear form were used to calculate the characteristic coefficients of the process, while the model in general form was used for error analysis.
The sorption capacity q in mg/g was calculated based on Equation (2), in which m denotes the adsorbent mass (in g); Ce denotes the equilibrium phosphate (mg/L); and V denotes the sample volume, given in L
q = C e · V m
The modeling of the process using Langmuir isotherms was conducted using linear forms, in which graphs with Ce/q = f(q) in the Langmuir linearization, 1/q = f(1/Ce) in the Lineweaver–Burke linearization, q/Ce = f(q) in the Scatchard linearization, and q = f(q/Ce) in the Eadie–Hofstee linearization [47,49] were made. The points on the graphs were approximated via a linear function accounting for the slope coefficients and the point of intersection with the vertical axis. This allowed for the calculation of the characteristic parameters, which are the Langmuir isotherm constant, KL, and the maximum sorption capacity, i.e., the mass that the analyzed adsorbent, qmax, can bind.
To evaluate the degree of fit of the linear trend function, the coefficient of determination, R2, was determined. The separation coefficient, also called the equilibrium parameter, RL, which is expressed in Formula (8), was also calculated:
R L = 1 1 + K L · C 0
RL is interpreted as follows: RL < 1 indicates that adsorption is favorable; RL ∼ 0 indicates that adsorption is irreversible; RL = 1 suggests that the adsorption isotherm is linear; and RL > 1 indicates that adsorption is unfavorable [28]. A considerable number of publications inaccurately indicate that adsorption is irreversible when RL = 0 [25,26,27,47,52,53]. Such a situation cannot occur, as the denominator must reach infinity. For the high denominator values in Formula (8), the RL-value will be very small—close to zero. Also highly doubtful is the situation wherein RL > 1. This can occur only if the product C0 · KL < 0 translates into a negative value of the constant KL because C0 cannot be harmful.

2.5. Statistical Analysis

An analysis of the fit of the measurement points and individual models was performed using the coefficient of determination, R2; the sum of squares of errors, ERRSQ (The Sum Square of Errors); the composite fractional error function, HYBRD (Hybrid Fractional Error Function); the average relative error, ARE (Average Relative Error); the Fisher F test; and the χ2 test [54]. The relevant formulas are shown below.
E R R S Q = i = 1 K q e x p q c a l c 2
H Y B R D = 100 k p i = 1 k q e x p q c a l c 2 q e x p
A R E = 100 k i = 1 k q e x p q c a l c q e x p
F = k p · i = 1 k q e x p 1 k · i = 1 k q e x p 2 k 1 · i = 1 k q e x p q c a l c 2
χ 2 = i = 1 k q e x p q c a l c 2 q c a l c
Here, qexp denotes the sorption obtained from measurements, qcalc denotes the sorption obtained from calculations using the model in general form, k is the number of measurement points, and p is the number of model parameters.
Statistical studies of the effect of temperature on sorption were performed using the GLM (generalized linear model) [55], with the dependent variable “q”, the quantitative variable “Ce”, and temperature as the qualitative variable.
In addition, in order to show whether there are significant differences between the sorption capacity at different process temperatures and Rockfos® material granulations, an analysis of variance was performed. The normality of distributions in individual groups was tested using the Shapiro–Wilk test, and the homogeneity of variance was tested using Levene’s test. When the tested variables followed a normal distribution and the homogeneity of variance was maintained, differences between groups were analyzed with the ANOVA test. To identify which means differed significantly, post hoc NIR tests were applied. When variables within groups did not follow a normal distribution (according to the Shapiro–Wilk test), differences between groups were analyzed using the nonparametric Kruskal–Wallis ANOVA test. Significant differences between groups were then identified through multiple comparisons of the mean ranks for all samples. Statistical analyses were performed using STATISTICA 13.3.

2.6. Thermodynamic Analysis

A thermodynamic analysis of the process was performed using relationships (14)–(16) [25,53].
K d = q C e
Δ G = R · T · ln K d
ln K d = Δ S R Δ H R T
Here, Kd is the equilibrium constant derived from the adsorption capacity, q, and the equilibrium concentration, Ce; ΔG denotes the standard free energy (J/mol); ΔS denotes the standard entropy (J/mol); ΔH denotes the standard enthalpy (J/(mol · K); R denotes the gas constant, 8.314 (J/(mol · K); and T denotes the absolute temperature (K).
The linear relationship (17) was used to determine the relevant parameters:
ln K d = f 1 T
whose directional coefficient is expressed by H/R, and the ordinate of the point of intersection of the vertical axis is indicated by S/R.

3. Results and Discussion

Figure 1, Figure 2 and Figure 3 show the relationship between the sorption capacity “q” of Rockfos® material and the loss of phosphate concentration in solution. The analysis considered different initial concentrations of phosphate in solution (0.5 mg/L, 1.0 mg/L, and 2.0 mg/L), granulations of sorption material (1.0–1.6 mm, 1.6–2.5 mm, and 2.0–5.0 mm), and selected process running temperatures (5 °C, 15 °C, and 25 °C). Each data series consists of nine points corresponding to different sorbent weights.
The results show that the amount of phosphate removed from the solution increases curvilinearly with increasing sorbent weights. The range of these values is strongly influenced by the initial concentration of phosphate in the solution, an observation that has been confirmed by previous studies [18,29]. At the lowest concentration, 0.5 mg/L, phosphate loss did not exceed 0.4 mg/L, even when using the most considerable sorbent weight (0.800 g). At higher initial phosphate concentrations, namely, 1.0 mg/L and 2 mg/L, maximum phosphate losses reached 0.90 mg/L and 1.24 mg/L, respectively. Preliminary studies of the Rockfos® material conducted by Kasprzyk et al. [29] showed a significant variation in the sorption capacity of the material depending on the initial concentration of phosphorus in the solution. The sorption capacity of the fine fraction of the material at a low phosphate concentration was 0.9 mg/g [48]. When using wastewater with higher phosphate concentrations, the sorption capacities were 9.6 mg/g and 45.6 mg/g [8,29]. Karaca et al. [56] conducted studies on a natural material, dolomite, and reported the phosphate sorption value to be 51.02 mg/g at the initial concentration in a solution of 60 mg/L. In turn, experiments using distilled water (with an initial phosphorus concentration of 0.28 mg/L), groundwater (0.34 mg/L), tap water (0.34 mg/L), and sewage (0.56 mg/L) revealed the sorption capacity of dolomite to be 0.06, 0.072, 0.05, and 0.05 mgP/g, respectively. The maximum sorption capacities, calculated using the Freundlich and Langmuir models, were 0.12 and 0.093 gP/kg [57], respectively. Column studies using shale conducted by Kpannieu et al. [58] also confirmed the positive relationship between the sorption capacity of the material and the initial concentration of phosphorus in the solution. The maximum sorption capacities for the material were 0.06 and 0.23 mg P/g, with initial concentrations of phosphorus of 5 and 25 mg/L, respectively [58]. It is worth noting, however, that some studies using natural materials came to different conclusions. Cyrus et al. [59,60] achieved a maximum sorption capacity of 0.17 g P/kg for shale at an initial concentration of 1000 mg P/L, which can be compared to 0.50 g P/kg at an initial concentration of 100 mg P/L [59,60].
The effect of the initial adsorbate concentration in a solution on sorption was also reported by Ho et al. [22] for lead sorption on tree fern sorbent; Reczek et al. [24] for lead on activated carbon, clinoptilolite, and manganese-dioxide-modified chalcedonite; and Tran et al. [49] for cadmium on orange peel sorbent. Wang et al. [23] showed that lead sorption on phosphoric-acid-activated carbon increases with increasing pH and decreases with an increase in ionic strength (which occurs during ion exchange).
The effect of grain size on sorption efficiency is shown in Figure 4, using two equilibrium concentration values (about 0.1 mg/L and 0.3 mg/L) and two selected process temperatures (10 °C and 20 °C) as examples. The magnitudes of phosphate sorption were determined by plotting q = f (Ce) (Figure 1, Figure 2 and Figure 3). The points are arranged somewhat chaotically, and it is impossible to decide which grain size favors sorption.
The scattering of the measurement points may result from variations in the content of active compounds in the individual portions of the sorbent used in this study. It should be emphasized that natural rocks were used in this study after being burned, crushed, and separated into fractions. The compositions of individual particles could therefore be different depending on the natural crystallization processes occurring over long periods of time, temperature fluctuations during crystallization, and other disturbances influencing the variability of the shares of individual oxides of different metals. Statistical analysis also showed that at the initial concentration of phosphates in the solution, 0.5 mg/L, the tested fractions of the Rockfos® material did not differ significantly in terms of phosphate sorption. Statistical analysis also showed that at the initial concentration of phosphates in the solution (0.5 mg/L), the tested fractions of the Rockfos® material did not differ significantly in terms of phosphate sorption. This finding was consistent across all the analyzed temperatures. At a concentration of 1.0 mg/L, the sorption capacity for granulations of 1.6–2.5 mm and 2–5 mm across the entire temperature range was significantly higher than that for the 1–1.6 mm granulation. In turn, at a concentration of 2.0 mg/L and low process temperatures (5 °C, 10 °C), sorption for the 2–5 mm fraction was significantly lower than that for the 1.6–2.5 mm granulation. At higher process temperatures, no significant differences in phosphate sorption were observed between the granulations.
A study carried out by Kasprzyk et al. [29] concluded that grain size affects sorption efficiency, but a closer examination of the text in this publication does not support this conclusion. The smaller the grains, the larger the surface area, revealing a relationship that can increase sorption capacity [12,29,61]. In chemisorption processes, however, the chemically active parts of the grains will play a more crucial role (rather than the total surface area). Therefore, it can be stated that in the case of materials with a heterogeneous composition, grain sizes within the ranges applied in this study do not affect the amounts of phosphates retained in the chemisorption process.
Temperature is one of the most critical factors affecting the amount of phosphate sorption on Rockfos® material. This relationship is illustrated in Figure 5 using the example of a 2.0–5.0 mm granulation with an initial phosphate concentration in solution of 2 mg/L.
The results in Figure 5 show an increase in sorption with increasing temperatures. The points corresponding to 5 °C are the lowest, and those corresponding to 25 °C are the highest. To statistically substantiate the effect of temperature on the amount of sorption (q) and equilibrium concentration (Ce), an analysis was performed using the generalized linear model (GLM); sample results are shown in Figure 6.
The model showed a statistically significant effect of temperature on sorption, with a probability of less than 0.001, which is less than the assumed significance level of 0.05. The data in Figure 6 show an apparent effect of temperature on the amount of phosphate sorption on Rockfos® material. The 5 and 10 °C results were included in one group, “a”, as they differed slightly from each other. In contrast, the average sorption values for the other temperatures were so different from each other that they were modeled in separate groups, “b”, “c”, and “d”. The ANOVA and Kruskal–Wallis ANOVA tests showed that at an initial phosphate concentration of 0.5 mg/L in the solution, there were no significant differences in the sorption capacity of the material across the various process temperatures. However, at higher initial concentrations (1.0 and 2.0 mg/L), the sorption capacity at 20 °C and 25 °C was significantly higher than that observed at lower temperatures. This pattern applied to each granulation of the Rockfos® material.
In the literature [25,46], these graphs initially (at low sorbent doses) have a strong upward trend, and from a certain mass of sorbent onward, the graph stacks upward horizontally. A strong upward trend in sorption modeled by the Langmuir isotherm with increasing temperatures was shown by Lomowskiy et al. [62], who studied melanin sorption on buckwheat husks but at higher temperatures of 40 °C, 50 °C, and 60 °C.
Figure 7 shows the effects of phosphate removal from the solution as a sorbent weight function at different sorption process temperatures. The points from 1 to 9 on the horizontal axis refer to the increasing sorbent weight, given in Section 2.2. A close proportional relationship between the effects of phosphate removal from solution and sorbent mass can be observed in all of the data series. However, the amplitude of the values is closely related to the temperature at which the sorption process was carried out. At 5 °C, 10 °C, and 15 °C, the course of the curves is similar, and the determined effects range from 1.5–2.6% to 37.2–41.7% (Figure 7). At 20 °C and 25 °C, the effects were noticeably higher and, depending on the sorbent mass, ranged from 1.1–61.0% to 3.1–66.1%, respectively.
The increase in efficiency as a function of temperature is not always so clear-cut. As shown in the study carried out by Hassani et al. [53], efficiency increased with increasing temperatures for black eriochrome-induced color removal and decreased for blue maxilon removal.
Similarly, the sorption of lead on tree ferns [22], cadmium on eucalyptus bark [27], cadmium on orange peel [49], and phosphate on calcium silicate hydrate (C-S-H) increased with increasing temperatures [34,49], as did the sorption of sodium oleate on a quartz surface [63] and melanin on buckwheat husks [62]. The opposite is true during the sorption of gases, as sorption decreases with increasing temperatures (e.g., carbon dioxide on selected coal samples) [64,65]. Inconclusive results have been obtained regarding the sorption of heavy oil in quartz nanopores at high temperatures [66].
Additional measurements of pH, total hardness, and calcium concentration were made to evaluate the influence of ion exchange processes on the sum effect of sorption. The choice of these indicators was dictated by previous reports of a strong impact of opoka on solution pH [8,13,33,34,44,45] and the chemical composition of the rock [11,12,29,44,45,67]. The hardness of the solution increased during the tests; its average value at the most negligible weight of sorbent was 1.56 ± 0.79 °dh, while it was 7.09 ± 1.98 °dh at the most significant weight. The calcium concentration increased from 12.76 ± 5.47 mg Ca/L to 46.27 ± 11.87 mg Ca/L. This indicates a significant role of ion exchange, during which phosphates react with calcium, leading to the precipitation of calcium phosphate as a residue. The chemisorption process cannot be ignored when using Rockfos® material. A partial confirmation of this reasoning is the increase in pH in the subsequent samples, that is, with increasing sorbent weights. Due to the heterogeneity of the composition of the rocks themselves, the pH changes of the solution were not uniform, although the vast majority varied from about 7.2 to about 8.6. Example pH results are shown in Figure 8.
Figure 8 shows the boundaries of each of the four quadrilles. The area between each series shows the boundaries (lower and upper) of each quadrille in which 10–11 measurement results were contained. These counts are a result of dividing the 45 measurements for each sorbent weight into four parts. For the most part, the pH values with the sorbent weights used did not exceed 9.0. However, in four cases, the pH exceeded this value and even approached 9.5. At such high pH values, the binding of phosphates to the Rockfos® material during the sorption process is enhanced by the formation of precipitates due to the reaction of calcium ions with phosphates. In wastewater treatment plants, in sludge treatment lines using anaerobic processes at the outflow area of the treatment plant, high pH stimulates sludge precipitation in the form of struvite or hydroxyapatite [68,69]. The irregular points referred to as the A and E series are there because the points on the graph refer to the single values (minimum and maximum) found in the set of 45 measurements, in each of the nine series assigned to the corresponding weights. These pH measurements should not be equated with studies on the effect of solution pH on the sorption effect, as presented in many publications [14,31,53]. In the present study, the pH during the experiment was controlled based on the observations of other researchers [8,12,70] who have shown that the materials obtained through the thermal processing of opoka in contact with water precipitate a significant increase in pH, sometimes to a range that is unacceptable for water or wastewater discharged into the environment.
The results of modeling studies concerning phosphate sorption on grains of Rockfos® material are shown in Table 2.
The results presented in Table 2 show that the way the general Langmuir model is linearized has a significant impact on the key parameters. These parameters include KL, i.e., the Langmuir adsorption constant (L/mg) that is related to the apparent energy of sorption [71], and qmax, which represents the maximum sorption capacity on the surface of the deposit grains.
An analysis of the individual values in Table 2 reveals irregular scatterings, which are challenging to describe methodically. However, qmax increases with increasing temperatures. With increasing phosphate concentrations in the solution, as shown in Figure 9, the most important parameter with a practical dimension is the maximum amount of phosphate that can be absorbed by a gram of analyzed material. The average values as a function of temperature depending on the grain size of the adsorbent for all four linearizations are shown in Figure 9.
Upon analyzing the graphs in Figure 9, it can be assumed that in the winter, at wastewater temperatures below 10 °C, 1 g of the test material can absorb 0.6–0.8 mg of phosphate, while in the summer, at 20–25 °C, it can absorb 0.8–1.0 mg. Scientific reports note opoka’s tremendous variation in phosphate absorption capacity and its modifications. The type of opoka and its source are essential aspects. With high proportions of silica (light opoka) and carbonates (heavy opoka), the sorption volumes of phosphate obtained from the Langmuir isotherm were 80 mg P/g and 137–181 mg P/g, respectively [12]. After the firing of opoka, the content of iron oxides is an essential aspect, and this is especially the case for calcium oxides, which, in amounts between 238.6 and 520.1 g of Ca/kg, stimulate the absorption of 12.3–25.5 mg of P-PO4−3/g [35]. Kasprzyk et al. [8,29] studied two materials, rock with high CaCO content3 (M1) and Rockfos® material (M2), which showed considerable differences in sorption. The sorption values obtained from the Langmuir isotherm were qmax = 256.41 mg/g for the M1 material and 0.36 mg/g for the M2 material. Cucarella and Renman [45] and Li et al. [46] showed that the type of rock is not the only parameter that affects phosphate sorption; they noted a dependence on sorbent particle size and pH and a robust correlation with phosphate concentrations in solution.
Laboratory results are not always fully translated into the practical performance of sorbents working in the final stage of wastewater treatment plants. Westholm [70], studying phosphate sorption on blast furnace slag, found that, compared to laboratory results from field studies, phosphorus sorption decreased significantly by about twofold.
The calculations made for LI and LII linearization (Figure 9A) show more excellent stabilization, while those obtained for LIII and LIV linearization (Figure 9B) show overestimated results with such substantial scattering that they can hardly be considered reliable. Since these results were obtained from the exact measurements, it can be seen that the linearization method has a significant impact on the conclusions. The above analyses show that sorption analysis using Langmuir linearization should be used, with Lineweaver–Burke constituting a secondary option.
The linearization of the general formula, approximation with a linear function, and, finally, the determination of KL and qmax naturally introduce errors, partially expressed by the determination coefficient, R2, shown for all cases in Table 2. As can be seen, the highest values of R2 were obtained from Langmuir linearization, which means that this mode of operation and this way of determining KL and qmax generates the least significant errors. The two graphs shown in Figure 10 show a comparison of such cases.
To more precisely determine the goodness of fit of the function with respect to the measurement results, error functions were determined for all the cases, described in Table 2 as optimization criteria. The characteristic quantities were determined using Formulas (8)–(12) and are shown in Table 3. The values are given in Table 3. The general formula was defined on the basis that there were no additional errors that are inevitable with linearization and approximation.
In Table 3, individual cells are labeled as L with the corresponding Roman numeral, referring to the specific linearization method. For example, in the first row, the lowest ESRQ, HYBRD, ARE, and χ2 values were obtained using Langmuir linearization, labeled LI. The same situation applies for Fisher’s test; however, this test determines the best fit when the value is as high as possible. Analyzing all the fits together with the typical and commonly used R2 is an excellent way of selecting the best fit for the results and thus, determining the correct values of KL, qmax, and RL. However, listing any fit in the table as the best fit should not be misleading since, for ESRQ, one would have to accept results with a multiplier of no more than 10−5, with multipliers for HYBRD, ARE, Fisher’s test, and the Chi-square test being less than 5 · 10−2, less than 10, more significant than 5, and under 5 · 10−3, respectively.
In the thermodynamic analysis, we used qmax and C0 to calculate Kd, followed by functional graphs lnKd = f(1/T). Example relationships for granulations of 1.0–1.6 mm and 2.0–5.0 mm and initial phosphate concentrations in solution of 0.5 and 1.0 mg/L are shown in Figure 11.
The directional coefficients and ordinates of the vertical axis intersection were used as the basis for calculating standard entropy (ΔS), standard enthalpy (ΔH), and standard free energy (ΔG). A summary of the results is shown in Table 4.
The results in the ΔG column are given for the range of temperatures tested. The first number corresponds to 5 °C and the second to 25 °C, and inside the range are values for intermediate temperatures.
Positive entropy values indicate that some structural changes are taking place on the adsorbent’s surface and reveal random interferences at the solid–liquid interface. They confirm an increase in the degree of disordered particles and energy dissipation throughout the temperature range. Negative enthalpy values indicate that sorption is exothermic. Negative free energy values suggest that the phosphate adsorption process is spontaneous over the studied temperature range. It can also be noted that ΔG increases with increasing solution temperatures, which can be explained by adsorption becoming slightly more challenging with increasing temperatures [53].

4. Conclusions

Our analysis of the results of the phosphate sorption tests conducted on Rockfos® allowed the following conclusions to be drawn.
  • The Langmuir isotherm, especially in the linearized form proposed by Langmuir, gave results that were the closest to those obtained from measurements. Linearization according to the Lineweaver–Burke suggestion ranked second. Only in some series did the calculations made according to the Scatchard and Eadie–Hofstee linearization show a good fit and a small error, but these results are too scanty to recommend use.
  • In assessing the degree of fit between the trend line and the survey results, it is insufficient to rely on the R2 coefficient of determination since even a few outliers from the main set cause a sharp drop in the R2 value. Additional error analyses, such as ESRQ, HYBRD, ARE, Fisher’s test, and Chi-square test (χ2), are instrumental in better illustrating the degree of fit, since they are performed on the model in its general form. At the same time, R2; refers to the linearized function.
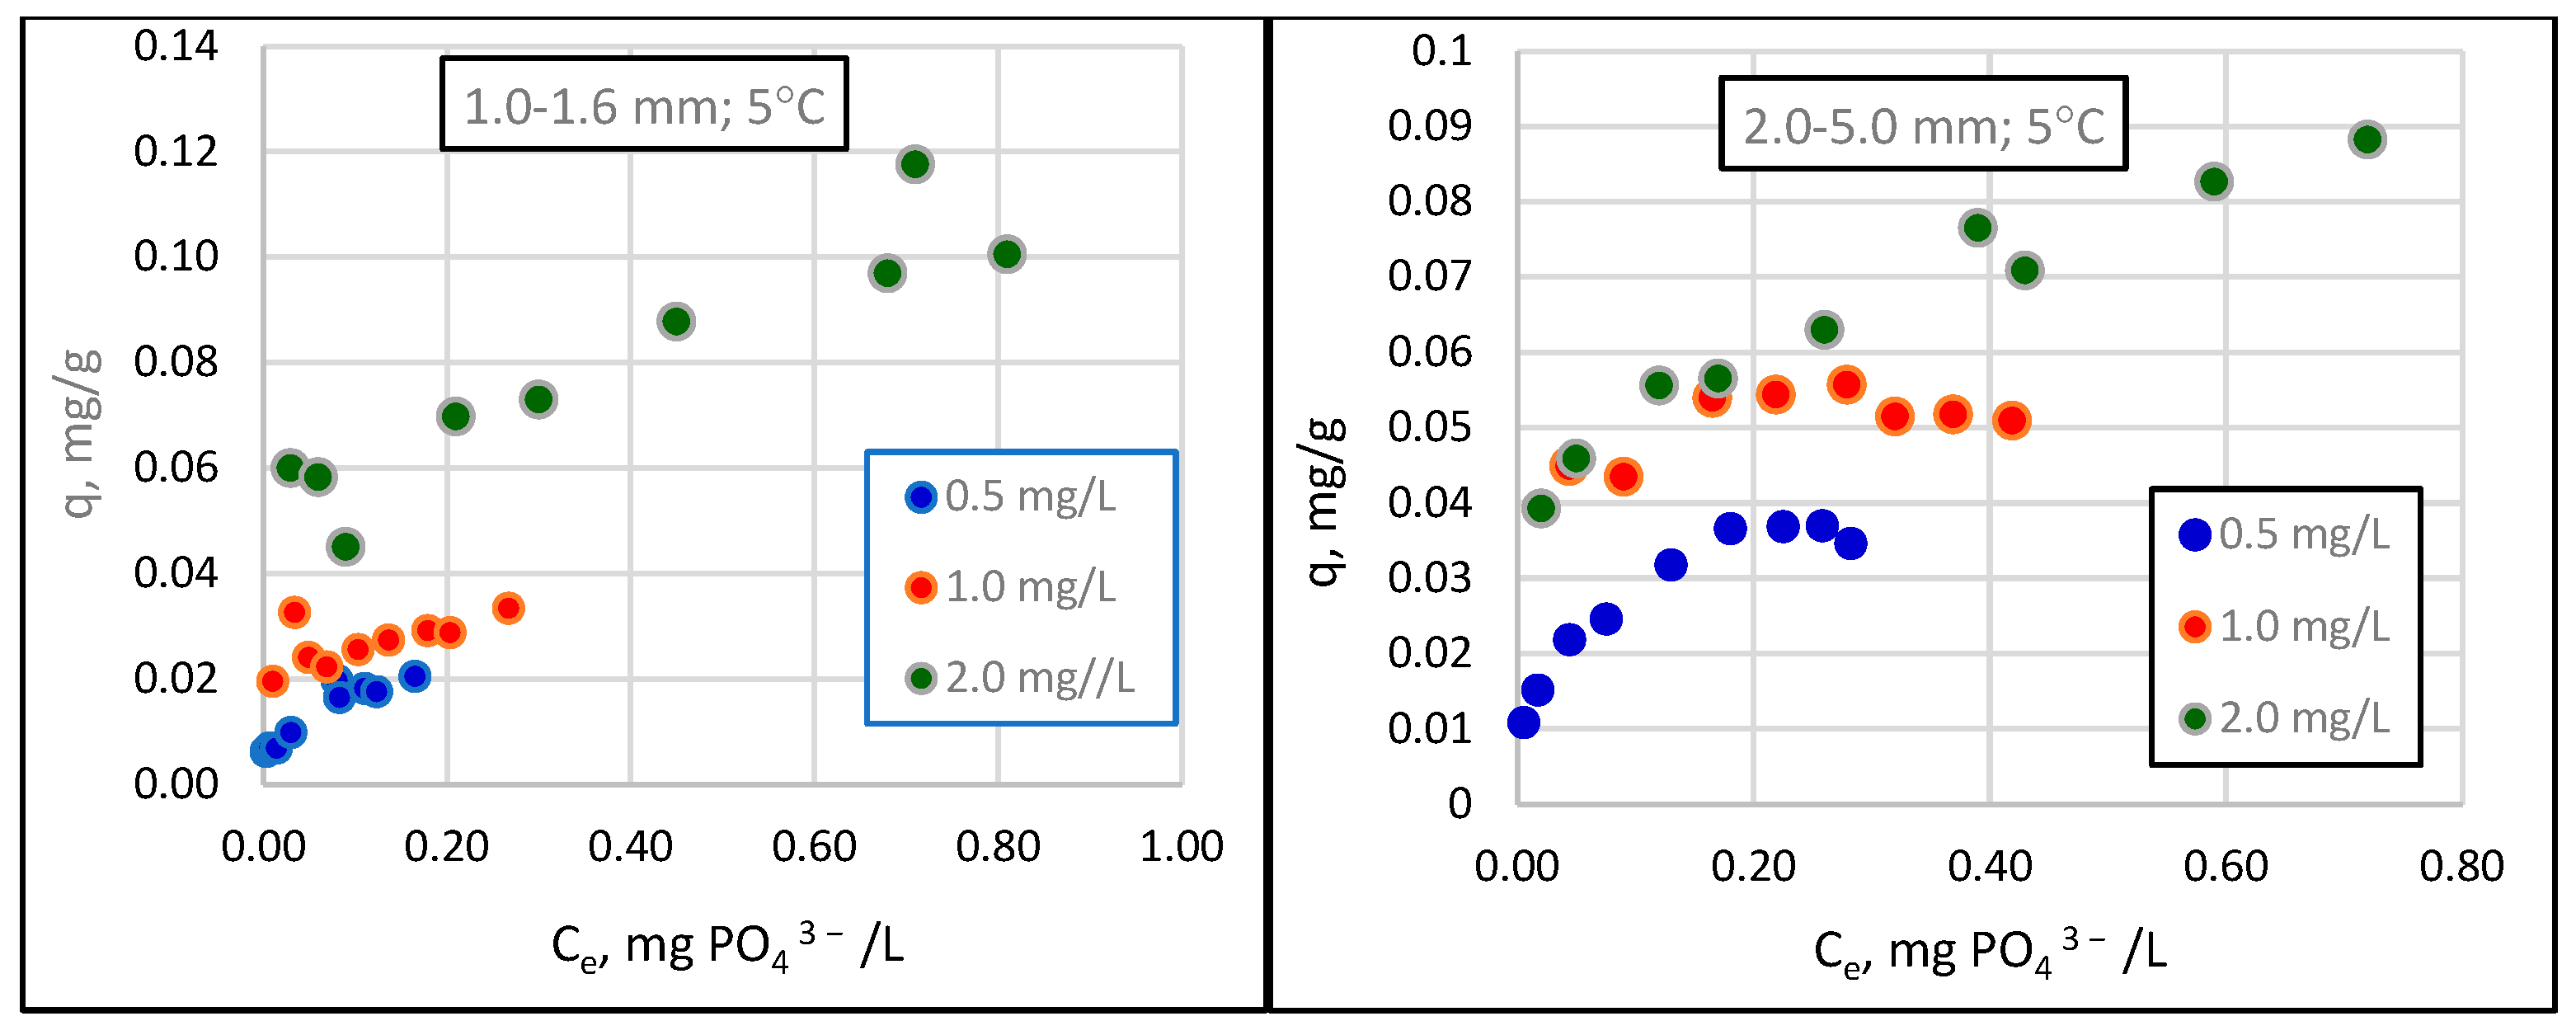
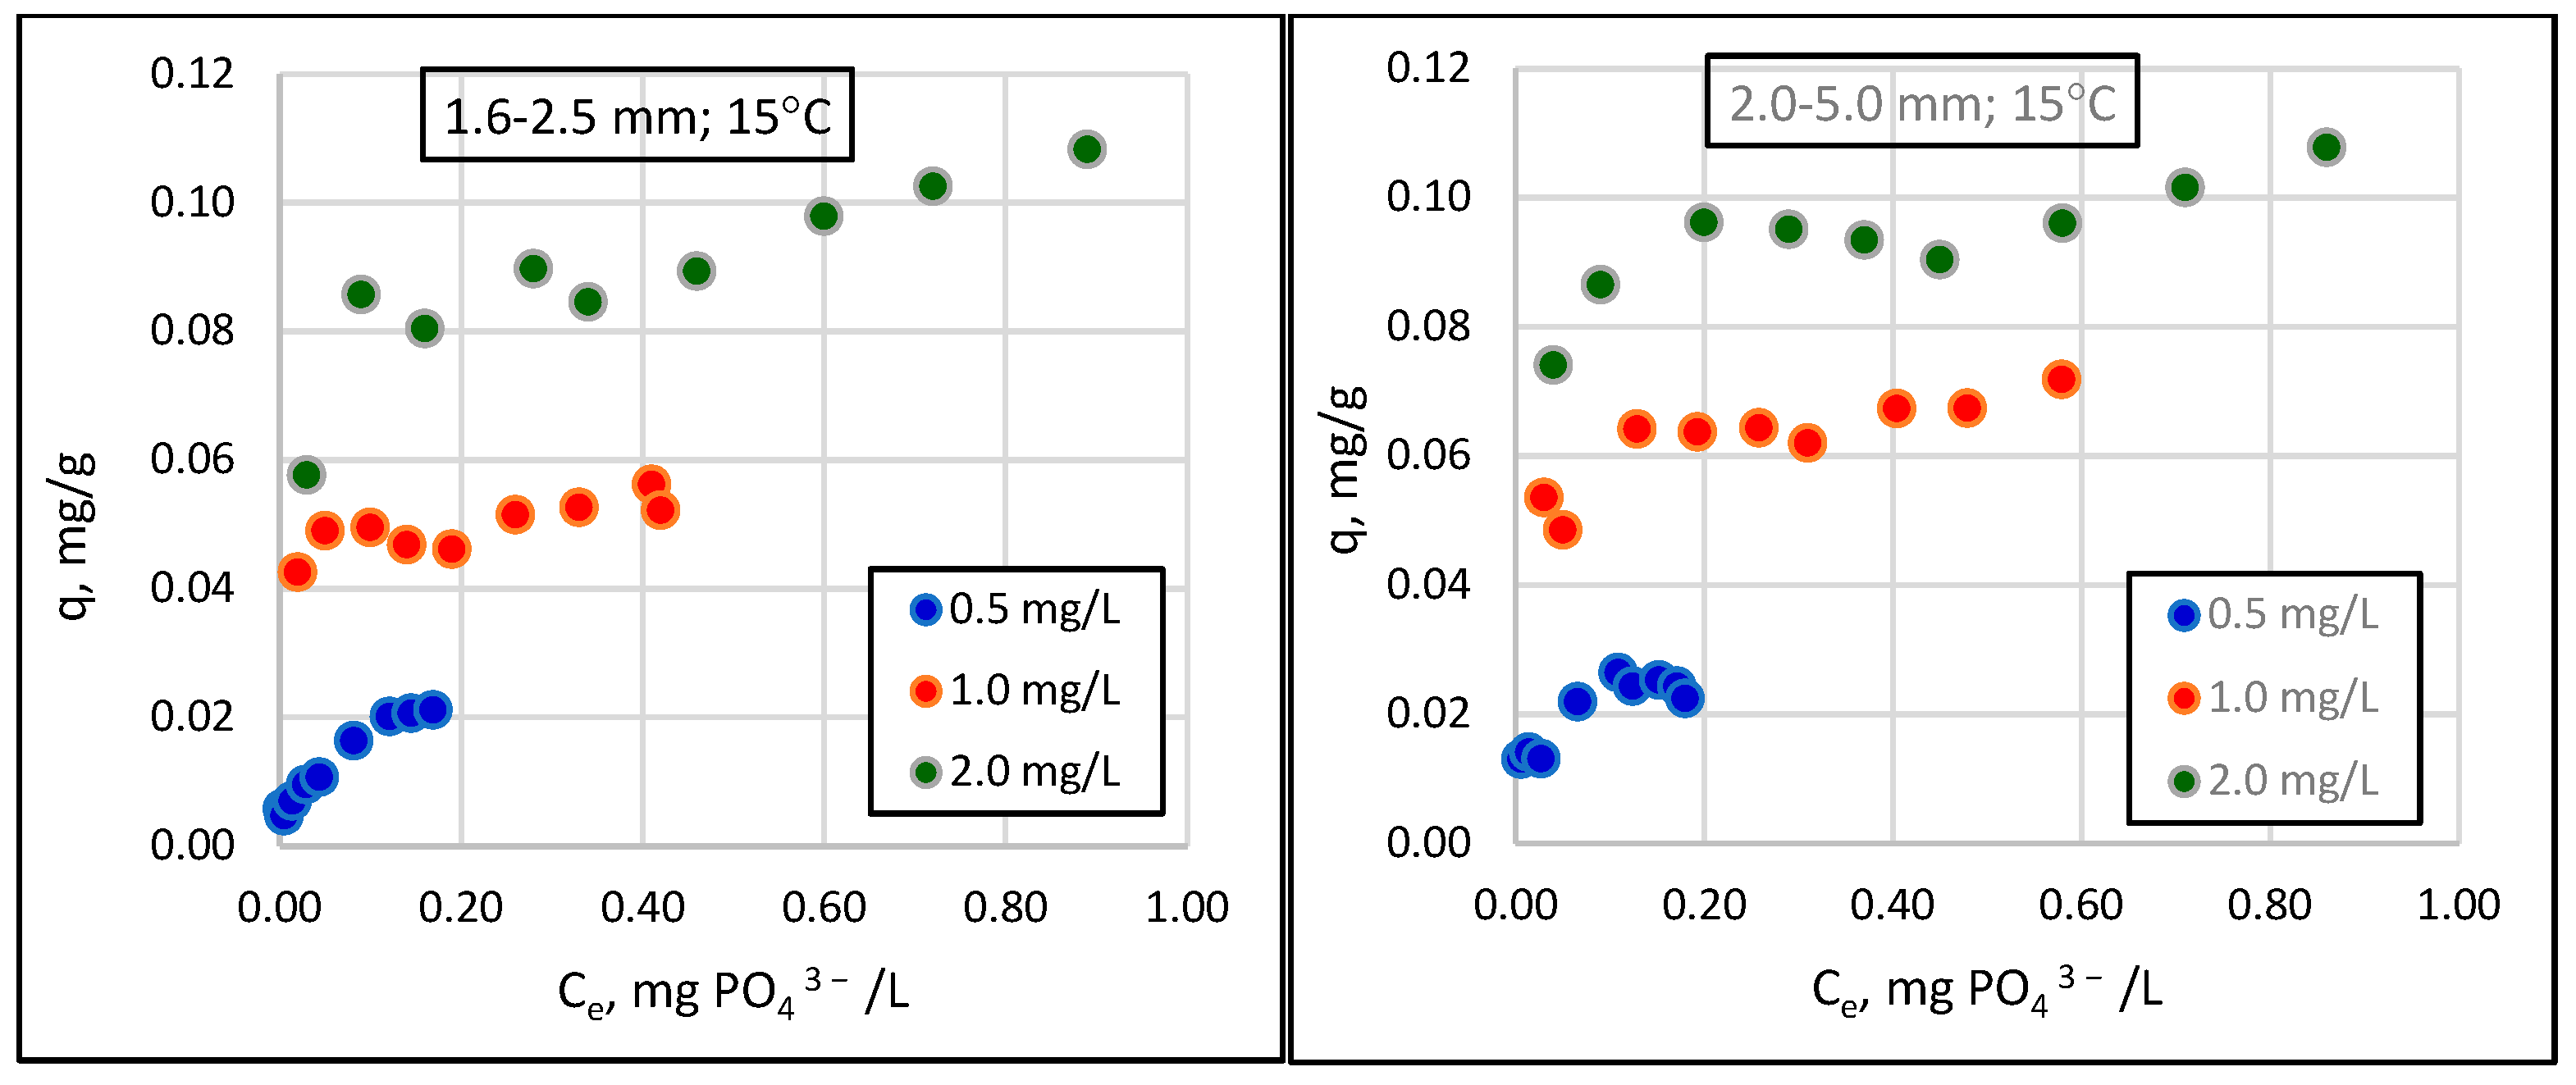
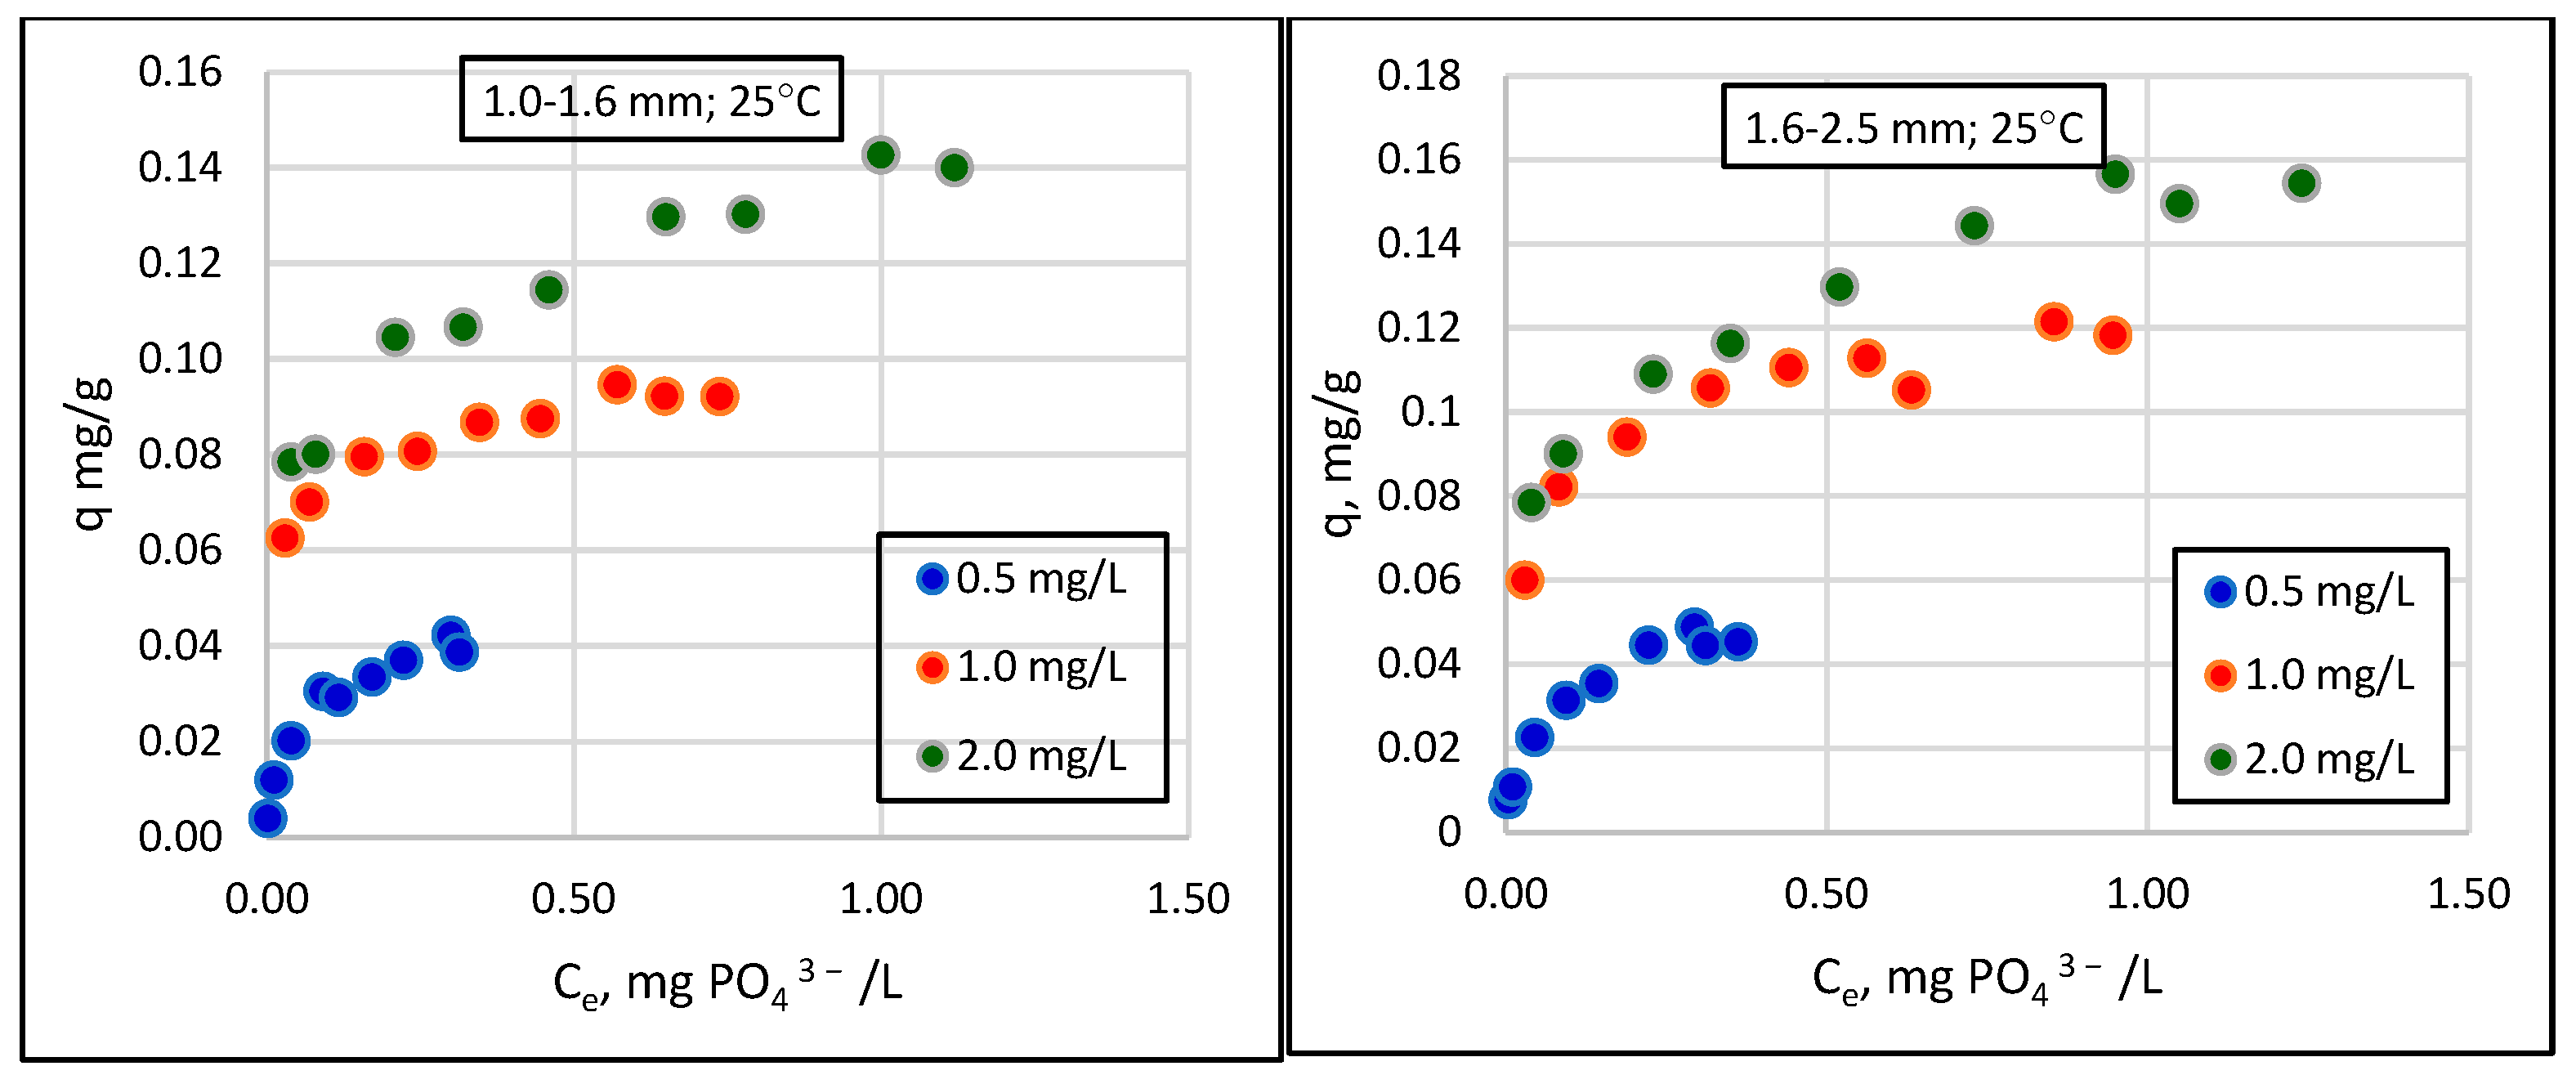
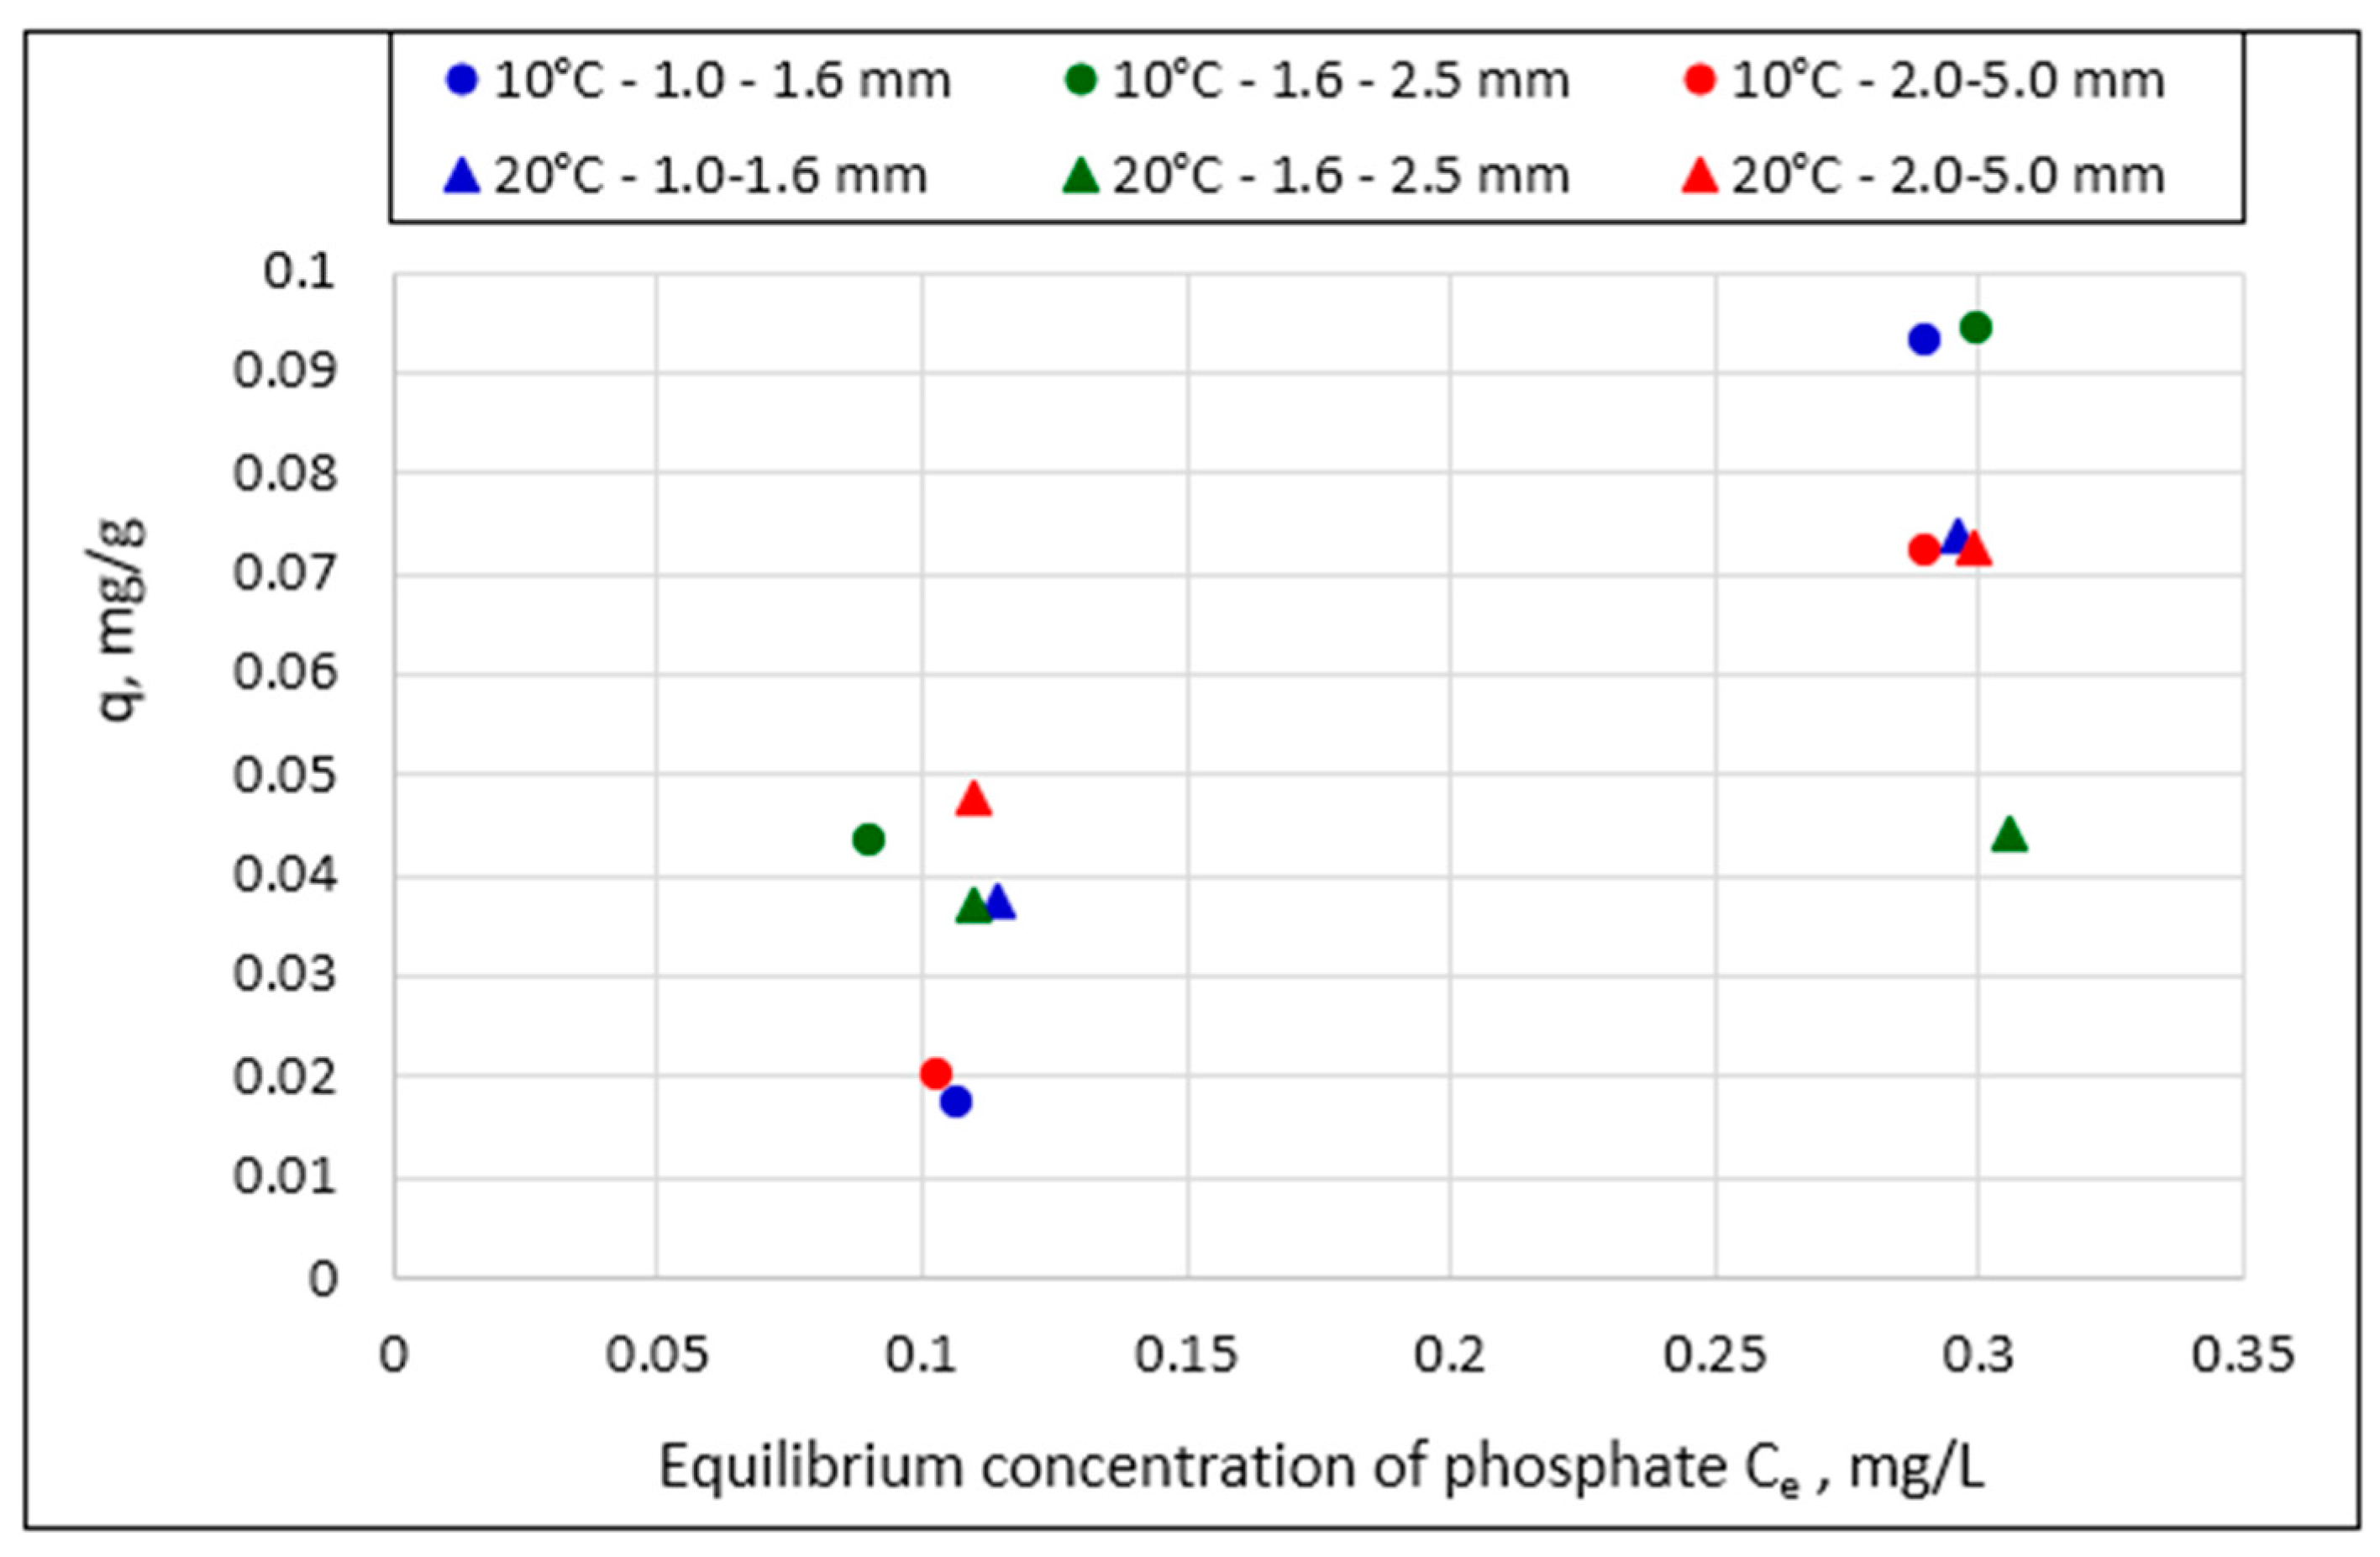
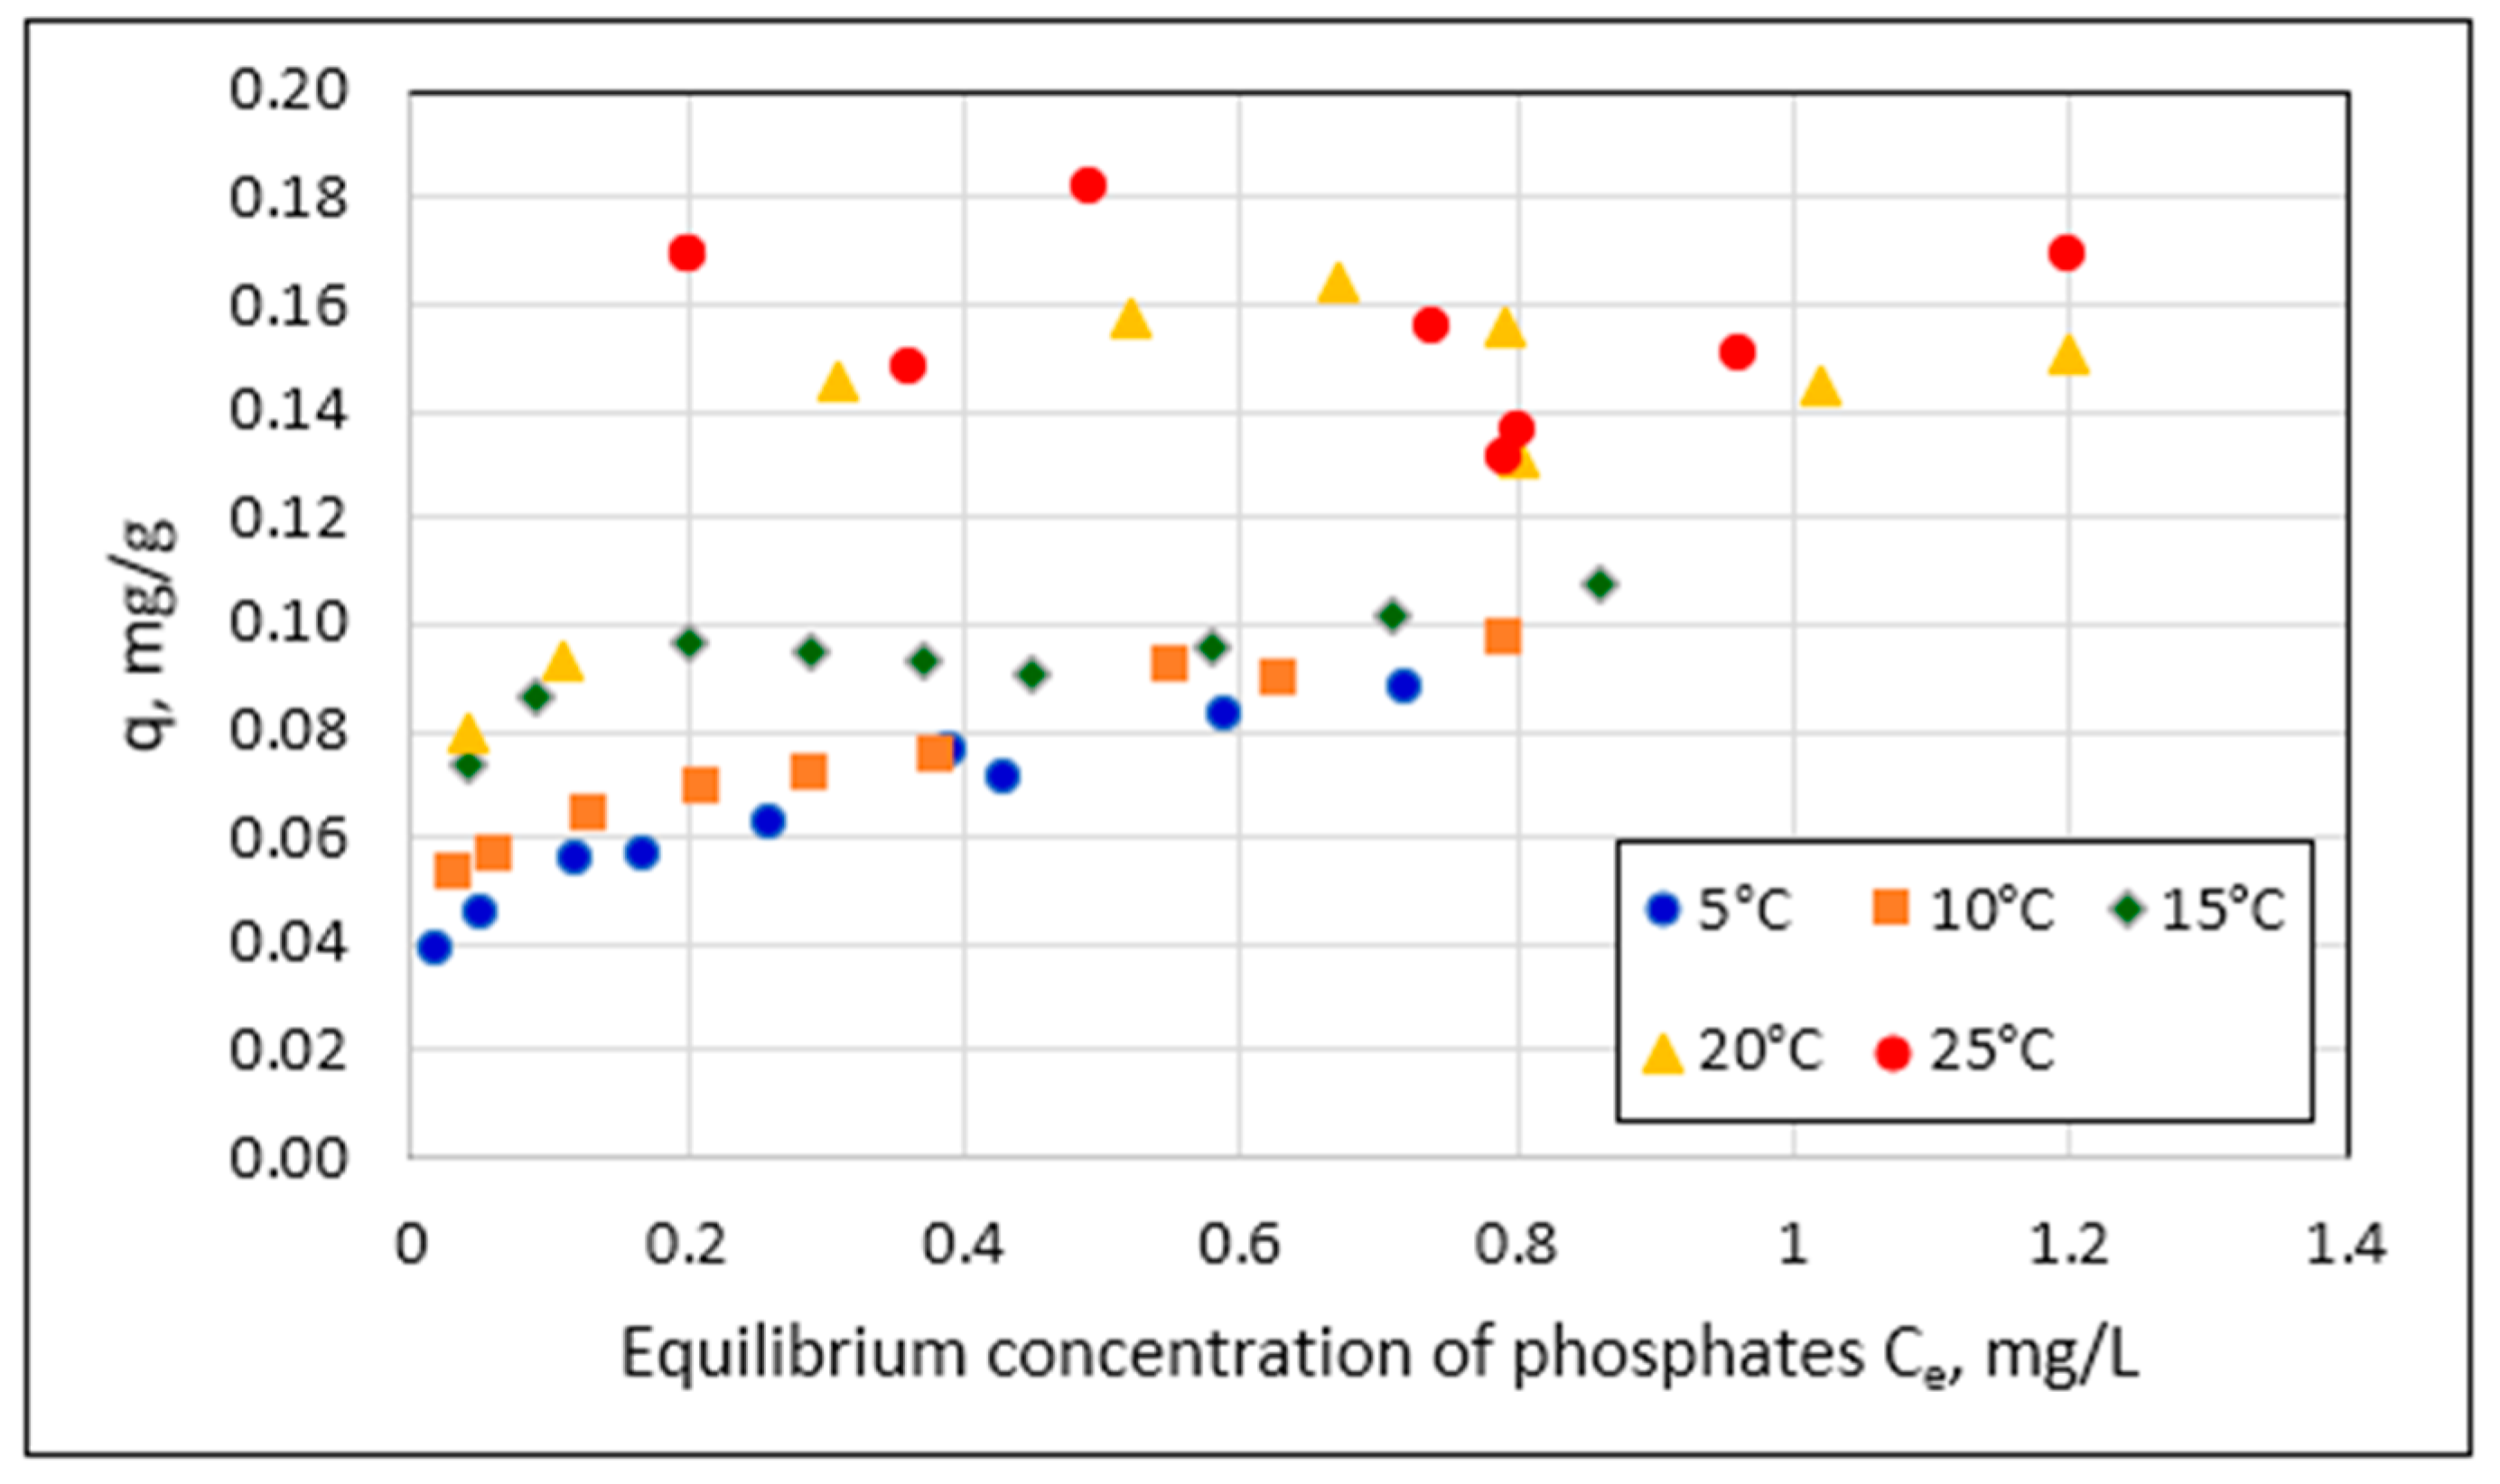
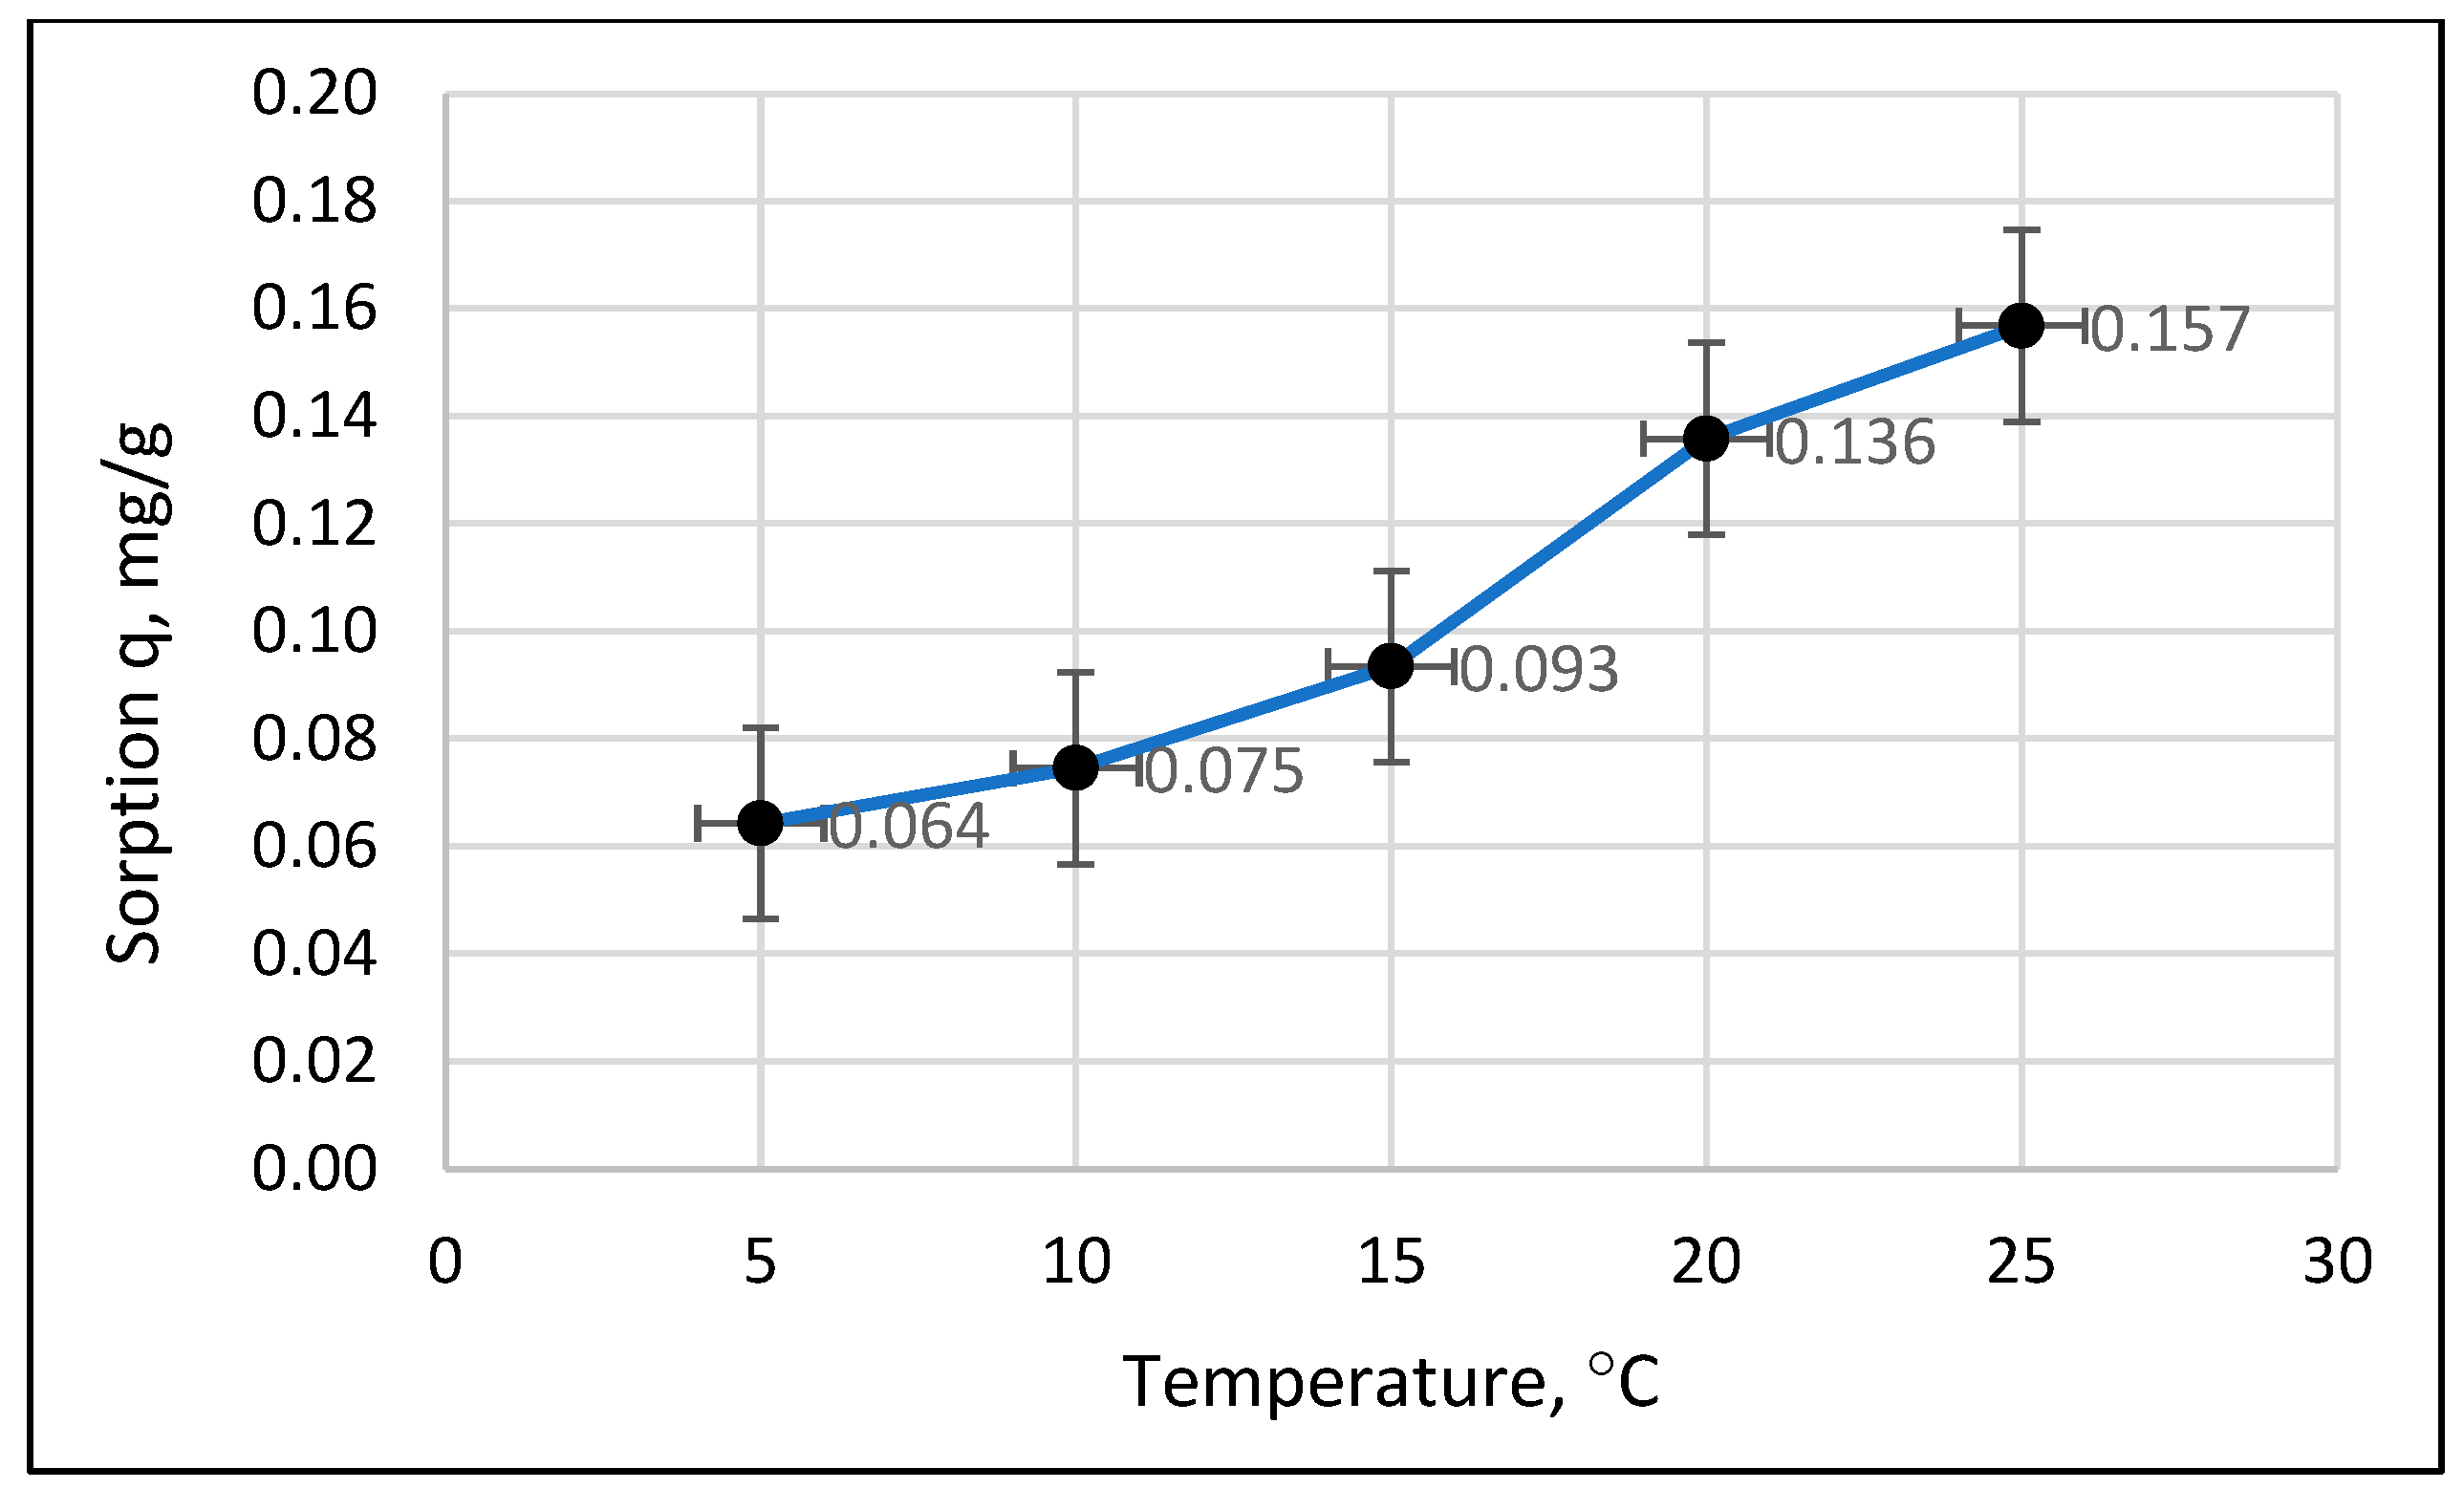
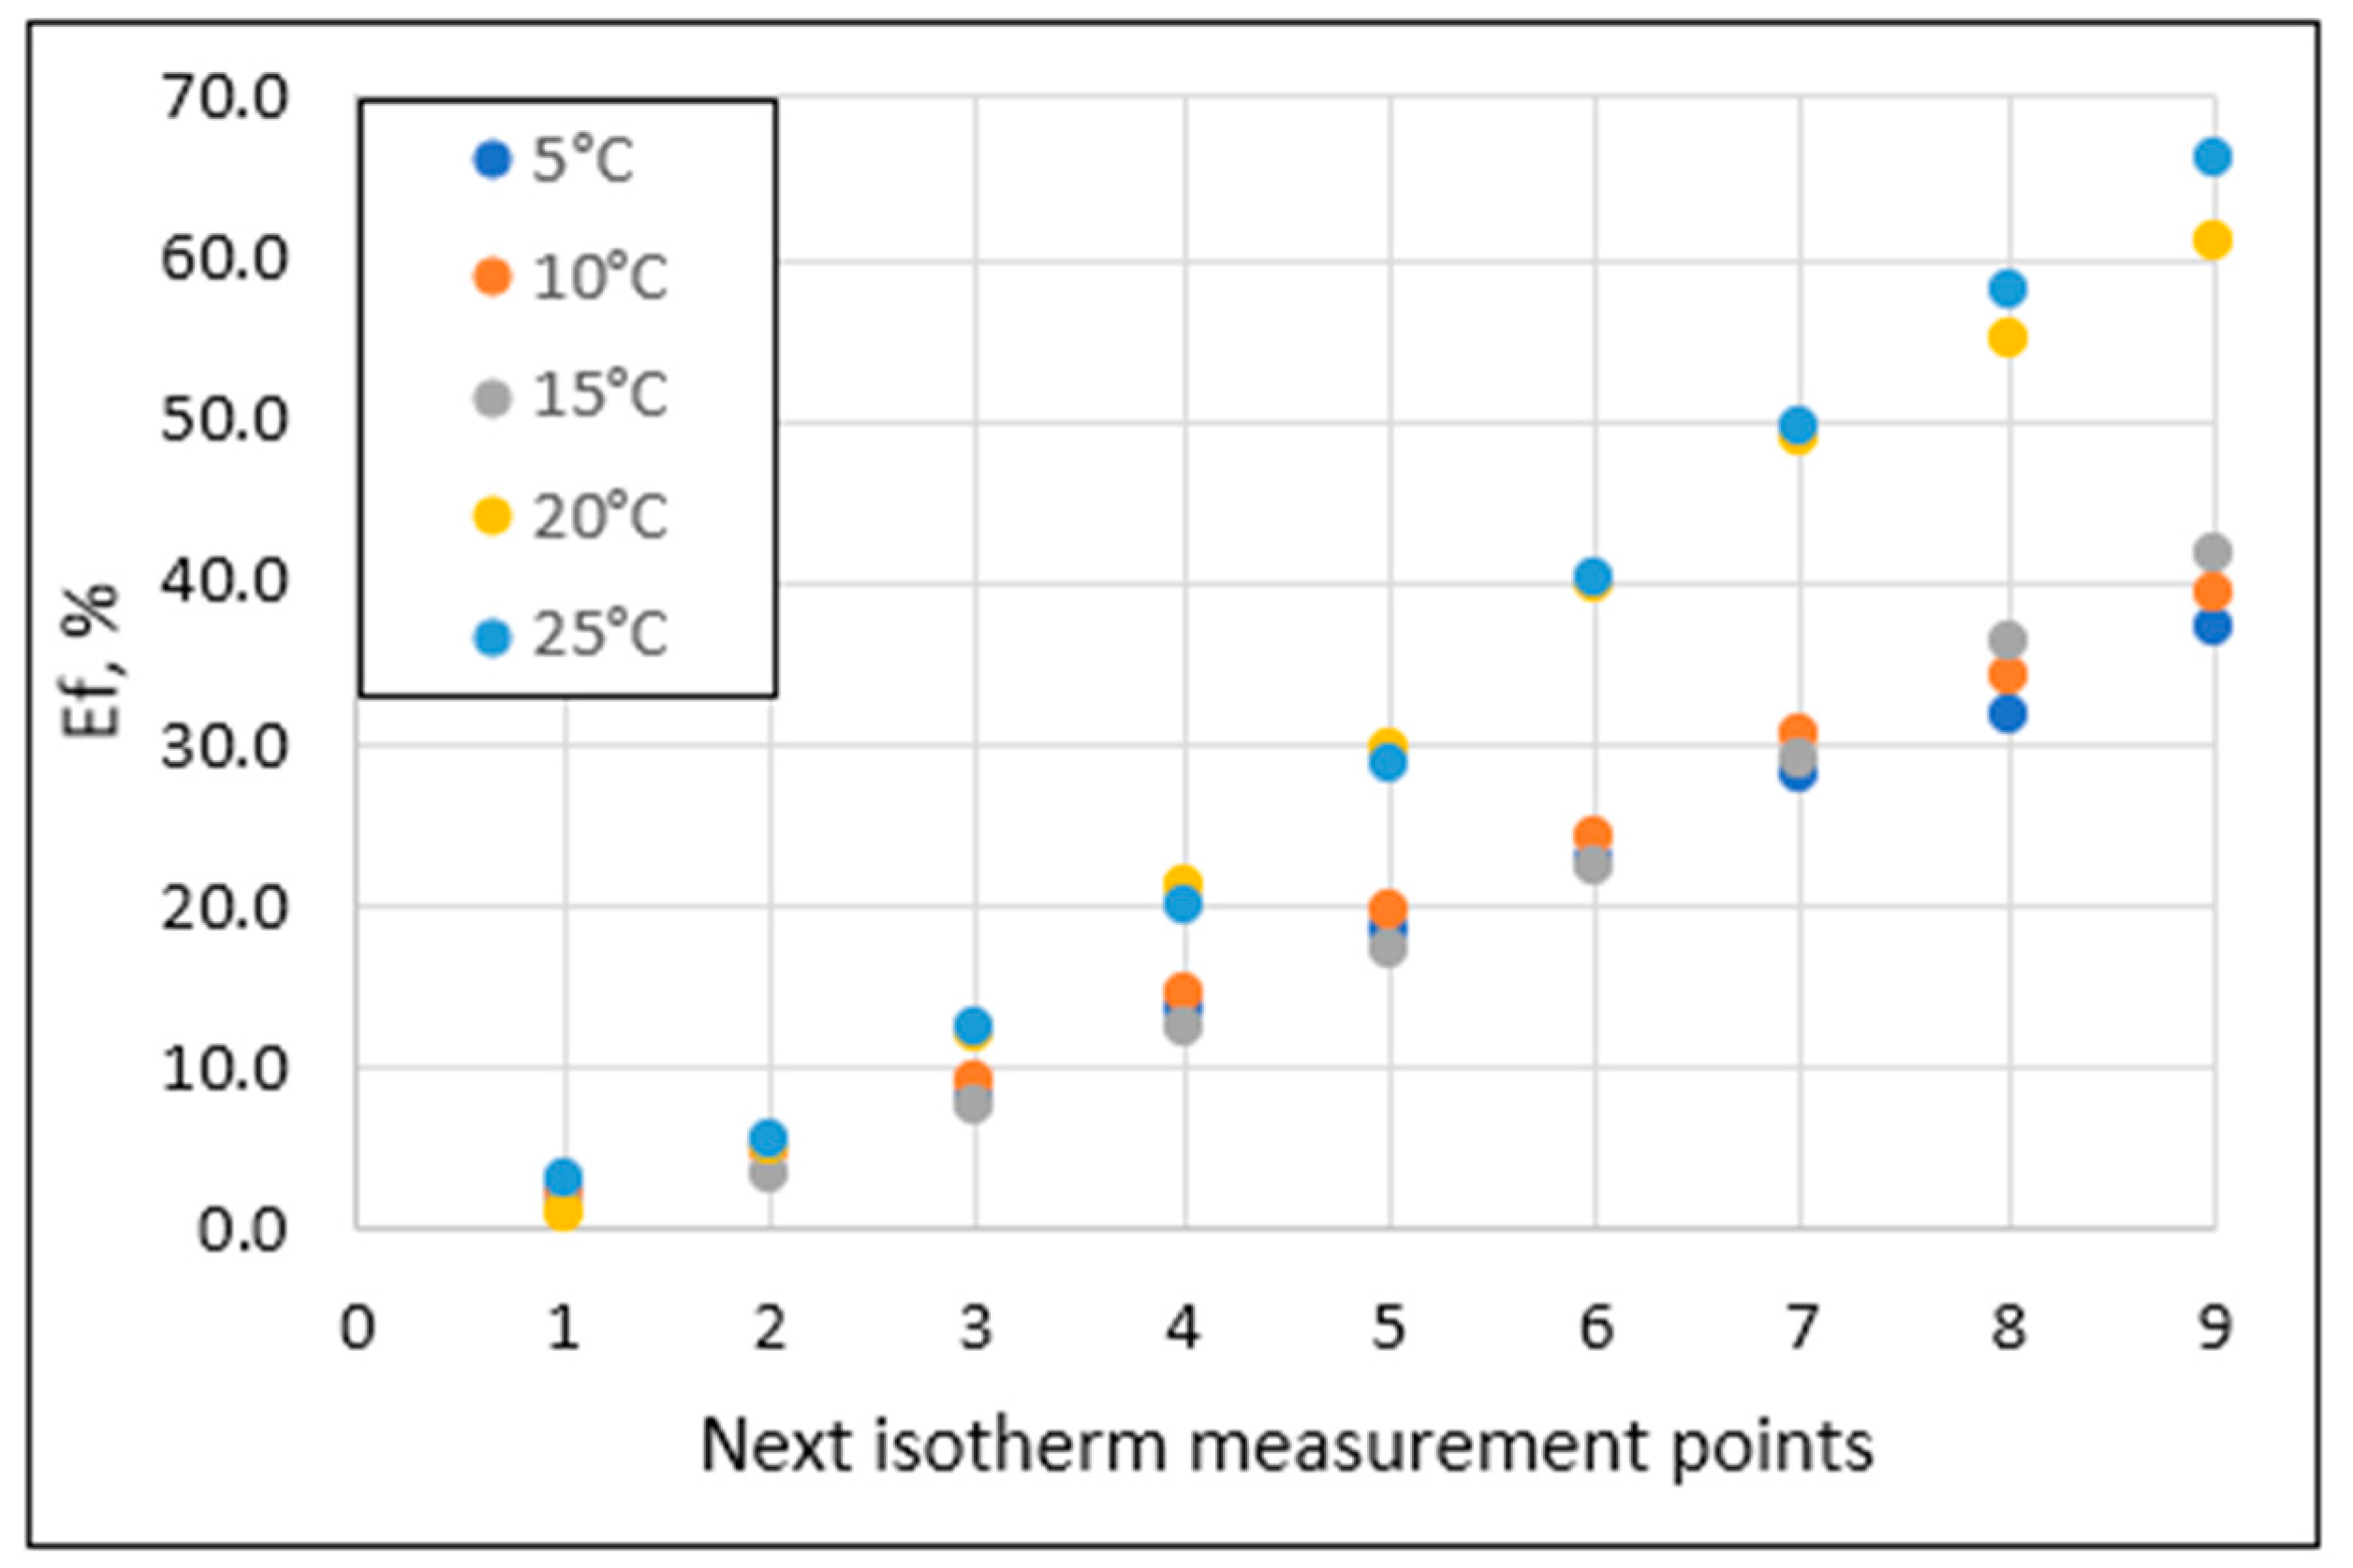
  • The relationship between the amount of phosphate sorption and the granularity of the material analyzed was not demonstrated. The mass of adsorbed phosphates and the efficiency of their removal from the solution increased with the increase in the initial concentration of phosphates in the solution. The effect of temperature on phosphate removal efficiency was statistically significant.
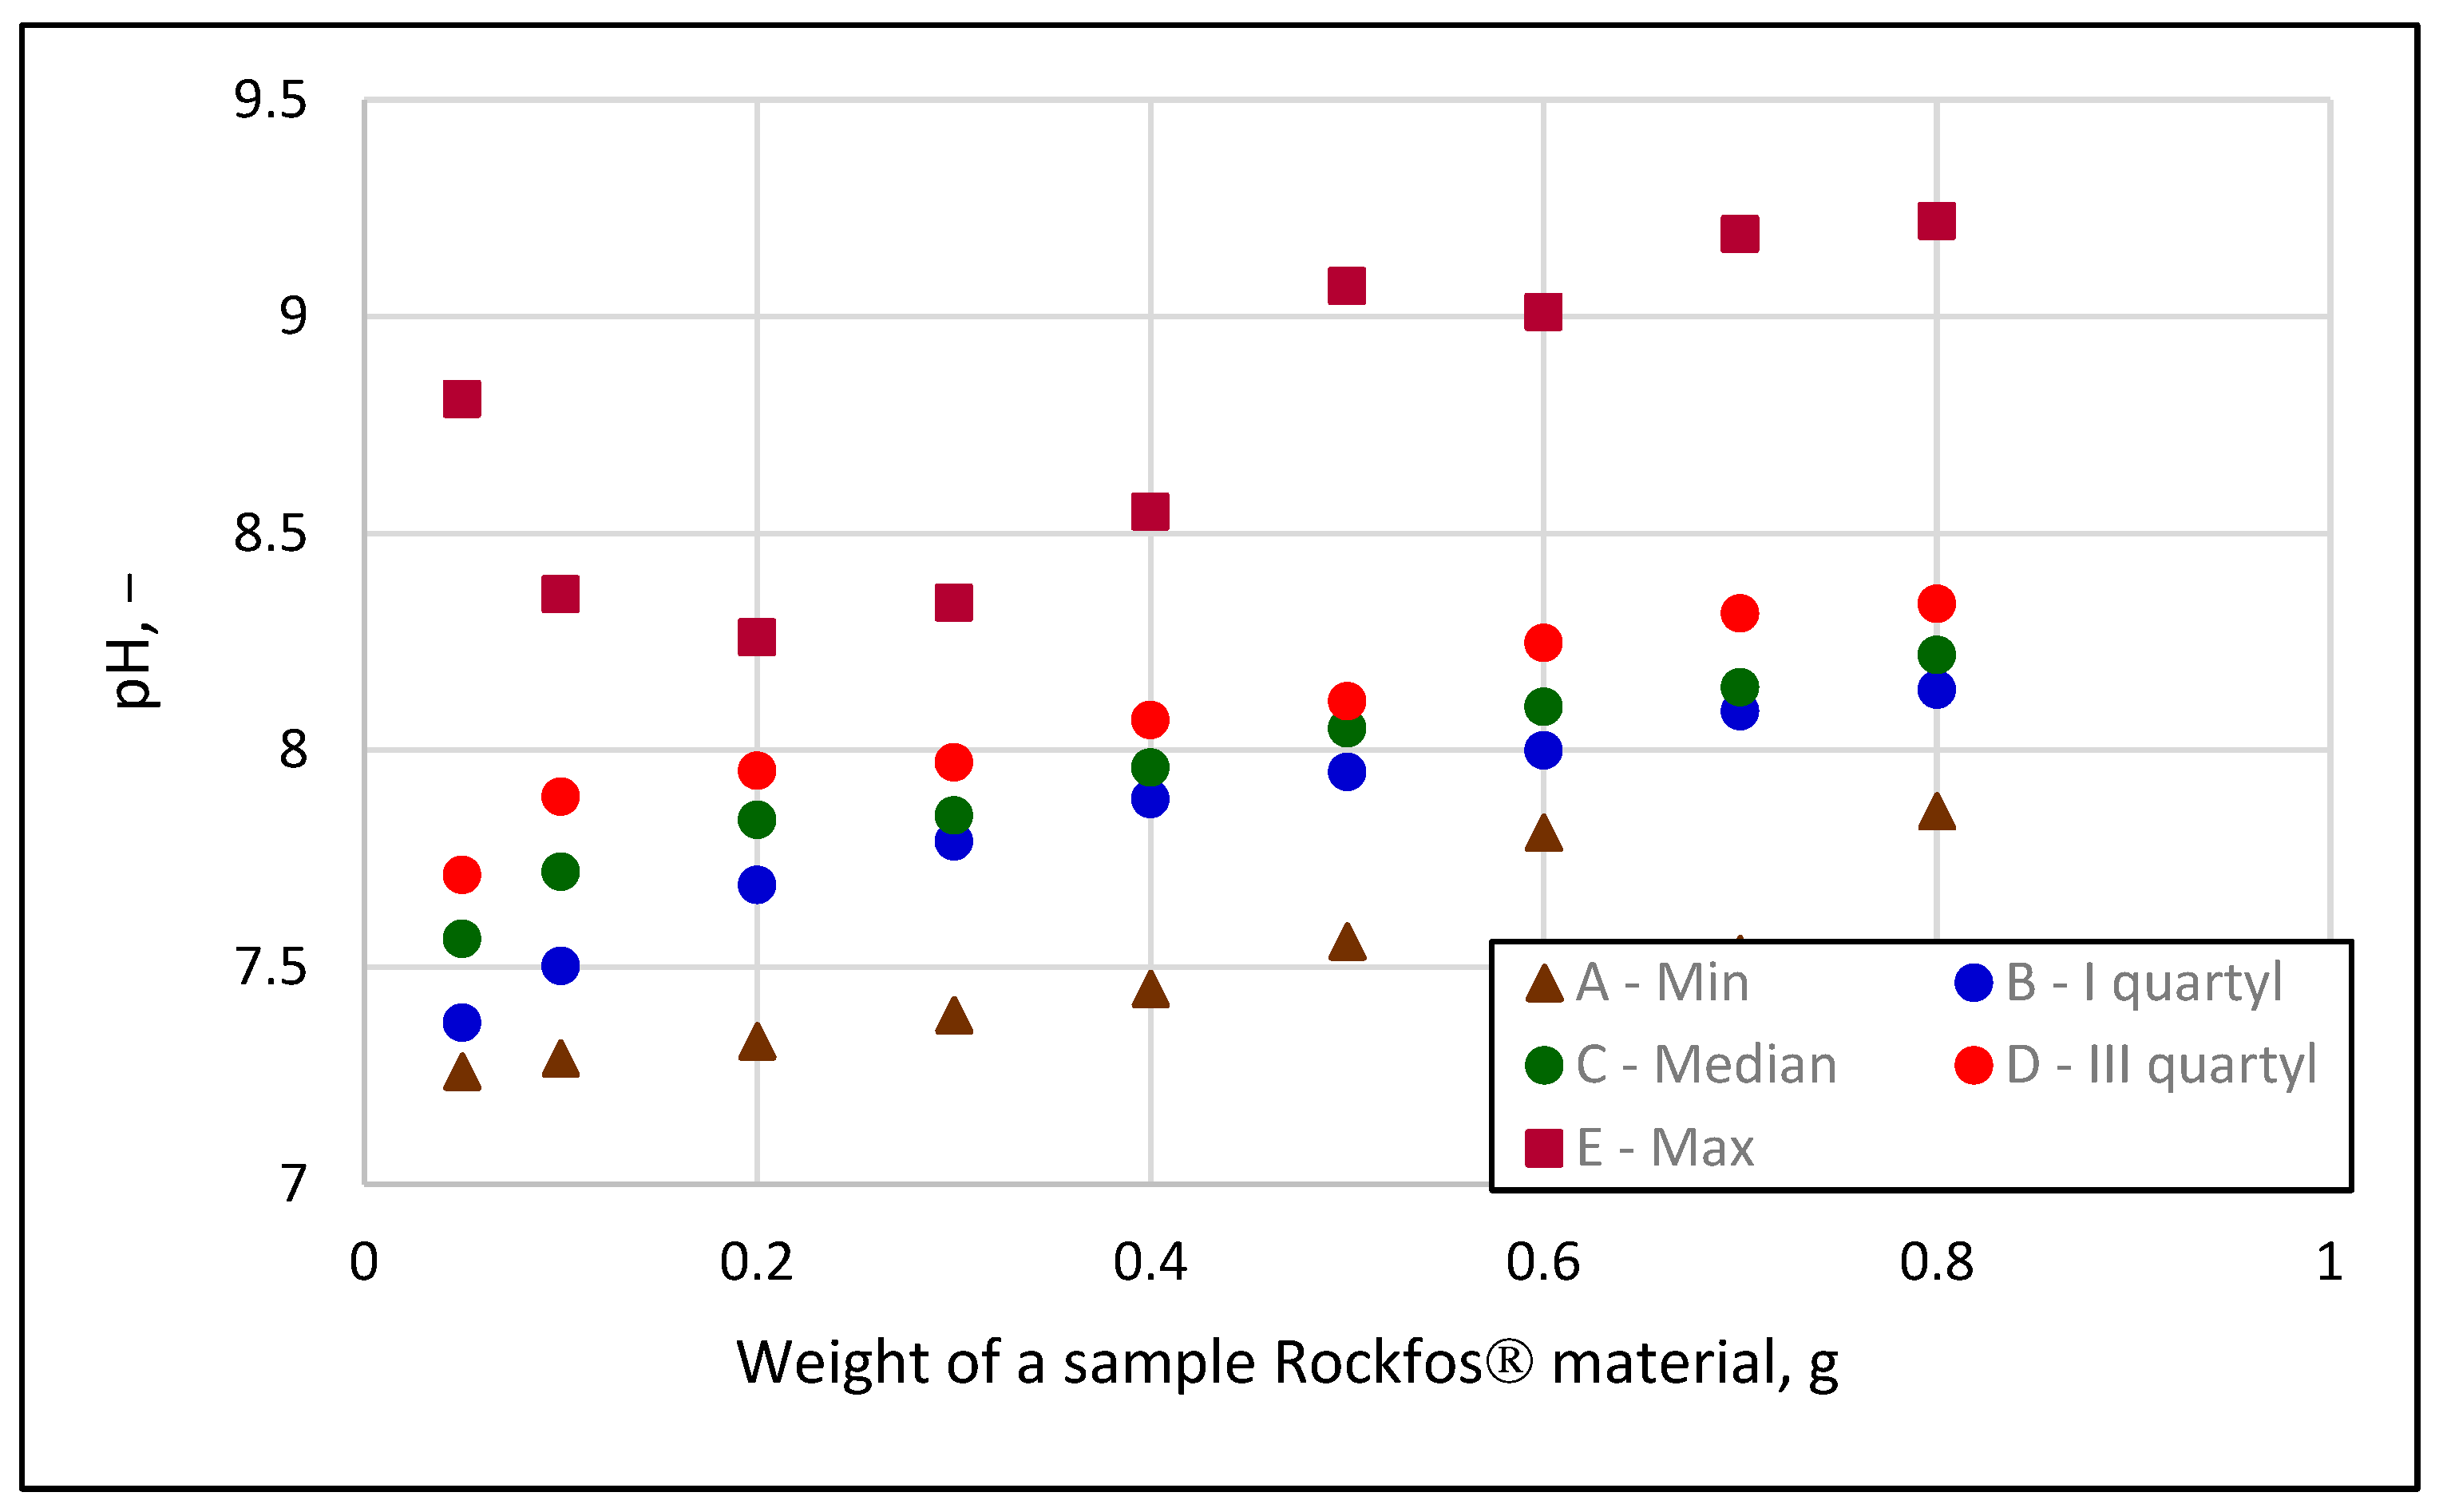
  • The near-zero values of the separation coefficient RL prove that the sorption of phosphates on Rockfos® material is irreversible (chemisorption). That is, phosphates react with the active parts of the material. This conclusion was confirmed by qualitative changes in the solution, including increasing pH, hardness, and calcium concentrations with increasing sorbent weight. The pH can even exceed 10 at large weightings, and at that point, phosphate removal relies more on precipitation than adsorption.
  • The tested material can be used in practice in wastewater treatment, and maximum sorption capacities of 0.6–0.8 mgPO43−/g of sorbent in the winter and 0.8–1.0 mgPO43−/g in the summer can be assumed for designing the mass and adequate time of filter beds.

Author Contributions

Conceptualization, B.Z. and T.S.; methodology, B.Z. and T.S.; validation, T.S., M.M., K.J., and L.R.; formal analysis, K.J.; investigation, B.Z., T.S., M.M., and L.R.; data curation, B.Z., T.S., and L.R.; writing—original draft, B.Z., T.S. and M.M.; visualization, B.Z., T.S., M.M., and K.J.; supervision, T.S. and K.J.; project administration, T.S. All authors have read and agreed to the published version of the manuscript.

Funding

This paper was written within the framework of a Ph.D. thesis prepared by Beata Zawadzka from the project no DWD/5/0332/2021 financed by the Ministry of Education and Science (Poland) titled “Development of guidelines for design and operation and implementation of a chemisorption modular phosphorus removal system in a selected wastewater treatment plant”.

Institutional Review Board Statement

Not applicable.

Informed Consent Statement

Not applicable.

Data Availability Statement

Data are contained within the article.

Acknowledgments

We acknowledge Alina Kiedryńska for her help in editing the English version of this article.

Conflicts of Interest

Author Beata Zawadzka was employed by the company Mirosław Zalewski MONT-SAN. The remaining authors declare that the research was conducted in the absence of any commercial or financial relationships that could be construed as a potential conflict of interest.

References

  1. Feng, W.; Wang, T.; Zhu, Y.; Sun, F.; Giesy, J.P.; Wu, F. Chemical composition, sources, and ecological effect of organic phosphorus in water ecosystems: A review. Carbon Res. 2023, 2, 12. [Google Scholar] [CrossRef]
  2. Zahed, M.A.; Salehi, S.; Tabari, Y.; Farraji, H.; Ataei-Kachooei, S.; Zinatizadeh, A.A.; Kamali, N.; Mahjouri, M. Phosphorus removal and recovery: State of the science and challenges. Environ. Sci. Pollut. Res. 2022, 29, 58561–58589. [Google Scholar] [CrossRef] [PubMed]
  3. Feng, W.; Yang, F.; Zhang, C.; Liu, J.; Song, F.; Chen, H.; Zhu, Y.; Liu, S.; Giesy, J.P. Composition characterization and biotransformation of dissolved, particulate and algae organic phosphorus in eutrophic lakes. Environ. Pollut. 2020, 265 Pt B, 114838. [Google Scholar] [CrossRef]
  4. Online Legal Acts System Home Page. Available online: https://isap.sejm.gov.pl/isap.nsf/download.xsp/WDU20190001311/O/D20191311.pdf (accessed on 24 August 2024). (In Polish)
  5. Przywara, L. Warunki i Możliwości Usuwania Fosforanów i Fosforu Ogólnego ze Ścieków Przemysłowych. Ph.D. Thesis, Politechnika Krakowska, Kraków, Poland, 2006. [Google Scholar]
  6. Cordell, D.; White, S. Life’s bottleneck: Sustaining the world’s phosphorus for a food secure future. Annu. Rev. Environ. Resour. 2014, 39, 161–188. [Google Scholar] [CrossRef]
  7. Adelagun, R.O.A. Technological options for phosphate removal and recovery from aqua system: A review. Chem. Sci. Rev. Lett. 2016, 5, 19–34. [Google Scholar]
  8. Kasprzyk, M.; Gajewska, M. Phosphorus removal by application of natural and semi-natural materials for possible recovery according to assumptions of circular economy and closed circuit of P. Sci. Total Environ. 2019, 650, 249–256. [Google Scholar] [CrossRef]
  9. Chu, W.; Shi, Y.; Zhang, L. Recovery of phosphorus in wastewater in the form of polyphosphates: A review. Processes 2022, 10, 144. [Google Scholar] [CrossRef]
  10. Jusino-Maldonado, M.; Rianço-Silva, R.; Mondal, J.A.; Pasek, M.; Laneuville, M.; Cleaves, H.J. A global network model of abiotic phosphorus cycling on Earth through time. Sci. Rep. 2022, 12, 9348. [Google Scholar] [CrossRef]
  11. Zawadzka, B.; Siwiec, T.; Marzec, M.; Jóźwiakowski, K.; Listosz, A. Meandering Flow Filter for Phosphorus Removal as a Component of Small Wastewater Treatment Plants—A Case Study. Water 2023, 15, 2703. [Google Scholar] [CrossRef]
  12. Cucarella, V.; Zaleski, T.; Mazurek, R. Phosphorus sorption capacity of different types of opoka. Ann. Wars. Univ. Life Sci.–SGGW. Land Reclam. 2007, 38, 11–18. [Google Scholar] [CrossRef]
  13. Vohla, C.; Kõiv, M.; Bavor, H.J.; Chazarenc, F.; Mander, Ü. Filter materials for phosphorus removal from wastewater in treatment wetlands—A review. Ecol. Eng. 2011, 37, 70–89. [Google Scholar] [CrossRef]
  14. Strawn, D.G. Sorption mechanisms of chemicals in soils. Soil Syst. 2021, 5, 13. [Google Scholar] [CrossRef]
  15. Bonilla-Petriciolet, A.; Mendoza-Castillo, D.I.; Reynel-Ávila, H.E. Adsorption Processes for Water Treatment and Purification; Springer: Berlin, Germany, 2017; Volume 256. [Google Scholar]
  16. Osman, A.I.; El-Monaem, E.M.A.; Elgarahy, A.M.; Aniagor, C.O.; Hosny, M.; Farghali, M.; Rashad, E.; Ejimofor, M.I.; López-Maldonado, E.A.; Ihara, I.; et al. Methods to prepare biosorbents and magnetic sorbents for water treatment: A review. Environ. Chem. Lett. 2023, 21, 2337–2398. [Google Scholar] [CrossRef]
  17. Tran, H.N. Adsorption Technology for Water and Wastewater Treatments. Water 2023, 15, 2857. [Google Scholar] [CrossRef]
  18. Agarwala, R.; Mulky, L. Adsorption of dyes from wastewater: A comprehensive review. ChemBioEng Rev. 2023, 10, 326–335. [Google Scholar] [CrossRef]
  19. Sukmana, H.; Bellahsen, N.; Pantoja, F.; Hodur, C. Adsorption and coagulation in wastewater treatment–Review. Prog. Agric. Eng. Sci. 2021, 17, 49–68. [Google Scholar] [CrossRef]
  20. Sales, F.R.P.; Serra, R.B.G.; de Figueirêdo, G.J.A.; da Hora, P.H.A.; de Sousa, A.C. Wastewater treatment using adsorption process in column for agricultural purposes. Rev. Ambiente Água 2019, 14, e2178. [Google Scholar] [CrossRef]
  21. Yousef, R.; Qiblawey, H.; El-Naas, M.H. Adsorption as a process for produced water treatment: A review. Processes 2020, 8, 1657. [Google Scholar] [CrossRef]
  22. Ho, Y.-S.; Chiu, W.-T.; Hsu, C.-S.; Huang, C.-T. Sorption of lead ions from aqueous solution using tree fern as a sorbent. Hydrometallurgy 2004, 73, 55–61. [Google Scholar] [CrossRef]
  23. Wang, L.; Zhang, J.; Zhao, R.; Li, Y.; Li, C.; Zhang, C. Adsorption of Pb (II) on activated carbon prepared from Polygonum orientale Linn.: Kinetics, isotherms, pH, and ionic strength studies. Bioresour. Technol. 2010, 101, 5808–5814. [Google Scholar] [CrossRef]
  24. Reczek, L.; Michel, M.M.; Siwiec, T.; Zukowska, E. Sorption of Pb (II) ions onto some filter materials used in water treatment technology. Przem. Chem. 2014, 93, 1978–1982. [Google Scholar]
  25. Soliman, A.M.; Elwy, H.M.; Thiemann, T.; Majedi, Y.; Labata, F.T.; Al-Rawashdeh, N.A. Removal of Pb (II) ions from aqueous solutions by sulphuric acid-treated palm tree leaves. J. Taiwan Inst. Chem. Eng. 2016, 58, 264–273. [Google Scholar] [CrossRef]
  26. Gupta, S.S.; Bhattacharyya, K.G. Adsorption of Ni (II) on clays. J. Colloid Interface Sci. 2006, 295, 21–32. [Google Scholar] [CrossRef] [PubMed]
  27. Ghodbane, I.; Nouri, L.; Hamdaoui, O.; Chiha, M. Kinetic and equilibrium study for the sorption of cadmium (II) ions from aqueous phase by eucalyptus bark. J. Hazard. Mater. 2008, 152, 148–158. [Google Scholar] [CrossRef] [PubMed]
  28. Kalam, S.; Abu-Khamsin, S.A.; Kamal, M.S.; Patil, S. Surfactant adsorption isotherms: A review. ACS Omega 2021, 6, 32342–32348. [Google Scholar] [CrossRef]
  29. Kasprzyk, M.; Węgler, J.; Gajewska, M. Analysis of efficiency of phosphates sorption by different granulation of selected reactive material. In E3S Web of Conferences; EDP Sciences: Les Ulis, France, 2018. [Google Scholar]
  30. Jamali, S.; Mofarahi, M.; Rodrigues, A.E. Investigation of a novel combination of adsorbents for hydrogen purification using Cu-BTC and conventional adsorbents in pressure swing adsorption. Adsorption 2018, 24, 481–498. [Google Scholar] [CrossRef]
  31. Elboughdiri, N.; Ferkous, H.; Rouibah, K.; Boublia, A.; Delimi, A.; Yadav, K.K.; Erto, A.; Ghernaout, D.; Salih, A.A.M.; Benaissa, M.; et al. Comprehensive investigation of Cu2+ adsorption from wastewater using olive-waste-derived adsorbents: Experimental and molecular insights. Int. J. Mol. Sci. 2024, 25, 1028. [Google Scholar] [CrossRef]
  32. Khamseh, A.A.G.; Ghorbanian, S.A.; Amini, Y.; Shadman, M.M. Investigation of kinetic, isotherm and adsorption efficacy of thorium by orange peel immobilized on calcium alginate. Sci. Rep. 2023, 13, 8393. [Google Scholar] [CrossRef]
  33. Okano, K.; Uemoto, M.; Kagami, J.; Miura, K.; Aketo, T.; Toda, M.; Honda, K.; Ohtake, H. Novel technique for phosphorus recovery from aqueous solutions using amorphous calcium silicate hydrates (A-CSHs). Water Res. 2013, 47, 2251–2259. [Google Scholar] [CrossRef]
  34. Zhang, Z.; Wang, X.; Zhao, J. Phosphate recovery from wastewater using calcium silicate hydrate (CSH): Sonochemical synthesis and properties. Environ. Sci. Water Res. Technol. 2019, 5, 131–139. [Google Scholar] [CrossRef]
  35. Bus, A.; Karczmarczyk, A. BazaAgro. Available online: https://agro.icm.edu.pl/agro/element/bwmeta1.element.agro-c4b86c9a-65d4-4c84-9aa2-0f1f14492abd/c/7.pdf (accessed on 24 August 2024). (In Polish).
  36. Kietlińska, A.; Renman, G. An evaluation of reactive filter media for treating landfill leachate. Chemosphere 2005, 61, 933–940. [Google Scholar] [CrossRef] [PubMed]
  37. Hylander, L.D.; Kietlińska, A.; Renman, G.; Simán, G. Phosphorus retention in filter materials for wastewater treatment and its subsequent suitability for plant production. Bioresour. Technol. 2006, 97, 914–921. [Google Scholar] [CrossRef]
  38. Available online: http://www.ceramika-kufel.pl/rockfos/ (accessed on 24 August 2024).
  39. Jóźwiakowski, K.; Bugajski, P.; Kurek, K.; Cáceres, R.; Siwiec, T.; Jucherski, A.; Czekała, W.; Kozłowski, K. Technological reliability of pollutant removal in different seasons in one-stage constructed wetland system with horizontal flow operating in the moderate climate. Sep. Purif. Technol. 2020, 238, 116439. [Google Scholar] [CrossRef]
  40. Karczmarczyk, A.; Renman, G. Phosphorus accumulation pattern in a subsurface constructed wetland treating residential wastewater. Water 2011, 3, 146–156. [Google Scholar] [CrossRef]
  41. Jóźwiakowski, K.; Bugajski, P.; Kurek, K.; Carvalho, M.d.F.N.d.; Almeida, M.A.A.; Siwiec, T.; Borowski, G.; Czekała, W.; Dach, J.; Gajewska, M. The efficiency and technological reliability of biogenic compounds removal during long-term operation of a one-stage subsurface horizontal flow constructed wetland. Sep. Purif. Technol. 2018, 202, 216–226. [Google Scholar] [CrossRef]
  42. Jóźwiakowski, K.; Gajewska, M.; Pytka, A.; Marzec, M.; Gizińska-Górna, M.; Jucherski, A.; Walczowski, A.; Nastawny, M.; Kamińska, A.; Baran, S. Influence of the particle size of carbonate-siliceous rock on the efficiency of phosphorous removal from domestic wastewater. Ecol. Eng. 2017, 98, 290–296. [Google Scholar] [CrossRef]
  43. Jucherski, A.; Walczowski, A.; Bugajski, P.; Jóźwiakowski, K.; Rodziewicz, J.; Janczukowicz, W.; Wu, S.; Kasprzyk, M.; Gajewska, M.; Mielcarek, A. Long-term operating conditions for different sorption materials to capture phosphate from domestic wastewater. Sustain. Mater. Technol. 2022, 31, e00385. [Google Scholar] [CrossRef]
  44. Pytka-Woszczyło, A.; Różańska-Boczula, M.; Gizińska-Górna, M.; Marzec, M.; Listosz, A.; Jóźwiakowski, K. Efficiency of filters filled with rockfos for phosphorus removal from domestic sewage. Adv. Sci. Technol. Res. J. 2022, 16, 176–188. [Google Scholar] [CrossRef]
  45. Cucarella, V.; Renman, G. Phosphorus sorption capacity of filter materials used for on-site wastewater treatment determined in batch experiments–a comparative study. J. Environ. Qual. 2009, 38, 381–392. [Google Scholar] [CrossRef]
  46. Li, X.; Liang, H.; Mo, Y.; Wei, Y. Preparation and phosphorus removal performance of Zr–La–Fe ternary composite adsorbent embedded with sodium alginate. Processes 2022, 10, 1761. [Google Scholar] [CrossRef]
  47. Foo, K.Y.; Hameed, B.H. Insights into the modeling of adsorption isotherm systems. Chem. Eng. J. 2010, 156, 2–10. [Google Scholar] [CrossRef]
  48. Kasprzyk, M. Treatment Wetland effluent quality improvement by usage sorbents of various origin. In E3S Web of Conferences; EDP Sciences: Les Ulis, France, 2019. [Google Scholar]
  49. Tran, H.N.; You, S.-J.; Chao, H.-P. Thermodynamic parameters of cadmium adsorption onto orange peel calculated from various methods: A comparison study. J. Environ. Chem. Eng. 2016, 4, 2671–2682. [Google Scholar] [CrossRef]
  50. PN-EN ISO 6878; Water Quality—Determination of Phosphorus—Spectrometric Method with Ammonium Molybdate. Polish Committee for Standardization: Warszawa, Poland, 2006.
  51. PN-EN ISO 10523; Water Quality—Determination of pH. Polish Committee for Standardization: Warszawa, Poland, 2012.
  52. Ayawei, N.; Ebelegi, A.; Donbebe, W. Modelling and Interpretation of Adsorption Isotherms. Hindawi J. Chem. 2017, 2017, 3039817. [Google Scholar] [CrossRef]
  53. Saoudi Hassani, E.M.; Azzouni, D.; Alanazi, M.M.; Mehdaoui, I.; Mahmoud, R.; Kabra, A.; Taleb, A.; Taleb, M.; Rais, Z. Innovative plant-derived biomaterials for sustainable and effective removal of Cationic and Anionic dyes: Kinetic and thermodynamic study. Processes 2024, 12, 922. [Google Scholar] [CrossRef]
  54. Chutkowski, M.; Petrus, R.; Warchol, J.; Koszelnik, P. Sorption equilibrium in processes of metal ion removal from environment. Statistical verification of mathematical models. Przem. Chem. 2008, 87, 436–438. [Google Scholar]
  55. Müller, M. Generalized Linear Models. In Handbook of Computational Statistics: Concepts and Methods; Springer: Berlin/Heidelberg, Germany, 2004. [Google Scholar]
  56. Karaca, S.; Gurses, A.; Ejder, M.; Acikyildiz, M. Kinetic modeling of liquid-phase adsorption of phosphate on dolomite. J. Colloid Interface Sci. 2004, 277, 257–263. [Google Scholar] [CrossRef] [PubMed]
  57. Ayoub, G.M.; Kalinian, H. Removal of low-concentration phosphorus using a fluidized raw dolomite bed. Water Environ. Res. 2006, 78, 353–361. [Google Scholar] [CrossRef]
  58. Kpannieu, D.E.; Ruby, C.; Coulibaly, L.; Abdelmoula, M.; Mallet, M. Removal of phosphate by ivory coast shale in a homogeneous reactor and under hydrodynamic conditions: Influence of soluble species. Clays Clay Miner. 2018, 66, 500–514. [Google Scholar] [CrossRef]
  59. Cyrus, J.S.; Reddy, G.B. Sorption and Desorption of Nitrogen and Phosphorus by Zeolite and Shale. In Proceedings of the 2007 National Conference on Environmental Science and Technology; Nzewi, E., Reddy, G., Luster-Teasley, S., Kabadi, V., Chang, S.-Y., Uzochukwu, G., Eds.; Springer Science+Buisness Media, LLC: New York, NY, USA, 2009; pp. 353–364. [Google Scholar]
  60. Cyrus, J.S.; Reddy, G.B. Sorption and desorption of phosphorus by shale: Batch and column studies. Water Sci. Technol. 2010, 61, 599–606. [Google Scholar] [CrossRef]
  61. Brogowski, Z.; Renman, G. Characterization of opoka as a basis for its use in wastewater treatment. Pol. J. Environ. Stud. 2004, 13, 15–20. [Google Scholar]
  62. Lomovskiy, I.; Kiryanov, A.; Skripkina, T. The Effect of Reverse Sorption on an Extraction Kinetics Melanin Case. Processes 2023, 11, 3192. [Google Scholar] [CrossRef]
  63. Cao, S.; Yin, W.; Yang, B.; Zhu, Z.; Sun, H.; Sheng, Q.; Chen, K. Insights into the influence of temperature on the adsorption behavior of sodium oleate and its response to flotation of quartz. Int. J. Min. Sci. Technol. 2022, 32, 399–409. [Google Scholar] [CrossRef]
  64. Marecka, A. Influence of Temperature on Sorption of Carbon Dioxide in Coals. Inżynieria Miner. 2014, 15, 143–148. [Google Scholar]
  65. Zhang, L.; Aziz, N.; Ren, T.X.; Wang, Z. Influence of temperature on coal sorption characteristics and the theory of coal surface free energy. Procedia Eng. 2011, 26, 1430–1439. [Google Scholar] [CrossRef]
  66. Chen, D.; Zheng, W.; Wang, T.; Liu, F.; Cheng, T.; Chen, H.; Miao, T. Influence of temperature on the adsorption and diffusion of heavy oil in quartz nanopore: A molecular dynamics study. Energies 2022, 15, 5870. [Google Scholar] [CrossRef]
  67. Kasprzyk, M.; Czerwionka, K.; Gajewska, M. Waste materials assessment for phosphorus adsorption toward sustainable application in circular economy. Resour. Conserv. Recycl. 2021, 168, 105335. [Google Scholar] [CrossRef]
  68. Rayshouni, H.; Wazne, M. Effects of Calcium on the Removal of Ammonium from Aged Landfill Leachate by Struvite Precipitation. Water 2022, 14, 1933. [Google Scholar] [CrossRef]
  69. Soares, A.; Czajkowska, J.; Colprim, J.; Gali, A.; Johansson, S.; Masic, A.; March, A.; McMeod, A.; Nenov, V. Nutrients Recovery from Wastewater Streams; IWA Publishing: London, UK, 2017; Volume 2017. [Google Scholar]
  70. Westholm, L.J. The use of blast furnace slag for removal of phosphorus from wastewater in Sweden—A review. Water 2010, 2, 826–837. [Google Scholar] [CrossRef]
  71. Ehiomogue, P.; Ahuchaogu, I.I.; Ahaneku, I.E. REVIEW OF ADSORPTION ISOTHERMS MODELS. Acta Tech. Corviniensis-Bull. Eng. 2021, 14.4. [Google Scholar]
Figure 1. Changes in sorption (q) as a function of the equilibrium concentration of phosphate in solution (Ce) for different granulations of Rockfos® material at 5 °C.
Applsci 14 10996 g001
Figure 2. Changes in sorption (q) as a function of the equilibrium concentration of phosphate in solution (Ce) for different granulations of Rockfos® material at 15 °C.
Applsci 14 10996 g002
Figure 3. Changes in sorption (q) as a function of the equilibrium concentration of phosphate in solution (Ce) for different granulations of Rockfos® material at 25 °C.
Applsci 14 10996 g003
Figure 4. Weight of phosphate (q) retained by Rockfos® material at different grain sizes at temperatures of 10 °C and 20 °C.
Applsci 14 10996 g004
Figure 5. Mass of adsorbed phosphate (q) on grains of 2.0–5.0 mm granulation at different process temperatures and phosphate concentration in the starting solution of 2 mg/L.
Applsci 14 10996 g005
Figure 6. Sample results of GLM modeling of the effect of temperature on sorption.
Applsci 14 10996 g006
Figure 7. Phosphate removal efficiency at different process running temperatures.
Applsci 14 10996 g007
Figure 8. Examples of pH changes as a function of the weight of Rockfos®; the series shows the following: A—minimum values, B—limits of 1 quadrillion, C—medians (limit of the second quadrillion, D—limits of 1 quadrillion, and E—maximum values.
Applsci 14 10996 g008
Figure 9. Maximum sorption capacity (qmax) as a function of temperature and adsorbent grain size for Langmuir LI and Lineweaver–Burke LII linearization (A) and Scatchard LIII and Eadie–Hofstee LIV (B).
Applsci 14 10996 g009
Figure 10. Examples of the fit of the measurement results with respect to the Langmuir model according to the analyzed linearizations at 15 °C for sorbent grains of 1.0–1.6 mm (A) and 2.0–5 mm (B).
Applsci 14 10996 g010
Figure 11. Examples of the thermodynamic relationships in the sorption process.
Applsci 14 10996 g011
Table 1. Langmuir sorption isotherm models in general and linear form.
Lp.General FormLinear FormReferences
1 q = q m a x · K L · C e 1 + K L · C e (3) [47,49]
2Linearization according to Langmuir C e q = 1 q m a x · K L + C e q m a x (4)[47,49]
3Linearization according to Lineweaver–Burke 1 q = 1 q m a x · K L · 1 C e + 1 q m a x (5)[47,49]
4Linearization according to Scatchard q C e = K L · q + q m a x · K L (6)[47,49]
5Linearization according to Eadie–Hofstee q = 1 K L · q C e + q m a x (7)[47,49]
Notation: qmax—maximum sorption capacity, given in mg/g; KL—Langmuir isotherm constant, given in L/mg.
Table 2. Parameters of adsorption Langmuir isotherms.
T, °C KL
[dm3 /g].
qmax
[mg/g].
RL
-
R2
-
KL
[dm3 /g].
qmax
[mg/g].
RL
-
R2
-
KL
[dm3 /g].
qmax
[mg/g].
RL
-
R2
-
C00.5 mg/dm21.0 mg/dm32.0 mg/dm3
LI—Langmuir isotherm in Langmuir linearization [49]
5 °C1.0 ÷ 1.6045.740.02210.040.96754.920.03300.020.9759.670.11570.050.959
1.6 ÷ 2.581.500.03920.020.98720.880.03990.050.9316.230.06640.070.926
2.0 ÷ 5.035.010.04000.050.987185.170.05300.010.99512.990.09210.040.978
10 °C1.0 ÷ 1.6070.170.02080.030.98767.980.03130.010.95517.910.13040.030.980
1.6 ÷ 2.583.400.03400.020.97113.640.06170.070.90423.520.11070.020.981
2.0 ÷ 5.037.850.03140.050.95760.140.05780.020.99513.380.10160.040.982
15 °C1.0 ÷ 1.6028.950.02620.060.93919.730.07220.050.96415.480.13120.030.996
1.6 ÷ 2.530.540.02460.060.95366.170.05510.010.99317.330.10990.030.988
2.0 ÷ 5.088.000.02580.020.97942.420.07180.020.99528.260.10660.020.991
20 °C1.0 ÷ 1.6045.600.04360.040.956111.320.06870.010.97616.930.11790.030.995
1.6 ÷ 2.524.510.05060.080.98137.040.13090.030.95211.870.15350.040.995
2.0 ÷ 5.027.650.03530.070.9596.650.13270.130.94732.300.15350.020.982
25 °C1.0 ÷ 1.6024.660.04430.080.98432.870.09610.030.99811.390.14910.040.992
1.6 ÷ 2.521.440.05200.090.98519.790.12340.050.99410.260.16500.050.993
2.0 ÷ 5.021.230.03690.090.91720.380.12460.050.97013.250.13350.040.963
LII—Langmuir isotherm in Lineweaver–Burke linearization [49]
5 °C1.0 ÷ 1.60192.080.01500.010.662218.690.02890.000.49648.430.08500.010.360
1.6 ÷ 2.563.980.04910.030.908−26.630.0427−0.040.577−5.990.0646−0.090.697
2.0 ÷ 5.094.530.03210.020.889130.720.05330.010.77951.950.07260.010.802
10 °C1.0 ÷ 1.60184.560.01700.010.571230.730.02860.000.34625.330.12370.020.967
1.6 ÷ 2.5108.500.04120.020.726−32.410.0746−0.030.38770.940.09940.010.096
2.0 ÷ 5.0348.480.02380.010.268134.380.05460.010.79550.190.08320.010.735
15 °C1.0 ÷ 1.60166.470.01620.010.81592.580.06010.010.73929.040.11930.020.903
1.6 ÷ 2.5143.340.01590.010.688228.170.05180.000.58846.920.09880.010.888
2.0 ÷ 5.0177.660.02290.010.62292.050.06760.010.67969.610.10050.010.854
20 °C1.0 ÷ 1.6027.880.04750.070.98731.930.08350.030.96729.930.10790.020.961
1.6 ÷ 2.546.030.04100.040.82415.210.14270.060.99817.060.14590.030.996
2.0 ÷ 5.0141.660.02530.010.63236.330.08690.030.62224.650.15430.020.856
25 °C1.0 ÷ 1.6063.580.03370.030.98467.710.09050.010.99832.380.12870.020.992
1.6 ÷ 2.557.850.03810.030.92234.640.11590.030.96826.990.14280.020.957
2.0 ÷ 5.0109.600.02390.020.11350.610.11450.020.47611.510.13210.040.517
LIII—Langmuir isotherm in Scatchard linearization [49]
5 °C1.0 ÷ 1.6077.540.02050.030.52364.630.03500.020.24314.770.11390.030.317
1.6 ÷ 2.530.220.05950.060.904−19.260.0375−0.050.303−5.470.0610−0.100.960
2.0 ÷ 5.056.580.03710.030.73090.730.05520.010.70728.930.08170.020.641
10 °C1.0 ÷ 1.6094.570.02050.020.52728.650.04490.030.07020.280.13010.020.823
1.6 ÷ 2.547.070.04810.040.313−18.550.06530.060.5372.240.31800.180.005
2.0 ÷ 5.069.490.03040.030.23492.050.05650.010.71722.340.11330.020.607
15 °C1.0 ÷ 1.6067.280.02180.030.54346.940.06610.020.55222.490.12560.020.841
1.6 ÷ 2.560.890.02120.030.479115.990.05420.010.51735.110.10290.010.755
2.0 ÷ 5.091.180.02650.020.56261.060.07070.020.63752.630.10300.010.767
20 °C1.0 ÷ 1.6038.430.04550.050.87922.340.09190.040.50524.350.11280.020.868
1.6 ÷ 2.532.210.05250.060.75012.910.15040.070.82616.470.14720.030.957
2.0 ÷ 5.053.620.03190.040.46411.890.12140.080.43417.580.16420.030.740
25 °C1.0 ÷ 1.6042.460.03950.040.85154.570.09260.020.84621.420.13830.020.713
1.6 ÷ 2.533.710.04750.060.76930.170.11840.030.91718.400.15340.030.757
2.0 ÷ 5.0−10.64−0.023−0.220.03217.860.13300.050.352−6.920.1102−0.080.899
LIV—Langmuir isotherm in Eadie–Hofstee linearization [49]
5 °C1.0 ÷ 1.60149.250.01720.010.533263.160.02900.000.31746.510.8990.010.243
1.6 ÷ 2.5100.000.04740.020.303-21.320.0400-0.050.904-5.700.0647-0.100.960
2.0 ÷ 5.077.520.03450.030.730128.210.05360.010.70745.050.07540.010.641
10 °C1.0 ÷ 1.60178.570.01790.010.527416.670.02840.000.70024.630.12550.020.823
1.6 ÷ 2.5149.250.04060.010.31334.600.07860.030.537476.190.9690.000.005
2.0 ÷ 5.0294.120.02460.010.234128.210.05490.010.71745.050.08550.010.607
15 °C1.0 ÷ 1.60123.460.01840.010.54384.750.06120.010.55226.740.12200.020.841
1.6 ÷ 2.5126.580.01690.020.479222.220.05200.000.51746.510.09940.010.755
2.0 ÷ 5.0161.290.02390.010.56296.150.6770.010.63768.490.10070.010.767
20 °C1.0 ÷ 1.6043.670.04390.040.87944.250.08030.020.50528.090.11000.020.868
1.6 ÷ 2.546.950.04430.040.75015.630.14340.060.82617.210.14590.030.957
2.0 ÷ 5.0116.280.02700.020.46427.400.09840.040.43423.870.15670.020.736
25 °C1.0 ÷ 1.6050.000.03770.040.85164.520.09110.020.84630.030.13140.020.713
1.6 ÷ 2.543.860.04400.040.76932.890.11700.030.91724.330.14660.020.757
2.0 ÷ 5.0333.330.02180.010.03250.760.11600.020.352−7.71010.1176-0.070.899
Table 3. Analysis of model fit error functions.
T, °C ESRQHYBRYDAREFisherχ2
5 °C1.0 ÷ 1.60.5L.I. 3.57 · 10−5L.I. 5.96 · 10−2L.I. 18.3L.I. 7.04L.I. 4.17 · 10−3
1.0L.II. 1.11 · 10−4L.II. 5.46 · 10−2L.II. 9.42L.IV. 1.34L.II. 3.82 · 10−3
2.0L.I. 2.04 · 10−3L.I. 4.49 · 10−1L.I. 17.7L.I. 1.89L.I. 3.14 · 10−2
1.6 ÷ 2.50.5L.IV. 5.06 · 10−4L.IV. 1.53 · 10−3L.II. 13.2L.IV. 1.81L.IV. 1.07 · 10−2
1.0L.IV. 2.81 · 10−3L.II. 4.65 · 10−1L.II. 18.4L.IV. 2.29L.II. 3.25 · 10−2
2.0L.II. 1.93 · 10−2L.II. 1.23L.II. 16.5 L.II. 3.79L.II. 8.61 · 10−2
2.0–5.00.5L.I. 5.98 · 10−5L.I. 5.09 · 10−1L.I. 10.6L.I. 11.7L.I. 3.56 · 10−3
1.0L.IV. 6.60 · 10−5L.II. 1.97 · 10−2L.II. 4.26L.IV. 3.38L.II. 1.38 · 10−3
2.0L.III. 5.28 · 10−4L.III. 1.28 · 10−1L.II. 4.26L.IV. 3.38L.II. 1.38 · 10−3
10 °C1.0 ÷ 1.60.5L.I. 3.20 · 10−5L.I. 4.62 · 10−2L.I. 12.2L.III. 4.55L.I. 3.23 · 10−3
1.0L.IV. 1.94 · 10−4L.II. 9.35 · 10−2L.II. 12.8L.IV. 1.05L.II. 6.55 · 10−3
2.0L.III. 9.15 · 10−4L.IV. 1.22 · 10−1L.II. 7.29L.III. 6.36L.IV. 8.54 · 10−3
1.6 ÷ 2.50.5L.IV. 2.29 · 10−4L.IV. 8.84 · 10−2L.II. 11.5L.IV. 1.58L.IV. 6.19 · 10−3
1.0L.II. 3.80 · 10−3L.II. 5.27 · 10−1L.II. 20.0 L.II. 1.19L.II. 3.69 · 10−2
2.0L.II. 2.16 · 10−3L.II. 3.90 · 10−1L.I. 12.5 L.II. 9.59 · 10−1L.II. 2.73 · 10−2
2.0–5.00.5L.IV. 1.16 · 10−4L.II. 6.94 · 10−2L.II. 13.7L.IV. 1.23L.II. 4.86 · 10−3
1.0L.IV. 6.63 · 10−5L.IV. 1.81 · 10−2L.II. 4.29L.IV. 3.47L.IV. 1.27 · 10−3
2.0L.IV. 6.23 · 10−4L.IV. 1.12 · 10−1L.II. 10.1L.IV. 2.75L.IV. 7.85 · 10−3
15 °C1.0 ÷ 1.60.5L.I. 4.96 · 10−5L.I. 7.38 · 10−2L.II. 19.1L.I. 6.00L.I. 5.17 · 10−3
1.0L.IV. 3.13 · 10−4L.IV. 6.87 · 10−2L.II. 6.97L.IV. 2.12L.IV. 4.81 · 10−3
2.0L.III. 3.76 · 10−4L.III. 6.36 · 10−2L.I. 5.95L.III. 11.3L.III. 4.45 · 10−3
1.6 ÷ 2.50.5L.I. 3.45 · 10−5L.I. 6.46 · 10−2L.II. 18.9L.I. 9.13L.I. 4.52 · 10−3
1.0L.IV. 6.12 · 10−5L.II. 1.75 · 10−2L.II. 3.85L.IV. 1.89L.II. 1.22 · 10−3
2.0L.IV. 3.66 · 10−4L.II. 5.59 · 10−2L.II. 5.91L.IV. 4.10L.II. 3.91 · 10−3
2.0–5.00.5L.I. 5.76 · 10−5L.I. 5.52 · 10−2L.II. 11.1L.I. 3.71L.I. 3.86 · 10−3
1.0L.IV. 1.13 · 10−4L.II. 2.87 · 10−2L.II. 4.77L.II. 3.23L.II. 2.01 · 10−3
2.0L.IV. 1.59 · 10−4L.II. 2.29 · 10−2L.II. 3.13L.IV. 3.96L.IV. 1.60 · 10−3
20 °C1.0 ÷ 1.60.5L.III. 9.77 · 10−5L.III. 4.35 · 10−2L.I. 9.70L.III. 16.4L.III. 3.05 · 10−3
1.0L.IV. 9.48 · 10−4L.IV. 1.81 · 10−1L.II. 11.1L.IV. 2.84L.IV. 1.27 · 10−2
2.0L.III. 3.92 · 10−4L.III. 7.16 · 10−2L.II. 6.20L.III. 10.3L.III. 5.01 · 10−3
1.6 ÷ 2.50.5L.I. 9.93 · 10−5L.I. 6.02 · 10−2L.I. 11.3L.I. 17.1L.I. 4.21 · 10−3
1.0L.IV. 1.93 · 10−3L.II. 2.16 · 10−1L.II. 9.62L.IV. 6.54L.II. 1.52 · 10−2
2.0L.III. 3.02 · 10−4L.II. 3.50 · 10−2L.II. 3.71L.III. 26.6L.II. 2.45 · 10−3
2.0–5.00.5L.III. 1.42 · 10−4L.IV. 1.00 · 10−1L.II. 15.6L.III. 2.37L.IV. 7.02 · 10−3
1.0L.I. 1.63 · 10−3L.I. 4.29 · 10−1L.I. 20.0L.I. 4.56L.I. 3.00 · 10−2
2.0L.IV. 1.32 · 10−3L.IV. 1.52 · 10−1L.II. 8.16L.IV. 4.64L.II. 1.07 · 10−2
25 °C1.0 ÷ 1.60.5L.I. 4.01 · 10−5L.I. 3.07 · 10−2L.I. 11.3L.I. 2.92L.I. 2.15 · 10−3
1.0L.III. 1.14 · 10−4L.IV. 2.05 · 10−2L.II. 3.82L.III. 7.21L.IV. 1.44 · 10−3
2.0L.III. 8.27 · 10−4L.III. 1.17 · 10−1L.II. 8.84L.III. 4.84L.III. 8.20 · 10−3
1.6 ÷ 2.50.5L.I. 6.92 · 10−5L.I. 4.81 · 10−2L.I. 11.7L.I. 24.1L.I. 3.37 · 10−3
1.0L.III. 1.94 · 10−4L.III. 2.75 · 10−2L.II. 3.96L.III. 13.8L.III. 1.92 · 10−3
2.0L.III. 9.98 · 10−4L.III. 1.29 · 10−1L.II. 8.95L.III. 5.77L.III. 9.02 · 10−3
2.0–5.00.5L.II. 6.52 · 10−4L.I. 3.32 · 10−1L.I. 23.3 L.II. 8.87L.I. 2.33 · 10−2
1.0L.IV. 1.32 · 10−3L.II. 1.73 · 10−1L.II. 9.06L.IV. 1.52L.II. 1.21 · 10−2
2.0L.IV. 3.41 · 10−2L.IV. 2.67L.IV. 25.9L.IV. 1.42L.IV. 1.87 · 10−1
Table 4. Thermodynamic function values.
Granulation, mmConcentration C0, mg/LΔS, J/molΔH, J/(mol · K)ΔG, J/(mol · K)
1.0–1.60.577.321−29,099.00−7254.18 ÷ −6073.08
1.0–1.61.0108.980−38,475.53−7953.77 ÷ −5947.07
1.0–1.62.01.238−7015.85−6720.82 ÷ −6419.69
1.6–2.50.552.998−21,633.86−6346.95 ÷ −5601.56
1.6–2.51.0132.284−32,214.26−7603.71 ÷ −5256.99
1.6–2.52.087.970−32,214.26−8151.18 ÷ −6229.76
2.0–5.00.50.853−6992.24−6146.72 ÷ −6673.73
2.0–5.01.092.028−32,647.42−6835.24 ÷ −5440.45
2.0–5.02.028.528−15,138.13−7258.97 ÷ −6816.61
Disclaimer/Publisher’s Note: The statements, opinions and data contained in all publications are solely those of the individual author(s) and contributor(s) and not of MDPI and/or the editor(s). MDPI and/or the editor(s) disclaim responsibility for any injury to people or property resulting from any ideas, methods, instructions or products referred to in the content.

