Spectral Separation of Up-Conversion Luminescence Processes

 , and
, and 
Abstract
1. Introduction
2. Spectrum Separation Method
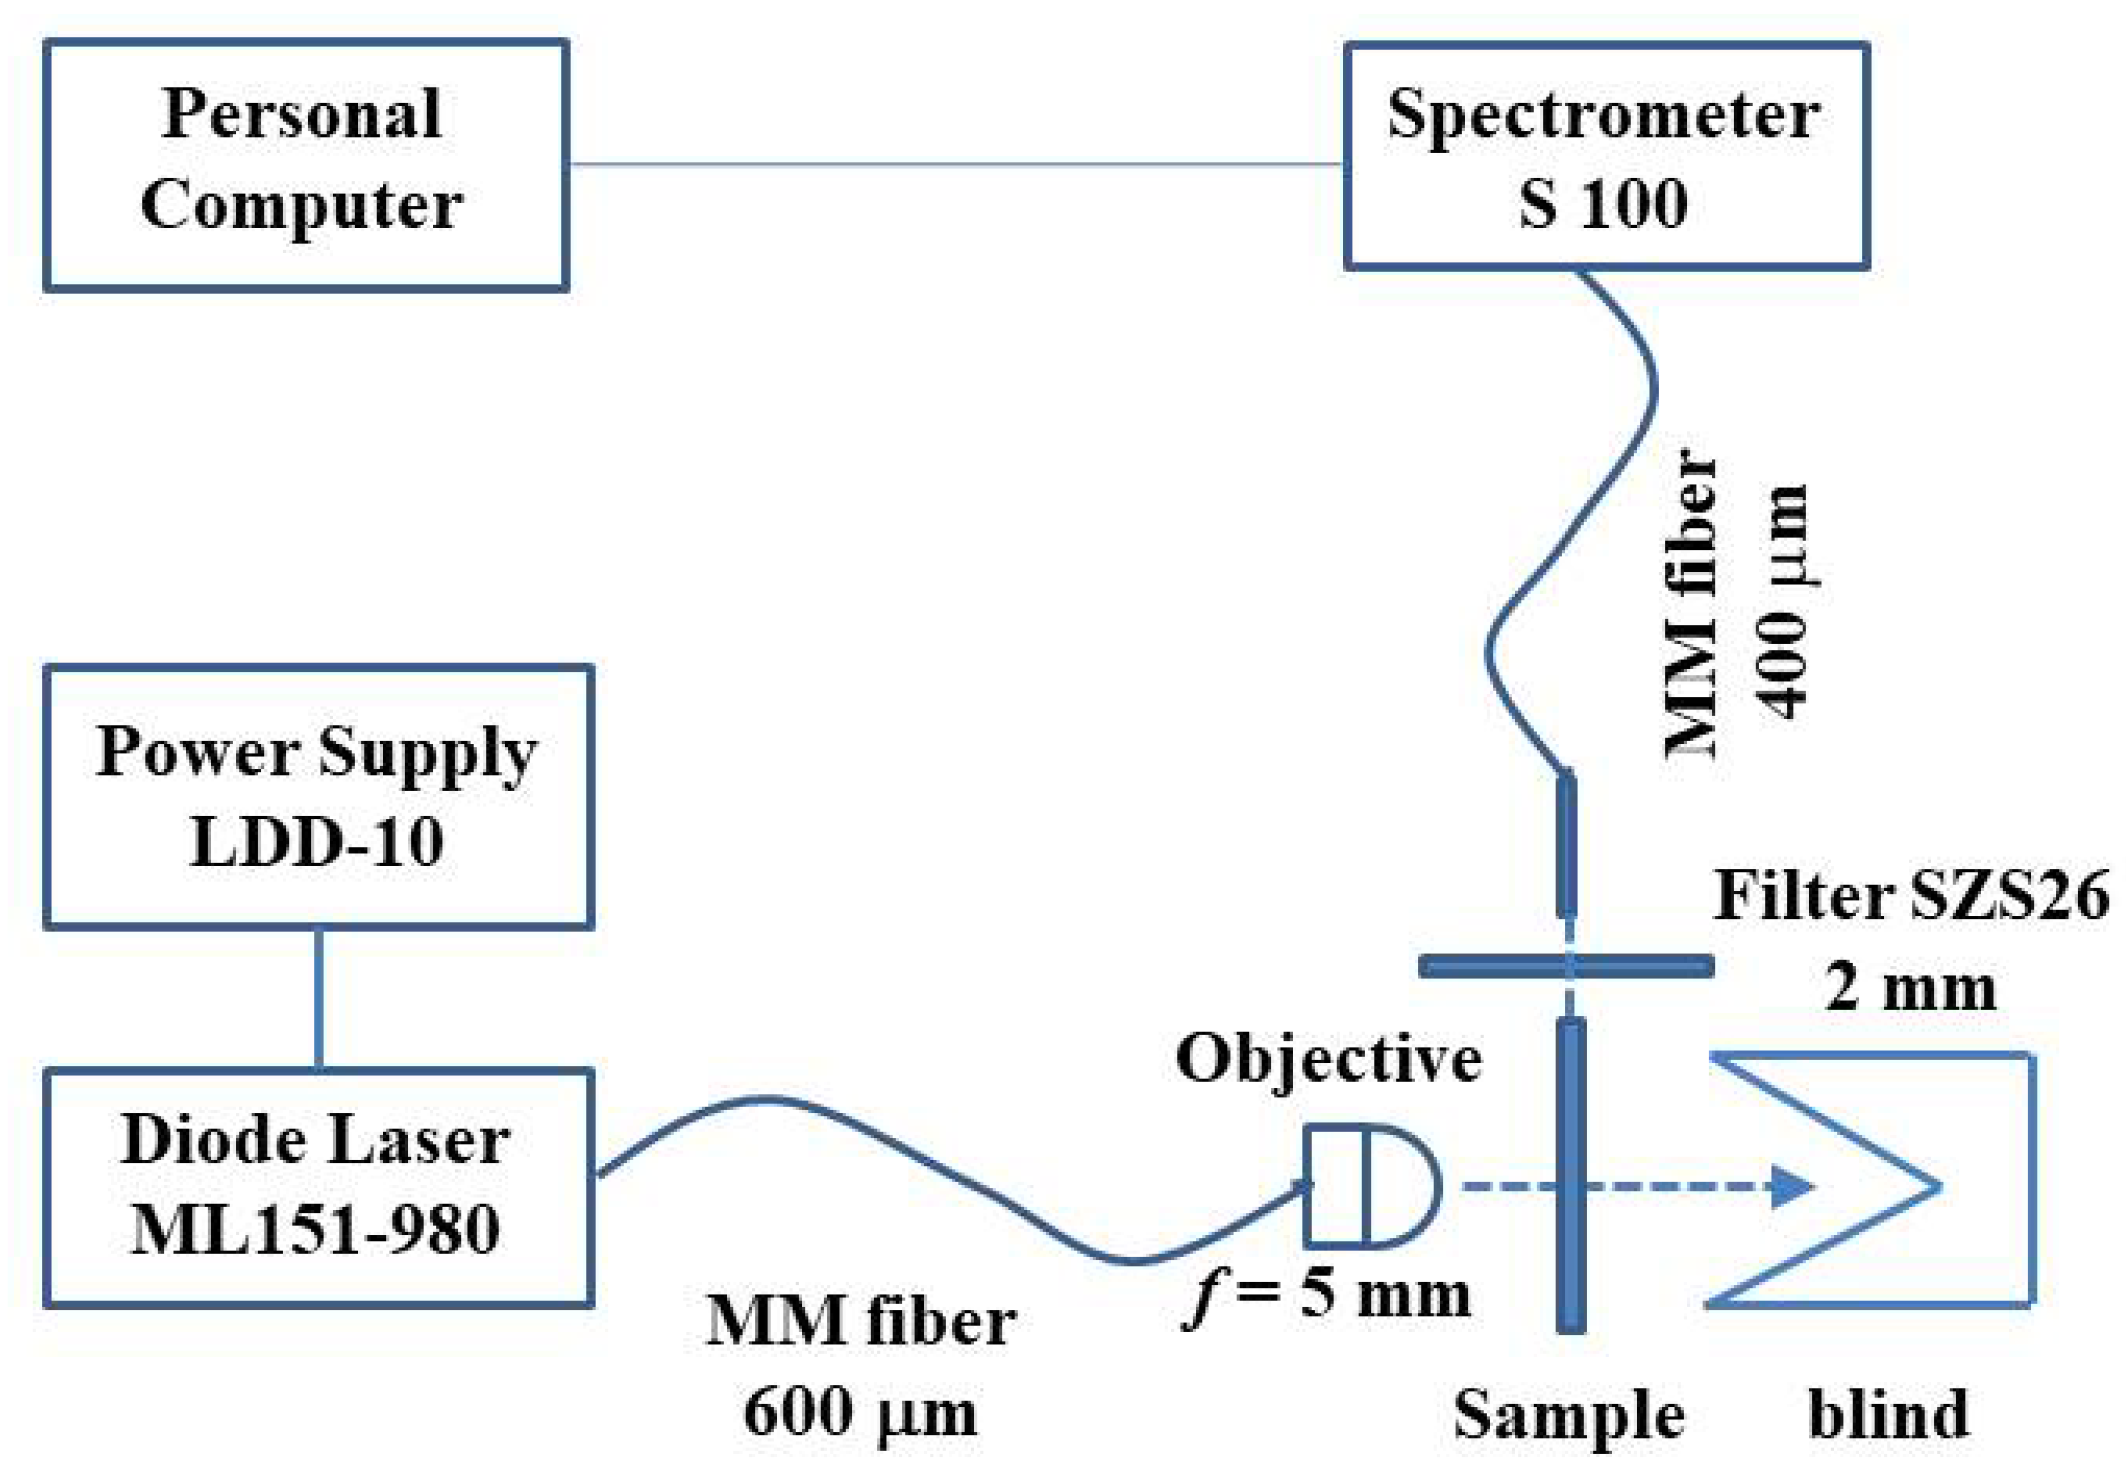
3. Experiment
- 1.
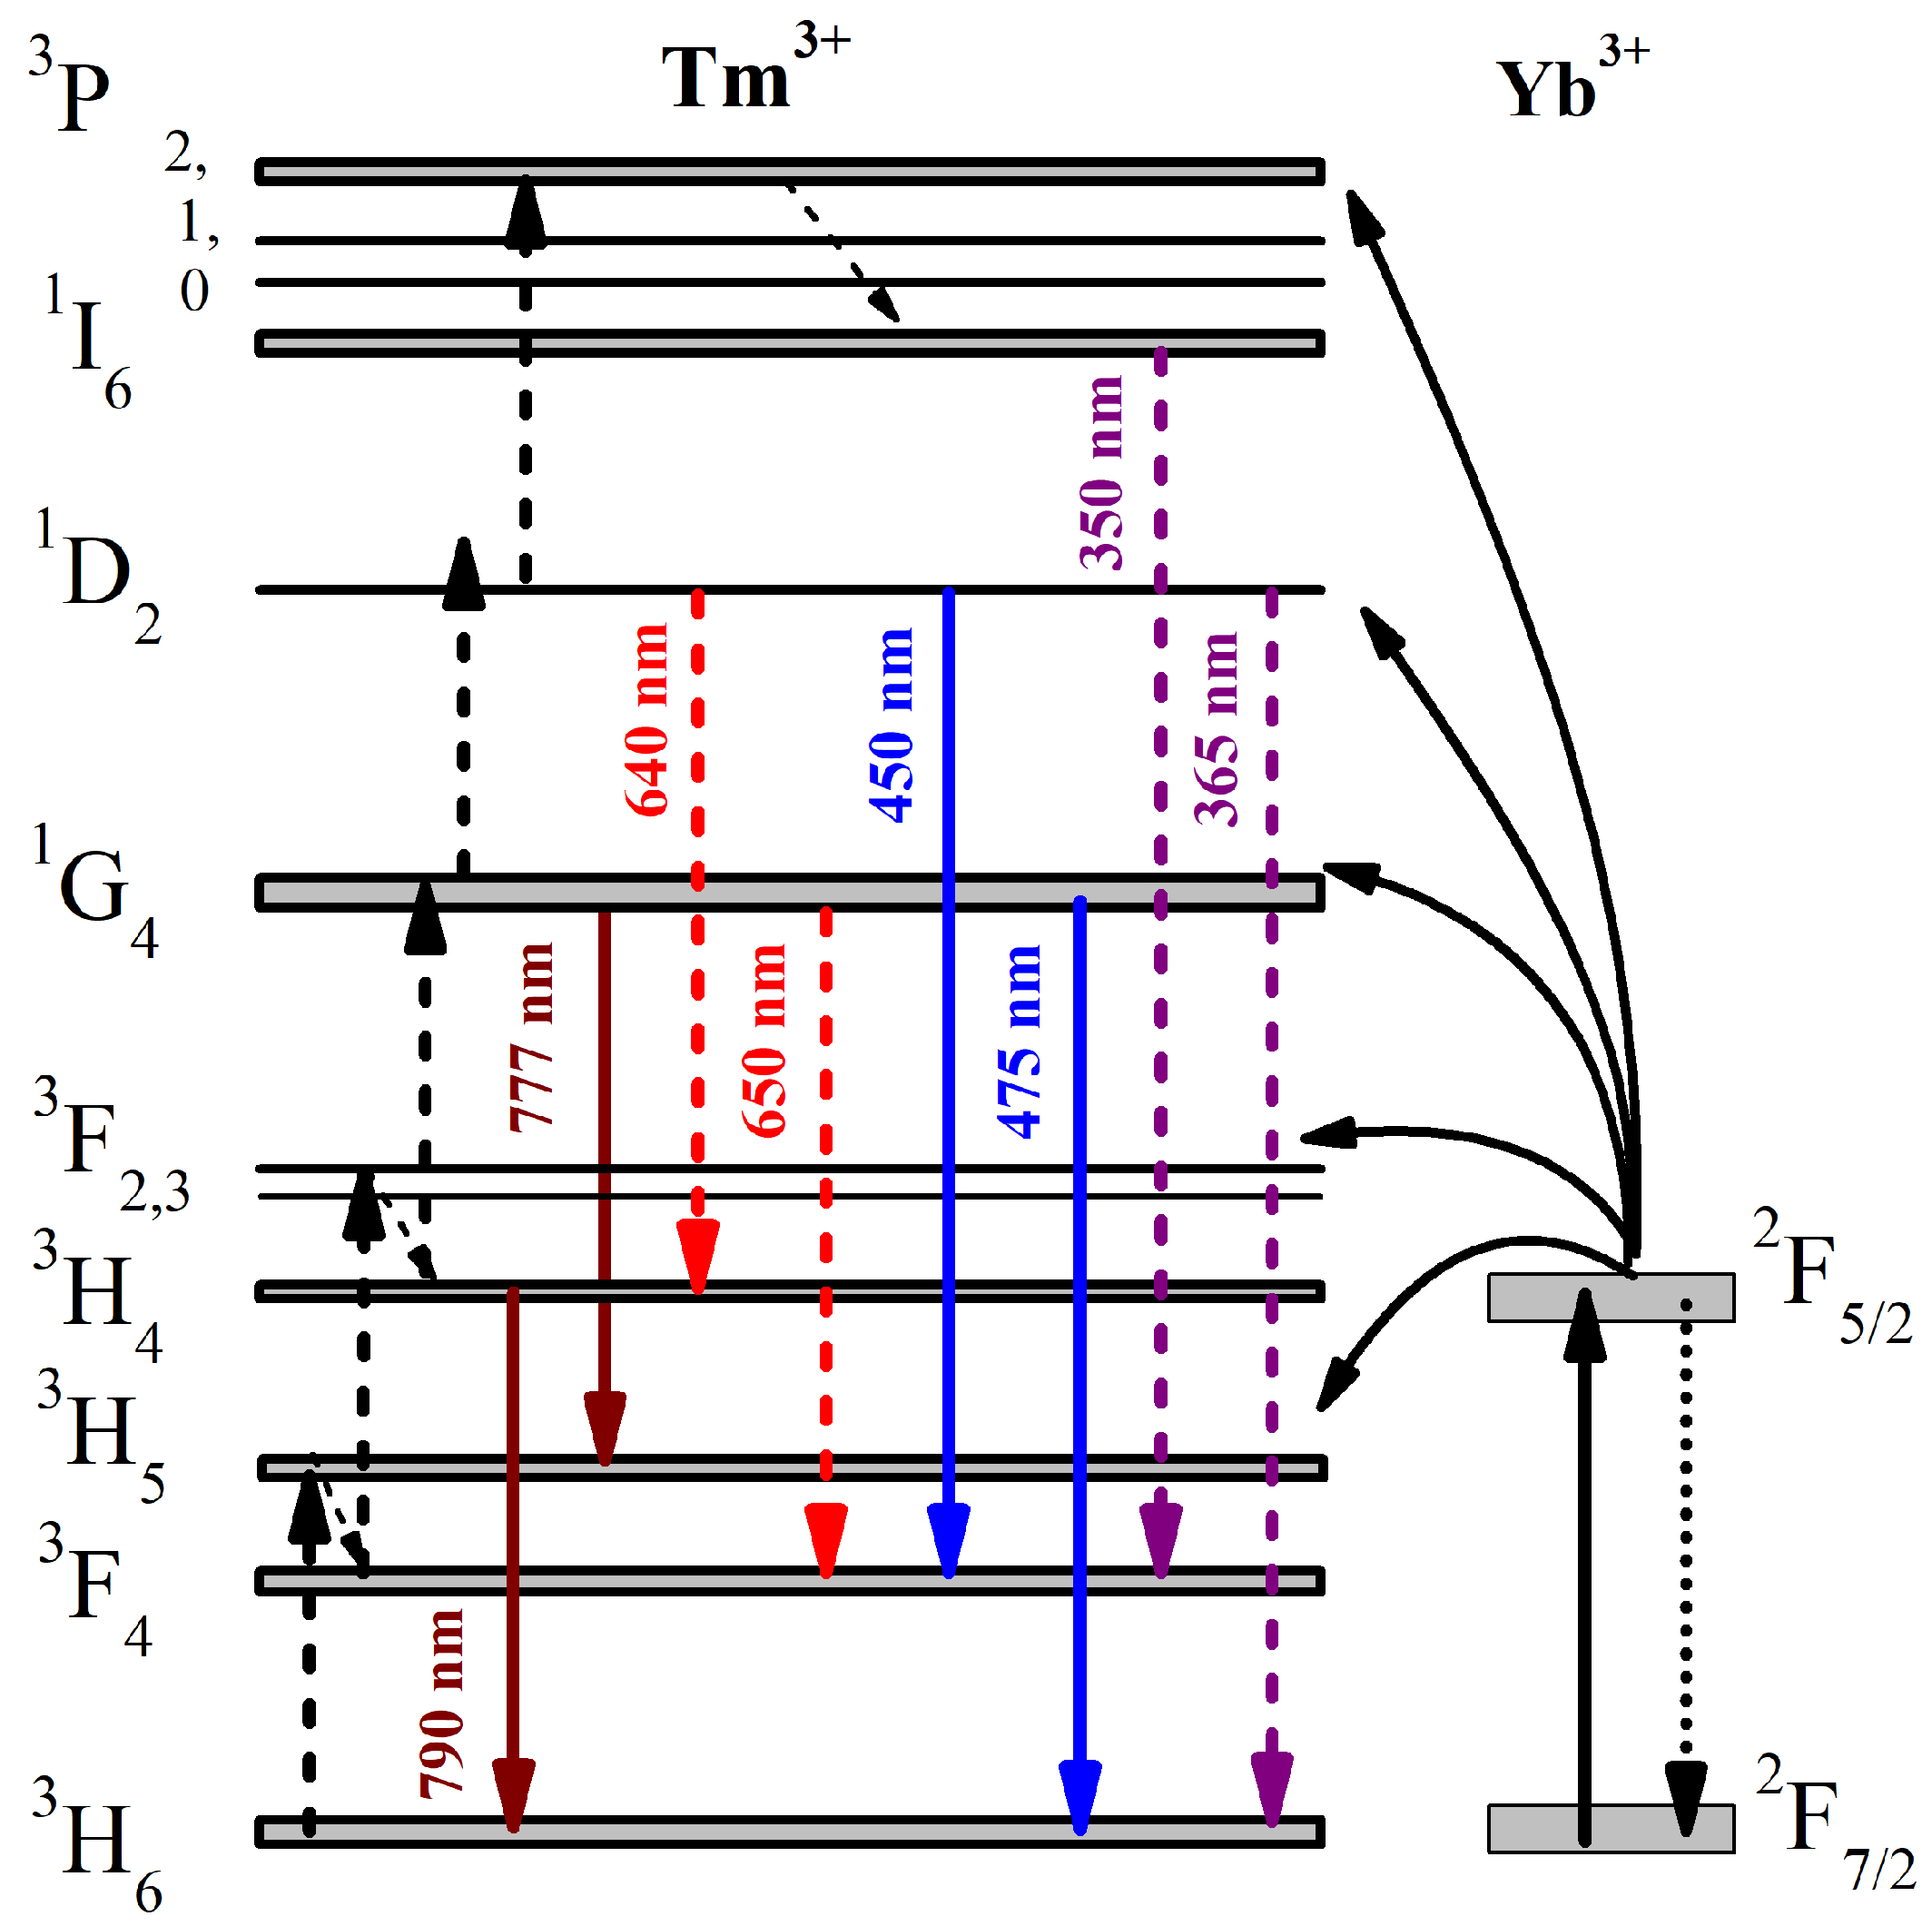
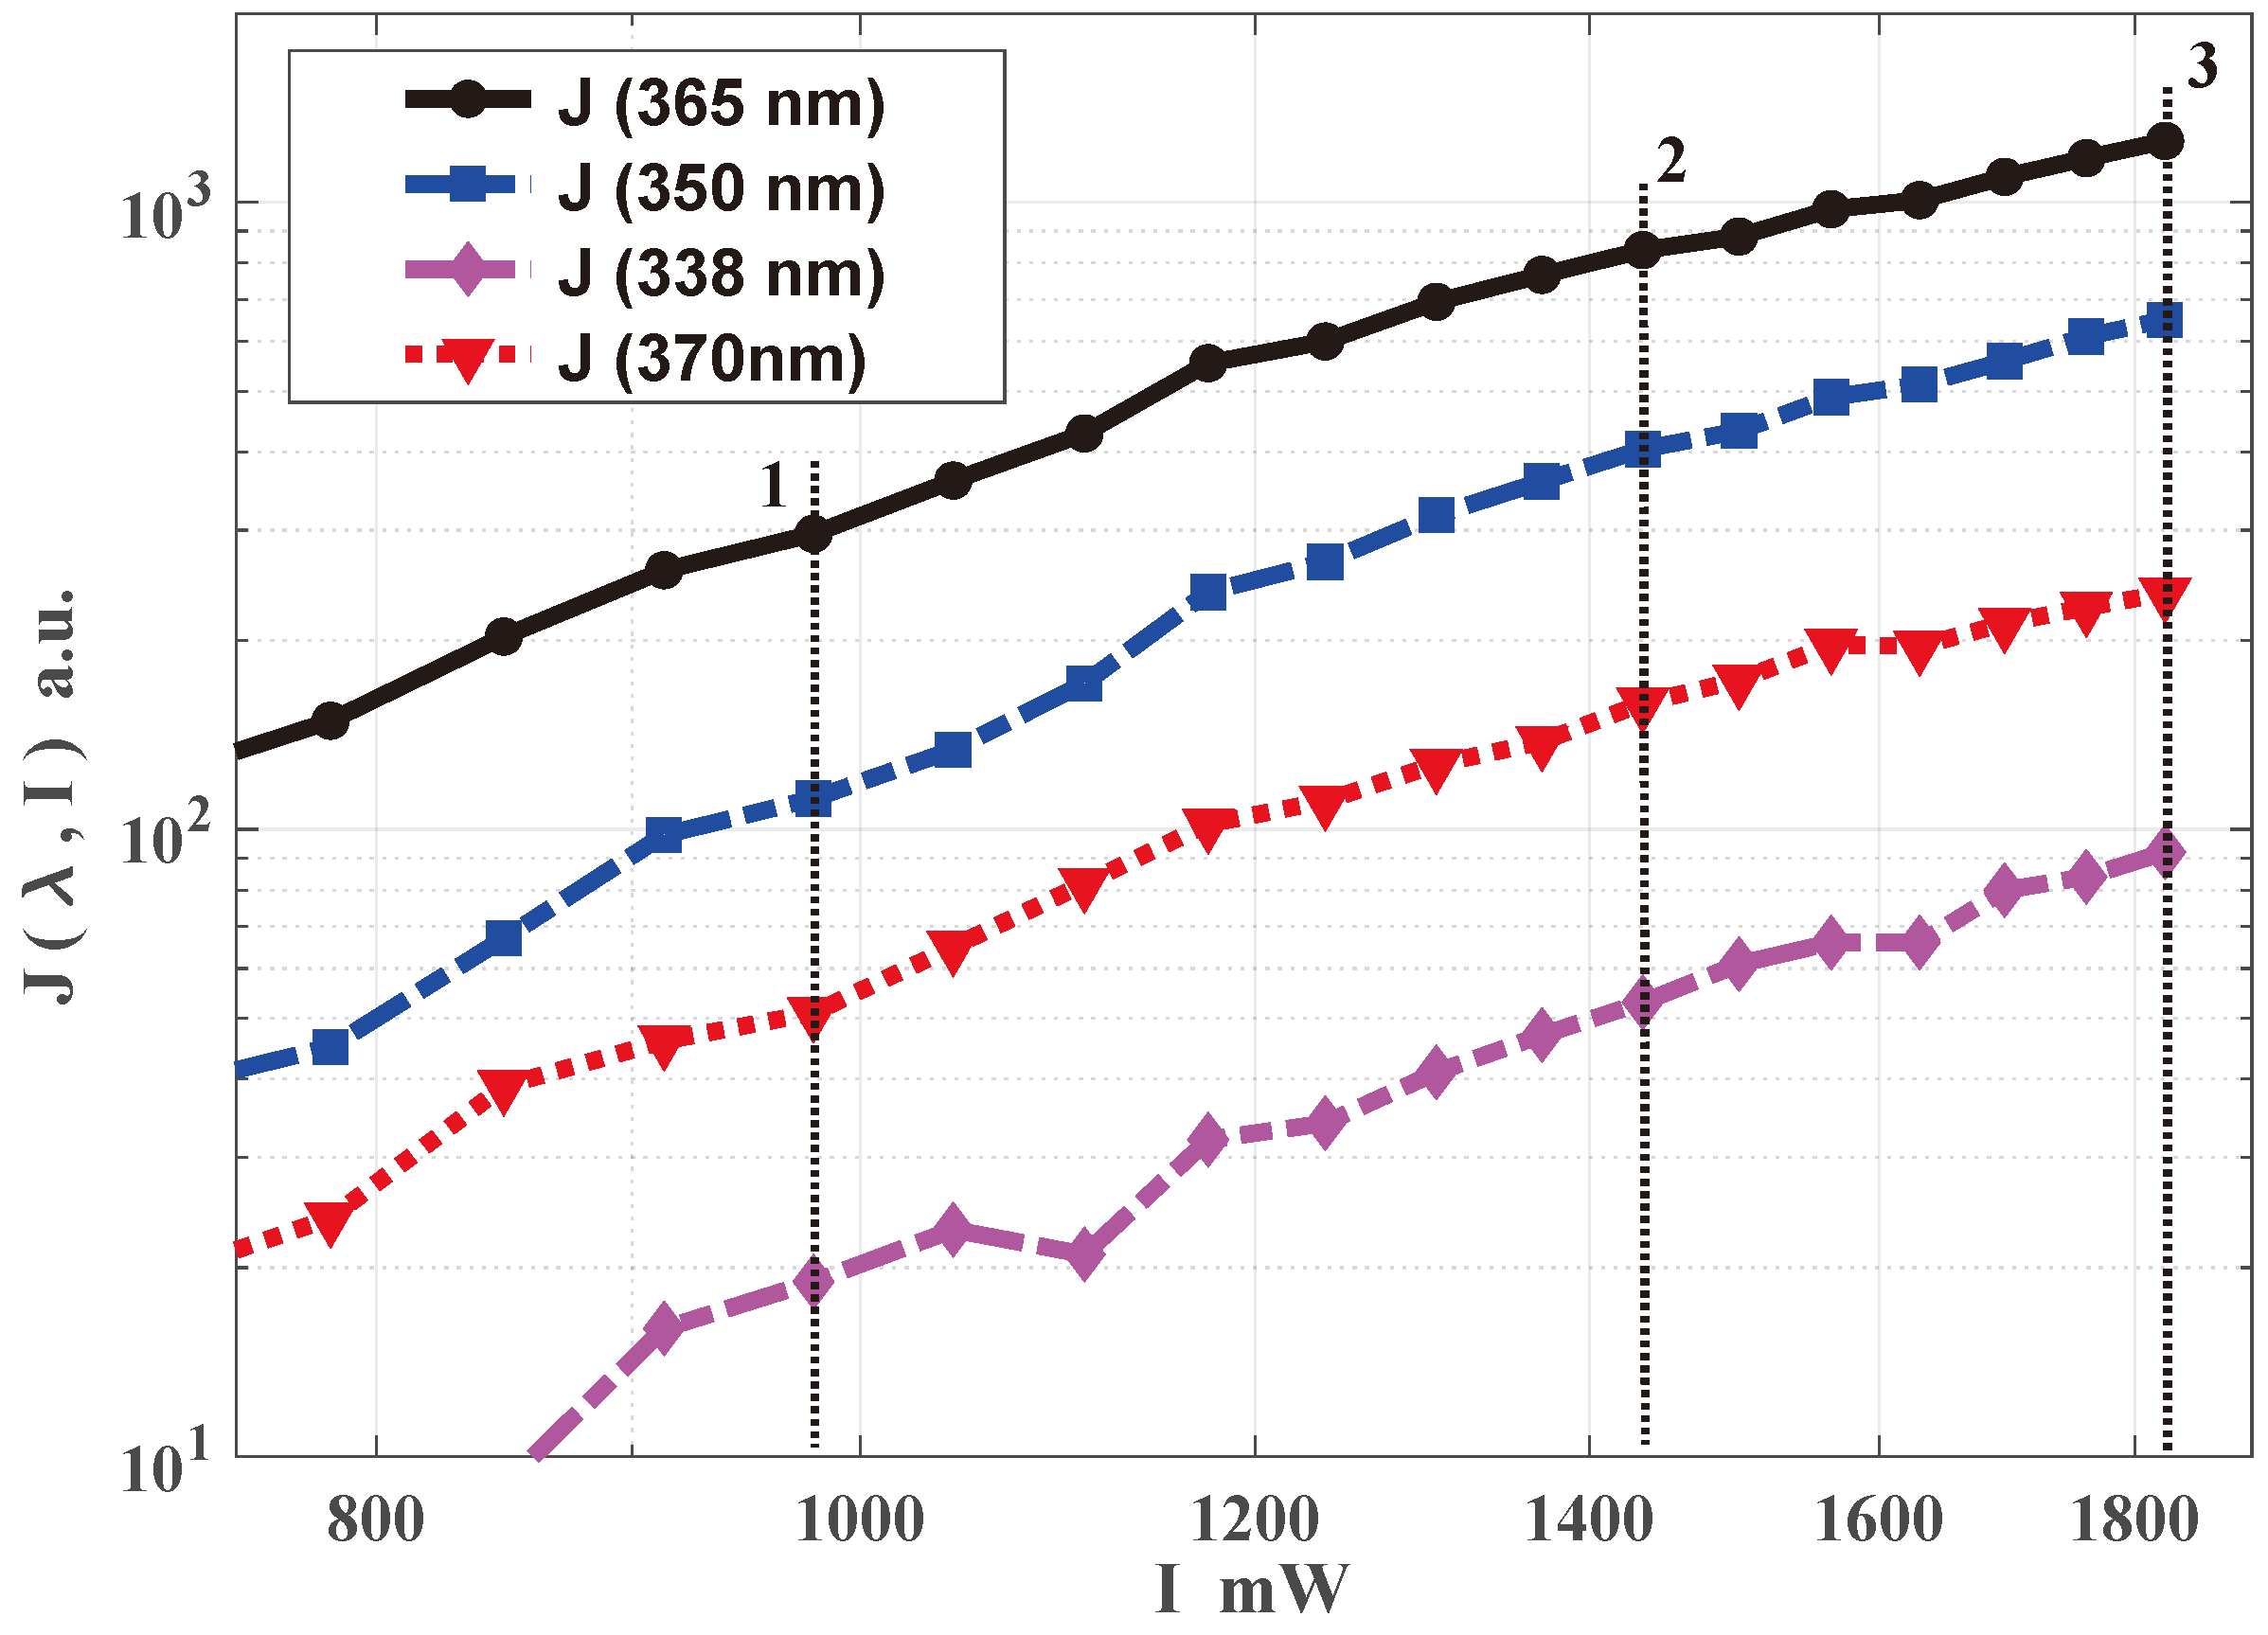
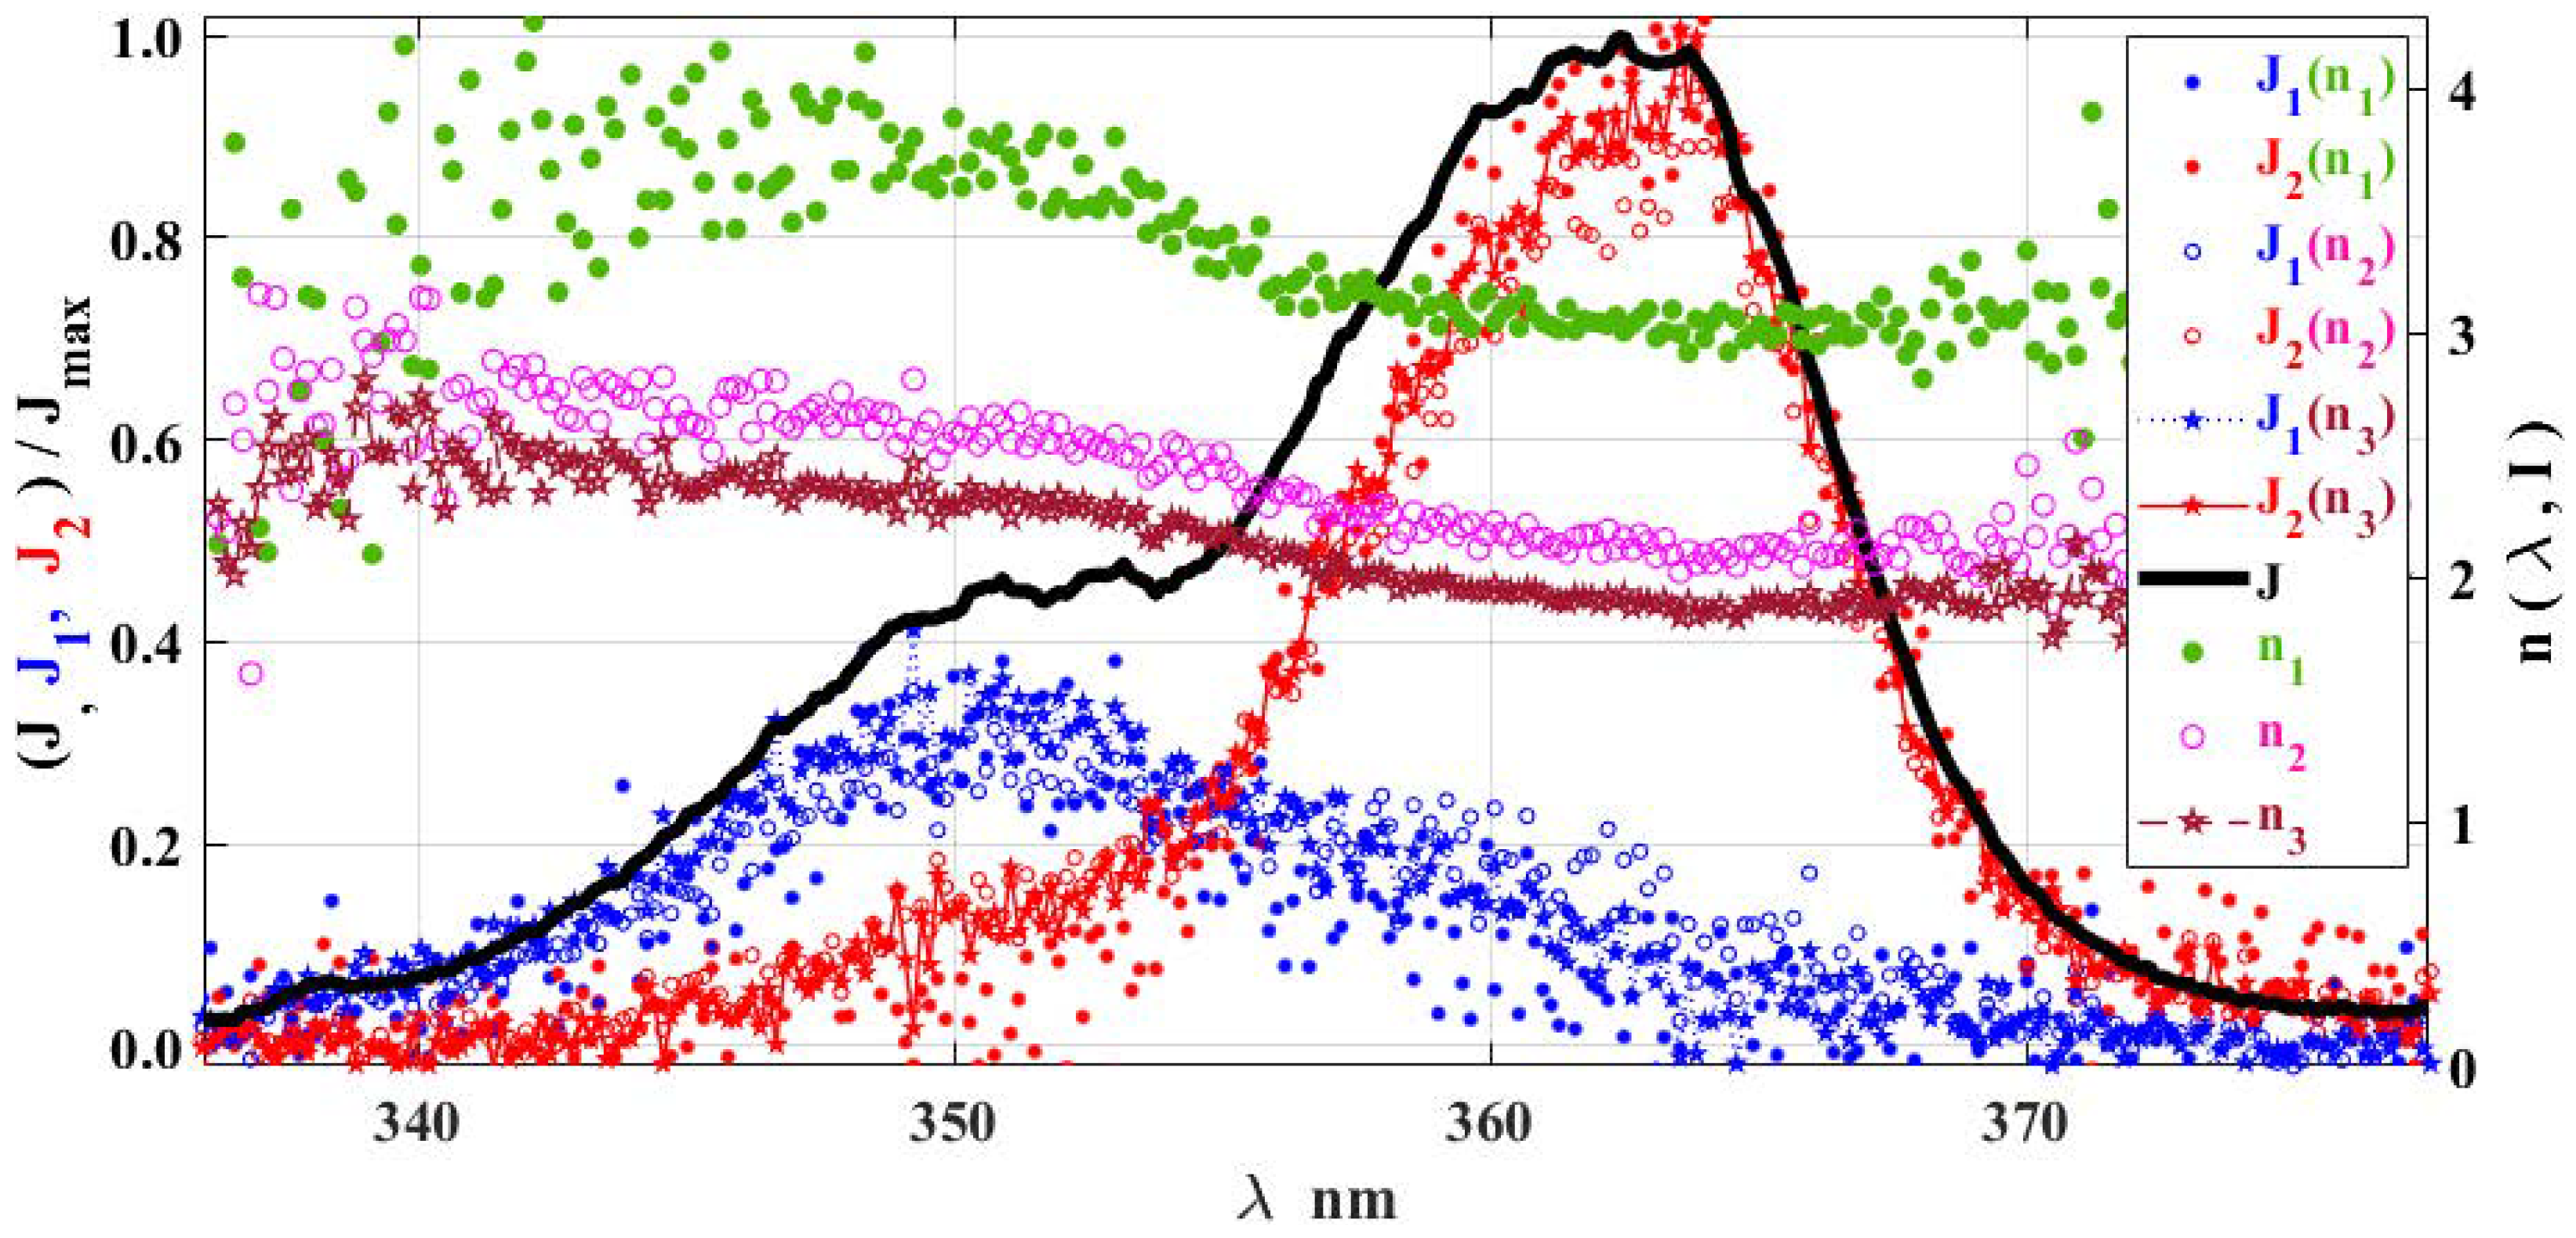
- In the region of 335–380 nm with a sufficiently strong excitation power (700–2000 mW), one detects UCL from two different levels, at 350 nm and at 365 nm, corresponding to the processes with different ENs. The third UCL process is quite weak, and left only negligible trace at 337 nm. Also notice that the processes and have a very close EN, and could hardly be separated by our method in (6) and (7) for the considered range of pump powers. These processes can still be separated using a stronger pump and larger Tm3+ ions concentrations such that cross-relaxation processes strongly impact the observed ENs. However, for such pump powers, the validity of the factorization (2) is questionable. So, we are not considering this possibility in the current work. Here, we considering only UCL from two different levels at 350 nm and at 365 nm, corresponding to the processes with different ENs.
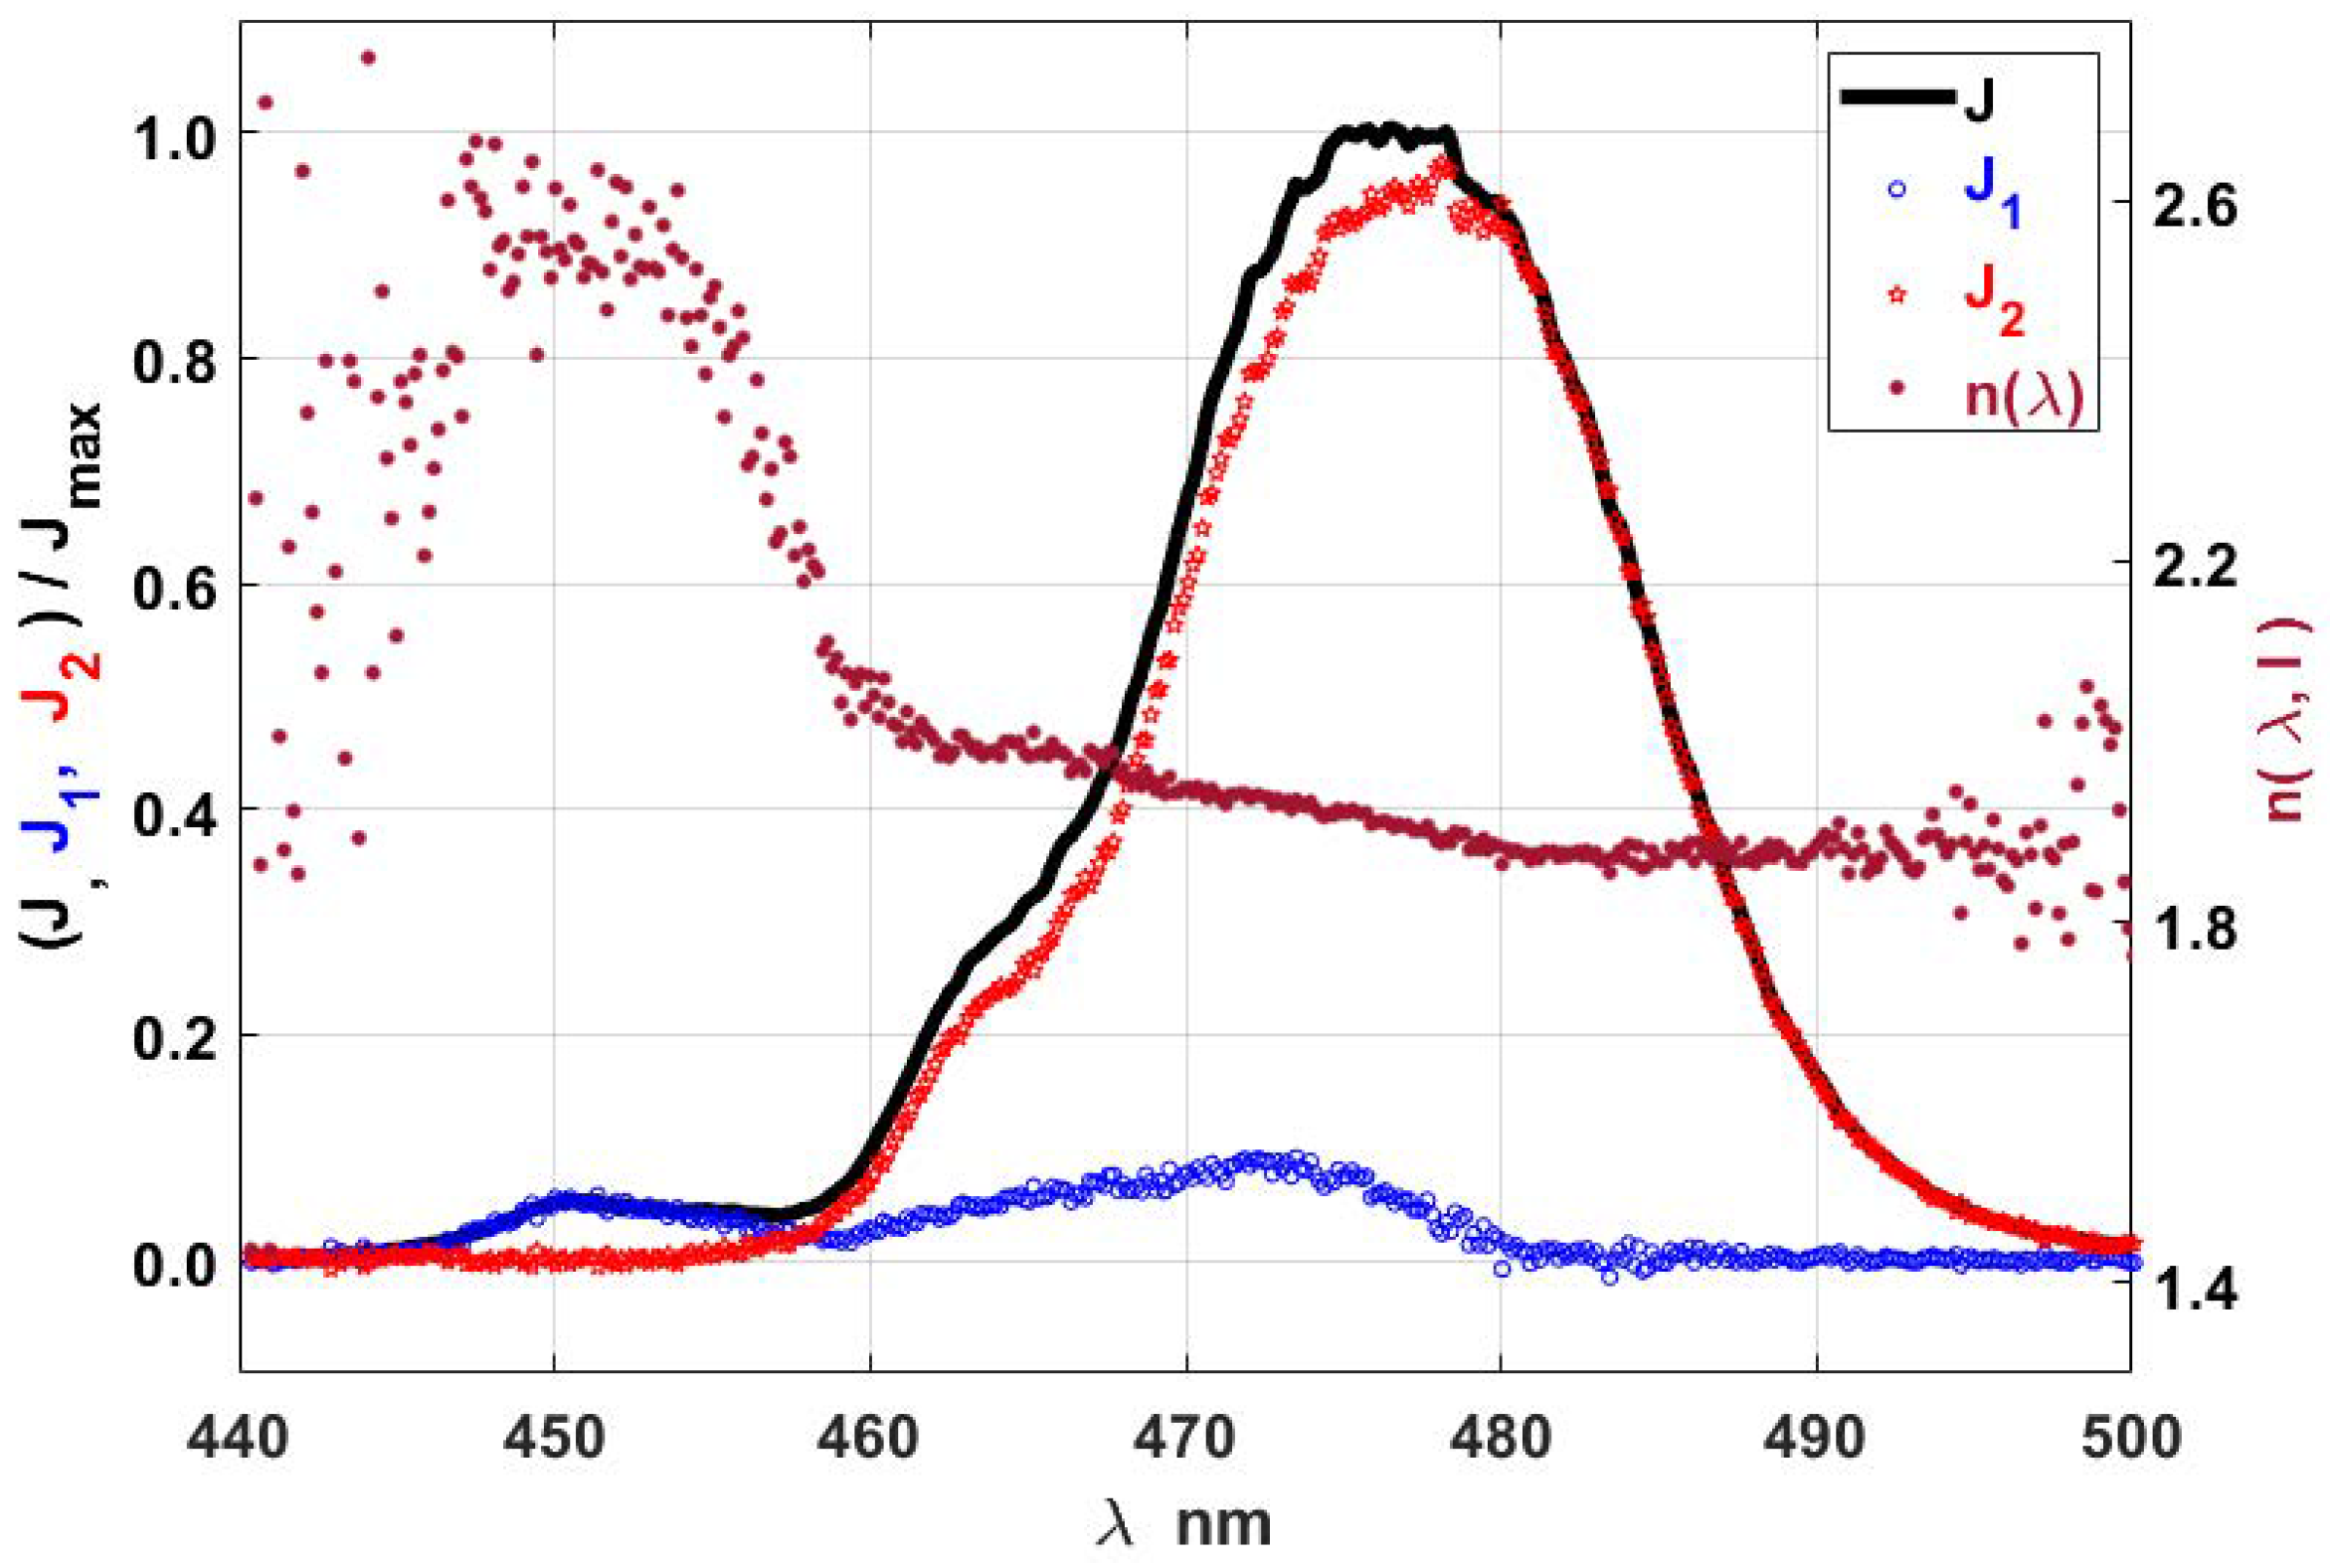
- 2.
- In the region of 440–500 nm, three processes with different ENs are possible as well: very weak UCL at 450 nm , relatively small UCL at 450 nm , and almost an order of magnitude more UCL at 475–480 nm .
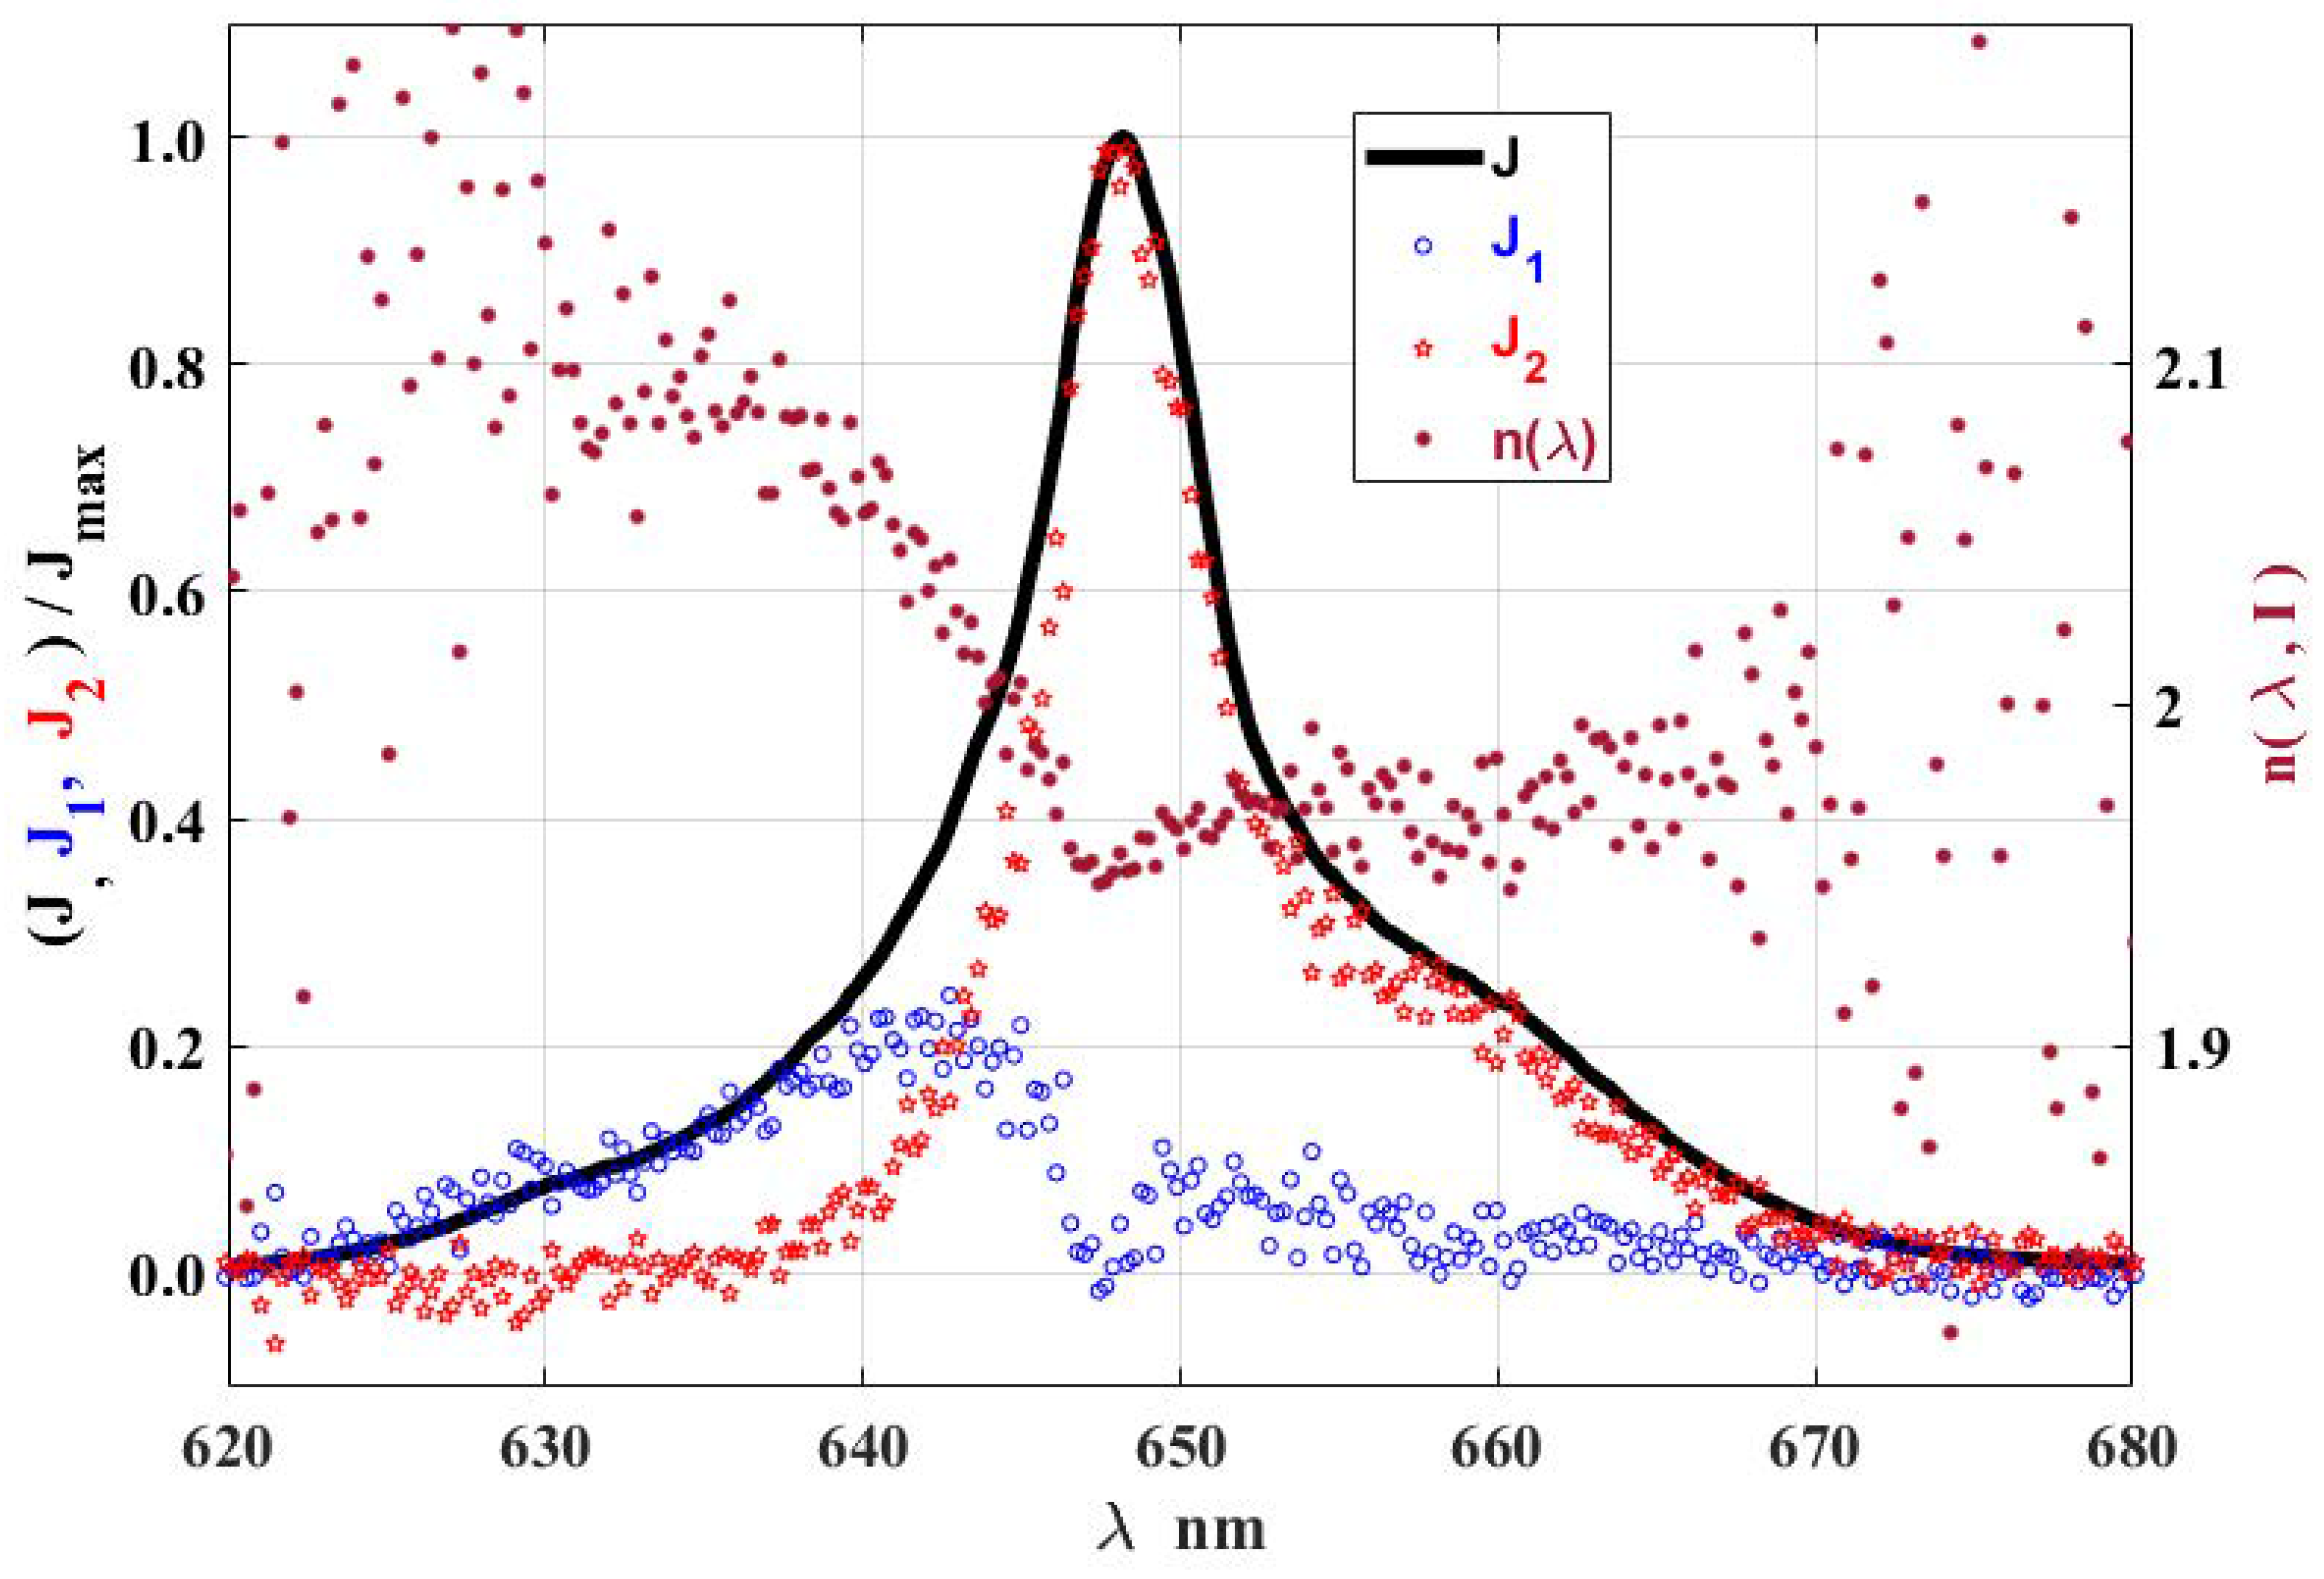
- 3.
- In the third region near 620–680 nm, two significantly overlapping lines are observed at 643 nm; and at 648 nm.
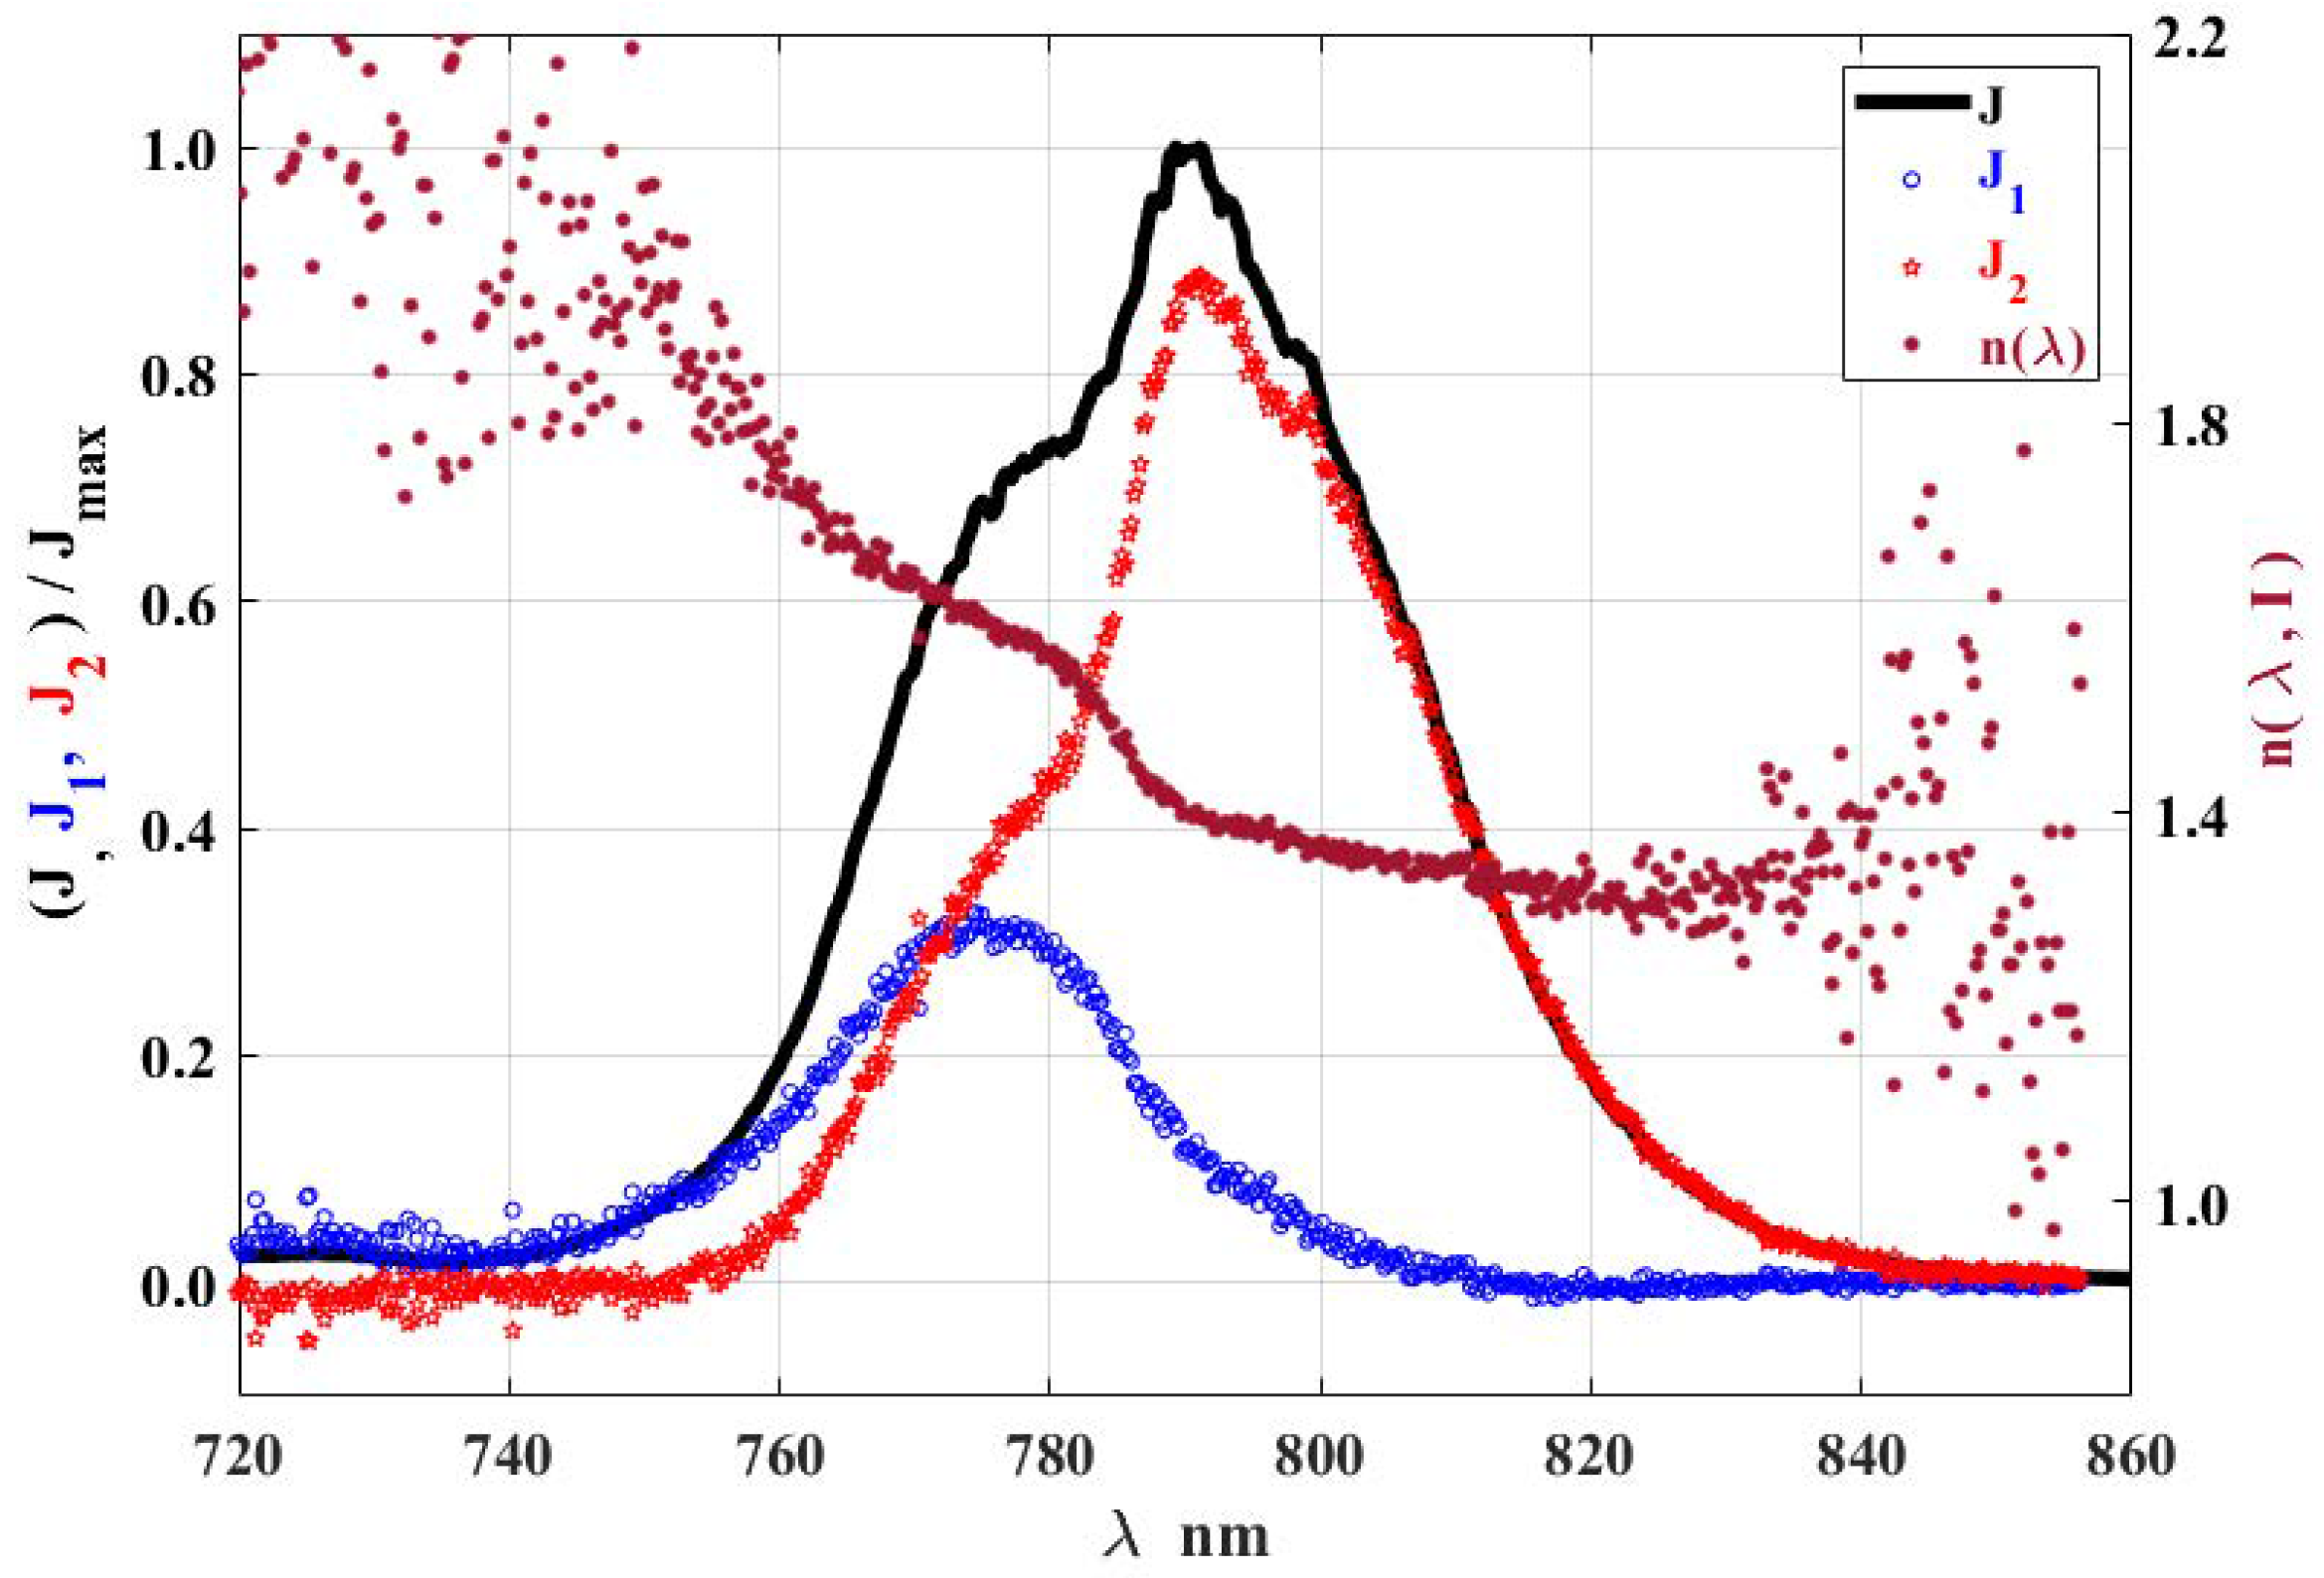
- 4.
- In the IR region at 720–840 nm, two processes of UCL with comparable efficiency are observed at 775 nm, and at 795 nm. No traces of UCL through processes were observed, apparently because the share in the branching of these processes from level is quite small (4% and 6%) [17], and the excitation process is not sufficiently effective to excite them.
4. Results
5. Conclusions
Author Contributions
Funding
Institutional Review Board Statement
Informed Consent Statement
Data Availability Statement
Acknowledgments
Conflicts of Interest
References
- Domingo-Almenara, X.; Brezmes, J.; Vinaixa, M.; Samino, S.; Ramirez, N.; Ramon-Krauel, M.; Lerin, C.; Díaz, M.; Ibáñez, L.; Correig, X.; et al. eRah: A computational tool integrating spectral deconvolution and alignment with quantification and identification of metabolites in GC/MS-based metabolomics. Anal. Chem. 2016, 88, 9821–9829. [Google Scholar] [CrossRef] [PubMed]
- Riener, M.; Kainulainen, J.; Henshaw, J.D.; Orkisz, J.H.; Murray, C.E.; Beuther, H. GAUSSPY+: A fully automated Gaussian decomposition package for emission line spectra. Astron. Astrophys. 2019, 628, A78. [Google Scholar] [CrossRef]
- Talsky, G. Derivative Spectrophotometry: Low and High Order; VCH: Vancouver, BC, Canada, 1994; ISBN 9783527282944. [Google Scholar]
- Kauppinen, J.K.; Moffatt, D.J.; Mantsch, H.H.; Cameron, D.G. Fourier self-deconvolution: A method for resolving intrinsically overlapped bands. Appl. Spectrosc. 1981, 35, 271–276. [Google Scholar] [CrossRef]
- Ruddick, B.; Anis, A.; Thompson, K. Maximum likelihood spectral fitting: The batchelor spectrum. J. Atmos. Ocean. Technol. 2000, 17, 1541–1555. [Google Scholar] [CrossRef]
- Dobigeon, N.; Moussaoui, S.; Tourneret, J.-Y.; Carteret, C. Bayesian separation of spectral sources under non-negativity and full additivity constraints. Signal Process. 2009, 89, 2657–2669. [Google Scholar] [CrossRef]
- Mikhalychev, A.; Vlasenko, S.; Payne, T.R.; Reinhard, D.A.; Ulyanenkov, A. Bayesian approach to automatic mass-spectrum peak identification in atom probe tomography. Ultramicroscopy 2020, 215, 113014. [Google Scholar] [CrossRef]
- Helin, R.; Indahl, U.G.; Tomic, O.; Liland, K.H. On the possible benefits of deep learning for spectral preprocessing. J. Chemom. 2022, 36, e3374. [Google Scholar] [CrossRef]
- Lawton, W.H.; Sylvestre, E.A. Self modeling curve resolution. Technometrics 1971, 13, 617–633. [Google Scholar] [CrossRef]
- Fok, M.V. Separation of Complex Spectra into Individual Bands by the Generalized Alentsev Method; Springer: Boston, MA, USA, 1973; pp. 1–22. [Google Scholar]
- Pelikan, P.; Ceppan, M.; Livska, M. Applications of Numerical Methods in Molecular Spectroscopy. 1994. Available online: https://api.semanticscholar.org/CorpusID:94214468 (accessed on 21 November 2024).
- Jiang, J.-H.; Ozaki, Y. Self-modeling curve resolution (SMCR): Principles, techniques, and applications. Appl. Spectrosc. Rev. 2002, 37, 321–345. [Google Scholar] [CrossRef]
- Galindo, J.A.O.; Pessoa, A.R.; Serge-Correales, Y.E.; Ribeiro, S.J.L.; Menezes, L.d.S.; Amaral, A.M. Method for separating spectrally overlapping multiphoton upconverted emission bands through spectral power dependence analysis. J. Lumin. 2023, 257, 119685. [Google Scholar] [CrossRef]
- Auzel, F. Upconversion and anti-stokes processes with F d Ions Solids. Chem. Rev. 2004, 104, 139–174. [Google Scholar] [CrossRef] [PubMed]
- Pollnau, M.; Gamelin, D.R.; Luthi, S.R.; Gudel, H.U.; Hehlen, M.P. Power dependence of upconversion luminescence in lanthanide and transition-metal-ion systems. Phys. Rev. B 2000, 61, 3337–3346. [Google Scholar] [CrossRef]
- Suyver, J.F.; Aebischer, A.; Garcia-Revilla, S.; Gerner, P.; Gudel, H.U. Anomalous power dependence of sensitized upconversion luminescence. Phys. Rev. B 2005, 71, 125123. [Google Scholar] [CrossRef]
- Silvestre, O.; Pujol, M.C.; Rico, M.; Guell, F.; Aguilo, M.; Diaz, F. Thulium doped monoclinic KLu(WO4)2 single crystals: Growth and spectroscopy. Appl. Phys. B Lasers Opt. 2007, 87, 707–716. [Google Scholar] [CrossRef]
- Korolkov, M.V.; Khodasevich, I.A.; Piotukh, A.S.; Grabtchikov, A.S.; Kolobkova, E.V.; Nguyen, T.V.; Mogilevtsev, D.S. Line Verification in Luminescence Spectra of Fluorophosphate Glass Doped with Ytterbium and Thulium Ions by the Degree of Nonlinearity of Up-Conversion Processes. J. Appl. Spectrosc. 2023, 90, 982–987. [Google Scholar] [CrossRef]
- Kolobkova, E.; Grabtchikov, A.; Khodasevich, I. Upconversion luminescence and energy transfer in the fluorophosphate glasses with low phosphate content doped with Tm3+ and Yb3+ ions. J. Non-Cryst. Solids X 2021, 11–12, 100065. [Google Scholar] [CrossRef]
- Quintanilla, M.; Nunez, N.O.; Cantelar, E.; Ocana, M.; Cusso, F. Tuning from blue to magenta the up-converted emissions of YF3:Tm3+/Yb3+ nanocrystals. Nanoscale 2011, 3, 1046–1052. [Google Scholar] [CrossRef]
- Cho, Y.; Song, S.W.; Lim, S.Y.; Kim, J.H.; Park, C.R.; Kim, H.M. Spectral evidence for multi-pathway contribution to the upconversion pathway in NaYF4:Yb3+,Er3+ phosphors. Phys. Chem. Chem. Phys. 2017, 19, 7326–7332. [Google Scholar] [CrossRef]
- Kore, B.P.; Kumar, A.; Kroon, R.E.; Terblans, J.J.; Swart, H.C. Origin of visible and near IR upconversion in Yb3+-Tm3+-Er3+ doped BaMgF4 phosphor through energy transfer and cross-relaxation processes. Opt. Mater. 2020, 99, 109511. [Google Scholar] [CrossRef]
- Noginov, M.A.; Curley, M.; Venkateswarlu, P.; Williams, A.; Jenssen, H.P. Excitation scheme for the upper energy levels in a Tm:Yb:BaY2F8 laser crystal. J. Opt. Soc. Am. B 1997, 14, 2126–2136. [Google Scholar] [CrossRef]
- Güell, F.; Mateos, X.; Gavalda, J.; Sole, R.; Aguilo, M.; Diaz, F.; Galan, M.; Massons, J. Optical characterization of Tm3+-doped KGd(WO4)2 single crystals. Opt. Mater. 2004, 25, 71–77. [Google Scholar] [CrossRef]
- Jones, A.M.; Yu, H.; Schaibley, J.R.; Yan, J.; Mandrus, D.G.; Taniguchi, T.; Watanabe, K.; Dery, H.; Yao, W.; Xu, X. Excitonic luminescence upconversion in a two-dimensional semiconductor. Nat. Phys. 2016, 12, 323–327. [Google Scholar] [CrossRef]
- Scheps, R. Upconversion laser processes. Prog. Quantum Electron. 1996, 20, 271–358. [Google Scholar] [CrossRef]
- Joubert, M.-F. Photon avalanche up-conversion in rare earth laser materials. Opt. Mater. 1999, 11, 181–203. [Google Scholar] [CrossRef]
- Scheife, H.; Huber, G.; Heumann, E.; Bar, S.; Osiac, E. Advances in up-conversion lasers based on Er3+ and Pr3+. Opt. Mater. 2004, 26, 365–374. [Google Scholar] [CrossRef]
- Zhu, X.; Peyghambarian, N. High-power ZBLAN glass fiber lasers: Review and prospect. Adv. Optoelectron. 2010, 501956. [Google Scholar] [CrossRef]
- Fu, S.; Shi, W.; Feng, Y.; Zhang, L.; Yang, Z.; Xu, S.; Zhu, X.; Norwood, R.A.; Peyghambarian, N. Review of recent progress on single-frequency fiber lasers. J. Opt. Soc. Am. B 2017, 34, A49–A62. [Google Scholar] [CrossRef]
- Bravo, A.F.; Yao, K.; Barnard, E.; Borys, N.; Levy, E.; Tian, B.; Tajon, C.; Moretti, L.; Altoe, M.V.; Aloni, S.; et al. Continuous-wave upconverting nanoparticle microlasers. Nat. Nanotechnol. 2018, 13, 07. [Google Scholar]
- Nexha, A.; Carvajal, J.J.; Pujol, M.C.; Diaz, F.; Aguilo, M. Lanthanide doped luminescence nanothermometers in the biological windows: Strategies and applications. Nanoscale 2021, 13, 7913–7987. [Google Scholar] [CrossRef]
- Goldschmidt, J.C.; Fischer, S. Upconversion for photovoltaics—A review of materials, devices and concepts for performance enhancement. Adv. Opt. Mater. 2015, 3, 1487. [Google Scholar] [CrossRef]
- Li, X.; Zhang, F.; Zhao, D. Lab on upconversion nanoparticles: Optical properties and applications engineering via designed nanostructure. Chem. Soc. Rev. 2015, 44, 1346–1378. [Google Scholar] [CrossRef] [PubMed]
- Qiu, L.; Yang, Y.; Dong, G.; Xia, D.; Li, M.; Fan, X.; Fan, R. Surfaces modification of MAPbI3 films with hydrophobic β-NaYF4:Yb,Er up-conversion ultrathin layers for improving the performance of perovskite solar cells. Appl. Surf. Sci. 2018, 448, 145–153. [Google Scholar] [CrossRef]
- Zhou, J.; Liu, Q.; Feng, W.; Sun, Y.; Li, F. Upconversion luminescent materials: Advances and applications. Chem. Rev. 2015, 115, 395–465. [Google Scholar] [CrossRef]
- Schulze, T.F.; Schmidt, T.W. Photochemical upconversion: Present status and prospects for its application to solar energy conversion. Energy Environ. Sci. 2015, 8, 103–125. [Google Scholar] [CrossRef]
- Chen, S.; Weitemier, A.Z.; Zeng, X.; He, L.; Wang, X.; Tao, Y.; Huang, A.J.Y.; Hashimotodani, Y.; Kano, M.; Iwasaki, H.; et al. Near-infrared deep brain stimulation via upconversion nanoparticle–mediated optogenetics. Science 2018, 359, 679–684. [Google Scholar] [CrossRef]
- Duan, C.; Liang, L.; Li, L.; Zhang, R.; Xu, Z.P. Recent progress in up-conversion luminescence nanomaterials for biomedical applications. J. Mater. Chem. B 2018, 6, 192–209. [Google Scholar] [CrossRef]
- Zhu, X.; Su, Q.; Feng, W.; Li, F. Anti-stokes shift luminescent materials for bio-applications. Chem. Soc. Rev. 2017, 46, 1025–1039. [Google Scholar] [CrossRef] [PubMed]
- Zhou, Y.; Han, S.; Chen, X.; Wang, F.; Tang, Y.; Roy, V.A.L. An upconverted photonic nonvolatile memory. Nat. Commun. 2014, 5, 4720. [Google Scholar] [CrossRef]
- Zhou, B.; Yan, L.; Tao, L.; Song, N.; Wu, M.; Wang, T.; Zhang, Q. Enabling photon upconversion and precise control of donor–acceptor interaction through interfacial energy transfer. Adv. Sci. 2018, 5, 1700667. [Google Scholar] [CrossRef]
- Rancic, M.; Ahlefeldt, M.P.H.R.L.; Sellars, M.J. Coherence time of over a second in a telecom-compatible quantum memory storage material. Nat. Phys. 2018, 14, 50–54. [Google Scholar] [CrossRef]
- Thiel, C.W.; Böttger, T.; Cone, R.L. Rare-earth-doped materials for applications in quantum information storage and signal processing. J. Lumin. 2011, 131, 353–361. [Google Scholar] [CrossRef]
- Asadi, F.K.; Wein, S.C.; Simon, C. Protocols for long-distance quantum communication with single 167Er ions. Quantum Sci. Technol. 2020, 5, 045015. [Google Scholar] [CrossRef]
- Liu, Y.; Lu, Y.; Yang, X.; Zheng, X.; Wen, S.; Wang, F.; Asensio, X.V.; Zhao, J.; Liu, D.; Zhou, Z.; et al. Amplified stimulated emission in upconversion nanoparticles for super-resolution nanoscopy. Nature 2017, 543, 229–233. [Google Scholar] [CrossRef] [PubMed]
- Jin, D.; Xi, P.; Wang, B.; Zhang, L.; Enderlein, J.; van Oijen, A.M. Nanoparticles for super-resolution microscopy and single-molecule tracking. Nat. Methods 2018, 15, 415–423. [Google Scholar] [CrossRef]
- Lee, C.; Xu, E.Z.; Liu, Y.; Teitelboim, A.; Yao, K.; Fernandez-Bravo, A.; Kotulska, A.M.; Nam, S.H.; Suh, Y.D.; Bednarkiewicz, A.; et al. Giant nonlinear optical responses from photon-avalanching nanoparticles. Nature 2020, 589, 230–235. [Google Scholar] [CrossRef]
- Chivian, J.S.; Case, W.E.; Eden, D.D. The photon avalanche: A new phenomenon in Pr3+ -based infrared quantum counters. Appl. Phys. Lett. 1979, 35, 124–125. [Google Scholar] [CrossRef]
- Kueny, A.W.; Case, W.E.; Koch, M.E. Nonlinear-optical absorption through photon avalanche. J. Opt. Soc. Am. B 1989, 6, 639–642. [Google Scholar] [CrossRef]
- Guy, S.; Joubert, M.F.; Jacquier, B. Photon avalanche and the mean-field approximation. Phys. Rev. B 1997, 55, 8240–8248. [Google Scholar] [CrossRef]
- Korolkov, M.V.; Khodasevich, I.A.; Grabtchikov, A.S.; Mogilevtsev, D.; Kolobkova, E.V. Avalanche-like behavior of up-conversion luminescence by nonlinear coupling of pumping rates. Opt. Lett. 2019, 44, 5880–5883. [Google Scholar] [CrossRef]
- Savitzky, A.; Golay, M.J.E. Smoothing and differentiation of data by simplified least squares procedures. Anal. Chem. 1964, 36, 1627–1639. [Google Scholar] [CrossRef]
- Pal, A.; Dhar, A.; Das, S.; Annapurna, K.; Schwuchow, A.; Sun, T.; Grattan, K.T.V.; Sen, R. Energy-transfer parameters in a Tm/Yb doped single mode silica fiber. J. Opt. Soc. Am. B 2010, 27, 2714–2720. [Google Scholar] [CrossRef]
- Feng, L.; Wu, Y.; Liu, Z.; Guo, T. Optical transitions of Tm3+ in oxyfluoride glasses and compositional and thermal effect on upconversion luminescence of Tm3+/Yb3+-codoped oxyfluoride glasses. Spectrochim. Acta Part A Mol. Biomol. Spectrosc. 2014, 118, 192–198. [Google Scholar] [CrossRef] [PubMed]
- Viswanath, C.S.D.; Babu, P.; Martin, I.R.; Venkatramu, V.; Lavin, V.; Jayasankar, C.K. Near-infrared and upconversion luminescence of Tm3+ and Tm 3+/Yb3+-doped oxyfluorosilicate glasses. J. Non-Cryst. Solids 2019, 507, 1–10. [Google Scholar] [CrossRef]
- Strzep, A.; Glowacki, M.; Szatko, M.; Potrzasaj, K.; Lisiecki, R.; Ryba-Romanowski, W. Spectroscopic properties of thulium doped (Lu0.25Gd0.75)2SiO5(LGSO) single crystals. J. Lumin. 2020, 220, 116962. [Google Scholar] [CrossRef]
Disclaimer/Publisher’s Note: The statements, opinions and data contained in all publications are solely those of the individual author(s) and contributor(s) and not of MDPI and/or the editor(s). MDPI and/or the editor(s) disclaim responsibility for any injury to people or property resulting from any ideas, methods, instructions or products referred to in the content. |
© 2024 by the authors. Licensee MDPI, Basel, Switzerland. This article is an open access article distributed under the terms and conditions of the Creative Commons Attribution (CC BY) license (https://creativecommons.org/licenses/by/4.0/).
Share and Cite
Korolkov, M.V.; Khodasevich, I.A.; Grabtchikov, A.S.; Orlovich, V.A.; Mogilevtsev, D. Spectral Separation of Up-Conversion Luminescence Processes. Appl. Sci. 2024, 14, 10888. https://doi.org/10.3390/app142310888
Korolkov MV, Khodasevich IA, Grabtchikov AS, Orlovich VA, Mogilevtsev D. Spectral Separation of Up-Conversion Luminescence Processes. Applied Sciences. 2024; 14(23):10888. https://doi.org/10.3390/app142310888
Chicago/Turabian StyleKorolkov, Mikhail V., Inna A. Khodasevich, Alexander S. Grabtchikov, Valentin A. Orlovich, and Dmitri Mogilevtsev. 2024. "Spectral Separation of Up-Conversion Luminescence Processes" Applied Sciences 14, no. 23: 10888. https://doi.org/10.3390/app142310888
APA StyleKorolkov, M. V., Khodasevich, I. A., Grabtchikov, A. S., Orlovich, V. A., & Mogilevtsev, D. (2024). Spectral Separation of Up-Conversion Luminescence Processes. Applied Sciences, 14(23), 10888. https://doi.org/10.3390/app142310888