Article

Effect of the Concentration of Bioethanol Mixed with Gasoline on the Energy and Environmental Performance of a Hybrid Vehicle in the Worldwide Harmonized Light Vehicles Test Cycle (WLTC)

1
Department of Automobile Engineering, Faculty of Transport Engineering, Vilnius Gediminas Technical University, Plytinės Str. 25, 10105 Vilnius, Lithuania
2
Department of Vehicles and Engines, Faculty of Mechanical Engineering, Technical University of Liberec, Studentská 2, 461 17 Liberec, Czech Republic
3
Department of Transport and Handling Machines, Faculty of Mechanical Engineering, University of Žilina, Univerzitna 8215/1, 010 26 Žilina, Slovakia
*
Author to whom correspondence should be addressed.
Appl. Sci. 2024, 14(23), 10858; https://doi.org/10.3390/app142310858
Submission received: 18 October 2024 / Revised: 13 November 2024 / Accepted: 20 November 2024 / Published: 23 November 2024

Abstract

:
Increasing the use of renewable biofuels in internal-combustion-engine (ICE) vehicles is a key strategy for reducing greenhouse gas emissions and conserving fossil fuels. Hybrid vehicles used in urban environments significantly reduce fuel consumption compared to conventional internal-combustion-engine cars. In hybrid vehicles integrating electric propulsion with biofuels offers even more significant potential to lower fuel consumption. One would like to think they should also be less polluted in all cases, but some results show that the opposite is true. This study’s aim was to evaluate a hybrid vehicle’s energy and environmental performance using different gasoline–bioethanol blends. A Worldwide Harmonized Light Vehicles Test Cycle (WLTC) study was conducted on a Toyota Prius II hybrid vehicle to assess changes in energy and environmental performance. During the WLTC test, data were collected from the chassis dynamometer, exhaust gas analyser, fuel consumption meter, and engine control unit (ECU). The collected data were synchronised, and calculations were performed to determine the ICE cycle work, brake specific fuel consumption (BSFC), brake thermal efficiency (BTE), pollutant emissions (CO, HC, and NOx), CO2 mass emissions per cycle, and brake specific pollutant emissions per kilometre. The study shows that the performance of the hybrid vehicle’s ICE is strongly influenced by the utilisation of electrical energy stored in the battery, especially at low and medium speeds. As the bioethanol concentration increases, the engine’s ECU advances the ignition timing based on the knock sensor signal. A comprehensive evaluation using the WLTC indicates that increasing the bioethanol concentration up to 70% improves the energy efficiency of the hybrid vehicle’s internal combustion engine and reduces pollutant and CO2 emissions.

1. Introduction

Hybrid vehicles used in urban environments significantly reduce fuel consumption compared to conventional internal-combustion-engine cars [1,2] mainly due to three primary factors: an enhancement in engine efficiency, the utilisation of regenerative braking, and the minimisation of idling periods [3,4]. One would like to think they should also be less polluted in all cases, but some results show that the opposite is true [5]. Studies by Chinese researchers [6] show that CO emissions were higher for hybrid cars in almost all modes. The main reason for this was the longer warm-up time of the engine and catalyst. Unfortunately, in some cases, the CO2 emissions claimed by plug-in cars are as much as 20% lower than they are [7,8]. The reason for this is the distance travelled by the electric motor. According to the manufacturers, plug-in cars should cover a much greater distance than they do [9]. There is a paradox: plug-in hybrid electric vehicles (PHEVs) have a larger battery than hybrid electric vehicles (HEVs) [10,11], but the battery is not used for its intended purpose. Instead, it adds weight to the car and increases fuel consumption [12]. On the other hand, promoting HEVs and PHEVs as environmentally friendly vehicles may result in a notable surge in overall vehicle usage, which could ultimately negate their green credentials due to the increased number of vehicles on the road [13].
The main advantage of a hybrid car is that it can have a low-power but economical and environmentally friendly ICE [14], and there is always an electric assist for traction. The emissions and, of course, the fuel consumption of a hybrid car depend strongly on the size of the car’s battery [2], the type of engine, and the type of transmission. The highest fuel consumption and probably the highest emissions are found in vehicles with a serial kind of transmission [15], where the ICE is not directly coupled to the wheels but to a generator. The energy produced by the generator is fed to the electric motor that turns the wheels. A car with a parallel hybrid transmission uses less fuel [16] due to lower energy-conversion losses. And power-split hybrids will have even better fuel economy because it allows the efficiency of both engines to be used optimally in different driving modes. In addition, the flywheel hybrid electric vehicle has a commendable environmental performance [17].
But it is not just about the type of transmission. It is also essential to consider how the car is driven, i.e., daily mileage, idling, engine, and catalyst temperatures, during engine operation, traffic congestion, and other characteristics [18]. The cold-start mode always produces the highest and most toxic emissions compared to warm-up mode [1]. In some cases, these problems can be solved by optimising the control algorithm [16,19].
Hybrid vehicles, which integrate an ICE with an electric motor, pose unique testing challenges due to their dual powertrains. The WLTC’s multi-phase structure is particularly beneficial for analysing hybrids, especially during the transition between electric and gasoline-powered modes. Hybrid systems, applied in vehicles, such as cars, buses, and vans, are promising technologies for improving energy efficiency, offering an alternative energy source to reduce the environmental impact of fossil fuels and lower emission levels [20,21,22]. As these systems continue to evolve, they are increasingly offered as an optional feature in various vehicle models, highlighting a critical gap in emissions research and the standardisation of testing protocols, as indicated in [15]. The same study compared a vehicle equipped with a serial-hybrid-drive system and one powered by a gasoline engine, focusing on fuel consumption and CO2 emissions during the NEDC (New European Driving Cycle) and WLTC Class 2 cruise cycles. The findings revealed a 3.3% increase in CO2 emissions with the downsized serial-hybrid drive system during the NEDC cycle. However, the opposite effect was observed during the WLTC cycle, where the serial-hybrid vehicle demonstrated a 1.7% reduction in fuel consumption and improved emissions performance.
Further insights into hybrid vehicle testing are provided by Imdat et al. [23], who found that HEVs are more economical than conventional vehicles while producing nearly the same power. The use of thermoelectric elements to recover heat from the exhaust and convert it into electricity also demonstrates potential for improving vehicle efficiency [24]. Compared to conventional gasoline vehicles, HEVs can reduce cold-start extra emissions by 30% to 85% [25], although a significant amount of pollutants is still emitted during the cold-start phase. In a test involving a hybrid hydrogen gasoline-engine-powered passenger car under the NEDC, Changwei et al. found that using hydrogen to start a spark-ignition (SI) engine effectively reduces HC and CO emissions [26]. Compared to WLTC, significantly higher fuel consumption and CO2 emissions during RDE testing have been consistently reported for various vehicle types [27,28]. Furthermore, some studies suggest that hybrid vehicles may emit more particulates, without particle filters, than their conventional counterparts [29].
The shift towards renewable energy sources has become a key component in addressing climate change and reducing reliance on fossil fuels. Among these alternatives, biofuels have garnered significant attention for their potential to lower carbon emissions. Derived from biological materials, biofuels like bioethanol and biodiesel can be used in internal combustion engines either as standalone fuels or blended with traditional gasoline or diesel [30].
Many common liquid fuels (gasoline, diesel, etc.) are made from hydrocarbons that have accumulated in the earth over many years. In contrast, ethanol is produced from renewable bio-based feedstocks. Like other fuels, ethanol produces CO2 when burned in ICE, but in the plant materials used to produce ethanol, this CO2 is converted into organic matter through photosynthesis. Ethanol production recovers about 40% of the organic matter accumulated in vegetation. The production waste is returned to the soil to fertilise it, increasing crop yields and reducing soil erosion. By returning 1% of organic matter back to the soil, each hectare of land recycles 40 t CO2 without releasing it into the atmosphere [31].
Once in the ground, ethanol is rapidly degraded by micro-organisms due to its biological origin, unlike hydrocarbons of mineral origin [32].
The WLTC offers a thorough evaluation of biofuel performance across various driving conditions for biofuel testing. This includes cold-start emissions, which are particularly important for biofuels due to differences in combustion temperatures and the potential for increased emissions during engine warm-up. A review [33] identified biodiesel, hydrotreated vegetable oil (HVO), bioethanol, and biomethane as the most relevant biofuels in Europe. In 2019, the most consumed biofuels in EU28 transport were biodiesel and HVO, accounting for 80.5% of the energy share, followed by bioethanol (18%) and biomethane (1.5%) [34]. Studies [35] have shown that biofuels generally have a lower climate impact compared to diesel and gasoline, with average greenhouse gas emission reductions varying by biofuel type: 70% for biohydrogen, 63% for biomethane, 41% for pure biodiesel, and between 54% and 7% for bioethanol, depending on the blend percentage (100% to 10%). Few studies have specifically examined how different concentrations of ethanol in fuel blends affect exhaust emissions in modern SI engines [36,37] or how ethanol-containing blends influence emissions from modern flex-fuel vehicles (FFVs) [37,38,39]. FFVs are designed to operate with standard gasoline and any ethanol-containing blend (both hydrous and anhydrous). In Europe, FFVs can run on standard gasoline (E5, which contains 5% ethanol) or blends with up to 85% ethanol (E85) during summer or up to 75% (E75) in winter. Modern gasoline vehicles can use blends containing up to 15% ethanol, and studies [39,40,41] suggest that increasing the ethanol content reduces emissions of certain regulated gases like CO, total hydrocarbons (THCs), and CO2. However, there were no significant trends for NOx emissions, and while a higher ethanol content in fuel blends shows promise in reducing regulated emissions and CO2, it also leads to increased formaldehyde and acetaldehyde emissions [39,40,41]. These carbonyl compounds are highly toxic and potentially carcinogenic [42,43], and they contribute to air quality issues as precursors to ozone and peroxyacetyl nitrates (PANs) [44,45]. Given the current trend of increasing the ethanol content in motor fuel blends, it is crucial to study FFV emissions for regulated gases and for unregulated compounds.
Biofuels represent a promising pathway for reducing the environmental impact of transportation, particularly when assessed under realistic driving conditions using the WLTC. Hybrid vehicles integrating electric propulsion with biofuels offer even more significant potential to lower fuel consumption and emissions [46]. However, challenges persist, especially in real-world testing, where emissions and fuel efficiency losses associated with ethanol blends remain concerns. Further research and development are required to optimise engine calibration, refine fuel blends, and enhance hybrid powertrains to harness the advantages of biofuels. The implementation of advanced after-treatment technologies, coupled with improved electric vehicle integration, will be crucial to maximising the environmental benefits of biofuels in both conventional and hybrid vehicles.

2. Materials and Methods
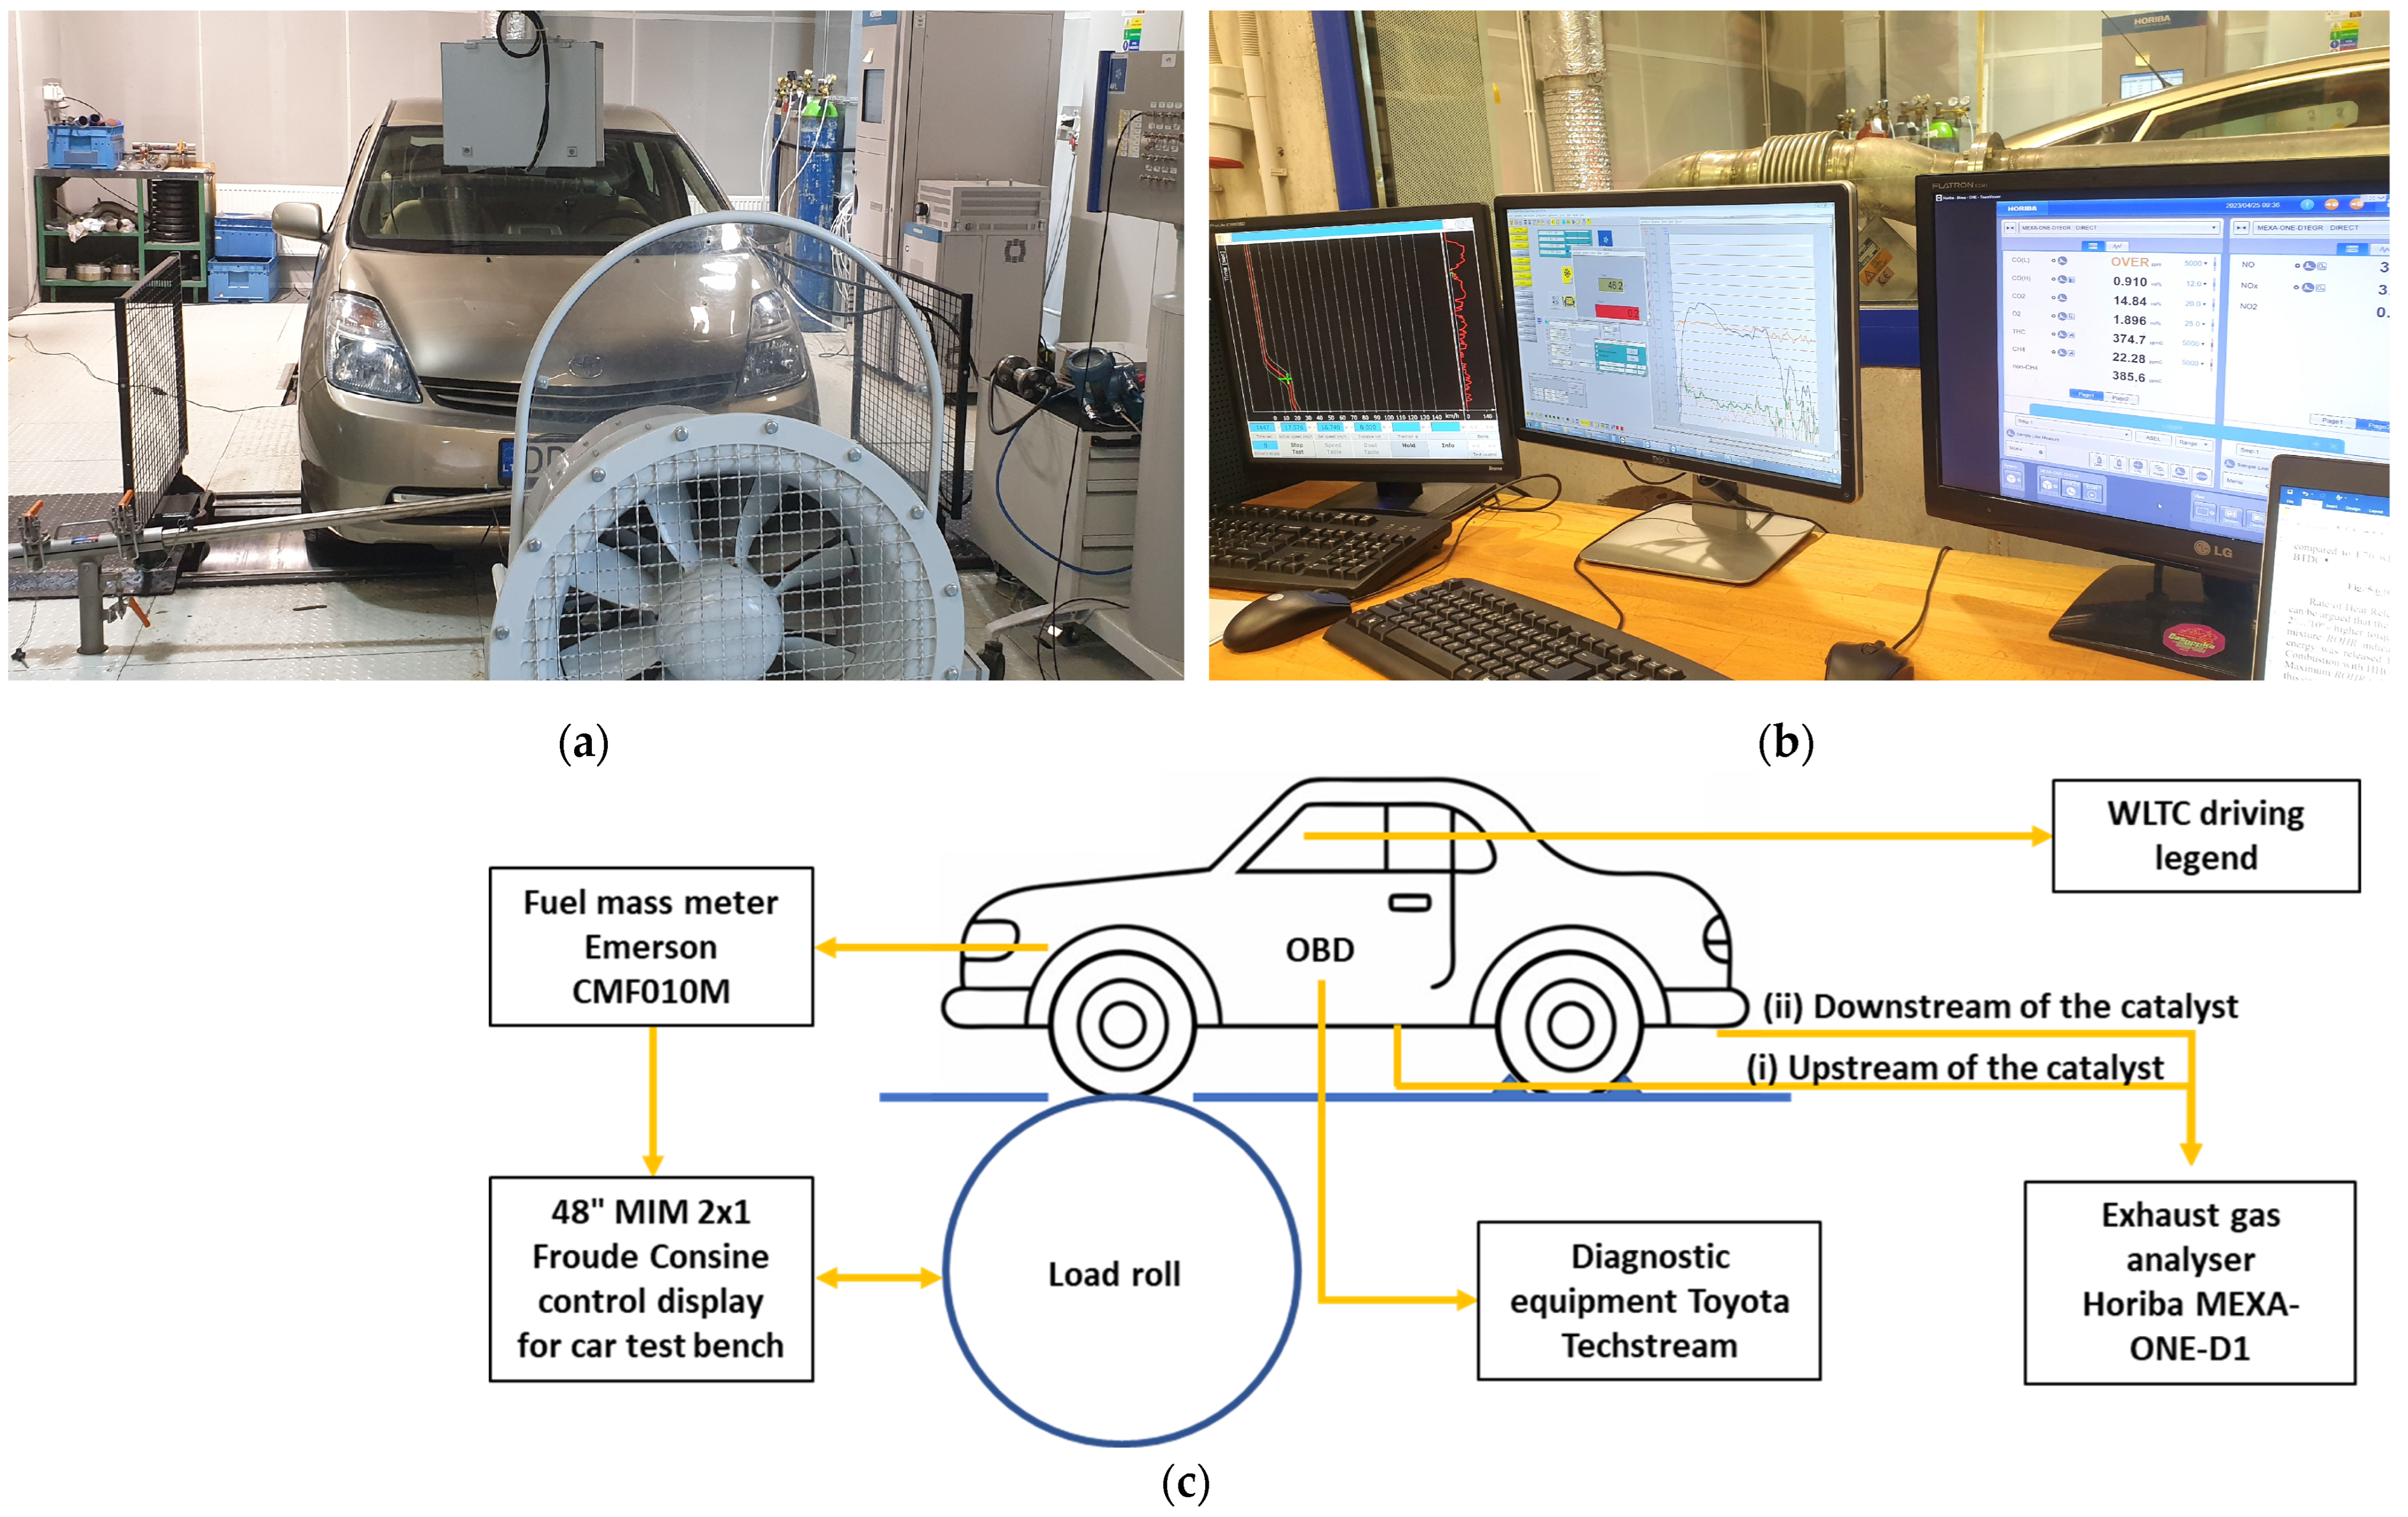
2.1. Test Equipment

During the WLTC test, the Toyota Prius II hybrid car (2005) was used. The main technical characteristics of the vehicle are given in Table 1. The vehicle uses a four-cylinder engine combined with an electric motor to provide smooth and efficient hybrid operation using an electronic continuously variable transmission. The energy-management system, which includes a nickel-metal hydride battery for energy storage as a key element, helps optimise energy consumption and ensure the car’s environmental friendliness. The aerodynamic design, which ensures a relatively low air drag coefficient, also contributes to the car’s energy and environmental efficiency, as well as the following indicators.
At the vehicle test cell, the vehicle was mounted on a 48″ MIM 2 × 1 Froude Consine load bench (Figure 1a). The load bench was maintained at a constant temperature of 18–20 °C using air conditioning. An additional fan was used to cool the internal combustion engine radiator, ensuring adequate airflow and adjusting it according to the vehicle’s speed. The driver maintained the speed indicated in the WLTC guidelines. The load bench generated the load specified by the test standard. An Emerson CMF010M fuel mass meter was installed in series with the engine’s fuel supply line using additional hoses. Toyota Techstream diagnostic equipment, connected to the vehicle’s diagnostic OBD2 connector, recorded the real-time signals from the ECU, such as the ICE load and speed, throttle opening, coolant, and catalytic converter temperatures. The composition of the car’s exhaust gases was measured with a Horiba MEXA-ONE-D1 gas analyser in two stages: in the first stage (i) upstream of the catalytic converter and in the second stage (ii) downstream of the catalytic converter. In the second step, the gas analyser was connected to a tube welded into the exhaust system upstream of the catalytic converter. All data collected during the test were monitored on PCs and recorded in the equipment-control room (Figure 1b). The overall arrangement of the equipment is shown in Figure 1c, and the main technical data are provided in Table 2.

2.2. Fuels

The fuels used in the study included pure gasoline (E0) and blends of gasoline with pure bioethanol (E100) at 10% and 70% by volume (E10 and E70). The main chemical and physical properties of the pure fuels were determined using their quality certificates, while the properties of the blends were calculated based on the weight fractions of their individual components (Table 3).
During the WLTC investigation, the car’s fuel tank was changed. The fuel was removed from the tank using Toyota Techstream (Copyright @1998–2024 Toyota Motor Europe N.V./S.A. (“TME”) Brussels, Belgium) diagnostic equipment, which activated the pump in the tank that supplies fuel to the injectors. After disconnecting the Emerson CMF010M fuel gauge, the removed fuel was pumped out through an additional hose.

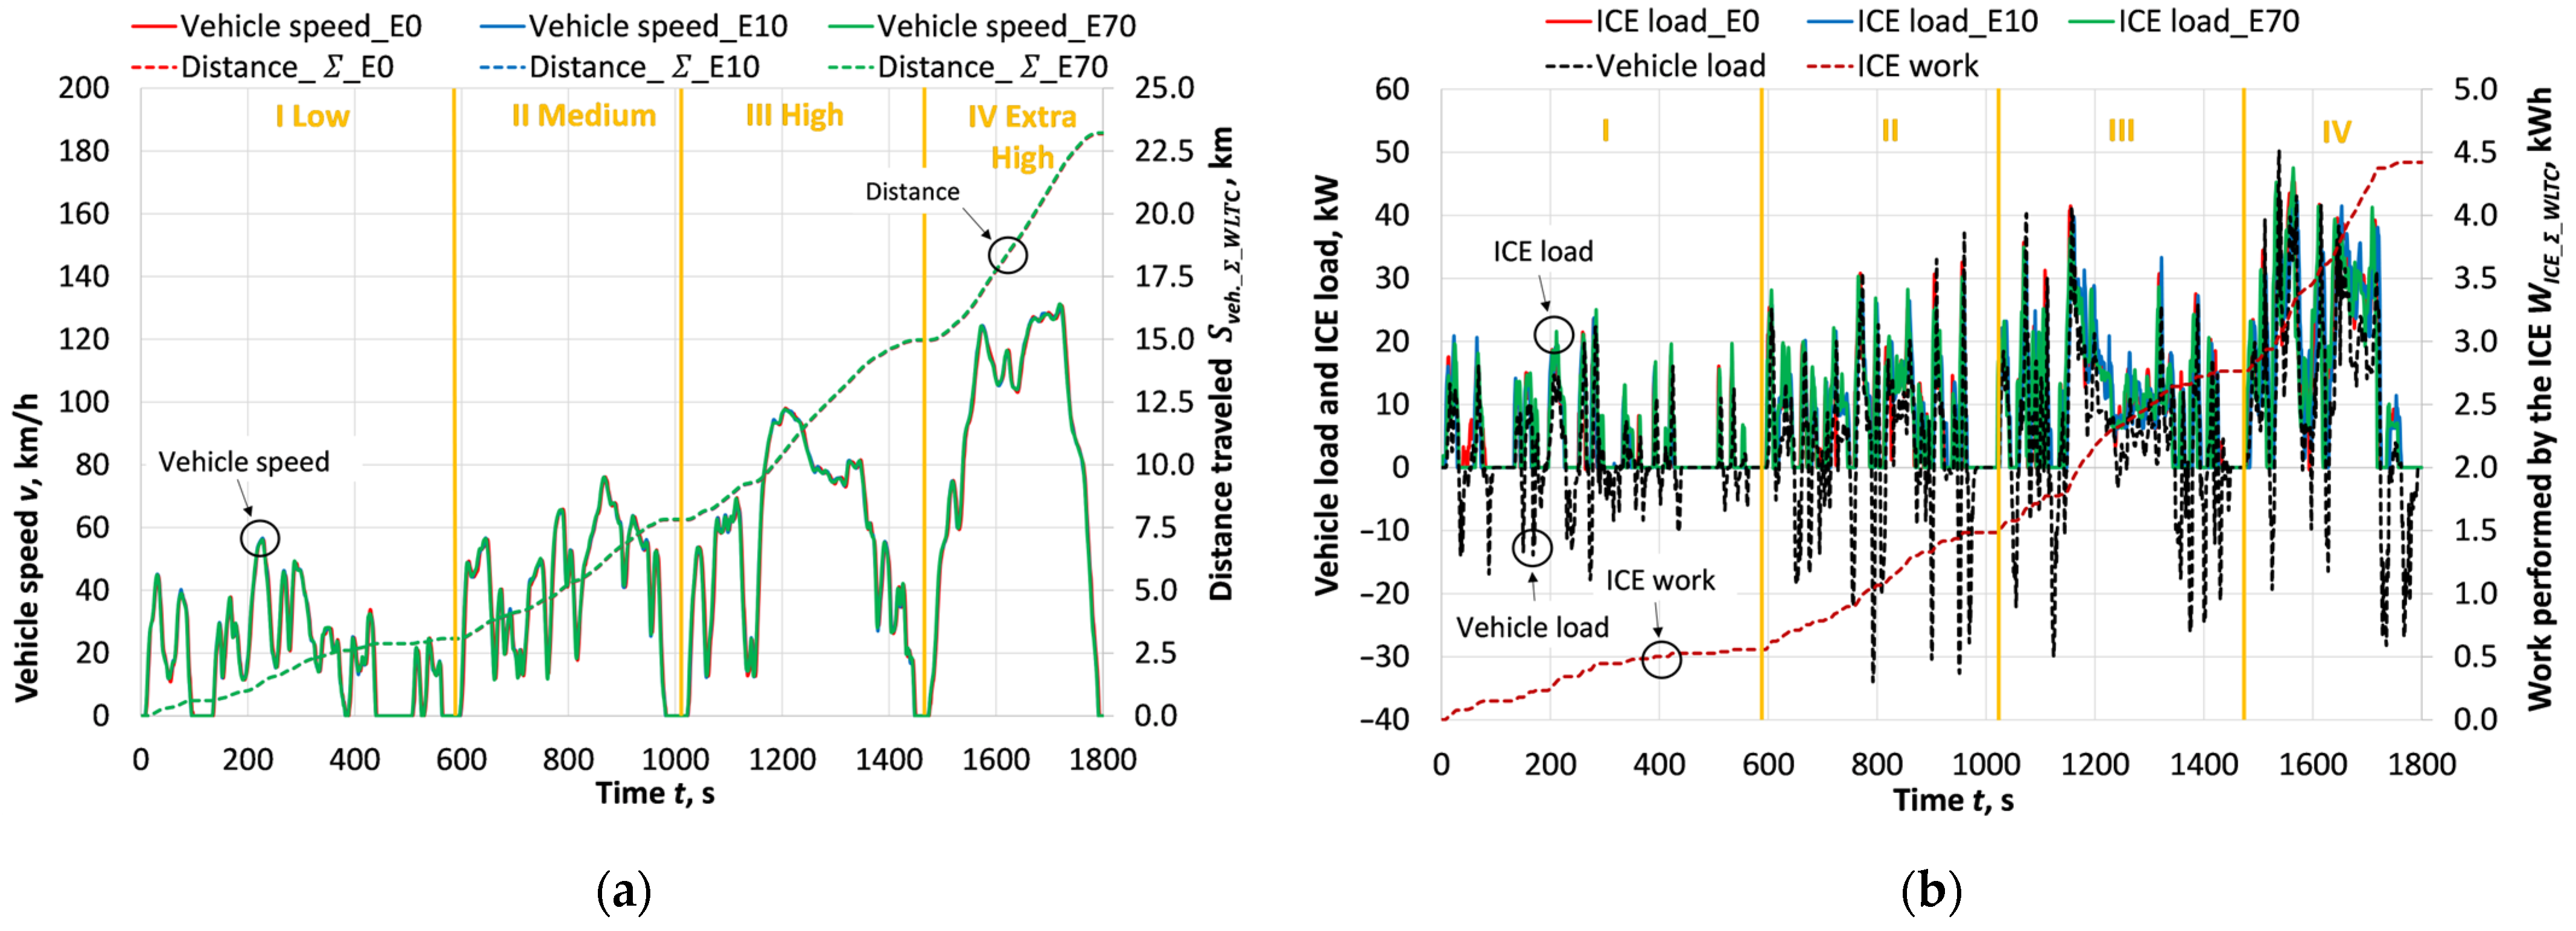
2.3. Description of the WLTC Test

During the test, the vehicle was driven in the same manner in all cases (using the different fuels, E0, E10, and E70). Exhaust gas composition measurements were taken in two steps: before the catalytic converter (i) and after the catalytic converter (ii), at the speed specified by the WLTC (Figure 1). The vehicle speed data were recorded on the load drums of the vehicle load bench. As required by the WLTC test standard, the test run was divided into four phases: Mode I, 589 s at low speed (maximum speed of 56.5 km/h, average speed of 18.9 km/h); Mode II, 433 s at medium speed (maximum speed of 76.6 km/h, average speed of 39.5 km/h); Mode III, 455 s at high speed (maximum speed of 97.4 km/h, average speed of 56.7 km/h); Mode IV, 323 s at very high speed (maximum speed of 131.3 km/h, average speed of 92 km/h) [50,51]. For all WLTC test cases, the vehicle’s mileage increased consistently over the 1800 s test period. After completing the four driving modes, a total distance of S v e c h . _ Σ _ W L T C 23.22 km was covered (Figure 2a).

2.4. Methodology for Calculating Energy Performance and Emissions in the WLTC Cycle

This study’s aim was to evaluate a vehicle’s energy and environmental performance using different fuel blends. This evaluation was based on various indicators recorded by multiple measuring devices during the tests. During the WLTC test cycle, different devices collected data at varying frequencies. Vehicle load bench data, including the speed, acceleration, load, and fuel consumption, were recorded at a rate of 10 times per second (f = 10 Hz). Exhaust gas concentrations (O2, CO2, CO, HC, NOx) were recorded once per second (f = 1 Hz). In contrast, data from the ECU were recorded at a much higher frequency of 58 Hz (f = 58 Hz).
To ensure consistent analysis, all data needed to calculate energy and emissions were aligned to the same frequency. Therefore, all data recorded at frequencies greater than 1 Hz were converted, in Microsoft Excel, to an average over a one-second interval for the entire 30 min (1800 s) WLTC cycle.
After processing the WLTC test data as described, the data were synchronised to align the vehicle speed, ICE performance parameters, and emissions over time. This synchronisation was necessary because the data streams from various measuring devices extended over a period longer than 1800 s, and some data, such as those from the gas analysers, were delayed due to the specific characteristics of their operation. The vehicle and engine data indicated that the vehicle remained stationary for the first 9 s of the test cycle, and the engine was not running. Consequently, the gas analyser data were adjusted and aligned so that the recorded increases in pollutant concentrations corresponded to the engine’s operation, beginning on the same row in Excel, creating a continuous 1800 s data stream. Once the data were synchronised at the start of the study, the end of the study was reviewed, revealing that emissions and CO2 concentrations dropped sharply when the engine ceased running. This synchronisation of the WLTC test data is critical for accurately calculating the vehicle’s energy performance and emissions.
The distance travelled by the vehicle during the WLTC cycle was calculated by accounting for the vehicle’s speed recorded at one-second intervals v v e h . n (km/h):
S v e h . _ Σ _ W L T C = n = 1800 1 v v e h . n / 3600 , k m .
Using the fuel mass gauge data B f m n (kg/h), recorded at one-second intervals, the fuel mass consumption for each WLTC cycle was calculated:
B f m _ Σ _ W L T C = n = 1800 1 B f m n / 3600 ,   k g .
The work of the ICE during the WLTC cycle was calculated by considering the engine’s brake power recorded at one-second intervals P B n (kW):
W I C E _ Σ _ W L T C = n = 1800 1 P B n / 3600 , k W · h .
The brake-specific fuel consumption per cycle was calculated based on the fuel mass consumed and the work performed during the WLTC cycle:
B S F C _ W L T C = B f m _ Σ _ W L T C · 1000 W I C E _ Σ _ W L T C , g / k W · h .
The ICE brake thermal efficiency per driving cycle for various fuels was calculated by evaluating the brake-specific fuel consumption and the lower heating value (LHV) of the fuel, (MJ/kg):
B T E _ W L T C = 3600 B S F C _ W L T C · L H V .
The mass emissions (g) per unit time (s) of individual compounds emitted by the engine were calculated to provide an objective assessment of emissions. This calculation was based on the pollutant concentrations measured by the exhaust gas analyser, the physical properties of the individual compounds, and data from the ECU regarding fuel and air consumption.
Carbon monoxide emissions:
E C O = C O · M C O · m e x . 1000 · M e x . · 3600 , g / s ;
where C O —concentration of carbon monoxide in exhaust gases, ppm; M C O —molar mass of carbon monoxide, M C O = 28.01 g/mol; m e x . —mass emissions of engine exhaust:
m e x . = B f m + B a i r m ,   k g / h ;
where B f m —fuel mass consumption as measured by a fuel mass meter, kg/h; B a i r m —air mass consumption as determined by the engine control unit, kg/h.
The molar mass of the engine exhaust gas was calculated by accounting for the molar masses of the individual exhaust gas components and their respective concentrations in the exhaust gases:
M e x . = M C O · C O 10000 · 100 + M H C · C H 10000 · 100 + M N O x · N O x 10000 · 100 + M C O 2 · C O 2 100 + M O 2 · O 2 100 + M N 2 · N 2 100 + M H 2 O · H 2 O 100 ,   g / m o l ;
where M C O —molar mass of carbon monoxide, M C O = 28.01 g/mol; C O —concentration of carbon monoxide in exhaust gases, ppm; M C H —the molar mass of unburned hydrocarbons, M H C = 42.5 g/mol;   H C —concentration of unburned hydrocarbons in the exhaust gases, ppm; M N O x —molar mass of nitrogen oxides, M N O x = 30.01 g/mol; N O x —concentration of nitrogen oxides in exhaust gases, ppm; M C O 2 —the molar mass of carbon dioxide, M C O 2 = 44.01 g/mol; C O 2 —the concentration of carbon dioxide in the exhaust gases, %; M O 2 —molar mass of oxygen, M O 2 = 31.998 g/mol; O 2 —oxygen concentration in the exhaust gas, %; M N 2 —molar mass of nitrogen, M N 2 = 28.014 g/mol; N 2 —concentration of nitrogen in the exhaust gases, %; M H 2 O —molar mass of water, M H 2 O = 18.015 g/mol; H 2 O —concentration of water vapor in the exhaust gases, %.
Unburnt hydrocarbon emissions:
E H C = H C · M H C · m e x . 1000 · M e x . · 3600 ,   g / s .
Nitrogen oxide emissions:
E N O x = N O x · M N O x · m e x . 1000 · M e x . · 3600 , g / s .
Carbon dioxide emissions:
E C O 2 = C O 2 · 10 · M C O 2 · m e x . M e x . · 3600 , g / s .
The above formulas were used to calculate the emissions of individual exhaust gas components for each second of the WLTC cycle. The accumulated mass of each pollutant during the WLTC cycle was determined in Microsoft Excel by progressively summing the emissions (g/s) from the first second of testing to the final second (1800 s). This approach enables the calculation of cumulative mass emissions of individual pollutants for different test fuels, both in specific modes and over the entire test cycle.
Total mass emissions of carbon monoxide during the WLTC cycle:
E C O _ Σ _ W L T C = n = 1800 1 E C O n , g .
Total mass emissions of unburned hydrocarbons during a WLTC cycle:
E H C _ Σ _ W L T C = n = 1800 1 E H C n , g .
Total mass emissions of nitrogen oxides during the WLTC cycle:
E N O x _ Σ _ W L T C = n = 1800 1 E N O x n , g .
Total mass emissions of carbon dioxide during the WLTC cycle:
E C O 2 _ Σ _ W L T C = n = 1800 1 E C O 2 n , g .
The EU standard provides specific emissions (CO, HC, NOx) and CO2 emissions during the WLTC test cycle based on the mass emissions of the individual pollutants and the distance travelled. Specific emissions of carbon monoxide over the WLTC test cycle:
E C O _ W L T C = E C O _ Σ _ W L T C S v e c h . _ Σ _ W L T C , g / k m .
Specific emissions of unburned hydrocarbons over the WLTC test cycle:
E C H _ W L T C = E H C _ Σ _ W L T C S v e c h . _ Σ _ W L T C , g / k m .
Specific emissions of nitrogen oxides over the WLTC test cycle:
E N O x _ W L T C = E N O x _ Σ _ W L T C S v e c h . _ Σ _ W L T C , g / k m .
Specific emissions of carbon dioxide over the WLTC test cycle:
E C O 2 _ W L T C = E C O 2 _ Σ _ W L T C S v e c h . _ Σ _ W L T C , g / k m .
The study measured exhaust gas concentrations in two stages: upstream (i) and downstream (ii) of the catalytic converter, using the same methodology as described above for data synchronisation and emission calculations.

3. WLTC-Based Analysis of Study Results

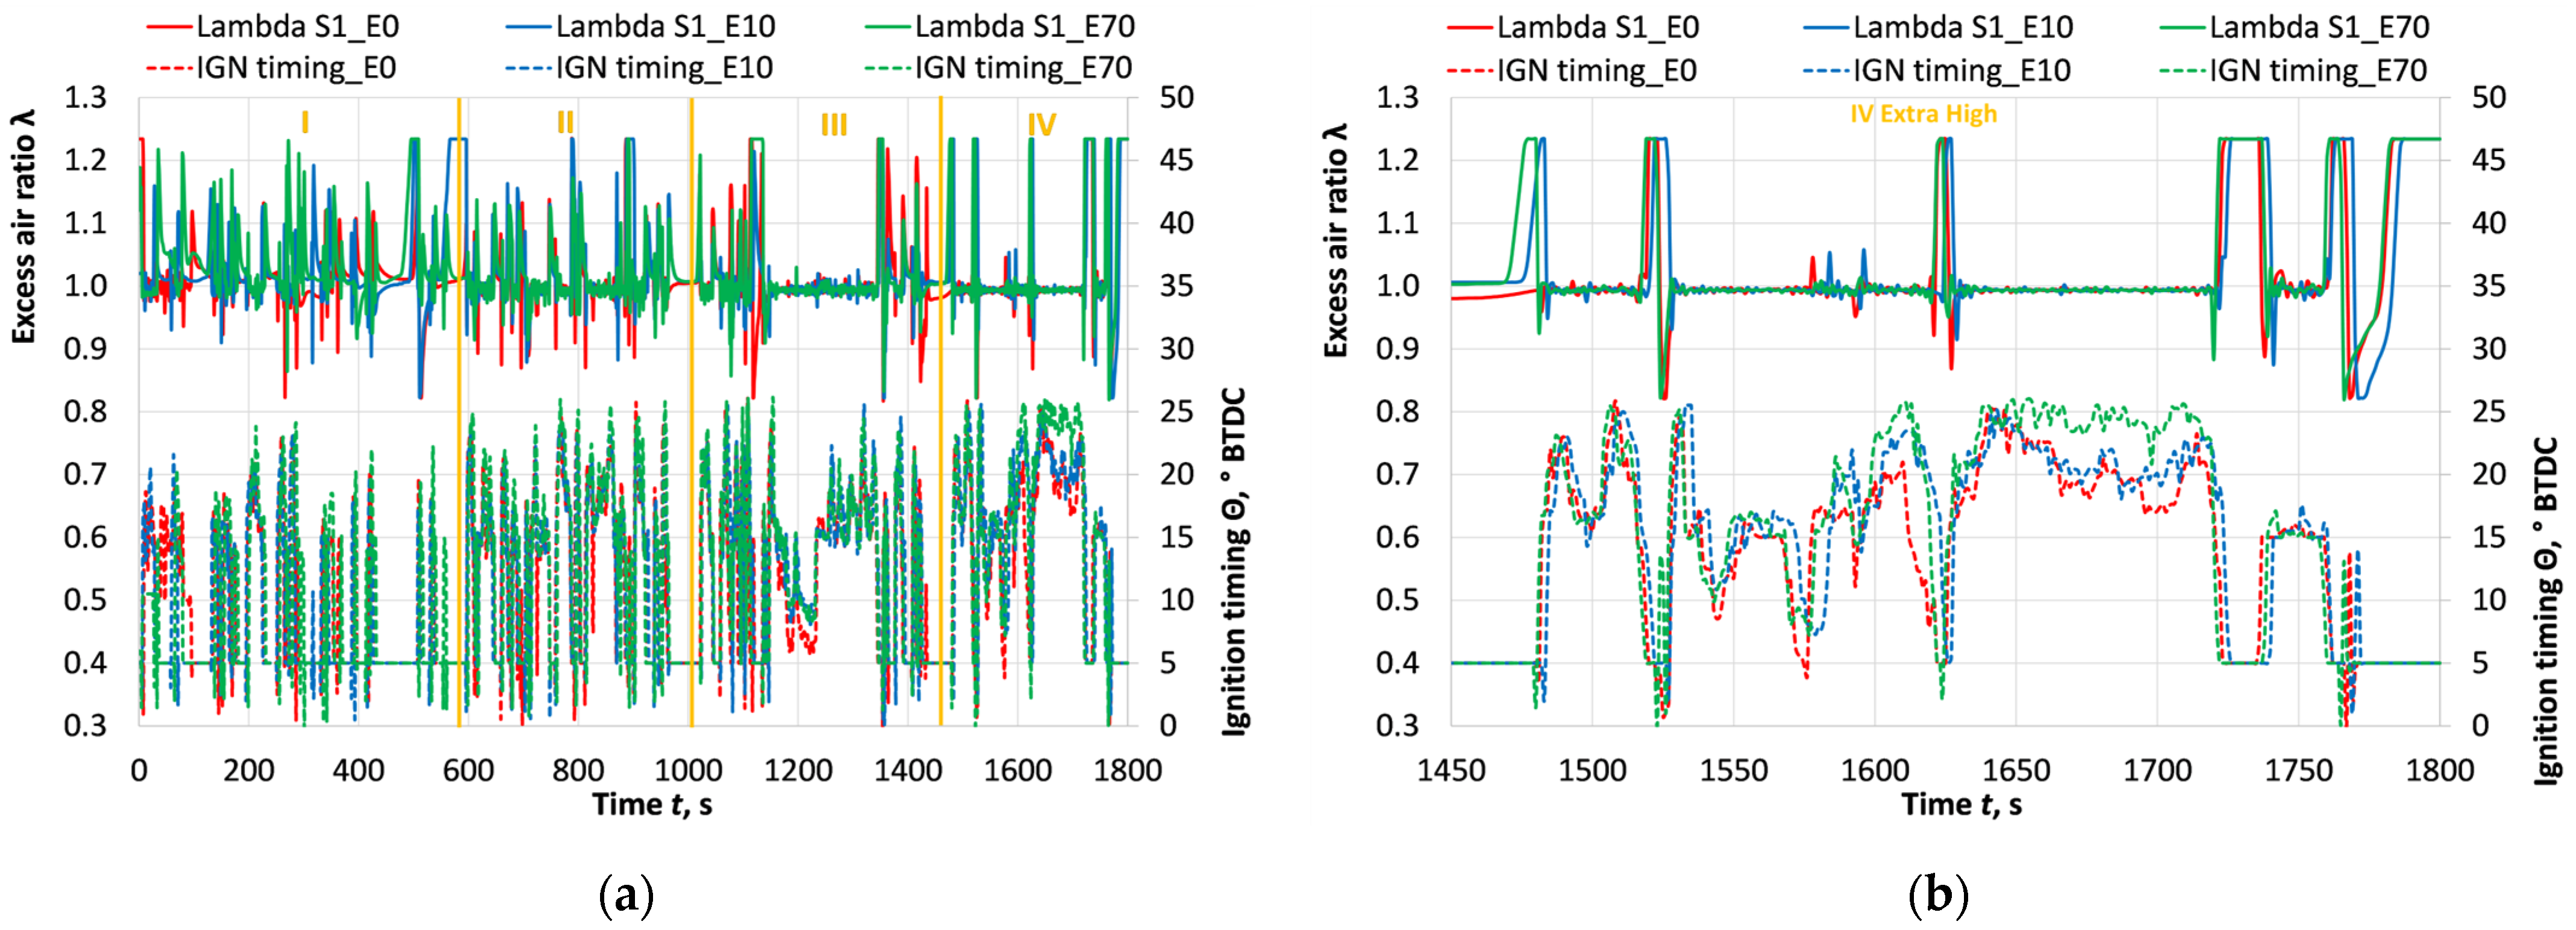
3.1. Energy Performance

Analysing the vehicle load data (obtained from the load bench, Figure 2b) and the internal combustion engine load data (derived from the ICE ECU, Figure 2b), it is observed that the main trends in the vehicle and ICE loads are consistent across all driving scenarios (using fuels E0, E10, and E70). However, there is a slight difference in the maximum loads experienced by the ICE. These load differences are attributable to the specific operation of the hybrid drive’s electric motor-generators. At higher battery charge levels, the electric motor generates more of the torque required to drive the vehicle, thereby reducing the load on the internal combustion engine. Conversely, when the battery is discharged, the load on the internal combustion engine increases, as its energy is used to propel the vehicle and to power the alternator and recharge the battery. This is corroborated by the graphs, which indicate that the load on the ICE is lower than the vehicle load during acceleration, while it is higher during low-speed, steady driving (Figure 2b). During braking (under negative load conditions), some kinetic energy is recuperated and converted into electricity to recharge the batteries. The observed instantaneous variations in ICE load during the same test phase when using different fuels do not significantly affect the overall WLTC test results. This is because the battery is quickly recharged under optimal conditions, and its energy is immediately utilised to assist in vehicle propulsion. During a test cycle, the battery undergoes multiple charge–discharge cycles that do not occur simultaneously. The uniform energy demand on the engine is evidenced by the calculated work performed by the ICE per WLTC cycle, which was consistent across all test cases, W I C E _ Σ _ W L T C ≈ 4.412 kWh, or the average distance travelled per 1 km 0.190 kW·h ICE energy.
The engine’s power output is regulated by adjusting the air–fuel mixture via the throttle. Depending on the power demand of the ICE, the throttle opening varies, influencing the intake air–fuel ratio and engine speed (Figure 3a). The graphs indicate that, when testing with different fuel mixtures, the throttle position and engine speed vary across certain modes and are significantly affected by the operation of the hybrid electric motor, as previously described. The average throttle opening during the WLTC cycle was calculated, revealing that using E10 and E70 fuel blends, compared to E0, resulted in a slight reduction in throttle opening. This reduction is attributed to the oxygen content in these fuels, which requires less air for combustion.
At the start of the WLTC tests, the engine was preheated, and the coolant temperature was 85 °C in all cases (Figure 3b). During testing, the engine-temperature-control system maintained the coolant temperature within a range of 87–99 °C, depending on the engine load and the cooling intensity regulated by the thermostat and the ECU. The exhaust gas temperature upstream of the catalytic converter at the start of the tests ranged from 249 °C to 286 °C, while downstream of the catalytic converter, it ranged from 230 °C to 274 °C (Figure 3b). As the vehicle speed and engine load increased in the low-speed mode (I), the exhaust gas temperature rose to approximately 600 °C upstream of the catalytic converter and around 400 °C downstream. However, the exhaust gas temperatures of the fuel blends E10 and E70 upstream of the catalytic converter were lower than those of pure gasoline (E0). Due to its greater latent vaporisation heat, the higher bioethanol concentration in the blends reduces the intake temperature, leading to lower combustion and exhaust temperatures [38]. Additionally, the increased thermal efficiency of these blends contributes to a reduction in the exhaust temperature.
The ignition timing, controlled by the engine’s ECU according to a predefined algorithm, significantly increases thermal efficiency and reduces the exhaust gas temperature. Bioethanol’s higher resistance to knocking [36] allows the ECU to advance the ignition timing based on the signal from the knock sensor (Figure 4a), thereby lowering the exhaust gas temperature. In medium- and high-speed driving modes (II and III), exhaust gas temperatures increase and become similar across all tested fuels (E0, E10, and E70), likely due to a greater amount of exhaust energy being utilised for engine cooling and the cooling intensity being adjusted in response to the engine temperature. As engine loads increase, the exhaust gas temperatures upstream and downstream of the catalytic converter rise, reaching maximum values of approximately 800 °C and 620 °C, respectively. During the WLTC driving test, the engine load is periodically increased, reduced, or stopped. In hybrid driving, WLTC stop periods are more frequent and extended than in conventional driving, as at low loads, when the battery is sufficiently charged, some or all of the required power is provided by the electric motors. During engine braking periods, the exhaust gas temperatures upstream and downstream of the catalytic converter drop to around 460 °C and 350 °C, respectively, in low-speed mode (I), and to approximately 550 °C and 440 °C, respectively, in high-speed modes (III and IV).
Two main engine control parameters—excess air ratio and ignition timing—were recorded using data from the engine’s ECU. The powertrain system of the test vehicle is designed to maintain an air–fuel mixture close to stoichiometric across a wide range of engine operating conditions. At higher power demands, the throttle opens wider to allow more air intake, while the fuel injectors remain open longer to increase fuel delivery. The composition of the air–fuel mixture is monitored and adjusted by the lambda (λ) control system, which uses a wideband oxygen sensor to measure the O2 concentration in the exhaust gases. This system adjusts the fuel injection rate to maintain an oxygen concentration of 0.5 to 0.6% in the exhaust gas upstream of the catalytic converter over a broad range of operating conditions. The data from the full WLTC 1800 s test and the extended Mode IV (very high speed, 1450–1800 s) (Figure 4b) demonstrate that the ECU maintained an excess air ratio of λ = 1.0 (stoichiometric mixture) over most of the test range. However, during engine startup, the mixture was slightly richened (λ ranged from 0.85 to 0.95), and at reduced loads, the mixture was leaned (λ reached up to 1.23) before engine braking. The average excess air ratio during the WLTC cycle was calculated as λ = 1.012 for E0 fuel. The excess air ratio for E10 and E70 fuels increased by approximately 0.8% and 1.3%, respectively. This increase in excess air with E10 and E70 is corroborated by a slight rise in the O2 concentration measured by the exhaust gas analyser. Although the lambda control system aims to maintain a stoichiometric mixture, the increase in O2 concentration indicates that the air–fuel mixture becomes slightly leaner. The engine ECU controls the ignition timing (Θ) and the excess air ratio, with feedback from the knock sensor. Analysing the graphs depicting the variation in ignition timing over the WLTC cycle and at high speeds (Figure 4b), we observe that for all fuels, at startup, the ignition timing is set to Θ = 5° before the top dead centre (BTDC). As the vehicle speed increases to its maximum during the WLTC cycle, the engine speed rises to 3000–4000 rpm (Figure 3a), and the load reaches 30–40 kW (Figure 2b). Under these conditions, the engine operates with the following ignition timings: Θ ≈ 19° BTDC for E0, Θ ≈ 21° BTDC (advanced by ~2°) for E10, and Θ ≈ 25° BTDC (advanced by ~6°) for E70. It is estimated that, over the entire cycle, switching from E0 to E10 and E70 fuels results in an ignition timing advance of approximately 0.8% and 4.3%, respectively. This adjustment in ignition timing by the ECU is attributed to the increased resistance to knocking provided by bioethanol, which enhances the engine’s thermal efficiency.
For all WLTC test cases, the vehicle mileage increased consistently over the 1800-second test period, with a total distance of S v e h . _ Σ _ W L T C   23.22 k m covered after completing the four driving modes (Figure 1b). The trends in instantaneous fuel mass consumption ( B f m ) over the driving cycle for E0, E10, and E70 were similar, though the absolute values differed (Figure 4a). The data indicate that the total fuel consumption of E10 ( B f m _ Σ _ W L T C ) increased at a slower rate during low- and medium-speed modes but accelerated more rapidly during high- and very-high-speed modes, reaching levels comparable to E0 (Figure 4b). This suggests that E10 exhibits higher thermal efficiency at lower loads, as evidenced by the lower exhaust gas temperatures (Figure 3b), while it does not provide an energy advantage at higher speeds. The total fuel mass consumption, B f m _ Σ _ W L T C , during engine operation was 1.054 kg with E0, 1.055 kg with E10 (an increase of 0.1%), and 1.308 kg with E70 (an increase of 23.9%). The higher mass consumption of E70 fuel over the test cycle, compared to E0, is attributed to the reduced net calorific value associated with the 70% bioethanol concentration. Mass consumption, fuel density, and distance travelled were used to calculate the volumetric fuel consumption per 100 km. During the WLTC cycle, E0 consumed 6.08 L/100 km, E10 consumed 6.03 L/100 km (a decrease of approximately 0.8%), and E70 consumed 7.24 L/100 km (an increase of approximately 19.1%). The use of fuels with low ethanol concentrations (up to 10%) led to approximately 20% higher fuel consumption compared to the vehicle’s technical specifications (Table 1). This discrepancy could be due to two primary factors. Firstly, the vehicle specifications were based on the New European Driving Cycle (NEDC), an older testing methodology. Secondly, the tested Toyota Prius II had a mileage of 200,000 km.
The brake specific fuel consumption per cycle ( B S F C _ W L T C ) was calculated by considering the fuel mass consumption and the work performed: E0—238.9 g/(kW·h); E10 —239.1 g/(kW·h) (an increase of approximately 0.1%); E70—296.5 g/(kW·h) (an increase of approximately 23.9%). The evaluation of BSFC, along with the LHV of the fuel, yielded the brake thermal efficiency per WLTC ( B T E _ W L T C ) for the ICE as follows: E0—0.346; E10—0.356 (an increase of approximately 2.8%); E70—0.376 (an increase of approximately 9.0%). Increasing the bioethanol concentration in the fuel blend from 0% to 10% and 70% led to an increase in the BTE, as the lower calorific value of the fuel decreased more significantly (by 3.8% and 25.7%, respectively) than the corresponding increase in effective fuel consumption (approximately 0.1% and 23.9%, respectively). The rise in efficiency with an increasing bioethanol concentration can be attributed to the advancement of ignition timing, as the engine-control system adjusted for the higher resistance of the fuel to knocking. However, excessively advanced ignition timing Θ can also reduce η e by increasing the fraction of combustion energy dissipated through the cooling system. In this case, a higher bioethanol concentration in the fuel helps mitigate cooling losses by lowering the intake, compression, and combustion temperatures.
Instantaneous air mass consumption (Figure 5b) correlates with throttle opening and engine speed (Figure 3a). The highest total air consumption during the WLTC test was observed with E0 fuel at 14.717 kg (Figure 5b). Air consumption with E10 fuel was 14.471 kg (approximately 1.67% lower), while E70 fuel resulted in 14.494 kg (approximately 1.52% lower). Theoretically, a stoichiometric mixture requires 14.70 kg of air per kilogram of E0 fuel, 14.10 kg of air per kilogram of E10 (4.1% less), and 10.65 kg of air per kilogram of E70 (27.6% less). The observed reduction in air intake mass was less than the theoretical amount per kilogram of fuel because the mass of E10 and E70 fuel consumed was ~0.1% and ~23.9% higher, respectively, due to their lower net calorific values than E0. Additionally, the ~9% increase in B T E _ W L T C resulting from a 70% bioethanol concentration in the fuel blend also contributed significantly to the observed differences; parallel trends have been noted in other research [38].

3.2. Ecological Parameters

Internal combustion engines emit around 200 chemical compounds, many harmful to humans and the environment. The WLTC study measured and assessed emissions regulated by the European Union’s emission regulations. The study analyses emissions of CO, HC, NOx, and CO2. The main aspects of the harmful effects of these chemical compounds are as follows: CO has direct toxic effects on humans through the inhalation of air containing even low concentrations of this gas and can cause death at higher concentrations; HC causes respiratory and ocular mucosal irritation, affects the nervous system, and can lead to oncological diseases; NOx is toxic via direct inhalation, can cause oncological diseases with prolonged exposure, contributes to the formation of smog and acid rain, and depletes the tropospheric ozone layer; CO2, at higher concentrations, impairs human well-being and is a major contributor to the greenhouse effect. CO and HC are products of incomplete fuel combustion and exhibit similar trends with changes in fuel composition. In the first test phase (i), the CO concentration measured before the catalytic converter (Figure 6a) showed that the average CO level decreased by approximately 6.0% and 7.5% during the WLTC cycle following the transition from E0 to E10 and E70, respectively. Based on the mass and properties of the exhaust components, it is estimated that the engine running on pure gasoline (E0) emitted around 80.9 g of CO over the test cycle ( E C O _ Σ _ W L T C ) before the catalytic converter (Figure 6a), corresponding to a specific emission of approximately 3.49 g/km. When the engine operated on E10 and E70 fuels, there was a slight difference in total CO emissions during the WLTC cycle, with both fuels producing around 65.6 g of CO, resulting in a specific emission of 2.83 g/km—approximately 19% lower compared to E0; similar trends have been found in other studies [41]. The change in pollutant emissions does not always correspond directly to the change in the pollutant concentration when altering the bioethanol content in the fuel mixture. This discrepancy arises because total pollutant emissions over the test cycle are determined by summing the calculated emissions for each second of the test. The result is influenced not only by the concentration of the pollutant but also by the mass of the exhaust gases and other factors. The catalytic converter further oxidised incomplete combustion products, resulting in a reduction of the CO concentration downstream (measurement step ii) by approximately 170 times (Figure 6b). The WLTC CO emission using E0 fuel was approximately 0.47 g (Figure 6b), with a benchmark emission of 0.020 g/km. Switching the fuel from E0 to E10 and E70 resulted in further reductions of approximately 25% and 28%, respectively, in the specific emissions E C O _ W L T C to 0.015 g/km and 0.014 g/km.
The Toyota Prius II, under the test, is required to comply with the Euro 4 emissions standard, which mandates that CO emissions remain below 1.0 g/km. With E0 fuel, the CO emissions were reduced by approximately 50 times due to the efficiency of the catalytic converter. The addition of bioethanol further reduces CO emissions significantly, attributed to the lower carbon-to-hydrogen (C/H) ratio, improved combustion from the increased oxidant (O2) concentration, and advanced ignition timing. The latter increases the combustion temperature by occurring in a smaller volume, contributing to reduced brake-specific fuel consumption. However, it is observed that at the beginning of the test cycle, in low-speed mode (I), the engine running on E10 fuel produced lower carbon monoxide emissions than when running on E70 fuel. This is because the higher bioethanol concentration in E70 fuel reduced the exhaust gas and catalytic converter temperatures in this mode (Figure 3b).
HC emissions are primarily caused by the uneven mixing of fuel and air and through flame front quenching in various regions of the combustion chamber. Bioethanol increases the oxygen content during combustion, enhancing the combustion process and reducing the emission of incomplete combustion products. The average concentration of unburned hydrocarbons during the WLTC, measured before the catalytic converter (test phase i), decreased by approximately 8% and 21% when E0 was replaced with E10 and E70, respectively (Figure 7a). Other studies have observed similar trends [36]. When the engine was running on pure gasoline (E0) before the catalytic converter, the HC emissions over the test cycle ( E H C _ Σ _ W L T C ) were calculated to be approximately 2.95 g (Figure 7a), with specific emissions E H C _ W L T C of around 0.127 g/km. When the engine was fueled with E10 and E70, the cumulative WLTC HC emissions were 2.44 g and 2.14 g, respectively, with specific emissions of 0.105 g/km and 0.092 g/km, representing reductions of approximately 17% and 27% compared to E0. Downstream of the catalytic converter (measurement step ii), the HC concentration was reduced by approximately 80 times (Figure 7b). The WLTC HC emission with E0 was approximately 0.037 g (Figure 7b), with a specific emission of 0.0016 g/km. Switching from E0 to E10 and E70 resulted in additional reductions of approximately 12% and 15% in the specific emissions of E H C _ W L T C downstream of the catalytic converter, to 0.0014 g/km and 0.00139 g/km, respectively.
The Euro 4 emission standard requires HC emissions below 0.1 g/km. E0 fuels have been found to produce HC emissions approximately 60 times lower than this limit when measured behind an efficient catalytic converter, and the addition of bioethanol further reduces these emissions. A more detailed analysis of the first stage of the test (i) shows peaks of increased HC concentrations when the engine is running on E70 fuel. These peaks are likely associated with the advanced ignition timing enabled by the higher knock resistance of bioethanol. Early combustion can lead to increased HC emissions because ignition occurs before the fuel/air mixture is fully homogenised. In the second test phase (ii), pollutants measured downstream of the catalytic converter in low-speed mode (I) show higher HC concentration peaks with E70 fuel. This correlates with increased CO concentrations in the same mode, likely due to reduced exhaust and catalytic converter temperatures. However, these peaks in HC and CO concentrations are transient. The role of bioethanol in improving the quality of fuel mixture preparation and combustion is confirmed by the overall reduction in total HC and CO emissions.
NOx is formed as a by-product of the combustion process, and its emissions increase significantly when the engine is operated at higher loads and combustion temperatures. Bioethanol has a significantly higher latent vaporisation heat than pure gasoline, which can reduce the temperature of the intake air/fuel mixture. Increasing the bioethanol concentration results in a cooler fuel mixture during the compression stroke, lowering the combustion temperature. This reduction in the combustion temperature directly impacts the formation of NOx compounds. The average concentration of nitrogen oxides measured during the WLTC test before the catalytic converter (test phase i) decreased by approximately 13% when E0 fuel was replaced with E70 (Figure 8a). When the engine was running on pure gasoline (E0) before the catalytic converter, total NOx emissions over the test cycle ( E N O x _ Σ _ W L T C ) were calculated to be approximately 41.8 g (Figure 8a), with specific emissions ( E N O x _ W L T C ) of about 1.80 g/km. When using E10 and E70, total NOx emissions during the WLTC cycle were 31.6 g and 29.0 g, respectively, with specific emissions of 1.36 g/km and 1.25 g/km, representing reductions of approximately 24% and 30% compared to E0. The catalytic converter reduced NOx emissions by approximately 74 times (Figure 8b). Total NOx emissions with E0 after the catalytic converter E N O x _ Σ _ W L T C were approximately 0.57 g (Figure 8b), with specific emissions E N O x _ W L T C of about 0.024 g/km. Increasing the bioethanol concentration to 10% and 70% resulted in further reductions of approximately 16% and 21% in specific NOx emissions downstream of the catalytic converter, to 0.021 g/km and 0.019 g/km, respectively.
A more detailed analysis of the first test run measuring NOx emissions upstream of the catalytic converter (i) indicates that the highest NOx emissions were produced with E0 fuel, while E70 and E10 exhibited the lowest emissions in different driving modes; different studies have found that NOx emissions increase, especially in hybrid vehicles, when regular gasoline is used [6]. In low-speed mode (I), NOx emissions were lower with the E10 blend compared to E70. This can be attributed to the greater ignition timing advance with E70, which, at lower engine speeds, leads to a more significant increase in the combustion temperature due to slower combustion chamber expansion. As the vehicle speed and engine load increased in modes II, III, and IV, NOx emissions were minimised with E70 fuel. In the second test step, NOx emissions measured downstream of the catalytic converter (ii) were significantly reduced due to catalytic reduction processes E N O x _ Σ _ W L T C . The lowest NOx emissions in driving modes I and II were observed with E0, while E10 and E70 exhibited higher emissions. In mode III, NOx emissions with E10 were notably higher, whereas, in the very high-speed mode (IV), the lowest NOx emissions were recorded with E70, while the highest was with E0. The higher NOx emissions downstream of the catalytic converter in the initial WLTC modes with E70 are linked to increased emissions upstream of the catalytic converter and the lower catalytic converter temperature, caused by the reduced exhaust gas temperature. The lower NOx peaks seen with E70 in modes III and IV, compared to E0 and E10, are attributed to bioethanol’s ability to lower combustion chamber temperatures. The Euro 4 emission standard limits NOx emissions to 0.08 g/km. The catalytic converter performance with E0 fuel resulted in emissions approximately 3.3 times lower than this limit, E N O x _ W L T C , and the addition of 10% and 70% bioethanol further reduced emissions to 3.8 and 4.2 times lower, respectively. Reducing NOx emissions has a significant impact not only on improving air quality but also on mitigating greenhouse gas emissions.
CO2 is a product of the complete combustion of carbon and depends primarily on fuel consumption [6], the fuel’s carbon-to-hydrogen (C/H) ratio, and combustion quality. The average CO2 concentration during the WLTC, measured before the catalytic converter (i), decreased by approximately 2.5% when E0 fuel was replaced with E70 (Figure 9a). Considering the CO2 concentration, fuel consumption, air intake, and exhaust gas characteristics, it is estimated that the engine running on E0 fuel before the catalytic converter resulted in a cumulative carbon dioxide emission over the test cycle ( E C O 2 _ Σ _ W L T C of approximately 3367 g (Figure 9a) and a specific emission of around 145.2 g/km. When fuelled with E10 and E70, cumulative WLTC CO2 emissions were 3223 g and 3183 g, respectively, with specific emissions of 138.8 g/km and 137.1 g/km—representing reductions of approximately 4.4% and 5.6% compared to E0.
The catalytic converter uses the small amount of oxygen present in the exhaust gas and free oxygen generated from NOx reduction to further oxidise CO and HC, leading to an additional increase in the CO2 concentration downstream of the catalytic converter (ii). The data show that the CO2 concentration upstream of the catalytic converter ranged between 14.2% and 14.5% (Figure 9b), while downstream of the catalytic converter, the CO2 concentration increased by approximately 5.5%, reaching between 15.0% and 15.3% (Figure 9b) during engine operation. The use of E0 fuel resulted in a further increase of around 5.9% in total CO2 emissions downstream of the catalytic converter, reaching approximately 3566 g (Figure 9b), with a corresponding benchmark emission of 153.8 g/km. Increasing the bioethanol concentration to 10% and 70% resulted in reductions of approximately 3.5% and 5.0% in specific CO2 emissions downstream of the catalytic converter, to 147.6 g/km and 145.5 g/km, respectively.
The CO2 emissions for the tested Toyota Prius II were initially determined according to the voluntary agreements made between the European Commission and representatives of the automotive industry. These agreements aimed to reduce the average CO2 emissions of new vehicles sold in the European Union to 140 g/km by 2009 [52]. This target was based on testing according to the New European Driving Cycle (NEDC) standards [53], which were used until 2017–2019. Currently, the WLTC test cycle is used, which includes longer driving times, greater distances, and higher acceleration, speed, and engine load. These factors are likely why the Toyota Prius II CO2 emissions measured during this study exceeded the 140 g/km threshold. It is important to emphasise, when analysing CO2 emissions, that bioethanol is a renewable fuel. On a lifecycle basis, pure bioethanol has approximately 60% lower CO2 emissions than fossil-based gasoline.

4. Conclusions

The experimental WLTC tests conducted on the Toyota Prius II hybrid vehicle provided a comprehensive understanding of the changes in energy and environmental performance when gasoline (E0) is substituted for gasoline–bioethanol blends E10 and E70. The study uses synchronised data from the vehicle load bench, fuel mass gauge, diagnostic equipment, and exhaust gas analysers to numerically analyse vehicle specific parameters.
  • The fuel E0 was replaced by E10 and E70, resulting in an increase in fuel mass consumption of ~0.1% and ~23.9%, respectively, due to the decrease in the lower calorific value of the fuel. The higher ethanol density of E70 resulted in a smaller increase in volumetric fuel consumption (~19.1%) compared to mass consumption. The ICE of the hybrid car using E0 is quite efficient, with a B T E _ W L T C ≈ 0.346 compared to a conventional spark ignition engine operating at low loads, as the hybrid system ensures engine operation in efficient modes. Increasing the bioethanol concentration to 10% and 70% resulted in an additional significant efficiency increase (~2.8% and ~9.0%), attributed to the more efficient combustion of bioethanol and the advanced ignition timing enabled by the higher knock resistance.
  • Upstream of the catalytic converter, CO emissions with fuel E0 were reduced by 19% when E0 was substituted with E10 and E70. The use of the catalytic converter reduced CO emissions with E0 by approximately 170 times. Similarly, the substitution of E0 with E10 and E70 reduced unburned hydrocarbons by approximately 17% and 27%, while downstream of the catalytic converter, HC emissions with E0 were reduced by approximately 80 times. The addition of 70% bioethanol further reduced CO and HC emissions downstream of the catalytic converter by ~28% and ~15%, respectively. The reduction in CO and HC emissions can primarily be attributed to the increased oxygen content in the fuel mixture due to bioethanol, the lower C/H ratio, and the advanced ignition timing. However, it was observed that in low- and medium-speed driving modes, the higher frequency and duration of braking caused a reduction in exhaust and catalytic converter temperatures. This effect was further amplified with an increasing bioethanol concentration, due to the higher specific evaporation temperature and earlier ignition timing. As a result, CO and HC emissions were higher in these driving modes, and pre-catalytic converter and catalytic converter efficiencies were lower.
  • Direct NOx emissions from the ICE were reduced by approximately 24% and 30% when E0 was replaced by E10 and E70, respectively. The catalytic converter reduced the NOx emissions of E0 by approximately 74 times. The addition of bioethanol further reduced NOx emissions by approximately 16% and 21%. However, in the low- and medium-speed vehicle modes, increasing the bioethanol concentration in the fuel led to an increase in NOx emissions. This was because the advanced ignition timing at lower engine speeds resulted in a greater rise in combustion temperatures, promoting NOx formation, while the lower exhaust gas temperatures reduced the catalytic converter’s efficiency. The most significant positive effect of bioethanol was observed in the high- and very-high-speed vehicle modes, where the hybrid system’s electric motor assistance is relatively lower and the ICE bears a higher load. In these conditions, the higher bioethanol content enhanced cylinder cooling, reducing high-temperature NOx emissions, while the catalytic converter temperatures were similar to those with E0 and effectively reduced NOx emissions.
  • The specific CO2 greenhouse gas emissions upstream of the catalytic converter when running on E0 fuel were 138.8 g/km. The oxidation of CO and HC compounds in the catalytic converter resulted in an increase of approximately 5.9% in CO2 emissions to 153.8 g/km. Increasing the bioethanol concentration to 10% and 70% reduced the C/H ratio of the fuel blends by approximately 4% and 28%, respectively, and this led to a reduction in specific CO2 emissions by approximately 3.5% and 5.0%, respectively. An important aspect of a life cycle assessment is that bioethanol is a renewable fuel, and using E100 instead of pure gasoline can reduce CO2 emissions by approximately 60%. In addition, increasing the concentration of bioethanol in gasoline blends reduces not only CO2, but also NOx, which also contributes to the greenhouse effect.

Author Contributions

Conceptualisation, A.R. and G.M.; methodology, G.M. and A.D.; validation, A.R., G.M. and A.D.; formal analysis, S.P. and D.B.; investigation, A.R., G.M., A.D. and S.P.; resources, A.D. and S.P.; data curation, A.R. and A.D.; writing—original draft preparation, A.R., G.M. and S.P.; writing—review and editing, S.P. and D.B.; visualisation, A.R., G.M. and S.P.; supervision, A.R.; project administration, S.P. All authors have read and agreed to the published version of the manuscript.

Funding

This research received no external funding.

Institutional Review Board Statement

Not applicable.

Informed Consent Statement

Not applicable.

Data Availability Statement

The original contributions presented in the study are included in the article; further inquiries can be directed to the corresponding author.

Conflicts of Interest

The authors declare no conflicts of interest.

Abbreviations

B a i r m air mass consumption
B f m fuel mass consumption
B f m _ Σ _ W L T C fuel mass consumption per WLTC
BSFCBrake Specific Fuel Consumption
B S F C _ W L T C Brake Specific Fuel Consumption per WLTC
BTDCBefore Top Dead Centre
BTEBrake Thermal Efficiency
B T E _ W L T C ICE Brake Thermal Efficiency per WLTC
COcarbon monoxide
CO2carbon dioxide
E0pure gasoline
E10blend of gasoline 90% with bioethanol 100% by volume
E100pure bioethanol
E70blend of gasoline 30% with bioethanol 70% by volume
ECUEngine Control Unit
E p o l l . pollutant emissions
E p o l l . _ W L T C specific emissions of pollutant during the WLTC test cycle
E p o l l . _ Σ _ W L T C total mass emissions of pollutant during the WLTC cycle
HCunburnt hydrocarbon
HEVHybrid Electric Vehicles
ICEInternal Combustion Engine
LHV Lower Heating Value
M e x . molar mass of the engine exhaust gas
m e x . mass emissions of engine exhaust
NEDC New European Driving Cycle
NOxnitrogen oxides
PHEVPlug-In Hybrid Electric Vehicles
SISpark Ignition
S v e h . _ Σ _ W L T C distance travelled by the vehicle during the WLTC
W I C E _ Σ _ W L T C work of the ICE during the WLTC cycle
WLTCWorldwide harmonized Light vehicles Test Cycle

References

  1. Jeong, J.W.; In Lee, D.; Woo, S.; Lim, Y.; Lee, K. Analysis of Energy Consumption Efficiency and Emissions According to Urban Driving of Hybrid Electric Vehicles in Korea. Appl. Energy 2024, 371, 123686. [Google Scholar] [CrossRef]
  2. Yang, N.; Li, J.; He, C.; Wang, J.; Chen, Y.; Yao, Y. CO2 Emission Characteristics of China VI Hybrid Vehicles. Transp. Res. Part D Transp. Environ. 2024, 135, 104377. [Google Scholar] [CrossRef]
  3. Bai, S.; Liu, C. Overview of Energy Harvesting and Emission Reduction Technologies in Hybrid Electric Vehicles. Renew. Sustain. Energy Rev. 2021, 147, 111188. [Google Scholar] [CrossRef]
  4. Hu, R.; Chen, X.; Li, L.; Kong, F.; Liu, Y. Exhaust Emissions and Energy Conversion of Hybrid and Conventional CNG Buses. Transp. Res. Part D Transp. Environ. 2024, 135, 104405. [Google Scholar] [CrossRef]
  5. Bagheri, S.; Huang, Y.; Walker, P.D.; Zhou, J.L.; Surawski, N.C. Strategies for Improving the Emission Performance of Hybrid Electric Vehicles. Sci. Total Environ. 2021, 771, 144901. [Google Scholar] [CrossRef]
  6. Wang, Y.; Hao, C.; Ge, Y.; Hao, L.; Tan, J.; Wang, X.; Zhang, P.; Wang, Y.; Tian, W.; Lin, Z.; et al. Fuel Consumption and Emission Performance from Light-Duty Conventional/Hybrid-Electric Vehicles over Different Cycles and Real Driving Tests. Fuel 2020, 278, 118340. [Google Scholar] [CrossRef]
  7. Allen, A. Hybrid Vehicle CO2 Emissions 20% Higher than Claimed, Research Reveals; AWE International: London, UK, 2024. [Google Scholar]
  8. Dornoff, J. Plug-in Hybrid Vehicle CO2 Emissions: How They Are Affected by Ambient Conditions and Driver Mode Selection; The International Council on Clean Transportation: Berlin/Heidelberg, Germany, 2021; p. 57. [Google Scholar]
  9. Transport & Environment Plug-in Hybrids to Lose ‘Low-CO2’ Status as EU Reassesses How Green They Really Are. Transp. Environ. 2022.
  10. Silva, C.; Ross, M.; Farias, T. Evaluation of Energy Consumption, Emissions and Cost of Plug-in Hybrid Vehicles. Energy Convers. Manag. 2009, 50, 1635–1643. [Google Scholar] [CrossRef]
  11. Dižo, J.; Blatnický, M.; Semenov, S.; Mikhailov, E.; Kostrzewski, M.; Droździel, P.; Šťastniak, P. Electric and Plug-in Hybrid Vehicles and Their Infrastructure in a Particular European Region. Transp. Res. Procedia 2021, 55, 629–636. [Google Scholar] [CrossRef]
  12. Mruzek, M.; Gajdáč, I.; Kučera, Ľ.; Barta, D. Analysis of Parameters Influencing Electric Vehicle Range. Procedia Eng. 2016, 134, 165–174. [Google Scholar] [CrossRef]
  13. Squalli, J. Greening the Roads: Assessing the Role of Electric and Hybrid Vehicles in Curbing CO2 Emissions. J. Clean. Prod. 2024, 434, 139908. [Google Scholar] [CrossRef]
  14. Vignesh, R.; Tanay, M.; Samay, G.; Kannan, C.; Ashok, B.; Senthil Kumar, M.; Szpica, D. Adoptability Assessment of HCDI and RCCI Modes in Plug-in Parallel Hybrid Electric Vehicles Using Sustainable Fuels and Model-Based Torque Structure Calibration Strategies. Results Eng. 2024, 23, 102859. [Google Scholar] [CrossRef]
  15. Dogdu, M.F.; Reyhancan, I.A. The Comparison of Gasoline Powered Vehicle and Serial Hybrid Vehicle on Emissions. Heliyon 2024, 10, e28532. [Google Scholar] [CrossRef] [PubMed]
  16. Sher, F.; Chen, S.; Raza, A.; Rasheed, T.; Razmkhah, O.; Rashid, T.; Rafi-ul-Shan, P.M.; Erten, B. Novel Strategies to Reduce Engine Emissions and Improve Energy Efficiency in Hybrid Vehicles. Clean. Eng. Technol. 2021, 2, 100074. [Google Scholar] [CrossRef]
  17. Si, S.; Yang, B.; Gao, B.; Zhang, Z.; Zhao, B.; Zhang, T.; Xu, H. A Real-Time Energy Management Strategy Combining Rule and Optimization for Minimizing Energy Consumption and Emissions of Flywheel Hybrid Electric Vehicle (FHEV). Appl. Therm. Eng. 2024, 255, 124013. [Google Scholar] [CrossRef]
  18. Rahman, M.M.; Zhou, Y.; Rogers, J.; Chen, V.; Sattler, M.; Hyun, K. A Comparative Assessment of CO2 Emission between Gasoline, Electric, and Hybrid Vehicles: A Well-To-Wheel Perspective Using Agent-Based Modeling. J. Clean. Prod. 2021, 321, 128931. [Google Scholar] [CrossRef]
  19. Kheir, N.A.; Salman, M.A.; Schouten, N.J. Emissions and Fuel Economy Trade-off for Hybrid Vehicles Using Fuzzy Logic. Math. Comput. Simul. 2004, 66, 155–172. [Google Scholar] [CrossRef]
  20. Mhaiti, N.; Radouani, M.; El Fahime, B. Multi-Physic Modeling and Simulation of a Hybrid Vehicle with Range Extender. IJESRT 2014, 3, 7058–7062. [Google Scholar]
  21. Huang, J.; Gao, J.; Yang, C.; Tian, G.; Ma, C. The Effect of Ignition Timing on the Emission and Combustion Characteristics for a Hydrogen-Fuelled ORP Engine at Lean-Burn Conditions. Processes 2022, 10, 1534. [Google Scholar] [CrossRef]
  22. Huang, Y.; Surawski, N.C.; Organ, B.; Zhou, J.L.; Tang, O.H.H.; Chan, E.F.C. Fuel Consumption and Emissions Performance under Real Driving: Comparison between Hybrid and Conventional Vehicles. Sci. Total Environ. 2019, 659, 275–282. [Google Scholar] [CrossRef]
  23. Taymaz, I.; Benli, M. Emissions and Fuel Economy for a Hybrid Vehicle. Fuel 2014, 115, 812–817. [Google Scholar] [CrossRef]
  24. Durand, T.; Dimopoulos Eggenschwiler, P.; Tang, Y.; Liao, Y.; Landmann, D. Potential of Energy Recuperation in the Exhaust Gas of State of the Art Light Duty Vehicles with Thermoelectric Elements. Fuel 2018, 224, 271–279. [Google Scholar] [CrossRef]
  25. Alvarez, R.; Weilenmann, M. Effect of Low Ambient Temperature on Fuel Consumption and Pollutant and CO2 Emissions of Hybrid Electric Vehicles in Real-World Conditions. Fuel 2012, 97, 119–124. [Google Scholar] [CrossRef]
  26. Ji, C.; Wang, S.; Zhang, B.; Liu, X. Emissions Performance of a Hybrid Hydrogen–Gasoline Engine-Powered Passenger Car under the New European Driving Cycle. Fuel 2013, 106, 873–875. [Google Scholar] [CrossRef]
  27. Pavlovic, J.; Ciuffo, B.; Fontaras, G.; Valverde, V.; Marotta, A. How Much Difference in Type-Approval CO2 Emissions from Passenger Cars in Europe Can Be Expected from Changing to the New Test Procedure (NEDC vs. WLTP)? Transp. Res. Part A Policy Pract. 2018, 111, 136–147. [Google Scholar] [CrossRef]
  28. Fontaras, G.; Ciuffo, B.; Zacharof, N.; Tsiakmakis, S.; Marotta, A.; Pavlovic, J.; Anagnostopoulos, K. The Difference between Reported and Real-World CO 2 Emissions: How Much Improvement Can Be Expected by WLTP Introduction? Transp. Res. Procedia 2017, 25, 3933–3943. [Google Scholar] [CrossRef]
  29. Yang, Z.; Ge, Y.; Thomas, D.; Wang, X.; Su, S.; Li, H.; He, H. Real Driving Particle Number (PN) Emissions from China-6 Compliant PFI and GDI Hybrid Electrical Vehicles. Atmos. Environ. 2019, 199, 70–79. [Google Scholar] [CrossRef]
  30. Di Blasio, G.; Viscardi, M.; Alfè, M.; Gargiulo, V.; Ciajolo, A.; Beatrice, C. Analysis of the Impact of the Dual-Fuel Ethanol-Diesel System on the Size, Morphology, and Chemical Characteristics of the Soot Particles Emitted from a LD Diesel Engine. In SAE Technical Paper; Istituto Motori CNR, Istituto Ricerche sulla Combustione CNR: Napoli, Italy, 2014; p. 2014–01–1613. [Google Scholar]
  31. Thanapornsin, T.; Phongsri, R.; Laopaiboon, L.; Laopaiboon, P. Use of Spent Yeasts from Bioethanol Production Plant as Low-Cost Nitrogen Sources for Ethanol Fermentation from Sweet Sorghum Stem Juice in Low-Cost Bioreactors. Carbon Resour. Convers. 2024, 100269. [Google Scholar] [CrossRef]
  32. Xiang, H.; Xin, R.; Prasongthum, N.; Natewong, P.; Sooknoi, T.; Wang, J.; Reubroycharoen, P.; Fan, X. Catalytic Conversion of Bioethanol to Value-Added Chemicals and Fuels: A Review. Resour. Chem. Mater. 2022, 1, 47–68. [Google Scholar] [CrossRef]
  33. Puricelli, S.; Cardellini, G.; Casadei, S.; Faedo, D.; Van Den Oever, A.E.M.; Grosso, M. A Review on Biofuels for Light-Duty Vehicles in Europe. Renew. Sustain. Energy Rev. 2021, 137, 110398. [Google Scholar] [CrossRef]
  34. Biofuels Barometer; EurObserv’ER: Maastricht, The Netherlands, 2020; p. 16.
  35. Puricelli, S.; Casadei, S.; Bellin, T.; Cardellini, G.; Cernuschi, S.; Costa, D.; Faedo, D.; Lonati, G.; Rigamonti, L.; Rossi, T.; et al. Reducing the Environmental Impacts of Passenger Cars: A Comparison between Electricity and Biofuels. Transp. Res. Procedia 2023, 72, 1388–1395. [Google Scholar] [CrossRef]
  36. Hsieh, W.-D.; Chen, R.-H.; Wu, T.-L.; Lin, T.-H. Engine Performance and Pollutant Emission of an SI Engine Using Ethanol–Gasoline Blended Fuels. Atmos. Environ. 2002, 36, 403–410. [Google Scholar] [CrossRef]
  37. Karavalakis, G.; Durbin, T.D.; Shrivastava, M.; Zheng, Z.; Villela, M.; Jung, H. Impacts of Ethanol Fuel Level on Emissions of Regulated and Unregulated Pollutants from a Fleet of Gasoline Light-Duty Vehicles. Fuel 2012, 93, 549–558. [Google Scholar] [CrossRef]
  38. Melo, T.C.C.D.; Machado, G.B.; Belchior, C.R.P.; Colaço, M.J.; Barros, J.E.M.; De Oliveira, E.J.; De Oliveira, D.G. Hydrous Ethanol–Gasoline Blends—Combustion and Emission Investigations on a Flex-Fuel Engine. Fuel 2012, 97, 796–804. [Google Scholar] [CrossRef]
  39. Clairotte, M.; Adam, T.W.; Zardini, A.A.; Manfredi, U.; Martini, G.; Krasenbrink, A.; Vicet, A.; Tournié, E.; Astorga, C. Effects of Low Temperature on the Cold Start Gaseous Emissions from Light Duty Vehicles Fuelled by Ethanol-Blended Gasoline. Appl. Energy 2013, 102, 44–54. [Google Scholar] [CrossRef]
  40. Durbin, T.D.; Miller, J.W.; Younglove, T.; Huai, T.; Cocker, K. Effects of Fuel Ethanol Content and Volatility on Regulated and Unregulated Exhaust Emissions for the Latest Technology Gasoline Vehicles. Environ. Sci. Technol. 2007, 41, 4059–4064. [Google Scholar] [CrossRef]
  41. Graham, L.A.; Belisle, S.L.; Baas, C.-L. Emissions from Light Duty Gasoline Vehicles Operating on Low Blend Ethanol Gasoline and E85. Atmos. Environ. 2008, 42, 4498–4516. [Google Scholar] [CrossRef]
  42. Chao, H.-R.; Lin, T.-C.; Chao, M.-R.; Chang, F.-H.; Huang, C.-I.; Chen, C.-B. Effect of Methanol-Containing Additive on the Emission of Carbonyl Compounds from a Heavy-Duty Diesel Engine. J. Hazard. Mater. 2000, 73, 39–54. [Google Scholar] [CrossRef]
  43. Grosjean, D.; Grosjean, E.; Gertler, A.W. On-Road Emissions of Carbonyls from Light-Duty and Heavy-Duty Vehicles. Environ. Sci. Technol. 2001, 35, 45–53. [Google Scholar] [CrossRef]
  44. Colón, M.; Pleil, J.D.; Hartlage, T.A.; Lucia Guardani, M.; Helena Martins, M. Survey of Volatile Organic Compounds Associated with Automotive Emissions in the Urban Airshed of São Paulo, Brazil. Atmos. Environ. 2001, 35, 4017–4031. [Google Scholar] [CrossRef]
  45. Bakeas, E.B.; Argyris, D.I.; Siskos, P.A. Carbonyl Compounds in the Urban Environment of Athens, Greece. Chemosphere 2003, 52, 805–813. [Google Scholar] [CrossRef] [PubMed]
  46. Branco, J.E.H.; Da Rocha, F.V.; Péra, T.G.; De Bastiani, F.P.; Bartholomeu, D.B.; Costa, E.L.; Grilo Junior, I. Assessing Greenhouse Gas Emissions and Costs of Brazilian Light-Duty Vehicles. Renew. Sustain. Energy Rev. 2024, 206, 114845. [Google Scholar] [CrossRef]
  47. Auto-Data.Net 2003 Toyota Prius II (NHW20) 1.5 VVT-i (113 Hp) Hybrid e-CVT. Available online: https://www.auto-data.net/en/toyota-prius-ii-nhw20-1.5-vvt-i-113hp-hybrid-e-cvt-3552 (accessed on 14 September 2024).
  48. HORIBA MEXA-ONE Motor Exhaust Gas Analyzer. Available online: https://www.horiba.com/int/automotive/products/detail/action/show/Product/mexa-one-41/ (accessed on 14 September 2024).
  49. EMERSON Micro MotionTM ELITE Coriolis Meter Consisting of CMF010M Sensor and 4700 Transmitter. Available online: https://www.emerson.com/en-us/catalog/micro-motion-pkg-cmf010m-sensor-and-4700-transmitter (accessed on 14 September 2024).
  50. DieselNet Worldwide Harmonized Light Vehicles Test Cycle (WLTC). Available online: https://dieselnet.com/standards/cycles/wltp.php (accessed on 14 September 2024).
  51. TransportPolicy.net International: Light-Duty: Worldwide Harmonized Light Vehicles Test Procedure (WLTP). Available online: https://www.transportpolicy.net/standard/international-light-duty-worldwide-harmonized-light-vehicles-test-procedure-wltp/ (accessed on 14 September 2024).
  52. DieselNet EU: Cars: Greenhouse Gas Emissions. Available online: https://dieselnet.com/standards/eu/ghg.php (accessed on 14 September 2024).
  53. DieselNet ECE 15 + EUDC/NEDC. Available online: https://dieselnet.com/standards/cycles/ece_eudc.php (accessed on 14 September 2024).
Figure 1. The layout of vehicle testing equipment: (a) vehicle test cell; (b) equipment-control room; (c) equipment installation diagram.
Applsci 14 10858 g001
Figure 2. Various settings during WLTC using different fuels: (a) vehicle speed and distance travelled; (b) vehicle load, ICE load, and work performed by the ICE.
Applsci 14 10858 g002
Figure 3. Various settings during WLTC using different fuels: (a) throttle opening and ICE speed; (b) ICE coolant temperature and catalytic converter temperature.
Applsci 14 10858 g003
Figure 4. Air–fuel ratio and ignition timing are used using different fuels: (a) all WLTCs; (b) extra high-speed mode.
Applsci 14 10858 g004
Figure 5. Fuel and air consumption during the WLTC are performed using different fuels: (a) fuel consumption; (b) air consumption.
Applsci 14 10858 g005
Figure 6. CO concentration and emission during the WLTC, using different fuels: (a) before the catalytic converter; (b) after the catalytic converter.
Applsci 14 10858 g006
Figure 7. HC concentration and emission during the WLTC, using different fuels: (a) before the catalytic converter; (b) after the catalytic converter.
Applsci 14 10858 g007
Figure 8. NOx concentration and emissions during the WLTC, using different fuels: (a) before the catalytic converter; (b) after the catalytic converter.
Applsci 14 10858 g008
Figure 9. CO2 concentration and emission during the WLTC, using different fuels: (a) Before the catalytic converter; (b) After the catalytic converter.
Applsci 14 10858 g009
Table 1. Toyota Prius II basic technical data [47].
ParameterValue
ModelToyota Prius II
Year of manufacture2005
Engine type, modelSpark-ignition, 1NZ-FXE
Engine displacement1497 cm3
Number and arrangement of cylinders4 in-line
Cylinder bore/stroke75 mm/84.7 mm
Compression ratio13
Valve timing systemDOHC Atkinson Cycle
Fuel supplyFuel injection before intake valves
Internal combustion engine torque111 Nm at 4200 rpm
Electric motor torque400 Nm
Internal combustion engine power57 kW at 5000 rpm
Electric motor power50 kW
Combined power82 kW
Hybrid system typeFully Hybrid Electric Vehicle (FHEV)
TransmissionElectronic continuously variable transmission (e-CVT)
Battery typeNickel-metal hydride (NiMH)
Battery capacity1.31 kWh
Fuel typeGasoline A95
Fuel tank capacity45 L
Fuel consumption (EPA)4.9 L/100 km city/5.2 L/100 km highway/5.1 L/100 km combined
Acceleration 0–100 km/h~10.5 s
Maximum speed170 km/h
Weight (empty)1310 kg
Dimensions (length × width × height)4.445 m × 1.725 m × 1.476 m
Wheelbase2.700 m
Driven wheelsFront
BrakesDisc brakes (front), drum brakes (rear)
Tyre size185/65R15
Aerodynamic drag coefficient0.26
Table 2. Basic technical details of the equipment used in the WLTC study [48,49].
DeviceParameterValue
Chassis dynamometerModel48″ MIM 2 × 1 Froude Consine CD Modernized by AVL
Axles1
Rollers2
Roller diameter1219.2 mm
Base inertia1354 kg
Mass of the vehicle500–2700 kg
Nominal power100 kW
Maximum force3000 N, accuracy 0.2% (FS)
Maximum speed200 km/h, accuracy 0.05% (FS)
Fuel mass meterModelEmerson CMF010M302NACZEZZZ
Measurement methodCoriolis principle
Flow range0.2–80 kg/h, accuracy ±0.1% of the flow
Fuel input pressureLower limit > 2.0 bar,
upper limit ≤ 125 bar
Pressure drop0.7 bar at 30 kg/h fuel flow
Gas analyserModelHoriba MEXA-ONE-D1
CORange: 0–5000 ppm, up to 20% (vol.)
HCRange: 0–5000 ppm, up to 20,000 ppm (vol.)
NOxRange: 0–5000 ppm, up to 10,000 ppm (vol.)
CO20–20% (vol.)
O20–25% (vol.)
Diagnostic equipmentModelToyota Techstream
Real-time parametersEngine speed, rpm;
Engine load, kW
Air intake, g/s;
Engine coolant temperature, °C
Air-fuel ratio;
Ignition timing, °BTDC;
Temperature before catalytic converter, °C;
Temperature after catalytic converter, °C
Table 3. Main chemical–physical properties of the fuels tested.
ParameterFuels
E0E10E70E100
Bioethanol volume concentration, %01070100
Bioethanol mass concentration, %010.571.1100
Density (15 °C), kg/m3748752778790
Viscosity (40 °C) (mm2/s)0.6 1.13
Specific heat of vaporisation, kJ/kg364 840
Laminar flame speed, cm/s51 63
Adiabatic combustion temperature, °C2307 2247
Freezing point, °C–40 –114
Octane number95 109
Elemental composition, %C86.4282.8262.0252.10
H13.5813.6614.1114.32
O0.003.5223.8833.58
C/H ratio6.366.064.403.64
Stoichiometric air–fuel ratio, kg of air/1 kg of fuel14.7014.1010.659.00
Lower heating value of fuel, MJ/kg43.5341.8832.3327.78
Disclaimer/Publisher’s Note: The statements, opinions and data contained in all publications are solely those of the individual author(s) and contributor(s) and not of MDPI and/or the editor(s). MDPI and/or the editor(s) disclaim responsibility for any injury to people or property resulting from any ideas, methods, instructions or products referred to in the content.

