Article

Computational Fluid Dynamics Analysis of Gas Suction in Coaxial Flow Venturi Injector: Impact of Gas–Liquid Interface Structure in Mixing Section

1
School of Chemical Engineering and Technology, China University of Mining and Technology, Xuzhou 221116, China
2
State Key Laboratory of Coking Coal Resources Green Exploitation, China University of Mining and Technology, Xuzhou 221116, China
3
National Engineering Research Center of Coal Preparation and Purification, China University of Mining and Technology, Xuzhou 221116, China
4
Center of Mineral Resource Waste Recycling, China University of Mining and Technology, Xuzhou 221008, China
*
Authors to whom correspondence should be addressed.
Appl. Sci. 2024, 14(23), 10839; https://doi.org/10.3390/app142310839
Submission received: 29 October 2024 / Revised: 13 November 2024 / Accepted: 20 November 2024 / Published: 22 November 2024

Abstract

:
The gas–liquid Venturi injector has been widely applied in industrial production due to its advantages of high entrainment and low energy consumption. In this study, Computational Fluid Dynamics (CFD) was employed to investigate the effect of the gas–liquid interface structure within the mixing section on entrainment behavior by varying the geometry of the mixing section during gas–liquid coaxial flow. The simulation results indicate that along the jet direction, the gas–liquid interface generally transitions from a smooth cylindrical shape to a lobed structure in the mixing section. Surface waves mainly appear in the lobed region. Furthermore, lobed and surface wave structures reduce pressure loss and enhance entrainment. Additionally, the study found that longer mixing sections enhance entrainment under low flow resistance. This study provides valuable insights for achieving high jet entrainment and offers supplementary research on gas–liquid interface structures in jets constrained by solid boundaries.

1. Introduction

Gas recirculation technology is widely used to enable resource reuse, improve production efficiency, reduce energy consumption, and protect the environment in industrial production, such as the petrochemical industry [1], syngas production [2], gas adsorption separation [3], gas oxidation reactions [4], gas catalytic reactions [5], gas treatment and purification [6], and bio-fermentation [7]. Traditional gas compressors, as gas transportation equipment, significantly limit the economic efficiency of chemical production due to their moving parts and complex structure. In recent years, gas–liquid Venturi injectors have garnered extensive attention due to their simple structure, low energy consumption, and ability to achieve gas recirculation without the need for gas compressors.
The gas entrainment rate is a key parameter affecting the mass transfer efficiency of the Venturi injector, which is primarily determined by the operational and structural parameters [8]. Tang et al. [9,10] analyzed the effects of the density of the working fluid and back pressure on gas entrainment performance. Duan et al. [11,12] found that the contraction angle of the nozzle has little effect on the entrainment rate, but reducing the nozzle outlet radius can improve it. Yadav et al. [13] demonstrated that the geometry of the suction chamber significantly affects the entrainment rate, with larger suction chamber angles leading to a decrease in entrainment rate. Duan et al. [11] proposed that the optimal length-to-diameter ratio of the mixing section should be around 5–7. However, Ozkan et al. [14] argued that the entrainment rate is not sensitive to the geometry of the suction chamber (<5%), and the length of the mixing tube has a more complex impact on gas entrainment behavior, with no clear maximum value. Due to the significant differences in research equipment sizes and nozzle outlet velocities, the results of the geometric parameters often vary widely. Therefore, the impact of the injector structure, particularly the configuration of the mixing section, on the entrainment rate warrants further investigation.
Furthermore, the injector entrainment process can also be viewed as a jet entrainment process with a solid boundary. The behavior of surface waves at the gas–liquid interface has a significant effect on gas–liquid transfer [15,16,17]. Most studies have focused on the formation of surface waves. Weber et al. [18,19,20] investigated the stability theory of jets in viscous fluids, suggesting that surface waves form at the gas–liquid interface due to disturbances from the surrounding gas. Huerre et al. [21,22] found that jet surfaces are inherently unstable regardless of how disturbances at the gas–liquid interface evolve. Vadivukkarasan et al. [23,24] studied the transition of jets from absolute to convective instability under varying conditions, identifying a critical Weber number. Cramers et al. [25,26,27] experimentally determined that the condition for jet breakup within an injector is a gas-to-liquid volume ratio of less than 1.3 to 2, and the range of jet breakup increases with the rise in back pressure. However, little research has focused on the relationship between injector structure, surface wave characteristics, and entrainment.
In this study, the Volume of Fluid (VOF) model is employed to simulate the gas–liquid coaxial flow, with a particular focus on the interaction between the two phases at their interface. The VOF model is well-suited for capturing clearly defined gas–liquid boundaries, which are typically observed in the annular flow regime [28,29]. Although, in practical scenarios, the liquid phase may partially penetrate the gas core, forming an annular-mist flow regime, the jet in this study does not undergo significant breakup and predominantly retains the distinct gas–liquid interface characteristic of the annular flow. Other multiphase models, such as the Mixture or Eulerian–Eulerian models, are generally more applicable to flows involving substantial jet breakup and intense turbulence, which fall outside the scope of this investigation.
A primary limitation of the VOF model is its sensitivity to grid resolution. Achieving the level of resolution required for highly accurate predictions of interface dynamics would necessitate a computationally expensive grid, comprising tens of millions of cells, which is not feasible with current computational resources. Nevertheless, the VOF model has demonstrated robust performance in simulating phenomena such as jet breakup [30], collision [31], and cavitation [32], even with moderate grid resolutions.
The choice of the turbulence model is crucial for accurately capturing the shear flow characteristics of the system. Previous studies by Turutoglu et al. [33,34] have shown that the Reynolds Stress Model (RSM) can effectively and accurately simulate turbulent round jet behavior and flow characteristics. Additionally, the secondary pressure–strain model within RSM has been found to be more reliable for shear flows [35].
This paper focuses on the conical nozzle and the key geometric structure of the mixing section in the Venturi configuration, aiming to investigate the characteristics of the gas–liquid interface structure within the mixing section and its effect on entrainment behavior. This research provides a supplementary study on gas–liquid interface structures in jets constrained by solid boundaries and reveals the mechanism by which the gas–liquid interface structure in the mixing section influences jet entrainment behavior, offering valuable insights for achieving high jet entrainment.

2. Governing Equation and Calculation Setting

2.1. Multiphase Flow Model

The VOF model simulates flow by solving the continuity equation, momentum equation, energy equation, and volume fraction equation of the two phases. Given the limited pressure variation (0.3 MPa) and maximum fluid velocity (30 m/s) within the apparatus, compressibility-induced temperature changes are negligible. Therefore, the isothermal assumption is considered a reasonable approximation for the flow conditions in this study, and the influence of temperature on the entrainment rate is not accounted for. Additionally, due to the significantly high liquid Weber number (the ratio of inertial to surface tension forces) and the need for convergence in the calculations, surface tension effects are neglected.
The multiphase flow volume fraction equation, namely, the continuity equation, can track the interface between the phases, which is expressed as follows:
1 ρ n t v n ρ n + v n ρ n u = S vn + n = 1 a M mn M nm
where ρn is the density of the nth phase fluid, kg/m3; u is the fluid flow velocity, m/s; Mnm is the mass transfer from the nth phase to the mth phase; Mmn is the mass transfer from the mth phase to the nth phase; Svn is the source term, and the default value is 0.
The volume fraction of the first phase will not be determined by the volume fraction equation. Instead, it will be calculated based on the following constraints:
n = 1 a α n = 1
αn is the volume fraction of n phase.
The essence of the momentum equation is to satisfy Newton’s second law. The VOF model for multiphase flow shares a momentum field and solves a single momentum equation in the entire computational domain, instead of obtaining it by summing the momentum equations of all phases. The resulting velocity field is common to all phases and can be expressed as follows:
t ( ρ u ) + ρ ( u ) 2 = μ u + u T p + ρ g + F
where F is the volume force, N; ρ is the average density of fluid volume fraction, kg/m3; μ is the average viscosity of the fluid volume fraction, Pa·s.

2.2. Turbulence Model

In RSM, the Reynolds-averaged Navier–Stokes equation is derived by solving the transfer equation of Reynolds stress. The transfer equation of Reynolds stress can be formulated as follows:
T ij + C ij = D T , ij + D L , ij + P ij + G ij + φ ij + ε ij + F ij + S vn
where T ij is the local time derivative, t ρ u i u j ¯ ; C ij is the convection, x k ρ u k u i u j ¯ ; D T , ij is the turbulent diffusion, x k ρ u i u j u k ¯ + p δ kj u i + δ ik u j ¯ ; D L , ij is the molecular diffusion, x k μ x k u i u j ¯ ; P ij is the stress production, ρ u i u k ¯ u j x k + u j u k ¯ u i x k ; G ij is the buoyancy production, ρ β g i u j θ ¯ + g j u i θ ¯ ; φ ij is the pressure strain, p u i x j + u j x i ¯ ; ε ij is the dissipation, 2 μ u i x k u j x k ¯ ; F ij is the production by system rotation, 2 ρ Ω k u j u m ¯ ε ikm + u i u m ¯ ε jkm .

2.3. Mesh Partition and Simulation Setting

Figure 1 shows a schematic diagram of the internal structure of the Venturi injector, consisting of a nozzle, suction chamber, mixing section, and diffuser. The specific structural parameters are detailed in Table 1.
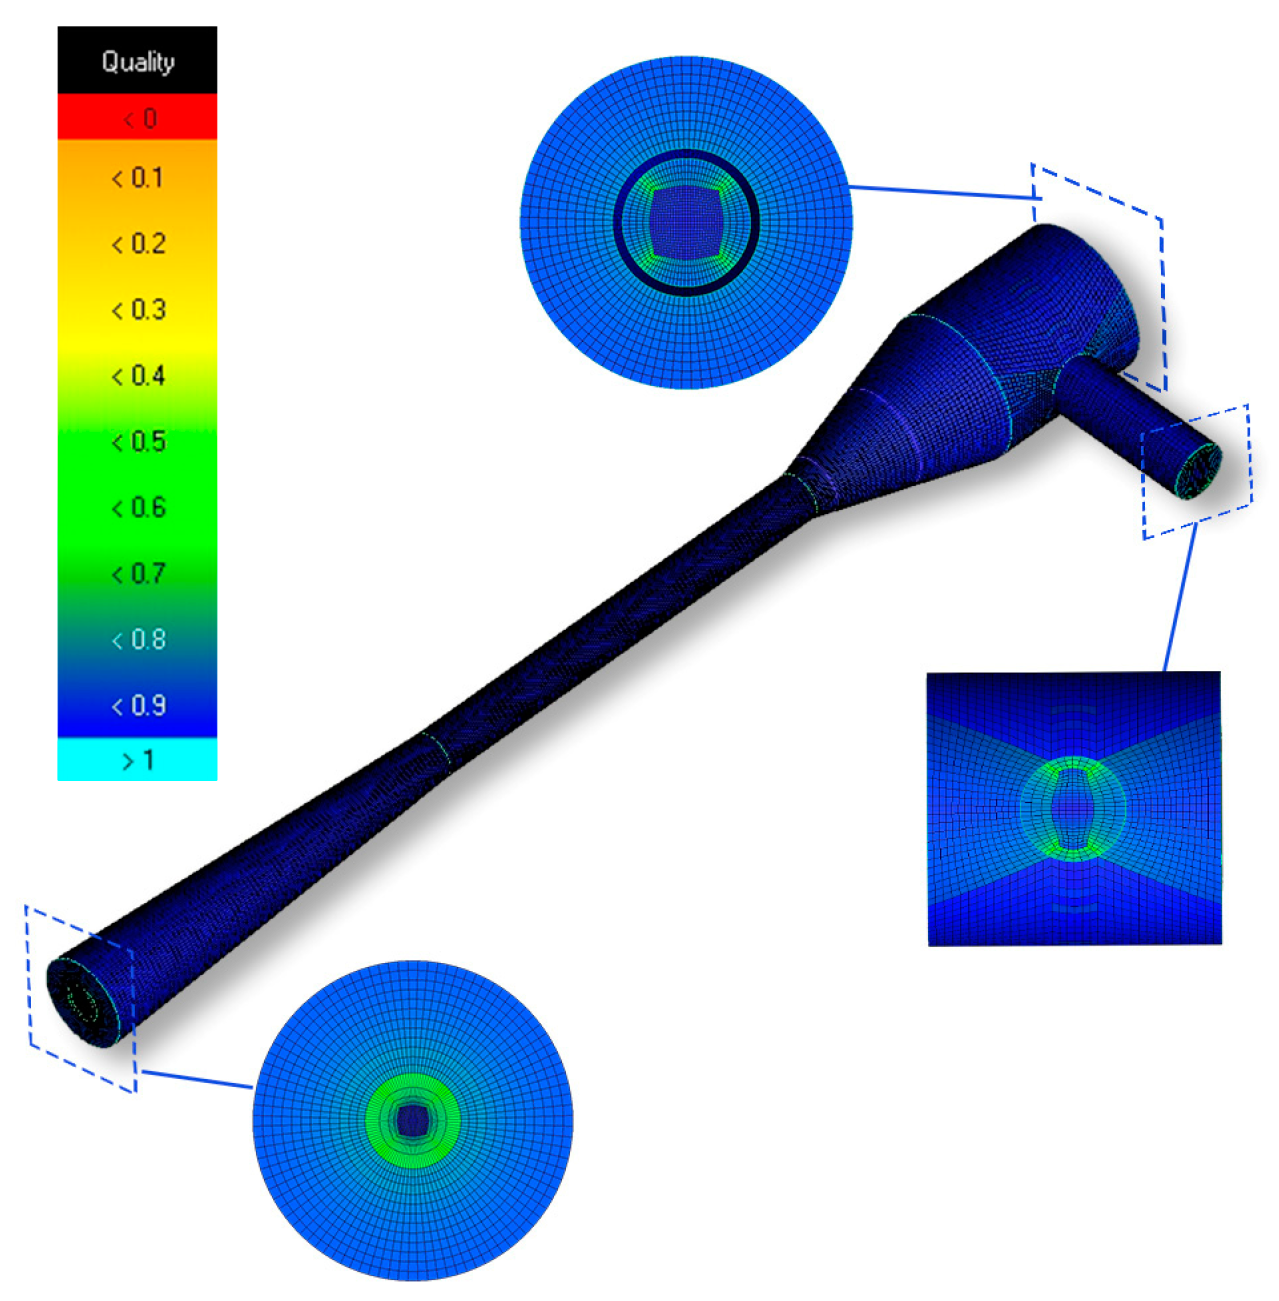
In this study, ICEM CFD 2022 R1 was employed to create a three-dimensional, non-uniformly distributed structured hexahedral grid. Figure 2 depicts a schematic representation of the 3D computational grid for the Venturi injector. The quality of the grid is assessed through the minimum orthogonal value, yielding a value of 0.64, affirming the rationality of the grid division strategy.
In this study, water was utilized as the primary phase fluid, while air served as the secondary phase fluid. The boundary conditions of the model are defined as follows: The liquid inlet is designated as a velocity inlet, with the velocity determined by the velocity of the nozzle inlet; the gas inlet is specified as the atmospheric pressure inlet; the outlet is also set as the atmospheric pressure outlet.
The computational software Fluent 2022 R1 was employed to solve the governing equations, utilizing a solver based on the pressure method. The pressure–velocity coupling method was implemented using the SIMPLEC scheme; the PRESTO scheme was employed for pressure term discretization; the momentum was solved using a second-order upwind scheme; turbulent kinetic energy and dissipation rate were computed using a first-order upwind scheme; and the volume fraction was handled using the Geo-Reconstruct scheme. Default relaxation factors were applied for pressure, density, and momentum.
Due to the significant fluctuations inherent in turbulent jet flows, achieving a steady-state solution was difficult, particularly as the VOF model is generally not well-suited for steady-state solutions. Consequently, transient simulations were employed in place of steady-state approaches. The time step was set at 5×10⁻⁵ s. Convergence criteria for mass, momentum, and k-ε residuals were established at 10-4, with a maximum of 20 iterations per time step. The simulation reached a stable state when variable values fluctuated within 5% of the stable value. To mitigate errors associated with single-time-point solutions, time-averaged sampling was employed, with data being continuously collected over a period of 0.2 s.

2.4. Model Validation

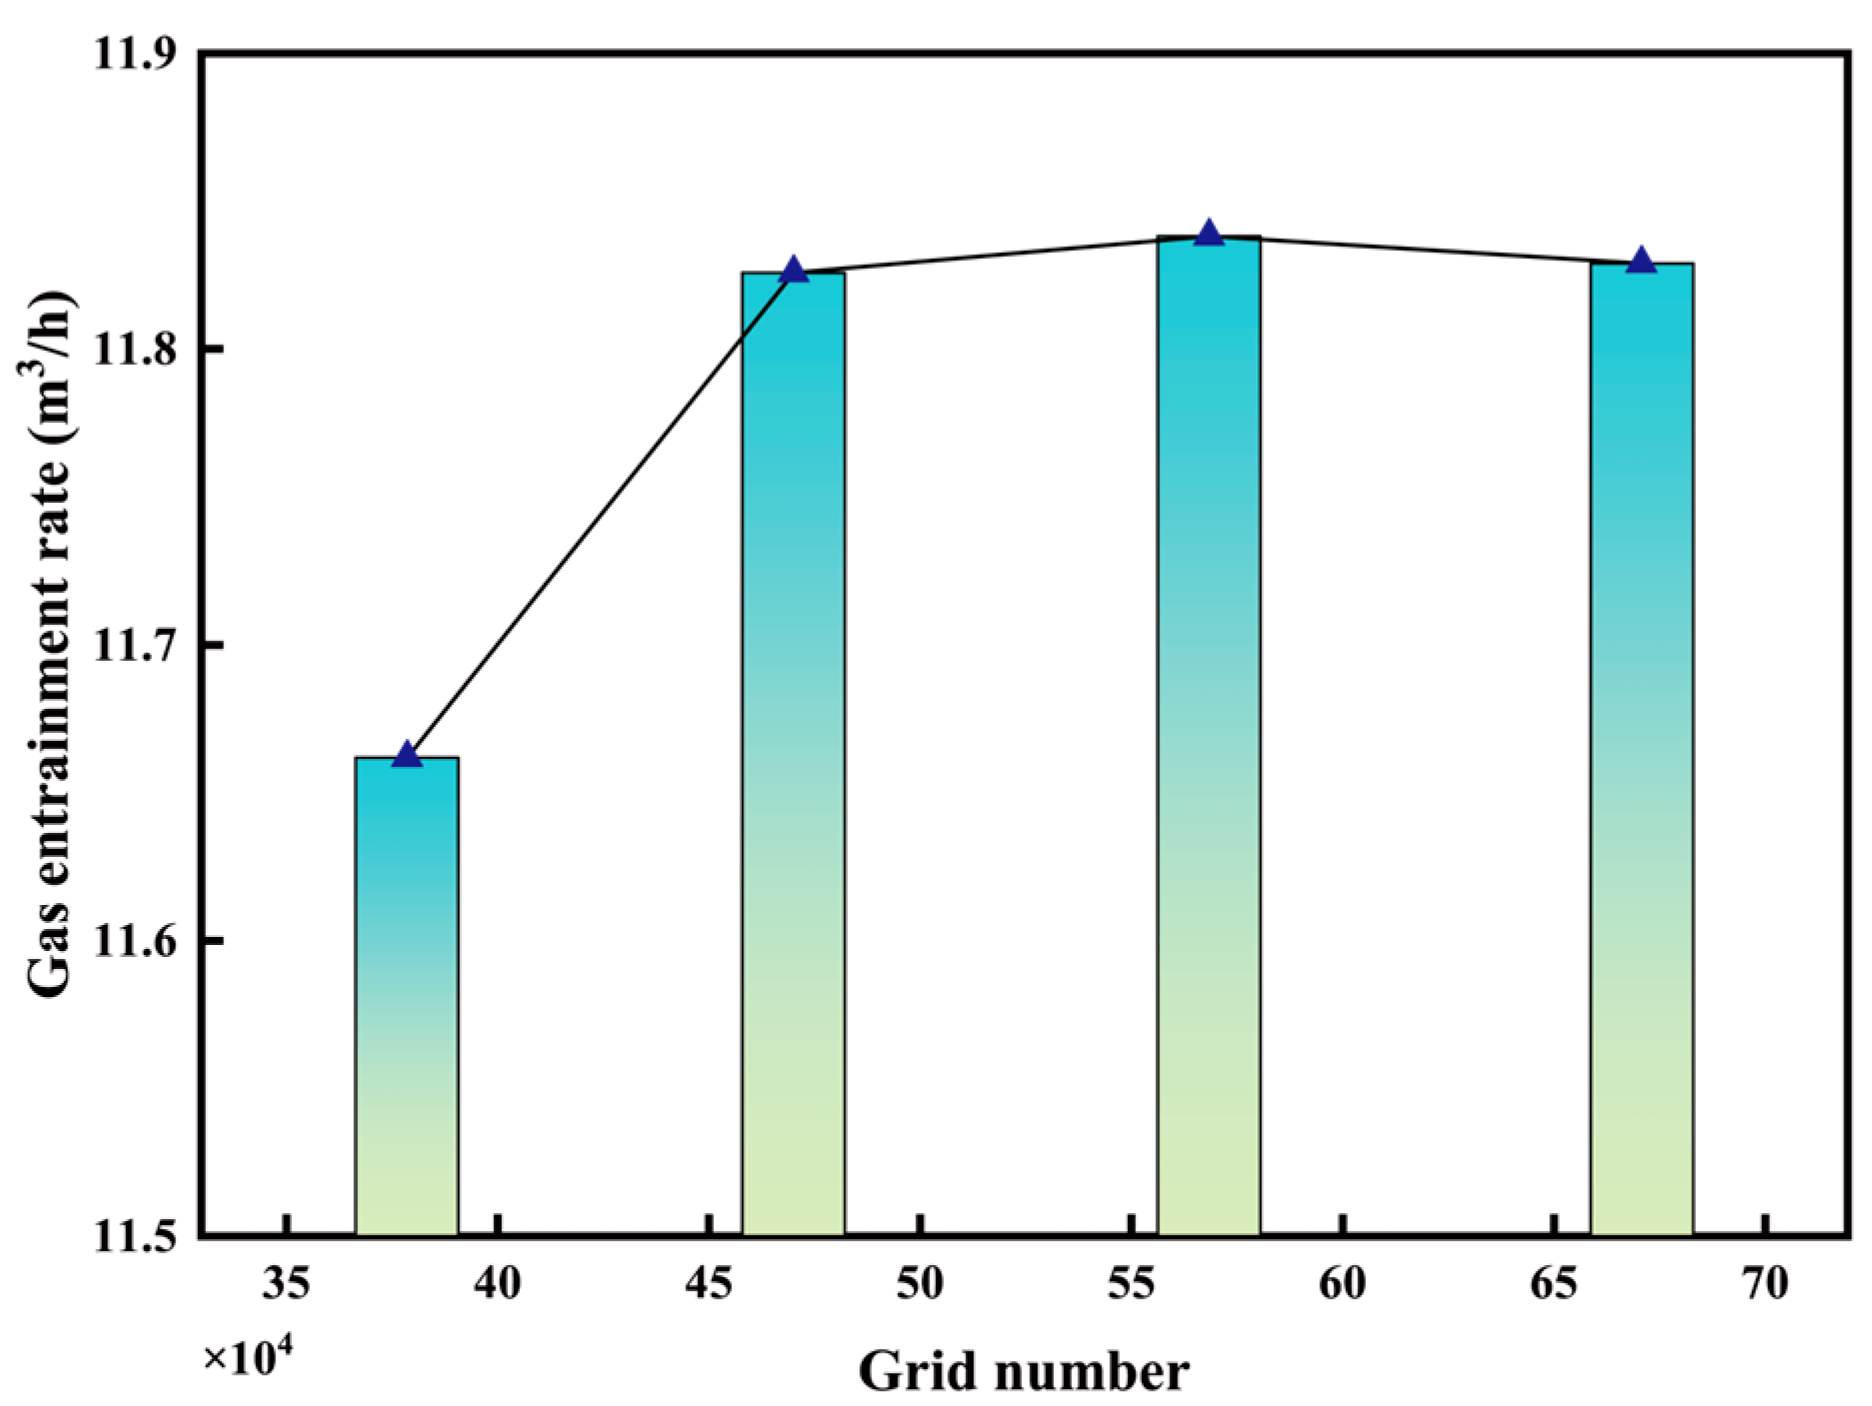
In this study, four different grid numbers were used to prove the insensitivity of the simulation results to grid counts. Figure 3 shows the effect of the number of grids on the gas entrainment rate. When the number of grids is greater than 470,048, the change in the entrainment rate does not exceed 0.11 %. Considering both computational accuracy and time efficiency, a meshing strategy entailing a grid number of 568,417 is identified as the optimal choice. This selected strategy features a maximum mesh size of 2.25 mm and a first-layer mesh height of 2.18 mm.
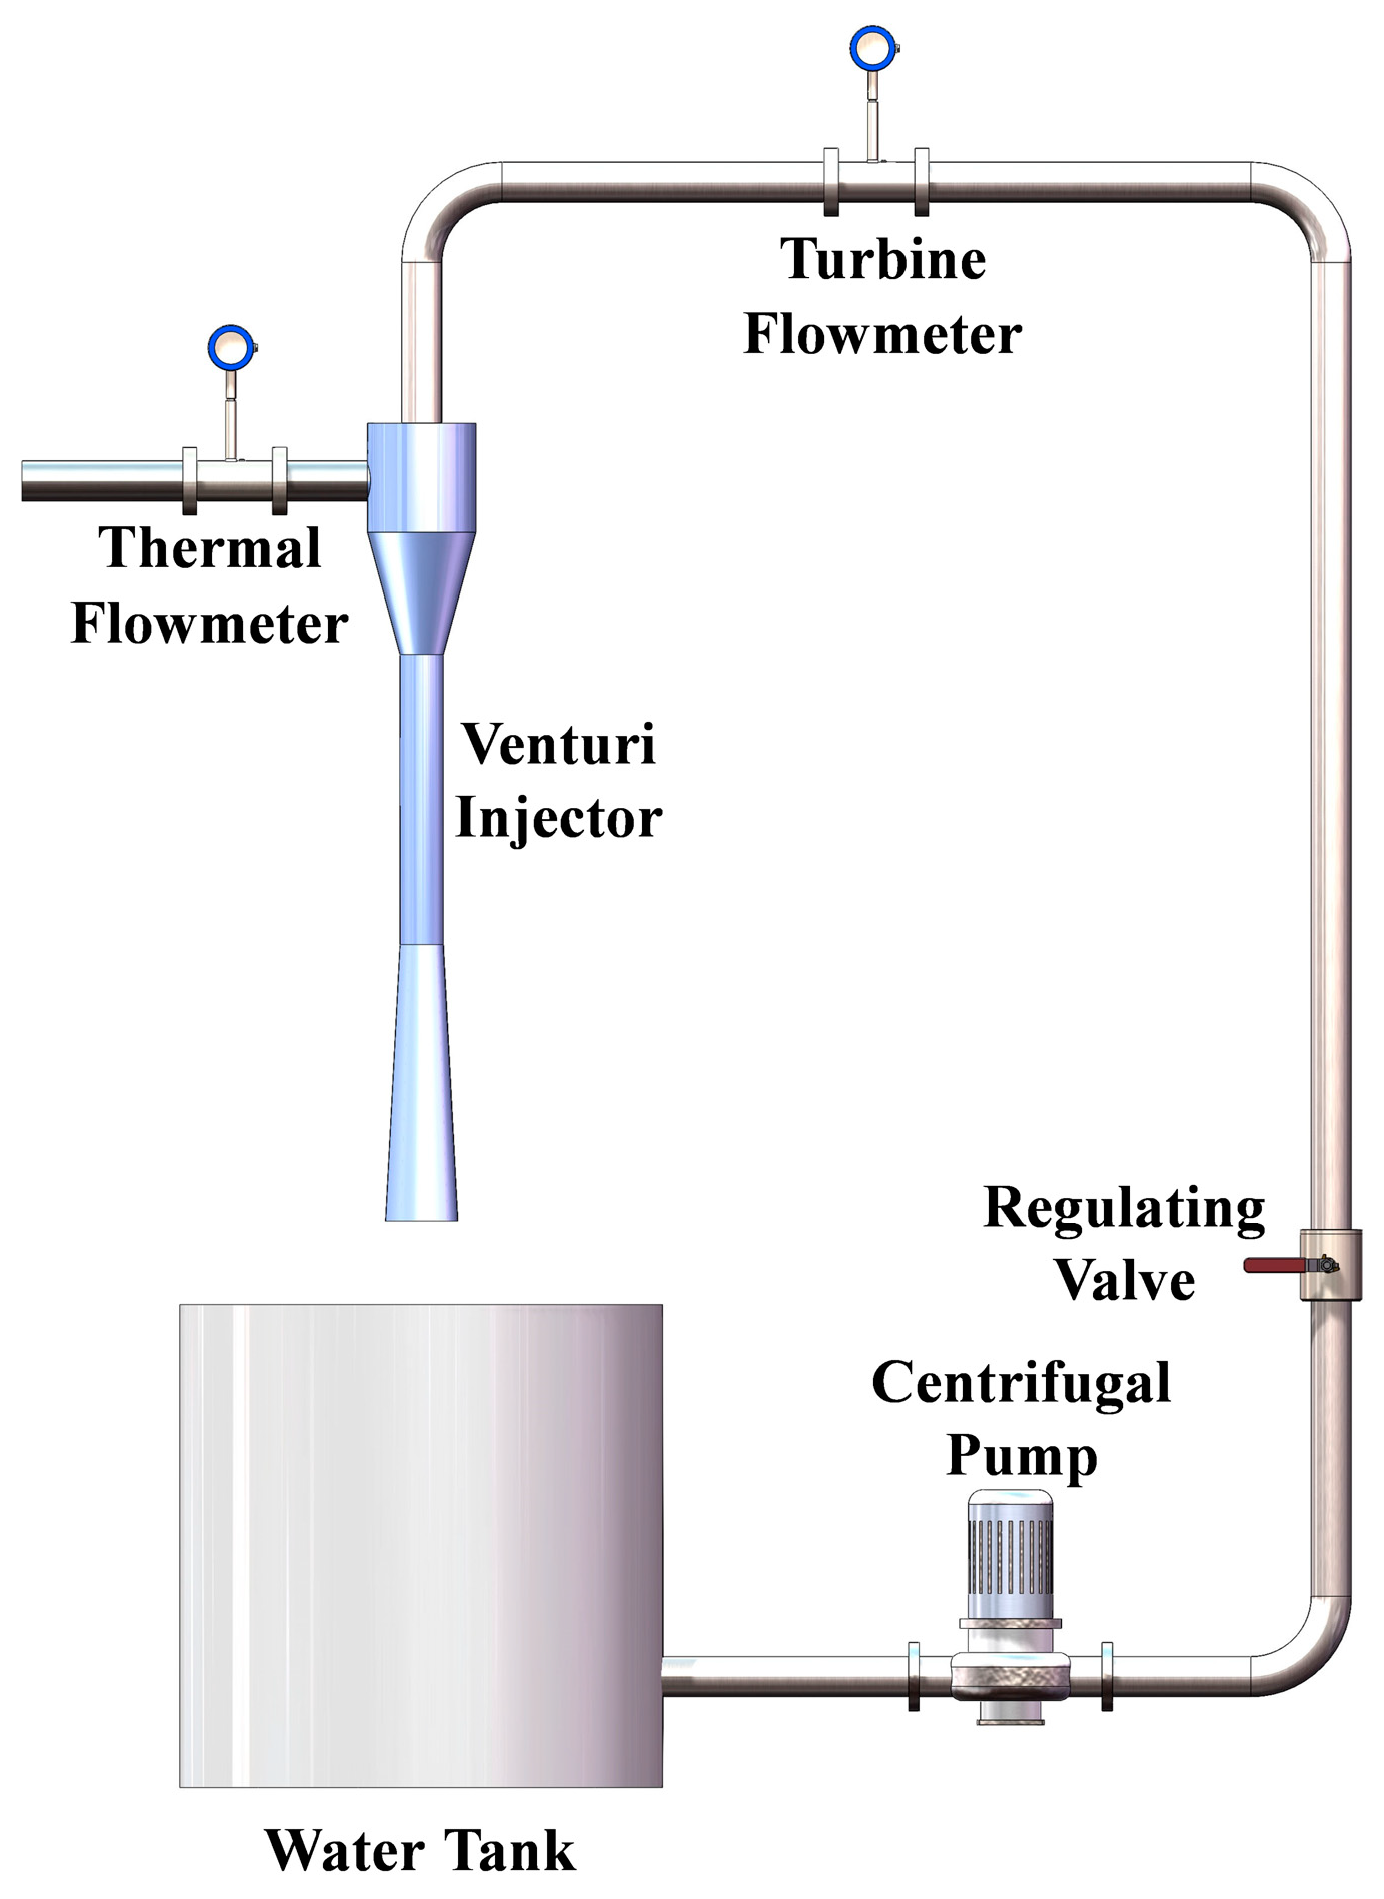
Experiments are conducted to verify the gas entrainment rate at different nozzle outlet velocities, in order to demonstrate the reliability of the numerical model. Figure 4 shows a schematic of the experimental system, which includes a water tank that is large enough to ensure minimal leakage effects. The system consists of a centrifugal pump, a regulating valve, a turbine flow sensor, a Venturi injector, and a thermal gas flow sensor. The centrifugal pump provides high-pressure liquid for the system, with flow controlled by the regulating valve. The turbine flow sensor monitors the liquid flow, while the thermal gas flow sensor tracks gas flow at the gas inlet in real time. For the Venturi injector, the nozzle is made of stainless steel, and the remaining parts are constructed of smooth acrylic. Both materials have minimal surface roughness, making it negligible in our study. To prevent leakage, Teflon tape and gaskets were applied at key connections, and the overall system was thoroughly checked for leaks prior to experimentation to ensure integrity. Liquid and air flow rates were monitored through liquid and gas flow meters, respectively, and no leakage was observed during the experiments. The outlet of the Venturi injector is connected to the atmosphere.
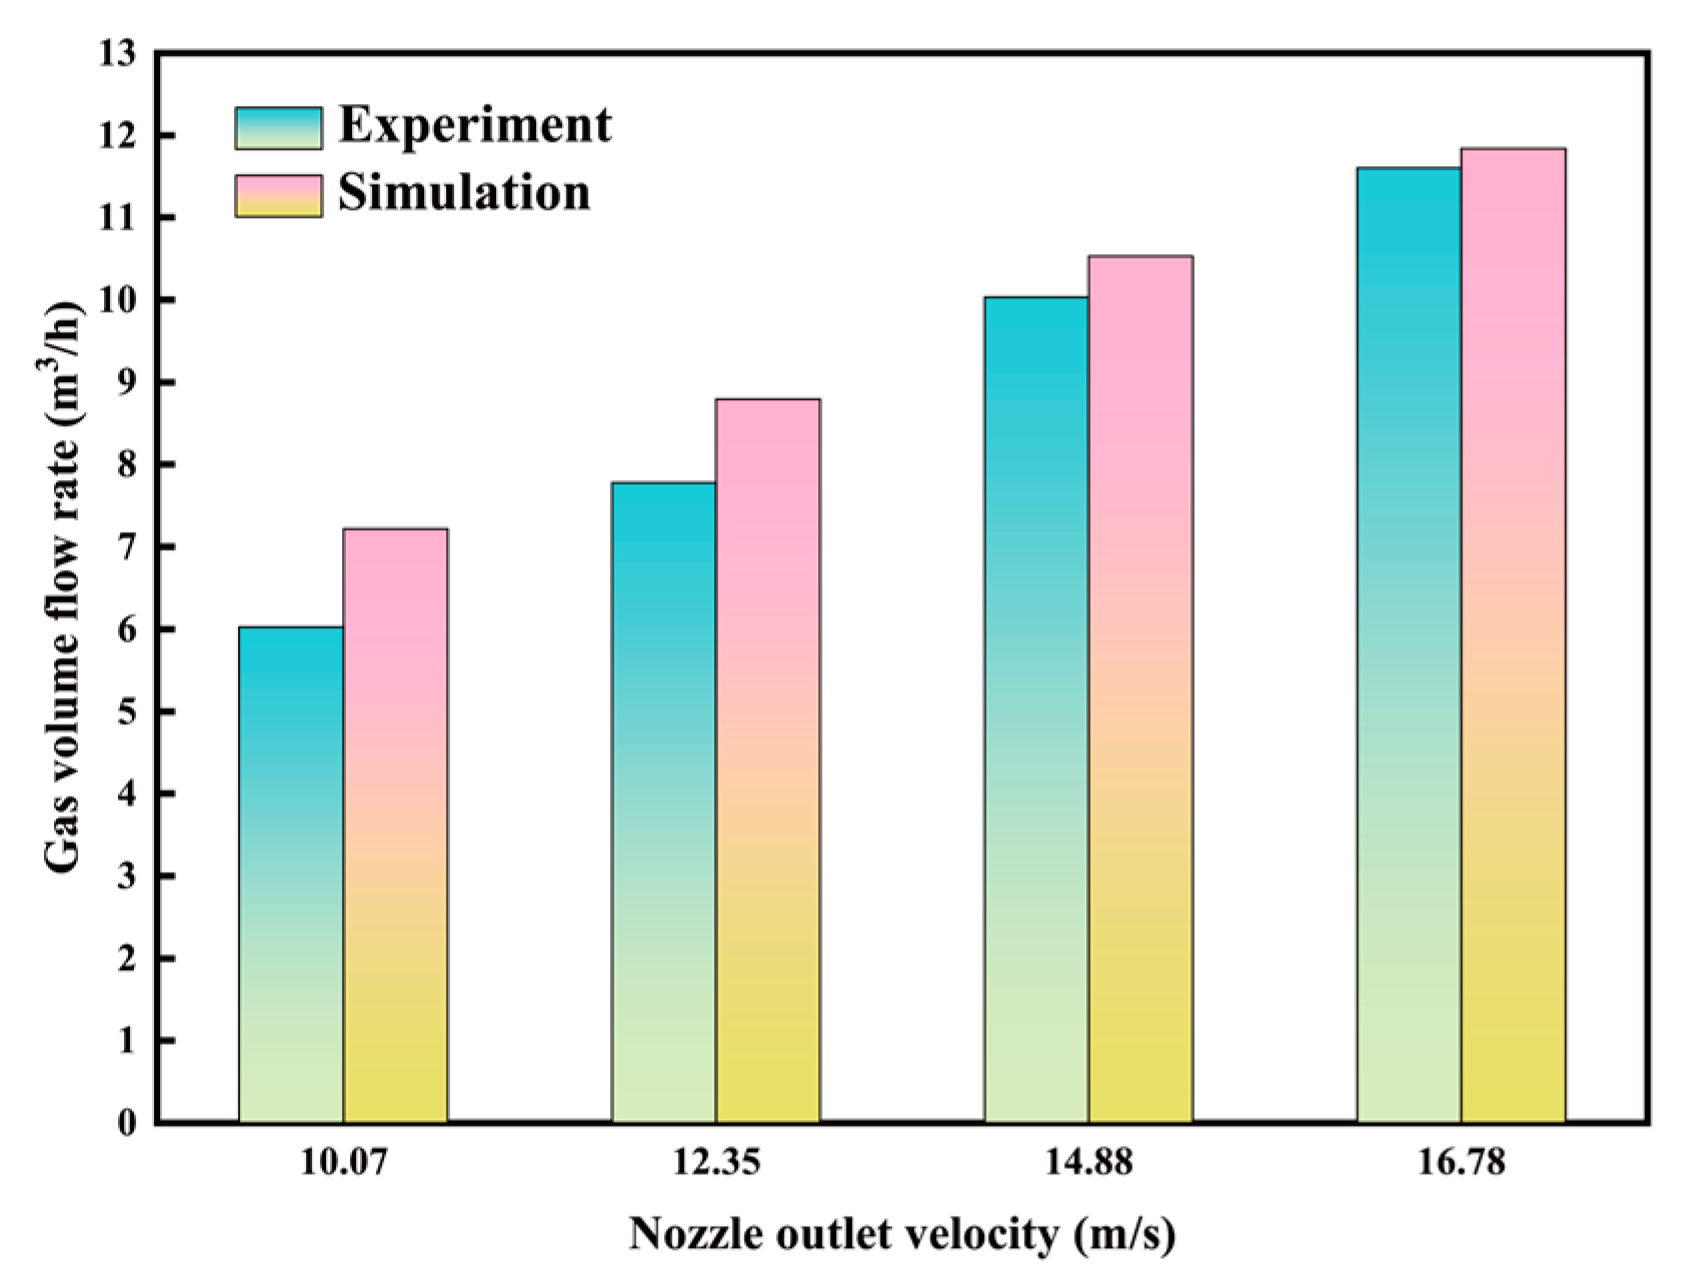
Figure 5 illustrates the variation in the experimental entrainment rate and the simulated entrainment rate concerning the nozzle outlet flow rate. It is evident that both the experimental entrainment rate and the predicted entrainment rate exhibit an increase with the escalation of the nozzle outlet flow rate, following a similar trend. Notwithstanding, there exist numerical discrepancies between them, likely arising from experimental inaccuracies, simplifications in the simulation models, and control equations. As the nozzle outlet flow rate increases, the experimental and simulated entrainment rates tend to converge. At a nozzle outlet flow rate of 16.78 m/s, the error between the experimental and simulated entrainment rates reduces to a mere 2.17%, indicating the reliability of the model. This study delves into exploring the impact of the mixing section structure on gas entrainment under the specified condition of a nozzle outlet flow rate of 16.78 m/s.

3. Results and Discussion

3.1. Gas–Liquid Interface Characteristics in the Mixing Section

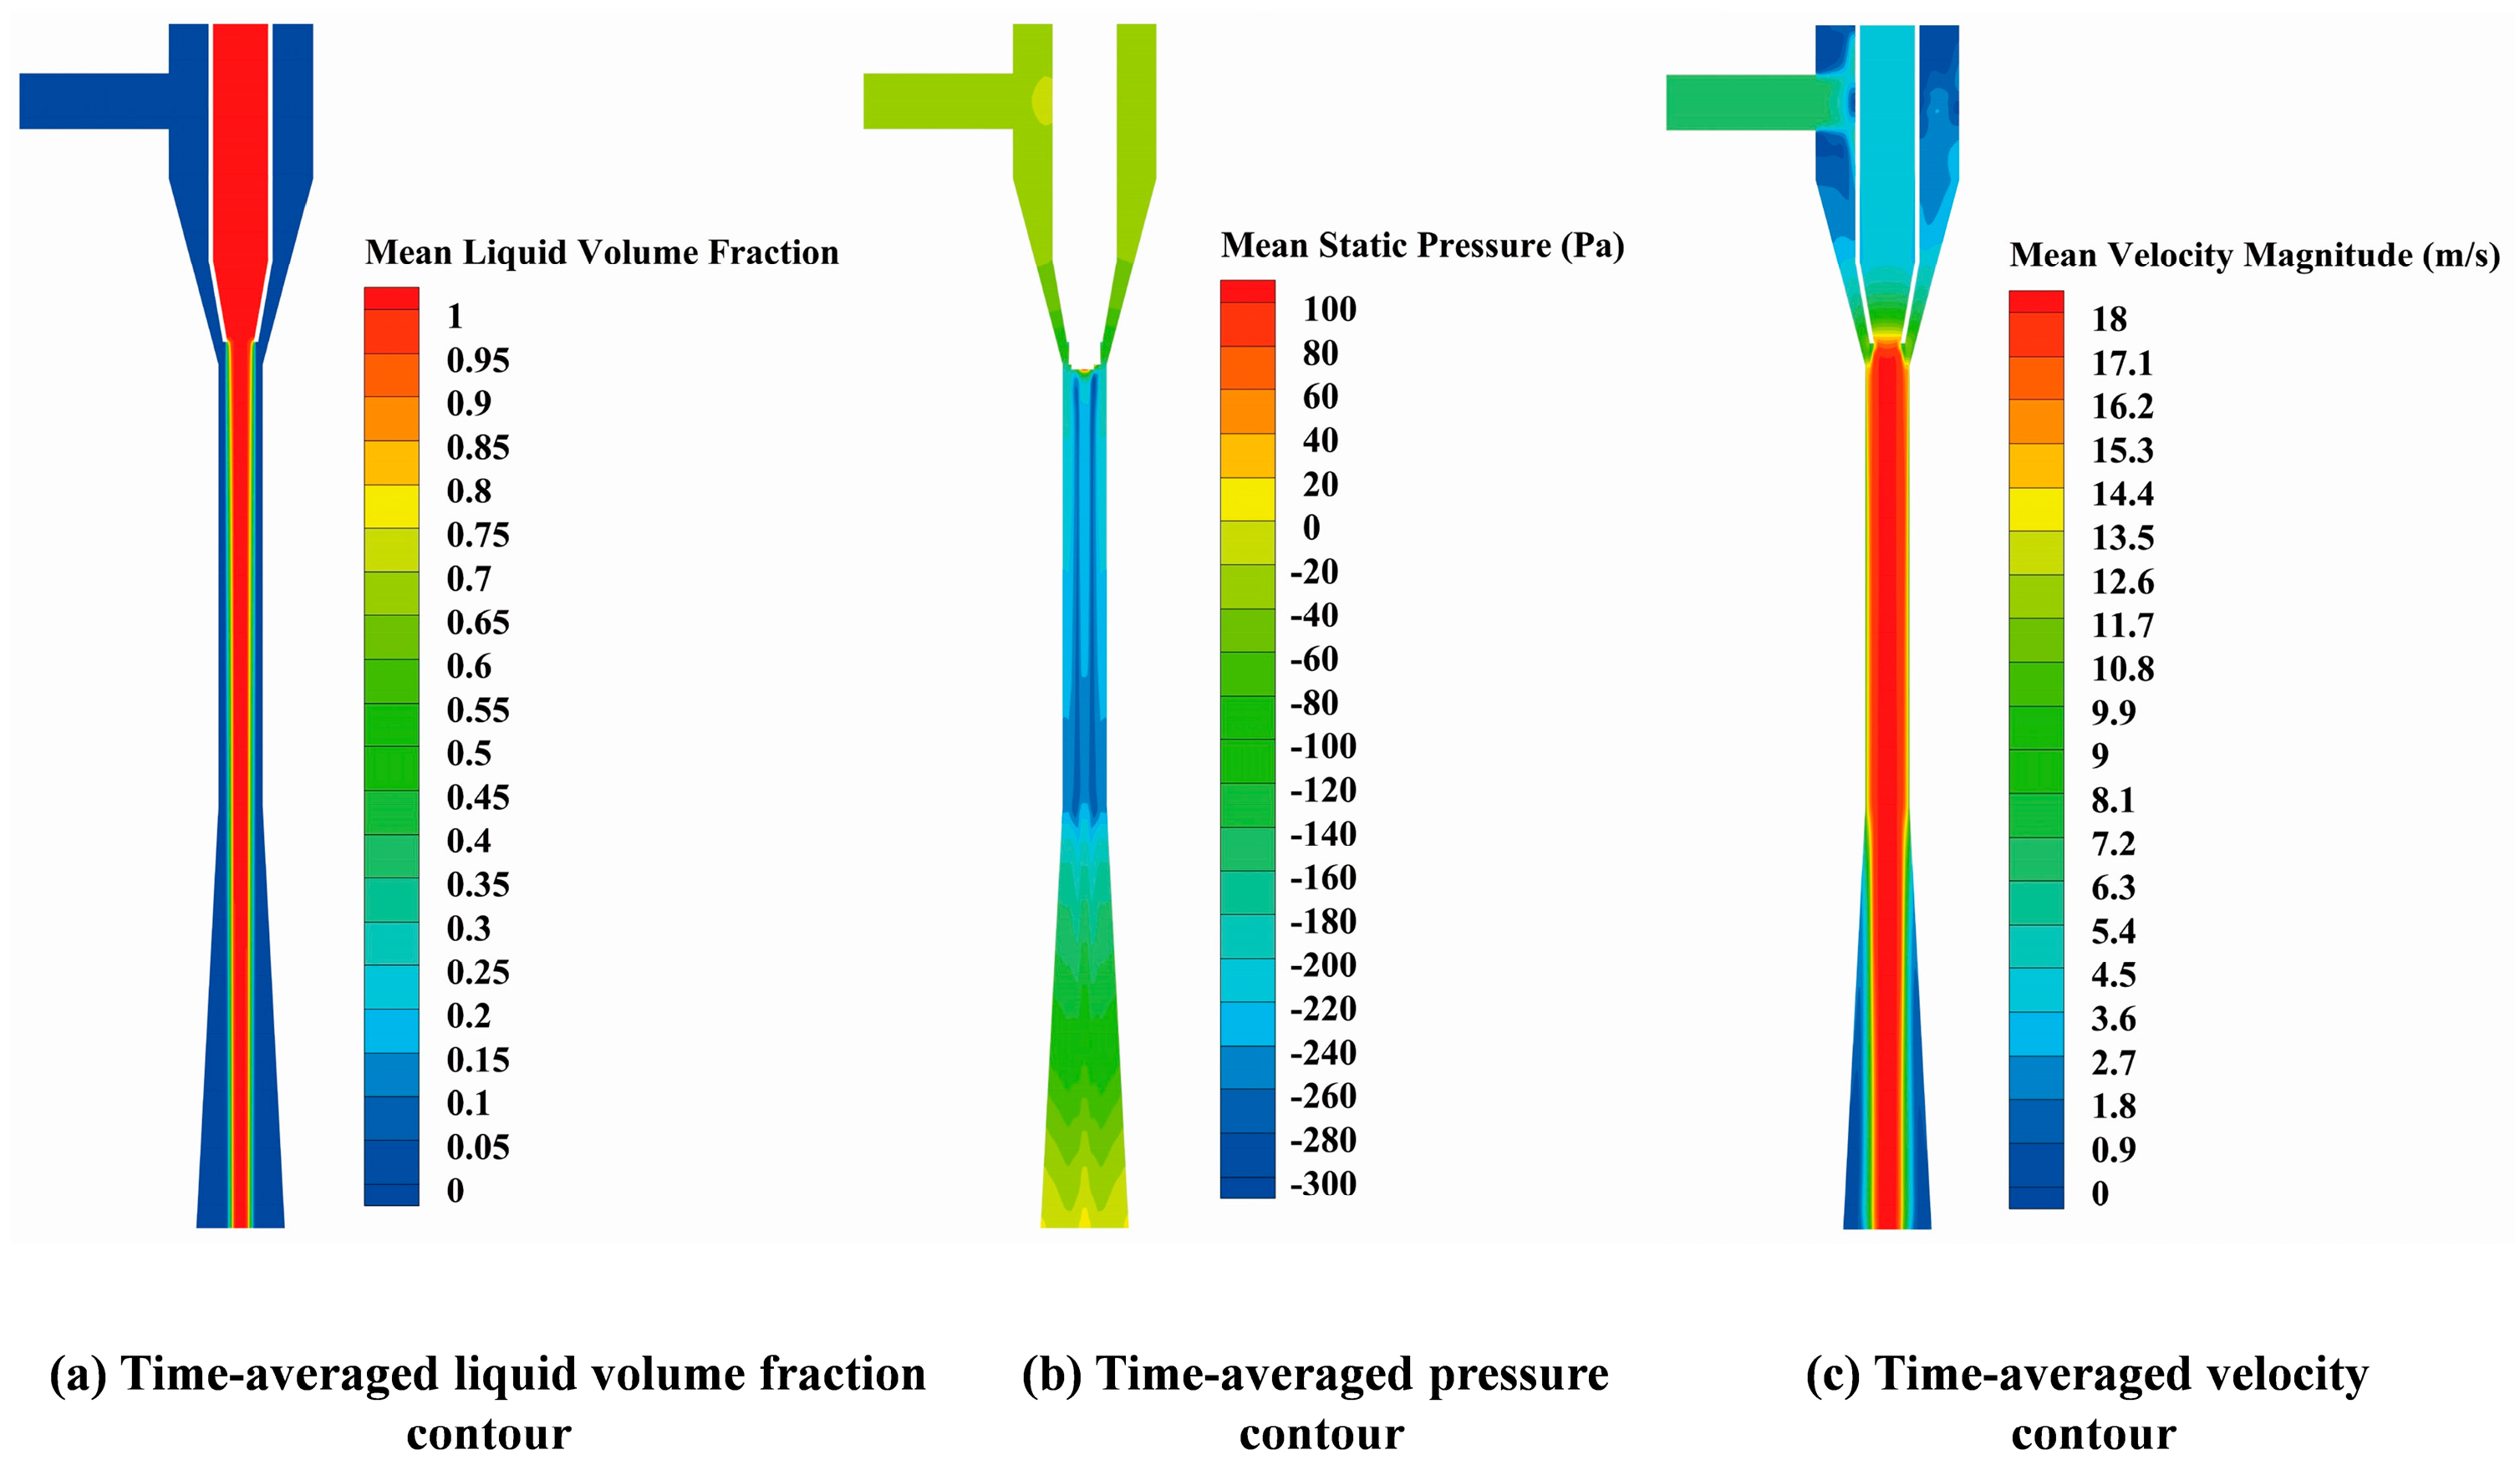
Figure 6 presents the time-averaged liquid volume fraction, pressure, and velocity contours on the central plane of the model at a nozzle exit velocity of 16.78 m/s. It shows that the working fluid is ejected from the nozzle, creating a low-pressure zone that entrains gas from the suction chamber into the mixing section. The solid boundaries of the mixing section cause the entrained gas to form an annular gas ring around the liquid, which suppresses the diffusion of the liquid jet. As a result, the gas–liquid flow in the entire system exhibits a coaxial flow pattern, resulting in an annular flow regime.
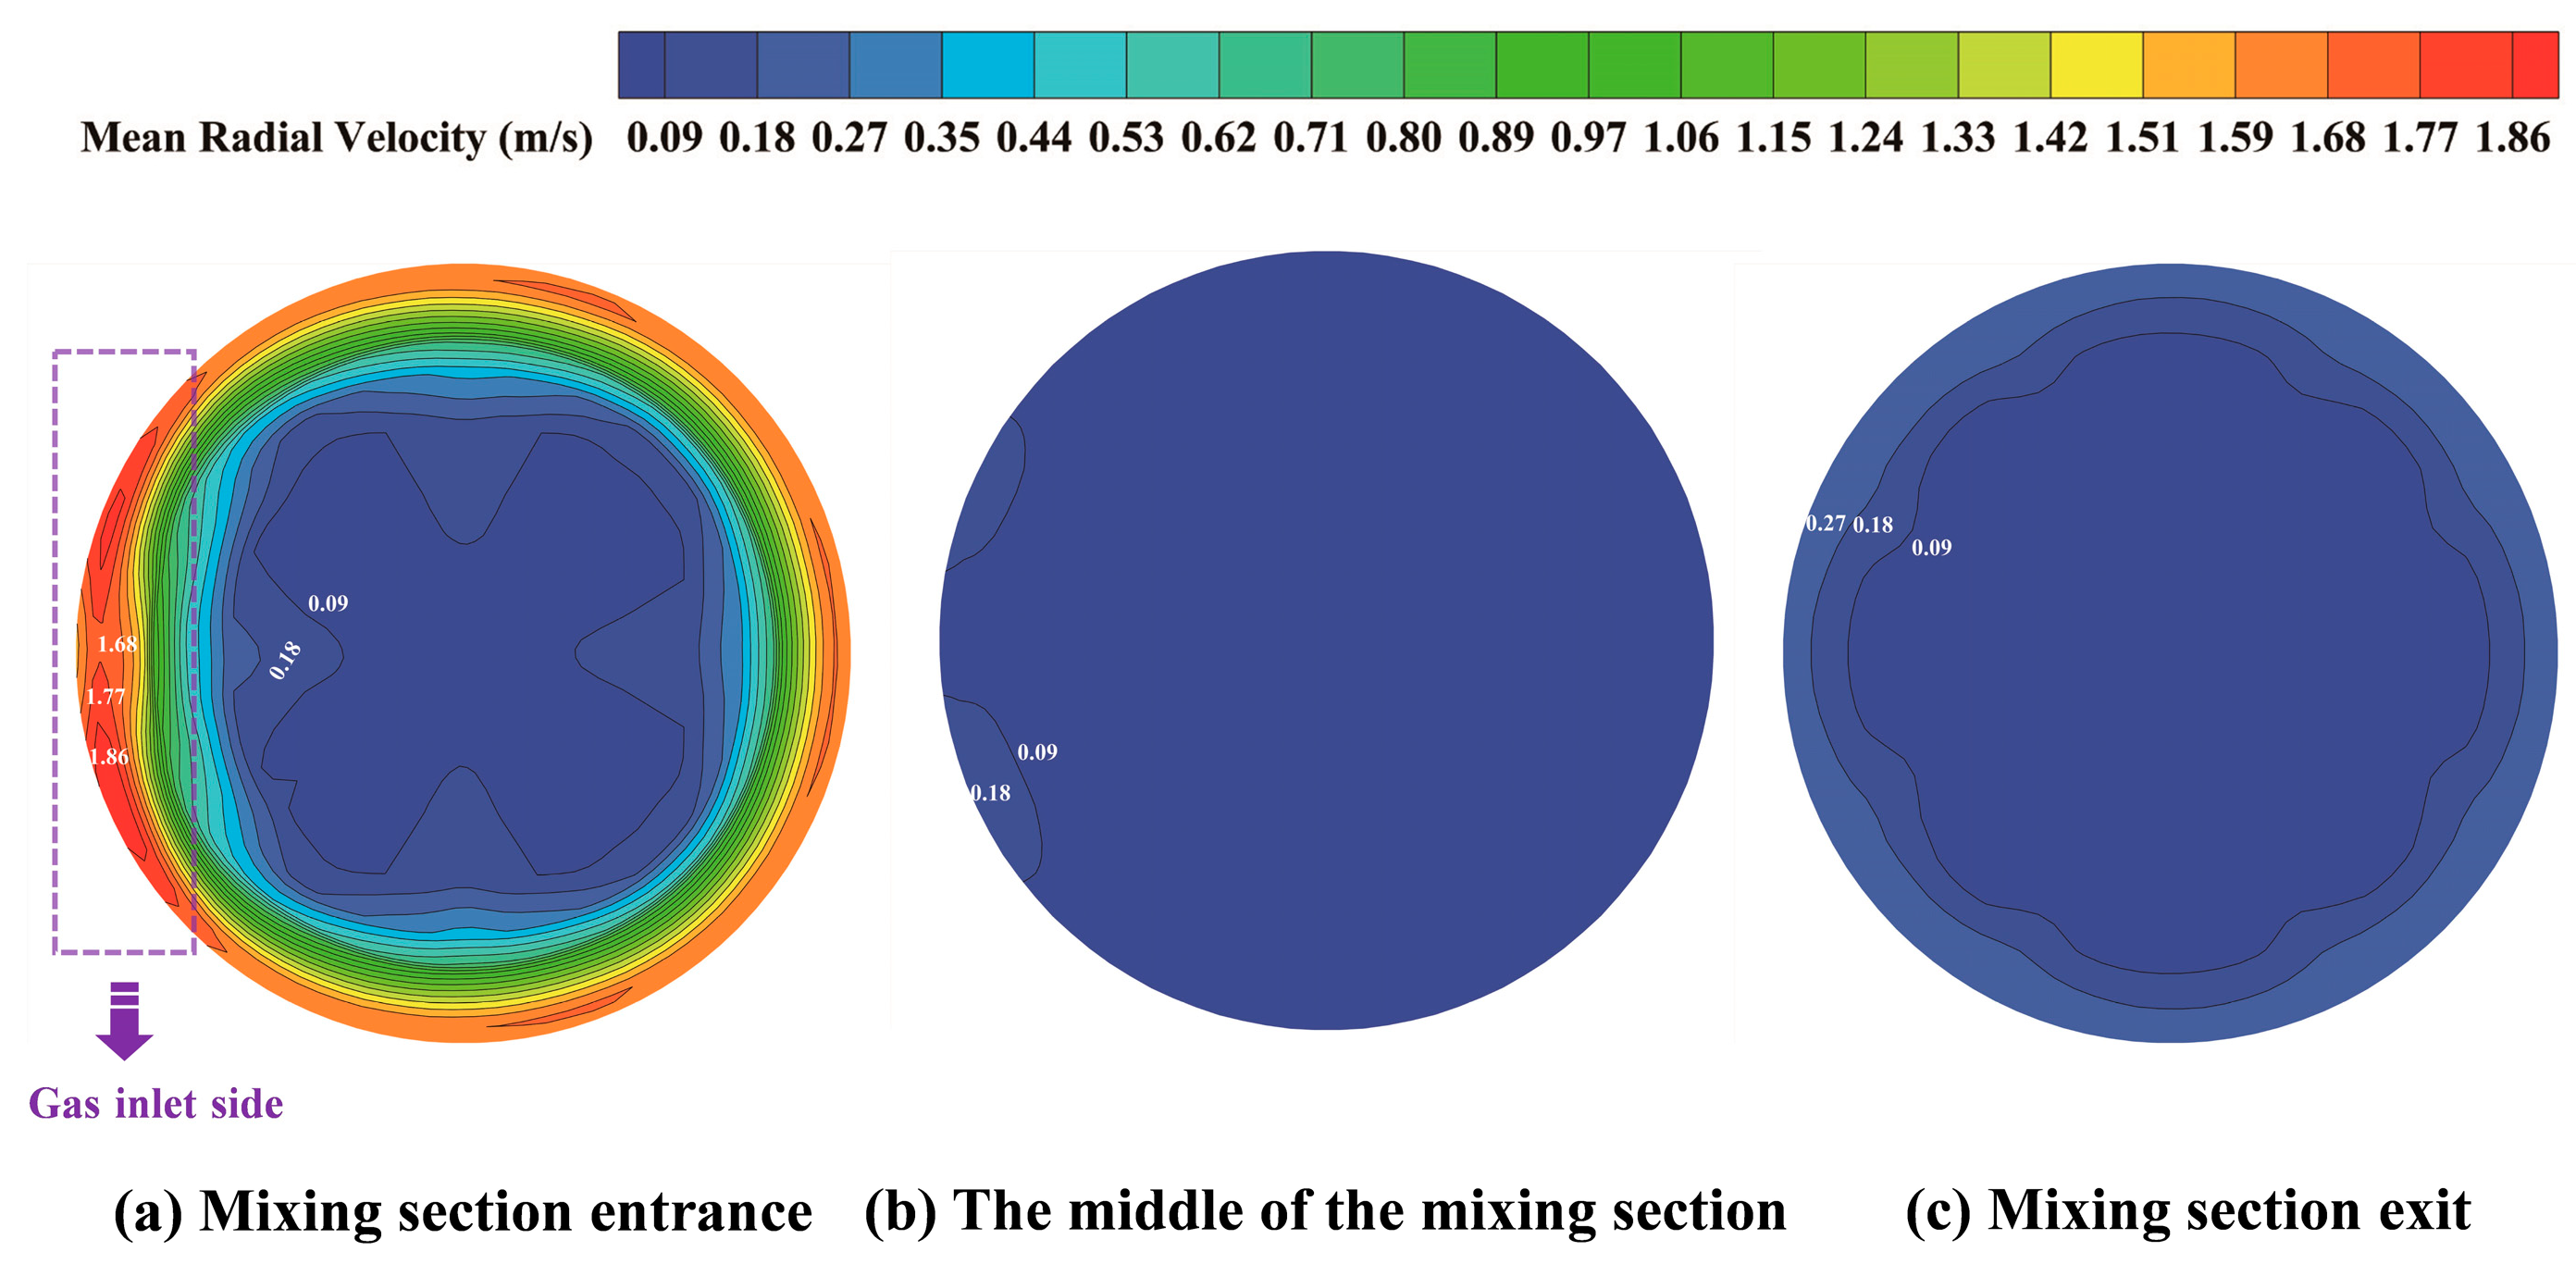
Figure 7 illustrates the time-averaged radial velocity contours at the entrance, middle, and exit sections of the mixing section, highlighting the gas disturbances affecting the interface. The contours reveal non-uniform radial velocity distributions at the inlet, middle, and outlet of the mixing section, with the velocity on the gas inlet side typically being higher. This indicates that the interface within the mixing section is subjected to non-uniform radial gas disturbances.
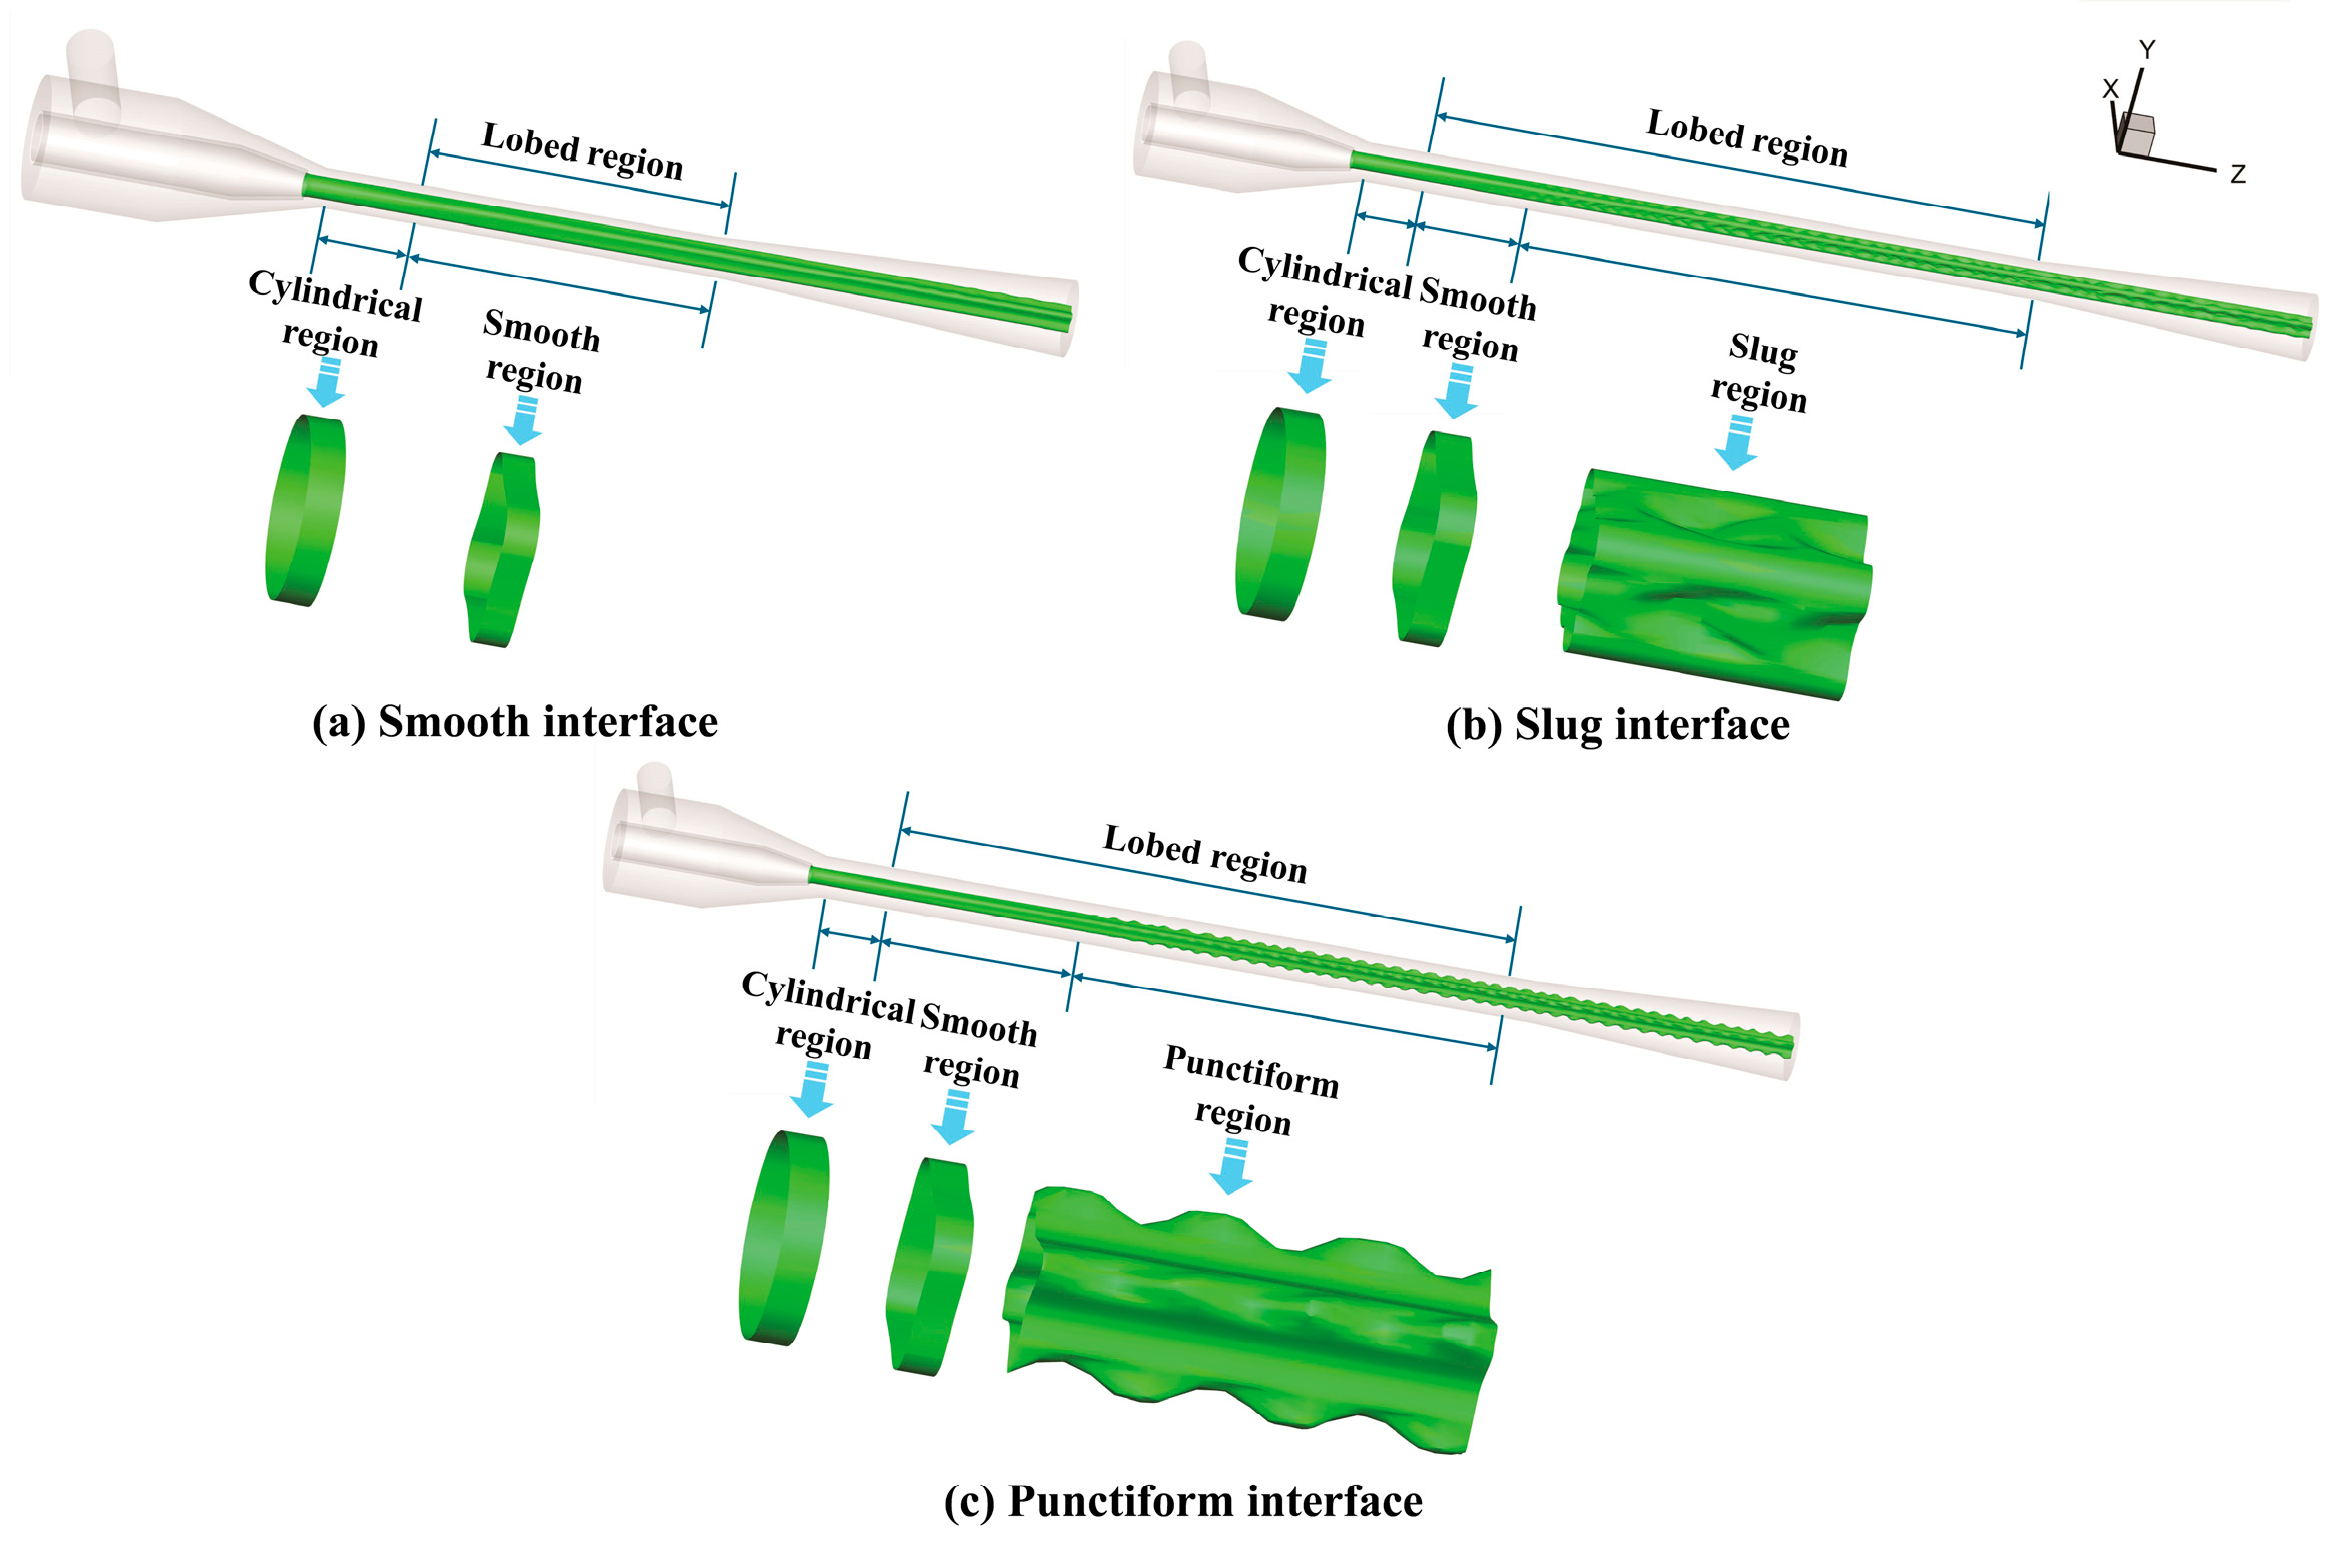
Figure 8 shows three types of instantaneous gas–liquid interfaces (isosurfaces where the gas volume fraction equals 0.5) for different mixing section sizes. It reveals that the gas–liquid interface gradually transitions from a smooth cylindrical shape to a lobed structure along the jet direction. This transition occurs due to the non-uniform gas disturbances within the mixing section, as shown in Figure 7. The gas–liquid interface types in the mixing section are classified according to the interface shape at the outlet of the mixing section. Figure 8a displays a smooth interface characterized by consistently smooth lobed surfaces within the mixing section. Figure 8b shows a slug interface, where pronounced surface waves form on the concave surface near the exit of the mixing section, leading to irregular pits. Figure 8c presents a punctiform interface, characterized by distinct surface waves on the convex surface near the exit of the mixing section, causing irregular protrusions.

3.2. Effect of Mixing Section Structure on Gas–Liquid Interface

Altering the structure of the mixing section inevitably affects the structures of the suction chamber and diffuser section. Therefore, to minimize the impact of the structure of the mixing section, dimensionless parameters DM/DN and LM/DM are introduced, and the length and contraction angle of the suction chamber and diffuser section are kept constant.
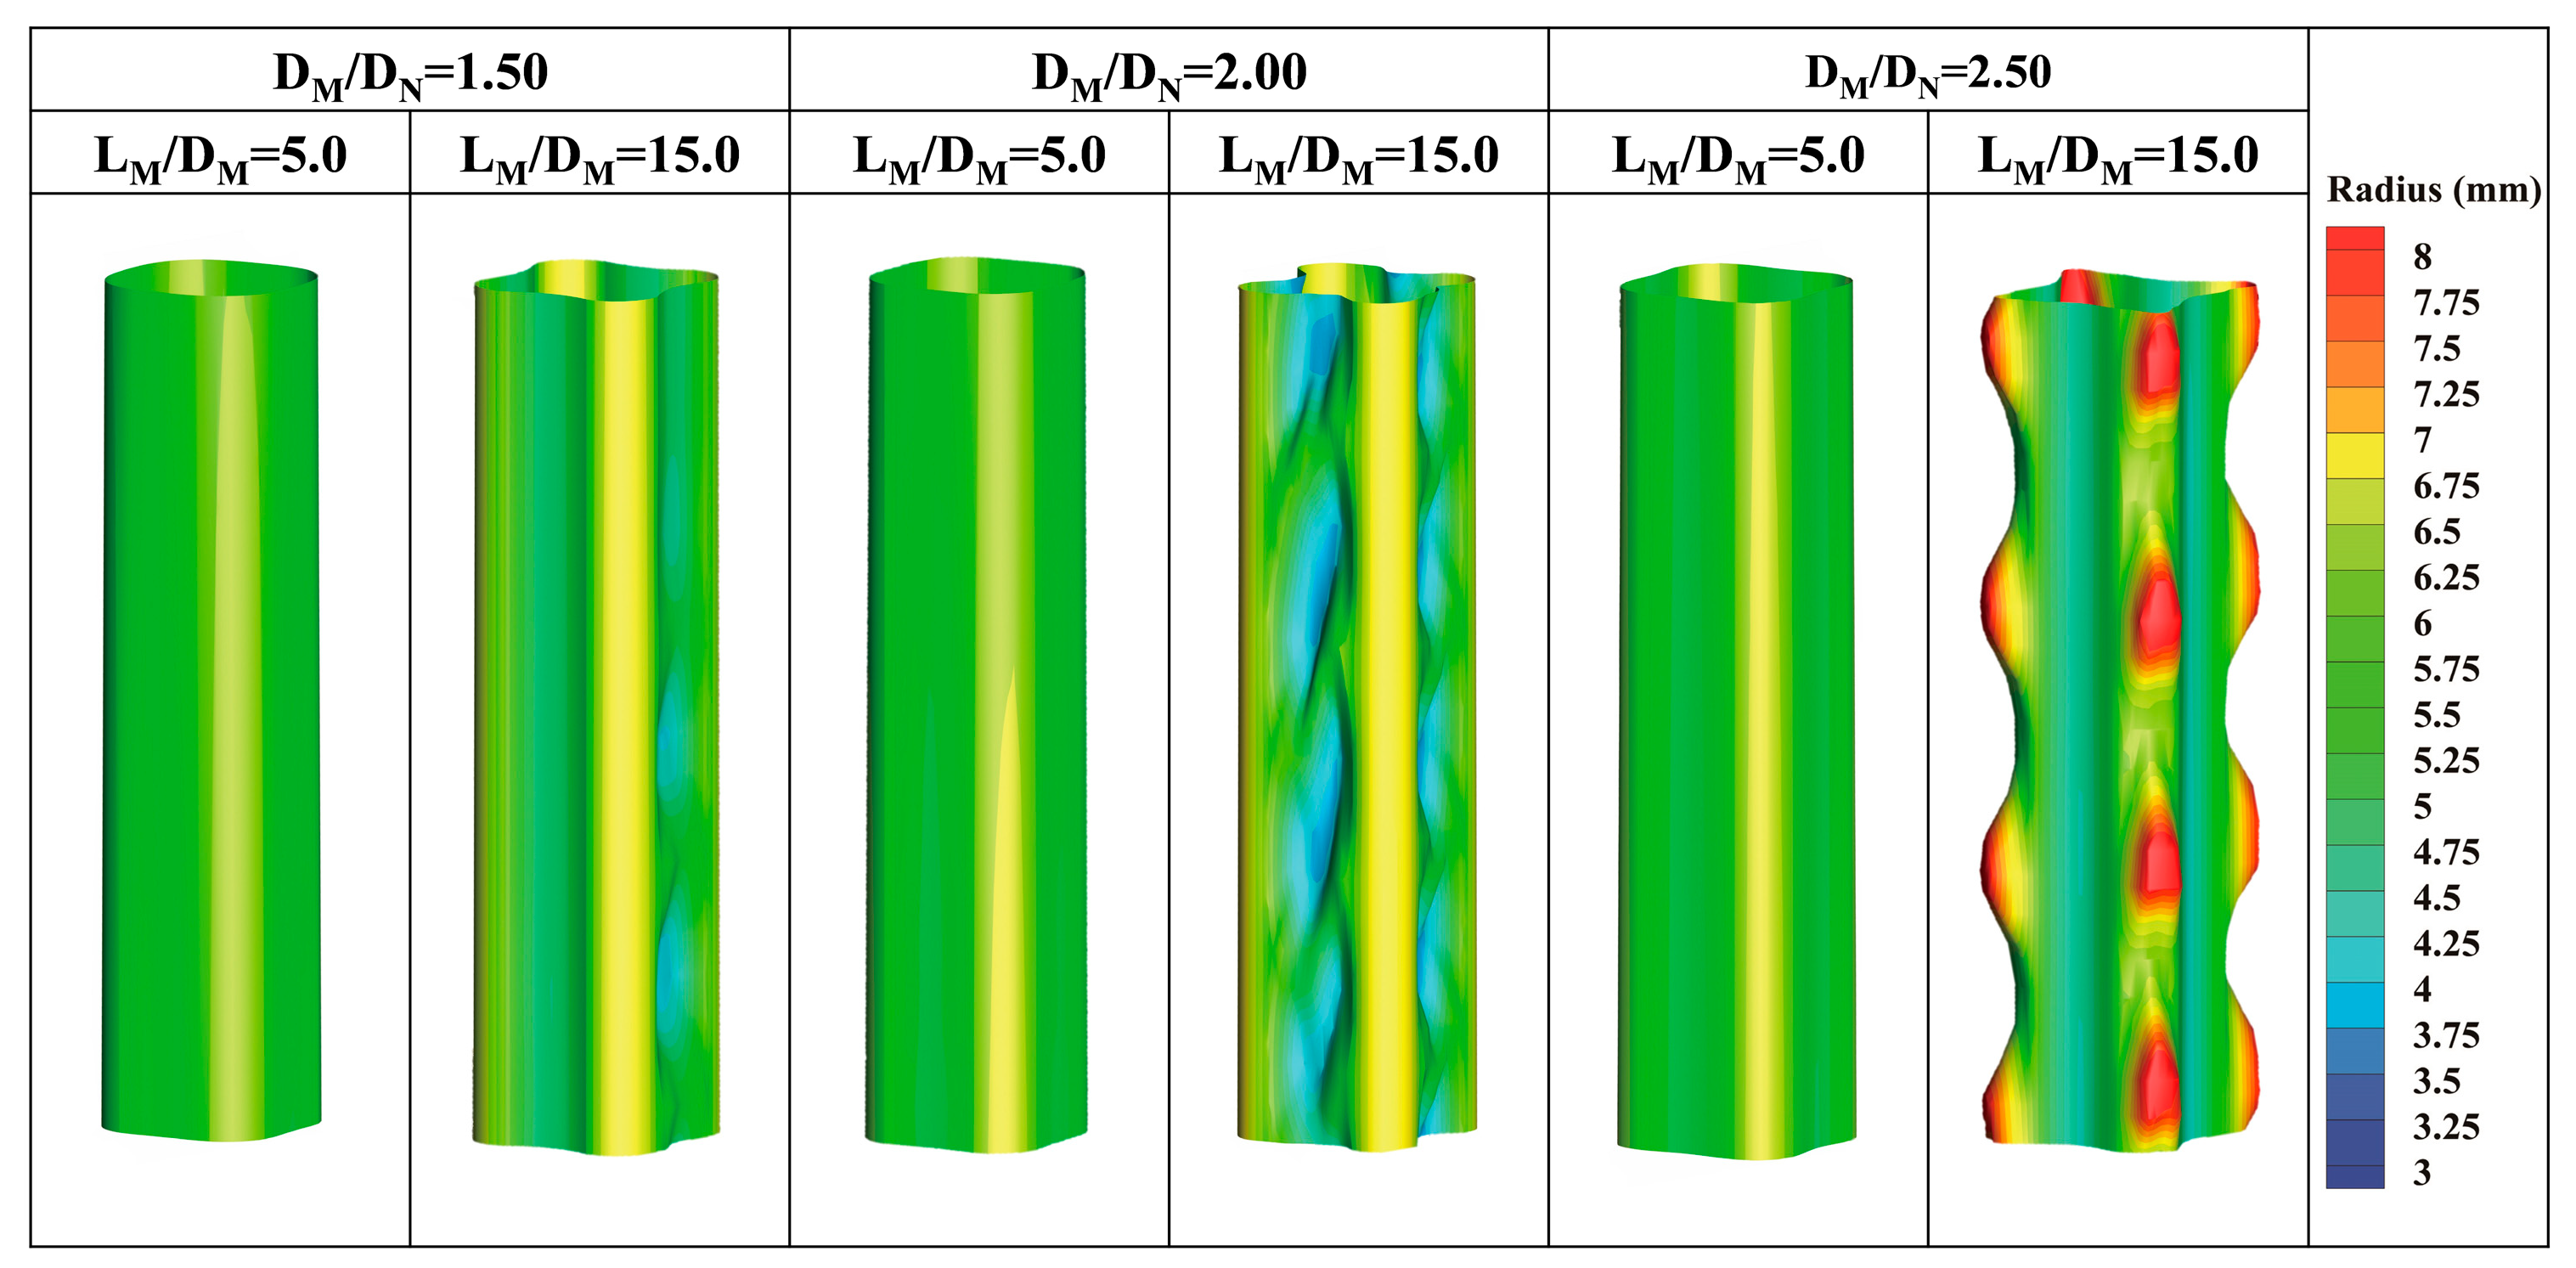
Figure 9 presents the three-dimensional instantaneous radius contours of the gas–liquid interface near the mixing section exit under different DM/DN and LM/DM to elucidate the effect of the mixing section structure on the gas–liquid interface. It shows that as LM/DM increases, the gas–liquid interface near the mixing section exit transitions from smooth to slug or punctiform. This transition is due to the friction between the lobed interface and the environment during jet flow, with increased mixing section length enhancing the frictional force between the gas and liquid, thereby reducing the stability of the jet surface. As DM/DN increases, the gas–liquid interface near the mixing section exit undergoes a transition from smooth to slug and then from slug to punctiform. This transition occurs because surface waves can be induced by shear gas flow parallel to the liquid surface. According to the Kelvin–Helmholtz instability mechanism, surface waves are generated when the velocity difference near the interface exceeds a certain threshold [36]. Moreover, the width of surface waves formed on the concave surface of the lobes increases with the gas–liquid velocity difference. Due to the limitations of the convex surfaces of the lobes, the surface waves become sharper when the width of the waves on the concave surface approaches the width of the convex surfaces. When the width of the surface waves exceeds that of the concave surface, the waves start to appear on the convex surface.
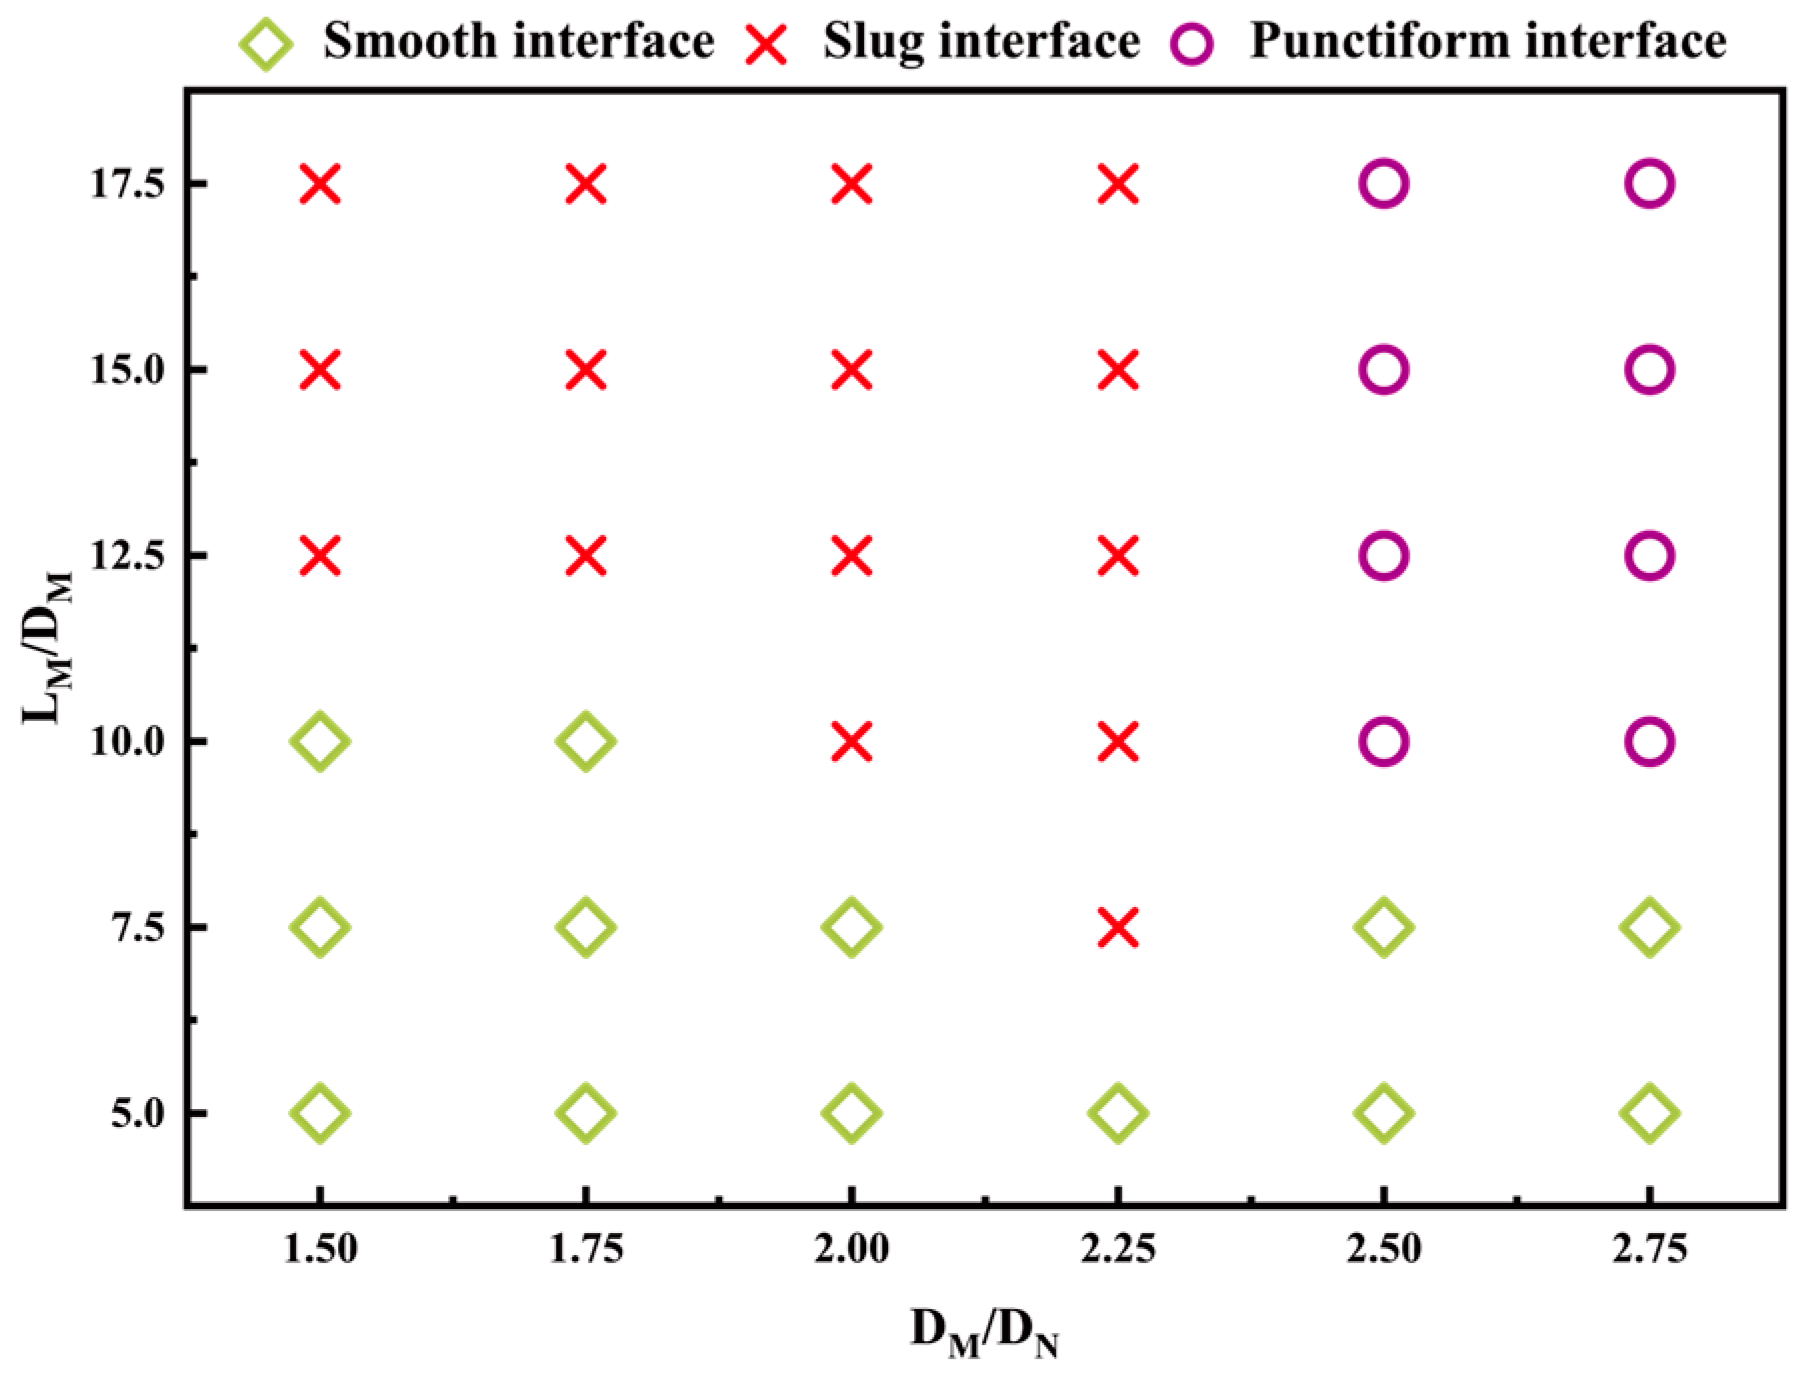
Figure 10 shows the types of interfaces under different DM/DN and LM/DM. It indicates that smooth interfaces primarily occur at lower DM/DN or LM/DM values. In fact, under these conditions, the friction between the lobed interface and the environment in the mixing section is weak, resulting in a relatively stable jet and a smooth interface surface. When DM/DN ≤ 2.25 and LM/DM reaches a critical value, slug interfaces start to appear, and the critical value decreases as DM/DN increases. Usually, with an increase in DM/DN, the length of the mixing section increases under the same LM/DM, leading to higher frictional resistance within the mixing section, thereby reducing the stability of the jet surface. Punctiform interfaces only appear when DM/DN ≥ 2.5 and LM/DM ≥ 10, as the formation of punctiform interfaces requires the surface wave width to exceed the width of the concave surface. Additionally, since the surface area of the convex surfaces is smaller than that of the concave surfaces, a longer mixing section is required to ensure sufficient frictional resistance to generate surface waves.

3.3. Effect of Gas–Liquid Interface on Gas–Liquid Volume Ratio

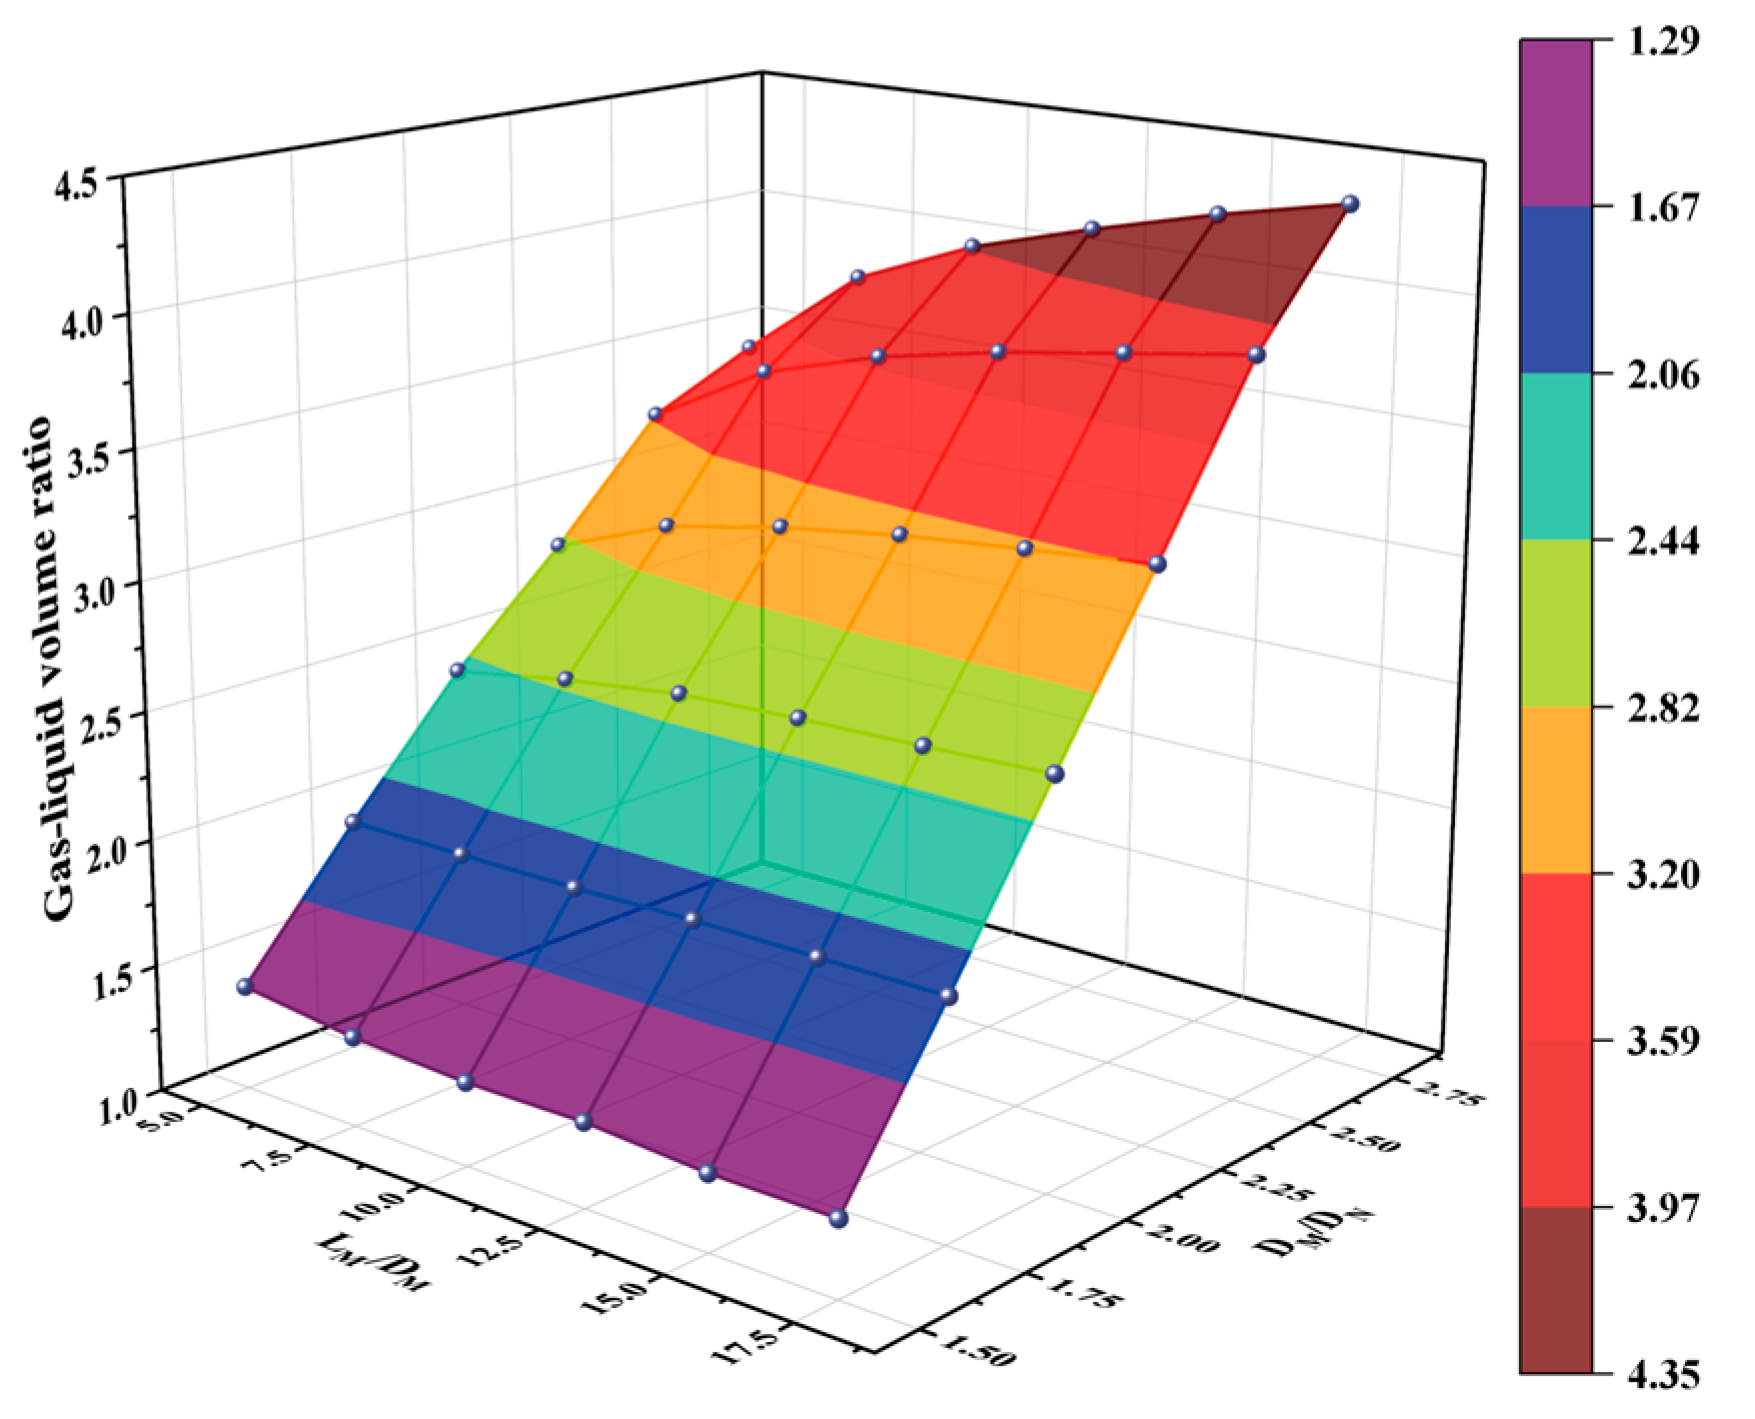
Figure 11 shows the variation in the gas–liquid volumetric ratio under different DM/DN and LM/DM. It can be observed that when DM/DN = 2 and LM/DM > 7.5 or DM/DN ≤ 1.75, the change in the gas–liquid volumetric ratio with increasing LM/DM is negligible (< 2%). In contrast, as LM/DM increases, the gas–liquid volumetric ratio also increases correspondingly. When LM/DM remains constant, the gas–liquid volumetric ratio significantly increases with increasing DM/DN. However, once DM/DN reaches 2.5, the rate of increase in the gas–liquid volumetric ratio slows down.
Figure 12a illustrates the variation in gas-phase axial velocity under different DM/DN and LM/DM. By comparing Figure 11 and Figure 12a, it is evident that when DM/DN remains constant, the trend in gas-phase axial velocity variation with increasing LM/DM is consistent with the variation in the gas–liquid volumetric ratio. This indicates that the gas–liquid volumetric ratio is primarily influenced by the gas-phase axial velocity. In fact, the entrainment rate is mainly determined by the gas phase and the entrainment near the gas–liquid interface. The entrainment within the gas phase is governed by the combined effects of the gas flow area and axial velocity, while the entrainment near the gas–liquid interface is mainly determined by the axial velocity near the gas–liquid interface (approximately the axial velocity of the gas–liquid interface) due to the relatively small variation in the flow area.
Figure 12b displays the variation in radial velocity at the gas–liquid interface under different DM/DN and LM/DM. The overall trend shows that the radial velocity of the gas–liquid interface gradually decreases with increasing LM/DM, leading to a weakening of the radial flow near the interface and consequently reducing the pressure loss of the gas within the mixing section. Simultaneously, the increase in the length of the mixing section leads to an increase in flow resistance. Therefore, when DM/DN ≤ 1.75 or DM/DN = 2 and LM/DM > 7.5, a smaller mixing section diameter or a longer mixing section results in greater gas flow resistance. The reduced pressure loss due to the increased length at the gas–liquid interface of the mixing section offsets the increased flow resistance, rendering the effect on the gas–liquid volumetric ratio negligible. Conversely, a larger mixing section diameter or a shorter mixing section leads to a lower gas flow resistance, and the reduction in pressure loss due to the increased length at the gas–liquid interface of the mixing section exceeds the increase in flow resistance, resulting in an increase in the gas–liquid volumetric ratio with increasing LM/DM.
By comparing Figure 11 and Figure 12a, it is observed that when LM/DM remains constant, the gas-phase axial velocity significantly decreases as DM/DN increases due to the increased flow area, while the gas–liquid volumetric ratio significantly increases. This finding is consistent with the results of Yadav et al. [13], who demonstrated that the gas-phase pressure loss in the suction chamber significantly decreases as the gas-phase axial velocity decreases, thereby substantially increasing the gas–liquid volumetric ratio. Additionally, the rate of decrease in gas-phase axial velocity is relatively constant. Therefore, when DM/DN = 2.5, the slowdown in the rate of increase in the gas–liquid volumetric ratio with increasing DM/DN is not caused by changes in gas-phase axial velocity but rather by the transition from a slug interface to a punctiform interface (see Figure 10), leading to a decrease in the axial velocity of the gas–liquid interface.
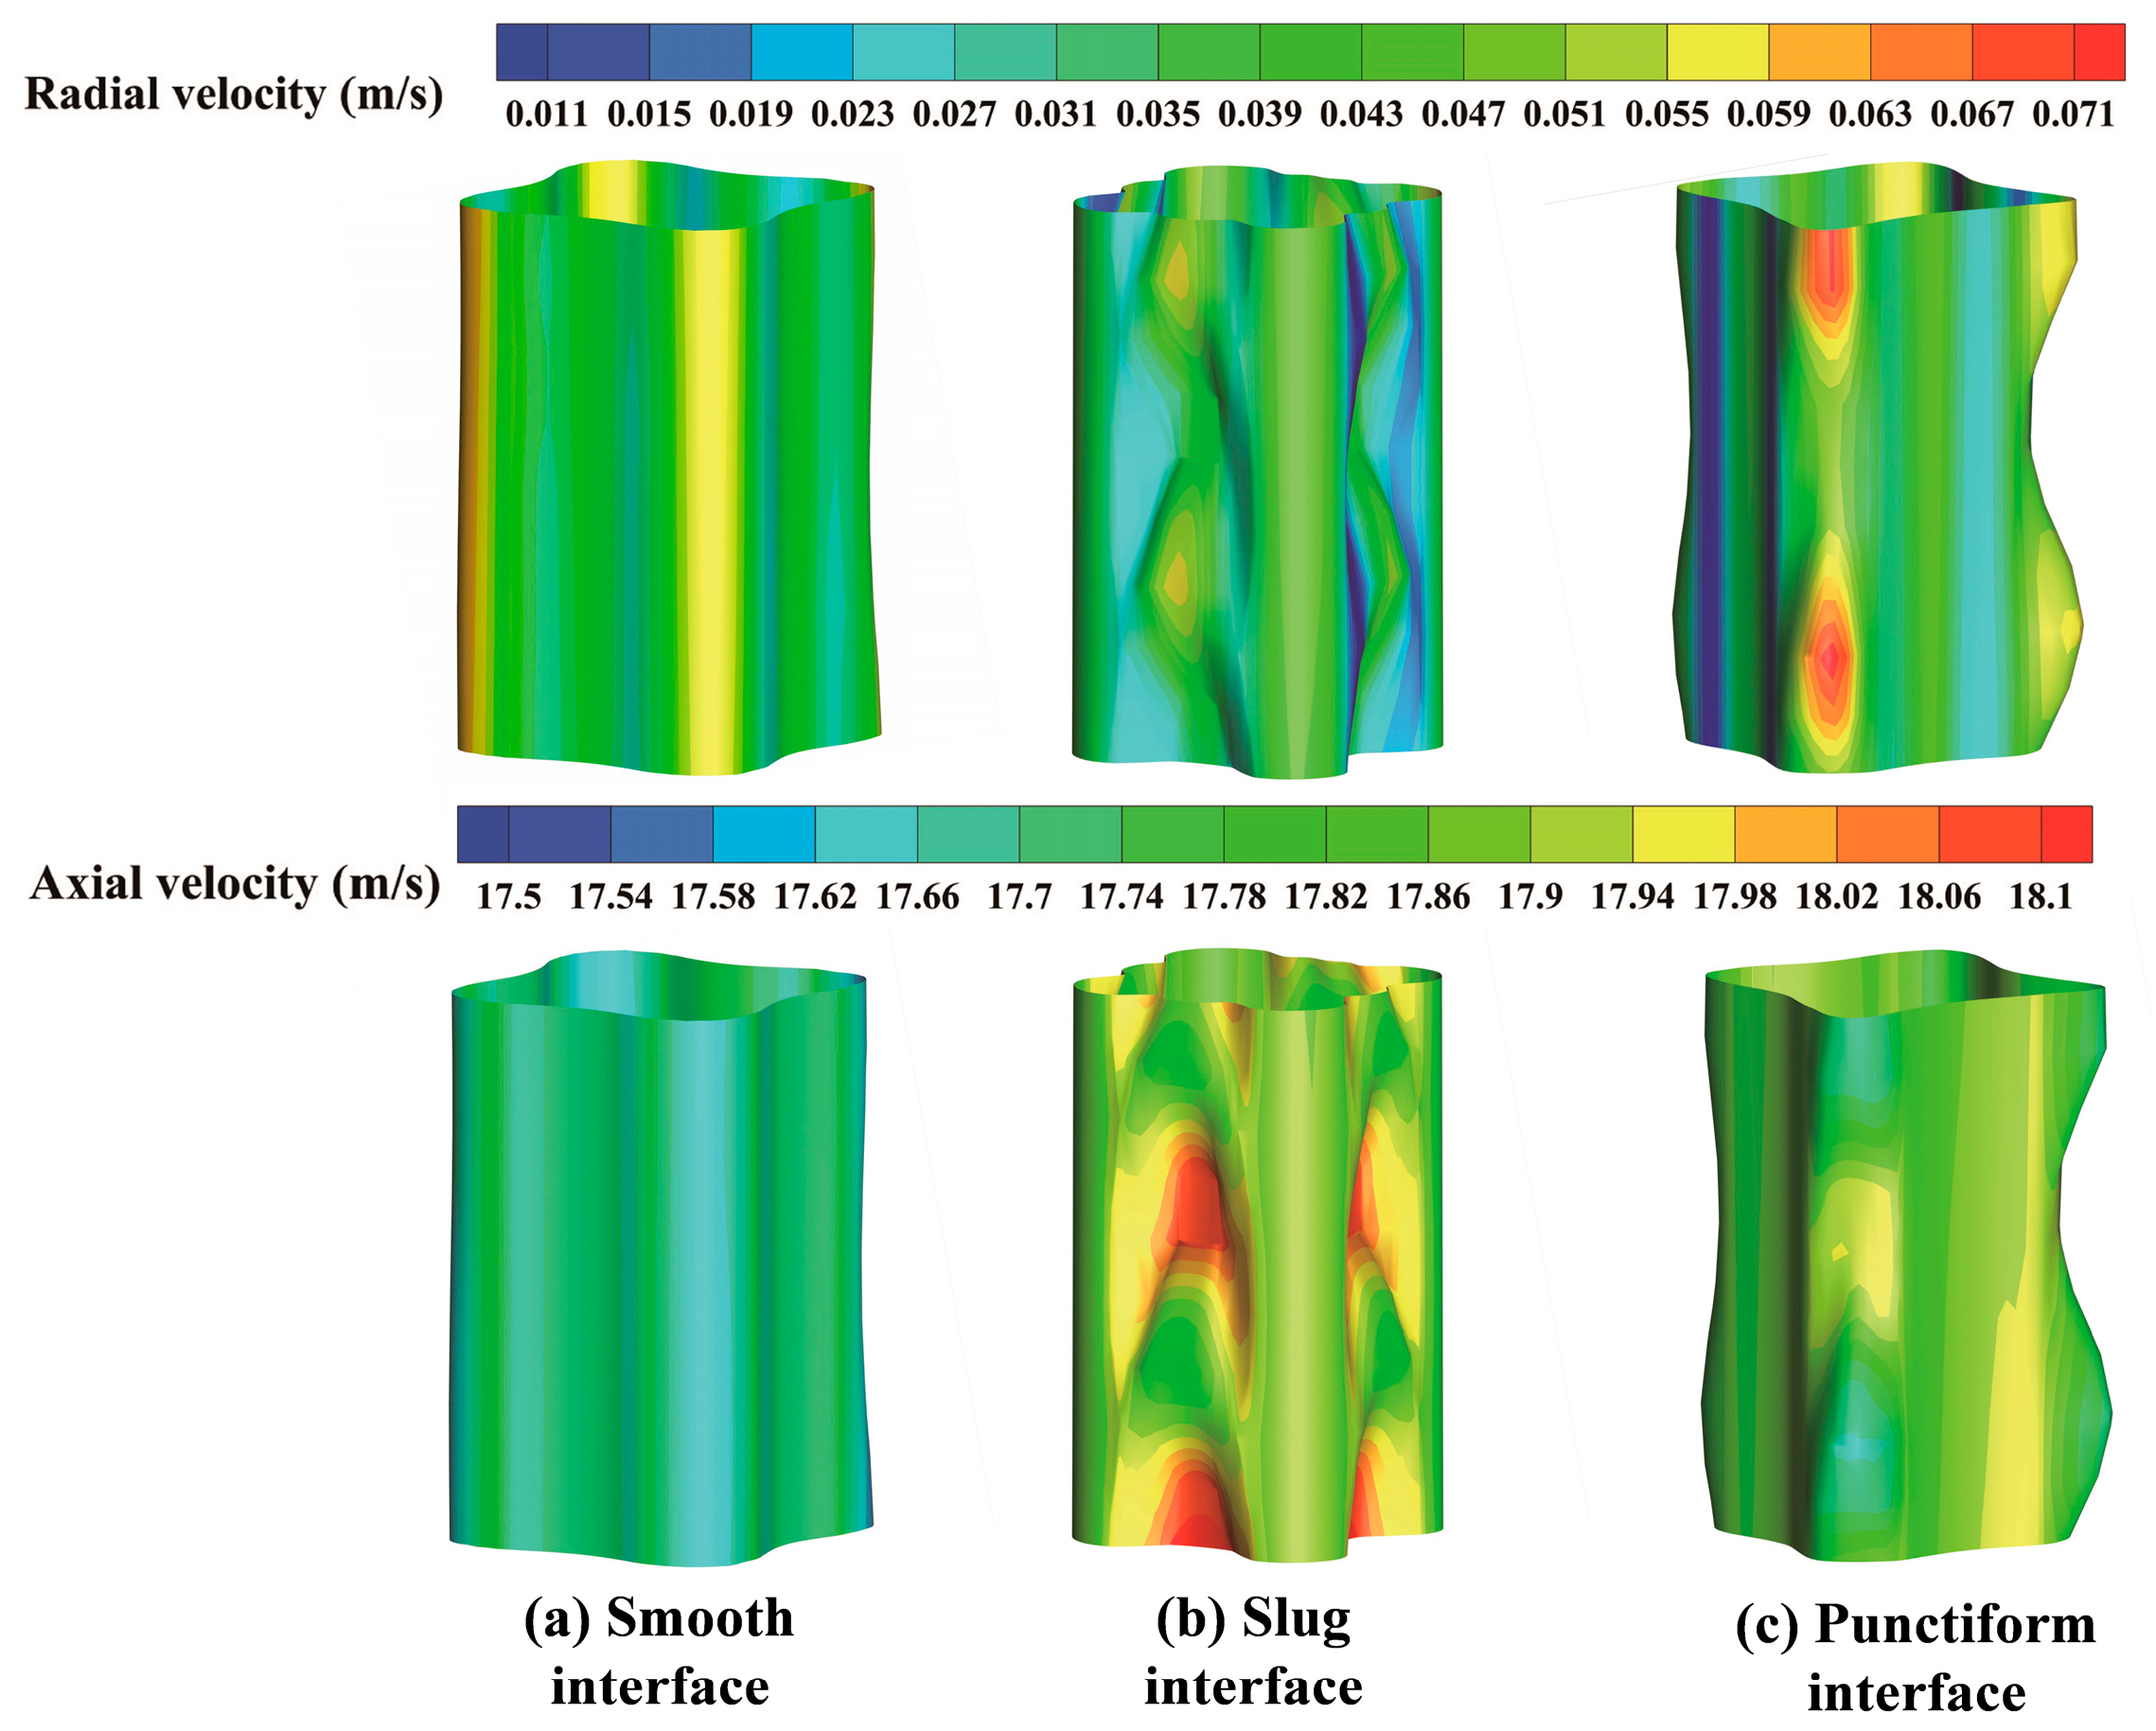
Figure 13 shows the radial and axial velocity contours of three different types of local gas–liquid interfaces at the same height, aiming to illustrate the effect of interface type on the nearby radial and axial flows. It demonstrates that radial velocity is larger in the convex regions of the lobes and smaller in the concave regions, with a noticeable reduction in radial velocity on the convex side of the lobes in slug and punctiform interfaces. This is mainly due to the fact that fluid diffusion over concave and convex surfaces generates radial velocity that cancels each other out. The axial velocity follows the order: smooth interface < punctiform interface < slug interface. Normally the gas at the interface is entrained by the liquid, causing the interface velocity to be primarily controlled by the liquid. Meanwhile, the radial velocity of the liquid is negligible compared to the axial velocity. According to the law of mass conservation, as the liquid passes through the lobed interface and surface waves, the streamlines bend, increasing the path length. To maintain a constant fluid mass per unit time, the liquid must accelerate as it passes through the lobed and surface wave regions to cover the longer path. Therefore, as the lobed and surface wave regions increase, the axial velocity of the interface also increases.

4. Conclusions

In this paper, the accuracy of the numerical model in predicting the entrainment behavior of the Venturi injector was validated through experimental measurements of the entrainment rate. Additionally, the effect of the gas–liquid interface structure within the mixing section on entrainment behavior was investigated by varying the mixing section geometry. The parameters DM/DN and LM/DM were used to characterize the mixing section structure, minimizing the influence of structural changes in the suction chamber and diffuser section. The main conclusions are as follows:
1.
Along the jet flow direction, the gas–liquid interface gradually transitions from a smooth cylindrical shape to a lobed pattern. The smooth interface predominantly occurs at low DM/DN or LM/DM. The slug interface primarily appears when DM/DN ≤ 2.25 and LM/DM exceeds a certain critical value, while the punctiform interface only emerges when DM/DN ≥ 2.5 and LM/DM ≥ 10.
2.
The presence of lobed and surface wave structures can reduce the radial flow near the gas–liquid interface, thereby decreasing gas-phase pressure losses. When the gas flow resistance is low (i.e., DM/DN = 2 and LM/DM ≤ 7.5 or DM/DN > 1.75), the lobed interface and surface waves cause the gas-phase axial velocity to increase with LM/DM, subsequently enhancing the gas–liquid volumetric ratio.
3.
The lobed and surface wave structures can increase the axial flow near the gas–liquid interface. However, as DM/DN increases from 2.25 to 2.5, the slug interface transitions to a punctiform interface. This transition significantly reduces the surface area of the interface, thereby decreasing the axial velocity at the interface. This phenomenon reduces the axial flow near the interface, leading to a slower rate of increase in the gas–liquid volumetric ratio as DM/DN increases.
To accurately capture the annular-mist flow regime, future simulations should incorporate novel grid refinement techniques. Further investigation is required into the effects of temperature variations, external disturbances, and excitations on the gas–liquid interface. Moreover, the integration of advanced multiphase flow detection techniques in subsequent studies could provide more precise insights into interface dynamics, thereby improving the accuracy of CFD predictions.

Author Contributions

Conceptualization, E.X. and Z.M.; methodology, Y.Z., W.Z., E.X. and Z.M.; formal analysis, Y.Z. and W.Z.; resources, E.X. and Z.M.; data curation, Y.Z. and W.Z.; writing—original draft preparation, Y.Z.; writing—review and editing, Y.Z., W.Z., E.X. and Z.M.; visualization, Y.Z.; funding acquisition, E.X. and Z.M. All authors have read and agreed to the published version of the manuscript.

Funding

This research was funded by the National Natural Science Foundation of China under grant numbers 52104275 and 52104279.

Institutional Review Board Statement

Not applicable.

Informed Consent Statement

Not applicable.

Data Availability Statement

The data presented in this study are available upon request from the corresponding authors.

Acknowledgments

The authors acknowledge the contributions of Yongzhi Han to the conceptualization, methodology, and validation of this study and Lefu Xie to the methodology and validation.

Conflicts of Interest

The authors declare no conflict of interest.

References

  1. Hagos, F.Y.; Aziz, A.R.A.; Zainal, E.Z.; Mofijur, M.; Ahmed, S.F. Recovery of gas waste from the petroleum industry: A review. Environ. Chem. Lett. 2022, 20, 263–281. [Google Scholar] [CrossRef]
  2. Hruška, M.; Variny, M.; Haydary, J.; Janošovský, J. Sulfur recovery from syngas in pulp mills with integrated black liquor gasification. Forests 2020, 11, 1173. [Google Scholar] [CrossRef]
  3. Kopac, T. Emerging applications of process intensification for enhanced separation and energy efficiency, environmentally friendly sustainable adsorptive separations: A review. Int. J. Energy Res. 2021, 45, 15839–15856. [Google Scholar] [CrossRef]
  4. Lima, V.N.; Rodrigues, C.S.D.; Borges, R.A.C.; Madeira, L.M. Gaseous and liquid effluents treatment in bubble column reactors by advanced oxidation processes: A review. Crit. Rev. Environ. Sci. Technol. 2018, 48, 949–996. [Google Scholar] [CrossRef]
  5. Warmeling, H.; Janz, D.; Peters, M.; Vorholt, A.J. Acceleration of lean aqueous hydroformylation in an innovative jet loop reactor concept. Chem. Eng. J. 2017, 330, 585–595. [Google Scholar] [CrossRef]
  6. Sharma, S.K.; Bhadauria, A.; Kumar, T.N.; Kumar, R. Purification of industrial effluent by gas hydrate-based (HyPurif) process. J. Clean. Prod. 2023, 420, 138424. [Google Scholar] [CrossRef]
  7. Ughetti, M.; Jussen, D.; Riedlberger, P. The ejector loop reactor: Application for microbial fermentation and comparison with a stirred-tank bioreactor. Eng. Life Sci. 2018, 18, 281–286. [Google Scholar] [CrossRef]
  8. Wu, Y.; Zu, Y.; Xu, E.; Miao, Z.; Wu, D.; Hu, Y. The effect of swirling shear blade on gas-liquid flow pattern and mass transfer performance in Venturi injector. Chem. Eng. Sci. 2024, 299, 120549. [Google Scholar] [CrossRef]
  9. Kim, S.-H.; Kim, S.-M.; Ko, T.; Kim, H.; Yoon, J.; Yoon, W.-S.; Lee, J. Effects of back pressure on flow regime and suction performance of gas–liquid swirl ejector. Int. J. Chem. React. Eng. 2019, 17, 20180264. [Google Scholar] [CrossRef]
  10. Tang, J.; Zhang, Z.; Li, L.; Wang, J.; Liu, J.; Zhou, Y. Influence of driving fluid properties on the performance of liquid-driving ejector. Int. J. Heat Mass Transf. 2016, 101, 20–26. [Google Scholar] [CrossRef]
  11. Duan, Z.; Li, W.; Lin, L.; Qu, R.; Li, S.; Zhang, J. Investigation on gas induction of liquid–gas ejector in jet loop reactor. Int. J. Chem. React. Eng. 2021, 19, 1271–1285. [Google Scholar] [CrossRef]
  12. Xu, E.; Jiang, X.; Ding, L. Optimizing conical nozzle of venturi ejector in ejector loop reactor using computational fluid dynamics. Korean J. Chem. Eng. 2020, 37, 1829–1835. [Google Scholar] [CrossRef]
  13. Yadav, R.L.; Patwardhan, A.W. Design aspects of ejectors: Effects of suction chamber geometry. Chem. Eng. Sci. 2008, 63, 3886–3897. [Google Scholar] [CrossRef]
  14. Sharma, D.V.; Patwardhan, A.W.; Ranade, V.V. Estimation of gas induction in jet loop reactors: Influence of nozzle designs. Chem. Eng. Res. Des. 2017, 125, 24–34. [Google Scholar] [CrossRef]
  15. He, H.; Liu, X.; Pan, Q.; Lu, Q.; Ren, Q.; Pan, L. Experimental and theoretical study on formation of interfacial waves on liquid film of annular two-phase flow. Nucl. Eng. Des. 2022, 389, 111683. [Google Scholar] [CrossRef]
  16. Rivera, Y.; Berna, C.; Muñoz-Cobo, J.L.; Escrivá, A.; Córdova, Y. Experiments in free falling and downward cocurrent annular flows—Characterization of liquid films and interfacial waves. Nucl. Eng. Des. 2022, 392, 111769. [Google Scholar] [CrossRef]
  17. Cuadros, J.L.; Rivera, Y.; Berna, C.; Escrivá, A.; Muñoz-Cobo, J.L.; Monrós-Andreu, G.; Chiva, S. Characterization of the gas-liquid interfacial waves in vertical upward co-current annular flows. Nucl. Eng. Des. 2019, 346, 112–130. [Google Scholar] [CrossRef]
  18. Weber, C. Zum Zerfall eines Flüssigkeitsstrahles. Z. Angew. Math. Mech. 1931, 11, 136–154. [Google Scholar] [CrossRef]
  19. Rayleigh, L. On the instability of jets. Proc. Lond. Math. Soc. 1878, 1, 4–13. [Google Scholar] [CrossRef]
  20. De, L.; Sterza, R.; de Mendonca, M.T.; de Souza, L.F.; Brandi, A.C. Investigation of the stability of a planar Oldroyd-B jet. J. Braz. Soc. Mech. Sci. Eng. 2023, 45, 251. [Google Scholar] [CrossRef]
  21. Huerre, P.; Monkewitz, P.A. Absolute and convective instabilities in free shear layers. J. Fluid Mech. 1985, 159, 151. [Google Scholar] [CrossRef]
  22. Arratia, C.; Mowlavi, S.; Gallaire, F. Absolute/convective secondary instabilities and the role of confinement in free shear layers. Phys. Rev. Fluids 2018, 3, 053901. [Google Scholar] [CrossRef]
  23. Vadivukkarasan, M. Transition from absolute to convective instability in a compound jet. Eur. J. Mech. B/Fluids 2020, 84, 186–192. [Google Scholar] [CrossRef]
  24. Poole, R.; Turner, M.R. Stability of jets and wakes confined by compliant walls. Phys. Rev. Fluids 2023, 8, 063901. [Google Scholar] [CrossRef]
  25. Bhutada, S.R.; Pangarkar, V.G. Gas induction and hold-up characteristics of liquid jet loop reactors: Power law fluids. Chem. Eng. Sci. 1988, 43, 2904–2907. [Google Scholar] [CrossRef]
  26. Cramers, P.H.M.R.; Beenackers, A.A.C.M. Influence of the ejector configuration, scale and the gas density on the mass transfer characteristics of gas–liquid ejectors. Chem. Eng. J. 2001, 82, 131–141. [Google Scholar] [CrossRef]
  27. Dirix, C.A.M.C.; Van Der Wiele, K. Mass transfer in jet loop reactors. Chem. Eng. Sci. 1990, 45, 2333–2340. [Google Scholar] [CrossRef]
  28. Farokhipour, A.; Mansoori, Z.; Saffar-Avval, M.; Ahmadi, G. 3D computational modeling of sand erosion in gas-liquid-particle multiphase annular flows in bends. Wear 2020, 450–451, 203241. [Google Scholar] [CrossRef]
  29. Che, S.; Breitenmoser, D.; Infimovskiy, Y.Y.; Manera, A.; Petrov, V. CFD Simulation of Two-Phase Flows in Helical Coils. Front. Energy Res. 2020, 8, 65. [Google Scholar] [CrossRef]
  30. Srinivasan, V.; Salazar, A.J.; Saito, K. Modeling the disintegration of modulated liquid jets using volume-of-fluid (VOF) methodology. Appl. Math. Model. 2011, 35, 3710–3730. [Google Scholar] [CrossRef]
  31. Wu, W.; Hu, C.; Hu, J.; Yuan, S.; Zhang, R. Jet cooling characteristics for ball bearings using the VOF multiphase model. Int. J. Therm. Sci. 2017, 116, 150–158. [Google Scholar] [CrossRef]
  32. Sekar, M.; Raja, G.G.; Salmen, S.H.; Chinnathambi, A.; Gavurova, B.; Praveenkumar, T.R. Hydrodynamic cavitation phenomena and flow instabilities in wastewater treatment: A multiphase VOF study with a venturi cavitator. J. Taiwan Inst. Chem. Eng. 2024, 105355. [Google Scholar] [CrossRef]
  33. Turutoglu, C.; Cadirci, S.; Yilmaz, S.; Erdem, D. Calibration of the Reynolds stress model for turbulent round free jets based on jet half-width. Phys. Fluids 2024, 36, 115133. [Google Scholar] [CrossRef]
  34. Amamou, A.; Habli, S.; Saïd, N.M.; Bournot, P.; Le Palec, G. Numerical study of turbulent round jet in a uniform counterflow using a second order Reynolds Stress Model. J. Hydro-Environ. Res. 2015, 9, 482–495. [Google Scholar] [CrossRef]
  35. Schalin, A.; Nielsen, P.V. Impact of turbulence anisotropy near walls in room airflow. Indoor Air 2004, 14, 159–168. [Google Scholar] [CrossRef]
  36. Katsis, C.; Akylas, T.R. Wind-generated surface waves on a viscous fluid. J. Appl. Mech. 1985, 52, 208–212. [Google Scholar] [CrossRef]
Figure 1. Diagram of Venturi injector structure.
Applsci 14 10839 g001
Figure 2. Computational grid diagram of the Venturi injector.
Applsci 14 10839 g002
Figure 3. Variation in the gas volume flow rate under different mesh numbers.
Applsci 14 10839 g003
Figure 4. Schematic diagram of the experimental system.
Applsci 14 10839 g004
Figure 5. Relationship between gas entrainment rate and nozzle outlet velocity.
Applsci 14 10839 g005
Figure 6. The time-averaged (a) liquid volume fraction, (b) pressure, and (c) velocity contours on the central section.
Applsci 14 10839 g006
Figure 7. The time-averaged radial velocity contours of the (a) entrance, (b) middle, and (c) exit sections of the mixing section.
Applsci 14 10839 g007
Figure 8. The instantaneous gas–liquid interface in different mixing sections: (a) DM/DN = 1.75, smooth interface; (b) DM/DN = 2.25, slug interface; and (c) DM/DN = 2.5, punctiform interface.
Applsci 14 10839 g008
Figure 9. The instantaneous radius contours of the gas–liquid interface near the mixing section exit under different DM/DN and LM/DM.
Applsci 14 10839 g009
Figure 10. Variation of gas–liquid type interface and DM/DN with different LM/DM.
Applsci 14 10839 g010
Figure 11. Gas–liquid volume ratio under different DM/DN and LM/DM.
Applsci 14 10839 g011
Figure 12. (a) Gas-phase axial velocity and (b) gas–liquid interface radial velocity under different DM/DN and LM/DM.
Applsci 14 10839 g012
Figure 13. Radial and axial velocity contours of three instantaneous gas–liquid interfaces (a) DM/DN = 2.75, LM/DM = 7.5; (b) DM/DN = 1.75, LM/DM = 17.5; and (c) DM/DN = 2.5, LM/DM = 17.5.
Applsci 14 10839 g013
Table 1. Structure parameter values of the injector.
Structure ParameterValue
Liquid/gas inlet diameter25 mm
Nozzle outlet diameter (DN)12 mm
Nozzle contraction angle20°
Suction chamber inlet diameter65 mm
Suction chamber contraction angle30°
Throat nozzle distance10 mm
Mixing section diameter (DM)20 mm
Mixing section length (LM)200 mm
Diffuser contraction angle
Diffuser outlet diameter40 mm
Disclaimer/Publisher’s Note: The statements, opinions and data contained in all publications are solely those of the individual author(s) and contributor(s) and not of MDPI and/or the editor(s). MDPI and/or the editor(s) disclaim responsibility for any injury to people or property resulting from any ideas, methods, instructions or products referred to in the content.