1. Introduction
Long-tailed image classification has been a significant challenge in the field of machine learning, where a small number of majority classes (head classes) dominate the training data, while the majority of classes (tail classes) have only a few samples. This class imbalance leads to models performing well on head classes when tested on balanced datasets but performing poorly on tail classes. Addressing this imbalance is crucial, particularly in applications such as medical diagnosis, species classification, and object recognition in natural scenes, where tail categories often represent rare yet important instances.
Over the years, researchers have explored several approaches to solve the long-tailed recognition problem. These can be broadly classified into several categories. Category Rebalancing Methods: These approaches aim to mitigate the class imbalance by adjusting the training data or loss functions. For example, Focal Loss [
1] modifies the standard cross-entropy loss to focus more on hard-to-classify tail examples, while Class-Balanced Loss [
2] introduces weighting schemes that give higher importance to tail classes based on the effective number of samples per class. These methods help alleviate the imbalance but often struggle with performance trade-offs between head and tail classes. Network Structure Improvements: This class of methods enhances the model architecture to better handle imbalanced data. LDAM-DRW [
3] introduces a margin-based loss function specifically designed for long-tailed distributions, while a Bilateral-Branch Network (BBN) [
4] creates two separate branches within the network—one for head classes and one for tail classes—to learn more specialized features for each group. Although effective, these methods are typically limited to visual modalities and do not leverage the potential of multimodal information. Data Augmentation Techniques: Some approaches, such as mixup [
5] and its rebalanced version Remix [
6], augment the data by generating synthetic samples from the original dataset. While these methods have been shown to improve model robustness, they rely heavily on the assumption that synthetic examples can accurately represent tail classes, which is not always the case in real-world long-tailed distributions. Two-Stage Approaches: Methods like cRT and LWS [
7] separate training into two stages—first learning a representation that is less biased toward head classes, followed by training a classifier with re-weighting schemes. This decoupling improves performance by focusing on the specific challenges of imbalanced classification. However, they do not fully exploit the rich semantic relationships present in multimodal data. Multi-branch Models: Multi-branch architectures, such as RIDE [
8] and LFME [
9], employ multiple expert models to address class imbalance. Each expert specializes in different portions of the data distribution, allowing for more tailored learning. These methods have shown promising results, particularly in handling tail categories. However, they often involve significant computational complexity, making them less practical for large-scale applications. Additionally, few-shot learning methods also aim to solve the problem of recognizing classes with limited data, which bears some similarity to long-tailed classification. For example, Lee et al. proposed a Hellinger Distance-Attention-based Feature Aggregation Network (HELA-VFA) for few-shot classification [
10]. Similarly, Roy et al. introduced a few-shot learning method, Felmi, based on hard mixup [
11]. These methods offer valuable insights for addressing the issue of tail classes in long-tailed data.
In recent years, the problem of long-tailed recognition has garnered increasing attention and research [
12,
13,
14,
15,
16,
17,
18]. Since real-world data often exhibit long-tailed distributions (e.g., Pareto distribution [
19]), traditional visual models are prone to class imbalance issues. The abundance of head class data leads models to focus on learning head features, while the scarcity of tail class data results in poor generalization capabilities. Although collecting more data can alleviate this issue to some extent, this approach is often costly and unsustainable. Thus, developing more efficient algorithms to handle long-tailed distributions has become crucial.
Despite the effectiveness of existing approaches, such as category rebalancing and network structure improvements, in visual modalities, they often overlook the potential semantic information in multimodal data, such as the semantic features embedded in label texts. These features hold significant potential in enhancing model generalization and improving the recognition of tail classes. Therefore, this paper aims to explore multimodal solutions to the long-tailed recognition problem by integrating visual and textual information to optimize and enhance existing methods.
Contrastive visual-semantic models such as CLIP [
20] have shown great capabilities in recent years. Such models are mainly pre-trained on a large number of image–text pairs collected from the Internet, aligning visual representation and language representation with contrastive loss. A model trained by this method shows strong classification performance in zero-shot cases. In the long-tail problem setting, if the information contained in the text label can be effectively used, it is expected to improve the recognition accuracy on long-tailed data. CLIP utilizes large-scale pre-trained models to align visual and textual representations, showing exceptional performance on various zero-shot tasks. However, these models have not been extensively applied to long-tailed data, where leveraging both image and text modalities could further enhance classification performance, particularly for tail categories. The motivation behind this work stems from the observation that most existing methods focus solely on visual data, overlooking the valuable information present in textual descriptions. By incorporating textual features through contrastive learning, we aim to improve the recognition of tail classes, which are typically underrepresented in visual data alone. This is particularly important in applications like natural-language-guided image classification, where textual descriptions can provide critical context for rare categories.
In this article, a long-tailed data recognition framework based on multimodality is proposed. According to the different distributions of input data, the method in this paper is divided into two stages: the first stage entails using long-tailed data for visual-semantic contrastive learning, and the second stage involves classifier learning using class-balanced data. The first stage is the comparative learning stage, in which long-tailed data are used to extract image features and text features, and in the process of learning, feature representations of the same category are shortened as much as possible, and the feature representations between different categories are pulled apart. When the first stage of learning is completed, the model usually has better classification performance for head categories but weaker classification performance for tail categories. Therefore, in the second stage of the dual-branch recognition framework, the training data after class-balanced sampling will be sent to the vision branch and the language branch for training so as to further improve the performance of the model on the tail category. The second stage will inherit image feature representations and filtered text feature representations from the first stage.
Specifically, the main contributions are as follows:
This paper proposes the use of text labels in long-tail problems to make up for the lack of a single visual modality and proposes a visual-semantic contrastive learning framework for the extraction of image features and text features, and in the process of extraction, the same-category features are kept as close as possible.
This paper proposes a multimodal classifier learning framework that first extracts the most relevant text features and then constructs a dual-branch classifier for text features and image features.
This paper presents a large number of conducted experiments, which achieved competitive results on four datasets: CIFAR-10-LT, CIFAR-100-LT, ImageNet-LT, and iNaturalist2018.
2. Method
The method is divided into two stages. The first stage is contrastive learning, which utilizes long-tailed data to extract both image and text features. In this phase, the model learns to bring feature representations of the same class closer together while increasing the separation between different classes. After the first stage is completed, the model typically performs well on head classes but exhibits weaker classification performance on tail classes. To enhance performance on tail classes, the dual-branch recognition framework moves into the second stage, where class-balanced sampled data are fed into both the vision and language branches for training. The second stage inherits the image feature representations from the first stage, along with filtered text feature representations, to further improve tail class classification.
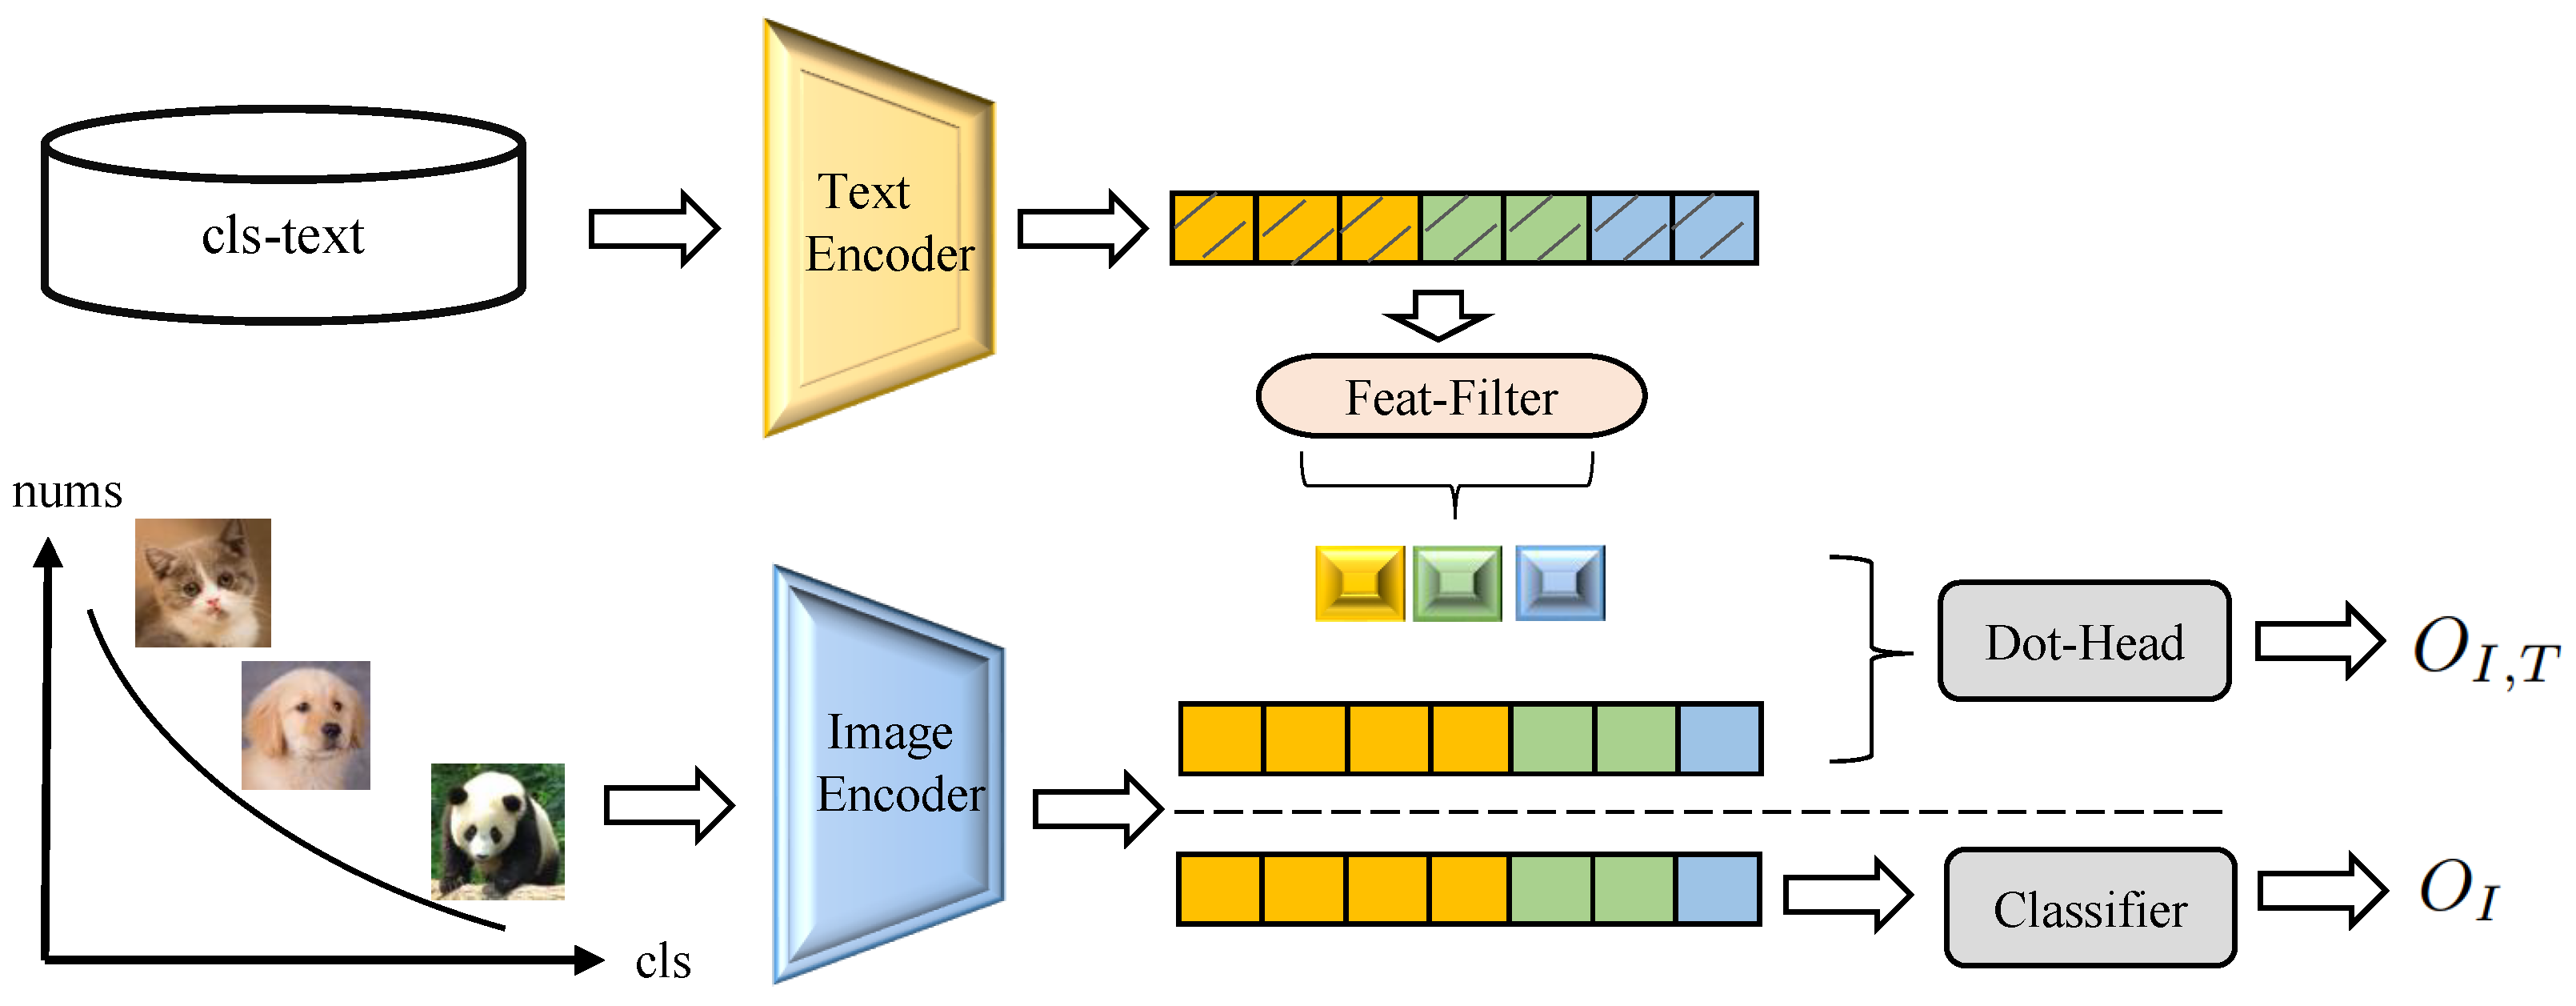
As shown in
Figure 1, for the image–text branch, the image encoder takes in raw long-tail-distributed image data to extract image features for the batch (assuming a large number of samples for cat and dog classes and fewer samples for the panda class). Simultaneously, the text encoder inputs several textual descriptions for each category from the text database to extract text features. During training, the contrastive loss between image–text pairs is employed to pull similar instances of the same class closer in the feature space while pushing different classes apart. Additionally, the official pre-trained CLIP model is utilized, and KL divergence is employed to prevent overfitting of the trained model. After the initial training phase described above, in the second phase, we modify our inputs by mitigating the imbalance through a category resampling strategy. Then, by inheriting the feature extractor from the first phase and selecting the most discriminative textual feature descriptions using the scoring method outlined in
Section 3.6, we concatenate them with the output of the image encoder and compute the score for each sample’s class membership. Simultaneously, leveraging the second branch, the image-classifier branch utilizes an MLP to implement a classifier and obtain balanced classifier scores. During training, the cross-entropy losses for both scores are calculated separately, while during testing, the weighted sum of both scores is used to obtain the final predicted classification results.
2.1. Image–Text Contrastive Model
Image–text contrastive learning models usually adopt a dual-encoder architecture, where one is an image encoder
and the other is a text encoder
, such as CLIP [
20] and CoOp [
21]. The main idea is to encode images and text separately through two independent encoders and then align the features of these two modalities.
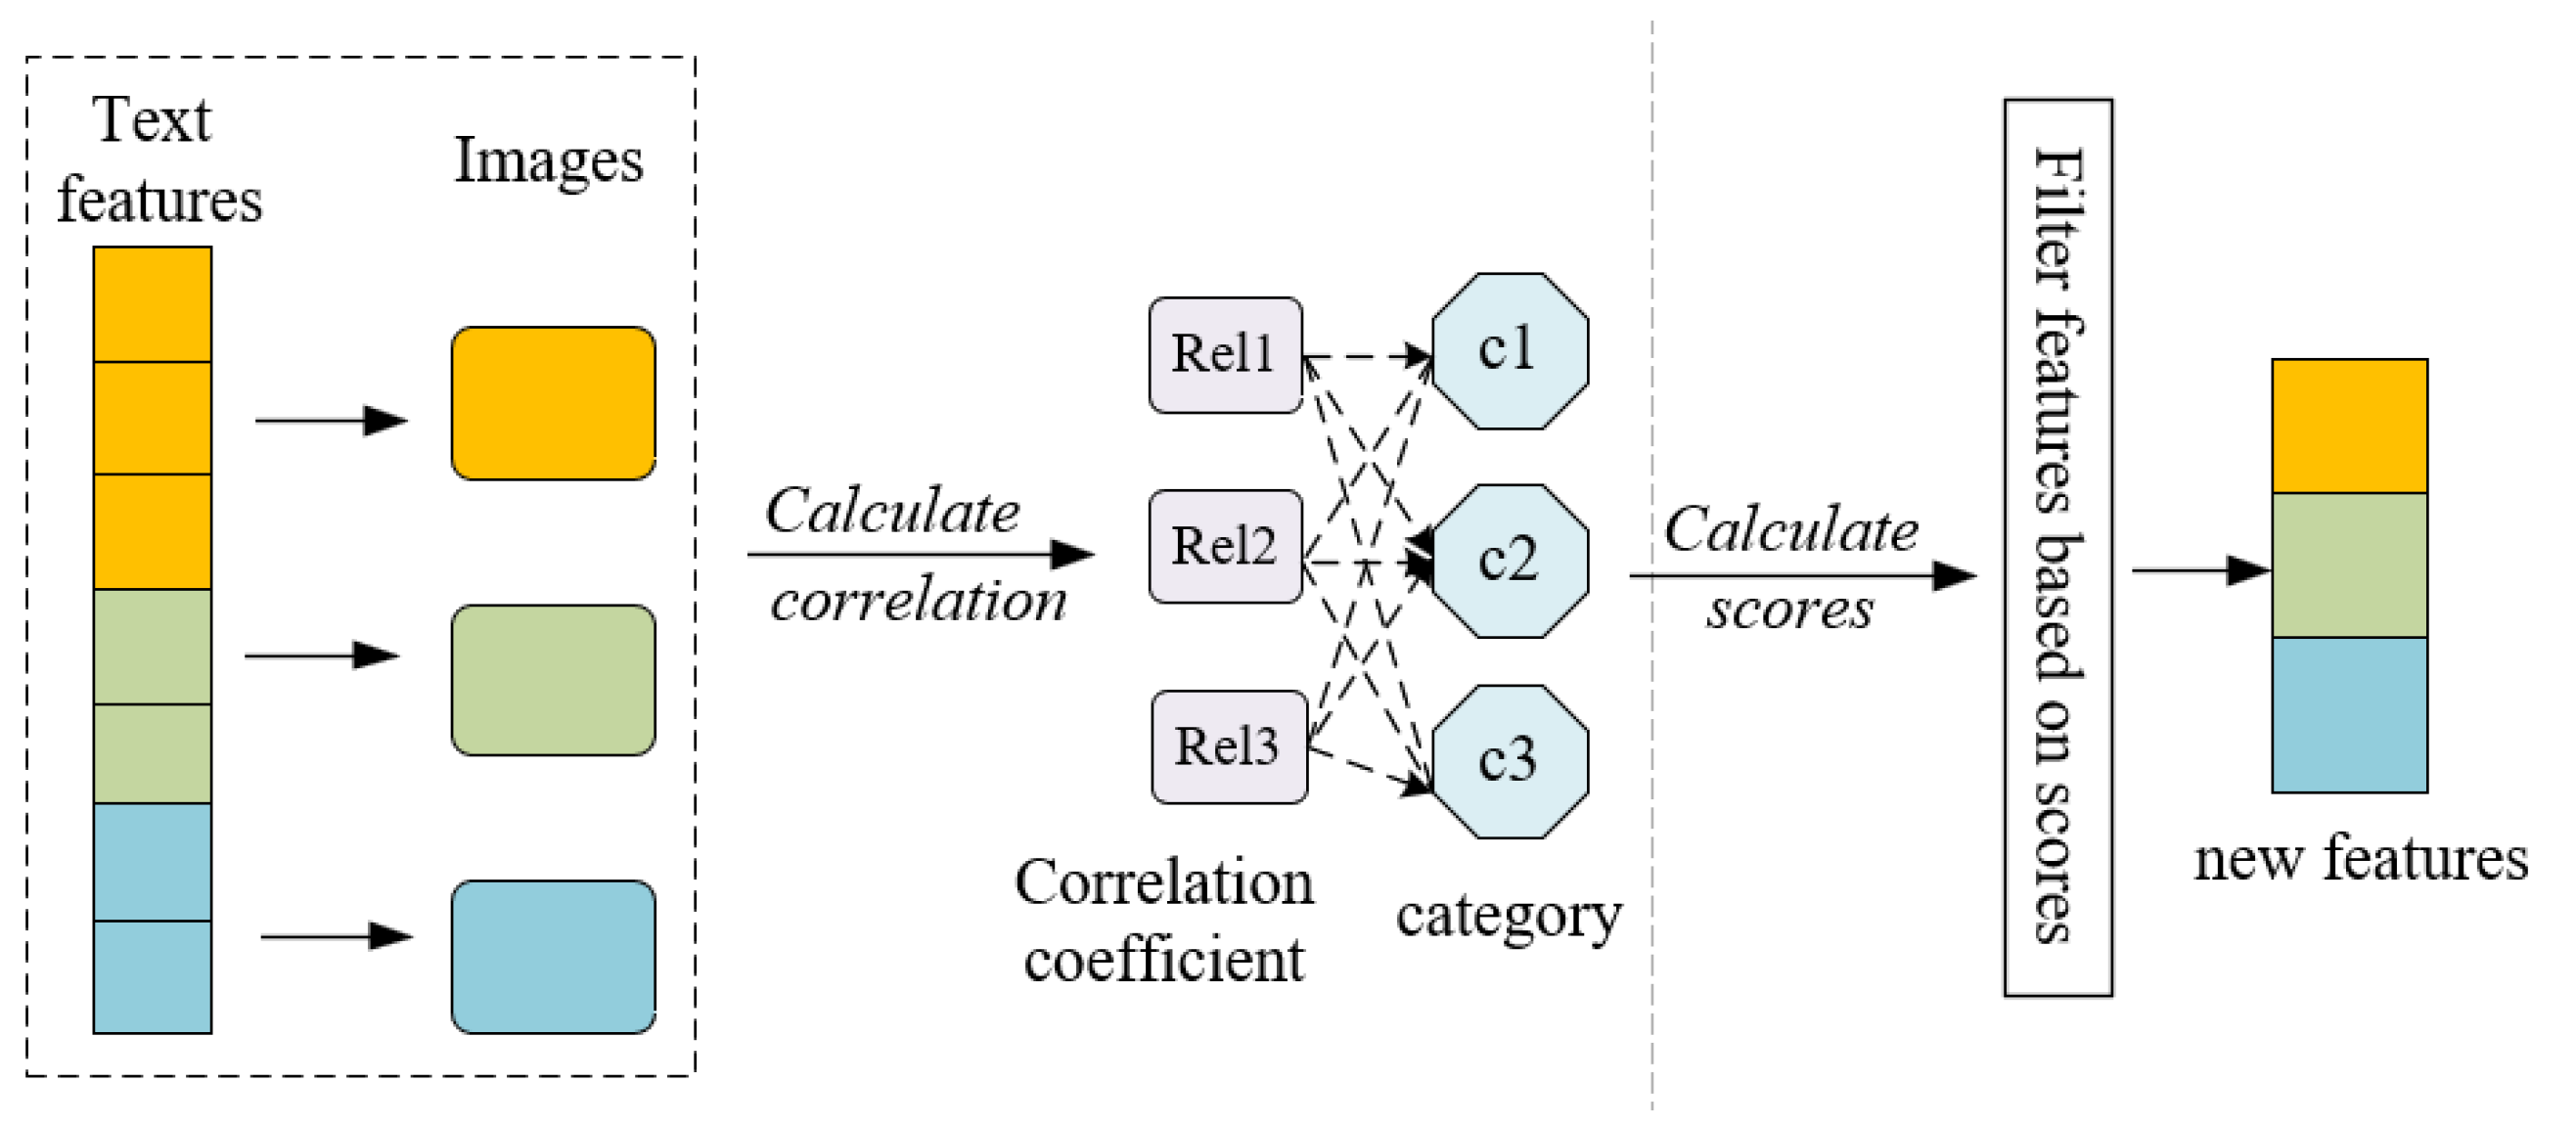
Figure 2 shows the most relevant text feature extraction process. Usually, the learning goal of this kind of model is the contrastive loss; the purpose is to bring the features described by the image and the corresponding text closer and, at the same time, push away features for which the image does not match the text in the feature space. For example, in the process of training, images
and sentences
of
n batch size are randomly selected from the samples to obtain image features
and text features
, respectively, in the multimodal space. Then, the features are passed through two transformation matrices:
Here,
and
are the D-dimensional image and text features of the
ith image normalized in the multimodal space, respectively. The goal of the original contrastive learning is to bring the image features and text features of a single image closer while pulling the image and all other text features away. In order to make features of the same category as compact as possible in the feature space, features of the same category should be excluded when pulling features out. In other words, when training image features, text features that are the same as the image category should be pulled closer, while text features that are different from the image category should be pulled away. In the same way, when training text images, image features that are the same as the text category should be pulled closer, and image features that are different from the text category should be pulled away.
Specifically, and represent the similarity loss of image features relative to text features and the similarity loss of text features relative to image features, respectively, and indicates that it belongs to i in the current batch. The text feature index of the category, , represents the image feature index belonging to the ith category in the current batch, and is a temperature parameter used to scale the logical output size.
After training using a large number of image–text pairs, a better multimodal feature representation can be obtained. In order to avoid overfitting on a specific dataset, this paper adds a comparison with the initial model during comparative learning so that the model after comparative learning training will not deviate too far from the original model, and it is limited by KL divergence, defined as
where
represents the KL divergence between the trained model and the original model,
and
represent the visual and language features of the trained model for the
ith sample, and
and
represent the visual features and language features of the original model for the
ith sample. In order to increase the speed of model training in the early stage of training and avoid overfitting in the later stage of training, this paper introduces a parameter
to adjust the focus of the training process. So far, the overall loss function in the comparative learning phase can be obtained as follows:
In this context,
represents the contrastive learning loss, and
is used to gradually shift the focus from learning the model for a specific dataset to learning the reduced and original model during the training process difference.
is defined as
The model obtained through comparative learning already has the ability to perform image classification. For example, let
v represent the visual feature representation of a certain picture after passing through the visual encoder, and let
represent the language feature representation obtained after the text describing each category passes through the language encoder. The probability of each category of the picture can be calculated using the following formula:
where
represents the probability of predicting the
ith category in a total of
C categories, the picture is predicted to be the category corresponding to the highest probability, and
is a scale used for scaling the temperature parameter.
2.2. Most Relevant Text Feature Extraction
For each category, the text information provided by the template text may be noisy; not all text information is necessarily beneficial to the classification of the text, and irrelevant text information may even lead to a decline in classification performance. Therefore, it is necessary to filter out text information that has nothing to do with the category or has little relevance, and the text information that is most relevant to the category is extracted.
Among the total
T text features, the correlation between the
tth text feature
and the
ith picture in the total
I pictures is calculated as follows:
Here, the larger the
value, the greater the correlation between the text
t and image
i. Assuming that the category corresponding to the
tth text feature is
c, the text and image
i correlation score for the category
c is calculated as follows:
where
is the number of image samples belonging to the category
c, and the higher the correlation between the text feature
t and the category
c, the higher the correlation score.
This score takes into account not only the logical output values belonging to the category but also the logical output values not belonging to the category. The main purpose of this design formula is as follows: When a text feature t does not belong to the text feature category while other categories of c are related, the text feature t is likely to be a confusing text, which is likely to mislead the classification. Therefore, the relevant score of the text should be reduced, and the amount by which it should be reduced, according to the degree to which the text is confusing, is determined by the size of the logical output value.
2.3. Double-Branch Multimodal Recognition Framework
In this section, a simple and effective two-branch multimodal long-tailed data recognition framework is introduced. The two branches of the framework are the image–text branch and the image branch. In this context, the image–text branch uses both image information and text information for judgment, while the image branch only uses image information. In the previous section,
S text features
and images for each category have been obtained as features
. The formula defining the logical output for computing the image–text branch is
where
and
represent the linear transformation matrix of image features and text features, respectively;
represents the Softmax Function; and
represents the latitude of the text feature.
The formula for the image branch logic output is defined as
where
represents the linear transformation matrix of the image branch.
The formulation of the final logistic output and loss function is defined as
where
represents the label of the
cth category. Algorithm 1 gives the data processing flow of the model.
| Algorithm 1 Long-tailed recognition algorithm. |
- Require:
Randomly select batch size n of images and text and the hyperparameters E and . - Ensure:
Classification result . - 1:
Initialize hyperparameters according to Equation ( 6). - 2:
for to T do - 3:
- 4:
- 5:
Calculate according to Equation ( 8). - 6:
Calculate according to Equation ( 9). - 7:
Select the best text feature for each category based on the score. - 8:
Normalize and according to Equation ( 1). - 9:
Calculate the similarity loss of image features relative to text features according to Equation ( 2). - 10:
Calculate the similarity loss of text features relative to image features according to Equation ( 3). - 11:
Calculate according to Equation ( 4). - 12:
Calculate the overall loss function of the contrastive learning phase according to Equation ( 5). - 13:
Optimize and to . - 14:
Calculate the logical output of the image–text branch according to Equation ( 10). - 15:
Calculate the image branch logic output according to Equation ( 11). - 16:
Calculate the final classification loss according to Equation ( 12). - 17:
Optimize Dot-Head and Classifier according to . - 18:
end for - 19:
Calculate the classification results based on Dot-Head and Classifier.
|
3. Experiment Details
3.1. Datasets
This paper presents extensive experiments conducted on three mainstream long-tailed datasets, which are introduced below.
CIFAR-10-LT and CIFAR-100-LT are long-tailed versions derived from the CIFAR-10 and CIFAR-100 datasets, primarily used to evaluate the model’s performance in handling imbalanced data. The original CIFAR-10 and CIFAR-100 datasets contain 10 and 100 classes, respectively, with a balanced number of images per class. In the long-tailed versions, the distribution is modified to follow a long-tailed distribution by downsampling the minority classes, simulating the common long-tail problem in real-world applications. Specifically, the long-tail factor determines the ratio between the number of samples in the head and tail classes. For instance, with an imbalance factor of 200, the class with the most samples has 200 times more samples than the class with the fewest. These long-tailed datasets are used to assess the model’s performance in imbalanced classification tasks.
ImageNet-LT is a long-tailed dataset sampled from the classic ImageNet-2012 dataset. To construct this dataset, researchers downsampled the original ImageNet data based on a Pareto distribution, retaining 1000 classes, with the number of samples per class ranging from hundreds to thousands. ImageNet-LT is designed to simulate real-world long-tailed distributions, where there is a significant imbalance between head classes (with many samples) and tail classes (with very few samples). This dataset is commonly used to evaluate model performance in large-scale, long-tailed image classification tasks.
iNaturalist2018 is a long-tailed dataset mainly used for studying fine-grained image classification problems. This dataset contains over 8000 species categories and approximately 437,000 images in total, but many categories have very few samples, exhibiting a typical long-tailed distribution. The iNaturalist2018 dataset is particularly challenging because it has not only a large number of categories but also a significant long-tail effect, where many categories have very few samples, while a few head categories have a large number of samples. It is widely used to evaluate model performance in fine-grained classification and long-tailed distribution problems, particularly in real-world applications like species recognition.
3.2. Evaluation Metrics
In our experiments, we trained the model on an imbalanced training set, where the number of samples per class is uneven, and tested it on a balanced test set. We primarily use Top-1 accuracy as the evaluation metric to measure the model’s classification performance. Top-1 accuracy refers to the proportion of input images where the predicted class matches the true class, i.e., the percentage of correctly classified samples out of the total. This is a standard evaluation metric widely used in image classification tasks, especially for multi-class classification problems.
Additionally, to more thoroughly assess the model’s performance on long-tailed data, we calculated Top-1 accuracy for different class groups separately: classes with more than 100 training samples (many-shot), classes with 20 to 100 training samples (medium-shot), and classes with fewer than 20 training samples (few-shot). This grouped evaluation method effectively reveals the performance differences between head and tail classes, providing a comprehensive reflection of the model’s performance on long-tailed datasets.
3.3. Implementation Details on ImageNet-LT
ImageNet-LT is a subset of ImageNet-2012, sampled from the original dataset according to the Pareto distribution. In order to compare with previous work [
8,
22], the visual encoder in this paper uses the ResNet-50 backbone network. In the language encoder, this paper uses the Transformer network structure. In the comparative learning phase of the first stage, a total of 60 epochs were used for training. The initial learning rate was
, and the learning rate was reduced to the original 0.1 and 0.01 at the 36th epoch and 48th epoch; the language encoder’s text words have a maximum length of 60 (excluding first and last words). In the image–text branch of the second stage, the 50 most relevant text features are extracted for each category. The initial learning rate of image features is
, and the initial learning rate of text features is
. In the second stage, a total of 40 epochs were used for training, and a stepwise learning strategy was used. The learning rate was reduced to 0.1 and 0.01 at the 24th epoch and 32nd epoch, respectively. All models are optimized by a stochastic gradient descent optimizer with a momentum of 0.9 and a decay rate of
. For the training sample, the image was proportionally scaled to a size of 256 pixels on the short side, and then the image or its horizontally flipped version was cropped to 224 × 224, and then autoAugment [
23] was used for data augmentation.
3.4. iNaturalist 2018 Implementation Details
iNaturalist 2018 is a very challenging long-tailed, fine-grained dataset. In References [
3,
4], in their experiments with iNaturalist 2018, the visual encoder used ResNet-50, and the language encoder used the Transformer network. In the comparative learning phase of the first stage, a total of 80 epochs were used for training. The initial learning rate was
, and the learning rate was reduced to the original 0.1 and 0.01 at the 48th epoch and 64th epoch. The initial learning rate of the image features in the second stage was
, and the initial learning rate of the text features was
. In the second stage, a total of 70 epochs were used with a stepwise learning strategy, and the learning rate was reduced to the original 0.1 and 0.01 at the 42nd and 56th epochs. The data enhancement method for training samples was the same as the data enhancement method on ImageNet-LT. The experiments conducted on the iNaturalist 2018 data and above were all optimized by a stochastic gradient descent optimizer with a momentum of 0.9 and a decay rate of
.
3.5. Method of Comparison
Rebalancing methods. This paper compares the proposed approach with several commonly used rebalancing methods, including Focal [
1], Class-Balanced [
2], LDAM-DRW [
3], and Equalization [
24]. These are standard approaches commonly used in long-tailed classification to address class imbalance issues. They were chosen to validate the basic effectiveness of the new method on long-tailed data and to demonstrate its improvements over traditional methods.
Data augmentation methods. To demonstrate the effectiveness of the proposed method, this paper compares it with several strong augmentation methods, such as mixup [
5], Rebalanced mixup [
6], and CAM [
22]. These methods alleviate the long-tail problem by generating more samples. Comparison with these methods helps demonstrate the robustness and performance improvement of the proposed multimodal approach under various data augmentation strategies.
Two-stage methods. The proposed approach is also compared with two-stage methods such as LWS [
7] and cRT [
7] to verify its effectiveness. These methods address the imbalance problem by separating representation learning and classification learning. By using these methods for comparison, we show how our proposed multimodal approach achieves higher classification accuracy within the same two-stage framework.
Multi-branch methods. LFME [
9], BBN [
4], and RIDE [
8] are multi-branch models. This paper compares them with our architecture to demonstrate its effectiveness. These methods improve performance for long-tailed categories by designing different optimization paths for head and tail classes. Choosing these methods highlights the better integration and performance improvement of our multimodal approach in similar structures.
State-of-the-art methods. This paper also compares the proposed method with recent state-of-the-art methods: Meta-weight-net [
25], Domain Adaptation [
26], LADE [
27], MiSLAS [
28], and DisAlign [
29]. They were selected to directly showcase the competitiveness of the new method against cutting-edge techniques, proving the latest breakthroughs in addressing long-tailed problems.
3.6. Main Experimental Results
3.6.1. Results on CIFAR-10-LT and CIFAR-100-LT
Table 1 reports the Top-1 accuracy of CIFAR-10-LT and CIFAR-100-LT using ResNet-32. The multimodal long-tailed data recognition (MMLTR) method proposed in this paper achieved the best results for all imbalance ratios (200, 100, 50, and 20), which verified the effectiveness of the multimodal long-tailed data recognition method in this paper. The results show that the proposed method outperforms classical rebalancing methods, reflecting the effectiveness of our contrastive learning framework.
The proposed method also outperforms the tested data augmentation methods. It also shows stronger competitiveness compared with the two-stage methods, which reflects the effectiveness of the two-stage method in this paper, namely, the contrastive learning stage and the classification learning stage. The proposed method employs a multi-branch model during the classification learning stage, and its performance is compared with various other multi-branch methods. The results show that its accuracy surpasses that of these other methods, demonstrating the effectiveness of the proposed model in classification. We also compared our framework with many recent state-of-the-art methods to demonstrate its effectiveness in multimodal long-tailed data recognition. In
Table 2, the accuracy on the majority class (more than 100 training images), median class (20∼100 training images), and minority class (fewer than 20 training images) are reported. The recognition accuracy of the MMLTR method in this study is more than 7% higher than that of the previous method for the tail category, and the overall recognition accuracy is 1.8% higher than that of the previous method. It can be seen that most of the improvement comes from the tail category.
3.6.2. Results on ImageNet-LT and iNaturalist2018
This paper further verifies the effectiveness on the ImageNet-LT and iNaturalist 2018 datasets.
Table 3 reports the results on these two large-scale imbalanced datasets. The method in this paper is 15.7% (ResNet-50) higher than RIDE on ImageNet-LT and 2.7% (ResNet-50) higher than RIDE on iNaturalist 2018, indicating that the method in this paper can be effectively generalized to large-scale datasets. In
Table 4, the accuracy on the majority class (more than 100 training images), the median class (20∼100 training images), and the minority class (fewer than 20 training images) are reported. It can be seen from the table that most of the improvement comes from the tail category, which shows that the method in this paper has a good effect on the tail category.
3.7. Ablation Experiment
Table 5 shows the results of the ablation study, where our primary objective is to verify the contributions of different modules and strategies to the overall performance of the multimodal approach. The details of the experiments are described below.
Experiment 1: Only the image encoder was used, without any textual information, aiming to evaluate the performance with a single visual modality. Experiment 2: Building on Experiment 1, text feature filtering was added to assess the improvement brought by the text feature filtering module in image classification. Experiment 3: Both the image encoder and text encoder were used for contrastive learning without subsequent multimodal classification to evaluate the impact of contrastive learning on the model. Experiment 4: Only the image branch of the multimodal model was used, meaning that in the second-stage classification, only image features were relied upon to assess the performance of the image branch. Experiment 5: This was the complete multimodal framework, which includes image–text contrastive learning, text feature filtering, and a dual-branch classification model (image and image–text), aiming to evaluate the contribution of all combined modules to the overall model performance.
The results of ablation experiments on ImageNet-LT and iNaturalist2018 datasets are reported. Contrastive learning means that the image–text comparison model is used for image and text feature extraction in the first stage, and the most relevant text feature extraction means that the most relevant features are selected for each category to prepare for the classification task model in the second stage. In the second stage of the multimodal recognition framework, the results of using one of the branches alone and using the two branches at the same time are obtained. It can be seen from the table that when all the methods proposed in this paper are used, the best results can be achieved. The results show the good effect and thus effectiveness of each part proposed in this article, as well as the whole.
4. Conclusions
This paper proposes a new multimodal long-tail recognition method that effectively improves classification performance on tail categories by introducing visual-semantic contrastive learning and a two-stage training framework. Experimental results show that the proposed method outperforms traditional methods on several imbalanced datasets (such as CIFAR-10-LT, CIFAR-100-LT, ImageNet-LT, and iNaturalist2018), with a significant improvement in recognizing tail categories. Compared to existing unimodal methods, our framework takes advantage of pre-trained visual-semantic models, reducing the reliance on complex resampling strategies and improving model generalization. However, despite the many advantages, our approach has certain limitations. First, the method relies on pre-trained models such as CLIP, and the final performance of the model is somewhat dependent on the quality and suitability of the pre-trained model. In addition, our method involves two stages of training, with the first stage, particularly visual-semantic contrastive learning, requiring simultaneous processing of image and text features, which may result in higher computational costs. Although the performance gains are substantial, this computational complexity may pose challenges in certain practical applications. To mitigate these limitations, several directions for future work can be explored. First, introducing model distillation techniques could simplify the inference phase while maintaining performance. Second, for different application scenarios, developing smaller pre-trained models or reducing the dimensionality of text features could help optimize computational resources. Lastly, further research could explore the efficient application of multimodal models in distributed training frameworks to reduce training time and resource consumption.
In conclusion, the proposed method demonstrates competitive performance in long-tail recognition tasks. Although its computational complexity is higher, this can be addressed through reasonable optimization strategies in real-world applications. We look forward to future research further enhancing the practicality and scalability of multimodal approaches.


