A Regionalization Approach Based on the Comparison of Different Clustering Techniques
Abstract
1. Introduction
2. Materials and Methods
2.1. Study Area
2.2. Variables Used
2.3. Clustering Methods
| Algorithm 1: K-means++ |
|
| Algorithm 2: DBSCAN |
|
| Algorithm 3: PD-Clustering |
|
| Algorithm 4: Federated heuristic based on fuzzy clustering |
|
- (1)
- Assigning Nodes to Communities: In this phase, the algorithm initially assigns each node to a community and evaluates the impact on the map equation. A community node is modified, and the resulting reduction in the map equation is calculated. The goal is to minimize the map equation by shifting nodes between communities.
- (2)
- Clustering Communities into Meta-Communities: In the second phase, the communities obtained in the previous step are treated as nodes at a higher level, forming a meta-community network. The algorithm is applied again to this clustered network to optimize the flow of information within the community structure. This process is repeated recursively until the map equation converges. In this phase, different assignments have been made to meta-communities depending on the percentage of nodes close to the source node (Table 2). In this way, we can check how the number of groups has varied and select the case that best suits our objective.
| Algorithm 5: Infomap |
|
2.4. Spatial Contiguity
2.5. Comparison of Regions and Selection of Results with Spatial Coherence
2.6. Importance of Variables in the Construction of the Regions
- Learning rate (shrinkage): The following learning rates were considered from 0.001 to 0.5 with a step of 0.1.
- Maximum depth of the trees (interaction.depth): Depths from 1 to 20 were tested.
- Minimum number of observations in the leaves (n.minobsinnode): Values of 10, 20, and 30 were evaluated.
- Fraction of data used in each iteration (bag.fraction): Fractions from 0.1 to 1 were considered, with a step of 0.1.
3. Results
3.1. Regionalization Without Spatial Contiguity
3.2. Regionalization with Spatial Contiguity
3.3. Comparison of the Regions
3.4. Federated Heuristic Optimization Based on Fuzzy Clustering
3.5. Most Important Variables in the Construction of the Regions
4. Discussion
4.1. Limitations of the Algorithms Used
4.2. Analytical Regionalization Versus Reference Regionalization
4.3. Characterization of the Regions
5. Conclusions
Author Contributions
Funding
Institutional Review Board Statement
Informed Consent Statement
Data Availability Statement
Acknowledgments
Conflicts of Interest
Appendix A
| Model | Regions/ Contiguity | 2 | 3 | 4 | 5 | 6 | 7 | 8 | 9 | 10 | 11 | 12 | 13 | 14 | 15 | 16 | 17 | 18 | 19 | 20 | 21 | 22 |
|---|---|---|---|---|---|---|---|---|---|---|---|---|---|---|---|---|---|---|---|---|---|---|
| PDC with 22 regions | 1 SC | 0.999 | 0.999 | 2.2 × 10⁻¹ | 0.999 | 2.2 × 10⁻¹ | 2.2 × 10⁻¹ | 2.2 × 10⁻¹ | 2.2 × 10⁻¹ | 2.2 × 10⁻¹ | 0.9999 | 2.2 × 10⁻¹ | 2.2 × 10⁻¹ | 0.999 | 2.2 × 10⁻¹ | 2.2 × 10⁻¹ | 0.999 | 2.2 × 10⁻¹ | 0.999 | 2.2 × 10⁻¹ | 0.999 | 0.999 |
| TSA | 2.2 × 10⁻² | 0.999 | 0.999 | 2.4 × 10⁻² | 2.4 × 10⁻² | 2.2 × 10⁻² | 2.0 × 10⁻² | 4.1 × 10⁻² | 0.999 | 0.9999 | 3.9 × 10⁻² | 1.8 × 10⁻² | 0.999 | 2.1 × 10⁻² | 2.4 × 10⁻² | 2.4 × 10⁻² | 0.999 | 3.3 × 10⁻² | 2.5 × 10⁻² | 0.999 | 0.999 | |
| PCO | 0.590 | 6.6 × 10⁻¹ | 3.5 × 10⁻¹ | 0.000 | 5.5 × 10⁻³ | 1.3 × 10⁻⁵ | 2.9 × 10⁻¹ | 7.9 × 10⁻³ | 1 × 10⁻³ | 1.2 × 10⁻⁹ | 0.009 | 7.4 × 10⁻⁹ | 1.3 × 10⁻⁸ | 9.3 × 10⁻⁸ | 0.004 | 1.2 × 10⁻¹ | 1.5 × 10⁻⁶ | 1.7 × 10⁻² | 0.000 | 2.2 × 10⁻⁶ | 0.692 | |
| 2 SC | 0.999 | 2.2 × 10⁻¹ | 0.999 | 2.2 × 10⁻¹ | 2.2 × 10⁻¹ | 2.2 × 10⁻¹ | 2.2 × 10⁻¹ | 2.2 × 10⁻⁶ | 0.9999 | 2.2 × 10⁻¹ | 2.2 × 10⁻¹ | 0.999 | 2.2 × 10⁻¹ | 2.2 × 10⁻¹ | 0.999 | 2.2 × 10⁻¹ | 0.999 | 2.2 × 10⁻¹ | 0.999 | 0.999 | ||
| TSA | 2.2 × 10² | 2.2 × 10² | 0.990 | 0.990 | 0.999 | 0.990 | 6.7 × 100 | 2.2 × 10⁻² | 2.2 × 10⁻² | 0.980 | 0.990 | 2.2 × 10⁻² | 0.990 | 0.990 | 0.990 | 2.2 × 10⁻² | 7.6 × 10⁻¹ | 0.990 | 2.2 × 10⁻² | 2.2 × 10⁻² | ||
| PCO | 4.6 × 10⁻¹ | 1.4 × 10⁻⁸ | 0.001 | 1.9 × 10⁻³ | 2.3 × 10⁻⁵ | 7.8 × 10⁻¹ | 6.1 × 10⁻² | 4.1 × 10⁻³ | 1.6 × 10−82 | 0.066 | 5.3 × 10⁻⁸ | 2.3 × 10⁻¹ | 1.9 × 10⁻⁷ | 0.001 | 9.31 × 10⁻² | 4.7 × 10⁻⁵ | 2.8 × 10⁻⁶ | 0.000 | 3.1 × 10⁻⁵ | 0.349 | ||
| 3 SC | 2.2 × 10⁻¹ | 0.999 | 2.2 × 10⁻¹ | 2.2 × 10⁻¹ | 2.2 × 10⁻¹ | 2.2 × 10⁻¹ | 2.2 × 10⁻¹ | 0.9999 | 2.2 × 10⁻¹ | 2.2 × 10⁻¹ | 0.999 | 2.2 × 10⁻¹ | 2.2 × 10⁻¹ | 0.999 | 2.2 × 10⁻¹ | 0.999 | 2.2 × 10⁻¹ | 0.999 | 0.999 | |||
| TSA | 0.999 | 2.4 × 10⁻² | 2.4 × 10⁻² | 2.4 × 10⁻² | 2.4 × 10⁻² | 4.1 × 10⁻² | 0.999 | 0.9999 | 3.9 × 10⁻² | 1.8 × 10⁻² | 0.999 | 2.1 × 10⁻² | 2.3 × 10⁻² | 2.4 × 10⁻³ | 0.999 | 3.3 × 10⁻² | 2.5 × 10⁻² | 1.0 × 10+1 | 0.999 | |||
| PCO | 8 × 10⁻⁸ | 2.7 × 10⁻³ | 5.1 × 10⁻¹ | 1.1 × 10⁻³ | 0.008 | 2.4 × 10⁻¹ | 1.1 × 10⁻² | 6.1 × 10−76 | 1.3 × 10⁻² | 2.6 × 10⁻⁷ | 1.1 × 10⁻³ | 2.0 × 10⁻⁶ | 0.007 | 0.002 | 2.1 × 10 | 3.1 × 10⁻¹ | 3.3 × 10⁻³ | 2.3 × 10⁻⁴ | 2.5 × 10⁻¹ | |||
| 4 SC | 2.2 × 10⁻¹ | 0.993 | 0.997 | 0.994 | 0.996 | 0.783 | 2.2 × 10⁻¹⁶ | 0.995 | 0.991 | 2.2 × 10⁻² | 0.997 | 0.995 | 2.2 × 10⁻¹ | 0.995 | 2.2 × 10⁻¹ | 0.999 | 2.2 × 10⁻¹ | 2.2 × 10⁻¹ | ||||
| TSA | 2.4 × 10⁻² | 2.4 × 10⁻² | 2.2 × 10⁻² | 2.0 × 10⁻² | 4.1 × 10⁻² | 0.999 | 0.9999 | 3.9 × 10⁻³ | 1.8 × 10⁻² | 0.999 | 2.1 × 10⁻³ | 2.3 × 10⁻² | 2.4 × 10⁻² | 0.999 | 3.3 × 10⁻² | 2.5 × 10⁻² | 0.999 | 0.999 | ||||
| PCO | 1.2 × 10⁻¹ | 2.3 × 10⁻² | 8.4 × 10⁻¹ | 1.1 × 10⁻⁵ | 7 × 10⁻⁴ | 6.7 × 10⁻³ | 0.4602 | 1.7 × 10⁻⁴ | 0.314 | 8.3 × 10⁻¹ | 0.088 | 7.4 × 10⁻⁷ | 1.4 × 10⁻⁶ | 0.006 | 2 × 10−36 | 9.7 × 10⁻² | 1.4 × 10⁻⁹ | 6.1 × 10⁻² | ||||
| 5 SC | 2.2 × 10⁻¹ | 2.2 × 10⁻¹ | 2.2 × 10⁻¹ | 2.2 × 10⁻¹ | 2.2 × 10⁻¹ | 0.9999 | 2.2 × 10⁻⁶ | 2.2 × 10⁻¹ | 0.999 | 2.2 × 10⁻¹ | 2.2 × 10⁻¹ | 0.999 | 2.2 × 10⁻¹ | 0.999 | 2.2 × 10⁻¹ | 0.999 | 0.999 | |||||
| TSA | 0.990 | 0.990 | 0.990 | 6.8 × 10−0 | 2.4 × 10⁻² | 2.4 × 10⁻²³ | 9.8 × 10⁻¹ | 0.990 | 2.4 × 10⁻² | 0.990 | 0.990 | 1.0 × 10 | 2.4 × 10⁻² | 7.5 × 10⁻¹ | 0.990 | 2.4 × 10⁻³ | 2.4 × 10⁻³ | |||||
| PCO | 6.6 × 10⁻⁶ | 1.1 × 10⁻¹ | 2.1 × 10⁻⁴ | 1.1 × 10⁻⁷ | 4.6 × 10⁻⁷ | 2.6 × 10⁻¹⁶ | 0.022 | 1.6 × 10⁻¹⁵ | 1.1 × 10⁻¹ | 9.2 × 10⁻⁴ | 6.2 × 10⁻¹ | 1.4 × 10⁻⁴ | 1.9 × 10⁻¹ | 1.5 × 10⁻⁶ | 0.813 | 7.7 × 10⁻¹ | 0.000 | |||||
| 6 SC | 0.996 | 0.999 | 0.996 | 0.776 | 2.2 × 10⁻¹⁶ | 0.998 | 0.985 | 2.2 × 10⁻¹ | 0.996 | 0.998 | 2.2 × 10⁻¹ | 0.998 | 2.2 × 10⁻¹ | 0.993 | 2.2 × 10⁻¹ | 2.2 × 10⁻⁶ | ||||||
| TSA | 0.990 | 0.990 | 6.8 × 10⁻¹ | 2.4 × 10⁻³ | 2.4 × 10⁻²³ | 9.8 × 10⁻¹ | 0.990 | 2.4 × 10⁻² | 0.990 | 0.990 | 1.0 × 10 | 2.4 × 10⁻³ | 7.6 × 10−0 | 0.990 | 2.4 × 10⁻³ | 2.4 × 10⁻³ | ||||||
| PCO | 0.000 | 0.000 | 0.174 | 0.811 | 7.3 × 10⁻²⁵ | 9.5 × 10⁻³ | 1.3 × 10⁻² | 0.000 | 5.6 × 10⁻² | 1.1 × 10⁻² | 0.000 | 3.9 × 10⁻¹ | 0.244 | 6.6 × 10⁷ | 0.000 | 3.1 × 10⁻⁶ | ||||||
| 7 SC | 0.997 | 0.996 | 0.779 | 2.2 × 10⁻¹⁶ | 0.998 | 0.988 | 2.2 × 10⁻¹ | 0.999 | 0.997 | 2.2 × 10⁻¹ | 0.998 | 2.2 × 10⁻¹ | 0.997 | 2.2 × 10⁻¹ | 2.2 × 10⁻⁶ | |||||||
| TSA | 0.990 | 6.7 × 10⁻¹ | 2.2 × 10⁻² | 2.2 × 10⁻²³ | 9.8 × 10⁻¹ | 0.990 | 2.2 × 10⁻² | 0.990 | 0.990 | 0.990 | 2.2 × 10⁻² | 7.5 × 10⁻¹ | 0.990 | 2.2 × 10⁻² | 2.2 × 10⁻³ | |||||||
| PCO | 7.9 × 10⁻² | 2.2 × 10⁻¹ | 0.000 | 7.5 × 10⁻¹¹ | 1.6 × 10⁻⁹ | 1.8 × 10⁻¹ | 0.999 | 0.000 | 1.4 × 10⁻⁴ | 4 × 10⁻² | 0.0218 | 2.3 × 10⁻¹ | 9.5 × 10⁻² | 0.413 | 7.5 × 10−0 | |||||||
| 8 SC | 0.997 | 0.776 | 2.2 × 10⁻¹⁶ | 0.999 | 0.985 | 2.2 × 10⁻¹ | 0.996 | 0.999 | 2.2 × 10⁻¹ | 0.998 | 2.2 × 10⁻¹ | 0.9937 | 2.2 × 10⁻¹ | 2.2 × 10⁻⁶ | ||||||||
| TSA | 6.7 × 10⁻¹ | 2.0−2 | 2.0 × 10⁻²³ | 9.7 × 10−0 | 0.990 | 2.0 × 10⁻² | 0.990 | 0.990 | 0.990 | 2.0 × 10⁻³ | 7.5 × 10−0 | 0.990 | 2.0 × 10⁻² | 2.0 × 10⁻³ | ||||||||
| PCO | 0.000 | 0.000 | 1.8 × 10−49 | 6.5 × 10⁻² | 9.9 × 10⁻⁶ | 7.9 × 10⁻² | 3.8 × 10⁻⁴ | 0.000 | 0.831 | 1.1 × 10⁻² | 0.001 | 3.6 × 10⁻⁵ | 4.8 × 10⁻² | 1.6 × 10⁻⁶ | ||||||||
| 9 SC | 0.779 | 2.2 × 10⁻¹⁶ | 0.998 | 0.982 | 2.2 × 10⁻¹ | 0.999 | 0.998 | 2.2 × 10⁻¹ | 0.998 | 2.2 × 10⁻¹ | 0.996 | 2.2 × 10⁻¹ | 2.2 × 10⁻⁶ | |||||||||
| TSA | 4.1 × 10⁻²³ | 6.9 × 10−01 | 6.7 × 10−01 | 4.1 × 10⁻²³ | 6.7 × 10−01 | 6.8 × 10−01 | 6.8 × 10−01 | 4.1 × 10⁻² | 9.1 × 10−0 | 6.8 × 10−0 | 4.1 × 10⁻³ | 4.1 × 10⁻² | 4.1 × 10⁻³ | |||||||||
| PCO | 0.261 | 2 × 10⁻⁴ | 2.6 × 10⁻⁵ | 3.5 × 10⁻³ | 2.2 × 10⁻¹¹ | 3.4 × 10⁻³ | 4.9 × 10⁻¹⁷ | 0.0002 | 1.4 × 10⁻¹ | 0.9137 | 4.3 × 10⁻⁸ | 3 × 10⁻¹⁴ | 7.3 × 10⁻³ | |||||||||
| 10 SC | 2.2 × 10⁻¹ | 0.777 | 0.790 | 2.2 × 10⁻¹ | 0.78 | 0.777 | 2.2 × 10⁻¹ | 0.778 | 2.2 × 10⁻¹ | 0.782 | 2.2 × 10⁻¹ | 2.2 × 10⁻¹ | ||||||||||
| TSA | 0.999 | 3.9 × 10⁻³ | 1.8 × 10⁻³ | 0.999 | 2.1 × 10⁻² | 2.3 × 10⁻² | 2.5 × 10⁻² | 0.999 | 3.3 × 10⁻² | 2.5 × 10⁻³ | 0.999 | 0.999 | ||||||||||
| PCO | 3.1 × 10⁻² | 1 × 10⁻⁵ | 1 × 10⁻²⁴ | 0.001 | 9.1 × 10⁻² | 2.5 × 10⁻² | 0.002 | 5.6 × 10⁻¹ | 0.348 | 2.8 × 10⁻⁷ | 0.000 | 4.5 × 10⁻⁶ | ||||||||||
| 11 SC | 2.2 × 10⁻¹ | 2.2 × 10⁻⁶ | 0.999 | 2.2 × 10⁻¹ | 2.2 × 10⁻² | 0.999 | 2.2 × 10⁻¹ | 0.999 | 2.2 × 10⁻⁶ | 0.999 | 0.999 | |||||||||||
| TSA | 0.999 | 3.9 × 10⁻³ | 1.8 × 10⁻³ | 0.999 | 2.1 × 10⁻² | 2.3 × 10⁻² | 2.4 × 10⁻² | 0.999 | 3.3 × 10⁻³ | 2.5 × 10⁻³ | 0.999 | |||||||||||
| PCO | 2.6 × 10⁻¹ | 0.767 | 7.5 × 10⁻¹ | 0.286 | 1.4 × 10⁻⁷ | 8.5 × 10⁻⁶ | 0.004 | 1.7 × 10⁻³ | 3.9 × 10⁻⁸ | 8.8 × 10⁻¹ | 8.5 × 10⁻² | |||||||||||
| 12 SC | 0.986 | 2.2 × 10⁻⁶ | 0.997 | 0.999 | 2.2 × 10⁻¹ | 0.999 | 2.2 × 10⁻¹ | 0.996 | 2.2 × 10⁻⁶ | 2.2 × 10⁻¹ | ||||||||||||
| TSA | 9.7 × 10⁻¹ | 3.9 × 10⁻³ | 9.79 × 10⁻¹ | 9.8 × 10⁻¹ | 9.8 × 10−0 | 3.9 × 10⁻³ | 7.7 × 10−0 | 0.980 | 3.9 × 10⁻³ | 3.9 × 10⁻² | ||||||||||||
| PCO | 2.9 × 10⁻¹ | 1.6 × 10⁻¹ | 2.1 × 10⁻¹ | 0.000 | 1.3 × 10⁻³ | 9.4 × 10⁻⁸ | 1.3 × 10⁻⁴ | 0.008 | 4.9 × 10⁻¹ | 0.001 | ||||||||||||
| 13 SC | 2.2 × 10⁻¹ | 0.988 | 0.985 | 2.2 × 10⁻¹ | 0.986 | 2.2 × 10⁻¹ | 0.998 | 2.2 × 10⁻¹ | 2.2 × 10⁻¹ | |||||||||||||
| TSA | 1.8 × 10⁻² | 0.990 | 0.990 | 0.990 | 1.8 × 10⁻² | 7.5 × 10−0 | 0.990 | 1.8 × 10⁻³ | 1.80 × 10⁻³ | |||||||||||||
| PCO | 1.8 × 10⁻¹ | 0.451 | 1.3 × 1068 | 1.3 × 10⁻⁵ | 0.010 | 2 × 10⁻³ | 9.4 × 10⁻² | 0.000 | 5.9 × 10⁻¹ | |||||||||||||
| 14 SC | 2.2 × 10⁻⁶ | 2.2 × 10⁻¹ | 0.999 | 2.2 × 10⁻¹ | 0.999 | 2.2 × 10⁻¹ | 0.999 | 0.999 | ||||||||||||||
| TSA | 2.1 × 10⁻³ | 2.8 × 10⁻³ | 2.4 × 10⁻³ | 0.999 | 3.3 × 10⁻² | 2.5 × 10⁻² | 0.999 | 0.999 | ||||||||||||||
| PCO | 0.000 | 1.4 × 10⁻³ | 4 × 10⁻³ | 0.021 | 2.3 × 10⁻¹ | 9.6 × 10⁻¹ | 0.413 | 7.5 × 10⁻¹ | ||||||||||||||
| 15 SC | 0.997 | 2.2 × 10⁻⁶ | 0.997 | 2.2 × 10⁻¹ | 0.997 | 2.2 × 10⁻¹ | 2.2 × 10⁻¹ | |||||||||||||||
| TSA | 0.990 | 0.990 | 2.1 × 10⁻³ | 7.5 × 10−0 | 0.990 | 2.1 × 10⁻² | 2.1 × 10⁻² | |||||||||||||||
| PCO | 1.6 × 10⁻⁶ | 2.2 × 10⁻⁵ | 0.058 | 8.8 × 10⁻² | 2.8 × 10⁻² | 0.000 | 1.8 × 10⁻¹ | |||||||||||||||
| 16 SC | 2.2 × 10⁻¹ | 0.999 | 2.2 × 10⁻¹ | 0.994 | 2.2 × 10⁻¹ | 2.2 × 10⁻¹ | ||||||||||||||||
| TSA | 0.990 | 2.3 × 10⁻³ | 7.5 × 10−0 | 0.990 | 2.3 × 10⁻² | 2.3 × 10⁻² | ||||||||||||||||
| PCO | 0.000 | 2.7 × 10⁻⁴ | 8.8 × 10⁻¹ | 1.1 × 10⁻² | 1.5 × 10⁻⁴ | 0.007 | ||||||||||||||||
| 17 SC | 2.2 × 10⁻¹ | 0.999 | 2.2 × 10⁻¹ | 0.999 | 0.999 | |||||||||||||||||
| TSA | 2.4 × 10⁻² | 7.5 × 10−0 | 0.990 | 2.4 × 10⁻² | 2.4 × 10⁻² | |||||||||||||||||
| PCO | 3.4 × 10⁻² | 0.005 | 8.6 × 10⁻⁴ | 4.2 × 10⁻² | 1.2 × 10⁻² | |||||||||||||||||
| 18 SC | 2.2 × 10⁻¹ | 0.995 | 2.2 × 10⁻² | 2.2 × 10⁻¹ | ||||||||||||||||||
| TSA | 3.3 × 10⁻² | 2.5 × 10⁻³ | 0.999 | 0.999 | ||||||||||||||||||
| PCO | 1 × 10⁻¹ | 6.2 × 10⁻¹¹ | 0.009 | 9.1 × 10⁻⁷ | ||||||||||||||||||
| 19 SC | 2.2 × 10⁻¹ | 0.999 | 0.999 | |||||||||||||||||||
| TSA | 7.6 × 10−0 | 3.3 × 10⁻² | 3.3 × 10⁻² | |||||||||||||||||||
| PCO | 2 × 10−72 | 1.2 × 10⁻¹ | 2.2 × 10⁻² | |||||||||||||||||||
| 20 SC | 2.2 × 10⁻¹ | 2.2 × 10⁻¹⁶ | ||||||||||||||||||||
| TSA | 2.5 × 10⁻³ | 2.5 × 10⁻² | ||||||||||||||||||||
| PCO | 6.3 × 10⁻¹ | 1.6 × 10−0 | ||||||||||||||||||||
| 21 SC | 0.999 | |||||||||||||||||||||
| TSA | 0.999 | |||||||||||||||||||||
| PCO | 0.999 | |||||||||||||||||||||
| PDC with 5 regions | 1 SC | 2.5 × 10⁻¹ | 2.5 × 10⁻¹ | 2.5 × 10⁻¹ | 0.999 | |||||||||||||||||
| TSA | 7.5 × 10⁻² | 3.0 × 10⁻² | 0.999 | 1.5 × 10⁻² | ||||||||||||||||||
| PCO | 2.1 × 10−0 | 2.2 × 10 | 4.1 × 10⁻⁶ | 0.000 | ||||||||||||||||||
| 2 SC | 0.615 | 0.874 | 2.2 × 10⁻¹ | |||||||||||||||||||
| TSA | 3.8 × 10⁻¹ | 7.5 × 10⁻² | 0.970 | |||||||||||||||||||
| PCO | 7.3 × 10⁻⁴ | 2.2 × 10⁻¹ | 1.1 × 10⁻⁴ | |||||||||||||||||||
| 3 SC | 0.5083 | 2.2 × 10⁻¹ | ||||||||||||||||||||
| TSA | 7.5 × 10⁻² | 4.4 × 10⁻¹ | ||||||||||||||||||||
| PCO | 2.2 × 10⁻¹ | 0.994 | ||||||||||||||||||||
| 4 SC | 2.2 × 10⁻¹ | |||||||||||||||||||||
| TSA | 1.5 × 10⁻² | |||||||||||||||||||||
| PCO | 1.5 × 10⁻³ |
References
- Lawton, J.H.; May, R.M. (Eds.) Extinction Rates; Oxford University Press: Oxford, UK, 1995; pp. xii + 233. ISBN 0-19-854829. [Google Scholar] [CrossRef]
- Butchart, S.H.M.; Walpole, M.; Collen, B.; Van Strien, A.; Scharlemann, J.P.W.; Almond, R.E.A.; Baillie, J.E.M.; Bomhard, B.; Brown, C.; Bruno, J.; et al. Global biodiversity: Indicators of recent declines. Science 2010, 328, 1164–1168. [Google Scholar] [CrossRef]
- Intergovernmental Science-Policy Platform on Biodiversity and Ecosys-tem Services (IPBES). Summary for Policymakers of the Global Assessment Report on Biodiversity and Ecosystem Services of the Intergovernmental Science-Policy Platform on Biodiversity and Ecosystem Services; IPBES Secretariat: Bonn, Germany, 2019; pp. 22–47. [Google Scholar]
- Narain, D.; Sonter, L.; Lechner, A.; Watson, J.; Simmonds, J.; Maron, M. Global assessment of the biodiversity safeguards of development banks that finance infrastructure. Conserv. Biol. 2023, 37, e14095. [Google Scholar] [CrossRef]
- Dinerstein, E.; Olson, D.; Joshi, A.; Vynne, C.; Burgess, N.D.; Wikramanayake, E.; Hahn, N.; Palminteri, S.; Hedao, P.; Noss, R.; et al. Al-Shammari, Muhammad Saleem, An Ecoregion-Based Approach to Protecting Half the Terrestrial Realm. BioScience 2017, 67, 534–545. [Google Scholar] [CrossRef] [PubMed]
- Franklin, J. Species distribution modelling supports the study of past, present and future biogeographies. J. Biogeogr. 2023, 50, 1533–1548. [Google Scholar] [CrossRef]
- Whittaker, R.J.; Araújo, M.B.; Jepson, P.; Ladle, R.J.; Watson, J.E.M.; Willis, K.J. Conservation biogeography: Assessment and prospect. Divers. Distrib. 2005, 11, 3–23. [Google Scholar] [CrossRef]
- Hortal, J.; Lobo, J.M.; Martin-PIERA, F. Una estrategia para obtener regionalizaciones bióticas fiables a partir de datos incompletos: El caso de los escarabeidos (coleoptera, scarabaeinae) ibérico-baleares. Graellsia 2003, 59, 331–344. [Google Scholar] [CrossRef]
- Fisher, B.L. Improving inventory efficiency: A case study of leaf-litter ant diversity in madagascar. Ecol. Appl. 1999, 9, 714–731. [Google Scholar] [CrossRef]
- Joaquín, C.; Magnus, N.; Alexis, R.; Anton, E.; Martin, R. Regularities in species’ niches reveal the world’s climate regions. eLife 2021, 10, e58397. [Google Scholar] [CrossRef]
- Gonzalez-Orozco, C.E.; Laffan, S.W.; Knerr, N.; Miller, J.T. A biogeographical regionalization of Australian Acacia species. J. Biogeogr. 2013, 40, 2156–2166. [Google Scholar] [CrossRef]
- Bloomfield, N.J.; Knerr, N.; Encinas-Viso, F. A comparison of network and clustering methods to detect biogeographical regions. Ecography 2018, 41, 1–10. [Google Scholar] [CrossRef]
- Wallace, A.R. The Geographical Distribution of Animals; Harper and Brothers: New York, NY, USA, 1876; Volumes I & II. [Google Scholar]
- Ojeda, F.; Marañón, T.; Arroyo, J. Patterns of ecological, chorological and taxonomic diversity at both sides of the Strait of Gibraltar. J. Veg. Sci. 1996, 7, 63–72. [Google Scholar] [CrossRef]
- Gao, P.; Kupfer, J.A. Capitalizing on a Wealth of Spatial Information: Improving Biogeographic Regionalization Through the Use of Spatial Clustering. Appl. Geogr. 2018, 99, 98–108. [Google Scholar] [CrossRef]
- Ariza-Salamanca, A.J.; González-Moreno, P.; López-Quintanilla, J.B.; Navarro-Cerrillo, R.M. Large-Scale Mapping of Complex Forest Typologies Using Multispectral Imagery and Low-Density Airborne LiDAR: A Case Study in Pinsapo Fir Forests. Remote Sens. 2024, 16, 3182. [Google Scholar] [CrossRef]
- Gonzalez-Orozco, C. Biogeographical regionalization of Colombia: A revised area taxonomy. Phytotaxa 2021, 484, 247–260. [Google Scholar] [CrossRef]
- Holdridge, L.R. Life Zone Ecology; Tropical Science Center: San José, Costa Rica, 1967; p. 206. [Google Scholar]
- Sun, Y.; Niu, J. Regionalization of Daily Soil Moisture Dynamics Using Wavelet-Based Multiscale Entropy and Principal Component Analysis. Entropy 2019, 21, 548. [Google Scholar] [CrossRef]
- Khan, A.J.; Koch, M. Correction and Informed Regionalization of Precipitation Data in a High Mountainous Region (Upper Indus Basin) and Its Effect on SWAT-Modelled Discharge. Water 2018, 10, 1557. [Google Scholar] [CrossRef]
- Hargrove, W.; Hoffman, F. Potential of Multivariate Quantitative Methods for Delineation and Visualization of Ecoregions. Environ. Manag. 2004, 34 (Suppl. S1), S39–S60. [Google Scholar] [CrossRef]
- Rousseau, J.; Betts, M. Factors influencing transferability in species distribution models. Ecography 2022, 2022, e06060. [Google Scholar] [CrossRef]
- Laffan, S.; Lubarsky, E.; Rosauer, D. Biodiverse: A tool for the spatial analysis of biological and other diversity. Ecography 2010, 33, 643–647. [Google Scholar] [CrossRef]
- Daru, B.H.; Karunarathne, P.; Schliep, K. phyloregion: R package for biogeographic regionalization and macroecology. Methods Ecol. Evol. 2020, 11, 1483–1491. [Google Scholar] [CrossRef]
- Lemus-Canovas, M.; Lopez-Bustins, J.A.; Martin-Vide, J.; Royé, D. synoptReg: An R package for computing a synoptic climate classification and a spatial regionalization of environmental data. Environ. Model. Softw. 2019, 118, 114–119. [Google Scholar] [CrossRef]
- Zhao, W.; Ma, J.; Liu, Q.; Song, J.; Tysklind, M.; Liu, C.; Wang, D.; Qu, Y.; Wu, Y.; Wu, F. Comparison and application of SOFM, fuzzy c-means and k-means clustering algorithms for natural soil environment regionalization in China. Environ. Res. 2023, 216, 114519. [Google Scholar] [CrossRef] [PubMed]
- Wei, X.; Zhang, Z.; Huang, H.; Zhou, Y. An overview on deep clustering. Neurocomputing 2024, 590, 127761. [Google Scholar] [CrossRef]
- Aydin, O.; Janikas, M.; Assuncao, R.; Lee, T.-H. A quantitative comparison of regionalization methods. Int. J. Geogr. Inf. Sci. 2021, 35, 2287–2315. [Google Scholar] [CrossRef]
- Chen, X.; Zhang, C.; Chen, X.; Saunier, N.; Sun, L. Discovering Dynamic Patterns from Spatiotemporal Data with Time-Varying Low-Rank Autoregression. arXiv 2022, arXiv:2211.15482v1. [Google Scholar] [CrossRef]
- Del Barrio, G.; Sanjuán, M.E.; Martínez-Valderrama, J.; Ruiz, A. Descripción y Ensayo de un Procedimiento de Regionalización Climática del Territorio; Serie “Metodologías para el seguimiento del estado de conservación de los tipos de hábitat”; Ministerio Para la Transición Ecológica: Madrid, Spain, 2019; p. 42. [Google Scholar]
- Pata, P.; Galbraith, M.; Young, K.; Margolin, A.; Perry, R.; Hunt, B. Data-driven determination of zooplankton bioregions and robustness analysis. MethodsX 2024, 12, 102676. [Google Scholar] [CrossRef]
- Grassi, K.; Poisson-Caillault, É.; Bigand, A.; Lefebvre, A. Comparative Study of Clustering Approaches Applied to Spatial or Temporal Pattern Discovery. J. Mar. Sci. Eng. 2020, 8, 713. [Google Scholar] [CrossRef]
- Pampuch, L.; Negri, R.; Loikith, P.; Bortolozo, C. A Review on Clustering Methods for Climatology Analysis and Its Application over South America. Int. J. Geosci. 2023, 14, 877–894. [Google Scholar] [CrossRef]
- Hartigan, J.A.; Wong, M.A. A K-Means Clustering Algorithm. J. R. Stat. Soc. Ser. C Appl. Stat. 1979, 28, 100–108. [Google Scholar] [CrossRef]
- Ester, M.; Kriegel, H.P.; Sander, J.; Xu, X. A density-based algorithm for discovering clusters in large spatial databases with noise. In Proceedings of the Knowledge Discovery and Data Mining KDD, Portland, OR, USA, 2–4 August 1996; Volume 96, pp. 226–231. [Google Scholar]
- Tortora, C.; Summa, M.G.; Palumbo, F. Factor PD-Clustering. arXiv 2011, arXiv:1106.3830v1. [Google Scholar] [CrossRef]
- Połap, D.; Prokop, K.; Srivastava, G. Federated Heuristic Optimization Based on Fuzzy Clustering and Red Fox Optimization Algorithm. In Proceedings of the 2023 IEEE International Conference on Fuzzy Systems (FUZZ), Incheon, Republic of Korea, 13–17 August 2023; pp. 1–6. [Google Scholar] [CrossRef]
- Rosvall, M.; Bergstrom, C. Maps of Random Walks on Complex Networks Reveal Community Structure. Proc. Natl. Acad. Sci. USA 2008, 105, 1118–1123. [Google Scholar] [CrossRef] [PubMed]
- Legendre, P.; y Legendre, L. Numerical Ecology, 2nd ed.; Elsevier: Amsterdam, The Netherlands, 1998. [Google Scholar]
- Paula-Souza, L.B.D.; Diniz Filho, J.A.F. Variance partitioning and spatial eigenvector analyses with large macroecological datasets. Front. Biogeogr. 2020, 12. [Google Scholar] [CrossRef]
- Kreft, H.; Jetz, W. A framework for delineating biogeographical regions based on species distributions. J. Biogeogr. 2010, 37, 2029–2053. [Google Scholar] [CrossRef]
- Fick, S.E.; Hijmans, R.J. WorldClim 2: New 1km spatial resolution climate surfaces for global land areas. Int. J. Climatol. 2017, 37, 4302–4315. [Google Scholar] [CrossRef]
- ISRIC. SoilGrids: Global Gridded Soil Information. 2023. Available online: https://files.isric.org/soilgrids (accessed on 17 April 2024).
- Friedman, J. Greedy Function Approximation: A Gradient Boosting Machine. Ann. Stat. 2001, 29, 1189–1232. [Google Scholar] [CrossRef]
- Ahmed, M.; Seraj, R.; Islam, S.M.S. The k-means Algorithm: A Comprehensive Survey and Performance Evaluation. Electronics 2020, 9, 1295. [Google Scholar] [CrossRef]
- Arthur, D.; Vassilvitskii, S. K-Means++: The Advantages of Careful Seeding. In Proceedings of the Annual ACM-SIAM Symposium on Discrete Algorithms; Society for Industrial and Applied Mathematics: New Orleans LA, USA, 2007; Volume 8, pp. 1027–1035, ISBN 9780898716245. [Google Scholar]
- Starczewski, A.; Cader, A. Determining the Eps Parameter of the DBSCAN Algorithm. In Artificial Intelligence and Soft Computing, Proceedings of the 18th International Conference, ICAISC 2019; Zakopane, Poland, 16–20 June 2019, Proceedings, Part II 18; Springer International Publishing: Berlin/Heidelberg, Germany, 2019; pp. 420–430. [Google Scholar] [CrossRef]
- Ferraro, M.B.; Giordani, P.; Serafini, A. fclust: An R Package for Fuzzy Clustering. R J. 2019, 11, 1–18. Available online: https://journal.r-project.org/archive/2019/RJ-2019-017/RJ-2019-017.pdf (accessed on 4 November 2024). [CrossRef]
- Scrucca, L. GA: A Package for Genetic Algorithms in R. J. Stat. Softw. 2013, 53, 1–37. [Google Scholar] [CrossRef]
- Bedia, J.; Herrera, S.; Guti_errez, J.M. Dangers of using global bioclimatic datasets for ecological niche modeling. limitations for future climate projections. Glob. Planet. Chang. 2013, 107, 1–12. [Google Scholar] [CrossRef]
- cariouCsárdi, G.; Nepusz, T.; Traag, V.; Horvát Sz Zanini, F.; Noom, D.; Müller, K. igraph: Network Analysis and Visualization in R. R Package Version2.1.1. 2024. Available online: https://CRAN.R-project.org/package=igraph (accessed on 6 November 2024). [CrossRef]
- Cariou, C.; Le Moan, S.; Chehdi, K. Improving K-Nearest Neighbor Approaches for Density-Based Pixel Clustering in Hyperspectral Remote Sensing Images. Remote Sens. 2020, 12, 3745. [Google Scholar] [CrossRef]
- Dray, S.; Legendre, P.; Peres-Neto, P.R. Spatial modelling: A comprehensive framework for principal coordinate analysis of neighbour matrices (PCNM). Ecol. Model. 2006, 196, 483–493. [Google Scholar] [CrossRef]
- Frau, C.; Pino, L.; Rojas, Y.; Hernández, Y. Generalización de modelo digital de elevación condicionada por puntos críticos de terreno. Bol. Cienc. Geod. 2011, 17, 439–457. [Google Scholar] [CrossRef]
- QGIS Geographic Information System. Open Source Geospatial Foundation Project. Available online: https://qgis.org (accessed on 10 November 2024).
- Cohen, J. A coefficient of agreement for nominal scales. Educ. Psychol. Meas. 1960, 20, 37–46. [Google Scholar] [CrossRef]
- Sim, J.; Wright, C.C. The kappa statistic in reliability studies: Use, interpretation, and sample size requirements. Phys. Ther. 2005, 85, 257–268. [Google Scholar] [CrossRef]
- Foody, G. Explaining the unsuitability of the kappa coefficient in the assessment and comparison of the accuracy of thematic maps obtained by image classification. Remote Sens. Environ. 2020, 239, 111630. [Google Scholar] [CrossRef]
- Ridgeway, G. Gbm: Generalized Boosted Regression Models. Compute 1. 1-12. 2005. Available online: https://cran.r-project.org/web/packages/gbm/gbm.pdf (accessed on 11 November 2024).
- Smith, J.R.; Hendershot, J.N.; Nova, N.; Daily, G.C. The biogeography of ecoregions: Descriptive power across regions and taxa. J. Biogeogr. 2020, 47, 1413–1426. [Google Scholar] [CrossRef]
- Warton, D.; Foster, S.; De’ath, G.; Stoklosa, J.; Dunstan, P. Model-based thinking for community ecology. Plant Ecol. 2015, 216, 669–682. [Google Scholar] [CrossRef]
- Instituto Nacional Geográfico. España en mapas. In Una Síntesis Geográfica; Serie Compendios del Atlas Nacional de España (ANE); Centro Nacional de Información Geográfica: Madrid, Spain, 2019; p. 620. [Google Scholar] [CrossRef]
- Díaz González, T.E.; Penas, Á. The High Mountain Area of Northwestern Spain: The Cantabrian Range, the Galician-Leonese Mountains and the Bierzo Trench. In The Vegetation of the Iberian Peninsula. Plant and Vegetation; Loidi, J., Ed.; Springer: Cham, Switzerland, 2017; Volume 12. [Google Scholar] [CrossRef]
- Vaccaro, I.; Beltran, O. (Eds.) Social and Ecological History of the Pyrenees: State, Market, and Landscape (New Frontiers in Historical Ecology); Left Coast Press: Walnut Creek, CA, USA, 2010. [Google Scholar]
- Janík, T.; Romportl, D. Comparative landscape typology of the Bohemian and Bavarian Forest National Parks. Eur. J. Environ. Sci. 2016, 6, 114–118. [Google Scholar] [CrossRef][Green Version]
- WWF. Iberian Sclerophyllous and Semi-Deciduous Forests. 2019. Available online: https://www.worldwildlife.org/ecoregions/pa1209 (accessed on 17 April 2024).
- WWF. Iberian Conifer Forests. 2019. Available online: https://www.worldwildlife.org/ecoregions/pa1208 (accessed on 17 April 2024).
- WWF. Western Europe and Northern Africa: Parts of Portugal, Spain, France, Italy, and Morocco. 2019. Available online: https://www.worldwildlife.org/ecoregions/pa1221 (accessed on 20 May 2024).
- Mucina, L.; Bueltmann, H.; Dierßen, K.; Theurillat, J.-P.; Raus, T.; Čarni, A.; Šumberová, K.; Willner, W.; Dengler, J.; Gavilán, R.; et al. Vegetation of Europe: Hierarchical floristic classification system of vascular plant, bryophyte, lichen, and algal communities. Appl. Veg. Sci. 2016, 19, 3–264. [Google Scholar] [CrossRef]
- Joint Research Centre of the European Commission. The Digital Observatory for Protected Areas (DOPA) Explorer 3.1: North Saharan Steppe and Woodlands. 2019. Available online: https://dopa-explorer.jrc.ec.europa.eu/ecoregion/81321 (accessed on 23 April 2024).
- Boubker, J. La Certification des Agrumes au Maroc. CIHEAM-IAMB 21, Options. Méditerranéennes; Série B/021-Proceedings of the Mediterranean Network on Certification of Citrus; CIHEAM: Bari, Italy, 2004. [Google Scholar]
- Finlayson, G.; Finlayson, C.; Espejo, J.M.R. Dynamics of a thermo-Mediterranean coastal environment—The Coto Doñana National Park. Quat. Sci. Rev. 2008, 27, 2145–2152. [Google Scholar] [CrossRef]
- Oro, D.; Martínez-Vilalta, A. Migration and dispersal of Audouin’s Gull Lams audouinii from the Ebro Delta. Ostrich 1994, 65, 225–230. [Google Scholar] [CrossRef]
- González-Solís, J.; Bernadí, X.; Ruiz, X. Seasonal Variation of Waterbird Prey in the Ebro Delta Rice Fields. Colon. Waterbirds 1996, 19, 135–142. [Google Scholar] [CrossRef]
- Schenker, A.; Cahenzli, F.; Gutbrod, K.; Thévenot, M.; Erhardt, A. The Northern Bald Ibis Geronticus eremita in Morocco since 1900: Analysis of ecological requirements. Bird Conserv. Int. 2020, 30, 117–138. [Google Scholar] [CrossRef]
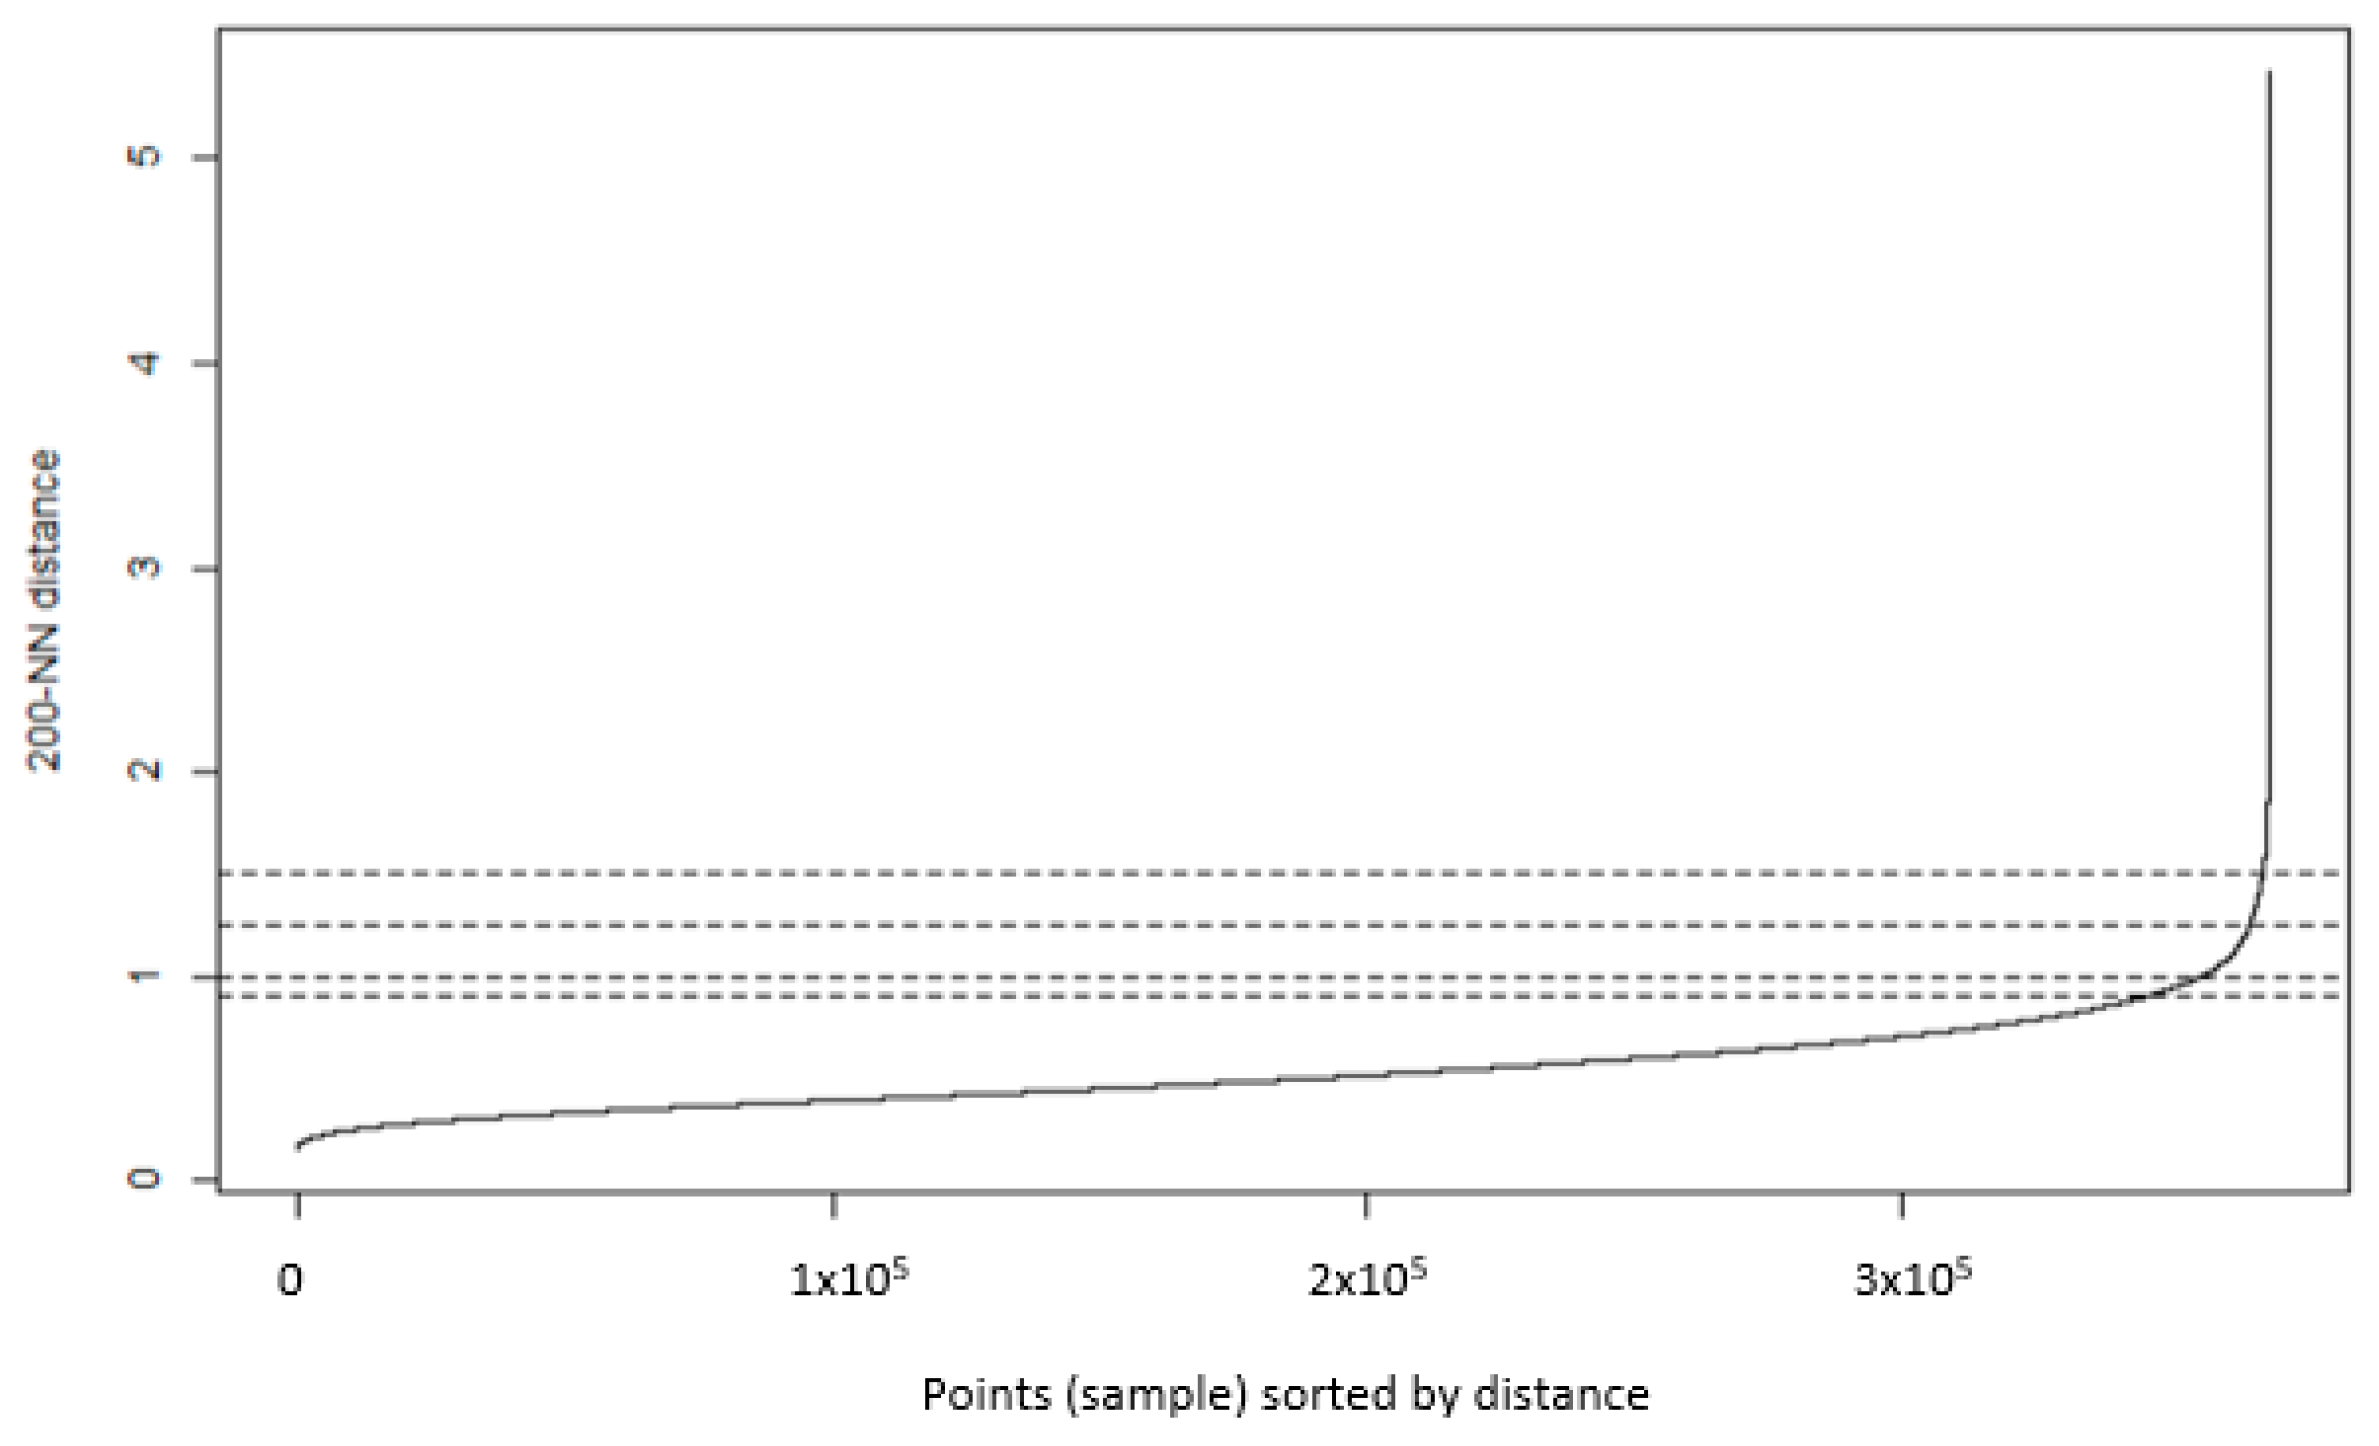

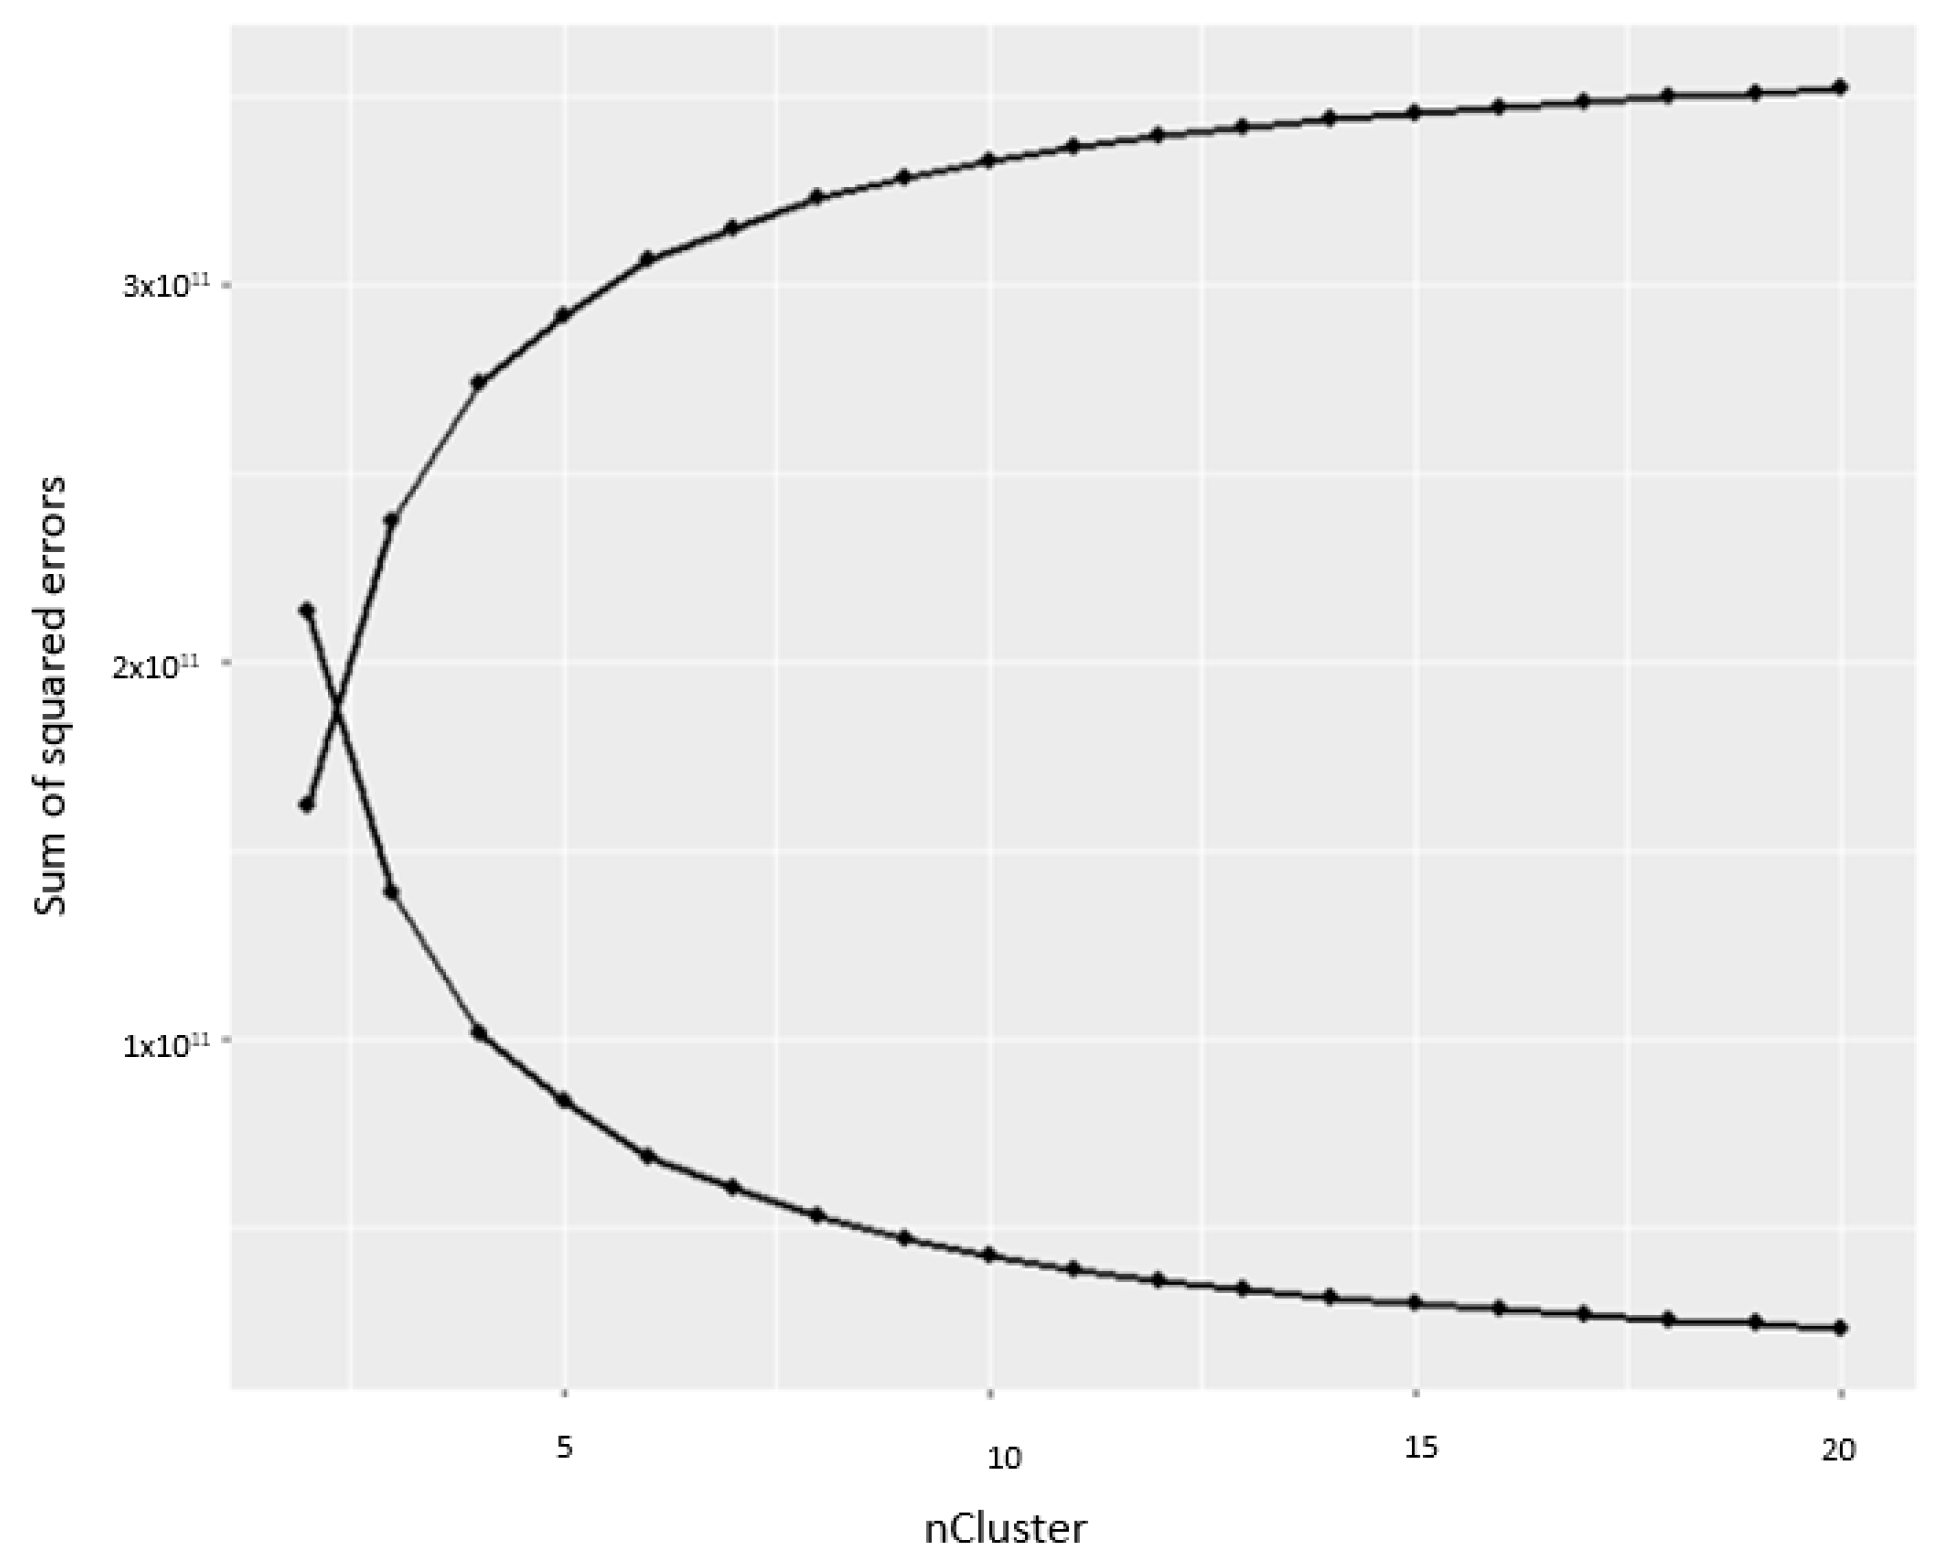
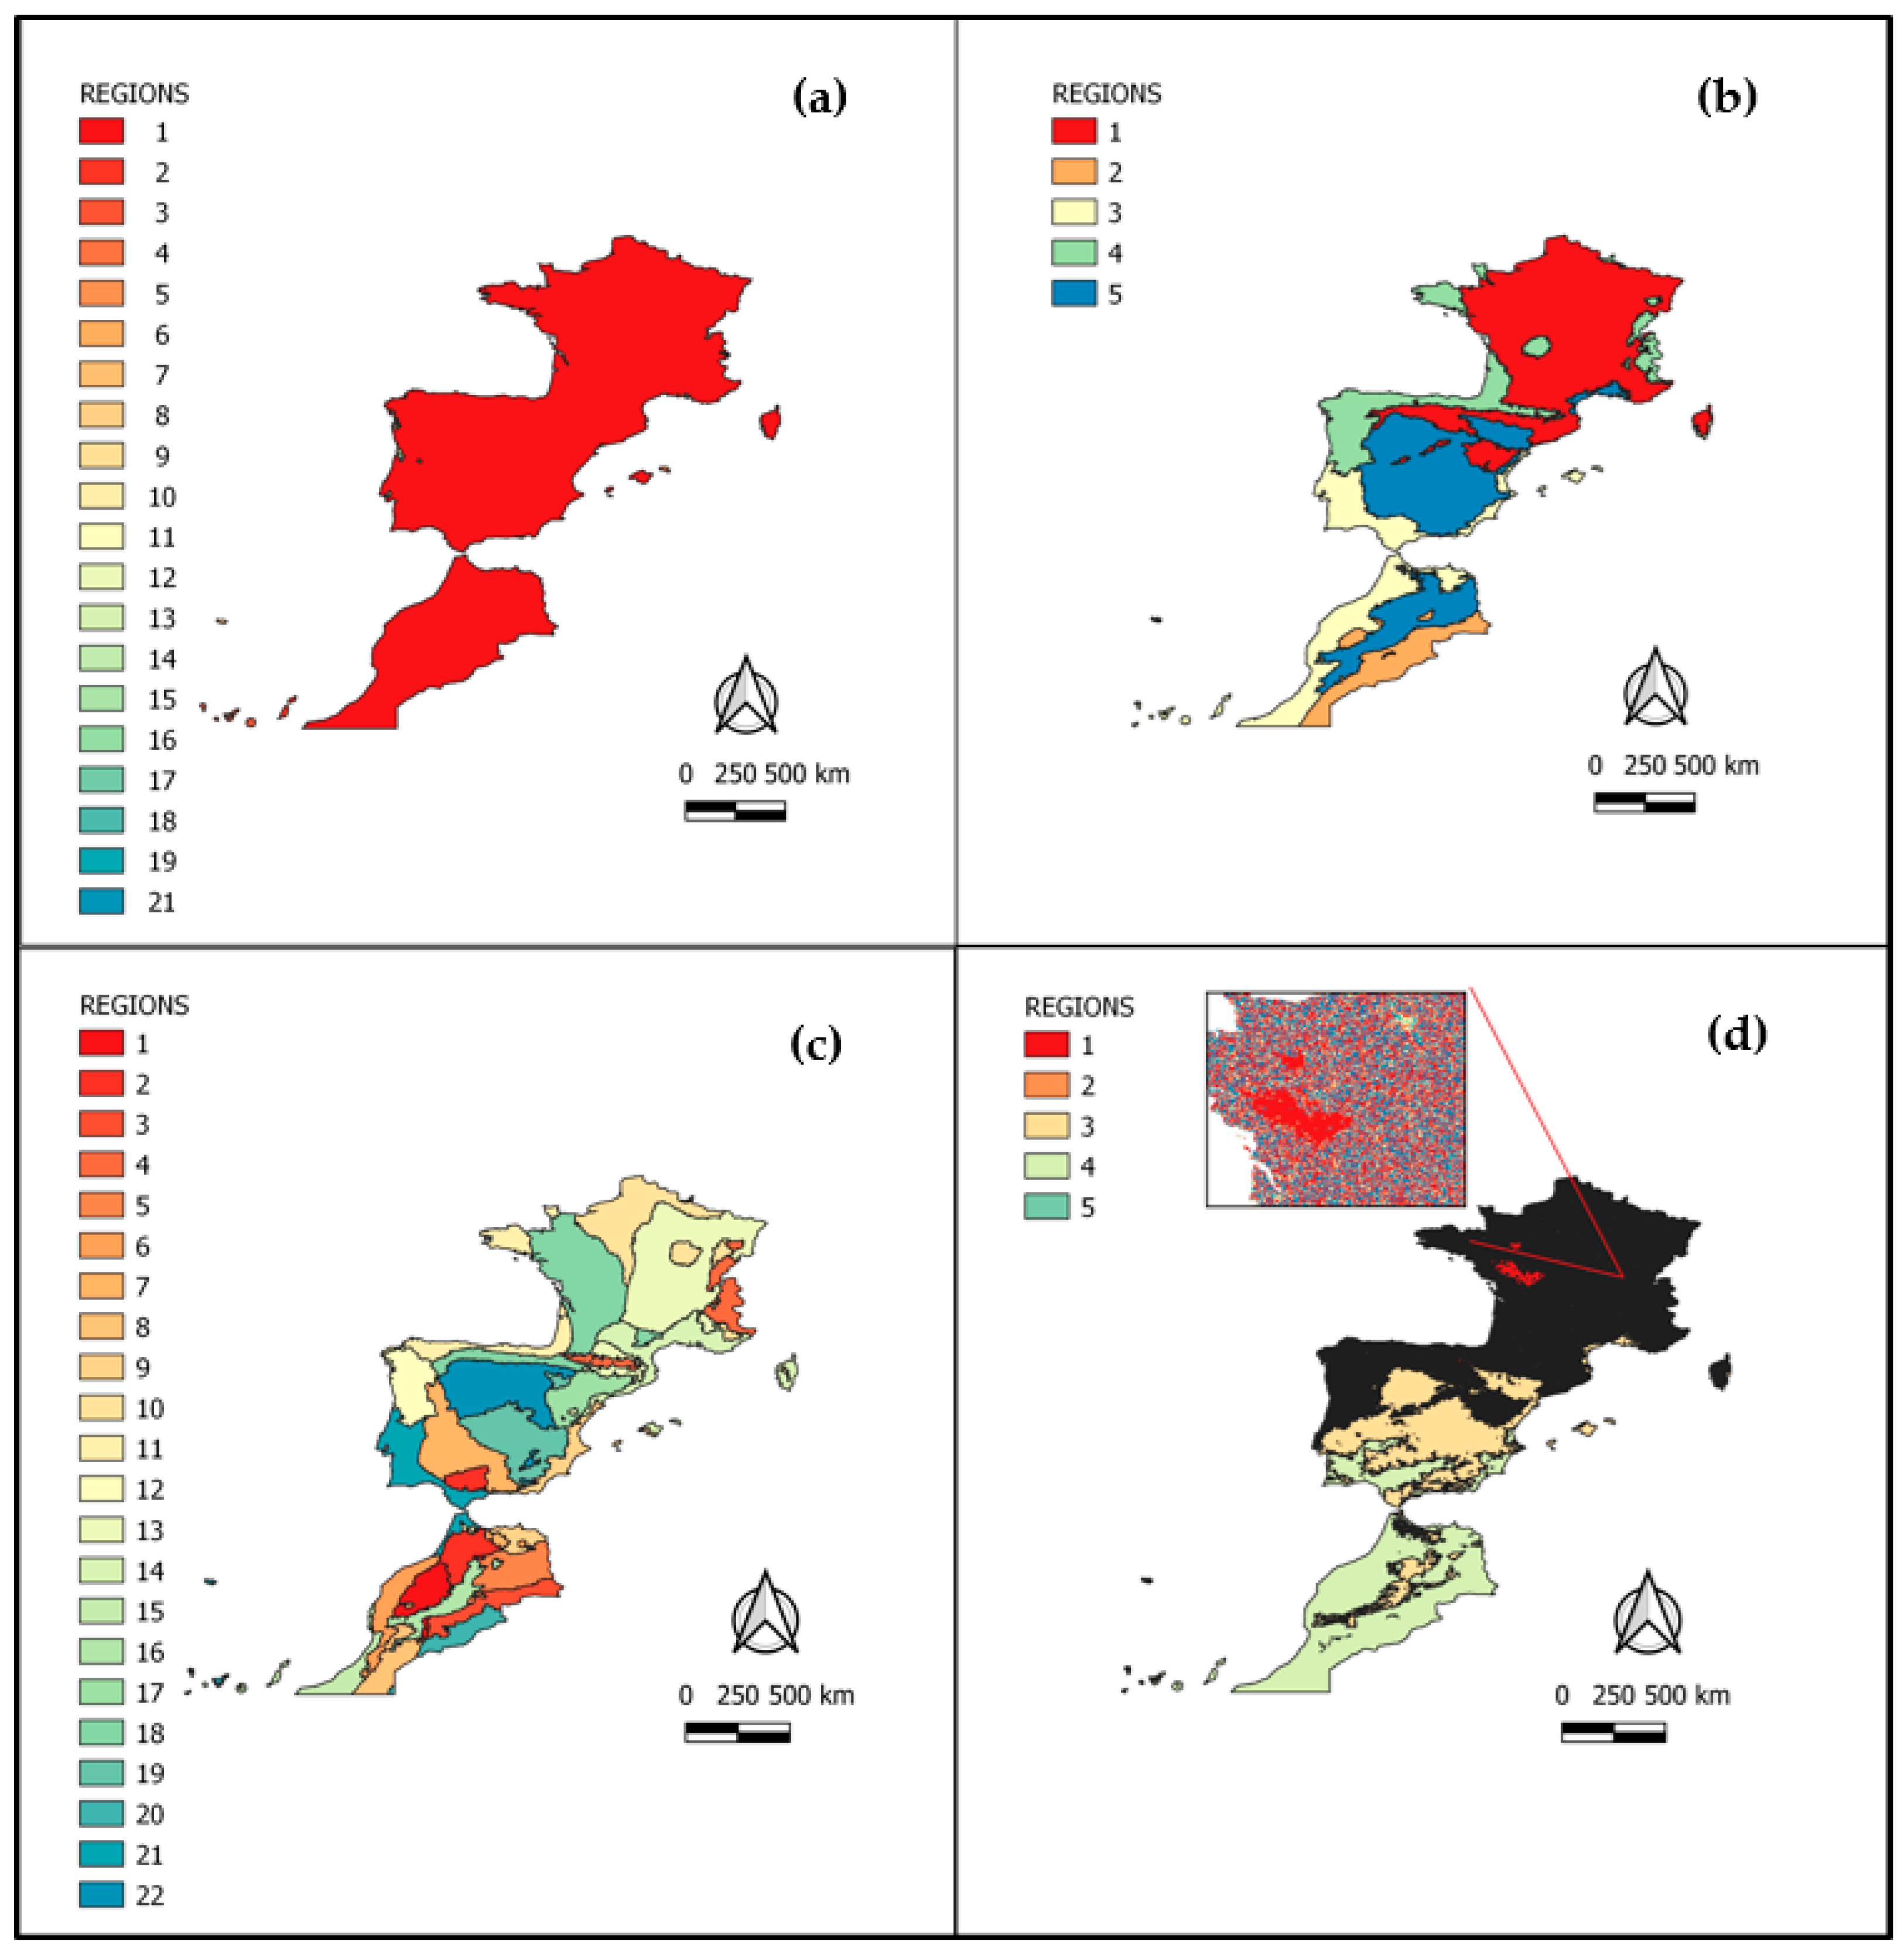
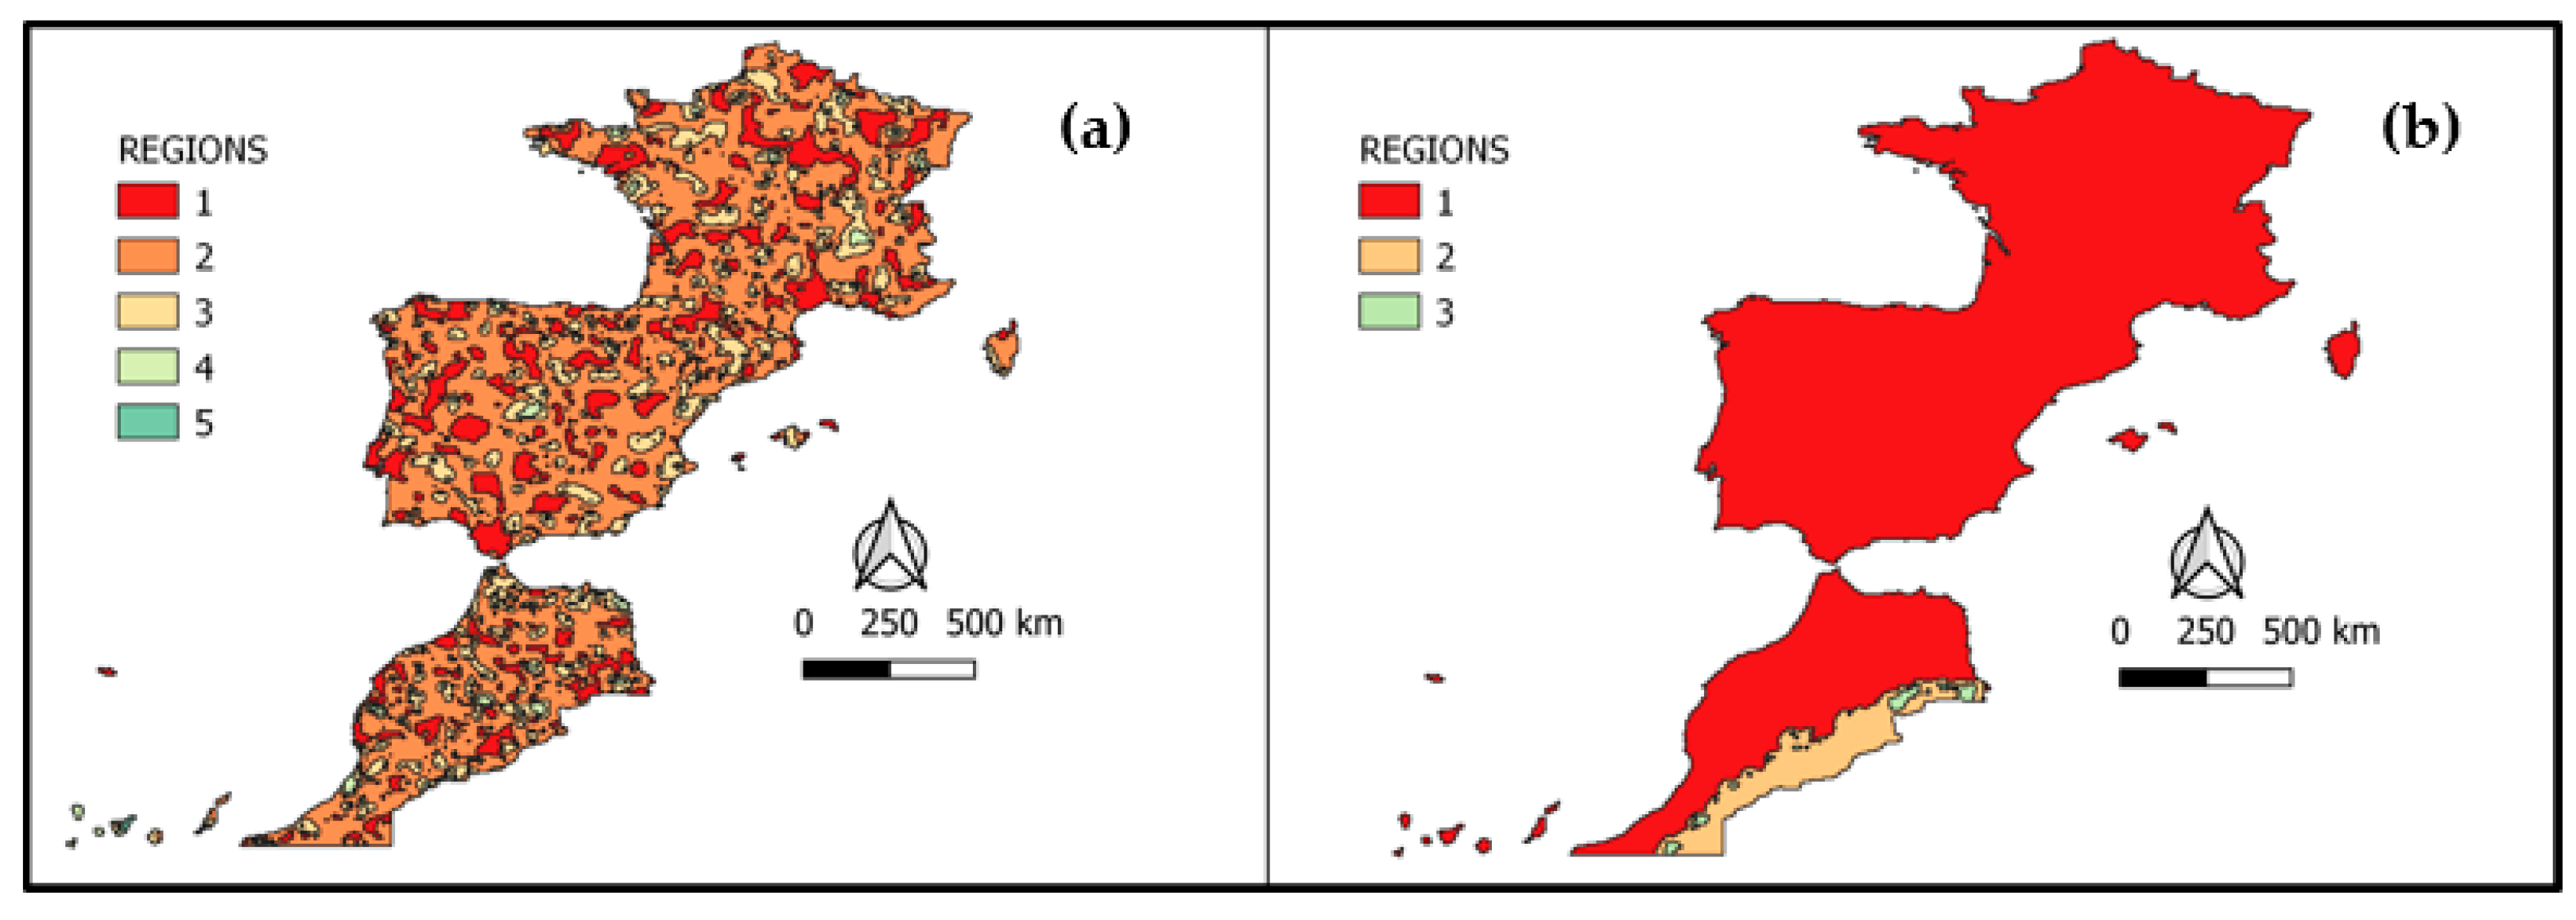

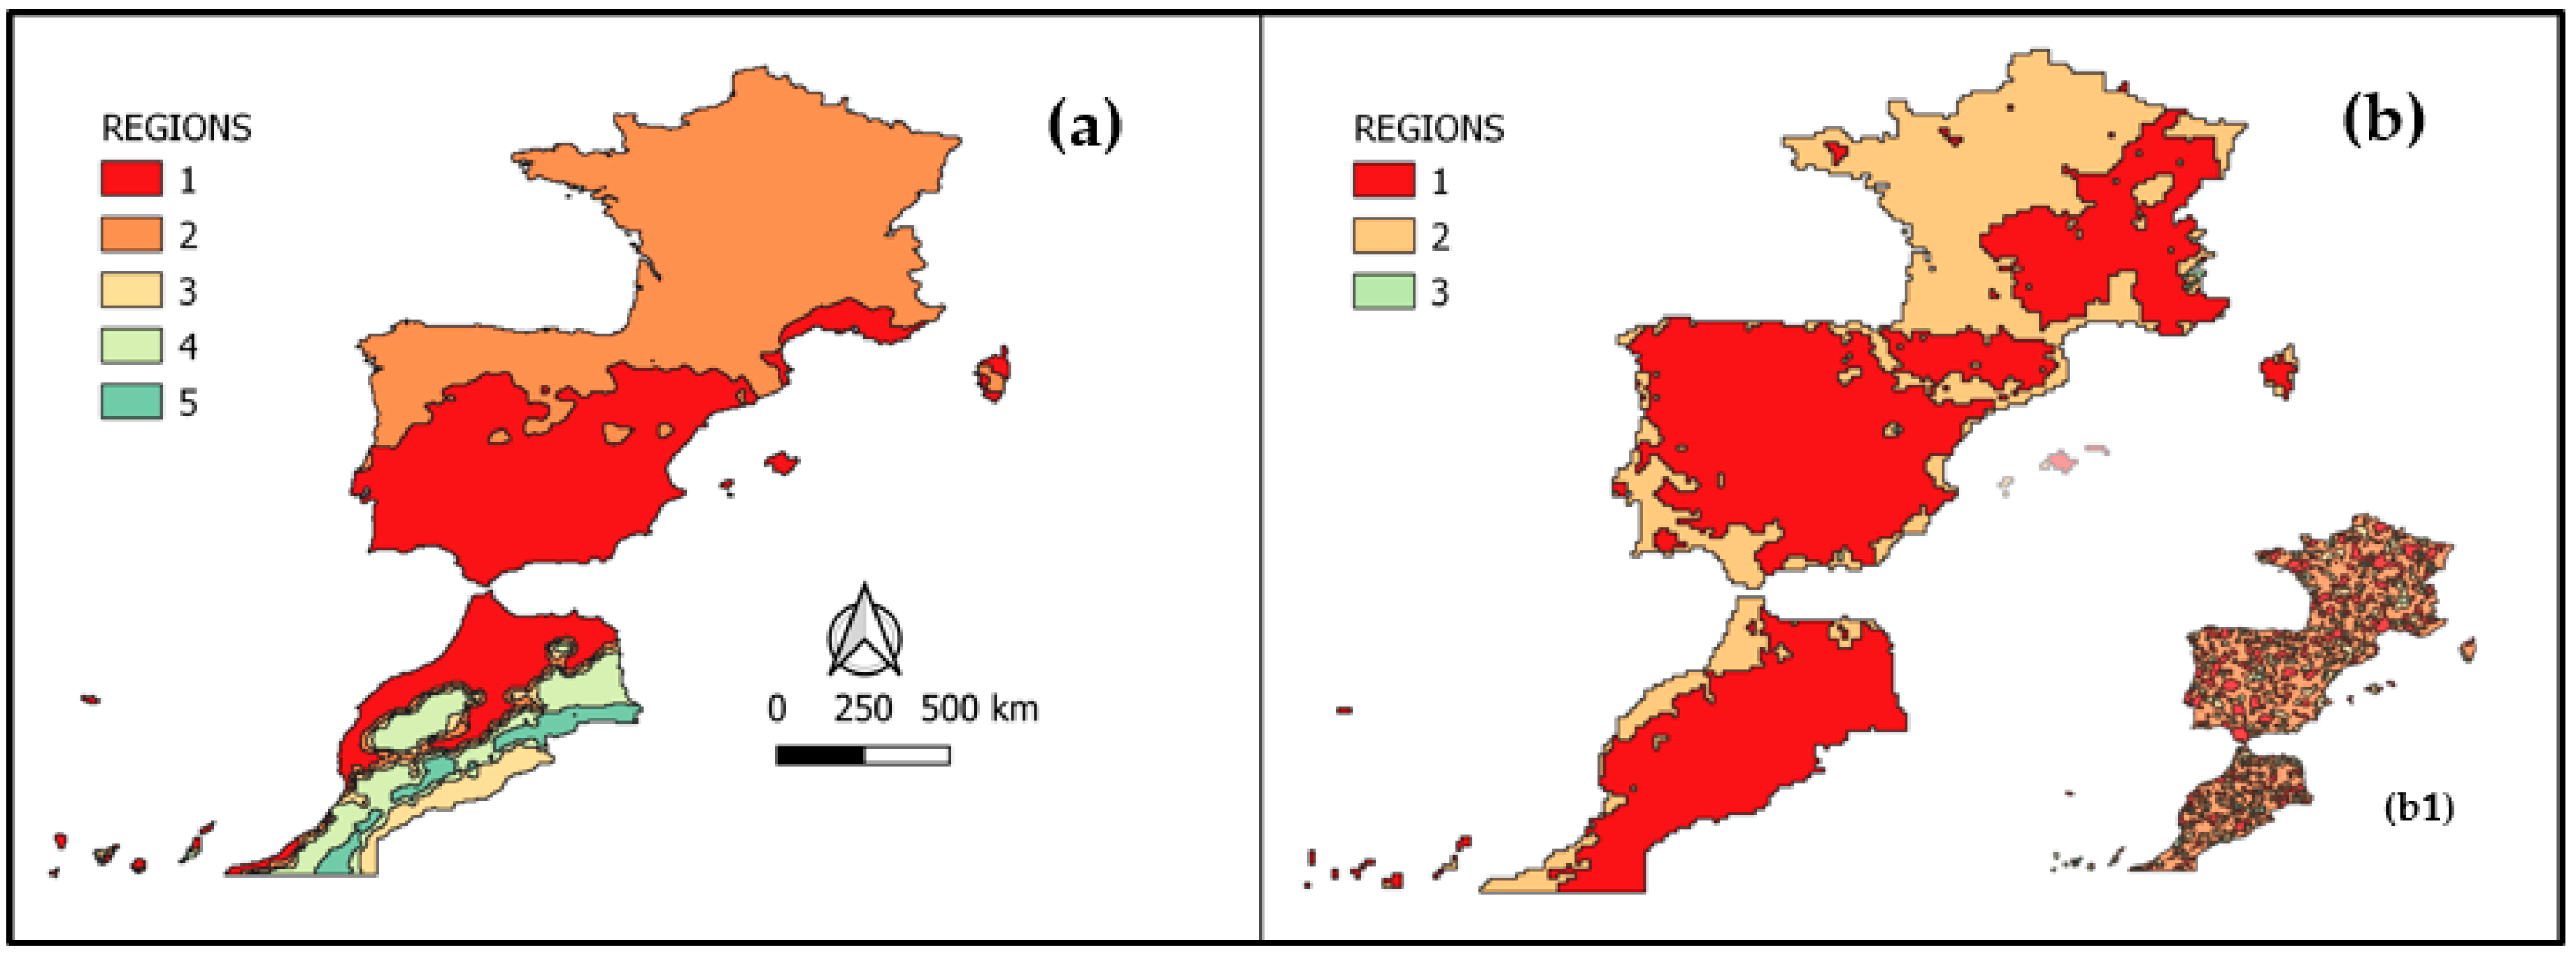

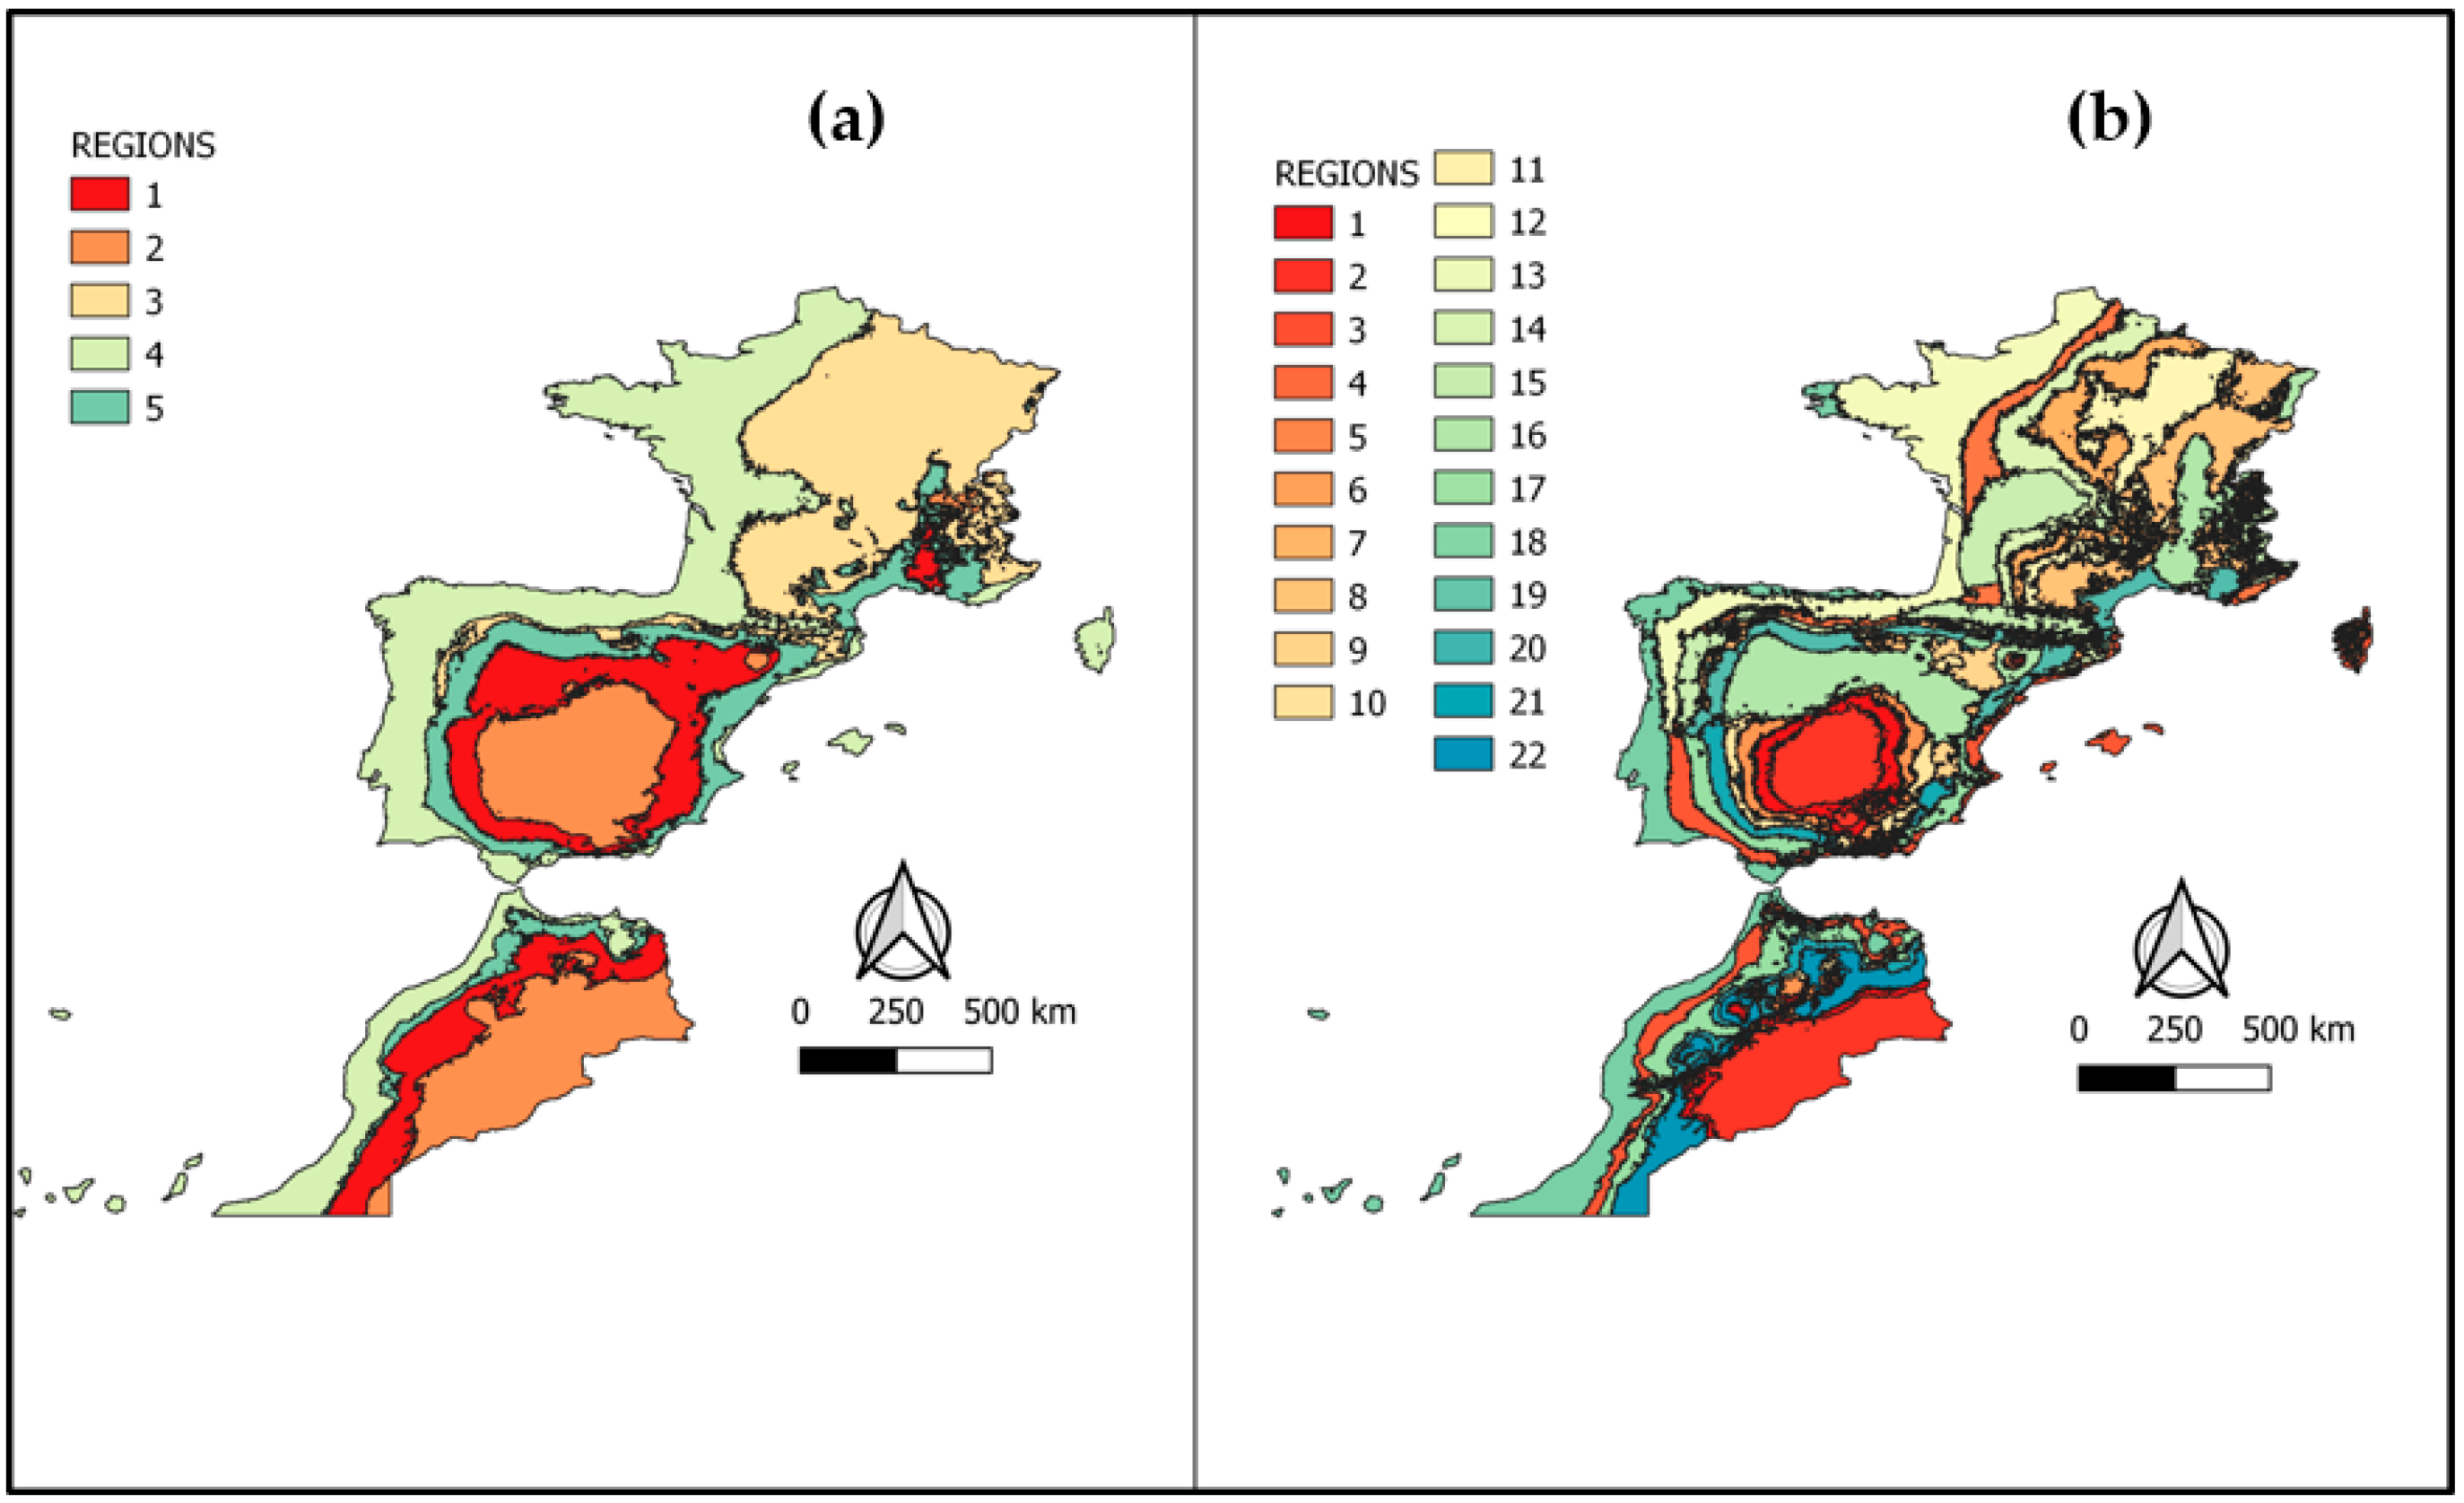
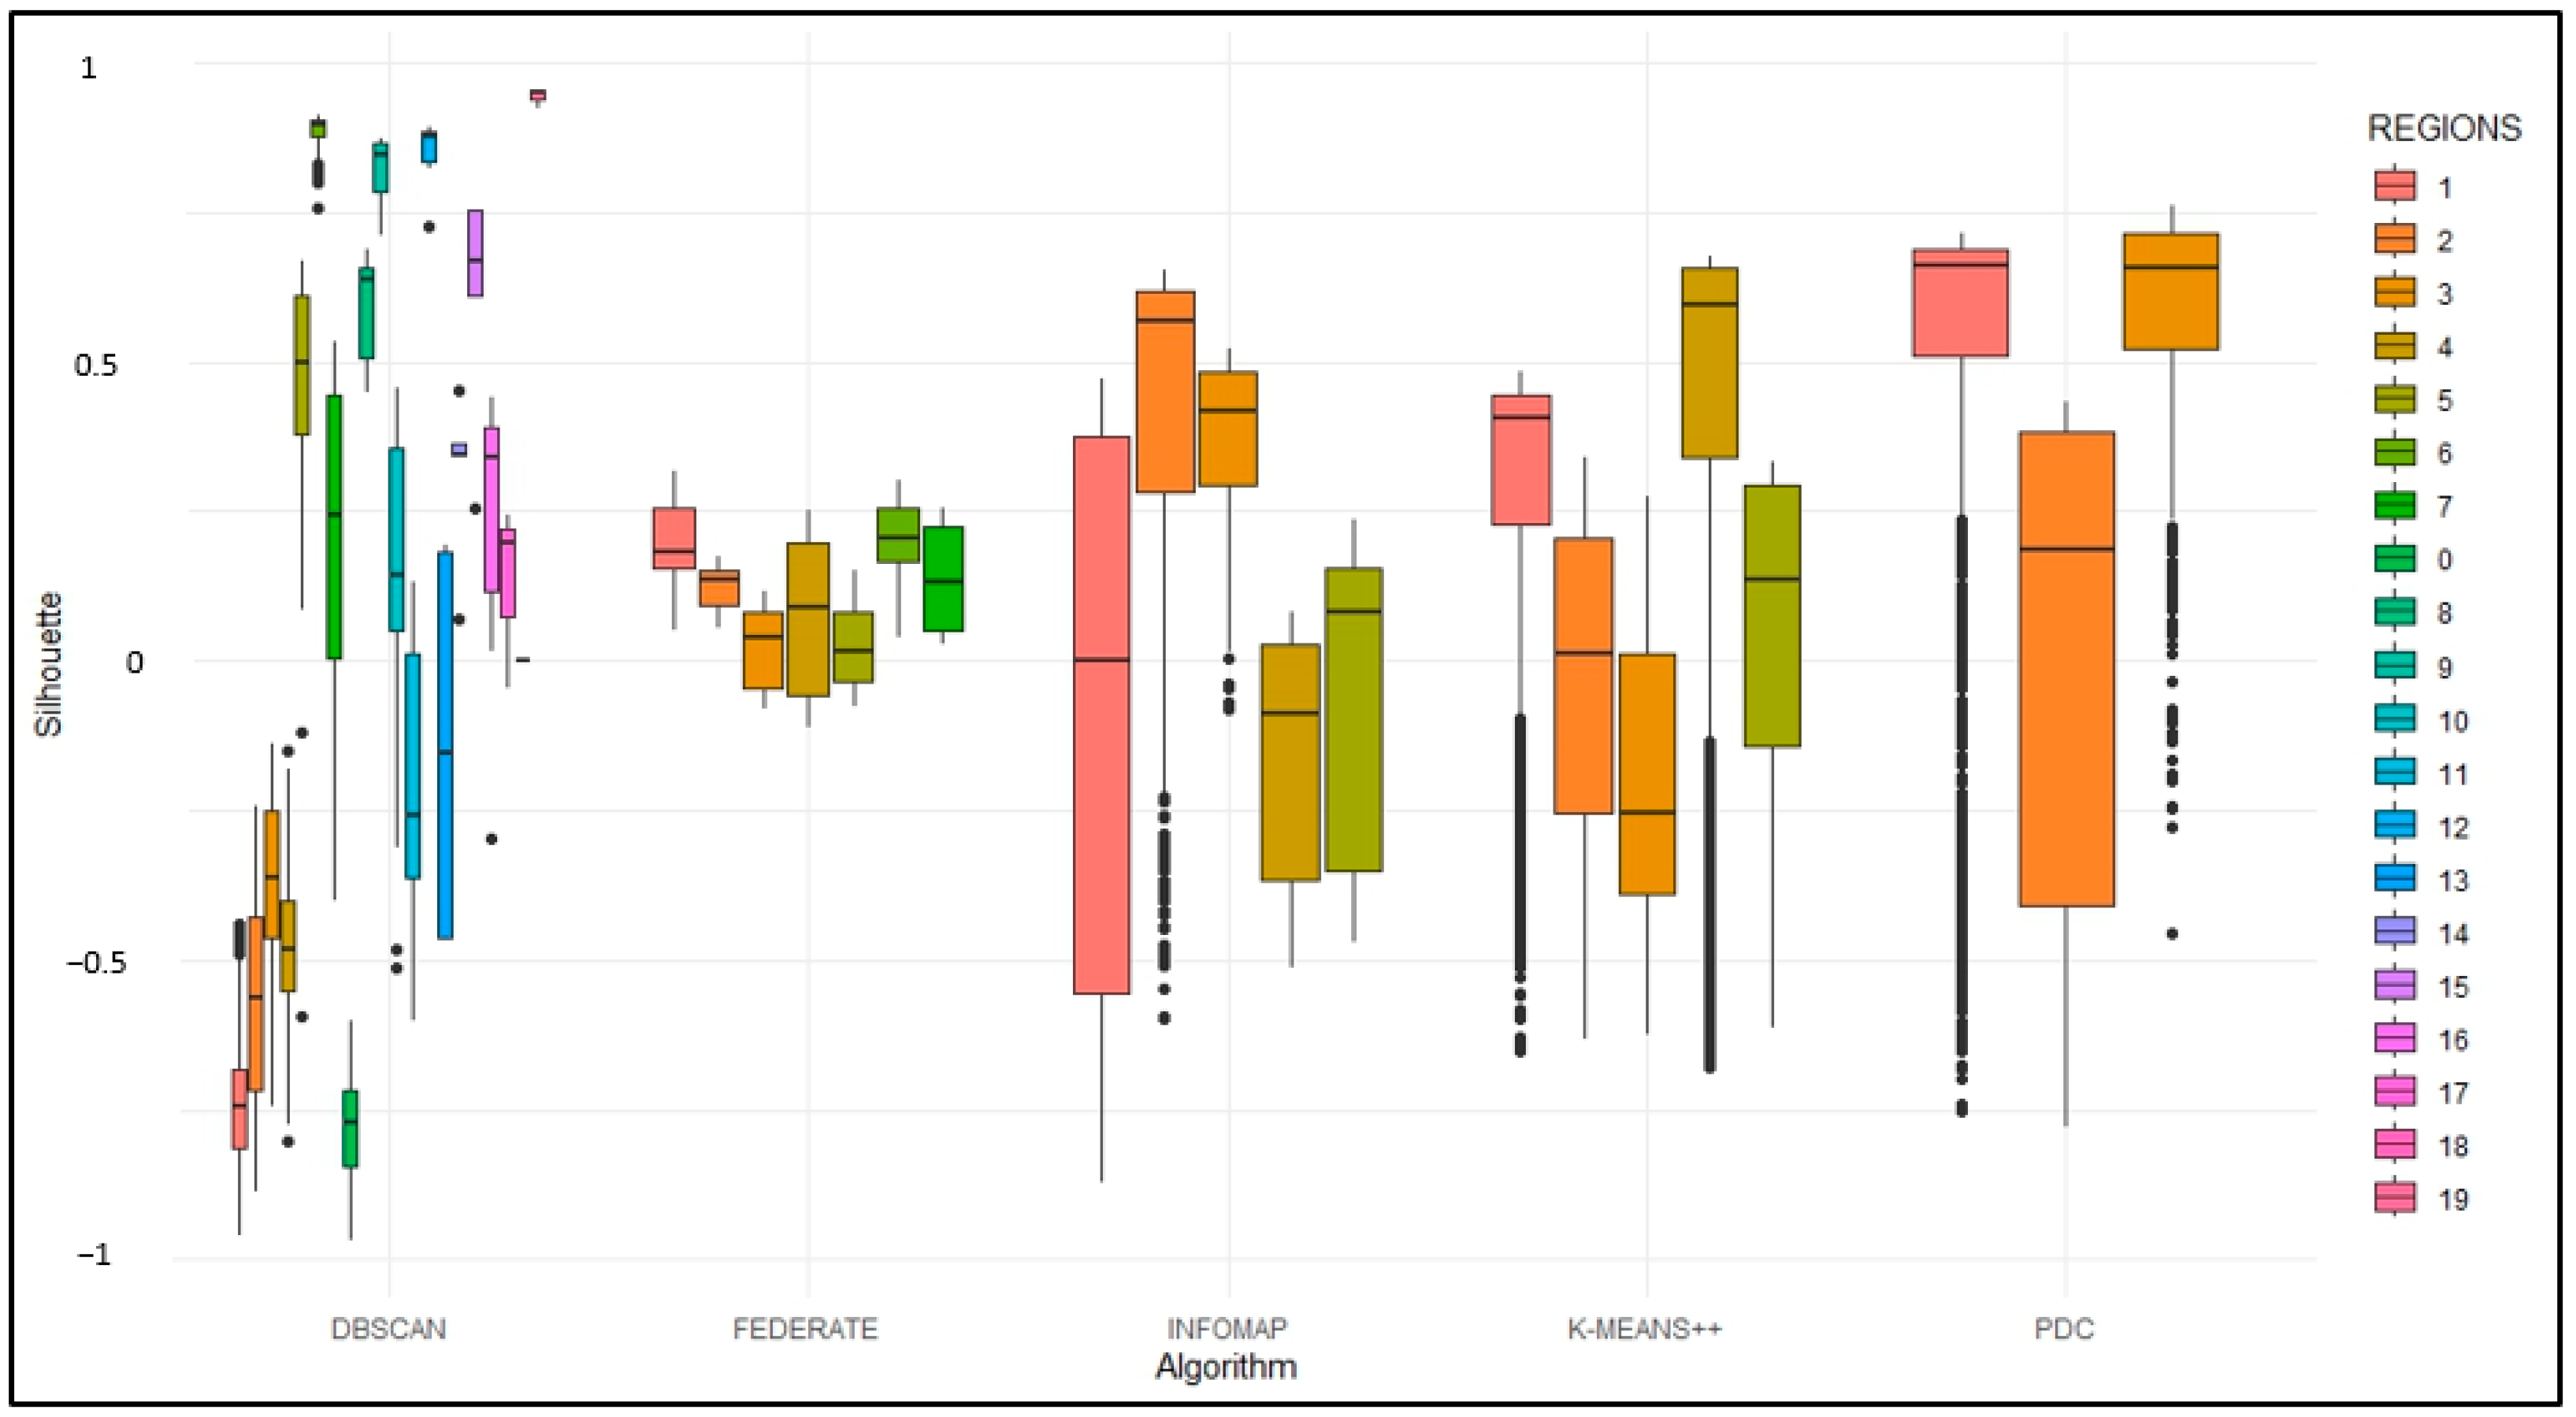

| Code | Type | Description |
|---|---|---|
| BIO1 | Climatic | Annual Mean Temperature |
| BIO2 | Climatic | Mean Diurnal Range (Mean of monthly (max temp–min temp)) |
| BIO3 | Climatic | Isothermality (BIO2/BIO7) (×100) |
| BIO4 | Climatic | Temperature Seasonality (standard deviation × 100) |
| BIO5 | Climatic | Max Temperature of Warmest Month |
| BIO6 | Climatic | Min Temperature of Coldest Month |
| BIO7 | Climatic | Temperature Annual Range (BIO5-BIO6) |
| BIO8 | Climatic | Mean Temperature of Wettest Quarter |
| BIO9 | Climatic | Mean Temperature of Driest Quarter |
| BIO10 | Climatic | Mean Temperature of Warmest Quarter |
| BIO11 | Climatic | Mean Temperature of Coldest Quarter |
| BIO12 | Climatic | Annual Precipitation |
| BIO13 | Climatic | Precipitation of Wettest Month |
| BIO14 | Climatic | Precipitation of Driest Month |
| BIO15 | Climatic | Precipitation Seasonality (Coefficient of Variation) |
| BIO16 | Climatic | Precipitation of Wettest Quarter |
| BIO17 | Climatic | Precipitation of Driest Quarter |
| BIO18 | Climatic | Precipitation of Warmest Quarter |
| BIO19 | Climatic | Precipitation of Coldest Quarter |
| Lat | Spatial | Geographic coordinates (Latitude) |
| Lon | Spatial | Geographic coordinates (Longitude |
| Evapo | Climatic | Potential evapotranspiration |
| Ph | Edaphic | PH of soil |
| Percentage of Closest Nodes | SC | TSA | PCO |
|---|---|---|---|
| 10 | 14 | 11 | 13 |
| 15 | 7 | 6 | 7 |
| 20 | 6 | 5 | 6 |
| 25 | 6 | 4 | 5 |
| 30 | 5 | 3 | 4 |
| Algorithm | K-Means++ (SC) | PDC (SC) * | K-Means++ (TSA) | K-Means++ (PCO) | PDC (TSA) * | PDC (PCO) | INFOMAP (SC)* | INFOMAP (TSA) * | INFOMAP (PCO) * | FEDERATE MODEL | REG. OLSON | |
|---|---|---|---|---|---|---|---|---|---|---|---|---|
| Algorithm | K | 5/22 | 3 | 5/22 | 5/22 | 3 | 5/22 | 3 | 5 | 3 | 7 | 5/22 |
| K-means++ (SC) | 5/22 | 1/1 | 0.3218 | 0.1929/0.1193 | 0.0703/−0.032 | 0.3205 | 0.3042/0.0118 | 0.1101 | −0.1846 | −0.1370 | 0.0154 | 0.1055/0.0573 |
| PDC (SC) * | 3 | 0.3218 | 1 | 0.4159 | −0.0356 | 0.2478 | 0.2518 | 0.0133 | 0.0479 | −0.1817 | 0.0582 | 0.2416 |
| K-means++ (TSA) | 5/22 | 0.1929/0.1193 | 0.4159 | 1 | −0.2196/−0.0107 | 0.3205 | −0.0053/0.0216 | 0.0205 | 0.3135 | −0.2605 | 0.356 | 0.2076/0.048 |
| K-means++ (PCO) | 5/22 | 0.0703/ −0.032 | −0.0356 | −0.2196/ −0.0107 | 1 | −0.1647 | −0.1537/−0.0148 | 0.0058 | 0.2823 | 0.0561 | 0.0274 | 0.0483/−0.0234 |
| PDC (TSA) * | 3 | 0.0243 | 0.2478 | 0.3205 | −0.1647 | 1 | −0.0796 | 0.1349 | −0.4020 | −0.1907 | 0.1201 | 0.2427 |
| PDC (PCO) | 5/22 | 0.3042/0.0118 | 0.2518 | −0.0053/0.0216 | −0.1537/−0.0148 | −0.0796 | 1 | 0.0352 | −0.068 | −0.0354 | −0.0495 | −0.153/0.063 |
| INFOMAP (SC) * | 3 | 0.1101 | 0.0133 | 0.0205 | 0.0058 | 0.1349 | 0.0352 | 1 | −0.0087 | −0.1097 | −0.0012 | 0.0364 |
| INFOMAP (TSA) * | 5 | −0.1846 | 0.0479 | 0.3135 | 0.2823 | −0.4020 | −0.068 | −0.0087 | 1 | 0.1749 | −0.086 | 0.1311 |
| INFOMAP (PCO) * | 3 | −0.1370 | −0.1817 | −0.2605 | 0.0561 | −0.1907 | −0.0354 | −0.1097 | 0.1749 | 1 | 0.0256 | −0.1286 |
| FEDERATE MODEL | 7 | 0.0154 | 0.0582 | 0.356 | 0.0274 | 0.1201 | −0.0495 | −0.0012 | −0.086 | 0.0256 | 1 | 0.069/0.003 |
| DBSCAN (SC) | 5/22 | 0.2049/−0.003 | 0.1613 | 0.1697/−0.002 | −0.1375/−0.002 | 0.4795 | 0.0410/0.0411 | 0.3197 | −0.1594 | −0.1955 | 0.0257 | −0.0002/0.0024 |
| DBSCAN (TSA) | 5/22 | 0.2096/−0.003 | 0.1639 | 0.1795/−0.002 | −0.0139/−0.0023 | 0.4858 | 0.040/0.0388 | 0.3262 | −0.1555 | −0.1940 | 0.0225 | −0.0002/0.0030 |
| DBSCAN (PCO) | 5/22 | 0.099/0.0126 | 0.0459 | 0.084/0.0401 | −0.0493/−0.0165 | 0.0681 | 0.0131/0.0185 | 0.1137 | −0.0093 | −0.0942 | −0.048 | −0.007/0.0052 |
| Feature | Relative Importance |
|---|---|
| Bio1—Annual Mean Temperature | 51.71885 |
| Bio11—Mean Temperature of Coldest Quarter | 17.91296 |
| Bio15—Precipitation Seasonality (Coefficient of Variation) | 10.67240 |
| Bio14—Precipitation of Driest Month | 4.64482 |
| Bio12—Annual Precipitation | 2.75624 |
| Bio18—Precipitation of Warmest Quarter | 2.72849 |
| Bio4—Temperature Seasonality (standard deviation ×100) | 1.97000 |
| Evapo—Potential evapotranspiration | 1.57400 |
| Bio19—Precipitation of Coldest Quarter | 1.56720 |
| Bio17—Precipitation of Driest Quarter | 1.26907 |
| Bio13—Precipitation of Wettest Month | 1.08024 |
| Bio3—Isothermality (BIO2/BIO7) (×100) | 0.73156 |
| Bio6—Min Temperature of Coldest Month | 0.35595 |
| Bio16—Precipitation of Wettest Quarter | 0.22083 |
| Ph—PH of soil | 0.17214 |
| Bio10—Mean Temperature of Warmest Quarter | 0.16941 |
| Bio2—Mean Diurnal Range (Mean of monthly (max temp—min temp)) | 0.11501 |
| Bio8—Mean Temperature of Wettest Quarter | 0.11230 |
| Bio9—Mean Temperature of Driest Quarter | 0.10589 |
| Bio7—Temperature Annual Range (BIO5-BIO6) | 0.08240 |
| Bio15—Precipitation Seasonality (Coefficient of Variation) | 0.04013 |
Disclaimer/Publisher’s Note: The statements, opinions and data contained in all publications are solely those of the individual author(s) and contributor(s) and not of MDPI and/or the editor(s). MDPI and/or the editor(s) disclaim responsibility for any injury to people or property resulting from any ideas, methods, instructions or products referred to in the content. |
© 2024 by the authors. Licensee MDPI, Basel, Switzerland. This article is an open access article distributed under the terms and conditions of the Creative Commons Attribution (CC BY) license (https://creativecommons.org/licenses/by/4.0/).
Share and Cite
Aguilar Colmenero, J.L.; Portela Garcia-Miguel, J. A Regionalization Approach Based on the Comparison of Different Clustering Techniques. Appl. Sci. 2024, 14, 10563. https://doi.org/10.3390/app142210563
Aguilar Colmenero JL, Portela Garcia-Miguel J. A Regionalization Approach Based on the Comparison of Different Clustering Techniques. Applied Sciences. 2024; 14(22):10563. https://doi.org/10.3390/app142210563
Chicago/Turabian StyleAguilar Colmenero, José Luis, and Javier Portela Garcia-Miguel. 2024. "A Regionalization Approach Based on the Comparison of Different Clustering Techniques" Applied Sciences 14, no. 22: 10563. https://doi.org/10.3390/app142210563
APA StyleAguilar Colmenero, J. L., & Portela Garcia-Miguel, J. (2024). A Regionalization Approach Based on the Comparison of Different Clustering Techniques. Applied Sciences, 14(22), 10563. https://doi.org/10.3390/app142210563


