Abstract
Identifying changes in driver’s vigilance under combined manual and automated driving conditions, as well as during prolonged driving, is crucial for reducing car crashes. Existing studies have not adequately considered the similarities and differences in physiological signals between different driving modes or the cumulative effects during extended driving periods. To address this gap, our study focuses on enhancing the feature selection method for driver’s vigilance recognition. A long-duration simulated car-following driving experiment was designed and conducted to simultaneously collect EEG, eye movement, EOG, and driving data. Similarities and differences in the physiological signals of vigilance between manual and automated driving are analyzed in terms of correlation and significance. The cumulative effects of physiological signals are investigated using time series analysis. The proposed feature selection method was validated using an LSTM-based driver’s vigilance recognition model. Results showed a recognition accuracy of 86.32% for manual driving, with a fluctuation rate of 1.18% over prolonged periods. For automated driving, the accuracy was 87.12%, with a fluctuation rate of 0.66%. By considering the similarities and differences in physiological signals between manual and automated driving modes and the cumulative effects, our study enhances the applicability and stability of the driver’s vigilance recognition model across different driving conditions. The validation results demonstrate that the proposed method improves the applicability and stability of the driver’s vigilance recognition model across different driving modes during extended driving periods.
1. Introduction
One of the primary causes of traffic accidents involving automated vehicles is reduced or lost driver’s vigilance [1,2]. When a vehicle operates in automatic mode, the driver must monitor it for extended periods. This task is usually low-demand, especially when the system runs smoothly with minimal driver intervention. Such monotony often leads to decreased vigilance. Reduced vigilance can lead to diminished responses to unexpected issues, characterized by decreased attention, slower information processing, prolonged reaction times, and impaired operational skills [3]. Therefore, identifying driver’s vigilance in automated vehicles is crucial to reducing traffic accidents.
Vigilance is a key application of signal detection theory [4]. Driver’s vigilance refers to the driver’s performance in monitoring the driving task, including their ability to detect and respond to potentially dangerous signals [5]. Many studies have examined changes in driver’s vigilance when the allocation or use of cognitive resources are disturbed [6,7,8]. According to the multi-resource theory, workload is a crucial indicator of how well task demands align with individual cognitive resources [9,10].
Workload is defined as the psychological and physical effort required to accomplish a task [9]. This effort is influenced by task duration [11], task demands [12], and participation frequency [13]. Lengthy, demanding, or infrequently performed tasks can lead to a decline in vigilance. Drivers in automated vehicles typically perform monitoring tasks that are long in duration, low in demands, and require infrequent engagement.
The measurement of driver’s vigilance can be divided into two categories: scale measurement and behavioral measurement. Common scales include the NASA Task Load Index Scale [14] and the Karolinska Sleepiness Scale [15]. A common behavioral measure is the Detection–Response Task (DRT) [16]. Studies have assessed vigilance using driver reaction times [17] or error rates [18] in the DRT.
The recognition of driver vigilance in autonomous vehicles primarily depends on the analysis of facial gestures and electrophysiological signals, captured from participants in both real-world [19,20,21,22,23] and virtual reality (VR) environments [24,25]. Facial posture-based recognition focuses on physical responses like eye states [19], facial expressions [20], and head movements [21]. For physiological signals, electroencephalograms (EEGs) and electrocardiograms (ECGs) are commonly used. Hu et al. [22] explored the relationship between vigilance and EEG signals, finding significant variations in the power ratios of different EEG bands across vigilance states. Hyper et al. [23] detected driver’s vigilance by combining heart rate with eye-width ratio.
Current driver’s vigilance recognition techniques primarily rely on machine learning architectures [26,27]. Guo et al. [17] developed a manual driving vigilance recognition model based on least-squares support vector machine and particle swarm optimization using fused EEG and driving contexts. Yang et al. [28] proposed a two-layer learning method using EEG data for automated driving modes. However, most existing studies focus on a single driving mode and do not consider scenarios where manual and automated driving coexist within the same vehicle. Müller and Gogoll [29] and Ratoff [30] argue from the perspectives of road safety and personal preference, respectively, that manual and automated driving modes will coexist in the same vehicle before fully automated driving is realized. However, significant changes in drivers’ physiological signals have been identified between automated and manual driving. Merat et al. [31] observed that drivers’ blink frequency and blink duration were higher during automated driving than manual driving. Strauch et al. [32] found that the percentage of drivers’ safety-relevant AOI gaze was higher during low-speed driving in manual driving and higher in high-speed driving in automated driving. Furthermore, this percentage was higher for automated driving at high speeds. Moreover, in scenarios where manual and automated driving modes coexist within the same vehicle, the commonalities and differences in the multimodal physiological signals that characterize driver vigilance remain inadequately explored.
Meanwhile, the baseline of physiological signals may change with the increase in working time, despite the driver remaining in a safe working condition. Yang et al. [33] studied six senior divers during a three-hour diving task, recording EEG and ECG at pre-task, 1.5 h, 2 h, and task completion. They observed significant changes in heart rate, ECG power spectral density ratios, and Theta and Alpha bands at the EEG Cz electrode site as task duration increased. Gescheider et al. [34] measured detection time and thresholds in a tactile vibratory stimulation task with 10 subjects, finding that increased stimulus duration led to decreased detection thresholds. Despite these findings, the cumulative effects of physiological data over extended periods, and the stability of their ability to consistently characterize alertness, remain inadequately understood.
The process of feature selection in existing driver vigilance recognition models has largely neglected key aspects such as the recognition of driver vigilance in scenarios where manual and automated driving modes coexist, as well as the cumulative effects of physiological signals on vigilance. As a result, this omission during the feature selection process has contributed to reduced accuracy in driver vigilance recognition models when both driving modes are present simultaneously. Therefore, it is crucial to clarify the commonalities and differences in the characterization of multimodal physiological signals between automated and manual driving, analyze the cumulative effects of these signals, and study their stability in characterizing driver’s vigilance over time. This will improve existing recognition methods and enhance the accuracy and stability of driver’s vigilance recognition.
In conclusion, the objective of this study is to examine the similarities and differences in the characterization of multimodal physiological signals on driver’s vigilance between automated and manual driving modes, as well as their cumulative effects and stability over time. This study considers the effects of driving mode and driving time on driver’s vigilance recognition in depth to enhance the accuracy and robustness of the recognition model.
2. Methods
2.1. Subjects
Thirty participants (22 male, 8 female; age: M = 23.2; range: 21–30) were voluntarily recruited for the study. All subjects had valid driver’s licenses, with a mean driving experience of 5 years (SD = 3.3). Participants declared no history of psychiatric conditions or substance dependence and reported normal or corrected-to-normal vision. They had at least 7 h of sleep the night before the experiment and avoided caffeine and alcohol consumption within 4 h and 24 h, respectively, before their test sessions. All experiments began in the afternoon (2–6 pm) and lasted for 1.5 h. To minimize the potential impact of hand dominance on the results, only right-handed participants were included, as they constitute most of the general population.
2.2. Experimental Equipment
The driving simulator comprises a Logitech G923 Racing Wheel, complete with a steering wheel, gear-shifting box, pedal board, and three 27-inch LED screens (Figure 1a) that provide a realistic representation of the driving environment (Figure 1b). The simulation program was developed using Unity3D.
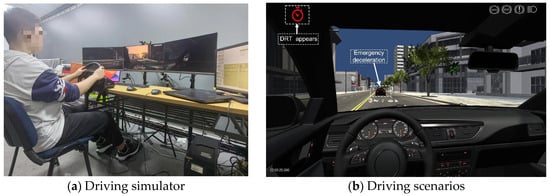
Figure 1.
Driving simulator and driving scenarios.
Physiological acquisition instruments include EEG, eye movement, and ECG devices. The EEG instrument used was Emotive’s FLEX-32-channel wireless gel EEG acquisition system with a sampling frequency of 128 Hz. The EEG electrodes were arranged according to the international standard 10–20 system. The eye movement instrument was the Smart Eye Pro 7.1 non-invasive eye movement system with a sampling frequency of 60 Hz. The ECG data were collected using PsychTech’s physiological acquisition bracelet, with a sampling frequency of 100 Hz.
2.3. Experimental Design and Procedure
A 60 km two-way four-lane urban road was designed as a driving scenario to simulate typical real-world conditions. Each lane is 3.5 m wide. The road is surrounded by urban landscape. The vehicle was left-hand drive. Under manual driving, the vehicle was entirely under the driver’s control. Under automated driving, the vehicle was equipped with an L2-level ACC system that adjusted speed and direction to maintain a minimum distance from the preceding vehicle, with a maximum cruising speed of 60 km per hour. The driver was required to respond to emergency braking. The emergency braking task was selected for its high vigilance demand, unpredictability, and relevance to driving safety, providing an effective means to assess changes in driver vigilance across different driving modes [35].
The experiment required subjects to follow a leading vehicle in the right lane of traffic. When the leading vehicle suddenly braked, subjects were instructed to brake as quickly as possible to avoid rear-end collisions while also making a keystroke response. After successful braking, the leading car resumed driving and the vehicle’s ACC system followed suit. In case of a collision, the vehicle reappeared behind the stopped leading car before resuming driving shortly. A total of 10 braking events occurred in the experiment. The random intervals between braking events were randomized by the simulator program, averaging 240.2 s (SD = 9.5 s) throughout the driving session [36].
To induce additional workload during driving [37], the experiment designated 9 subtasks derived from three resources: information input, working memory, and information output. The selection of these nine secondary tasks was based on the U.S. Department of Transportation National Highway Traffic Safety Administration’s classification of in-vehicle workload tasks and balanced cognitive load intensity. The contents of these subtasks are illustrated in Figure 2. To avoid the influence of learning effects on experimental results, the experiments were designed in a randomized manner.
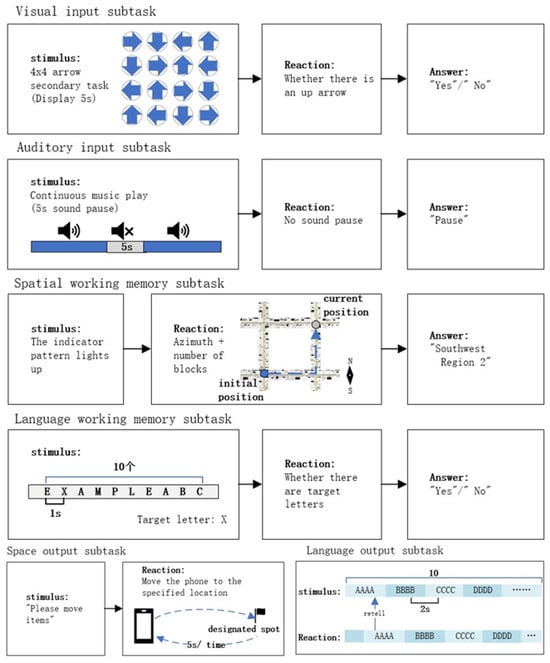
Figure 2.
Submission content.
Participants completed a brief practice drive before the actual experiment to familiarize themselves with the driving simulator. Then, they assisted the researcher in putting on the physiological measurement instruments and performed a 30 s pre-recording of physiological signals to establish a baseline.
2.4. Experimental Data Analysis
Feature selection focused on multimodal physiological signals of drivers. Physiological indicators with stable discriminatory ability, regardless of manual/automated driving modes and driving time, were selected as inputs for the driver’s vigilance recognition model.
2.4.1. Data Acquisition and Preprocessing
The experiment involved measuring three types of data: subjective evaluation data, physiological signal data, and performance data. The NASA-TLX scale was used to assess the workload of subjects under various experimental tasks.
The average value of bilateral mastoid electrode points was used as a pre-reference value. The EEG signals are high-pass filtered at 0.1 Hz and low-pass filtered at 40 Hz. A eyes-close pre-recording stage from 5 s before the start of the experiment was used as the baseline. The Independent Component Analysis (ICA) algorithm was used to differentiate the EEG signal into independent components and remove impurity components such as blinks, eye movements, head movements, electrocardiography (ECG) data, and work frequency interference from the EEG signal.
The Theta band (4–8 Hz) was chosen for its established role in working memory and attention [38]. The Alpha band (8–13 Hz), associated with relaxation, was analyzed to observe decreases in power during cognitive engagement [38]. The Low Beta band (13–17 Hz) was selected for its relevance to alertness, vigilance, and cognitive processing [38]. Fourteen electrode sites in the parietal and occipital electrodes (Figure 3) have been demonstrated to correlate with vigilance. Using fast Fourier transform (FFT), the power of Theta, Alpha, Low Beta, and the Theta/Alpha ratio were calculated for these 14 electrode points, yielding 56 EEG indicators.
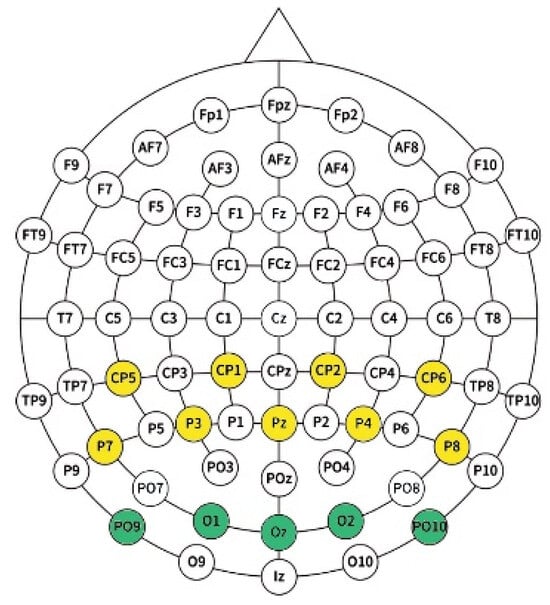
Figure 3.
Position of 14 electrode channels. The yellow dots represent 9-channel EEG signals of the parietal site, and the green dots represent 5-channel EEG signals of the occipital site.
For the ECG data, a bandpass filter (0.03–20 Hz) was applied to remove baseline wander and high-frequency noise, preserving essential low-frequency components and heart rate variability data. After filtering, R-peak detection and power calculations were performed to extract 8 features for analysis. Combined with 4 eye movement metrics, a total of 68 physiological metrics were obtained, as summarized in Table 1.

Table 1.
Physiological indicators summary.
The performance data included emergency deceleration event response time, self-vehicle speed when DRT appeared, DRT response time, and following distance, recorded at 20 Hz. The DRT was used to measure the subject’s vigilance state during the experiment. When DRT appeared, a red clock pattern was displayed in the upper left quadrant of the driver’s field of view for two seconds. The interval between appearances was randomly distributed, ranging from 46 to 50 s. The driver needed to press a button on the steering wheel’s right side to react.
2.4.2. Vigilance Classification
The differing attributes of vehicle control in manual and automated driving lead to different risk thresholds for road safety, necessitating distinct risk level thresholds for each mode. The driver’s minimum decision-making reaction time forms the basis for establishing these road risk thresholds. Under manual driving, it is defined as the shortest reaction time sufficient to avoid a collision under the prevailing following distance. Under automated driving, it is defined as the reaction time required when the vehicle is traveling at the Minimum Safe Distance Violation [39].
The principle of driver’s vigilance division is as follows: when the driver’s reaction time is less than the minimum decision-making reaction time, it indicates high vigilance, meaning the driver can handle the emergency deceleration of the front vehicle at the current distance. Conversely, if the driver’s reaction time is greater than the minimum decision-making reaction time or is zero, it indicates low vigilance.
The reaction time measured by DRT in each time period is compared to the minimum driver decision reaction time for that period. If the DRT reaction time is less than the minimum decision reaction time, the driver is marked as being in a high-vigilance state. If the DRT reaction time is greater than the minimum decision reaction time or is zero, the driver is marked as being in a low-vigilance state.
2.4.3. Statistical Analysis
Spearman’s rank correlation analysis was used to analyze correlations between experimental data. ANOVA compared the means of multiple independent groups, followed by post hoc analysis using the least significant difference (LSD) method. Data normality was tested, and non-normal data were log-transformed to achieve normal distribution. Autocorrelation analysis plots were used for preliminary diagnosis of multimodal physiological data, and white noise tests statistically examined autocorrelated data. A general linear model (GLM) was used to explore whether driving time influenced the effects of driver’s vigilance on physiological indicators.
2.5. Algorithm Design
LSTM is suitable for processing time-series data and can accurately predict changes in driver’s vigilance by modeling long-term dependencies. Attention-based Fusion assigns and dynamically adjusts weights to features for adaptive feature weighting according to the inputs.
The driver recognition model (A-LSTM in a later section) uses LSTM to process EEG, eye movement, and ECG indicators through two LSTM layers to extract time-related features. The first LSTM layer (LSTM1) captures temporal dependencies from the input data, followed by a dropout layer and Batch Normalization (BN) layer to prevent overfitting and ensure dimensional stability. The processed features are then passed through a second LSTM layer (LSTM2) to further refine temporal relationships.
After the LSTM layers, an attention mechanism is applied to assign importance weights to the features from each physiological modality, allowing the model to prioritize the most relevant patterns for detecting changes in driver vigilance. These weighted features are subsequently fed through another BN layer to ensure dimensional appropriateness before entering the fully connected layers.
Finally, the model accomplishes the recognition task by making decisions based on the combined features of all input signals through two fully connected layers.
To address data imbalance, the model employs a cross-entropy loss function with category weights. It uses the Adam optimizer with an initial learning rate of 0.001 and includes a learning rate scheduler that reduces the learning rate by 0.1 if the loss does not significantly decrease within 5 epochs. The model undergoes a total of 50 training sessions, each consisting of 50 epochs.
2.6. Recognition Result Measurement
A confusion matrix is a specialized table design for presenting the performance of machine learning models [40]. Based on the confusion matrix, four metrics are used to evaluate the model’s performance: Accuracy (Acc), Precision (Pre), Recall (Rec), and F1 score (F1) [41,42].
Cross-validation is a statistical method for evaluating classifier performance. K-fold cross-validation was chosen to assess model performance [28]. The coefficient of variation, which is the ratio of the standard deviation to the mean, was used to measure model stability [43]. This metric compares the degree of data dispersion and reflects the fluctuation in performance indicators relative to their mean.
3. Results
3.1. Characterization Results
Characterization refers to an indicator’s ability to adequately describe or reflect the essential attributes and states of an object. It illustrates the correlation and significance of an indicator in describing, assessing, or predicting something.
The significant results of the characterization analysis of the EEG indicator are shown in Table 2. Under manual driving, multiple channels demonstrated statistical significance (p < 0.05) in the Theta band and Theta/Alpha ratio. This result suggests an increased cognitive load and information processing activity in the brain during driving tasks that require high levels of vigilance. Under automated driving, except for the P3 and P7 channels of the Alpha band, which demonstrated significance, all other frequency bands and channels were not significant (p > 0.05). This indicates that in the high vigilance state, the activity in brain regions typically associated with relaxation and attention dissociation is reduced.
Table 2.
The significant results of the EEG indicator.
The significant results of the characterization analysis of the eye movement indicator are shown in Table 3. Under manual driving, the head heading deviated significantly to the left in the high-vigilance state compared to the low-vigilance state. Specifically, the median head heading was close to 0 degrees (looking straight ahead) in the low-vigilance state, while it showed a slight leftward deviation in the high-vigilance state. Under automated driving, the pupil diameter was significantly increased in the high-vigilance state compared to the low-vigilance state, indicating a higher cognitive load during high vigilance.
Table 3.
The significant results of the eye movement indicator.
The significant results of the characterization analysis of the ECG indicators are shown in Table 4. The results indicate that SDNN, RMSSD, and N50 significantly decrease with increasing driver’s vigilance in both manual and automated driving. This decrease usually reflects reduced parasympathetic activity or increased sympathetic activity, implying that the driver’s heart is more directly responsive to external stimuli.
Table 4.
The significant results of the ECG indicator.
Based on the comprehensive analysis of the results, In the manual driving mode, EEG indicators related to driver vigilance were primarily concentrated in the parietal and occipital regions. As driver vigilance increased, significant activation was observed in brain regions associated with spatial perception, motor coordination, and visual information processing. In contrast, during automated driving mode, vigilance-related EEG indicators were concentrated in the Alpha band power in the parietal region. Increased driver vigilance in this mode was reflected by significant activation in regions associated with spatial perception. A comparison of EEG signal characteristics between the two driving modes reveals that brain regions related to spatial perception exhibit significant representation of driver vigilance across both modes. However, brain regions associated with motor coordination and visual information processing did not show significant representation of driver vigilance in the automated driving mode.
Analysis of eye movement indicators showed that in manual driving, driver vigilance was more strongly related to head movement indicators, while in automated driving, changes in pupil diameter were more closely related to vigilance. The analysis of ECG indicators revealed that parasympathetic nervous system activity decreased as driver vigilance increased in both driving modes.
Most ECG indicators that represented driver vigilance showed consistency across both driving modes. SDNN, RMSSD, and N50 consistently represent driver vigilance across both manual and automated driving modes.
3.2. Cumulative Effect Results
The cumulative effect refers to the phenomenon where multimodal physiological signals exhibit a discernible upward or downward trend during driving, either generally or locally. Autocorrelation analysis plots were constructed with a time interval (K) of 48 s. Confidence intervals were delineated with line segments, and only cases where K was greater than 3 were considered [44]. Autocorrelation analysis diagrams were subjected to a test for results with white noise, as detailed in Appendix A.
The analysis of EEG indicators showed that there was no cumulative effect of the indicators characterizing driver’s vigilance in both driving modes. Under manual driving, the head heading exhibited a cumulative effect, trending towards zero as driving time increased. Conversely, the eye movement indicators in automated driving mode did not show a cumulative effect. The analysis of ECG indicators revealed that N50 exhibited a cumulative effect in manual driving mode, decreasing as driving time increased. Under automated driving, the ECG indicators did not exhibit a cumulative effect.
The cumulative effect changes in head heading and N50 are shown in Figure 4. After completing the 40 min following task in manual driving mode, the head heading changed by 25.89% and N50 decreased by 70.13%. Notably, the head heading increased significantly by 29.99% between 8 and 16 min and then stabilized within 10% after 16 min. N50 showed a significant decrease of 36.18% after 12 min, stabilized within 10% between 12 and 36 min, and decreased again by 47.22% after the 36 min mark.
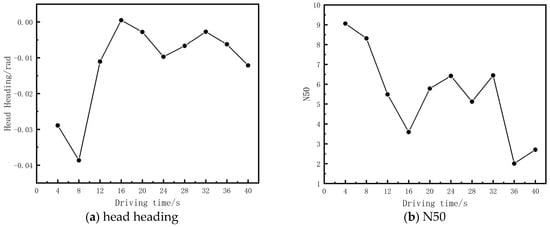
Figure 4.
Cumulative effects of head heading and N50.
A general linear model was constructed with physiological indicators as dependent variables, driver’s vigilance as a fixed factor, and driving time as a covariate. The interaction effect between driving time and driver’s vigilance for head heading in manual driving mode was significant (F = 5.631, p = 0.023 < 0.05). The interaction effect for N50 was not significant. The results demonstrate that the effect of driver’s vigilance on head heading depends on the duration of the driving time. Head heading is unreliable for accurately characterizing the driver’s vigilance state over an extended driving time.
Physiological indicators which lacked sufficient stability were removed from the study of the cumulative effect and stability. A stable set of multimodal physiological features was obtained that effectively characterizes driver’s vigilance in both driving modes and during prolonged driving. This set is used as the input for driver’s vigilance recognition, as shown in Table 5.
Table 5.
Physiological features for driver vigilance recognition across driving modes and durations.
3.3. Model Recognition Results
The recognition accuracy of the A-LSTM model for driver’s vigilance is 82.48% in manual drive and 87.13% in automated drive. The comparison between the model results and the DRT response results is shown in Figure 5. Green markers indicate that the model correctly identified the low-vigilance state, purple markers indicate false alarms for high-vigilance state, and red markers indicate missed alarms for low-vigilance state.
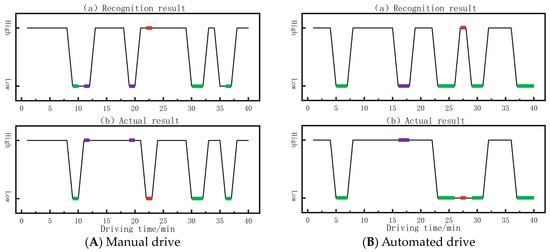
Figure 5.
The comparison between the model results and the DRT response results.
The errors in the driver’s vigilance recognition model are mainly false alarms, where high vigilance is recognized as low vigilance, occurring at 10–12 min, 19–20 min, and 35 min. At 22–23 min, the model has an omission error, recognizing low vigilance as high vigilance. In automated driving mode, the driver’s vigilance recognition model exhibits a false alarm at 16–18 min and an omission error at 27–28 min. The remaining moments of the driver’s vigilance recognition model results are in accordance with the DRT response metrics results.
The results illustrate that the model has a good ability to recognize driver’s vigilance, and that A-LSTM can learn the relevant features of driver’s vigilance from the data better than other classification models.
3.4. Model Performance Validation
The model performance was evaluated using 5-fold cross-validation, as shown in the Table 6. The results show no extreme high or low values in the model’s performance metrics across the five iterations, indicating that the model adapts well to different data subsets and has good generalization ability. Additionally, the coefficients of variation (CVs) for the performance metrics are all less than 5%, indicating minimal fluctuation between different folds and suggesting that the model has good stability.
Table 6.
Five-fold cross-validation results.
3.5. Model Validity Validation
The metrics in Section 3.1 that characterize driver’s vigilance under manual and automated driving, respectively, are used as model inputs. The results are compared with the results when the indicators in Table 5 (ADMD) are used as model inputs, and the results of the comparisons are shown in Table 7. Indicators in manual driving mode (MD) have low recognition accuracy when driving in automated driving mode, and indicators in automated driving mode (AD) have low recognition accuracy when driving in manual driving mode. Indicators in Table 5 have high recognition in both driving modes. The recognition of the metrics in either manual driving mode or automated driving mode showed a decrease in recognition accuracy at the latter 20 min. The recognition of the metrics in Table 5 did not show a significant decrease before and after driving. The results indicate that the vigilance recognition method proposed in this paper can achieve effective recognition of driver’s vigilance in both driving modes and under long driving time.
Table 7.
Model validation results.
4. Discussion
In this study, we focus on improving the feature selection method for driver’s vigilance recognition. Compared to traditional methods, our approach integrates the commonalities and differences of physiological signals between manual and automated driving modes and introduces time series analysis to account for the cumulative effect of physiological signals under prolonged driving conditions, often overlooked in previous studies. With these new features, our model demonstrates higher accuracy and consistency across both driving modes, as verified in Section 3.3. This improvement not only enhances the predictive performance of the model but also increases its applicability across different driving modes, especially in prolonged driving where cumulative physiological effects can be effectively identified, as verified in Section 3.5. The method’s applicability to multiple driving modes and long-duration driving in practical applications is significant for guiding the development of safety monitoring systems in future automated driving technologies.
4.1. Discussion on Similarities and Differences in Manual and Automated Driving
Multiple EEG channels showed significant increases in the Theta band and Theta/Alpha ratio during high vigilance in manual driving mode. In contrast, only the P3 and P7 channels showed a significant decrease in the Alpha band during high vigilance in automated driving mode.
Enhancement of the Theta band is usually associated with high levels of cognitive activity and information processing, especially in tasks involving memory and attention focus [45]. In the driving task, the increase in Theta waves may reflect the fact that drivers invest more cognitive resources to maintain vigilance [46]. This change supports a role for Theta waves in maintaining task-related attention and executive control.
The significant decrease in Alpha wave power during high vigilance may be related to the continuous active state of the brain [47]. In driving situations that require high vigilance and fast reaction time, the reduction in Alpha waves may be an indication that the brain is reducing the allocation of internal resources to non-critical tasks [46]. This reduction helps drivers to be less distracted and more focused on the driving task.
Under manual driving, the head heading deviated significantly to the left in the high-vigilance state. In left-hand drive vehicles, drivers check the left side (e.g., the left mirror) more frequently, especially during high vigilance, and this behavior may be more pronounced.
The increase in the driver’s pupil diameter reflects the heightened psychological stress or cognitive load of a high vigilance state [48]. Even though the vehicle’s operation is controlled by an automated system, the driver needs to remain vigilant to monitor the system’s performance and be ready to take over control. This pupil dilation is a physiological response to potential threats or situations requiring high attention.
Decreases in ECG indicators usually reflect reduced parasympathetic activity and increased sympathetic activity [49]. In both manual and automated driving modes, the mean values of ECG indicators were significantly lower when the driver was in a high state of vigilance compared to a low state. This suggests an increase in sympathetic activity and a decrease in parasympathetic activity when a high level of vigilance is required.
Commonality Analysis: In both manual and automated driving modes, the P3 and P7 channels show a decrease in Alpha band power during high vigilance, suggesting that the brain reduces attention to non-critical stimuli to maintain vigilance. Additionally, high vigilance in both driving modes leads to a decrease in ECG indicators, indicating a general autonomic nervous system response to psychological stress and increased vigilance.
Analysis of Differences: In manual driving mode, significant increases in Theta waves and Theta/Alpha ratios indicate that drivers require more attention and information-processing capacity during driving tasks. This increase is not observed in automated driving mode, likely because automated driving reduces some operational burdens, lowering the need for high cognitive activity. Additionally, head stabilization in manual driving versus pupil dilation in automated driving reveals different mechanisms of vigilance regulation. Manual driving emphasizes physical stabilization and visual attention, while automated driving involves constant environmental monitoring.
Understanding these commonalities and differences is essential for designing effective driver’s vigilance recognition methods. Screening multimodal physiological indicators that are applicable across different driving modes can help reduce the impact of physiological signal variations on driver’s vigilance recognition.
4.2. Discussion on Cumulative Effects of Long-Duration Driving
Our analysis revealed significant cumulative effects in physiological signals over extended periods of driving, particularly evident in manual driving modes. For instance, under manual driving, the head heading gradually converged to 0 degrees, accompanied by a gradual decrease in the electrocardiographic index N50. In long driving tasks, the characterization of the driver’s head heading on vigilance were significantly affected by driving time, while N50 was not significantly affected by driving time.
The cumulative effect of head heading in manual driving may indicate a change in the driver’s allocation of attention over time [50]. During extended periods of driving, drivers need to continuously monitor the road and surroundings, requiring frequent head turns to view mirrors and blind spots. Over time, they may adjust their head-turning strategy to allocate attention more efficiently. These adjustments may be reflected in the cumulative effect of head heading.
The cumulative effect of head heading was present in manual driving mode, but not in automated driving mode. According to attention resource theory [51], this reflects the different effects of driving modes on driver behavior and attention demand. Manual driving requires the driver to make decisions and maneuvers, necessitating head turns for safety and accuracy. In contrast, automated driving systems take over most driving tasks, reducing the need for the driver to maneuver. Consequently, drivers in automated mode do not need to turn their heads as often for environmental monitoring or operational decisions.
The decrease in N50 in manual driving mode indicates an increased workload resulting from extended driving time [52]. This cumulative effect may be associated with decreased heart rate variability, suggesting a limited ability of the heart to cope with sustained load [53]. In contrast, the stabilized ECG metrics in automated driving reflect an automated system that reduces the operational burden on the driver, thereby decreasing the workload.
The cumulative effect of N50 appears in manual driving mode but not in automated mode. According to workload theory, this may be due to differences in driver workload between the modes. Manual driving requires continuous monitoring, decision-making, and operation, leading to a high cognitive and operational load that increases overall workload. In response, sympathetic nervous system activity increases while parasympathetic activity decreases [31]. Over time, this constant high-stress state may lead to a decrease in autonomic nervous system regulation, reflected by a significant decrease in N50. In automated mode, the system handles most driving tasks, significantly reducing the driver’s operational loads. Due to lower stress, the driver’s autonomic nervous system maintains a relatively stable state, resulting in no significant change in N50.
In a long-duration driving task, the characterization of vigilance by the driver’s head heading was significantly affected by driving time, and N50 was not significantly affected by driving time. The difference may be due to physiological versus behavioral differences: head heading is a direct indicator of driver behavior and attention allocation, whereas N50 reflects more the physiological state of the autonomic nervous system. The cumulative effect of prolonged driving on behavior is more pronounced because drivers need to constantly adjust their behavior to road and traffic conditions, whereas physiological metrics may show greater stability.
The absence of cumulative effects in drivers’ EEG metrics in manual or automated driving may reflect the brain’s adaptation and regulation mechanisms. To cope with driving demands, the brain maintains the balance and stability of EEG activities through dynamic allocation of cognitive resources, avoiding cumulative effects. However, this contrasts with the cumulative effects found in the Theta and Alpha bands at Cz electrode sites in the literature [33]. The difference may stem from the distinct nature of driving versus diving tasks. Diving involves high pressure, high risk, and complex physical and environmental coordination, presenting more extreme physiological and psychological challenges [54]. In contrast, both the driving task and the driving environment are slightly less physically and psychologically demanding for the driver. Thus, the type of task and environment likely impact the cumulative effects of EEG signals.
Understanding these cumulative effects is important for designing effective driver’s vigilance recognition methods. By screening multimodal physiological indicators that maintain stable characterization ability under prolonged driving, we can avoid misjudgment and omission in driver’s vigilance recognition due to the cumulative effect of physiological signals.
4.3. Limitations and Future Research Directions
We recognize that although the feature selection method showed advantages in this study, the robustness of the model in extreme environments or unconventional driving behaviors is yet to be further validated. Future research could explore how to further automate the feature selection and optimization process through machine learning techniques to enhance the model’s adaptability and generalizability to different driving states.
5. Conclusions
In this study, we investigated the commonalities and differences in the characterization of multimodal physiological signals on driver’s vigilance between automated and manual driving modes, as well as the cumulative effect and stability over time. A recognition and classification model of driver’s vigilance is designed to realize the recognition of driver’s vigilance under different driving modes and long driving time conditions. Under these experimental conditions, the following conclusions were obtained:
- RMSSD and N50 indicators were negatively correlated with driver’s vigilance between both driving modes and had significant discriminative ability. EEG and eye movement indicators differed in their characterization and discriminative ability for driver’s vigilance in different driving modes.
- In the manual driving mode, head heading and N50 showed cumulative effects, with the head heading gradually tending to 0 and N50 gradually decreasing as driving time increased. In the automated driving mode, none of the physiological indexes showed cumulative effects. In manual driving mode, the effect of driver’s vigilance on head heading is significantly influenced by driving time, making the characterization of vigilance unstable.
In this study, we focus on improving the feature selection method for driver’s vigilance recognition. Compared with traditional methods, our approach integrates the commonalities and differences of physiological signals between manual and automated driving modes and introduces a time series analysis that accounts for the cumulative effect of physiological signals under prolonged driving conditions, often neglected in previous studies. These new features lead to higher accuracy and consistency between driving modes. This improvement not only enhances the predictive performance of the model but also its applicability in different driving modes, especially for prolonged driving where cumulative physiological effects can be effectively identified. The method can be applied to multiple driving modes and long-duration driving in practical applications, which is significant for guiding the development of safety monitoring systems for future automated driving technologies.
Author Contributions
Conceptualization, M.G. and X.J.; methodology, M.G.; validation, M.G., Q.H., and Y.W.; formal analysis, M.G.; investigation, M.G. and J.Z.; resources, X.J. and J.M.; data curation, M.G.; writing—original draft preparation, M.G.; writing—review and editing, M.G.; visualization, M.G.; supervision, X.J.; project administration, M.G.; funding acquisition, X.J. All authors have read and agreed to the published version of the manuscript.
Funding
This research was funded by the Military Scientific Research Program Project (2020-JCJQ-JJ-046-01).
Institutional Review Board Statement
The study was conducted in accordance with the Declaration of Helsinki and approved by College of Engineering, China Agricultural University.
Informed Consent Statement
Informed consent was obtained from all subjects involved in the study.
Data Availability Statement
Data cannot be disclosed due to privacy or ethical restrictions.
Acknowledgments
Thanks to the Northern Vehicle Institute for the financial support.
Conflicts of Interest
The authors declare no conflicts of interest. The funders had no role in the design of the study; in the collection, analyses, or interpretation of data; in the writing of the manuscript; or in the decision to publish the results.
Appendix A. Autocorrelation Analysis

Figure A1.
Results of physiology indicators in manual driving mode.

Figure A2.
Results of physiology indicators in automated driving mode.
Table A1.
Results of physiology indicators with white noise in manual driving mode.
Table A1.
Results of physiology indicators with white noise in manual driving mode.
| Indicator | K | p |
|---|---|---|
| P7.T/A | 192 | 0.258 |
| P8.T/A | 192 | 0.203 |
| PO10.T/A | 192 | 0.202 |
| Head Heading | 192 | 0.000 |
| Head Heading | 240 | 0.000 |
| N50 | 576 | 0.034 |
References
- Wang, J.; Zhang, L.; Huang, Y.; Zhao, J.; Bella, F. Safety of autonomous vehicles. J. Adv. Transp. 2020, 2020, 8867757. [Google Scholar] [CrossRef]
- Dababneh, L.; El-Gindy, M. Driver vigilance level detection systems: A literature survey. Int. J. Veh. Perform. 2016, 2, 1–29. [Google Scholar] [CrossRef]
- Parasuraman, R. Vigilance, monitoring, and search. In Handbook of Perception and Human Performance, Cognitive Processes and Performance; Boff, K.R., Kaufman, L., Thomas, J.P., Eds.; John Wiley & Sons: Hoboken, NJ, USA, 1986; Volume 2, pp. 1–39. [Google Scholar]
- Wickens, C.D.; Hollands, J.G.; Banbury, S. Engineering Psychology and Human Performance, 4th ed.; Zhang, K.; Sun, X., Translators; China Machine Press: Beijing, China, 2014. [Google Scholar]
- Sorkin, R.D.; Woods, D.D. Systems with Human Monitors: A Signal Detection Analysis. Hum. –Comput. Interact. 1985, 1, 49–75. [Google Scholar] [CrossRef]
- May, J.F.; Baldwin, C.L. Driver fatigue: The importance of identifying causal factors of fatigue when considering detection and countermeasure technologies. Transp. Research. Part F Traffic Psychol. Behav. 2009, 12, 218–224. [Google Scholar] [CrossRef]
- Shaik, M.E. A systematic review on detection and prediction of driver drowsiness. Transp. Res. Interdiscip. Perspect. 2023, 21, 100864. [Google Scholar] [CrossRef]
- Körber, M.; Cingel, A.; Zimmermann, M.; Bengler, K. Vigilance decrement and passive fatigue caused by monotony in automated driving. Procedia Manuf. 2015, 3, 2403–2409. [Google Scholar] [CrossRef]
- Wickens, C.D. Multiple resources and mental workload. Hum. Factors 2008, 50, 449–455. [Google Scholar] [CrossRef]
- Wickens, C.D. Multiple resources and performance prediction. Theor. Issues Ergon. Sci. 2002, 3, 159–177. [Google Scholar] [CrossRef]
- Dember, W.N.; Warm, J.S.; Nelson, W.T.; Simons, K.G.; Hancock, P.A.; Gluckman, J.P. The rate of gain of perceived workload in sustained attention. Proc. Hum. Factors Ergon. Soc. Annu. Meet. 1993, 37, 1388–1392. [Google Scholar] [CrossRef]
- Abich, J., IV; Reinerman-Jones, L.; Matthews, G. Impact of three task demand factors on simulated unmanned system intelligence, surveillance, and reconnaissance operations. Ergonomics 2017, 60, 791–809. [Google Scholar] [CrossRef]
- MacPhee, M.; Dahinten, V.S.; Havaei, F. The impact of heavy perceived nurse workloads on patient and nurse outcomes. Adm. Sci. 2017, 7, 7. [Google Scholar] [CrossRef]
- Greenlee, E.T.; DeLucia, P.R.; Newton, D.C. Driver vigilance in automated vehicles: Hazard detection failures are a matter of time. Hum. Factors 2018, 60, 465–476. [Google Scholar] [CrossRef] [PubMed]
- Mårtensson, H.; Keelan, O.; Ahlström, C. Driver Sleepiness Classification Based on Physiological Data and Driving Performance from Real Road Driving. IEEE Trans. Intell. Transp. Syst. 2018, 20, 421–430. [Google Scholar] [CrossRef]
- Stojmenova, K.; Sodnik, J. Detection-Response Task—Uses and Limitations. Sensors 2018, 18, 594. [Google Scholar] [CrossRef]
- Guo, Z.; Pan, Y.; Zhao, G.; Cao, S.; Zhang, J. Detection of Driver Vigilance Level Using EEG Signals and Driving Contexts. IEEE Trans. Reliab. 2017, 67, 370–380. [Google Scholar] [CrossRef]
- Makeig, S.; Inlow, M. Lapse in alertness: Coherence of fluctuations in performance and EEG spectrum. Electroencephalogr. Clin. Neurophysiol. 1993, 86, 23–35. [Google Scholar] [CrossRef]
- Flores, M.; Armingol, J.; De La Escalera, A. Driver Drowsiness Warning system using visual information for both diurnal and nocturnal illumination conditions. EURASIP J. Adv. Signal Process. 2010, 2010, 438205. [Google Scholar] [CrossRef]
- Li, N.; Busso, C. Analysis of facial features of drivers under cognitive and visual distractions. In Proceedings of the 2013 IEEE International Conference on Multimedia and Expo (ICME), San Jose, CA, USA, 15–19 July 2013; pp. 1–6. [Google Scholar] [CrossRef]
- Murphy-Chutorian, E.; Trivedi, M.M. Head Pose Estimation and Augmented Reality Tracking: An Integrated System and Evaluation for Monitoring Driver Awareness. IEEE Trans. Intell. Transp. Syst. 2010, 11, 300–311. [Google Scholar] [CrossRef]
- Hu, J.; Liu, F.; Wang, P. EEG-Based Multiple Entropy Analysis for Assessing Driver Fatigue. In Proceedings of the 2019 5th International Conference on Transportation Information and Safety (ICTIS), Liverpool, UK, 14–17 July 2019; pp. 1290–1294. [Google Scholar] [CrossRef]
- Hyder, G.; Chowdhry, B.S.; Memon, K.; Ahmed, A. The Smart Automobile (SAM): An Application Based on Drowsiness Detection, Alcohol Detection, Vital Sign Monitoring and Lane based Auto Drive to avoid Accidents. In Proceedings of the 2020 Global Conference on Wireless and Optical Technologies, Malaga, Spain, 6–8 October 2020; pp. 1–10. [Google Scholar] [CrossRef]
- Jimenez, I.a.C.; Olivetti, E.C.; Vezzetti, E.; Moos, S.; Celeghin, A.; Marcolin, F. Effective affective EEG-based indicators in emotion-evoking VR environments: An evidence from machine learning. Neural Comput. Appl. 2024, 1–19. [Google Scholar] [CrossRef]
- Dubovi, I. Cognitive and emotional engagement while learning with VR: The perspective of multimodal methodology. Comput. Educ. 2022, 183, 104495. [Google Scholar] [CrossRef]
- Han, S.; Kwak, N.; Oh, T.; Lee, S. Classification of pilots’ mental states using a multimodal deep learning network. Biocybern. Biomed. Eng. 2020, 40, 324–336. [Google Scholar] [CrossRef]
- Zaidan, R.; Alamoodi, A.; Zaidan, B.; Zaidan, A.; Albahri, O.; Talal, M.; Garfan, S.; Sulaiman, S.; Mohammed, A.; Kareem, Z.; et al. Comprehensive driver behaviour review: Taxonomy, issues and challenges, motivations and research direction towards achieving a smart transportation environment. Eng. Appl. Artif. Intell. 2022, 111, 104745. [Google Scholar] [CrossRef]
- Yang, L.; Ma, R.; Zhang, H.M.; Guan, W.; Jiang, S. Driving behavior recognition using EEG data from a simulated car-following experiment. Accid. Anal. Prev. 2018, 116, 30–40. [Google Scholar] [CrossRef] [PubMed]
- Müller, J.F.; Gogoll, J. Should Manual Driving be (Eventually) Outlawed? Sci. Eng. Ethics 2020, 26, 1549–1567. [Google Scholar] [CrossRef] [PubMed]
- Ratoff, W. Self-driving cars and the right to drive. Philos. Technol. 2022, 35, 57. [Google Scholar] [CrossRef]
- Merat, N.; Jamson, A.H.; Lai, F.C.H.; Carsten, O. Highly Automated Driving, Secondary Task Performance, and Driver State. Hum. Factors 2012, 54, 762–771. [Google Scholar] [CrossRef]
- Strauch, C.; Mühl, K.; Patro, K.; Grabmaier, C.; Reithinger, S.; Baumann, M.; Huckauf, A. Real autonomous driving from a passenger’s perspective: Two experimental investigations using gaze behaviour and trust ratings in field and simulator. Transp. Research. Part F Traffic Psychol. Behav. 2019, 66, 15–28. [Google Scholar] [CrossRef]
- Yang, H.; Shi, L.; Liu, F.; Zhang, Y.; Liu, B.; Li, Y.; Shi, Z.; Zhou, S. EEG and ECG changes during deep-sea manned submersible operation. arXiv 2017, arXiv:1707.00142. [Google Scholar] [CrossRef]
- Gescheider, G.A.; Berryhill, M.E.; Verrillo, R.T.; Bolanowski, S.J. Vibrotactile temporal summation: Probability summation or neural integration? Somatosens. Mot. Res. 1999, 16, 229–242. [Google Scholar] [CrossRef]
- Seet, M.; Bezerianos, A.; Panou, M.; Bekiaris, E.; Thakor, N.; Dragomir, A. Individual Susceptibility to Vigilance Decrement in Prolonged Assisted Driving Revealed by Alert-State Wearable EEG Assessment. IEEE Trans. Cogn. Dev. Syst. 2023, 15, 1586–1594. [Google Scholar] [CrossRef]
- Jung, T.P.; Makeig, S.; Stensmo, M.; Sejnowski, T.J. Estimating alertness from the EEG power spectrum. IEEE Trans. Biomed. Eng. 1997, 44, 60–69. [Google Scholar] [CrossRef] [PubMed]
- Angell, L.S.; Auflick, J.; Austria, P.A.; Kochhar, D.S.; Kiger, S. Driver Workload Metrics Task 2 Final Report; U.S. Department of Transportation National Highway Traffic Safety Administration (NHTSA): Washington, DC, USA, 2006. [CrossRef][Green Version]
- Kumar, J.S.; Bhuvaneswari, P. Analysis of Electroencephalography (EEG) Signals and its Categorization–A Study. Procedia Eng. 2012, 38, 2525–2536. [Google Scholar] [CrossRef]
- Wishart, J.; Como, S.; Elli, M.; Russo, B.; Weast, J.; Altekar, N.; James, E.; Chen, Y. Driving Safety Performance Assessment Metrics for ADS-Equipped Vehicles. SAE Int. J. Adv. Curr. Pract. Mobil. 2020, 2, 2881–2899. [Google Scholar] [CrossRef]
- Chai, R.; Naik, G.R.; Nguyen, T.N.; Ling, S.H.; Tran, Y.; Craig, A.; Nguyen, H.T. Driver Fatigue Classification with Independent Component by Entropy Rate Bound Minimization Analysis in an EEG-Based System. IEEE J. Biomed. Health Inform. 2017, 21, 715–724. [Google Scholar] [CrossRef] [PubMed]
- Khanehshenas, F.; Mazloumi, A.; Nahvi, A.; Nickabadi, A.; Sadeghniiat, K.; Rahimiforoushani, A.; Aghamalizadeh, A. A hybrid approach for driver drowsiness detection utilizing practical data to improve performance system and applicability. Work 2024, 77, 1165–1177. [Google Scholar] [CrossRef]
- Du, N.; Zhou, F.; Pulver, E.M.; Tilbury, D.M.; Robert, L.P.; Pradhan, A.K.; Yang, X.J. Predicting driver takeover performance in conditionally automated driving. Accid. Anal. Prev. 2020, 148, 105748. [Google Scholar] [CrossRef]
- Lovie, P. Coefficient of variation. In Encyclopedia of Statistics in Behavioral Science; Wiley: New York, NY, USA, 2005. [Google Scholar] [CrossRef]
- Mestre, G.; Portela, J.; Rice, G.; Roque, A.M.S.; Alonso, E. Functional time series model identification and diagnosis by means of auto- and partial autocorrelation analysis. Comput. Stat. Data Anal. 2021, 155, 107108. [Google Scholar] [CrossRef]
- Nigbur, R.; Ivanova, G.; Stürmer, B. Theta power as a marker for cognitive interference. Clin. Neurophysiol. 2011, 122, 2185–2194. [Google Scholar] [CrossRef]
- Craig, A.; Tran, Y.; Wijesuriya, N.; Nguyen, H. Regional brain wave activity changes associated with fatigue. Psychophysiology 2012, 49, 574–582. [Google Scholar] [CrossRef]
- Griffiths, B.J.; Mayhew, S.D.; Mullinger, K.J.; Jorge, J.; Charest, I.; Wimber, M.; Hanslmayr, S. Alpha/beta power decreases track the fidelity of stimulus-specific information. eLife 2019, 8, e49562. [Google Scholar] [CrossRef]
- Mandrick, K.; Peysakhovich, V.; Rémy, F.; Lepron, E.; Causse, M. Neural and psychophysiological correlates of human performance under stress and high mental workload. Biol. Psychol. 2016, 121, 62–73. [Google Scholar] [CrossRef] [PubMed]
- Li, Z.; Jiao, K.; Chen, M.; Wang, C. Effect of magnitopuncture on sympathetic and parasympathetic nerve activities in healthy drivers—Assessment by power spectrum analysis of heart rate variability. Eur. J. Appl. Physiol. 2003, 88, 404–410. [Google Scholar] [CrossRef] [PubMed]
- Doshi, A.; Trivedi, M.M. On the Roles of Eye Gaze and Head Dynamics in Predicting Driver’s Intent to Change Lanes. IEEE Trans. Intell. Transp. Syst. 2009, 10, 453–462. [Google Scholar] [CrossRef]
- McManus, B.; Heaton, K.; Stavrinos, D. Commercial motor vehicle driving performance: An examination of attentional resources and control using a driving simulator. J. Exp. Psychol. Appl. 2017, 23, 191–203. [Google Scholar] [CrossRef]
- Fallahi, M.; Motamedzade, M.; Heidarimoghadam, R.; Soltanian, A.R.; Miyake, S. Effects of mental workload on physiological and subjective responses during traffic density monitoring: A field study. Appl. Ergon. 2016, 52, 95–103. [Google Scholar] [CrossRef]
- Billman, G.E. The effect of heart rate on the heart rate variability response to autonomic interventions. Front. Physiol. 2013, 4. [Google Scholar] [CrossRef]
- Colodro-Plaza, J.; De Los Fayos-Ruiz, E.G.; López-García, J.; Colodro-Conde, L. Individual differences in diving. Personal. Individ. Differ. 2014, 60, S59. [Google Scholar] [CrossRef]
Disclaimer/Publisher’s Note: The statements, opinions and data contained in all publications are solely those of the individual author(s) and contributor(s) and not of MDPI and/or the editor(s). MDPI and/or the editor(s) disclaim responsibility for any injury to people or property resulting from any ideas, methods, instructions or products referred to in the content. |
© 2024 by the authors. Licensee MDPI, Basel, Switzerland. This article is an open access article distributed under the terms and conditions of the Creative Commons Attribution (CC BY) license (https://creativecommons.org/licenses/by/4.0/).