Article

Evaluation of BLE Star Network for Wireless Wearable Prosthesis/Orthosis Controller †

1
Worcester Polytechnic Institute, Worcester, MA 01609, USA
2
Liberating Technologies, Inc., Holliston, MA 01746, USA
*
Authors to whom correspondence should be addressed.
This article is a revised and expanded version of a paper entitled “Power Consumption, Latency, and Maximum Number of Supported Nodes for BLE Biosensor Applications”, which was presented at the Myoelectric Controls Symposium Conference, 12–15 August 2024, Fredericton, NB, Canada.
Appl. Sci. 2024, 14(22), 10455; https://doi.org/10.3390/app142210455
Submission received: 17 October 2024 / Revised: 9 November 2024 / Accepted: 11 November 2024 / Published: 13 November 2024
(This article belongs to the Special Issue New Insights into Embedded Systems for Wearables)

Abstract

:

Featured Application

These results demonstrate that a BLE wireless sensor system can meet the latency, network size and power requirements for a wearable, wireless prosthesis/orthosis controller.

Abstract

Concomitant improvements in wireless communication and sensor technologies have increased capabilities of wearable biosensors. These improvements have not transferred to wireless prosthesis/orthosis controllers, in part due to strict latency and power consumption requirements. We used a Bluetooth Low Energy 5.3 (BLE) network to study the influence of the connection interval (10–100 ms) and event length (2500–7500 μs), ranges appropriate for real-time myoelectric prosthesis/orthosis control on the maximum network size, power consumption, and latency. The number of connections increased from 4 to 12 as the connection interval increased from 10 to 50 ms (event length of 2500 μs). For connection intervals ≤50 ms, the number of connections reduced by ≥50% with the increasing event length. At a connection interval of 100 ms, little change was observed in the number of connections vs. event length. Across event lengths, increasing the connection interval from 10 to 100 ms decreased the average power consumed by approximately 16%. Latency measurements showed that an average of one connection interval (maximum of just over two) elapses between the application of the signal at the peripheral node ADC input and its detection on the central node. Overall, reducing the latency using shorter connection intervals reduces the maximum number of connections and increases power consumption.

1. Introduction

Wearable, wireless sensors have become prominent in the last decade or two in a wide range of applications. In the healthcare sector, these sensors can be used for remote patient monitoring, diagnostics, and research. These sensors enable clinicians and researchers to collect data continuously from subjects both in and outside of a traditional laboratory or clinical setting. Wearable, wireless biosensors have been used for fitness applications such as heart rate monitoring, sleep monitoring, and exercise tracking in devices such as the Apple Watch or Google Pixel Watch [1,2], as well as in human–machine interfaces for prosthetics, orthotics and robotic control applications [3,4], and virtual and augmented reality controllers [5]. In this work, the goal is to assess BLE 5.3 for use in a multi-channel, wireless, biosensor network for a wearable electromyogram (EMG)-driven prosthesis controller.
Real-time myoelectric prosthesis control requires low latency, high wireless transmission throughput communication protocols and multiple peripheral nodes communicating with a single central node (i.e., a star network). For myoelectrically controlled prostheses, wireless EMG eliminates cumbersome cabling and is essential for osseointegrated devices that lack a socket in which to run wiring and house sensors. In a prosthesis controller, performance decreases approximately linearly with the total latency, which should be under 100 ms to ensure that wearers do not experience a performance-reducing lag between muscle activation and prosthesis response [6]. A delay from wireless transmission reduces the available EMG smoothing time, resulting in higher variance control signals [7]. Additionally, multiple battery-powered sensors are commonly placed at different EMG sites, which requires multiple simultaneous wireless connections.
With the rise of wearable, wireless sensors, there have been improvements in wireless communication protocols such as Bluetooth Low Energy (BLE), Wi-Fi, ZigBee, and NFC. The choice of wireless communication protocol is made to ensure that latency, power usage, range, and compatibility are suitable for the target application. BLE is commonly used for wearable systems, as it offers a low-power, low-cost solution for close range (less than 400 m for BLE 5) applications [8] and is highly configurable—making it easy to adapt for low latency and low power applications. Additionally, BLE is implemented in many common devices such as smartphones and laptops, making the integration of BLE-based sensors with existing infrastructure straightforward [9]. Backwards compatibility is guaranteed, so devices running the latest BLE release can operate with legacy BLE systems [10].
Wi-Fi, ZigBee, and NFC have also been used to design wireless biosensors. Wi-Fi is also widely available in modern smartphones and PCs. In comparison to BLE, Wi-Fi can send larger amounts of data at faster rates but at the expense of higher power consumption, which is detrimental in battery-powered systems [11].
ZigBee has been used for biomedical and industrial applications. It operates indoors and outdoors and offers transmission distances from 10 to 100 m. However, ZigBee supports a smaller maximum data rate of 250 kbps [12] compared to the 2 Mbps maximum data rate offered by BLE 5 [10]. This lower rate is insufficient for EMG acquisition, which, for research applications, should be sampled at a minimum of 2000 Hz [13,14], whilst many real-time products are sampled at a minimum of 1000 Hz (as we have done herein). In comparison to BLE, ZigBee offers a shorter operation range and has limited adoption, making interoperability a concern and a less robust security protocol, which makes it a less secure option for health-related applications [11].
More recently, NFC has also found applications in wearable, wireless, battery-less biosensors. Operating in the high frequency range (with a carrier frequency of 13.56 MHz), NFC is able to both transmit data and harvest power wirelessly between the NFC tags, which is ideal for small, low-power, battery-less wearable sensors [15]. Additionally, NFC is commonly built into smartphones, making it accessible to medical Internet of Things (IoTM) applications [16]. These NFC-based biosensor applications tend to be limited to relatively low bandwidths or low-power electrochemical, capacitive, and colorimetric applications such as a wireless pH sensor to monitor for the rejection of osseointegrated implants [17], skin hydration-sensing patches [18], and an ultra-compact, battery-free sweat glucose monitor [19]. There are a number of benefits associated with NFC, including its small footprint, easy pairing process, and ability to harvest power wirelessly from the NFC transmitter, the Poller [15,16]. NFC is ideal for very close-range applications in which the distance between the central and peripheral nodes is less than 10 cm [20]. When compared to BLE, NFC is a lower power option but has insufficient data transmission rates (424 kbps) and ranges (distance between the devices) for prosthesis control [21].
In this work, BLE was selected as the wireless communication protocol, as it offers a high data throughput at relatively low power consumption. Additionally, it can be configured for use in low latency applications (≤100 ms) and guarantees interoperability with existing BLE devices. The goal of this work was to evaluate how the configuration parameters of the connection interval and event length influence power consumption, latency, and maximum network size of the biosensor network. The results of this evaluation are intended to demonstrate whether BLE would be a suitable protocol for a wireless, wearable EMG-driven prosthesis controller. This article is a revised and expanded version of a paper entitled Power Consumption, Latency, and Maximum Number of Supported Nodes for BLE Biosensor Applications, which was presented at the Myoelectric Controls Symposium in Fredericton, New Brunswick, on 12–15 August 2024 [22].

2. Background

When working with BLE, developers have the option to configure various parameters of their systems, such as transmit strength, duration between transmissions, and duration of their transmissions, as well as size of the data transmitted. It is important to note that different manufacturers and operating systems may dictate the amount of configurability available to the developer. For example, Apple, Inc. has specific guidelines for connection parameters that accessory designers must follow when developing devices to pair with their products [23].
When developing a wireless sensor network, it is crucial to understand how BLE parameter selection influences the system performance in terms of power consumption, latency, and supported network size (i.e., maximum number of connections). For a real-time EMG-powered prosthesis controller, latency is a primary concern. Subjects have reported that they felt as though they were operating their prosthesis “in molasses” when delays longer than 50–100 ms were purposely imposed on their controller [6]. In addition, frequent charging of their device is inconvenient and impractical, so it is intended that a user get a full day (12 h or more) of use before they must recharge their device. To achieve this requirement, the average power consumption must be kept low, ideally to a few mA. Finally, for many EMG-driven applications, multiple channels of EMG or other sensor modalities are acquired. Thus, we also assessed the maximum number of sustained peripherals. In this work, the nRF52840 System-on-Chip (SoC) from Nordic Semiconductor was used to implement a multi-node wireless system to measure the average and maximum power consumption, latency, and maximum network size for different BLE configurations.
In a wireless prosthesis/orthosis controller, the peripheral devices would typically be placed around the remnant muscle, and the central device would be placed within the prosthetic device’s control system as shown in Figure 1. In some cases, the sensors may be placed around a joint or other location on the body, depending on the task at hand. In a traditional wired system, the sensors are physically connected via cabling between the sensors and control system, which requires housing (socket) to contain them. In this proposed wireless system, an enclosure would no longer be required, which is ideal for socket-less solutions such as prosthetic liners and osseointegrated devices.

2.1. BLE Parameter Definitions

The BLE configuration parameters of the connection interval and event length were considered in our measurements. The maximum transmit unit was scaled with respect to the connection interval to maximize the amount of data sent in each BLE transmission. These configuration parameters are defined as [24]:
  • Connection Interval: The time between consecutive connection events of the connected devices.
  • Maximum Transmission Unit (MTU): The maximum size of the data packet transferred between connected devices.
  • Event Length: The time allocated within a connection interval for the data transfer to occur between the connected devices (including required interframe and subevent spaces).

2.2. Related Works

BLE has been used for many applications since its release in 2010. Related works have studied some, but not all, of the configuration parameters considered here and typically under different test conditions or using earlier versions of BLE.
Tipparaju et al. [25] connected two peripheral devices to one central node to study the relationship between MTU size and data loss, as well as the impact of the external environment. They used two TI CC2640 BLE microcontroller units (MCUs) for their peripheral nodes and seven different central devices (one Raspberry Pi, four iOS-based devices, and two Android-based devices) to study the influence of the operating system and BLE hardware on data loss. Additionally, they measured the packet loss and received signal strength vs. node-to-node distance and objects placed between the central and peripheral nodes. They proposed a data loss mitigation protocol of increasing the connection interval and data bundling.
Touati et al. [26] used a single BLE peripheral device to study the Quality of Service vis-à-vis throughput, packet error rate, and end-to-end delay. They determined that BLE can meet the Quality of Service requirements of specific medical applications. Brunelli et al. [27] compared the current consumption and data throughput with various environmental interferences, comparing BLE 4.1 using the TI CC2650 SoC to Low Power Wi-Fi using the TI CC3200 for a multi-channel surface EMG acquisition system. They observed that Low Power Wi-Fi consumed seven times more current than BLE for low data rates, but there was a limitation of the throughput to 111.9 kbps for their BLE implementation. Note: With the release of BLE 5, higher throughputs are now achievable.
To specifically study the influence of the environment and interference from other wireless devices, Karvonen et al. [28] measured path loss (the attenuation of electromagnetic signals from transmitter to receiver) over distance in a hospital. They used nRF52840 SoC development kits running BLE 5.0. The received signal strength was measured at different locations in the hospital for a peripheral placed in a patient’s room. A known number of BLE-, Wi-Fi- and ZigBee-enabled devices (personal and medical) were placed inside and outside of the main patient’s room and surrounding patient rooms. The authors found that ranges of 6 m or more should utilize BLE 5.0’s long-range mode to ensure reliable communication.
Lastly, Tosi et al. [29] reviewed the BLE protocol and how various BLE parameters interact. The experimental and theoretical results detailing the number of connections that can be supported by a single central node, the relationship between connection interval and throughput, and power consumption are presented from different platforms such as the TI CC2241, Nordic Semiconductor nRF51822, and ST Microelectronic BlueNRG.
None of the above cited works considered these various parameters together, as shown in this work. Additionally, these works used BLE version 4.x, with the exception of [28], which used BLE 5.0. Herein, BLE version 5.3 was used. This latter version has improvements in reliability and reductions in power consumption and latency.

2.3. Theoretical Maximum Number of Connections

The maximum number of connections that can be sustained for a given BLE configuration can be theoretically estimated given the connection interval, MTU size, and event length. Developers should first note that the event length and connection interval values are often constrained by the development environment. Developers should consult the appropriate documentation for their selected development environment. Additionally, the event length minus 300 μs (required 150 μs interframe space plus 150 μs minimum subevent space) must be greater than the MTU size divided by the BLE data rate (0.25 MB/s for a BLE throughput of 2 Mbps). Then, the theoretical maximum number of connections—based purely on timing and assuming no transmission errors—is the connection interval divided by the event length, rounded down to the nearest integer value. Table 1 contains this theoretical number of connections for the BLE configurations considered in this work. In practice, of course, this theoretical maximum is not always achieved. Our experiments investigate the number of connections achieved for numerous configurations.

3. Materials and Methods

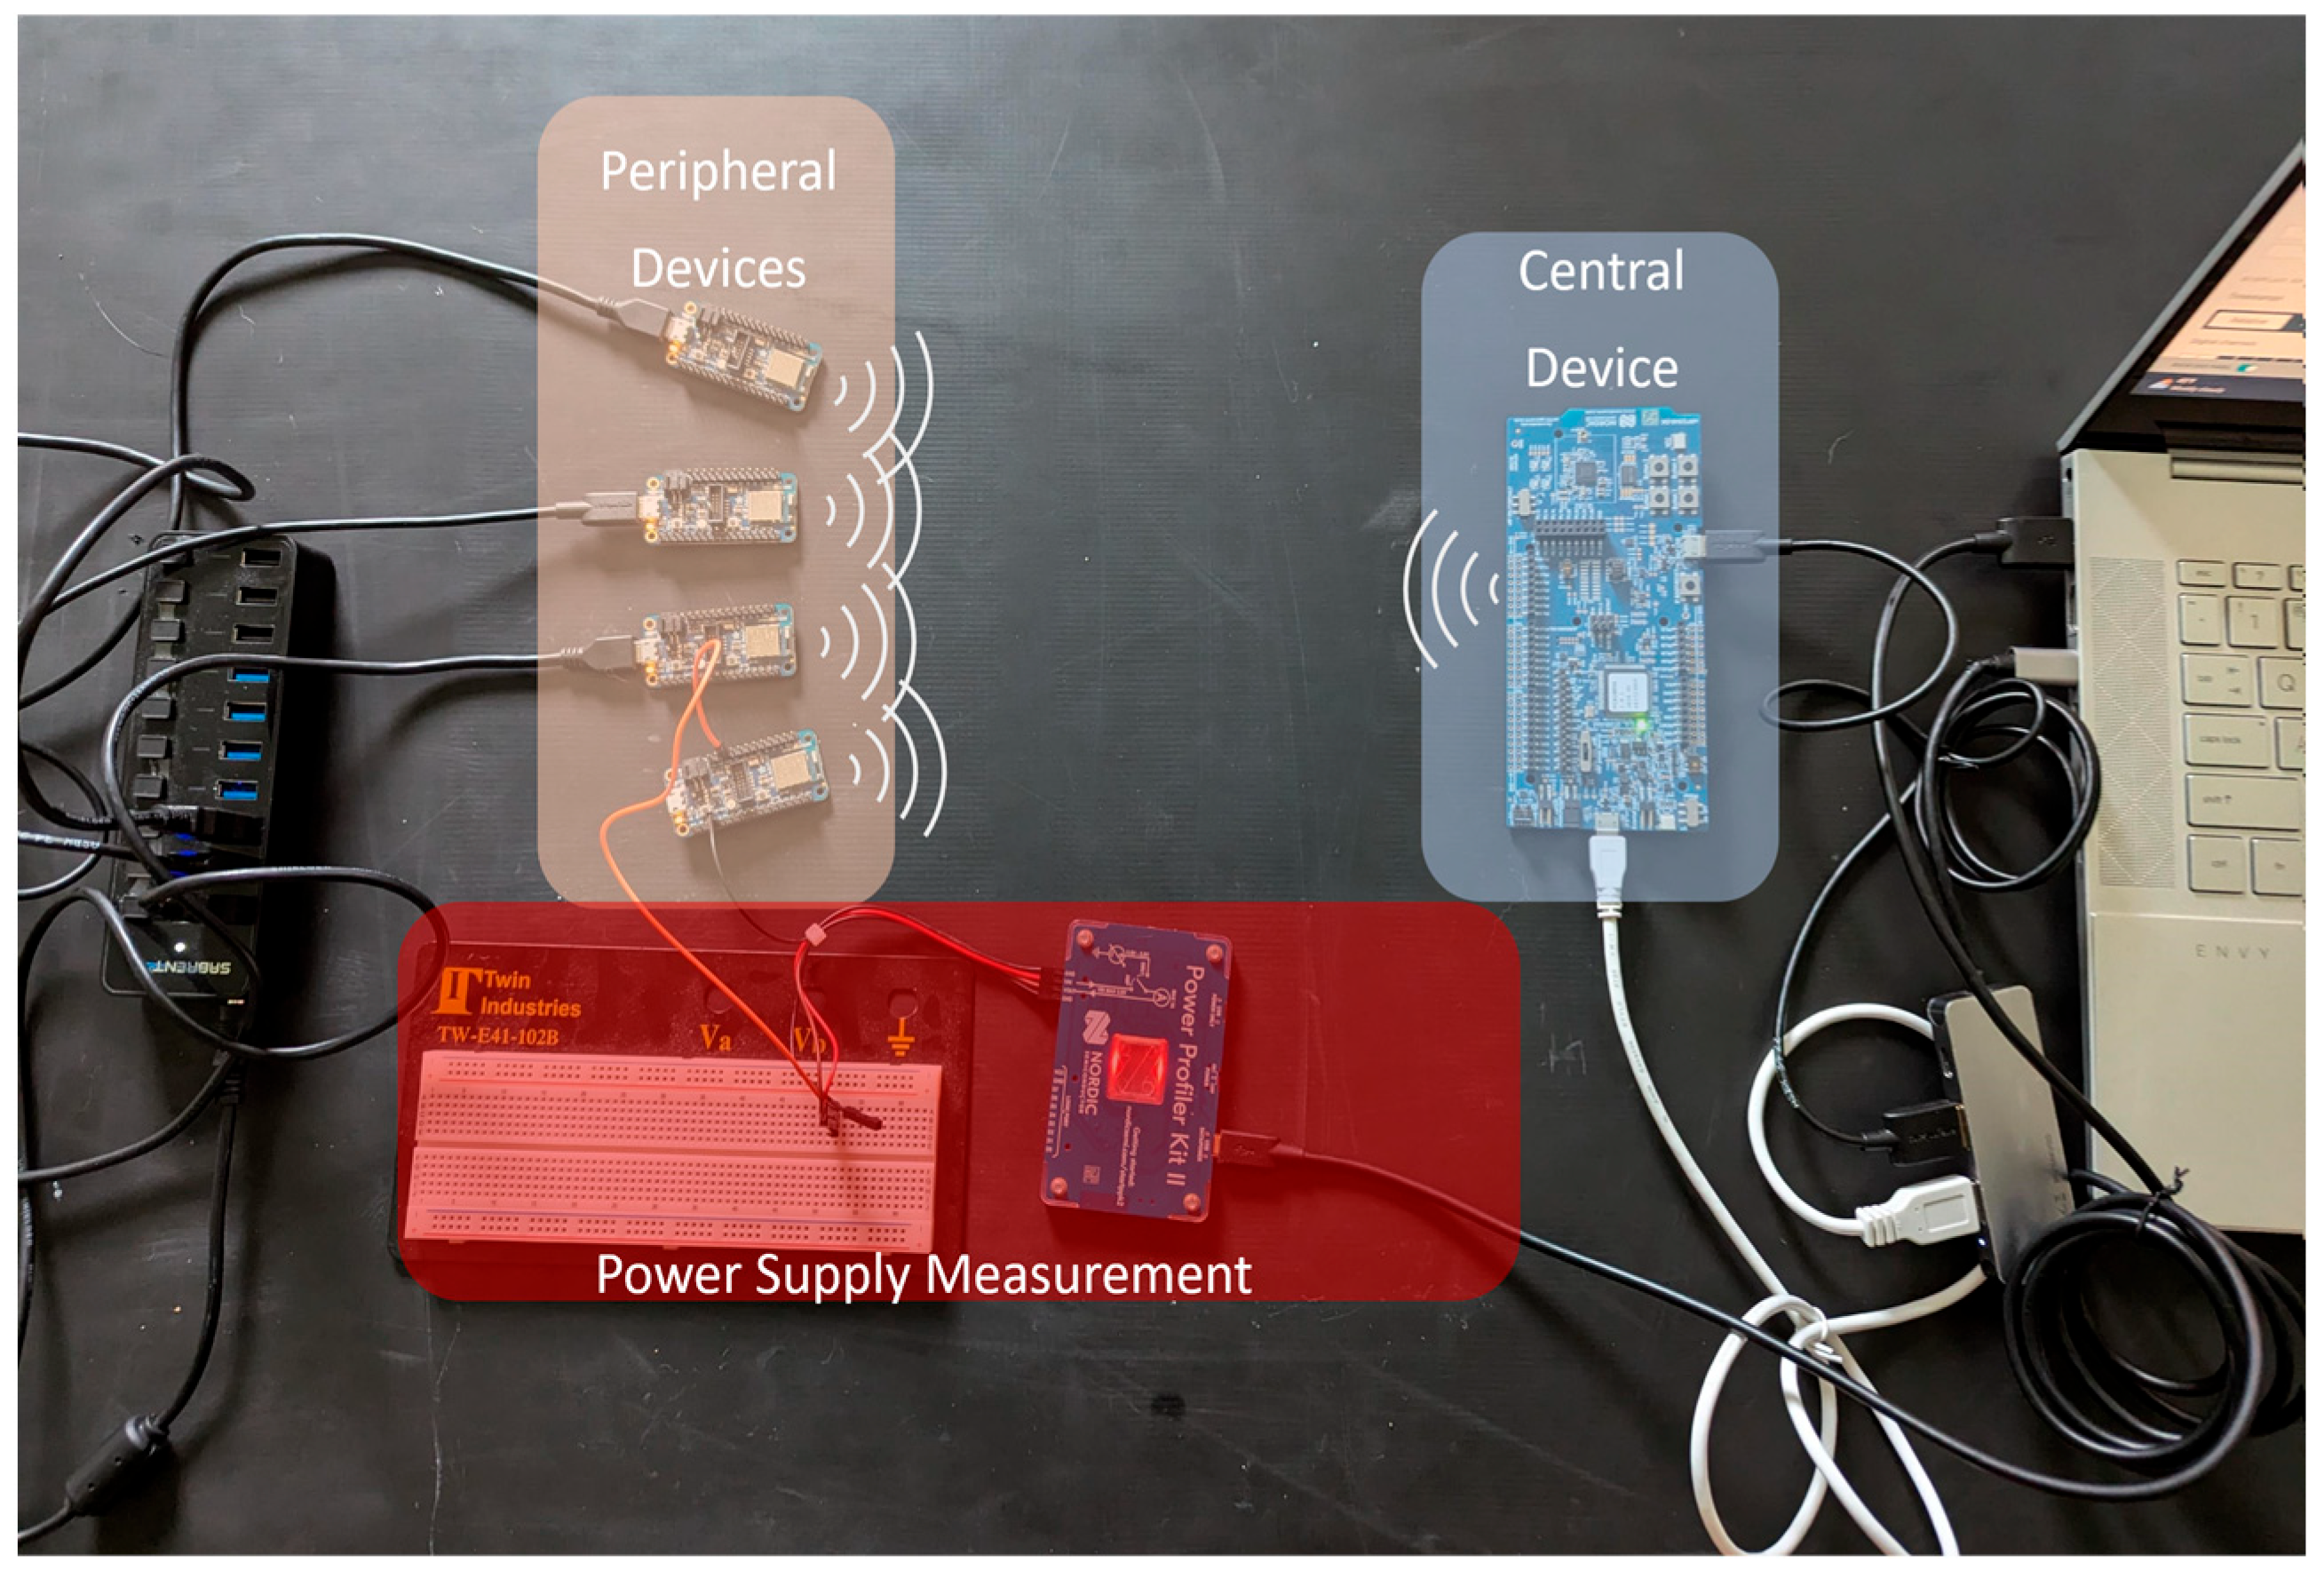
3.1. Experimental Set-Up

The maximum number of sustained peripheral connections, average and maximum power consumed, and latency were measured for all combinations of connection interval values of 10, 20, 30, 40, 50, and 100 ms and event length values of 2500, 5000, and 7500 μs. These values cover the range of appropriate values for real-time prosthesis/orthosis control, as connection intervals above 100 ms would introduce noticeable lag into the control system [6]. The minimum values selected for the connection interval and event length represent the lower limits available in the version of the software development kit (nRF Connect SDK v2.3.0) used. The minimum connection interval available is 7.5 ms, which was rounded up to 10 ms. Event lengths shorter than 2500 μs were not supported by the software development kit used. The MTU value was scaled to maximize the number of analog-to-digital converter (ADC) samples sent for a given connection interval.
When sampling at 1 kHz (sampling period of 1 ms), the number of ADC samples captured within a connection interval is equal to the duration of that connection interval in ms. Thus, to remain current with the capture of ADC samples in a real-time system, the number of bytes transmitted per connection interval must scale with the connection interval duration. In this case, each 12-bit sample is stored in 2 bytes. Twenty bytes of each BLE data packet were reserved for header information. Therefore, the MTU size used, in bytes, is equal to two times the value of the connection interval plus twenty bytes of header information. For the longest connection interval considered, 100 ms, a MTU size of 247 bytes was selected, as it is the maximum number of bytes permitted in a single packet [30]. Setting the MTU size based on the number of ADC samples collected minimized the delay between when the data were sampled and when they were ready for BLE transmission. This approach mimics embedded MCU schemes. All MTU sizes used are presented in Table 1, alongside the corresponding connection interval. A transmit power of +0 dBm was used for all measurements.
A single central node was connected to as many peripheral devices as possible for each configuration tested. The central node hardware was the Nordic Semiconductor nRF52840 Discovery Kit (Nordic Semiconductor, Trondheim, Norway), while Adafruit Feather nRF52840 Express (Adafruit, New York, NY, USA) was used for each peripheral node. Both development kits feature nRF52840 System-on-Chip (SoC) from Nordic Semiconductor, which contains a 64 MHz Cortex-M4 central processing unit and a floating-point unit [31]. BLE version 5.3 was used.
The peripheral nodes were placed in a semicircle fashion equidistant from the central node, as shown in Figure 2, initially at a radius of 0.5 m (with the central node in the center). Radii of 4.5 m and 9 m were also tested, though only when studying the maximum network size for each configuration. All measurements were performed in a home office to take into consideration a typical environment (containing possible sources of interference, such as cellular devices, laptops, smart TVs, etc.) in which a prosthesis/orthosis may be used.
The 12-bit ADC of each peripheral node was enabled and configured to sample ADC channel 0 at a rate of 1 kHz. Each ADC input was connected to a 70 Hz sine wave with an amplitude of 1.5 Vpp and DC offset of 0.850 V (HP 33120A Arbitrary Function Generator, Keysight, Santa Rosa, CA, USA). For each trial, 10 min of ADC data were streamed from each connected peripheral node to the central node.
The first in-use peripheral node (P0) was powered (5 V) by the Nordic Semiconductor Power Profiler Kit (PPKII). The remaining peripheral nodes were powered by a standard 5V USB connection powered from a wall adapter. The central node was powered from the USB connection of the PC.

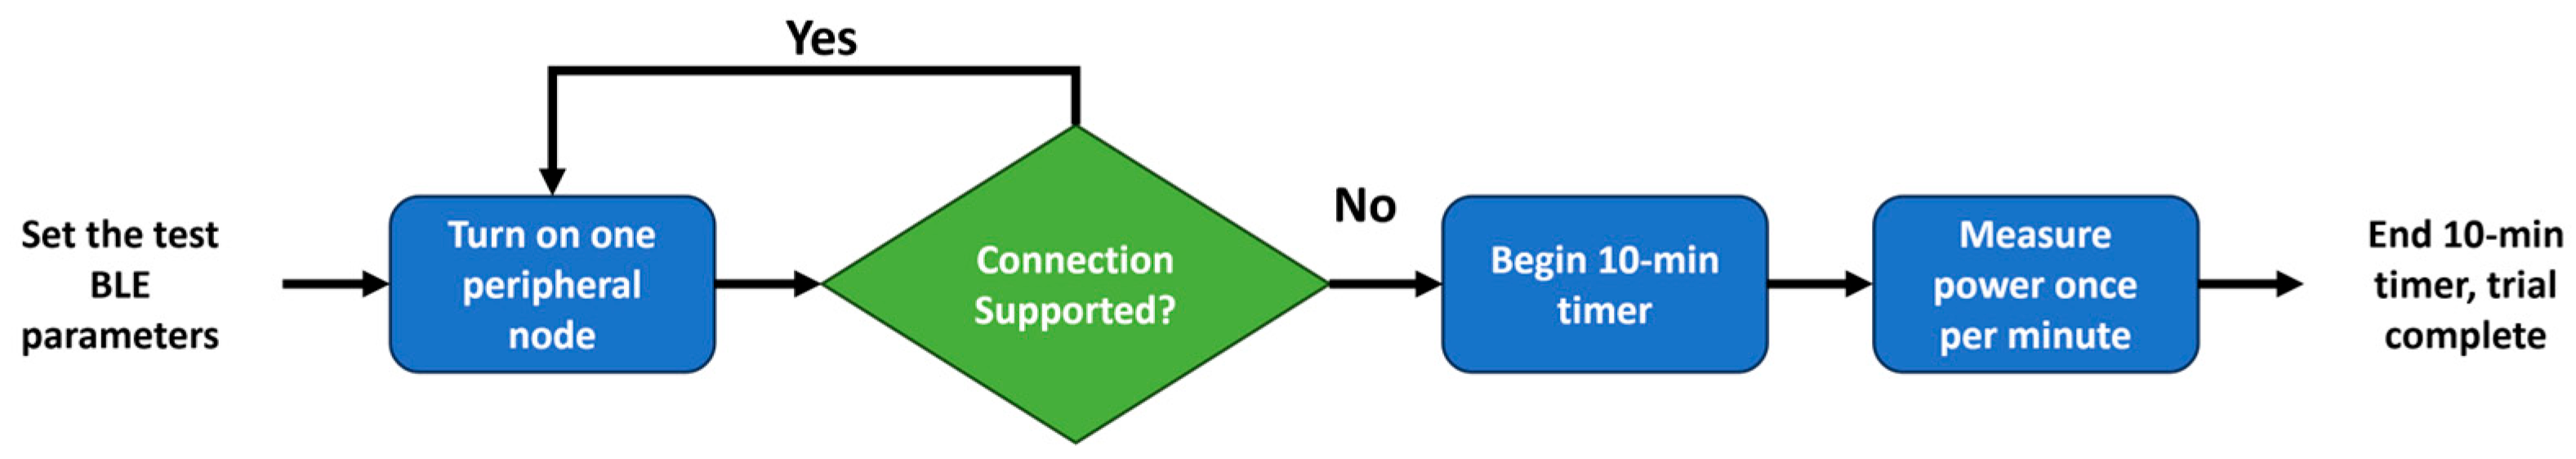
3.2. Measuring Maximum Number of Supported Peripheral Nodes and Power Supply Current

The maximum number of connections for a given combination of connection interval and event length was established prior to each power consumption measurement trial for a radius of 0.5 m. Initially, node P0 was connected, streaming its ADC samples to the central. Then, additional nodes (with ADC streaming) were added sequentially (P1, P2, P3,…) until no further connections were sustained. This point was reached when the central node reported a failure to receive the incoming data (i.e., reported the error “Failed to buffer bytes on channel x”). This last connected peripheral (the one that resulted in this error) was powered off. This measure was not repeated, since the maximum number of connections was stable for a given configuration.
Next, a 10-min current measurement trial began. The power supply current was measured only from peripheral node P0 at 0.5 m using PPKII (Power Profiler application, v3.5.4; nRF Connect for Desktop application, v4.0.0). The average and maximum current consumption were measured once per minute (total of 10 measures each) for each configuration. For each measurement, the average and maximum current consumption were measured over the default seven-second interval of the PPKII application (100 kHz sampling rate). Figure 3 contains a flow diagram detailing the steps taken to determine the maximum number of connections sustained, followed by the power consumption measurements. Thereafter, the distance was increased, and only the maximum number of connections was established at 4.5 m and 9 m.

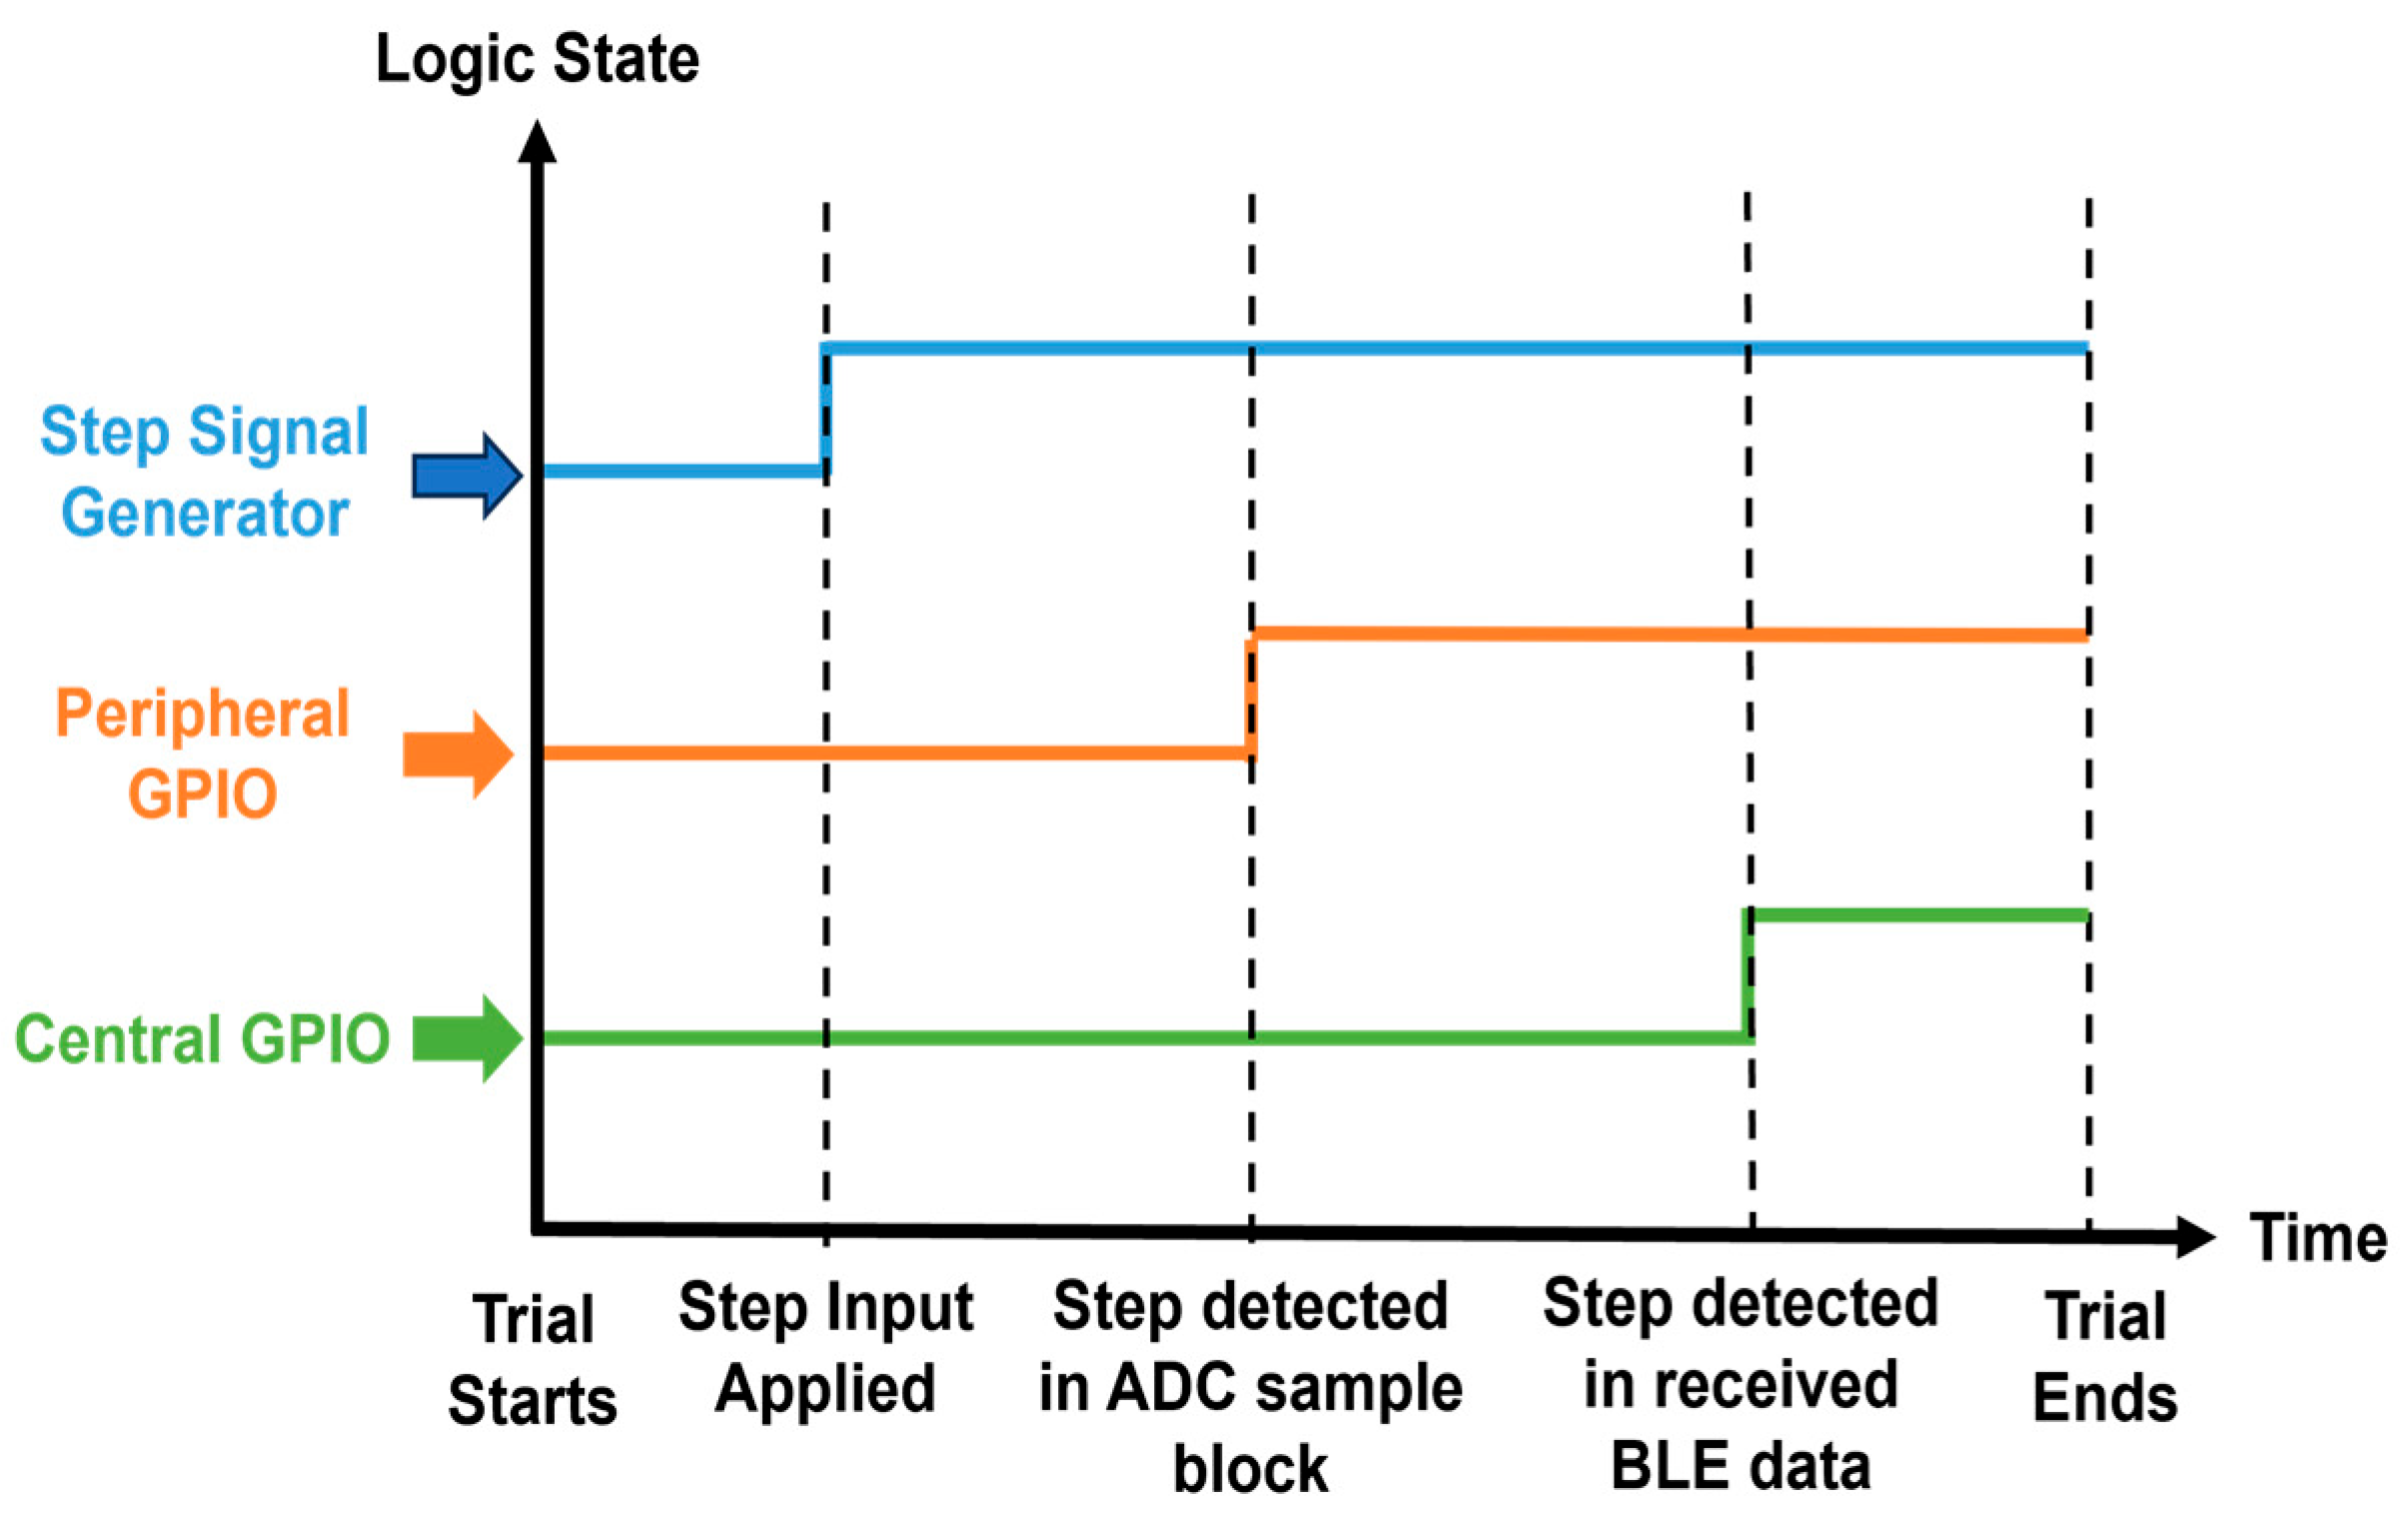
3.3. Measuring Latency

Separately, latency was measured between a single peripheral and central node (distance of 0.5 m) to determine the time required for ADC data to pass through the wireless system. The measure of latency is confounded, because a full data block is collected on the peripheral node before transmission to the central node. Transmission of an ADC sample captured at the beginning of the sampling block is delayed until the end of the sampling block, resulting in a delay of up to one full connection interval. Conversely, an ADC sample captured at the end of the sampling block experiences little to no delay prior to transmission to the central node. In addition, once a data block is queued for transmission in the peripheral node, it must wait until scheduled to do so by the central node. This queuing-to-transmit delay is unsynchronized between the peripheral and central nodes.
To measure latency, a step input, generated using one of the general purpose output pins of a nRF52840-DK (a standalone device), was applied to the ADC input of a single peripheral node. The step input was manually triggered for each trial to avoid synchronization with the ADC sampling process. A logic analyzer [Analog Devices, Inc. Active Learning Module 2000 (ADALM2000), Wilmington, MA, USA] measured the time between critical actions in the data pathway [32]. For each trial, the rising edge of the step input was used to trigger the beginning of the measurement. Software edge detection on both the peripheral and central nodes was implemented to set a general purpose digital output high (on each respective node) when the step input edge was detected first on the peripheral in the full block of recently captured ADC samples and then on the central node (after transmission) in the incoming BLE packet. Detection on the peripheral node measured the time between when the step input was applied and when it was available for BLE transmission following an ADC sampling block. Detection on the central node indicates that the step input has been received from the peripheral node. For each combination of event length and connection interval tested, 10 trials were completed. Latency from step input to detection on each of the peripheral and central nodes was manually measured on the logic analyzer for each individual trial. Figure 4 illustrates the timing associated with and GPIO flags set for a single trial starting with the initial trigger of the logic analyzer when the step input signal is applied, followed by the change in GPIOs on the peripheral and central, indicating that the software edge detection found the rising edge of the step input at each respective stage of the data flow.

3.4. Statistical Analysis

Initially, the Kolmogorov–Smirnoff test of normality was applied. This test showed that the data for all measurements did not follow a normal distribution. Thus, the Friedman test was chosen as a non-parametric alternative to the one-way ANOVA. If the Friedman test showed statistically significant differences, the pair-wise Nemenyi test was applied post hoc [33]. The Nemenyi test was chosen as it inherently adjusts for multiple comparisons. Differences were statistically significant for p-values less than 0.05.

4. Results

The results of the measurements of the maximum number of supported peripheral connections, average and maximum power consumption, and latency are presented below. The raw data are available as Supplementary Materials.

4.1. Number of Supported Peripheral Connections

Table 1 shows the number of connections sustained for each configuration tested over three different distances: 0.5 m, 4.5 m, and 9.0 m. In general, increasing the connection interval results in more peripheral connections for a given event length. When looking at the event length, decreasing the event length for a given connection interval leads to more connections sustained. It was observed that, as the distance between the central and peripheral nodes was increased from 0.5 m to 9.0 m, the number of connections decreased by 50% or more for most of the combinations considered for a transmit power of +0 dBm. Notable exceptions to this trend are the connection interval–event length pairs {10 ms, 5000 μs} and {10 ms, 7500 μs}, wherein the number of connections was fully constrained by the event length. For example, only one transmission event of length 7500 μs fits within a 10 ms connection interval, limiting the number of connections to one, regardless of distance.
The Kolmogorov–Smirnoff test showed that the number of connections compared across the three distances were not normally distributed. The Friedman test, applied to compare the number of connections for each distance, detected statistically significant differences. To compare on a pair-wise basis, the Nemenyi post hoc test was applied. Statistically significant differences were found between 0.5 m and 9.0 m (p = 0.001) and 4.5 m and 9.0 m (p = 0.008). When comparing results from 0.5 and 4.5 m, no statistically significant differences were found. No statistical analysis was warranted as a function of the remaining parameters (connection interval and event length), since these results were not stochastic.

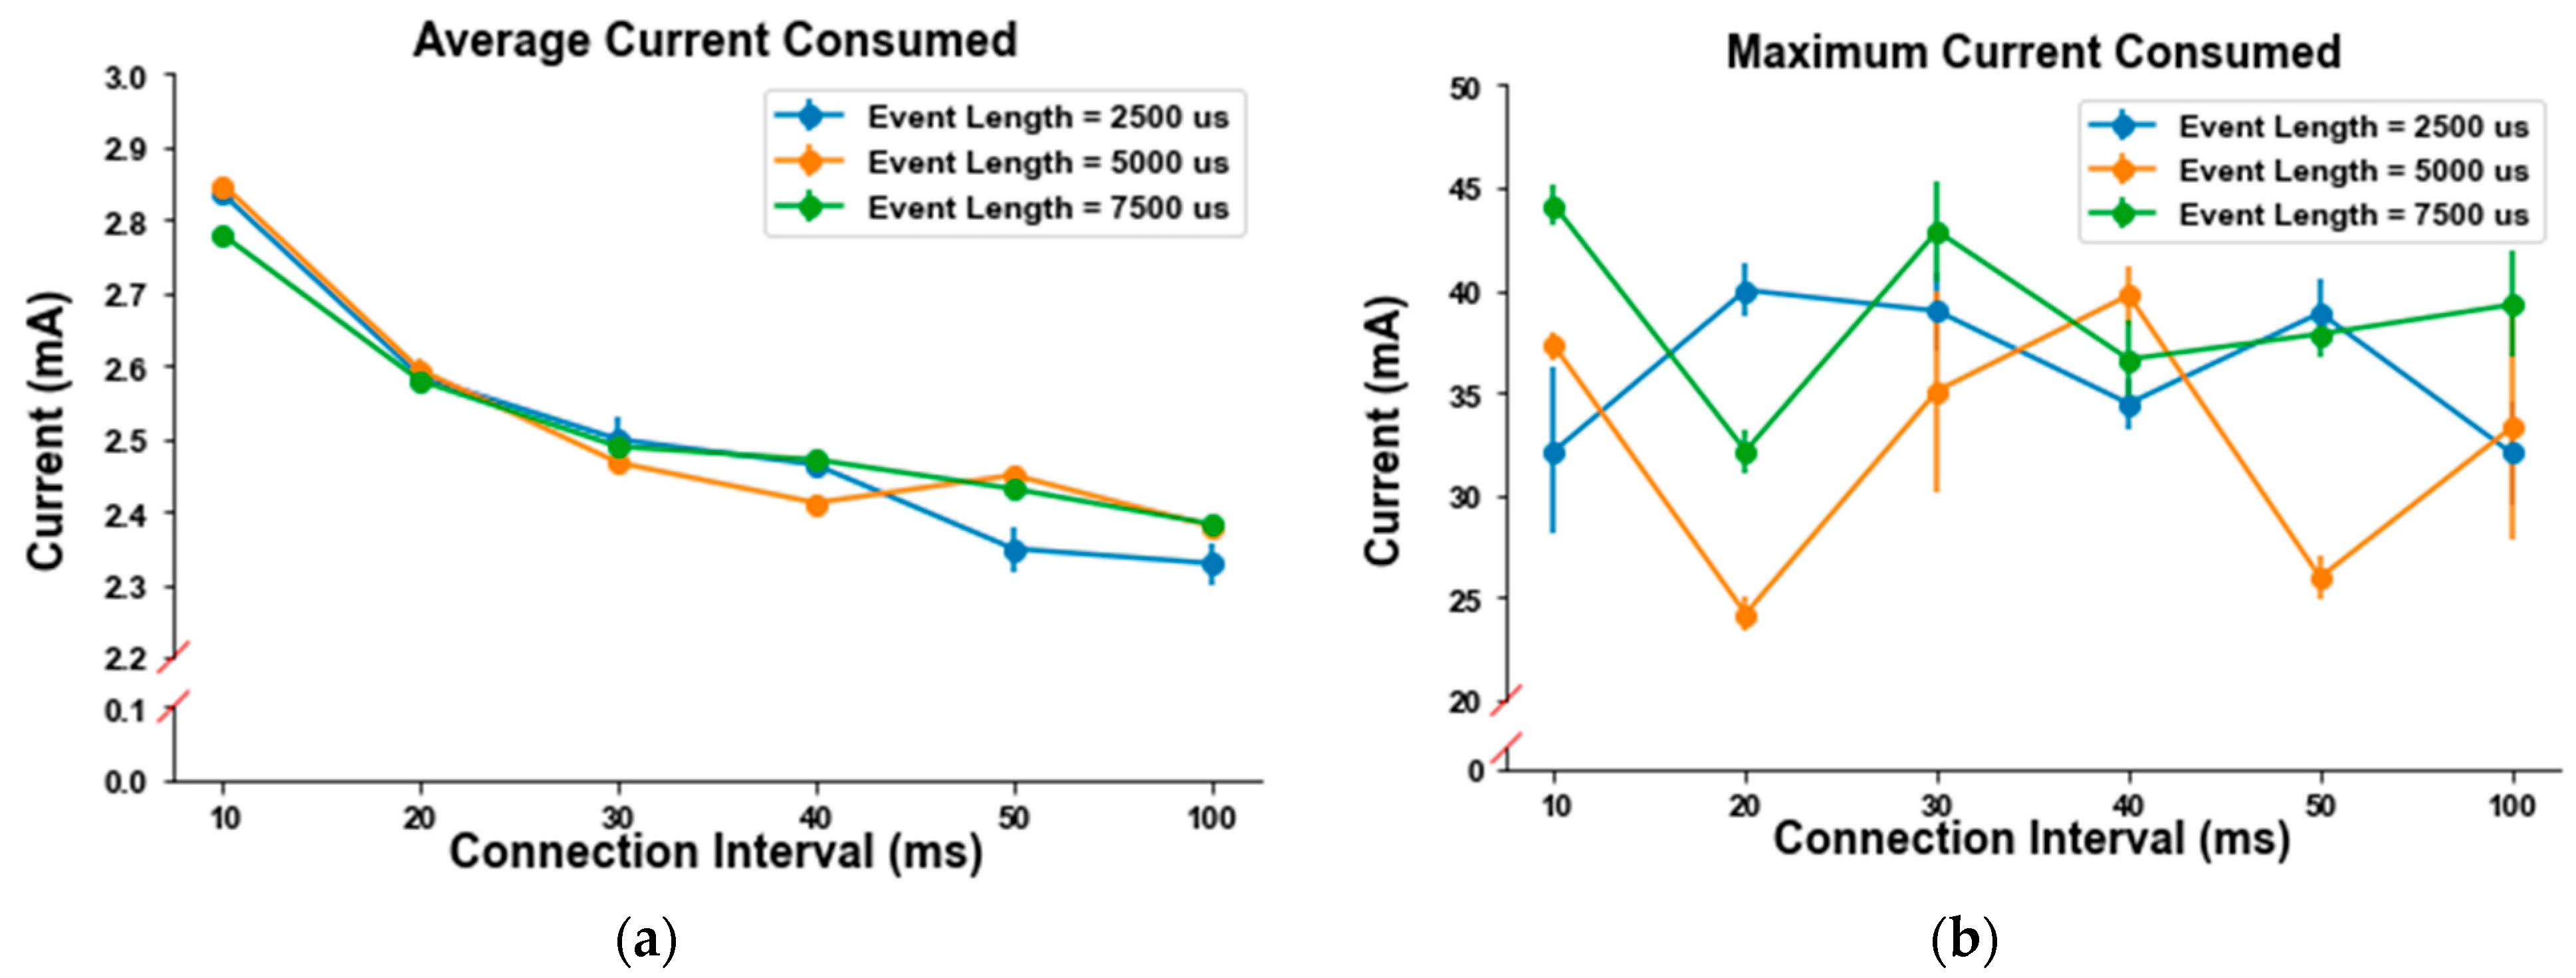
4.2. Peripheral Node Power Supply Current
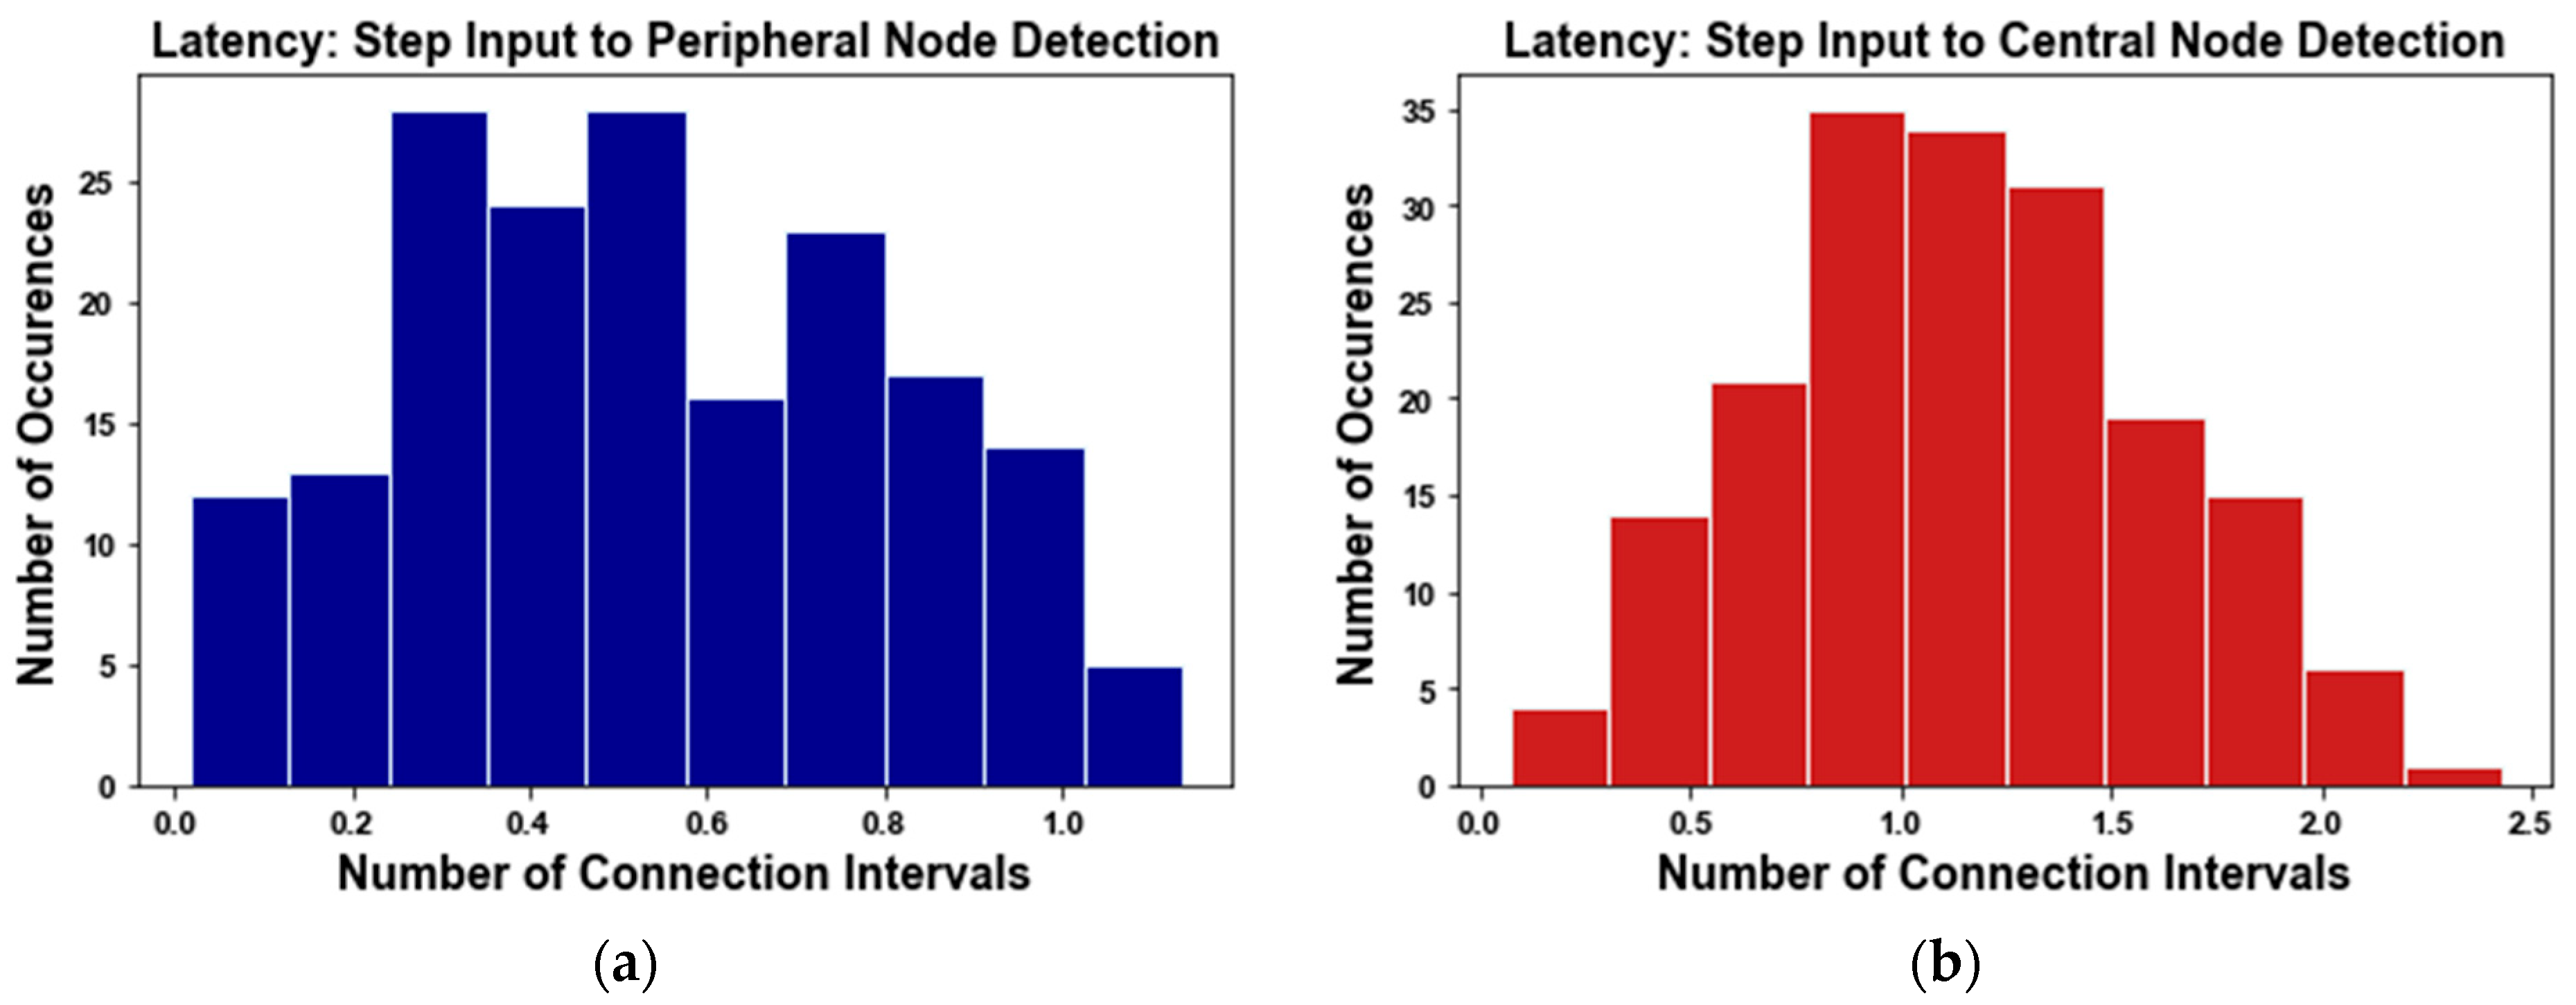
Figure 5 shows the mean and standard deviation of the 10 measurements of the average and, separately, maximum current consumption of the peripheral node as a function of the connection interval and event length. There was a strong trend towards lower average current consumption at longer connection intervals for all event lengths. There was no clear trend vs. connection interval for the maximum currents.
Initially, Friedman’s test was applied at each connection interval to test for differences in the average current consumption and, separately, maximum current consumption across the event length. All six comparisons were significant for the average current (p ≤ 0.002), albeit with small average differences, and separately for the maximum current (p ≤ 0.002). Table 2 lists the post hoc Nemenyi pair-wise comparison results for both the average and maximum current. There were no obvious trends vs. event length for either the average or maximum current consumption results.
Next, Friedman’s test was applied at each event length to test for differences in the average current consumption and, separately, maximum current consumption across the connection interval. All 15 comparisons were significant for the average current (p ≤ 3.84 × 10⁻⁹) and, separately, for the maximum current (p ≤ 1.69 × 10⁻⁶). Table 3 lists the post hoc Nemenyi pair-wise comparison results for both the average and maximum current. For the average current, statistically significant differences were generally found between the lower valued connection intervals of 10, 20, and 30 ms and the higher valued connection intervals of 40, 50, and 100 ms. There were no obvious trends vs. connection interval for the maximum current consumption results, many of which did not show statistical differences.

4.3. Latency

For a given configuration, latency seemed to grow proportionally with he connection interval. Thus, to evaluate if we could combine latency measurements across the different configurations, each measurement was normalized by dividing by its respective connection interval. This normalization converted the units of the measured latencies from milliseconds to multiples of the connection interval, potentially simplifying the relationship between connection interval and latency. The results of the Kolmogorov–Smirnoff test showed that the normalized latency data were not normally distributed. Friedman’s test was applied to both sets of normalized latency measurements separately, comparing the 18 conditions (6 connection intervals by 3 event lengths). There was no statistically significant difference detected in the latencies between the application of the step and its detection in the ADC data on the peripheral (p = 0.068). The results of Friedman’s test when applied to the latencies between application of the step and detection in the received BLE data on the central node found a statistically significant difference (p = 6.65 × 10⁻⁵). Nemenyi’s post hoc test showed that, of the 153 unique p-values, only 6 were statistically significant, as shown in Table 4. Since the vast majority of normalized latencies did not indicate statistically significant differences between conditions, only normalized latencies were further considered in this work.
Figure 6 shows histograms of the normalized latency measurements, aggregating the results from all the combinations of connection interval and event length. When looking at the latency measured between the step input and its detection on the peripheral node, the data looked to be uniformly random over the range from just above 0 to just above 1 of the connection interval (mean ± std. dev. of 0.54 ± 0.27 connection intervals). The data for the second latency measurement (from step input at the peripheral’s ADC to step detected on the central node) show a triangle-like distribution with a mean ± std. dev. of 1.14 ± 0.46 connection intervals.

5. Discussion

In this work, performance of a wireless biosensor network was studied in terms of power consumption, latency, and maximum network size for various BLE configurations using the nRF52840 SoC operating with BLE version 5.3. For a wireless, wearable EMG-driven prosthesis controller comprised of multiple peripheral devices, the results of this evaluation demonstrated that BLE version 5.3 would meet the latency requirements (as low as 10 ms, on average, for up to four peripherals) at a relatively low power consumption (<3 mA—representing, in our experiment, the sum of the currents consumed by the entire Adafruit Feather board, including the nRF52840 SoC, LEDs, and power management components). Additionally, these results were performed in a home office to mimic the expected environment in which a prosthesis/orthosis controller would operate. The decision to not control the test environment was deliberate to expose the test system to the various possible sources of interference that the wireless system may encounter in a user’s home from RF sources such as Wi-Fi and BLE-enabled devices such as smart TVs, PCs, tablets, wireless headphones, and smart phones.
With respect to the number of maximum peripheral connections, it was observed that in cases in which the event length is short (i.e., 2500 μs), the maximum number of connections sustained failed to reach its theoretical maximum for connection intervals of 50 and 100 ms. At these greater connection intervals, larger amounts of data were being transmitted, filling the allocated buffers sooner than at the shorter connection intervals. Increasing the size of these buffers from their default value might alleviate this issue but at the risk of impacting other functionality, such as data processing and transmission to the PC via UART. To maximize the number of connections that can be sustained, future developers should focus on allocating sufficient storage of incoming data without interfering with other resources or functionality.
When looking at the maximum number of peripheral connections, as the distance between the central and peripheral increased, the number of connections dropped significantly between the measurements at 0.5 m and 9 m. For prosthetic and orthotic applications, it is intended for the peripheral devices to be placed on the user’s body and the central to be placed within their devices’ control system. In most use cases, it is expected that the peripheral and central devices will be relatively close to one another, likely under one meter; in a typical configuration, it is expected that the peripheral would be placed on or near the muscles of the residual limb and the central placed within the prosthetic limb control system, so the limitations in the number of peripheral connections due to distance will be avoided. In the event that the distance between the central and peripheral exceeds a meter or two, fewer peripheral connections may be supported, which could be detrimental in scenarios where multiple peripherals are used. One possible solution to address this limitation is an increase in transmit power, which comes at the expense of greater power consumption.
Measurements of the average power supply current showed that, for all event lengths considered, an average decrease of 16.13% was observed as the connection interval increased from 10 ms to 100 ms. With respect to the event length, few statistically significant differences were detected between event lengths of 2500 μs and 5000 μs. When comparing 2500 μs and 7500 μs, as well as 5000 μs and 7500 μs, more statistically significant differences were detected. In general, the greatest power consumption is due to the operation of the BLE antenna, which is only active during a connection event. For low- or battery-powered applications, using a longer connection interval—if latency requirements allow—can minimize the system power consumption, as the BLE radio is less frequently activated. Prosthesis control applications, however, demand low transmission latency.
Our measurements of the instantaneous maximum power supply current (again measured from the entire Adafruit Feather board) reached almost 50 mA, which was an order of magnitude higher than the average currents. In a system that is field ready, some of these functions may be modified or eliminated, which may result in a lower maximum power consumption.
The normalized latency measurements showed that the time delay between when the input signal was applied and detected on the peripheral follows a uniform-shaped distribution, with a mean of 0.54 connection intervals and standard deviation of 0.27 connection intervals. This finding is consistent with the step input being manually triggered; thus, its time of arrival within the peripheral node ADC data block was equally likely at each time within the connection interval. Once queued for transmission in the peripheral node, the transmit time is unsynchronized with ADC data block completion but occurs within a connection interval. Thus, again, this delay is equally likely from the 0 to 1 connection interval. Hence, the measurements of overall time delay from when the step occurred on the peripheral to when it was detected in the received BLE data on the central node showed a triangle-like distribution with a mean ± std. dev. of 1.14 ± 0.46 connection intervals, consistent with the sum of two independent and uniform delay processes [34]. Some small additional delays were observed between each stage in the data flow, as expected, to account for intermediate processing of the data, data queuing, the BLE interframe space, etc. Additional measurements could help refine the shape of the latency distributions. When looking at the normalized latencies, on average, a little over one connection interval (maximum of just over two connection intervals) elapses between when the step was applied on the peripheral and when it was detected on the central node. In real-time applications, lower latencies are best, which are facilitated by shorter connection intervals. For prosthesis controllers, connection intervals well below 100 ms—which leave as much time as possible for EMG smoothing—should be used to avoid long delays for the user. This choice of connection interval may not result in the lowest power consumption and may limit the number of simultaneous connections that can be sustained. Hence, a trade-off must be made.
Additional work can be completed to investigate methods that can be used to improve the performance of the biosensor system in terms of power consumption, maximum network size, and latency. With respect to power consumption, reductions may be achieved using power-saving techniques such as the use of low power modes, disabling of functions on the Adafruit feather board, power cycling schemes, or BLE version 5.3’s connection subrating feature [35]. Power cycling schemes minimize the average power consumption during times of inactivity, which results in a lower average current consumption. Introduced in BLE version 5.3, the connection subrating feature allows for quick and dynamic modification from long to short BLE connection intervals. The connection subrating feature can be used to quickly reduce the data throughput during times of inactivity to reduce power consumption. To increase the number of connections that can be sustained over distance, future work should consider increasing the transmission strength using the BLE Power Control feature. Introduced in BLE version 5.2, the Power Control feature modifies the transmit power based on the received signal strength, which helps to maintain quality communication between connected devices [36]. Of course, increasing the transmission strength will increase the power consumption, so developers must take caution when making these design decisions. Finally, to reduce the system latency, one could investigate the reduction of, or elimination of, some of the data processing or functionality on the microcontroller. This approach may also provide power savings.
Future works may also consider the use of different development environments. As many wireless biosensors are designed to pair with existing devices such as smartphones or PCs, future works could measure the performance of the Nordic Semiconductor nRF52840 when paired with central nodes from different manufacturers or from different ecosystems (iOS or Android). Future works may also consider conducting similar comparisons using alternative MCUs, since each has its own unique design trade-offs that might influence the interplay between connectivity, power consumption, data throughput, latency, etc.

6. Conclusions

With the rise of wearable, wireless biosensors also come advancements in some commonly used wireless communication protocols. In the case of BLE, version 5.x introduced new features that can help develop lower power and larger biosensor networks for a variety of biosensor applications. In this work, the nRF52840 SoC was used to evaluate the power consumption, maximum network size, and latency at different configurations of the connection interval, event length, and MTU size for a wireless, wearable EMG-driven prosthesis controller. It was observed that increasing the connection interval from 10 ms to 100 ms reduced the power consumption by an average of 16.13%. With respect to the network size, minimizing the event length maximized the number of connections sustained for a given connection interval. Additionally, for a given event length, longer connection intervals allow for more connections to be sustained. Finally, latency measurements showed that, on average, 1.14 connection intervals lapse between the application of a step change at the peripheral node’s ADC and when it is detected on the central node in the received BLE data. From these results, it is advised to use connection intervals well under 100 ms for prosthesis control (to minimize latency) and shorter event lengths (to maximize the number of connections sustained). Future works could look to further improve the system’s power consumption using power optimization techniques or look to increase the network size or reduce the latency using data compression techniques or through firmware enhancements. Finally, using the latest release of the BLE protocol can improve the performance, as these new releases tend to introduce new features, as well as a more efficient implementation [37].

Supplementary Materials

The following supporting information can be downloaded at: https://www.mdpi.com/article/10.3390/app142210455/s1, The raw data for the results presented above.

Author Contributions

Conceptualization, K.J.R. and E.A.C.; Data curation, K.J.R.; Formal analysis, K.J.R.; Funding acquisition, B.E.M., T.R.F. and E.A.C.; Investigation, K.J.R.; Methodology, K.J.R. and A.W.; Project administration, K.J.R.; Resources, K.J.R.; Software, K.J.R. and A.W.; Supervision, E.A.C.; Validation, K.J.R. and A.W.; Visualization, K.J.R.; Writing—original draft, K.J.R. and E.A.C.; Writing—review and editing, A.W., B.E.M., T.R.F., J.L. and X.H. All authors have read and agreed to the published version of the manuscript.

Funding

This research was funded by DoD STTR Contract No. W81XWH-22-C-0049. Any opinions, findings, and conclusions or recommendations are those of the authors and do not necessarily reflect the views of the U.S. Army Medical Research and Development Command (USAMRDC).

Institutional Review Board Statement

Not applicable.

Informed Consent Statement

Not applicable.

Data Availability Statement

The original contributions presented in this study are included in the article and Supplementary Materials. Further inquiries can be directed to the corresponding authors.

Conflicts of Interest

Authors Anson Wooding, Benjamin E. McDonald, and Todd R. Farrell were employed by the company “Liberating Technologies, Inc.”. The remaining authors declare that the research was conducted in the absence of any commercial or financial relationships that could be construed as a conflict of interest.

References

  1. Apple, Inc. Take an ECG with the ECG App on Apple Watch; Apple Inc.: Cupertino, CA, USA, 2023. [Google Scholar]
  2. Google. Google Pixel Watch. Available online: https://store.google.com/product/pixel_watch_3?hl=en-US (accessed on 14 November 2023).
  3. Farina, D.; Jiang, N.; Rehbaum, H.; Holobar, A.; Graimann, B.; Dietl, H.; Aszmann, O.C. The Extraction of Neural Information from the Surface EMG for the Control of Upper-Limb Prostheses: Emerging Avenues and Challenges. IEEE Trans. Neural Syst. Rehabil. Eng. 2014, 22, 797–809. [Google Scholar] [CrossRef] [PubMed]
  4. Parker, P.; Englehart, K.; Hudgins, B. Myoelectric Signal Processing for Control of Powered Limb Prostheses. J. Electromyogr. Kinesiol. 2006, 16, 541–548. [Google Scholar] [CrossRef] [PubMed]
  5. Meta. Inside Facebook Reality Labs: Wrist-Based Interaction for the Next Computing Platform; Meta: Menlo Park, CA, USA, 2021. [Google Scholar]
  6. Farrell, T.R.; Weir, R.F. The Optimal Controller Delay for Myoelectric Prostheses. IEEE Trans. Neural Syst. Rehabil. Eng. 2007, 15, 111–118. [Google Scholar] [CrossRef] [PubMed]
  7. St-Amant, Y.; Rancourt, D.; Clancy, E.A. Influence of Smoothing Window Length on Electromyogram Amplitude Estimates. IEEE Trans. Biomed. Eng. 1998, 45, 795–799. [Google Scholar] [CrossRef] [PubMed]
  8. Sponas, J.G. Things You Should Know About Bluetooth Range; Nordic Semiconductor: Trondheim, Norway, 2023. [Google Scholar]
  9. Nelson, B.D.; Karipott, S.S.; Wang, Y.; Ong, K.G. Wireless Technologies for Implantable Devices. Sensors 2020, 20, 4604. [Google Scholar] [CrossRef] [PubMed]
  10. Core Specification Working Group. Bluetooth Core Specification; Core Specification Working Group: Zug, Switzerland, 2021. [Google Scholar]
  11. Dehghani, A.; Ghalamfarsa, F.; Bidgoly, A.J.; Mollarasouli, F. Recent Advances and Challenges in Internet of Things (IoT)-Based Smartphone Biosensors for COVID-19 and Zika Viruses Detection: A Review. IEEE Sens. 2023, 23, 24123–24134. [Google Scholar] [CrossRef]
  12. Connectivity Standards Alliance. Zigbee FAQ. Available online: https://csa-iot.org/all-solutions/zigbee/zigbee-direct-faq/ (accessed on 25 October 2023).
  13. Merletti, R.; Cerone, G.L. Tutorial. Surface EMG Detection, Conditioning and Pre-Processing: Best Practices. J. Electromyogr. Kinesiol. 2020, 54, 102440. [Google Scholar] [CrossRef] [PubMed]
  14. Gallina, A.; Disselhorst-Klug, C.; Farina, D.; Merletti, R.; Besomi, M.; Holobar, A.; Enoka, R.M.; Hug, F.; Falla, D.; Sogaard, K.; et al. Consensus for Experimental Design in Electromyography (CEDE) Project: High-Density Surface Electromyography Matrix. J. Electromyogr. Kinesiol. 2022, 64, 102656. [Google Scholar] [CrossRef] [PubMed]
  15. Kang, S.G.; Song, M.S.; Kim, J.W.; Lee, J.W.; Kim, J. Near-Field Communication in Biomedical Applications. Sensors 2021, 21, 703. [Google Scholar] [CrossRef] [PubMed]
  16. Lazaro, A.; Villarino, R.; Lazaro, M.; Canellas, N.; Prieto-Simon, B.; Girbau, D. Recent Advances in Batteryless NFC Sensors for Chemical Sensing and Biosensing. Biosensors 2023, 13, 775. [Google Scholar] [CrossRef] [PubMed]
  17. Fries, F.; Ghoreishizadeh, S. Design Methodology of a Wireless pH Measuring Device for Orthopaedic Implants. In Proceedings of the 2020 27th IEEE International Conference on Electronics, Circuits and Systems (ICECS), Glasgow, UK, 23–25 November 2020. [Google Scholar]
  18. Flament, F.; Galliano, A.; Abric, A.; Matoschitz, C.-M.; Bammer, M.; Kampus, M.; Kanda-Diwidi, D.; Chibout, S.; Cassier, M.; Delaunay, C. Skin Moisture Assessment Using Hydration Sensor Patches Coupled with Smartphones via Near Field Communication (NFC). A Pilot Study with the First Generation of Patches That Allow Self-Recordings of Skin Hydration. Skin Res. Technol. 2021, 27, 959–965. [Google Scholar] [CrossRef] [PubMed]
  19. Mirzajani, H.; Abbasiasl, T.; Mirlou, F.; Istif, E.; Bathaei, M.J.; Dağ, Ç.; Deyneli, O.; Yazıcı, D.; Beker, L. An Ultra-Compact and Wireless Tag for Battery-Free Sweat Glucose Monitoring. Biosens. Bioelectron. 2022, 213, 114450. [Google Scholar] [CrossRef] [PubMed]
  20. ST Microelectronics. NFC Technology—Essentials & Insights; ST Microelectronics: Geneva, Switzerland, 2024. [Google Scholar]
  21. NFC Forum. The Building Blocks of Contactless; NFC Forum: Wakefield, MA, USA, 2024. [Google Scholar]
  22. Rajotte, K.J.; Wooding, A.; Farrell, T.; Li, J.; Huang, X.; Clancy, E.A.; McDonald, B. Power Consumption, Latency, and Maximum Number of Supported Nodes for BLE Biosensor Applications. In Proceedings of the MEC Symposium, Fredericton, NB, Canada, 12–15 August 2024. [Google Scholar]
  23. Apple, Inc. Accessory Design Guidelines for Apple Devices; Apple, Inc.: Cupertino, CA, USA, 2023. [Google Scholar]
  24. Townsend, K.; Cufi, C.; Akiba; Davidson, R. Getting Started with Bluetooth Low Energy; O’Reilly Media, Inc.: Sebastopol, CA, USA, 2014. [Google Scholar]
  25. Tipparaju, V.V.; Mallires, K.R.; Wang, D.; Tsow, F.; Xian, X. Mitigation of Data Packet Loss in Bluetooth Low Energy-Based Wearable Healthcare Ecosystem. Biosensors 2021, 11, 350. [Google Scholar] [CrossRef] [PubMed]
  26. Touati, F.; Erdene-Ochir, O.; Mehmoud, W.; Hassan, A.; Mnaouer, A.B.; Gaabab, B.; Rasid, M.F.A.; Khriji, L. An Experimental Performance Evaluation and Compatibility Study of the Bluetooth Low Energy Based Platform for ECG Monitoring in WBANs. Int. J. Distrib. Sens. Netw. 2015, 11, 645781. [Google Scholar] [CrossRef]
  27. Brunelli, D.; Farella, E.; Giovanelli, D.; Milosevic, B.; Minkov, I. Design Considerations for Wireless Acquisition of Multichannel sEMG Signals in Prosthetic Hand Control. IEEE Sens. 2016, 16, 8338–8347. [Google Scholar] [CrossRef]
  28. Karvonen, H.; Mikhaylov, K.; Hämäläinen, M.; Iinatti, J.; Pomalaza-Raez, C. Interference of Wireless Technologies on BLE Based WBANs in Hospital Scenarios. In Proceedings of the 2017 IEEE 28th Annual International Symposium on Personal, Indoor, and Mobile Radio Communications (PIMRC), Montreal, QC, Canada, 8–13 October 2017; pp. 1–6. [Google Scholar]
  29. Tosi, J.; Taffoni, F.; Santacatterina, M.; Sannino, R.; Formica, D. Performance Evaluation of Bluetooth Low Energy: A Systematic Review. Sensors 2017, 17, 2898. [Google Scholar] [CrossRef] [PubMed]
  30. Mohammad, A. Bluetooth 5 Speed: How to Achieve Maximum Throughput for Your BLE Application; NovelBits: Fishers, IN, USA, 2023. [Google Scholar]
  31. Nordic Semiconductor. nRF52840 System on Chip Multiprotocol Bluetooth 5.4 SoC Supporting Bluetooth Low Energy, Bluetooth Mesh, NFC, Thread and Zigbee; Nordic Semiconductor: Trondheim, Norway, 2024. [Google Scholar]
  32. Analog Devices, Inc. ADALM2000 Overview; Analog Devices, Inc.: Wilmington, MA, USA, 2022. [Google Scholar]
  33. Pereira, D.G.; Afonso, A.; Medeiros, F.M. Overview of Friedman’s Test and Post-Hoc Analysis. Commun. Stat.—Simul. Comput. 2015, 44, 2636–2653. [Google Scholar] [CrossRef]
  34. Papoulis, A. Functions of Two Random Variables. In Probability, Random Variables, and Stochastic Processes; McGraw-Hill Book Company: New York, NY, USA, 1965; p. 190. [Google Scholar]
  35. Nordic Semiconductor. What’s New in Bluetooth 5.3? Nordic Semiconductor: Trondheim, Norway, 2021. [Google Scholar]
  36. Kai, R. 6 Important Things to Know About LE Power Control; Bluetooth SIG, Inc.: Kirkland, WA, USA, 2020. [Google Scholar]
  37. Kanafek, P. What’s New in Bluetooth 5.4: An Overview; Nordic Semiconductor: Trondheim, Norway, 2023. [Google Scholar]
Figure 1. Illustration of the intended upper limb prosthetic control application. The peripheral devices (IMU and EMG sensors) are placed at their sensing location, the remnant muscle for the EMG sensor and the shoulder for the IMU sensor, and wirelessly connected to a central device placed inside of the prosthetic device’s control module.
Applsci 14 10455 g001
Figure 2. Photograph of the experimental set-up with 4 peripherals. The peripheral nodes are shown on the left-hand side, and they are wirelessly connected to one central node placed in the center of the semicircle. The central node is connected to a PC using the serial port. The Nordic Semi PPKII (Nordic Semiconductor, Trondheim, Norway) is connected to the first in-use peripheral to source and measure the node’s power consumption. The PPKII is connected to the PC to configure and log measurements. Note, to capture this photograph, the distance between the peripheral and central devices was reduced. Additionally, not shown (to minimize the cabling shown) is the signal generator connected to the ADC input for each peripheral.
Applsci 14 10455 g002
Figure 3. Flow diagram detailing the steps used for each trial measuring the maximum number of nodes and the maximum and average power consumption.
Applsci 14 10455 g003
Figure 4. Example timing diagram illustrating a single trial of the latency measurement, starting with application of the step signal input (blue), the detection in a block of ADC samples on the peripheral (orange), and finally, the detection of the step in the received BLE data on the central (green).
Applsci 14 10455 g004
Figure 5. (a) Average current and (b) maximum current consumed (over 7 s of data) vs. connection interval and event length. Mean ± standard deviation of 10 current consumption measurements were used per result.
Applsci 14 10455 g005
Figure 6. (a) Normalized latency measurements for the step input’s detection on the peripheral and (b) normalized latency measurements for the step input’s detection on the central node, computed by dividing the measured latency by the connection interval. There are 180 samples per histogram (10 trials per condition × 6 connection intervals × 3 event lengths).
Applsci 14 10455 g006
Table 1. Number of connections sustained vs. distance. Also shown is the theoretical maximum number of connections.
Connection Interval (ms)
[MTU Size]
Event Length (μs)Theoretical Max.
Number of
Connections
Achieved Connections at Specified Distance
0.5 m4.5 m9.0 m
10
[40 bytes]
25004432
50002222
75001111
20
[60 bytes]
25008821
50004441
75002221
30
[80 bytes]
2500121163
50006631
75004442
40
[100 bytes]
2500161261
50008882
75005562
50
[120 bytes]
2500201252
5000101073
75006661
100
[247 bytes]
2500401071
5000201072
7500131122
Table 2. Nemenyi post hoc pair-wise statistical results vs. event length. (*) denotes p ≤ 0.05.
Connection Interval (ms)Event Lengths Compared (μs)p-Value (Significant) for:
Average CurrentMaximum Current
102500 vs. 50000.1740.174
2500 vs. 75000.037 (*)0.001 (*)
5000 vs. 75000.001 (*)0.037 (*)
202500 vs. 50000.1090.001 (*)
2500 vs. 75000.3730.065
5000 vs. 75000.002 (*)0.065
302500 vs. 50000.001 (*)0.109
2500 vs. 75000.2610.109
5000 vs. 75000.0650.001 (*)
402500 vs. 50000.003 (*)0.001 (*)
2500 vs. 75000.9000.174
5000 vs. 75000.002 (*)0.174
502500 vs. 50000.001 (*)0.001 (*)
2500 vs. 75000.1740.632
5000 vs. 75000.037 (*)0.010 (*)
1002500 vs. 50000.007 (*)0.504
2500 vs. 75000.001 (*)0.001 (*)
5000 vs. 75000.7600.037 (*)
Table 3. Nemenyi post hoc pair-wise statistical results (p-values) vs. connection interval for current consumption. (*) denotes p ≤ 0.05.
Connection
Interval 1 (ms)
Connection
Interval 2 (ms)
Average Current:
p-Value (Significant) for:
Maximum Current:
p-Value (Significant) for:
Event Length 2500 μsEvent Length 5000 μsEvent Length 7500 μsEvent Length 2500 μsEvent Length 5000 μsEvent Length 7500 μs
10200.8190.8190.8190.002 (*)0.003 (*)0.001 (*)
300.1210.1600.1600.023 (*)0.8880.900
400.006 (*)0.001 (*)0.005 (*)0.9000.4720.005 (*)
500.001 (*)0.005 (*)0.001 (*)0.019 (*)0.0660.007 (*)
1000.001 (*)0.001 (*)0.001 (*)0.9000.6810.324
20300.7500.8190.8190.9000.0900.001 (*)
400.1810.005 (*)0.1600.009 (*)0.001 (*)0.396
500.001 (*)0.1600.005 (*)0.9000.9000.324
1000.001 (*)0.001 (*)0.001 (*)0.001 (*)0.2060.007 (*)
30400.9000.1600.8190.0660.047 (*)0.023 (*)
500.0780.8190.1600.9000.5430.033 (*)
1000.033 (*)0.005 (*)0.005 (*)0.007 (*)0.9000.612
40500.5430.8190.8190.0560.001 (*)0.900
1000.3590.8190.1600.9000.016 (*)0.612
501000.9000.1600.8190.006 (*)0.7500.681
Table 4. Statistically significant combinations of second latencies (from step input on the peripheral to detection on the central).
Combination #1
(Connection Interval, Event Length)
Combination #2
(Connection Interval, Event Length)
p-Value
(10 ms, 2500 μs)(50 ms, 2500 μs)0.022
(10 ms, 2500 μs)(100 ms, 5000 μs)0.001
(10 ms, 2500 μs)(40 ms, 7500 μs)0.009
(10 ms, 2500 μs)(100 ms, 7500 μs)0.001
(10 ms, 5000 μs)(100 ms, 5000 μs)0.016
(20 ms, 5000 μs)(100 ms, 5000 μs)0.034
Disclaimer/Publisher’s Note: The statements, opinions and data contained in all publications are solely those of the individual author(s) and contributor(s) and not of MDPI and/or the editor(s). MDPI and/or the editor(s) disclaim responsibility for any injury to people or property resulting from any ideas, methods, instructions or products referred to in the content.

