Article

Application of Binary Image Quality Assessment Methods to Predict the Quality of Optical Character Recognition Results

by
Mateusz Kopytek
,
Piotr Lech
and
Krzysztof Okarma
*
Department of Signal Processing and Multimedia Engineering, West Pomeranian University of Technology in Szczecin, 70-313 Szczecin, Poland
*
Author to whom correspondence should be addressed.
Appl. Sci. 2024, 14(22), 10275; https://doi.org/10.3390/app142210275
Submission received: 15 October 2024 / Revised: 5 November 2024 / Accepted: 7 November 2024 / Published: 8 November 2024
(This article belongs to the Section Computing and Artificial Intelligence)

Abstract

:
One of the continuous challenges related to the growing popularity of mobile devices and embedded systems with limited memory and computational power is the development of relatively fast methods for real-time image and video analysis. One such example is Optical Character Recognition (OCR), which is usually too complex for such devices. Considering that images captured by cameras integrated into mobile devices may be acquired in uncontrolled lighting conditions, some quality issues related to non-uniform illumination may affect the image binarization results and further text recognition results. The solution proposed in this paper is related to a significant reduction in the computational burden, preventing the necessity of full text recognition. Conducting only the initial image binarization using various thresholding methods, the computation of the mutual similarities of binarization results is proposed, making it possible to build a simple model of binary image quality for a fast prediction of the OCR results’ quality. The experimental results provided in the paper obtained for the dataset of 1760 images, as well as the additional verification for a larger dataset, confirm the high correlation of the proposed quality model with text recognition results.

1. Introduction

The growing availability and popularity of mobile devices and embedded systems equipped with visual sensors increase the interest in onboard computations, as well as the development of computation methods and models useful for fast processing using limited hardware resources. Such limitations, related to memory amount and computational power, often hinder the real-time image analysis that may be important in scenarios where another image may be captured after changes in some camera parameters or its location. Some examples of such systems may be related to video-based navigation in mobile robotics, video inspection and diagnostics, and optical text recognition.
Images captured by cameras integrated with mobile devices are usually subject to various distortions, particularly considering their acquisition in unknown lighting conditions, including non-uniform illumination, presence of shadows, etc. Although in many applications related to object detection and classification, image segmentation, traffic monitoring, video surveillance, object recognition and tracking, etc., many such distortions may be efficiently eliminated or their influence is not critical, there are some areas where the analysis of natural images may be significantly influenced by them.
An obvious example may be a non-uniformly illuminated document image containing many small details—alphanumerical characters in such a case. Since a typical image preprocessing operation in Optical Character Recognition (OCR) systems is the binarization of input images, its results strongly depend on the presence of shadows and some other illumination issues. Application of the simplest global thresholding methods, such as Otsu [1], does not lead to satisfactory binary images in such cases, affecting not only the readability of some characters but often converting some parts of the image, even containing some characters, into solid black areas or a white background. In some cases, even the application of more advanced adaptive binarization methods does not lead to satisfactory results ensuring correct text recognition during further processing stages.
In some situations, users can capture another photo of a document image, but the problem lies in the relatively long time necessary for the OCR procedure, particularly if text recognition is applied as a cloud service with an additional transmission required. Therefore, a convenient solution would be the image quality assessment (IQA) conducted with a metric highly correlated with OCR accuracy, which might be calculated much faster than the execution time of the text recognition process. One of the possible solutions might be the application of no-reference (“blind”) IQA methods for input images in a similar way to the approach proposed for the fault-tolerant video-based OCR in the paper [2].
Nevertheless, the computation of such metrics for color or greyscale input images, although less demanding than the OCR procedure, is still much slower than similar calculations for binary images. Furthermore, the text recognition results depend on the binarization method [3,4,5] that is applied between image quality assessment of such greyscale or color images and the OCR procedure. Therefore, a more appropriate solution is the application of the binary image quality assessment for the selected binarization method. Unfortunately, the development of IQA methods for binary images is not as advanced as for greyscale or color images where a variety of full-reference (FR), reduced-reference (RR), and no-reference (NR) metrics [6] have been proposed during recent years.
Although some quality metrics have been proposed also for binary images [7,8,9,10], they are based on the comparison of a binary image with the “ground-truth” (reference) image. Such a full-reference approach cannot be directly applied for unknown images captured by a camera due to unavailability of reference images. Therefore, the idea proposed in this paper is based on the mutual comparison of the image binarization results using selected thresholding methods. It is assumed that a high similarity between two binary images occurs for two high-quality images rather than for low-quality binarization results. Therefore, such high similarities should be correlated with satisfactory OCR results. Nevertheless, an appropriate choice of the binary image quality metric used during these computations requires an additional verification using a dedicated image dataset containing various document images captured in non-uniform illumination subject to several binarization methods, discussed in the subsequent parts of this paper.

2. Proposed Approach and Its Verification

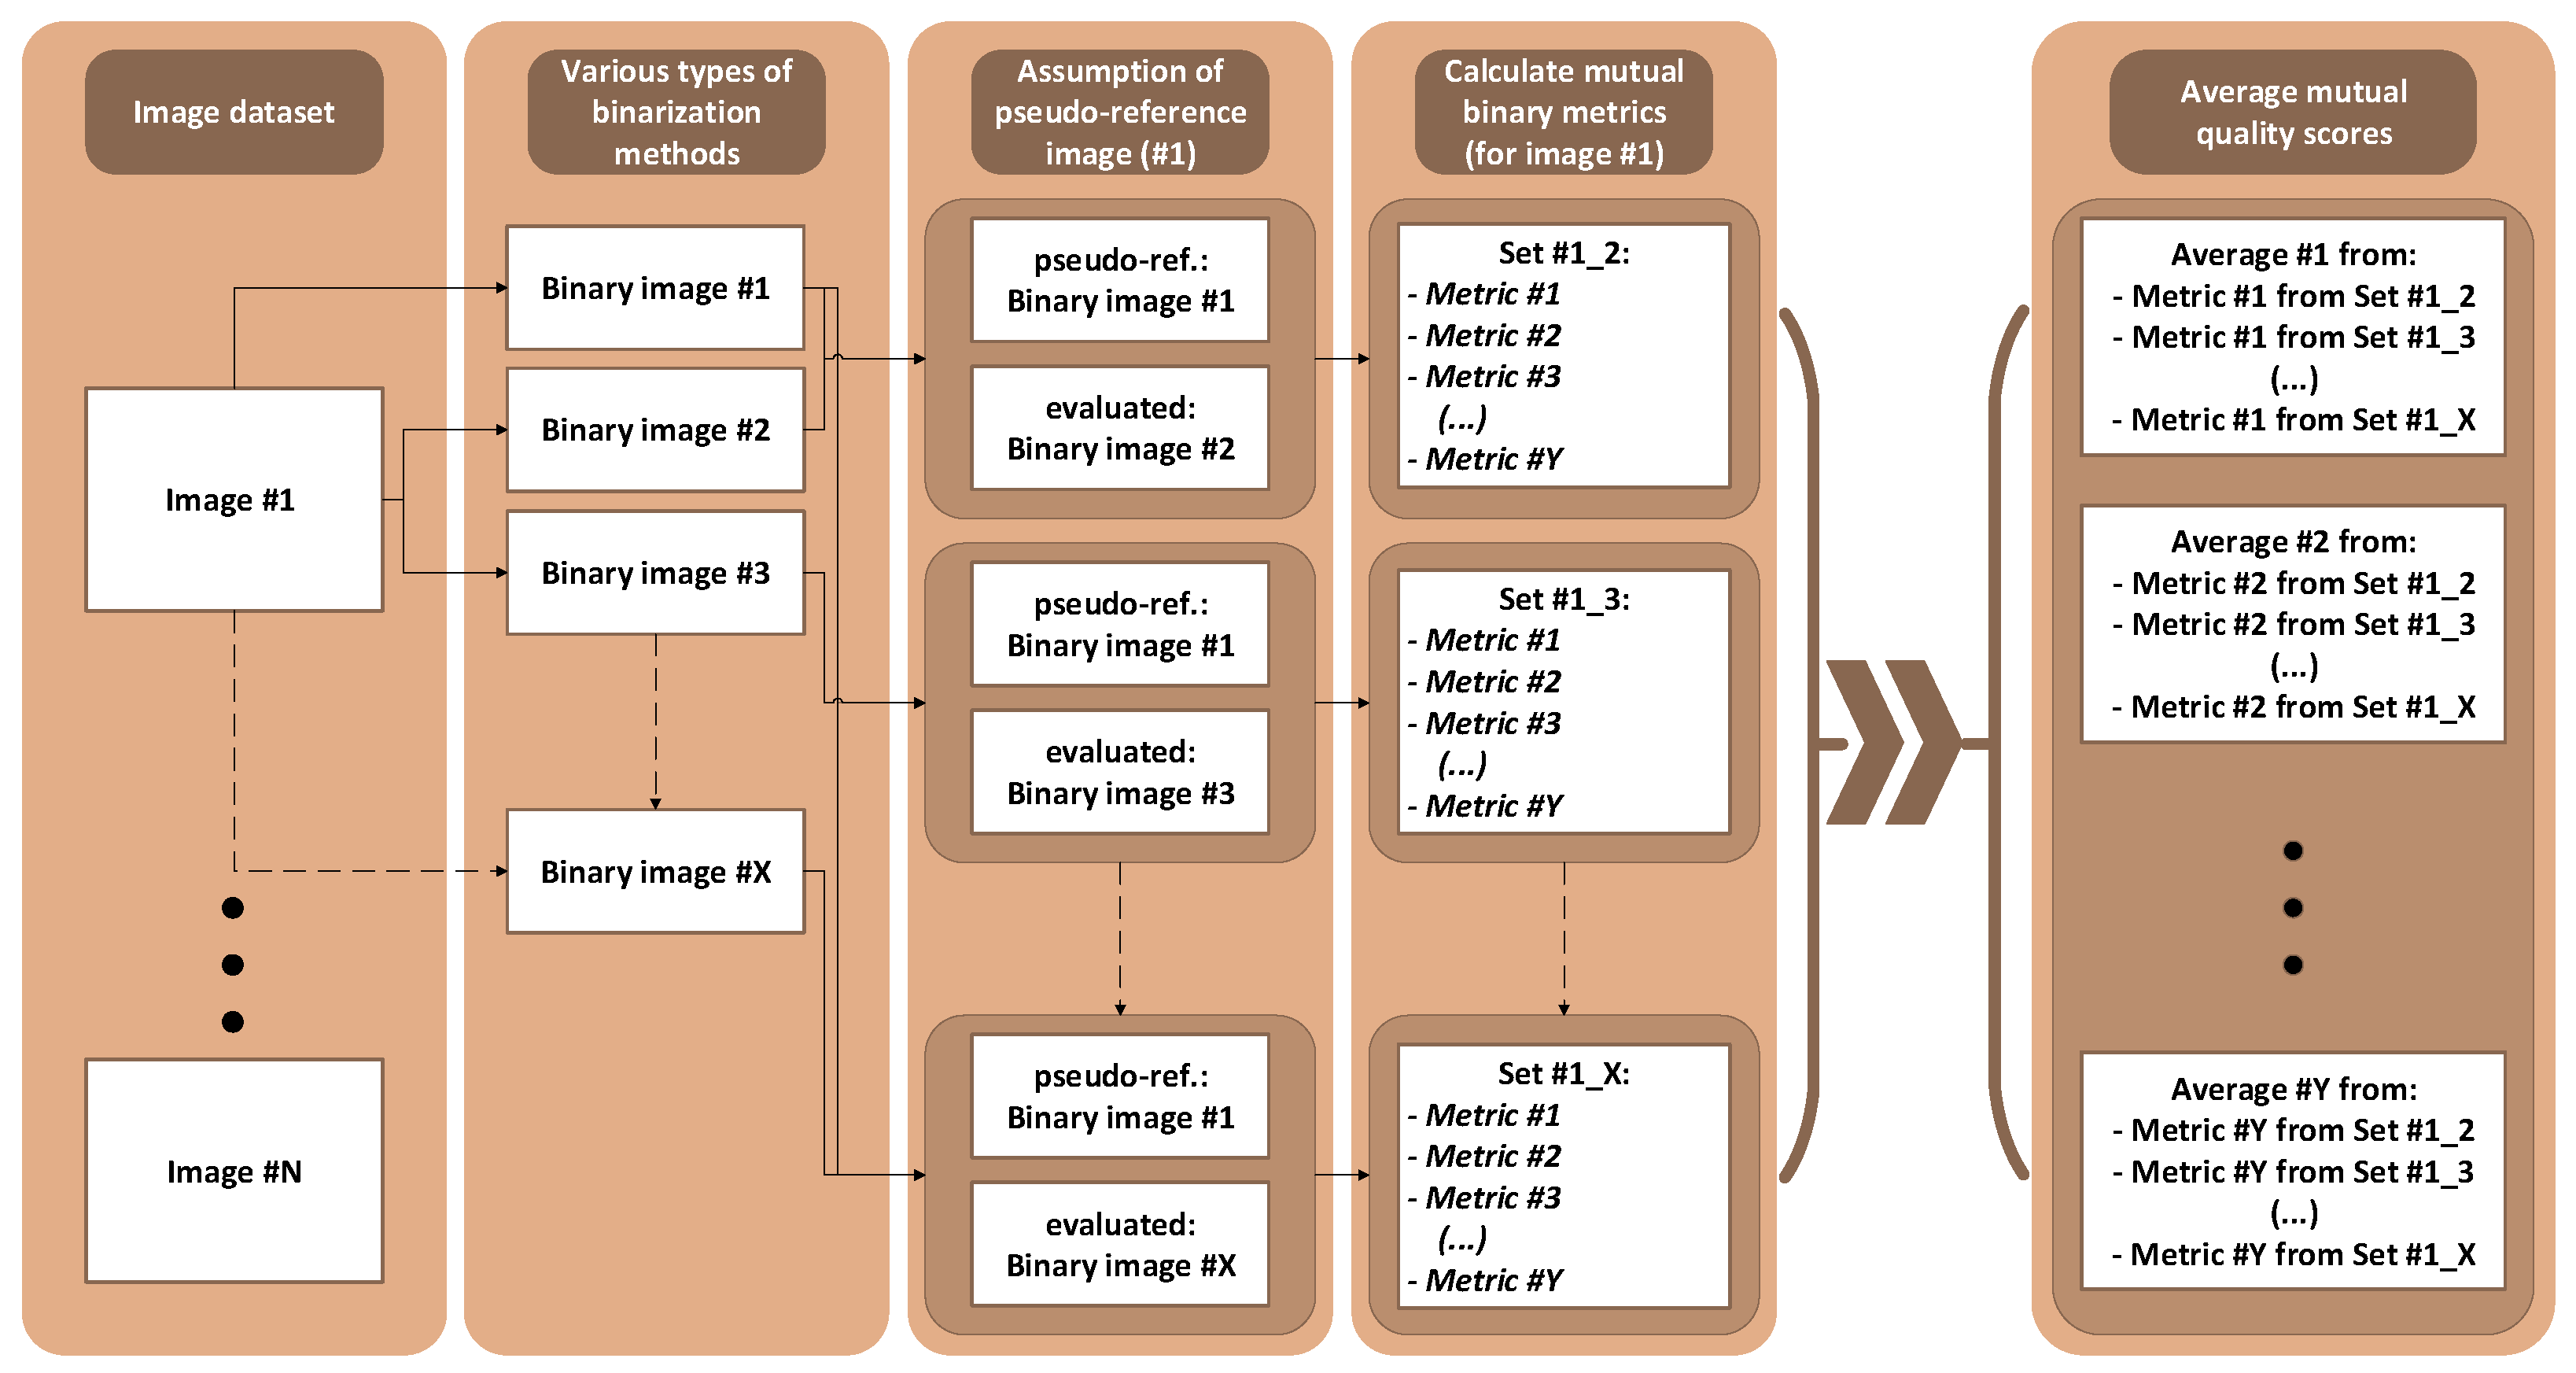
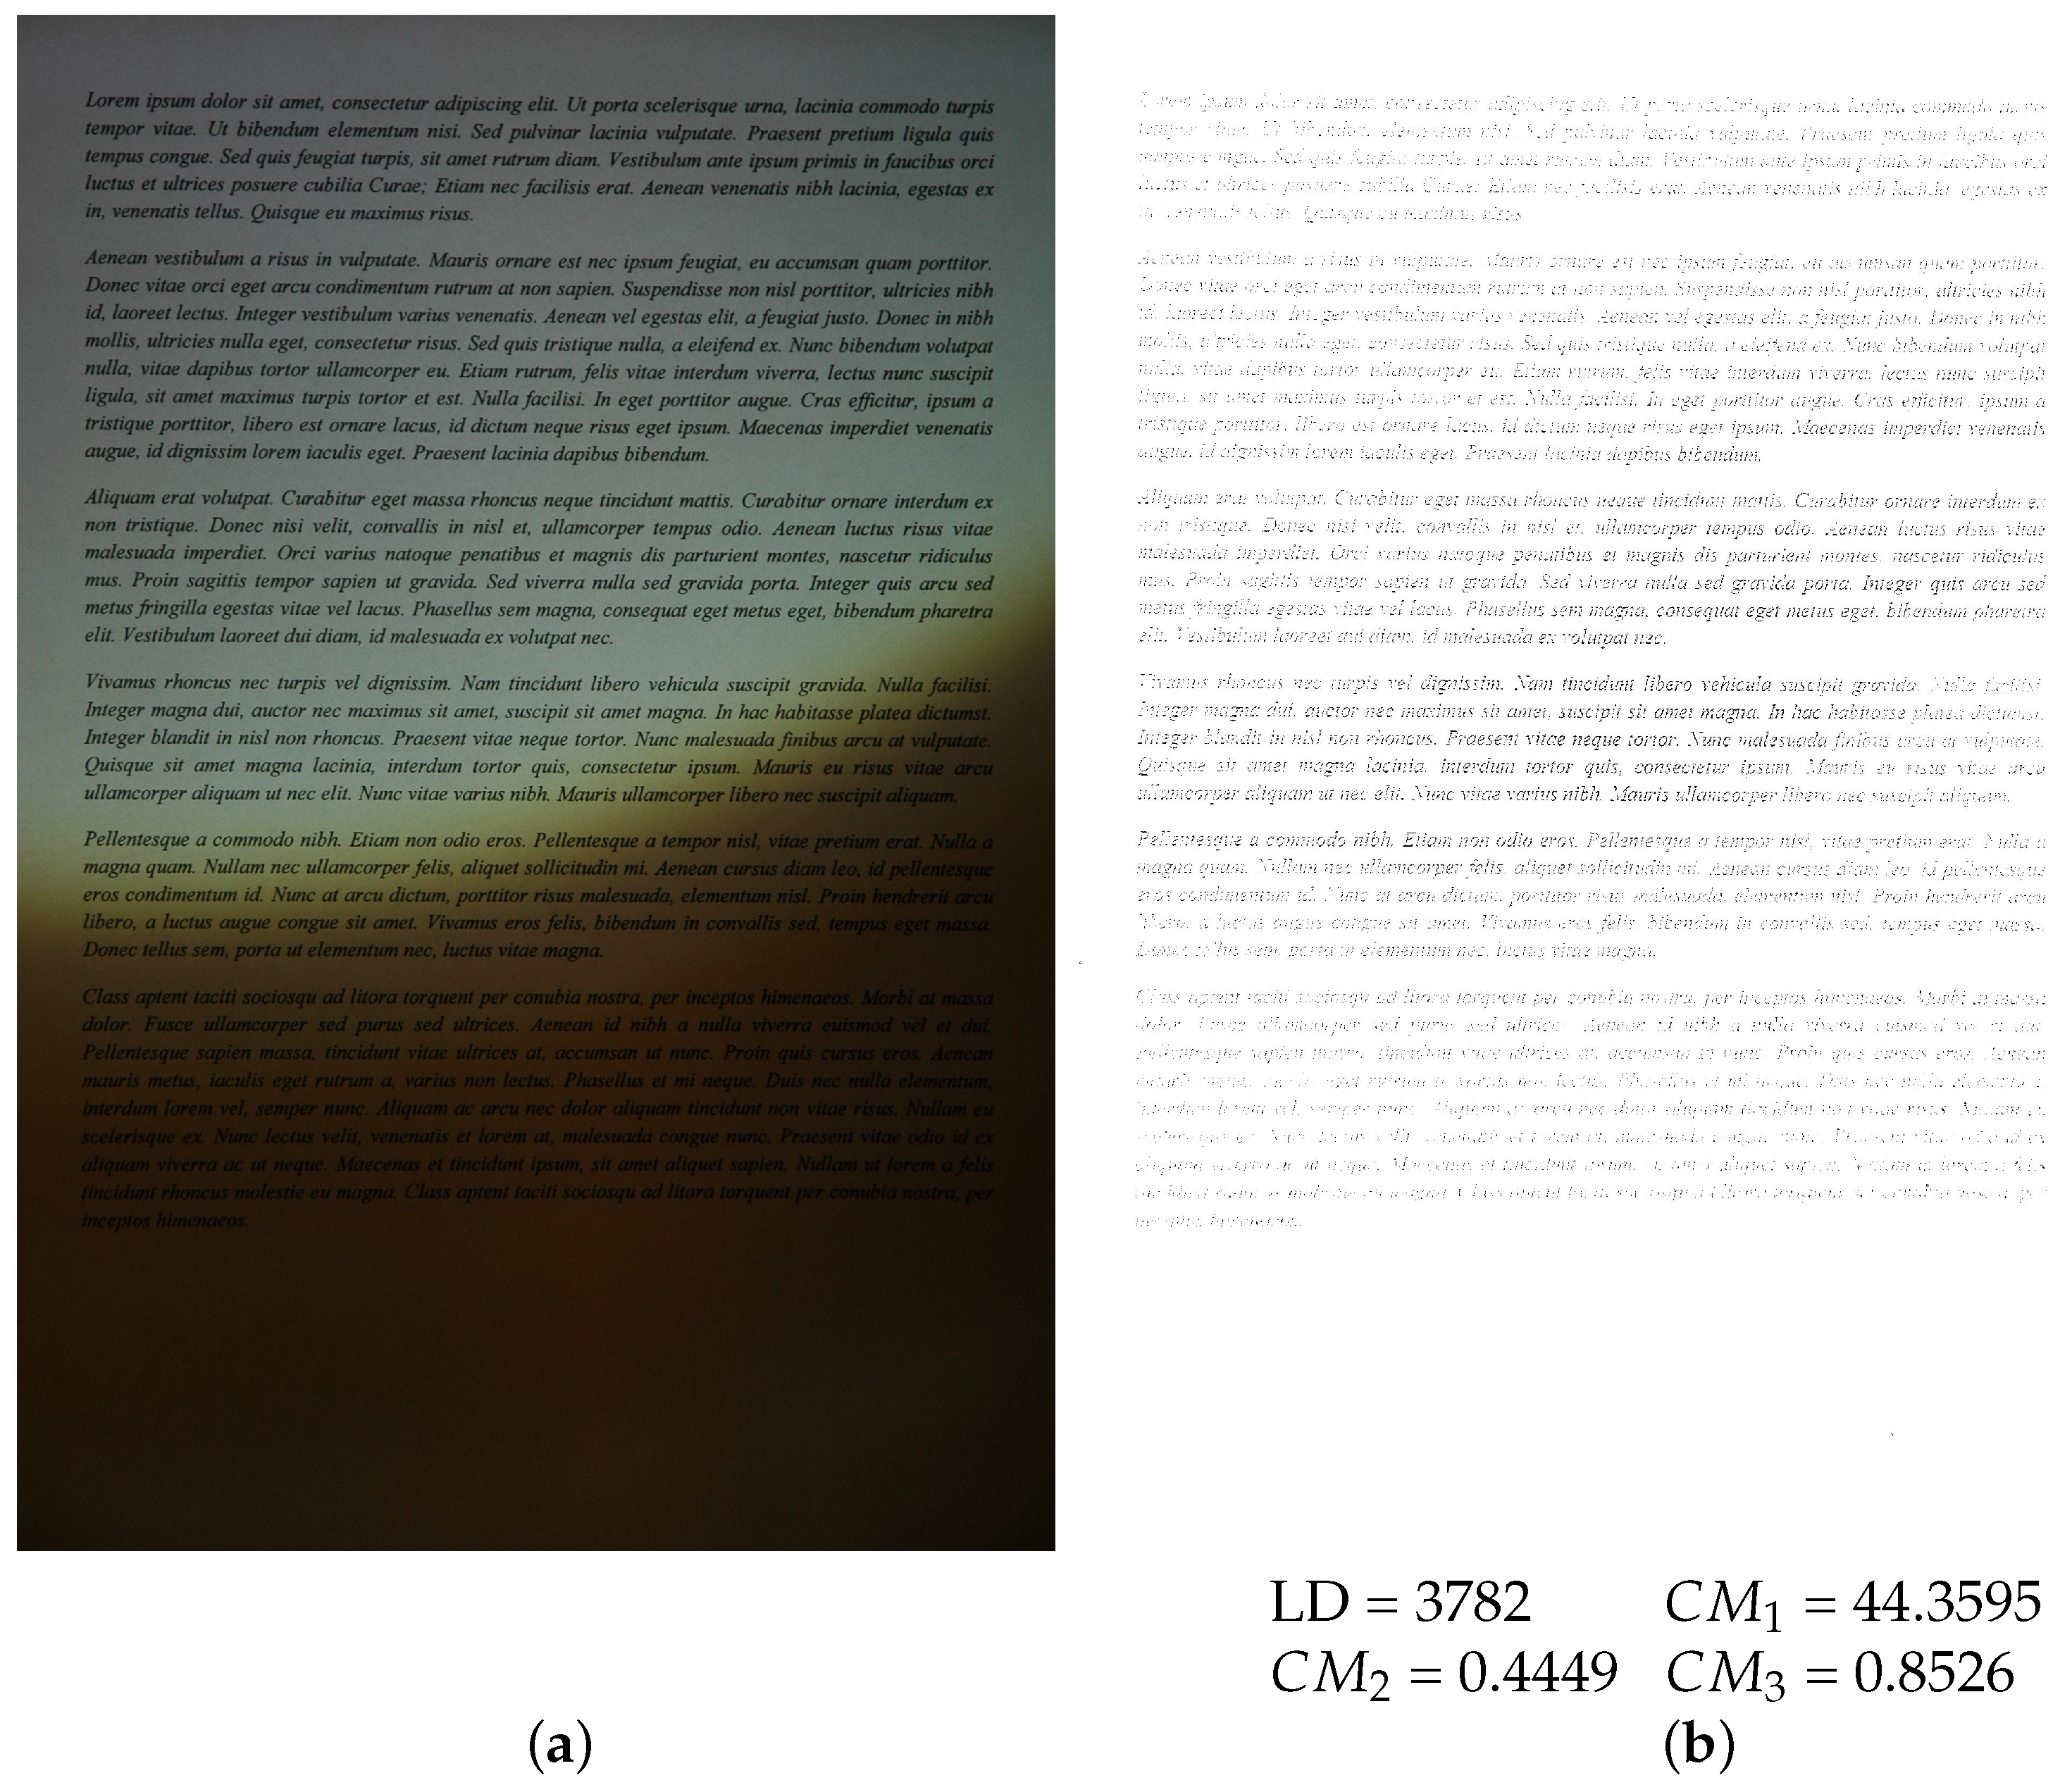
2.1. Mutual Similarity of Binary Images

The proposed idea of a fast prediction of the OCR results’ quality based on the application of binary image quality assessment makes it possible to significantly reduce the computational burden and prevent the text recognition for low quality images containing some areas with unreadable characters. It utilizes the mutual comparisons of binary images obtained using various thresholding methods; however, the comparisons may be conducted using various methods.
According to the assumptions related to the highest mutual similarity of high-quality binary images, the experimental verification of the idea has been conducted using the designated dataset based on the WEZUT OCR Dataset [11], which contains 176 non-uniformly illuminated document images with the commonly used placeholder text “Lorem ipsum”. The WEZUT OCR dataset is available at https://okarma.zut.edu.pl/?id=dataset (accessed on 12 October 2024). All images have been captured by a Digital Single-Lens Reflex (DSLR) camera Nikon N70 and their size is 2861 × 1965 or 2872 × 1940 pixels. This dataset has been extended using various image binarization algorithms, further applied instead of the default first step of the OCR algorithm. Finally, the dataset of binary images consisting of 1760 images has been created as a result of the application of the following adaptive image binarization methods: Bernsen [12], Bradley [13], Feng [14], Meanthresh, NICK [15], Niblack [16], Sauvola [17], and Wolf [18]. Additionally, two methods based on deep learning proposed by Liedes (the code is available at https://github.com/sliedes/binarize—accessed on 12 October 2024) and Masyagin (ROBIN—RObust document image BINarization tool—the code is available at https://github.com/masyagin1998/robin—accessed on 12 October 2024) have been used. Obviously, global image thresholding methods have not been applied due to their inadequacy for non-uniformly illuminated document images. The illustrations of some binarization results obtained for a representative sample image are presented in Figure 1, Figure 2, Figure 3 and Figure 4.
All 1760 images have been used as inputs for the open source Tesseract OCR engine (version 5.0.0) available at https://github.com/tesseract-ocr/tesseract (accessed on 12 October 2024), originally developed by Hewlett-Packard, further supported by Google, and currently evolving thanks to a group of developers led by Ray Smith. The OCR engine has been used without dictionary and language support to prevent their influence on the obtained results, replacing its default binarization with the individual methods mentioned above. The obtained text recognition results for each image have been compared with the “ground-truth” text provided in the WEZUT OCR Dataset and then the Levenshtein Distance (LD) between those two strings has been calculated. The computation of the classical Levenshtein Distance, also known as edit distance, is based on the counting of the number of simple edits necessary to convert one string into another. The operations considered as simple edits are character insertion, deletion, and substitution.
Since the WEZUT OCR Dataset contains photos of the documents printed using five different popular font shapes (Arial, Times New Roman, Calibri, Courier, and Verdana) with some typical modifications of attributes (normal, bold and italic versions of all fonts, as well as bold italics), each of the 1760 images obtained after thresholding has been compared with their equivalents obtained from the same source image using the other binarization methods. Finally, the nine similarity values have been averaged, leading to an aggregated mutual quality index. Then, the Pearson’s linear correlation coefficient values between them and the Levenshtein Distances computed for the same image have been determined to verify the appropriateness and usefulness of each image quality/similarity metric for the prediction of the quality of OCR results. Obviously, as it may be noticed in Figure 1, Figure 2, Figure 3 and Figure 4, some binarization methods have caused the loss of data and some characters are impossible to recognize.
During the experiments, some classical metrics based on the confusion matrix, typically used for the evaluation of binarization methods, as well as for performance metrics for pattern recognition or classification purposes, have been used, mainly due to their fast computation. The most widely known such metrics include Precision (defined as the ratio of true positives to all predicted positives) and Recall/Sensitivity (ratio of true positives to all actual positives), where black pixels representing the foreground information are considered positives and white background pixels negatives. The other metrics, based on similar computations, are F-Measure (harmonic mean of Precision and Recall), Accuracy (ratio of the sum of all true positives and true negatives to all pixels), pseudo-Precision, pseudo-Recall, pseudo-F-Measure, and Specificity [19], as well as the less popular Peak Signal-to-Noise Ratio (PSNR), Balanced Classification Rate (BCR), S-F-Measure, and Geometric Accuracy.
Nevertheless, the evaluation of image binarization results may also be conducted using some other approaches considered in this paper. The first interesting idea is the application of the Border Distance proposed by Zhang et al. [10]. This method is based on the assumption that the Border Distance of the modified pixels plays an important role in the binary image quality evaluation and the larger distances are related to worse image quality due to their larger influence. Since the distance may be defined in various ways, three approaches are considered based on the chessboard, city block, and Euclidean distances, leading to three types of the BDPSNR metric.
Another approach to binary image quality evaluation is the application of the Distance Reciprocal Distortion (DRD) metric [7]. This metric also utilizes the observation that the quality perception of document images is dependent on the distance between two pixels. Therefore, it is assumed that the influence of the horizontal and vertical neighbors is higher than the diagonal ones. All pixels differing between two compared images are then weighted by the reciprocal of a distance to the central pixel using the 5 × 5 pixel weighting matrix. Then, the local DRD values are computed for the neighborhoods of the flipped pixels, further aggregated, and divided by the number of 8 × 8 pixel blocks containing at least two differing pixels in the reference image (fully white and fully black blocks are excluded).
The last considered binary IQA metric is the Misclassification Penalty Metric (MPM), proposed in the paper [8], based on the idea of the penalization of the misclassified pixels depending on distances from the border of the reference objects. After the division of the obtained result by the sum of all pixel-to-contour distances in the image, the normalized value of the metric is obtained.
The approach proposed in the paper is based on the application of several of the above metrics for the calculation of mutual similarities between pairs of binary images obtained from the same color or greyscale input image. Since most of the considered thresholding methods belong to the family of adaptive binarization algorithms, one may expect quite similar results obtained even for non-uniformly illuminated images. Therefore, it is proposed to calculate mutual similarity values pairwise for each combination of two binary images originating from the same input image applying the selected metrics. The most appropriate binarization methods should not produce images strongly differing from the results obtained using the other thresholding algorithms; hence, the final OCR result’s quality should also be better than that achieved using the other binarization methods.
Since no-reference quality metrics for binary images are not known and the binary image quality assessment is based on the comparison with ground-truth images, it is proposed to determine the mutual similarities assuming that one of the binary images is considered a pseudo-reference image. The average mutual similarity values obtained as the results of such comparisons with images obtained the other binarization methods are saved as the final metrics separately for each of the considered elementary metrics. The illustration of this idea is presented in the form of a simplified flowchart in Figure 5.
The first stage of the experimental verification of the proposed idea has been related to the calculation of the correlation values for each of the above discussed metrics, applied for the computations of the aggregated mutual similarity and the Levenshtein Distances obtained for each of the 1760 images.

2.2. Combined Metrics and Discussion of Results

The experimental results presented as the correlations of individual metrics used for the computation of aggregated mutual similarities with Levenshtein Distances obtained for all 1760 images are shown in Table 1. As it may be noticed, for some of the metrics, correlation values are very small, and therefore they cannot be considered useful for predicting the quality of final OCR results. The best results have been obtained for F-Measure and pseudo-F-Measure; hence, these two metrics are the most appropriate for the analyzed application.
Considering the encouraging results obtained by the combination of metrics presented in some earlier papers, including their application to binary images [20], the next conducted experiments have been related to the validation of the combination of the two abovementioned “best” metrics. The first model is defined as the weighted product of two metrics:
C M 1 = i = 1 2 Q i w i = ( F Measure ) w 1 · ( pseudo F Measure ) w 2 ,
where Q i are the averaged mutual similarities obtained using the individual metrics being combined and w i are their weights obtained as the result of optimization using MATLAB’s (version R2024a) fminsearch function.
The second considered model is defined as the weighted sum of two individual metrics, also used as the averaged mutual similarities:
C M 2 = i = 1 2 a i · Q i w i = a 1 · ( F Measure ) w 1 + a 2 · ( pseudo F Measure ) w 2 .
The main motivation of the use of the above defined combined metrics originates from the application of a similar approach for natural images for which a significant increase in the correlation between the objective and subjective quality scores has been reported. Some initial experiments have been conducted for the nonlinear combination of three metrics, MS-SSIM, VIF, and R-SVD, further changed into the combination of MS-SSIM, VIF, and FSIMc, leading to CISI metric [21], which is highly correlated with the subjective quality scores available in image quality assessment (IQA) datasets.
Further extensions and applications of this approach for many various types of images, including binary images [20], remote sensing, or stitched images, fully confirmed the validity of this approach. A similar approach has also been applied by Netflix researchers in their Video Multi-Method Assessment Fusion (VMAF) metric [22]. Particularly interesting results have been obtained applying the combined metric based on the weighted sum, according to Formula (2), for multiply distorted images, proposed in the paper [23]. Although some attempts at the use of neural networks for designing the combined metrics have also been made [24], leading to comparable performance, the use of simpler combinations is more convenient for the considered application.
As it may be seen in Table 2, the combination of two metrics has led to a noticeable improvement in correlation between the obtained IQA values and Levenshtein Distances, particularly for the weighted sum denoted as C M 2 . Further experiments related to the additional use of the third metric in both combinations have not led to significant improvements of the computed PLCC values, including the use of neural networks, as well as the extension of the proposed approach for video sequences. Additionally, a simple combination of the abovementioned two models, leading to the combined metric C M 3 , has also been considered, which may be expressed in the following form:
C M 3 = a 1 · Q 1 w 1 + a 2 · Q 2 w 2 + a 3 · Q 1 w 3 · Q 2 w 4 ,
where Q 1 is the F-Measure and Q 2 is the pseudo-F-Measure in this case. Nevertheless, its application has led to a small improvement of the achieved correlation to 0.9085, as shown in Table 2.
To illustrate the properties of the proposed combined metrics based on the averaged mutual similarities of binary images, a sample image from the WEZUT OCR Dataset and its three binary versions are presented in Figure 6, together with the values of three combined metrics and the respective values of the Levenshtein Distance. The relations between the visual quality of the binary images, Levenshtein Distance values, and the results obtained using the three proposed combined metrics may be easily noticed. The best results among three presented methods may be observed for the NICK thresholding.

3. Additional Experiments

To verify the universality and usefulness of the proposed approach, some additional experiments were performed for a larger dataset of images, being the results of application of 12 binarization methods for the document images captured by mobile phone cameras. The algorithms selected during these experiments were Otsu [1], Bernsen [12], Niblack [16], Sauvola [17], Wolf [18], Gatos [25], NICK [15], Baitaneh [26], Singh [27], Su [28], WAN [29], and ISauvola [30].
As the source data (nearly 13 GB) for the binarization algorithms, the images from the SmartDoc-QA dataset available at https://zenodo.org/records/5293201 (accessed on 12 October 2024) were chosen due to the presence of several single and multiple distortions [31]. The SmartDoc-QA dataset contains two subsets with 2130 images of 30 documents each, captured using Nokia and Samsung smartphones, respectively, under varying conditions (subject to motion blur, out-of-focus blur, differing light conditions, and perspective angles), together with ground-truth data containing text transcriptions (the expected OCR results). The three types of documents present in the dataset consist of contemporary documents, old administrative documents, and shop receipts (10 samples per type). Both subsets have different size of images: 3264 × 2448 pixels for Nokia and 4128 × 3096 pixels for Samsung.
For the verification of the proposed approach, all images from the SmartDoc-QA dataset were binarized using the 12 abovementioned algorithms, and mutual comparisons were conducted similar to the WEZUT Dataset used in previous experiments. Nevertheless, since most of the images contain relatively large background areas that produce solid white or black fragments of binary images, depending on the individual thresholding method, one cannot expect as high mutual similarities as for the WEZUT Dataset containing document images without large background areas. An illustration of this phenomenon is presented in Figure 7, where the sample image from the SmartDoc-QA dataset is shown together with its results of binarization using three various methods. The easily noticeable differences in the background areas of the binary images are the main reason for the decreased correlations between the results of the binary image quality assessment and the Levenshtein Distance for this extended dataset.
Furthermore, to verify the universality of the proposed approach, apart from the Tesseract engine, the other OCR software implemented in Python by JaidedAI, known as EasyOCR (version 1.7.2), was used. Its code is available on GitHub at https://github.com/JaidedAI/EasyOCR (accessed on 12 October 2024). Therefore, the binary IQA metrics were computed mutually for each binarization algorithm and the 11 others, and then their correlations with the Levenshtein Distances (LD) obtained after applying the Tesseract and EasyOCR engines independently were determined. Finally, the results achieved for various binarization methods were averaged, leading to 2130 average correlation coefficients for each of two subsets (Nokia and Samsung) between the IQA metric and the LD values calculated separately for two OCR engines. The correlations obtained for individual metrics are presented in Table 3, where the highest values may be observed for F-Measure and pseudo-F-Measure, similar to previous experiments conducted for the WEZUT Dataset.
Having confirmed the appropriateness of the choice of elementary metrics, the last step of the verification of the proposed approach concerned the calculation of the combined metrics based on the F-Measure and pseudo-F-Measure for the extended dataset of 4260 binary images originating from the SmartDoc-QA database. The obtained values of the averaged PLCC obtained for all three considered metrics are presented in Table 4 separately for the Tesseract and EasyOCR engines, as well as for the Nokia and Samsung subsets.
Comparing the best results achieved for the elementary metrics marked with bold fonts in Table 3 to the results reported in Table 4, the increase in the Pearson’s correlations with the Levenshtein Distances may be observed, similar to the WEZUT OCR Dataset. This observation confirms the validity of the proposed approach, also using some other binarization methods for a more demanding database.

4. Conclusions and Further Research

The proposed method for predicting the quality of OCR results, based on the application of image quality assessment of binary images as the aggregated mutual similarity indexes makes it possible to prevent the necessity of time-consuming text recognition, particularly for low-quality images. Due to a much faster execution of adaptive binarization, which may be efficiently executed in parallel also using integral images to speed up the computations, such as, e.g., in the Bradley method [13], after additional quality assessment of the results, mobile device users may obtain the information about the necessity for the acquisition of another image. Since some OCR engines work as cloud services, there is no necessity of sending various binary versions of the input image to the cloud using the proposed approach. In this case, the transmission time may be considered as an additional constraint, dependent on the network properties. The proposed preprocessing may be useful, particularly for devices where the execution of the OCR engine would be troublesome, e.g., due to memory limitations. The main assumption is the most appropriate preprocessing of the input image before a single run of the OCR engine leading to the best possible text recognition results.
The experimental verification of various binary IQA methods confirmed the usefulness of the F-Measure and pseudo-F-Measure for this purpose, as well as the advantages of their nonlinear combinations, leading to the linear correlation between the proposed combined aggregated mutual similarity and Levenshtein Distances of nearly 0.91 for the WEZUT Dataset. Noticeably smaller correlation values observed during the additional verification for the larger dataset are caused by the presence of some differences in the binarization of background areas using individual thresholding methods. Since most of the metrics are based on the mutual comparison of pixels, these differences influence the binary image quality assessment results regardless of the final OCR effects, decreasing the overall correlation of the binary IQA and the OCR results. Nevertheless, these experiments fully confirmed the choice of elementary metrics, as well as the validity and usefulness of the proposed approach. During further research, it is planned to develop even better models utilizing the combination of metrics also for short video sequences.

Author Contributions

Conceptualization, M.K. and K.O.; methodology, M.K. and K.O.; software, M.K., P.L. and K.O.; validation, M.K. and K.O.; formal analysis, M.K. and K.O.; investigation, M.K. and K.O.; resources, M.K., P.L. and K.O.; data curation, M.K., P.L. and K.O.; writing—original draft preparation, M.K. and K.O.; writing—review and editing, K.O.; visualization, M.K. and K.O.; supervision, K.O.; project administration, K.O.; funding acquisition, K.O. All authors have read and agreed to the published version of the manuscript.

Funding

This research received no external funding.

Institutional Review Board Statement

Not applicable.

Informed Consent Statement

Not applicable.

Data Availability Statement

The data presented in this study are available on request from the corresponding author due to the use of external datasets as the input data for creating an extended dataset.

Conflicts of Interest

The authors declare no conflicts of interest. The funders had no role in the design of the study; in the collection, analyses, or interpretation of data; in the writing of the manuscript; or in the decision to publish the results.

Abbreviations

The following abbreviations are used in this manuscript:
BCRBalanced Classification Rate
BDPSNRBorder Distance Peak Signal-to-Noise Ratio
CISICombined Image Similarity Index
CMCombined Metric
DRDDistance Reciprocal Distortion
FRFull Reference (metric)
FSIMFeature Similarity
IQAImage Quality Assessment
LDLevenshtein Distance
MPMMisclassification Penalty Metric
MS-SSIMMulti-Scale Structural Similarity
NRNo Reference (metric)
OCROptical Character Recognition
PSNRPeak Signal-to-Noise Ratio
RRReduced Reference (metric)
R-SVDReferee Matrix Singular Value Decomposition
VIFVisual Information Fidelity
VMAFVideo Multi-Method Assessment Fusion

References

  1. Otsu, N. A Threshold Selection Method from Gray-Level Histograms. IEEE Trans. Syst. Man Cybern. 1979, 9, 62–66. [Google Scholar] [CrossRef]
  2. Okarma, K.; Lech, P. A method supporting fault-tolerant optical text recognition from video sequences recorded with handheld cameras. Eng. Appl. Artif. Intell. 2023, 123, 106330. [Google Scholar] [CrossRef]
  3. Ho, J.; Liu, M. Research on Document Image Binarization: A Survey. In Proceedings of the 2024 IEEE 7th International Conference on Electronic Information and Communication Technology (ICEICT), Xi’an, China, 31 July–2 August 2024; pp. 457–462. [Google Scholar] [CrossRef]
  4. Polyakova, M.V.; Nesteryuk, A.G. Improvement of the color text image binarization method using the minimum-distance classifier. Appl. Asp. Inf. Technol. 2021, 4, 57–70. [Google Scholar] [CrossRef]
  5. Yang, Z.; Zuo, S.; Zhou, Y.; He, J.; Shi, J. A Review of Document Binarization: Main Techniques, New Challenges, and Trends. Electronics 2024, 13, 1394. [Google Scholar] [CrossRef]
  6. Kamble, V.; Bhurchandi, K. No-reference image quality assessment algorithms: A survey. Optik 2015, 126, 1090–1097. [Google Scholar] [CrossRef]
  7. Lu, H.; Kot, A.; Shi, Y. Distance-Reciprocal Distortion Measure for Binary Document Images. IEEE Signal Process. Lett. 2004, 11, 228–231. [Google Scholar] [CrossRef]
  8. Young, D.; Ferryman, J. PETS Metrics: On-Line Performance Evaluation Service. In Proceedings of the 2005 IEEE International Workshop on Visual Surveillance and Performance Evaluation of Tracking and Surveillance, Beijing, China, 15–16 October 2005; pp. 317–324. [Google Scholar] [CrossRef]
  9. Zhai, Y.; Neuhoff, D.L. Similarity of Scenic Bilevel Images. IEEE Trans. Image Process. 2016, 25, 5063–5076. [Google Scholar] [CrossRef]
  10. Zhang, F.; Cao, K.; Zhang, J.L. A simple quality evaluation method of binary images based on Border Distance. Optik 2011, 122, 1236–1239. [Google Scholar] [CrossRef]
  11. Michalak, H.; Okarma, K. Robust Combined Binarization Method of Non-Uniformly Illuminated Document Images for Alphanumerical Character Recognition. Sensors 2020, 20, 2914. [Google Scholar] [CrossRef]
  12. Bernsen, J. Dynamic Thresholding of Gray Level Image. In Proceedings of the ICPR’86 Proceedings of International Conference on Pattern Recognition, Paris, France, 27–31 October 1986; pp. 1251–1255. [Google Scholar]
  13. Bradley, D.; Roth, G. Adaptive Thresholding using the Integral Image. J. Graph. Tools 2007, 12, 13–21. [Google Scholar] [CrossRef]
  14. Feng, M.L.; Tan, Y.P. Contrast adaptive binarization of low quality document images. IEICE Electron. Express 2004, 1, 501–506. [Google Scholar] [CrossRef]
  15. Khurshid, K.; Siddiqi, I.; Faure, C.; Vincent, N. Comparison of Niblack inspired binarization methods for ancient documents. In Document Recognition and Retrieval XVI; SPIE: Bellingham, WA, USA, 2009; Volume 7247, p. 72470U. [Google Scholar] [CrossRef]
  16. Niblack, W. An Introduction to Digital Image Processing; Prentice-Hall, Inc.: Upper Saddle River, NJ, USA, 1990. [Google Scholar]
  17. Sauvola, J.; Pietikäinen, M. Adaptive document image binarization. Pattern Recognit. 2000, 33, 225–236. [Google Scholar] [CrossRef]
  18. Wolf, C.; Jolion, J.M. Extraction and recognition of artificial text in multimedia documents. Form. Pattern Anal. Appl. 2004, 6. [Google Scholar] [CrossRef]
  19. Ntirogiannis, K.; Gatos, B.; Pratikakis, I. Performance Evaluation Methodology for Historical Document Image Binarization. IEEE Trans. Image Process. 2013, 22, 595–609. [Google Scholar] [CrossRef] [PubMed]
  20. Okarma, K.; Kopytek, M. A Hybrid Method for Objective Quality Assessment of Binary Images. IEEE Access 2023, 11, 63388–63397. [Google Scholar] [CrossRef]
  21. Okarma, K. Combined image similarity index. Opt. Rev. 2012, 19, 349–354. [Google Scholar] [CrossRef]
  22. Rassool, R. VMAF reproducibility: Validating a perceptual practical video quality metric. In Proceedings of the 2017 IEEE International Symposium on Broadband Multimedia Systems and Broadcasting (BMSB), Cagliari, Italy, 7–9 June 2017. [Google Scholar] [CrossRef]
  23. Okarma, K.; Lech, P.; Lukin, V.V. Combined Full-Reference Image Quality Metrics for Objective Assessment of Multiply Distorted Images. Electronics 2021, 10, 2256. [Google Scholar] [CrossRef]
  24. Lukin, V.V.; Ponomarenko, N.N.; Ieremeiev, O.I.; Egiazarian, K.O.; Astola, J. Combining full-reference image visual quality metrics by neural network. In Human Vision and Electronic Imaging XX; Rogowitz, B.E., Pappas, T.N., de Ridder, H., Eds.; SPIE: Bellingham, WA, USA, 2015; Volume 9394, p. 93940K. [Google Scholar] [CrossRef]
  25. Gatos, B.; Pratikakis, I.; Perantonis, S. Adaptive degraded document image binarization. Pattern Recognit. 2006, 39, 317–327. [Google Scholar] [CrossRef]
  26. Bataineh, B.; Abdullah, S.N.H.S.; Omar, K. An adaptive local binarization method for document images based on a novel thresholding method and dynamic windows. Pattern Recognit. Lett. 2011, 32, 1805–1813. [Google Scholar] [CrossRef]
  27. Singh, T.R.; Roy, S.; Singh, O.I.; Sinam, T.; Singh, K.M. A New Local Adaptive Thresholding Technique in Binarization. IJCSI Int. J. Comput. Sci. Issues 2011, 8, 271–277. [Google Scholar]
  28. Su, B.; Lu, S.; Tan, C.L. Robust document image binarization technique for degraded document images. IEEE Trans. Image Process. 2013, 22, 1408–1417. [Google Scholar] [CrossRef] [PubMed]
  29. Mustafa, W.A.; Abdul Kader, M.M.M. Binarization of Document Image Using Optimum Threshold Modification. J. Phys. Conf. Ser. 2018, 1019, 012022. [Google Scholar] [CrossRef]
  30. Hadjadj, Z.; Meziane, A.; Cherfa, Y.; Cheriet, M.; Setitra, I. ISauvola: Improved Sauvola’s Algorithm for Document Image Binarization. In Image Analysis and Recognition; Campilho, A., Karray, F., Eds.; Springer International Publishing: Cham, Switzerland, 2016; Volume 9730, LNCS; pp. 737–745. [Google Scholar] [CrossRef]
  31. Nayef, N.; Luqman, M.M.; Prum, S.; Eskenazi, S.; Chazalon, J.; Ogier, J.M. SmartDoc-QA: A dataset for quality assessment of smartphone captured document images - single and multiple distortions. In Proceedings of the 2015 13th International Conference on Document Analysis and Recognition (ICDAR). Institute of Electrical and Electronics Engineers (IEEE), Tunis, Tunisia, 23–26 August 2015. [Google Scholar] [CrossRef]
Figure 1. A sample image from the WEZUT OCR database and its selected binarized versions.
Applsci 14 10275 g001
Figure 2. Some other binarized versions obtained for a sample image from the WEZUT OCR database presented in Figure 1.
Applsci 14 10275 g002
Figure 3. A sample image from the WEZUT OCR database and its selected binarized versions.
Applsci 14 10275 g003
Figure 4. Some other binarized versions obtained for a sample image from the WEZUT OCR database presented in Figure 3.
Applsci 14 10275 g004
Figure 5. Illustration of the idea of calculation of mutual similarities for binary images.
Applsci 14 10275 g005
Figure 6. A sample image from the WEZUT OCR Dataset: original image (a), after Sauvola binarization (b), after Feng binarization (c), and after NICK binarization (d), together with respective values of three combined metrics and Levenshtein Distances.
Applsci 14 10275 g006aApplsci 14 10275 g006b
Figure 7. A sample image from the SmartDoc-QA database and its selected binarized versions.
Applsci 14 10275 g007
Table 1. Pearson’s linear correlation coefficient (PLCC) of individual IQA metrics with the Levenshtein Distance for the considered 1760 images. The two best results are marked with bold font.
Quality MetricPLCC for Tesseract
Precision0.5594
Recall/Sensitivity0.1003
F-Measure0.8460
Pseudo-Precision0.5972
Pseudo-Recall0.1127
Pseudo-F-Measure0.8810
Specificity0.2957
Balanced Classification Rate (BCR)0.1397
S-F-Measure0.2019
Accuracy0.2590
Geometric Accuracy0.2165
Peak Signal-to-Noise Ratio (PSNR)0.2543
Border Distance (chessboard) [10]0.2939
Border Distance (city block) [10]0.2805
Border Distance (Euclidean) [10]0.2932
Distance Reciprocal Distortion (DRD) [7]0.3662
Misclassification Penalty Metric (MPM) [8] 0.1928
Table 2. Pearson’s linear correlation coefficient (PLCC) values of two combined IQA metrics with the Levenshtein Distance for the considered 1760 images together with the optimized weights for the combined metrics.
MetricPLCC a 1 a 2 a 3 w 1 w 2 w 3 w 4
CM10.8960 0.9643 2.3779
CM20.9077 0.9098 0.0537 0.7213 0.6592
CM30.9085 1.1595 0.9666 1.1790 1.0414 0.1376 1.0231 0.0157
Table 3. Averaged Pearson’s linear correlation coefficients (PLCC) of individual IQA metrics with the Levenshtein Distance for the considered images from the SmartDoc-QA subsets. The highest values in each column are marked with bold font.
OCR EngineTesseractEasyOCR
Quality MetricNokiaSamsungNokiaSamsung
Precision0.22750.29660.26970.3151
Recall/Sensitivity0.35390.32860.41110.4385
F-Measure0.48110.45690.54800.5490
Pseudo-Precision0.35710.15850.38140.1935
Pseudo-Recall0.22930.29140.27190.3922
Pseudo-F-Measure0.45230.48650.51700.5756
Specificity0.34020.43430.36340.4932
Balanced Classification Rate (BCR)0.38290.28320.44760.3857
S-F-Measure0.42720.38290.48350.4832
Accuracy0.47890.37290.50730.4021
Geometric Accuracy0.41690.38070.47370.4761
Peak Signal-to-Noise Ratio (PSNR)0.23360.36030.25800.3559
Border Distance (chessboard) [10]0.21290.32530.23860.3191
Border Distance (city-block) [10]0.21300.32730.23950.3197
Border Distance (Euclidean) [10]0.21340.32540.23910.3190
Distance Reciprocal Distortion (DRD) [7]0.45360.35340.48780.3782
Misclassification Penalty Metric (MPM) [8] 0.06550.14530.07480.1264
Table 4. Averaged Pearson’s linear correlation coefficients (PLCCs) of the combined metrics with the Levenshtein Distance for the considered images from the SmartDoc-QA subsets.
OCR EngineTesseractEasyOCR
Quality MetricNokiaSamsungNokiaSamsung
C M 1 0.48390.50020.55690.6002
C M 2 0.48550.50030.56690.5996
C M 3 0.48920.50050.57340.6037
Disclaimer/Publisher’s Note: The statements, opinions and data contained in all publications are solely those of the individual author(s) and contributor(s) and not of MDPI and/or the editor(s). MDPI and/or the editor(s) disclaim responsibility for any injury to people or property resulting from any ideas, methods, instructions or products referred to in the content.

