Abstract
Xerostomia, commonly known as dry mouth, is characterized by reduced salivary secretion, which can lead to various oral health issues and discomfort. In this paper, we propose a novel, non-invasive method for predicting xerostomia through the analysis of tongue images. To predict salivary gland secretion from tongue images, we collected images from patients who visited the hospital with complaints of dry mouth and measured their saliva secretion. Features were extracted from these tongue images, and correlation analysis was performed using machine learning techniques to assess the relationship between the extracted features and measured saliva secretion. We obtained tongue images and saliva secretion measurements from 176 patients. Images were cropped to 100 × 100 pixels, resulting in 462 features. The dataset was divided into training and test sets, consisting of 160 and 16 samples, respectively. The correlation coefficients for the training and test datasets were 0.9496 and 0.9415, respectively, while the correlation coefficient for the entire dataset was 0.9482. The estimated linear equation was y = 0.9244x + 2.1664. This study aimed to predict salivary gland secretion based on tongue images. By extracting features from color images and employing a neural network machine learning model, we estimated salivary gland secretion. With a sufficiently large dataset of tongue images, further advancements in regression analysis using deep learning techniques could enhance the accuracy of these predictions.
1. Introduction
Xerostomia, commonly referred to as dry mouth, is a condition characterized by reduced salivary secretion. This condition is particularly prevalent among the elderly and can significantly affect oral health and quality of life [1]. Water accounts for approximately 99% of saliva, and other components include inorganic salts such as sodium, potassium, calcium, magnesium, and organic materials such as amylase, lysozyme, lactoferrin, immunoglobulin, and glycoprotein. [2]. These components contained in saliva help maintain a proper pH in the oral cavity and enable antibacterial effects. Saliva has various physiological functions that are essential to oral hygiene, playing a crucial role in maintaining homeostasis in the tongue and mouth [3]. A reduction in saliva can lead to a range of oral health issues and discomfort. Symptoms associated with xerostomia include difficulty chewing and swallowing, a persistently dry or sore throat, and bad breath resulting from bacterial growth. Additionally, this condition increases the risk of dental caries, gum disease, and oral infections due to the diminished protective and cleansing properties of saliva [4,5,6,7].
The prevalence of xerostomia is approximately 20% in the general population, rising to 30% in women and up to 50% in the elderly [8]. Xerostomia refers to the subjective sensation of dry mouth, while hyposalivation is defined as an objective reduction in salivary flow [1,2], typically diagnosed when saliva production is equal to or less than 0.1–0.2 mL per minute. Hyposalivation may or may not be accompanied by the perception of dry mouth (xerostomia), a condition frequently reported among older adults. In the general population, the prevalence of hyposalivation ranges from 14.4% to 20%, but it exceeds 50% in individuals with autoimmune diseases [3,4]. As life expectancy continues to rise, the prevalence of dry mouth is also increasing, driving greater interest in these conditions.
The diagnosis of xerostomia involves several key factors, including symptoms, medication use, past medical history, and oral examination. Specifically, the symptoms associated with xerostomia include a persistent feeling of dry mouth, difficulty swallowing, intolerance to spicy or acidic foods, and discomfort when consuming crunchy foods [9]. To assess the presence of xerostomia, several research teams have proposed the use of structured questionnaires for patients, with diagnosis being based on the scoring results from these tools [10,11,12]. Additionally, careful oral examination for clinical pathognomonic signs—such as frothy saliva, the loss of papillae on the dorsal surface of the tongue, or a glassy appearance of the oral mucosa—serves as another diagnostic approach [13]. These approaches can be subjective, varying depending on the patient or physician, and therefore may have limitations in terms of objectively diagnosing the condition.
One of the most straightforward and direct diagnostic methods currently used in clinical settings is the measurement of salivary flow. Depending on the targeted salivary gland, whether a major or minor salivary gland, salivary flow can be measured under stimulated or unstimulated conditions. Measurement methods vary according to the proposing research group, including differences in duration (ranging from 1 to 15 min) and technique (such as draining or absorbent strip methods) [14,15,16]. Generally, a flow rate of less than 0.1 mL per minute is considered indicative of dry mouth [17].
In addition, salivary gland function tests, such as scans or CT imaging, help detect structural or functional abnormalities. Biopsies of minor salivary glands can be used to differentiate autoimmune diseases, such as Sjögren’s syndrome [18]. Blood tests are also employed to detect systemic or autoimmune conditions that may contribute to dry mouth.
Despite these diagnostic methods, limitations exist. Diagnosis often relies on subjective patient reports, which can vary due to individual perceptions. The absence of standardized tests for saliva flow and salivary gland function adds to the inconsistency in diagnostic accuracy. External factors, such as stress and environmental influences, can affect saliva production, potentially leading to misdiagnosis. Additionally, certain diagnostic procedures, such as sialography, are invasive and may cause discomfort, limiting their routine application.
Given these challenges, there is a pressing need for ongoing research and the development of more objective, standardized diagnostic tools. In particular, recent studies have reported using tongue images, which are easily accessible and can be obtained in an automated manner, to predict various health indicators—ranging from general health assessments to the diagnosis of coronary artery disease based on deep learning [19]. Therefore, advances in this area are crucial in improving the accuracy of dry mouth diagnosis and enhancing patient care. In this paper, we propose a novel, non-invasive method for predicting xerostomia through the analysis of tongue images.
2. Materials and Methods
In this study, we aimed to predict salivary gland secretion levels using images of the tongue obtained from patients presenting with xerostomia (dry mouth). Patients who visited the hospital were selected based on their reported symptoms, and we subsequently measured their saliva secretion. To utilize machine learning, we extracted various features from the tongue images captured. These features included the color intensity and texture of the tongue image. We employed machine learning techniques such as deep neural networks to conduct a correlation analysis between the derived image features and the measured saliva secretion levels. Figure 1 illustrates the comprehensive workflow of our study, detailing the step-by-step processes in image analysis for machine learning implementation.
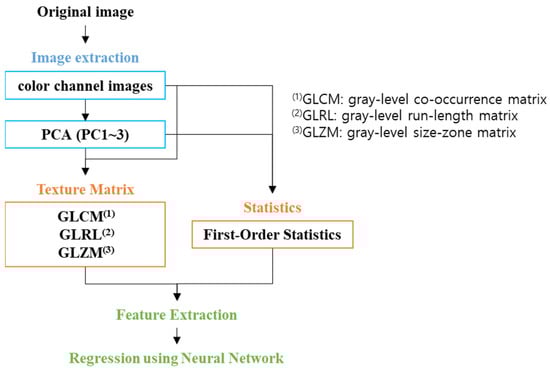
Figure 1.
Workflow scheme.
2.1. Data Acquisition
Tongue image data and saliva secretion measurements were obtained through a research protocol approved by the Institutional Review Board (IRB, DKUH 2022-09-02 and DKUH 2023-09-020) at Dankook University Hospital, Korea. This study enrolled 123 patients who sought medical care at the hospital for symptoms of dry mouth, with an average age of 55.7 years, and 55.3% being female. All participants were prescribed pilocarpine to alleviate the symptoms of dry mouth. The following exclusion criteria were applied to ensure the validity of the study results: patients with uncontrolled severe acute renal or cardiac conditions that could interfere with the study outcomes within six months prior to screening, patients who had taken medications known to induce dry mouth (such as antidepressants, antihistamines, chemotherapeutic agents, or diuretics) in the four weeks before enrollment, patients with psychiatric disorders, patients diagnosed with asthma, patients with acute iritis or narrow-angle glaucoma, and pregnant or breastfeeding women, as well as those planning to conceive during the study period.
Tongue images of the dorsal surface were captured using an iPhone 14 camera (Apple Inc., Cupertino, CA, USA). The sampling area was determined based on the ease of image acquisition and the appropriate size of the extraction image. Thus, we focused on the tongue, from which three samples were extracted. Saliva secretion was assessed using the Mucus device (ICST corporation, Saitama, Japan) [20,21]. Measurements were taken after more than 10 min had elapsed since the patients had last consumed food. During the measurement procedure, patients were instructed to protrude their tongue, and saliva secretion was measured for 2 s at the center of the tongue (approximately 10 mm from the tip). Each measurement was repeated three times, and the average value was recorded for multi-linear regression analysis. To classify patients based on their salivary output, we established a threshold value of 27.0 [21]. Patients were categorized as either normal or abnormal based on whether their measured saliva secretion was above or below this critical value.
2.2. Image Pre-Processing
We utilized an imaging tool specifically designed for tongue image acquisition, which included a camera and a chin support instrument. However, we encountered some image distortion due to poor user control and minor movements, leading to several unfocused and blurred images. In particular, images that were out of focus could result in distortions of the extracted image features, potentially compromising the validity of our analyses. To address this issue, we implemented an unsharp masking algorithm to enhance the clarity of the unfocused images. This method involves subtracting a blurred version of the original image from the original image itself, multiplying the resulting difference by a predetermined weight value, and subsequently adding this adjusted value back to the original image. The mathematical representation of this process is as follows [22]:
Sharpened image = original image + weight × (original image − blurred image)
The blurred image was generated using a two-dimensional Gaussian low-pass filter, which effectively reduced high-frequency noise while preserving essential image details. The weight value applied in this process was determined through a series of empirical tests, with the final value set to 4.
We proceeded to extract a variety of features by converting the images into different color channels. Specifically, the original RGB (red, green, blue) sample images were transformed into several color spaces, including CMYK (cyan, magenta, yellow, and black), HSV (hue, saturation, and value), LAB (lightness, red/green, and blue/yellow), YCbCr (luminance and chrominance), and grayscale images. Principal component analysis (PCA) was then applied to 17 color channel images to extract three principal components. The principal components were calculated by multiplying the difference image by the eigenvector. The difference image was obtained by subtracting the normalized image from the average value of the normalized image. The eigenvector was derived from the covariance matrix of the difference image. For our feature extraction process, we specifically utilized the RGB channel, the magenta channel from CMYK representation, and the three principal components derived from PCA (Figure 2). The choice to focus on the magenta channel was based on the hypothesis that it would contain valuable information regarding the condition of the tongue, given its prominent red hue, which may reflect vascular and structural characteristics pertinent to salivary function.
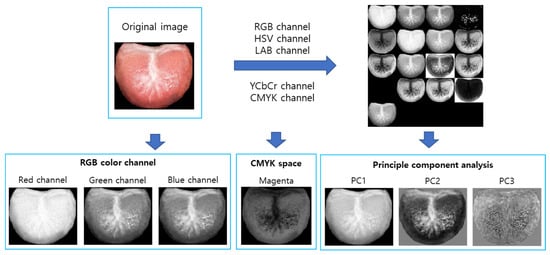
Figure 2.
Image generation for image feature extraction.
2.3. Image Feature Extraction
The images utilized in this study exhibited variability in size due to the manual acquisition process. To mitigate this variability and standardize our analyses, we cropped three samples of the tongue images to a uniform size of 100 × 100 pixels, as illustrated in Figure 3. From these cropped samples, one image was randomly selected, and features were subsequently extracted.
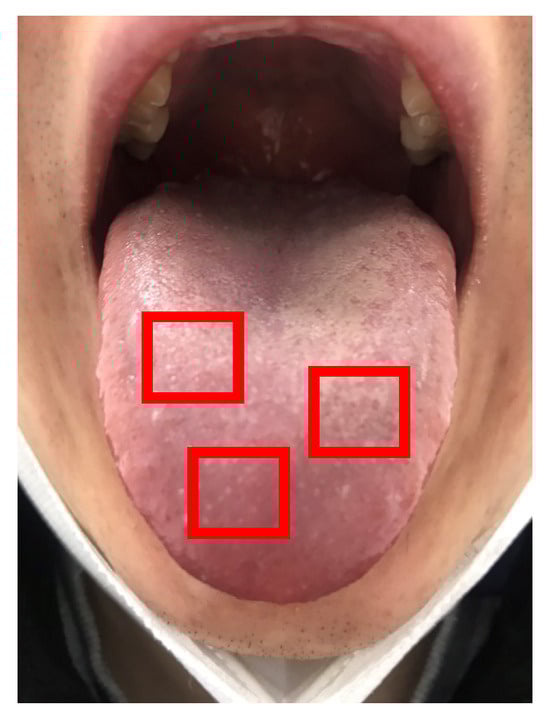
Figure 3.
Three sample images (red boxes, 100 × 100 pixels) in a tongue image.
We extracted 462 image features from the cropped tongue image, focusing on both first-order statistics and second-order statistics, which encompass textural features. First-order statistics provide insights into the statistical properties of the spatial distribution of gray levels within the image. These statistics include fundamental measures such as the mean, median, range, standard deviation, skewness, and kurtosis [23]. Textural features, on the other hand, were calculated using texture matrices that represent the spatial distribution of pixel intensities within the images [24,25]. Specifically, we employed three primary types of texture matrices: the gray-level co-occurrence matrix (GLCM) [26], the gray-level run-length matrix (GLRLM) [27], and the gray-level size-zone matrix (GLSZM) [28,29,30,31]. The GLCM characterizes the spatial relationships of pixels with predefined gray-level intensities, allowing us to quantify how often pairs of pixels with specific values occur in a specified spatial relationship. The GLRLM provides valuable information regarding the spatial distribution of consecutive pixels that share the same gray level, thus offering insights into texture continuity. The GLSZM counts the number of groups of interconnected neighboring pixels that share identical gray levels, enabling a deeper understanding of the structure and distribution of pixel intensities (Supplementary Method).
In this study, we calculated a total of 66 features derived from these textural analyses: 11 features based on first-order statistics, 23 features extracted from the GLCM, 16 features obtained from the GLRLM, and 16 features derived from the GLSZM. Overall, we calculated a total of 462 features from the seven images generated during the image pre-processing phase.
2.4. Multi-Linear Regression Analysis Using Machine Learning
Regression models, such as trees, neural networks, kernel approximation, and the linear regression model, were employed for the machine learning component of this study. Given their capacity to model complex reationships, we utilized neural networks, specifically structured similarly to convolutional neural networks (CNNs) to estimate saliva secretion from the tongue image. From a total of 496 image features, we extracted 100 features that exhibited a high correlation with saliva secretion. These 100 high-correlation features served as input data, while the measured saliva secretion data acted as target data. The fitrnet function in MATLAB R2023a (Mathworks, Inc., Natick, MA, USA) was utilized for non-linear regression [32]. This function trains a feedforward, fully connected neural network for regression. The neural network model was configured with three fully connected hidden layers, containing 200, 100, and 50 perceptron in each layer, respectively (Figure 4). The ReLU (rectified linear unit) function was used as the activation function.

Figure 4.
Neural network structure (FC: fully connected, ReLU (rectified linear unit): activation function).
Regression fitting training data were randomly extracted from 90% of the total data. The remaining 10% data were used for testing. Cross-validation was performed during the training process, where 20% of training datasets was used for cross-validation. And we calculated the correlation coefficients of the train data, test data, and total data, respectively.
3. Results
3.1. Image Acquisition and Saliva Secretion Measurement
The number of enrolled patients was actually 123, with an additional 53 patients re-enrolled. More than two tongue images were acquired for each patient, and a high-quality image was selected. The blurred images were converted to a sharpness image using an image sharpness algorithm. In the Figure 5, the amount of saliva secretion was measured using 176 data and ranged from 11.7 to 33.6 (average, 27.599; standard deviation, 3.035). Among the enrolled patients, there were more normal data (119) than abnormal data (57).
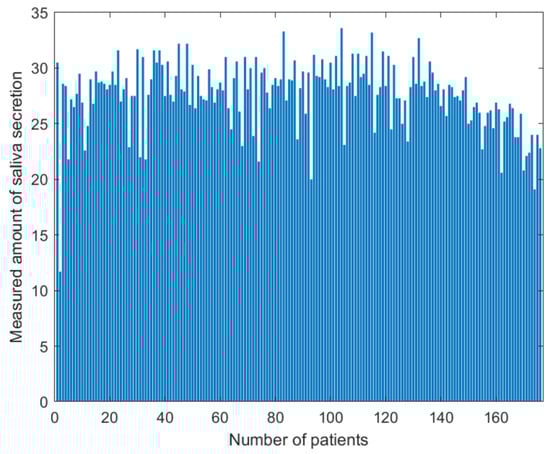
Figure 5.
Distribution of saliva secretion measured for 123 enrolled patients and 53 re-enrolled patients. The amount of saliva secretion ranged from 11.7 to 33.6 (average, 27.599; standard deviation, 3.035).
3.2. Image Sharpness
We corrected unfocused images using an unsharp masking algorithm, where the two-dimensional Gaussian filter size and weight value were 1 to 5, respectively. Ultimately, we set both the Gaussian filter size and the weight value on 4, respectively (Figure 6). From the images corrected by this algorithm, three sample images were cropped to 100 × 100 pixels.

Figure 6.
The sharpened image test used for the various weight value and filter size.
3.3. Image Features
Image features were extracted from the images cropped to 100 × 100 pixels. A total of 462 features were extracted from the tongue images of 176 patients. The feature values were normalized between 0 and 1. The normalized features were used to create the feature map in Figure 7. Similar or different patterns were confirmed using the feature map. The extracted features were used for multi-linear regression fitting.

Figure 7.
Feature map of 462 features from 176 patients.
3.4. Multi-Linear Regression Analysis
We extracted 100 features that showed a high correlation with saliva secretion. Among these high-correlation features, the highest and lowest absolute value of correlation coefficients were 0.3853 and 0.1971, respectively. The training and test dataset were used for 160 (90%) and 16 (10%) samples, respectively. The correlation coefficients for the training dataset and test dataset were 0.9496 and 0.9415, respectively. The correlation coefficient of the entire dataset was 0.9482. The estimated linear equation was given by y = 0.9244x + 2.1664 (Figure 8).
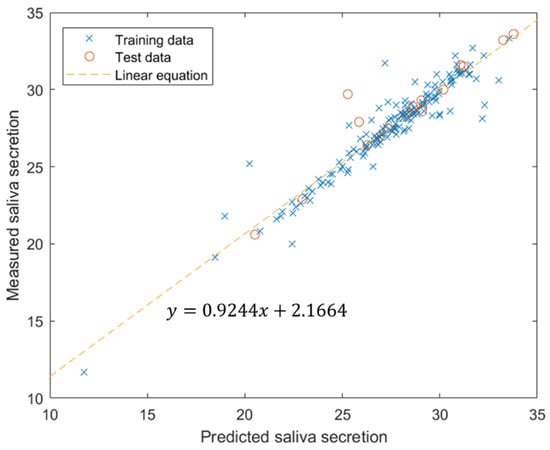
Figure 8.
Multi-linear regression results using neural network.
4. Discussion
In 2014, C. P. Bots et al. [33] reported that there was no significant difference between the visual assessment of tongue photographs and the patient’s unstimulated salivary flow rate (USFR) or xerostomia inventory (XI) score. In their study, 25 dentists and individuals with another academic background assessed tongue photographs based on criteria such as tongue brilliance, wetness, the appearance of saliva, frothy saliva, and the presence of papillae or swelling. In contrast, our study was focused on quantitative analysis rather than visual assessment. Our goal was to achieve a more objective evaluation of salivary secretion by extracting features from various color channels and principal component images. Specifically, we extracted 462 features from tongue images and derived a relationship equation between these features and saliva secretion using machine learning, such as deep neural networks. Our proposed method may offer a more objective assessment compared to the visual approach used by C. P. Bots et al., representing a significant advancement in the field.
The condition of the tongue surface is correlated with the function of specific body organs [34]. Other researchers have developed tongue imaging systems and methods of analyzing tongue images. These systems utilize various technologies, such as the CCD camera [35,36], hyper-spectral camera [37], and cell phone camera [38,39]. Diseases such as intestinal infection, heart failure, cholecystitis, or appendicitis have been predicted or classified through tongue image analysis [40,41]. In this paper, we present an algorithm to predict the saliva secretion from tongue images.
We utilized an imaging tool specifically designed for tongue image acquisition, which included a camera and a chin support instrument. This imaging tool was used for image focusing and positioning the images. However, we encountered some image distortion due to poor user control and minor movements, leading to several unfocused and blurred images. Additionally, specific lighting conditions were not used, which may have affected the image contrast. Consequently, the image focus varied between acquisitions, complicating the extraction of distinct features from unfocused images [42]. Moreover, images obtained without adequate lighting necessitated pre-processing steps, such as normalization, to improve the quality and consistency [43]. A higher-quality dataset could potentially be obtained with fixed camera positioning and consistent lighting, reducing the need for extensive pre-processing. Moving forward, we plan to establish more controlled lighting conditions and refine our image acquisition protocols to ensure consistent image quality in future research.
A potential limitation of this study is that the Mucus device does not measure the secretion rate but the moisture in the oral. This layer can be influenced by factors such as saliva composition and evaporation caused by mouth breathing. Nevertheless, we applied the same method consistently across all patient samples.
Additionally, the distribution of measured saliva secretion was skewed, with a significant concentration of values exceeding 26 (119 of 176 samples). This imbalance in the dataset may adversely affect the regression performance for values below 26. When the training data are concentrated in a specific range in the distribution, the risk of model overfitting increases [44].
We acknowledge that a significant limitation of this study is the lack of clinical trials. If the dataset is insufficient, the model may fail to generalize with new data, leading to overfitting, where the model only learns to fit the training data. In our study, we utilized a dataset of 176 samples for regression training and achieved a high correlation between saliva secretion and tongue image features. However, we believe that the dataset size may be insufficient. We anticipate that acquiring additional data could help in developing a more generalized model.
Image feature extraction methods were employed for the analysis of tongue images, focusing on aspects such as the tongue body, color, moisture, size, shape, and coating. The gray-level co-occurrence matrix (GLCM) has been widely used for textural feature extraction [26]. However, the number of features extracted by GLCM is limited, and a limited number of features may not fully represent the condition of the entire tongue [45,46,47]. In this paper, we introduced various textural feature extraction methods, which provide more comprehensive information about tongue condition. We hope this will enhance the accuracy of disease diagnosis and prediction. Also, it could be useful in the future to conduct new research involving smartphone applications [48] and specific AI-based computer software [49].
Currently, computed tomography (CT) and ultrasound are used in accurately diagnosing salivary gland function. These diagnostic tools provide the precise identification of anatomical issues but come with several drawbacks, including high costs, radiation exposure (in the case of CT), and potential adverse reaction from skin contact (with ultrasound). In contrast, our proposed method offers a simpler and potentially more accessible approach to diagnosing salivary gland function. While it may not match the accuracy of CT or ultrasound, it provides significant advantages in terms of ease of use and the potential for patient self-assessment.
5. Conclusions
This study aimed to predict the amount of salivary gland secretion based on images of the tongue as a diagnostic tool. A comprehensive set of 462 features was extracted from color tongue images through the conversion of various color channels and the application of principal component analysis (PCA). Subsequently, a neural network machine learning model was employed to estimate salivary gland secretion levels based on these extracted features.
Despite challenges such as issues with image focus, skewed data, and a limited dataset, the results demonstrated a high correlation (r = 0.9482) between the estimated salivary gland secretion and the tongue image features. This high correlation shows the potential of using tongue imaging as a viable method for assessing salivary function.
Furthermore, the integration of image feature extraction methods, such as those provided by Radiomics, could significantly enhance the accuracy of predictive models. Radiomics offers the opportunity to extract a diverse array of quantitative features. In addition to improving salivary secretion predictions, we believe that the methods introduced in this study may have broader applications in the prediction or classification of other diseases. Our findings will open up avenues for future research that harnesses the potential of tongue imaging in clinical practice.
Supplementary Materials
The following supporting information can be downloaded at: https://www.mdpi.com/article/10.3390/app142210118/s1. References [50,51,52] are cited in the supplementary materials.
Author Contributions
Conceptualization, S.-H.A. and H.S.K.; methodology, H.S.K.; validation, P.-S.C.; formal analysis, H.S.K.; investigation, P.-S.C.; data curation, P.-S.C. and M.-J.L.; writing—original draft preparation, S.-H.A., S.J.L. and H.S.K.; writing—review and editing, H.S.K.; funding acquisition, S.-H.A. and P.-S.C. All authors have read and agreed to the published version of the manuscript.
Funding
This work was supported by the Technology Innovation Program Development Program (20021987, Development of LED-based salivary gland care device technology to improve dry mouth) funded by the Ministry of Trade, Industry, and Energy (MOTIE, Republic of Korea).
Institutional Review Board Statement
This study was approved by the Institutional Review Board (DKUH) of Dankook University Hospital, Korea (protocol codes 2022-09-002 and 2023-09-020, date of approval 21 December 2022 and 20 September 2023).
Informed Consent Statement
Informed consent was obtained from all subjects involved in the study.
Data Availability Statement
The feature data used in this study are available upon reasonable request form the corresponding author. The tongue image data are not available due to institutional review board (IRB) approval restrictions.
Conflicts of Interest
The authors declare no conflicts of interest.
References
- Sutarjo, F.N.A.; Rinthani, M.F.; Brahmanikanya, G.L.; Parmadiati, A.E.; Radhitia, D.; Mahdani, F.Y. Common precipitating factors of xerostomia in elderly. J. Health Allied Sci. NU 2024, 14, 011–016. [Google Scholar] [CrossRef]
- Yoo, M.H.; Rhee, Y.; Jung, J.; Lee, S.; Moon, J.; Mo, J.; Chung, P. TRPV1 regulates inflammatory process in the tongue of surgically induced xerostomia mouse. Head Neck 2020, 42, 198–209. [Google Scholar] [CrossRef] [PubMed]
- Tanasiewicz, M.; Hildebrandt, T.; Obersztyn, I. Xerostomia of various etiologies: A review of the literature. Adv. Clin. Exp. Med. Off. Organ Wroc. Med. Univ. 2016, 25, 199–206. [Google Scholar] [CrossRef]
- Dodds, M.W.J.; Ben Haddou, M.; Day, J.E.L. The effect of gum chewing on xerostomia and salivary flow rate in elderly and medically compromised subjects: A systematic review and meta-analysis. BMC Oral Health 2023, 23, 406. [Google Scholar] [CrossRef]
- Sardellitti, L.; Bortone, A.; Filigheddu, E.; Serralutzu, F.; Milia, E.P. Xerostomia: From Pharmacological Treatments to Traditional Medicine—An Overview on the Possible Clinical Management and Prevention Using Systemic Approaches. Curr. Oncol. 2023, 30, 4412–4426. [Google Scholar] [CrossRef]
- Ornelas, D.A.T.; Vela, M.O.R.; Palencia, P.G. Xerostomia: Etiology, diagnosis, prevalence, and treatment literature review. Int. J. Appl. Dent. Sci. 2023, 9, 75–79. [Google Scholar] [CrossRef]
- Bhansali, M.; Modak, R.; Lihe, V. Xerostomia and treatment approaches: An overview. IOSR J. Dent. Med. Sci. 2020, 19, 31–37. [Google Scholar]
- Hahnel, S.; Schwarz, S.; Zeman, F.; Schäfer, L.; Behr, M. Prevalence of xerostomia and hyposalivation and their association with quality of life in elderly patients in dependence on dental status and prosthetic rehabilitation: A pilot study. J. Dent. 2014, 42, 664–670. [Google Scholar] [CrossRef]
- Villa, A.; Connell, C.L.; Abati, S. Diagnosis and management of xerostomia and hyposalivation. Ther. Clin. Risk Manag. 2014, 11, 45–51. [Google Scholar] [CrossRef]
- Wang, R.; Wu, F.; Lu, H.; Wei, B.; Feng, G.; Li, G.; Liu, M.; Yan, H.; Zhu, J.; Zhang, Y.; et al. Definitive intensity-modulated radiation therapy for nasopharyngeal carcinoma: Long-term outcome of a multicenter prospective study. J. Cancer Res. Clin. Oncol. 2012, 139, 139–145. [Google Scholar] [CrossRef]
- Feltsan, T.; Stanko, P.; Mracna, J. Sjögren´s syndrome in present. Bratisl. Med. J. 2012, 113, 514–516. [Google Scholar] [CrossRef] [PubMed]
- Jeganathan, S.; Carey, H.; Purnomo, J. Impact of xerostomia on oral health and quality of life among adults infected with HIV-1. Spéc. Care Dent. 2012, 32, 130–135. [Google Scholar] [CrossRef] [PubMed]
- Bajaj, S.; Prasad, S.; Gupta, A.; Singh, V.; Vb, S. Oral manifestations in type-2 diabetes and related complications. Indian J. Endocrinol. Metab. 2012, 16, 777–779. [Google Scholar] [CrossRef]
- Oğütcen-Toller, M.; Gedik, R.; Gedik, S.; Göze, F. Sjögren’s syndrome: A case report and review of the literature. West Indian Med. J. 2012, 61, 305–308. [Google Scholar] [CrossRef]
- Riley, C.K.; Terezhalmy, G.T. The patient with hypertension. Quintessence Int. 2001, 32, 671–690. [Google Scholar] [PubMed]
- Vissink, A.; Mitchell, J.B.; Baum, B.J.; Limesand, K.H.; Jensen, S.B.; Fox, P.C.; Elting, L.S.; Langendijk, J.A.; Coppes, R.P.; Reyland, M.E. Clinical management of salivary gland hypofunction and xerostomia in head-and-neck cancer patients: Successes and barriers. Int. J. Radiat. Oncol. 2010, 78, 983–991. [Google Scholar] [CrossRef]
- Altamini, M.A. Update knowledge of dry mouth- A guideline for dentists. Afr. Health Sci. 2014, 14, 736–742. [Google Scholar]
- Stankeviciene, I.; Stangvaltaite-Mouhat, L.; Aleksejuniene, J.; Mieliauskaite, D.; Talijuniene, I.; Butrimiene, I.; Bendinskaite, R.; Puriene, A. Oral health status, related behaviours and perceived stress in xerostomia, Sicca and Sjögren’s syndromes patients-a cross-sectional study. BMC Oral Health 2024, 24, 454. [Google Scholar] [CrossRef]
- Bhatnagar, V.; Bansod, P.P. Challenges and solutions in automated tongue diagnosis techniques: A review. Crit. Rev. Biomed. Eng. 2022, 50, 47–63. [Google Scholar] [CrossRef]
- Fukushima, Y.; Sano, Y.; Isozaki, Y.; Endo, M.; Tomoda, T.; Kitamura, T.; Sato, T.; Kamijo, Y.; Haga, Y.; Yoda, T. A pilot clinical evaluation of oral mucosal dryness in dehydrated patients using a moisture-checking device. Clin. Exp. Dent. Res. 2019, 5, 116–120. [Google Scholar] [CrossRef]
- Fukushima, Y.; Yoda, T.; Araki, R.; Sakai, T.; Toya, S.; Ito, K.; Funayama, S.; Enoki, Y.; Sato, T. Evaluation of oral wetness using an improved moisture-checking device for the diagnosis of dry mouth. Oral Sci. Int. 2017, 14, 33–36. [Google Scholar] [CrossRef]
- Al-Ameen, Z.; Muttar, A.; Al-Badrani, G. Improving the Sharpness of Digital Image Using an Amended Unsharp Mask Filter. Int. J. Image Graph. Signal Process. 2019, 11, 1–9. [Google Scholar] [CrossRef][Green Version]
- Bianconi, F.; Palumbo, I.; Spanu, A.; Nuvoli, S.; Fravolini, M.L.; Palumbo, B. PET/CT radiomics in lung cancer: An overview. Appl. Sci. 2020, 10, 1718. [Google Scholar] [CrossRef]
- Aerts, H.J.W.L.; Velazquez, E.R.; Leijenaar, R.T.H.; Parmar, C.; Grossmann, P.; Carvalho, S.; Bussink, J.; Monshouwer, R.; Haibe-Kains, B.; Rietveld, D.; et al. Decoding tumour phenotype by noninvasive imaging using a quantitative radiomics approach. Nat. Commun. 2014, 5, 4006. [Google Scholar] [CrossRef]
- Lambin, P.; Leijenaar, R.T.H.; Deist, T.M.; Peerlings, J.; de Jong, E.E.C.; van Timmeren, J.; Sanduleanu, S.; Larue, R.T.H.M.; Even, A.J.G.; Jochems, A.; et al. Radiomics: The bridge between medical imaging and personalized medicine. Nat. Rev. Clin. Oncol. 2017, 14, 749–762. [Google Scholar] [CrossRef] [PubMed]
- Haralick, R.M.; Shanmugam, K.; Dinstein, I.H. Textural Features for Image Classification. IEEE Trans. Syst. Man Cybern. 1973, 6, 610–621. [Google Scholar] [CrossRef]
- Galloway, M.M. Texture analysis using gray level run lengths. Comput. Graph. Image Process. 1975, 4, 172–179. [Google Scholar] [CrossRef]
- Zhang, W.; Guo, Y.; Jin, Q. Radiomics and Its Feature Selection: A Review. Symmetry 2023, 15, 1834. [Google Scholar] [CrossRef]
- Sebastian, V.; Bino, A. Unnikrishnan, and Kannan Balakrishnan. Gray level co-occurrence matrices: Generalisation and some new features. arXiv 2012, arXiv:1205.4831. [Google Scholar]
- Dash, S.; Senapati, M.R. Gray level run length matrix based on various illumination normalization techniques for texture classification. Evol. Intell. 2021, 14, 217–226. [Google Scholar] [CrossRef]
- Mayerhoefer, M.E.; Materka, A.; Langs, G.; Häggström, I.; Szczypiński, P.; Gibbs, P.; Cook, G. Introduction to radiomics. J. Nucl. Med. 2020, 61, 488–495. [Google Scholar] [CrossRef] [PubMed]
- Gemechu, W.F.; Sitek, W.; Batalha, G.F. Improving Hardenability Modeling: A Bayesian Optimization Approach to Tuning Hyperparameters for Neural Network Regression. Appl. Sci. 2024, 14, 2554. [Google Scholar] [CrossRef]
- Bots, C.P.; Beest, A.V.; Brand, H.S. The assessment of oral dryness by photographic appearance of the tongue. Br. Dent. J. 2014, 217, E3. [Google Scholar] [CrossRef] [PubMed]
- Joshi Manisha, S.; Umadevi, V.; Akshitha Raj, B.N. Computerized pragmatic assessment of prakriti dosha using tongue images: Pilot study. Indian J. Sci. Technol. 2020, 13, 4679–4698. [Google Scholar] [CrossRef]
- Wang, X.; Zhang, B.; Yang, Z.; Wang, H.; Zhang, D. Statistical analysis of tongue images for feature extraction and diagnostics. IEEE Trans. Image Process. 2013, 22, 5336–5347. [Google Scholar] [CrossRef]
- Wang, X.; Zhang, D. A high quality color imaging system for computerized tongue image analysis. Expert Syst. Appl. 2013, 40, 5854–5866. [Google Scholar] [CrossRef]
- Liu, Z.; Wang, H.J.; Li, Q. Tongue tumour detection in medical hyperspectral images. Sensors 2012, 12, 162–174. [Google Scholar] [CrossRef]
- Tania, M.H.; Lwin, K.T.; Hossain, M.A. Computational complexity of image processing algorithms for an intelligent mobile enabled tongue diagnosis scheme. In Proceedings of the 10th International Conference on Software, Knowledge, Information Management & Applications, Chengdu, China, 15–16 December 2016; pp. 29–36. [Google Scholar]
- Hu, M.-C.; Lan, K.-C.; Fang, W.-C.; Huang, Y.-C.; Ho, T.-J.; Lin, C.-P.; Yeh, M.-H.; Raknim, P.; Lin, Y.-H.; Cheng, M.-H.; et al. Automated tongue diagnosis on the smartphone and its applications. Comput. Methods Programs Biomed. 2019, 174, 51–64. [Google Scholar] [CrossRef]
- Zhang, H.; Wang, K.; Zhang, D.; Pang, B.; Huang, B. Computer aided tongue diagnosis system. In Proceedings of the 27th Annual Conference on Engineering in Medicine & Biology Society, Shanghai, China, 17–18 January 2005; pp. 6754–6757. [Google Scholar]
- Pang, B.; Zhang, D.; Li, N.; Wang, K. Computerized tongue diagnosis based on Bayesian networks. IEEE Trans. Biomed. Eng. 2004, 51, 1803–1810. [Google Scholar] [CrossRef]
- Jiang, T.; Hu, X.-J.; Yao, X.-H.; Tu, L.-P.; Huang, J.-B.; Ma, X.-X.; Cui, J.; Wu, Q.-F.; Xu, J.-T. Tongue image quality assessment based on a deep convolutional neural network. BMC Med. Inform. Decis. Mak. 2021, 21, 147. [Google Scholar] [CrossRef]
- Koo, K.-M.; Cha, E.-Y. Image recognition performance enhancements using image normalization. Hum.-Centric Comput. Inf. Sci. 2017, 7, 33. [Google Scholar] [CrossRef]
- Santos, M.S.; Soares, J.P.; Abreu, P.H.; Araujo, H.; Santos, J. Cross-validation for imbalanced datasets: Avoiding overoptimistic and overfitting approaches [research frontier]. IEEE Comput. Intell. Mag. 2018, 13, 59–76. [Google Scholar] [CrossRef]
- Mrilaya, D.; Pervetaneni, P.; Aleperi, G. An Approach for tongue diagnosing with sequential image processing method. Int. J. Comput. Theory Eng. 2012, 4, 322–328. [Google Scholar]
- Mrilaya, D.; Pervetaneni, P.; Aleperi, G. Tongue diagnosing with sequential image enhancement methods method. Int. J. Eng. Adv. Technol. 2013, 2, 831–835. [Google Scholar]
- Mrilaya, D.; Pervetaneni, P.; Aleperi, G. Computer aided image enhancement of tongue for diagnosis in ayurvedic treatment. Appl. Med. Inform. 2014, 34, 46–56. [Google Scholar]
- Pascadopoli, M.; Zampetti, P.; Nardi, M.G.; Pellegrini, M.; Scribante, A. Smartphone Applications in Dentistry: A Scoping Review. Dent. J. 2023, 11, 243. [Google Scholar] [CrossRef]
- Lee, J.; Bae, S.-R.; Noh, H.-K. Commercial artificial intelligence lateral cephalometric analysis: Part 2—Effects of human examiners on artificial intelligence performance, a pilot study. J. Clin. Pediatr. Dent. 2023, 47, 130–141. [Google Scholar] [CrossRef]
- Galloway, M.M. Texture analysis using grey level run lengths. Nasa Sti/Recon Tech. Rep. N 1974, 75, 18555. [Google Scholar]
- Thibault, G.; Fertil, B.; Navarro, C.; Pereira, S.; Mari, J. Texture indexes and gray level size zone matrix: Application to cell nuclei classification. In Proceedings of the 10th International Conference on Pattern Recognition and Information Processing, Minsk, Belarus, 19–21 May 2009; pp. 140–145. [Google Scholar]
- Tixier, F.; Hatt, M.; Le Rest, C.C.; Le Pogam, A.; Corcos, L.; Visvikis, D. Reproducibility of tumor uptake heterogeneity characterization through textural feature analysis in 18F-FDG PET. J. Nucl. Med. 2012, 53, 693–700. [Google Scholar] [CrossRef]
Disclaimer/Publisher’s Note: The statements, opinions and data contained in all publications are solely those of the individual author(s) and contributor(s) and not of MDPI and/or the editor(s). MDPI and/or the editor(s) disclaim responsibility for any injury to people or property resulting from any ideas, methods, instructions or products referred to in the content. |
© 2024 by the authors. Licensee MDPI, Basel, Switzerland. This article is an open access article distributed under the terms and conditions of the Creative Commons Attribution (CC BY) license (https://creativecommons.org/licenses/by/4.0/).