Article

A Transferable Meta-Learning Phase Prediction Model for High-Entropy Alloys Based on Adaptive Migration Walrus Optimizer

1
School of Information and Electrical Engineering, Hebei University of Engineering, Handan 056038, China
2
School of Mechanical Engineering, Dalian University of Technology, Dalian 116024, China
*
Authors to whom correspondence should be addressed.
Appl. Sci. 2024, 14(21), 9977; https://doi.org/10.3390/app14219977
Submission received: 20 September 2024 / Revised: 24 October 2024 / Accepted: 26 October 2024 / Published: 31 October 2024

Abstract

:
The phases of high-entropy alloys (HEAs) are crucial to their material properties. Although meta-learning can recommend a desirable algorithm for materials designers, it does not utilize the optimal solution information of similar historical problems in the HEA field. To address this issue, a transferable meta-learning model (MTL-AMWO) based on an adaptive migration walrus optimizer is proposed to predict the phases of HEAs. Firstly, a transferable meta-learning algorithm frame is proposed, which consists of meta-learning based on adaptive migration walrus optimizer, balanced-relative density peaks clustering, and transfer strategy. Secondly, an adaptive migration walrus optimizer model is proposed, which adaptively migrates walruses according to the changes in the average fitness value of the population over multiple iterations. Thirdly, balanced-relative density peaks clustering is proposed to cluster the samples in the source and target domains into several clusters with similar distributions, respectively. Finally, the transfer strategy adopts the maximum mean discrepancy to find the most matching historical problem and transfer its optimal solution information to the target domain. The effectiveness of MTL-AMWO is validated on 986 samples from six datasets, including 323 quinary HEAs, 366 senary HEAs, and 297 septenary HEAs. The experimental results show that the MTL-AMWO achieves better performance than other algorithms.

1. Introduction

High-entropy alloys (HEAs) are composed of five or more principal elements [1,2,3]. They have characteristics of high strength, high hardness, excellent corrosion resistance, and high thermal stability [4], and have wide applications in aerospace, electronics, medical, and other fields [5,6]. The phases of HEAs mainly include solid solution (SS), intermetallic compound (IM), amorphous (AM), and mixed SS and IM (SS + IM) [7,8,9], and have a significant impact on their material properties. Therefore, it is essential to accurately predict the phases of HEAs for material designers [10,11].
HEAs contain multiple different principal elements, which generate a large number of possible combinations. The proportion of each principal element in the alloy can be different, further increasing the number of combinations. Compared to single principal component alloys, the number of element combinations in HEAs is much greater. The traditional trial and error method is an approach to predict the phases of HEAs that have high costs, long cycles, and low efficiency [12]. The phase diagrams (CALPHAD) method is suitable for predicting the phases of binary and ternary alloys, but it is hard to provide reliable prediction results for multi-principal element alloys [2,13]. The density functional theory (DFT) and first principles are other approaches to predict the phases of HEAs, both are computationally intensive and inefficient [14,15]. The parametric method, which is another approach to predict the phases of HEAs, can effectively reduce the computational burden [5]. However, its heavy reliance on empirical knowledge limits its application scope. In recent years, machine-learning (ML) has been increasingly applied to the field of materials due to its high efficiency and powerful learning ability [16,17].
Although ML has been applied to predict the phases of HEAs and achieved promising results, the accuracies among different ML algorithms based on the same dataset can be significantly different [18]. Recommending an ideal algorithm for the materials designers can significantly reduce their workload and shorten the materials development cycle. Meta-learning can recommend a suitable algorithm for materials designers. Ferrari et al. [19] developed a novel approach to selecting the best-performing clustering algorithm by extracting meta-knowledge from datasets. Cao et al. [20] proposed a dynamic ensemble pruning selection model by meta-learning to recommend the most competent ensemble pruning algorithm for a test sample. Li et al. [21] proposed a classification algorithm recommendation framework based on meta-learning and achieved promising results. In the field of HEAs, some scholars have conducted relevant research on meta-learning. Hou et al. [22] proposed a method based on meta-learning recommendation, which can recommend algorithms with ideal accuracy to materials designers on some datasets. In the above studies, although ideal results were achieved by meta-learning, the optimization algorithms in meta-learning do not utilize the optimal solution set information of a similar historical problem. If the optimal solution set information of a similar historical problem can be transferred to the above meta-learning optimization algorithms, the performance of the model will be further improved.
Transfer learning can employ the optimal solution set information of similar historical problems when solving a new problem, thereby improving the performance of the algorithm [23]. Scholars have conducted relevant research on transfer learning in evolutionary optimization. Dinh et al. [24] proposed several transfer learning methods for Genetic Programming. When addressing a new target task, they transferred several individuals obtained from the source domain task by the genetic algorithm and randomly replaced some individuals in the initial population. Feng et al. [25] proposed a new memetic computation paradigm that combines transfer learning and evolutionary optimization, this approach can reduce computational costs. Zhang et al. [26] proposed an evolutionary optimization framework based on the concept of transfer learning, which can accelerate the evolution process of the population and improve the search efficiency of the algorithm. The successful application of the above methods indicates that transfer learning can improve the performance of evolutionary algorithms. However, to the best of the author’s knowledge, there have been no reports on combining meta-learning and transfer strategy in the HEA field.
The optimization algorithms in meta-learning play an important role in improving the performance of meta-learning. Eberhart et al. [27] developed a novel population-based optimization technique, termed particle swarm optimization (PSO). However, it has a relatively slow convergence speed. Mirjalili et al. [28] proposed a novel meta-heuristic optimization algorithm, called whale optimization algorithm (WOA). Nevertheless, its convergence speed is slow. Compared with PSO and WOA, the walrus optimizer (WO) converges faster. WO is a novel swarm intelligent optimization algorithm proposed by Han et al. [29] in 2024. It includes the migration and reproduction phases. However, in the migration phase, WO only considers the number of iterations, the phenomenon of the average fitness value of the population hardly changing over multiple iterations, which is caused by the stagnation problem, is ignored [30]. In other words, when migrating walruses to areas more suitable for survival, not only the number of iterations should be considered, but also the changes in the average fitness value of the population over multiple iterations. This can improve the efficiency of algorithm evolution and enhance the optimization effect.
During the transfer process, the samples in the source and target domains are clustered into several clusters with similar distributions, respectively. This provides an essential foundation for transfer learning. Clustering algorithms can divide data into multiple clusters, so that objects in the same cluster are similar to each other, and objects in different clusters are different from each other [31,32]. The classical K-means method cannot identify nonspherical clusters, the number of cluster centers needs to be given in advance [33]. Rodriguez et al. [34] proposed a clustering algorithm by fast search and finding of density peaks (DPC) in 2014, which can identify nonspherical clusters and has the advantages of high clustering efficiency and better robustness. However, this algorithm tends to ignore the cluster centers with relatively low density [35], and cannot eliminate the density difference among different clusters. Sun et al. [36] proposed a novel nearest neighbors-based adaptive DPC algorithm with an optimized allocation strategy. Although the algorithm considers the issue of cluster centers with low local density, it cannot get desirable results for the density difference among different clusters. For the issue of density difference among different clusters, the balanced-relative density is more likely to be selected based on the local density and the mutual nearest-neighbor relationship, while the balanced-relative density has not been considered in [34,36].
Therefore, in this paper, a transferable meta-learning model based on adaptive migration walrus optimizer is proposed to predict the phases of HEAs. Firstly, a transferable meta-learning algorithm frame is proposed, which consists of meta-learning based on adaptive migration walrus optimizer, balanced-relative density peaks clustering, and transfer strategy. Secondly, an adaptive migration walrus optimizer model is proposed, which can adaptively migrate walruses according to the changes in the average fitness value of the population over multiple iterations. Thirdly, a balanced-relative density peaks clustering algorithm is proposed to cluster the samples in the source and target domain into several clusters with similar distributions, respectively. Finally, the transfer strategy adopts the maximum mean discrepancy (MMD) to find the most matching historical problem in the source domain, and the optimal solution information of the historical problem is transferred to the target domain.
The rest of the paper is organized as follows: In Section 2, the background knowledge on HEAs, the walrus optimizer algorithm (WO), and nearest neighbors-based adaptive density peaks clustering with optimized allocation strategy (NADPC) are introduced. In Section 3, the HEAs phase prediction model proposed in this paper is described in detail. In Section 4, a large number of experiments are carried out, and the effectiveness of the proposed model is verified. In Section 5, a conclusion is given.

2. Related Works

2.1. Background Theory of HEAs

Compared with conventional metallic alloys based on one or two major elements [37], HEAs are composed of five or more principal elements. Due to their remarkable material properties, HEAs have attracted the attention of more and more scholars [2,14,38]. Their properties are greatly affected by their phase structures [39]. Some scholars adopt the parameter method to determine the phase formation of HEAs in the materials field [7]. At present, the main parameters of HEAs phase prediction include mixing enthalpy ( Δ H mix ), mixing entropy ( Δ S m i x ), atomic size difference (δ), electronegativity difference ( Δ χ ), and dimensionless parameter (Ω) [40,41,42,43]. The calculation formulas of these five parameters are shown in Equations (1)–(5).
Δ H m i x = i = 1 , i j n 4 H i j c i c j ,
where c i and c j are the atomic percentages of the i-th and j-th elements, respectively. H i j is the mixing enthalpy of i-th and j-th binary liquid alloys.
Δ S m i x = R i = 1 n c i l n c i ,
where R = 8.314   J K 1 mol 1 is the gas constant.
δ = 100 × i = 1 n c i ( 1 r i / r ¯ ) 2 ,
where r ¯ = i = 1 n c i r i is the average atomic radius, r i is the atomic radius of the i-th element.
Δ χ = i = 1 n c i χ i χ ¯ 2 ,
where χ ¯ = i = 1 n c i χ i is the average Pauling electronegativity, χ i is the Pauling electronegativity of i-th element.
Ω = T m Δ S m i x | Δ H m i x | ,
where T m = i = 1 n c i T m i is the average melting point of constituent elements.

2.2. Walrus Optimizer (WO)

Walrus optimizer (WO) is a novel swarm intelligence algorithm. It includes the migration and reproduction phases [29]. The details of the WO are as follows:

2.2.1. Initialization

The fitness values F i t _ v a l u e of all walruses are shown in Equation (6):
F i t _ v a l u e = f 1 , 1 f 1 , 2 f 1 , D f 2 , 1 f 2 , 2 f 2 , D f N u m , 1 f N u m , 2 f N u m , D N u m × D ,
where Num is the population size and D is the dimension of design variables.

2.2.2. Danger and Safety Signals

Walruses are very vigilant when foraging and roosting. Arrange 1 to 2 walruses to patrol around, and danger signals will be sent out once unexcepted situations are found. The calculation formula of the danger signal is shown in Equation (7):
D _ s i g n a l = A * Z ,
The formula for the safety signal is as shown in Equation (8):
S _ s i g n a l = φ 2 ,
where A = 2 × α and Z = 2 × φ 1 1 are danger factors, α = 1 t / T decreases from 1 to 0 with the number of iterations t, T is the maximum iteration. φ 1 and φ 2 are random numbers within the range of (0, 1).

2.2.3. Migration

When D _ s i g n a l 1 , walrus herds migrate to areas more suitable for population survival, the walrus position is updated as shown in Equation (9):
X i , j t + 1 = X i , j t + M _ s t e p ,
where M _ s t e p = ( X p t X q t ) · β · φ 3 2 is the step size of walrus movement and φ 3 is a random number within the range of (0, 1). X i , j t is the current position of i-th walrus on the j-th dimension, X i , j t + 1 is the new position for the i-th walrus on the j-th dimension, X p t and X q t are the positions of the vigilantes randomly selected from the population. β = 1 1 / 1 + e x p ( ( t T 2 / T ) × 10 ) is the migration step control factor.

2.2.4. Reproduction

Compared with migration, walrus herds tend to reproduce in currents when risk factors are low. The female walrus ( F i , j t ) is influenced by the lead walrus ( X b e s t t ) and male walrus ( M i , j t ). As the process of iteration progresses, the female is gradually influenced more by the leader and less by the mate. The position update formula is shown in Equation (10):
F i , j t + 1 = F i , j t + α · M i , j t F i , j t + ( 1 α ) · X b e s t t F i , j t ,
where F i , j t and M i , j t are the positions of the i-th female and male walruses on the j-th dimension. F i , j t + 1 is the new position of the i-th female walrus on the j-th dimension.
Killer whales and polar bears often prey on juvenile walruses at the edge of the population. Therefore, juvenile walruses ( J i , j t ) need to update their position to avoid predation. The position update is shown in Equation (11).
J i , j t + 1 = O J i , j t · ,
where J i , j t + 1 is the new position for the i-th juvenile walrus on the j-th dimension, O = X b e s t t + J i , j t · L F is the reference safety position, ∂ is the distress coefficient of juvenile walrus, and is a random number within the range of (0, 1).
For details of foraging behavior, please refer to Ref. [29].

2.3. Nearest Neighbors-Based Adaptive DPC with an Optimized Allocation Strategy (NADPC)

Assume a dataset X = x 1 , x 2 , , x i , , x n and any point x i = [ x i 1 , x i 2 , , x i m ] , where n and m are the number and dimension of X , respectively.
The set of mutual nearest neighbors of point x i is called the mutual neighborhood ( M H i ) of point x i . M H i is shown in Equation (12):
M H i = x j | x j , f ( i , j ) = 1 ,
where for any point x i , if its KNN contains x j , and the KNN of x j also contains x i , then f i , j = 1 .Otherwise, f i , j = 0 .
The local density of any point x i is shown in Equation (13):
ρ x i = x j MH i d m a x d i j ,
where d m a x is the maximum distance between points in X .
The relative density of x i is shown in Equation (14):
r n d ( x i ) = 0 , | μ 1 ( i ) | = 0 x j μ 1 ( i ) ρ ( x i ) ρ ( x j ) | μ 1 ( i ) | , | μ 1 ( i ) | > 0 ,
where μ 1 ( i ) is a set of all points with local density greater than 0 in K N N i .
The candidate cluster center based on mutual neighborhood is shown in Equation (15):
f m ( i ) = 1 0 , , x j M H i , ρ x i ρ x j o t h e r w i s e ,
where f m i = 1 indicates that x i is a candidate cluster center; otherwise, it is not. Assuming that there are g candidate cluster centers, then c t = c t 1 , c t 2 , , c t g is the set of candidate cluster centers.
The credibility of any candidate cluster center is shown in Equation (16):
c r d ( c t i ) = r n d ( c t i ) δ ( c t i ) ,
δ i = m i n d i j m a x δ j , , ρ c t i < ρ c t j o t h e r w i s e ,
The details of the neighborhoods of points based on high-density nearest neighbors, shared nearest neighbors, mutual nearest neighbors, and similarity refer to Ref. [36].

3. Methodology

In this section, a transferable meta-learning model based on an adaptive migration walrus optimizer is proposed to predict the phases of HEAs.

3.1. A Transferable Meta-Learning Algorithm Frame

The meta-learning method can inherit the knowledge of historical learners and provide suitable machine-learning algorithms for material designers. With the increase of data and algorithm models, it can better and faster utilize these data and historical model knowledge to recommend suitable algorithms. Therefore, a transferable meta-learning algorithm frame is proposed, which consists of meta-learning based on adaptive migration walrus optimizer, balanced-relative density peaks clustering, and transfer strategy. The schematic diagram of the transferable meta-learning algorithm frame is shown in Figure 1.
As shown in Figure 1, the transferable meta-learning algorithm frame consists of meta-learning based on adaptive migration walrus optimizer, balanced-relative density peaks clustering, and transfer strategy. In the HEA field, this frame has not been found in previous studies.
On the left side of the frame diagram, the meta-learning based on AMWO can recommend the optimal ensemble model to predict the phases of HEAs, thereby improving the prediction accuracy of the frame. The AMWO employs an adaptive migration strategy to adaptively migrate walruses according to the changes in the average fitness value of the population over multiple iterations. On the right side of the frame diagram, the balanced-relative density peaks clustering (BRDPC) algorithm can cluster the samples in the source domain and the target domain into several clusters with similar distributions, respectively. The transfer strategy can improve the population’s search speed and efficiency in the search process by transferring the optimal solution information of similar historical problems to the target domain. Therefore, the transferable meta-learning algorithm frame is composed of meta-learning based on AMWO, BRDPC algorithm, and transfer strategy.
The parameters Δ H m i x , Δ S m i x , δ , Δ χ and Ω of each sample are calculated by Equations (1)–(5). The statistical features of the dataset are Δ H m i x ¯ , Δ S m i x ¯ , δ ¯ , Δ χ ¯ , Ω ¯ , σ Δ H m i x 2 , σ Δ S m i x 2 , σ δ 2 , σ Δ χ 2 , σ Ω 2 , where Δ H m i x ¯ , Δ S m i x ¯ , δ ¯ , Δ χ ¯ , Ω ¯ are the mean value of Δ H m i x , Δ S m i x , δ , Δ χ , Ω , respectively, σ Δ H m i x 2 , σ Δ S m i x 2 , σ δ 2 , σ Δ χ 2 , σ Ω 2 are the variances of Δ H m i x , Δ S m i x , δ , Δ χ , Ω . The statistical features of the training dataset are S F = S F 1 , S F 2 , , S F K . S F k = S F 1 , S F 2 , , S F R 1 × R k = 1 , 2 , , K , S F 1 = Δ H m i x 1 ¯ , Δ S m i x 1 ¯ , δ 1 ¯ , Δ χ 1 ¯ , Ω 1 ¯ , σ Δ H m i x 1 2 , σ Δ S m i x 1 2 , σ δ 1 2 , σ Δ χ 1 2 , σ Ω 1 2 . The statistical features of the test dataset are S F = S F 1 , S F 2 , , S F W . S F w = S F 1 , S F 2 , , S F R   S F 1 = Δ H m i x 1 ¯ , Δ S m i x 1 ¯ , δ 1 ¯ , Δ χ 1 ¯ , Ω 1 ¯ , σ Δ H m i x 1 2 , σ Δ S m i x 1 2 , σ δ 1 2 , σ Δ χ 1 2 , σ Ω 1 2 . The parameter set of Cart trees is P = P 1 , P 2 , , P k , , P K T . P k = p 1 , p 2 , , p R 1 × R , p 1 = C 1 , C 2 , , C c .
The detailed steps of the proposed frame are as follows:
Input: D t r a i n = x 1 , y 1 , x 2 , y 2 , , x n , y n is an imbalanced training dataset. n balanced sub-datasets D j k j = 1 , 2 , , n are constructed from D t r a i n by UnderBagging. The statistical features of D j k are S F k = S F 1 , S F 2 , , S F R 1 × R k = 1 , 2 , , K , The meta-features of D j k are M F k = S F k , P k k = 1 , 2 , , K , P k = p 1 , p 2 , , p R 1 × R .
D t e s t = x 1 , y 1 , x 2 , y 2 , , x n , y n is an imbalanced test dataset. n balanced sub-datasets D j t e s t j = 1 , 2 , , n are constructed from D t e s t by UnderBagging. The statistical features of D j t e s t are S F w = S F 1 , S F 2 , , S F R 1 × R w = 1 , 2 , , W , the meta-features of D j t e s t are M F w = S F w , P w w = 1 , 2 , , W , P w = p 1 , p 2 , , p R 1 × R .
The accuracy of S E M k are a c c = a c c 1 , a c c 2 , , a c c k , , a c c K T . The history library (HL) stores information on similar historical problems solved by optimization algorithms. H L = S F 1 , s o l 1 , S F 2 , s o l 2 , , S F o , s o l o , , S F p n , s o l p n , where S F o and s o l o are the statistical features and the optimal solution set information of the o-th historical problem, respectively.
Output: The phases of HEAs.
Historical problems with the same number of alloy components, types of learners, number of learners, and number of parameters corresponding to the learners are selected, and the statistical features of these historical problems along with the optimal solution sets of the learners are added to HL.
Step 1: k = 1, t = 0, o = 1.
Step 2: A selective ensemble model S E M k k = 1 , 2 , , K is constructed by randomly selecting R C a r t i trees from C a r t i i = 1 , 2 , , n trained on the D j k .
Step 3: The a c c k k = 1 , 2 , , K of S E M k are obtained on the validation dataset D v a l i d a t i o n .
Step 4: k = k + 1, if k > K, go to Step 5. Otherwise, return to Step 2.
Step 5: The meta-knowledge database is established based on meta-features D j k and accuracies of S E M k . The input variable MF and the output variable acc of meta-learner are the values of meta-features and the accuracies of selective ensemble models.
Step 6: The meta-learner is trained based on the input variable MF and output variable acc in Step 5. Thus, get a trained meta-learner, also known as the meta-model.
Step 7: t = t + 1. The meta-features M F w of D j t e s t are encoded to form an initial population. The AMWO algorithm iterates a small number of generations (ft), inputs the values of meta-features to the meta-model in each iteration, and obtains the accuracy of the ensemble model SEM.
Step 8: If t = ft, then the solution set is S o l t = s o l t , 1 , s o l t , 2 , , s o l t , N , s o l t , n is a solution to the target problem and represents the parameters of Cart trees. Additionally, the solutions and their corresponding statistical features constitute the target domain sample set Tar S = S F t , 1 , sol t , 1 , S F t , 2 , sol t , 2 , , S F t , N , sol t , N . Otherwise, if t < ft, return to Step 7, if t > ft, go to Step 9.
Step 9: The solution set S o l o = s o l o , 1 , s o l o , 2 , , s o l o , M and statistical features of the o-th similar historical problem in HL constitute the source domain sample set S o u S = ( S F o , 1 , sol o , 1 ) , ( S F o , 2 , sol o , 2 ) , , ( S F o , M , sol o , M ) .
Step 10: The BRDPC algorithm in Section 3.3 is employed to cluster the samples in S o u S and T a r S into several clusters with similar distributions, respectively. The source and target domain sample cluster set are S c = S c 1 , S c 2 , , S c k and T c = T c 1 , T c 2 , , T c k , respectively.
Step 11: The MMD in Section 3.3.1 is adopted to find the most matching cluster in the source domain for each cluster in the target domain. The inverse of the MMD average value of all sample clusters in the target domain is taken as the overall similarity Sid between the source domain and the target domain.
Step 12: o = o + 1, if o > pn, go to Step 13. Otherwise, return to Step 9.
Step 13: The solution set of the historical problem with the highest Sid value is regarded as the optimal solution set.
Step 14: The transfer strategy in Section 3.4 is employed to transfer the optimal solution set in S o u S to the target domain T a r S .
Step 15: t = t + 1, run the AMWO algorithm in Section 3.2 iteratively to continuously update the position of each walrus.
Step 16: The method in Section 3.4.1 is adopted to update the representative set L = l 1 , l 2 , , l k and HL. Each individual in L is the walrus with the highest fitness in each cluster in T c .
Step 17: If t = T, output the optimal solution. Otherwise, return to Step 15.
Step 18: L and its corresponding SF are stored in HL.
Step 19: The optimal ensemble model is recommended to predict the phases of HEAs in D t e s t .

3.2. Adaptive Migration Walrus Optimizer (AMWO)

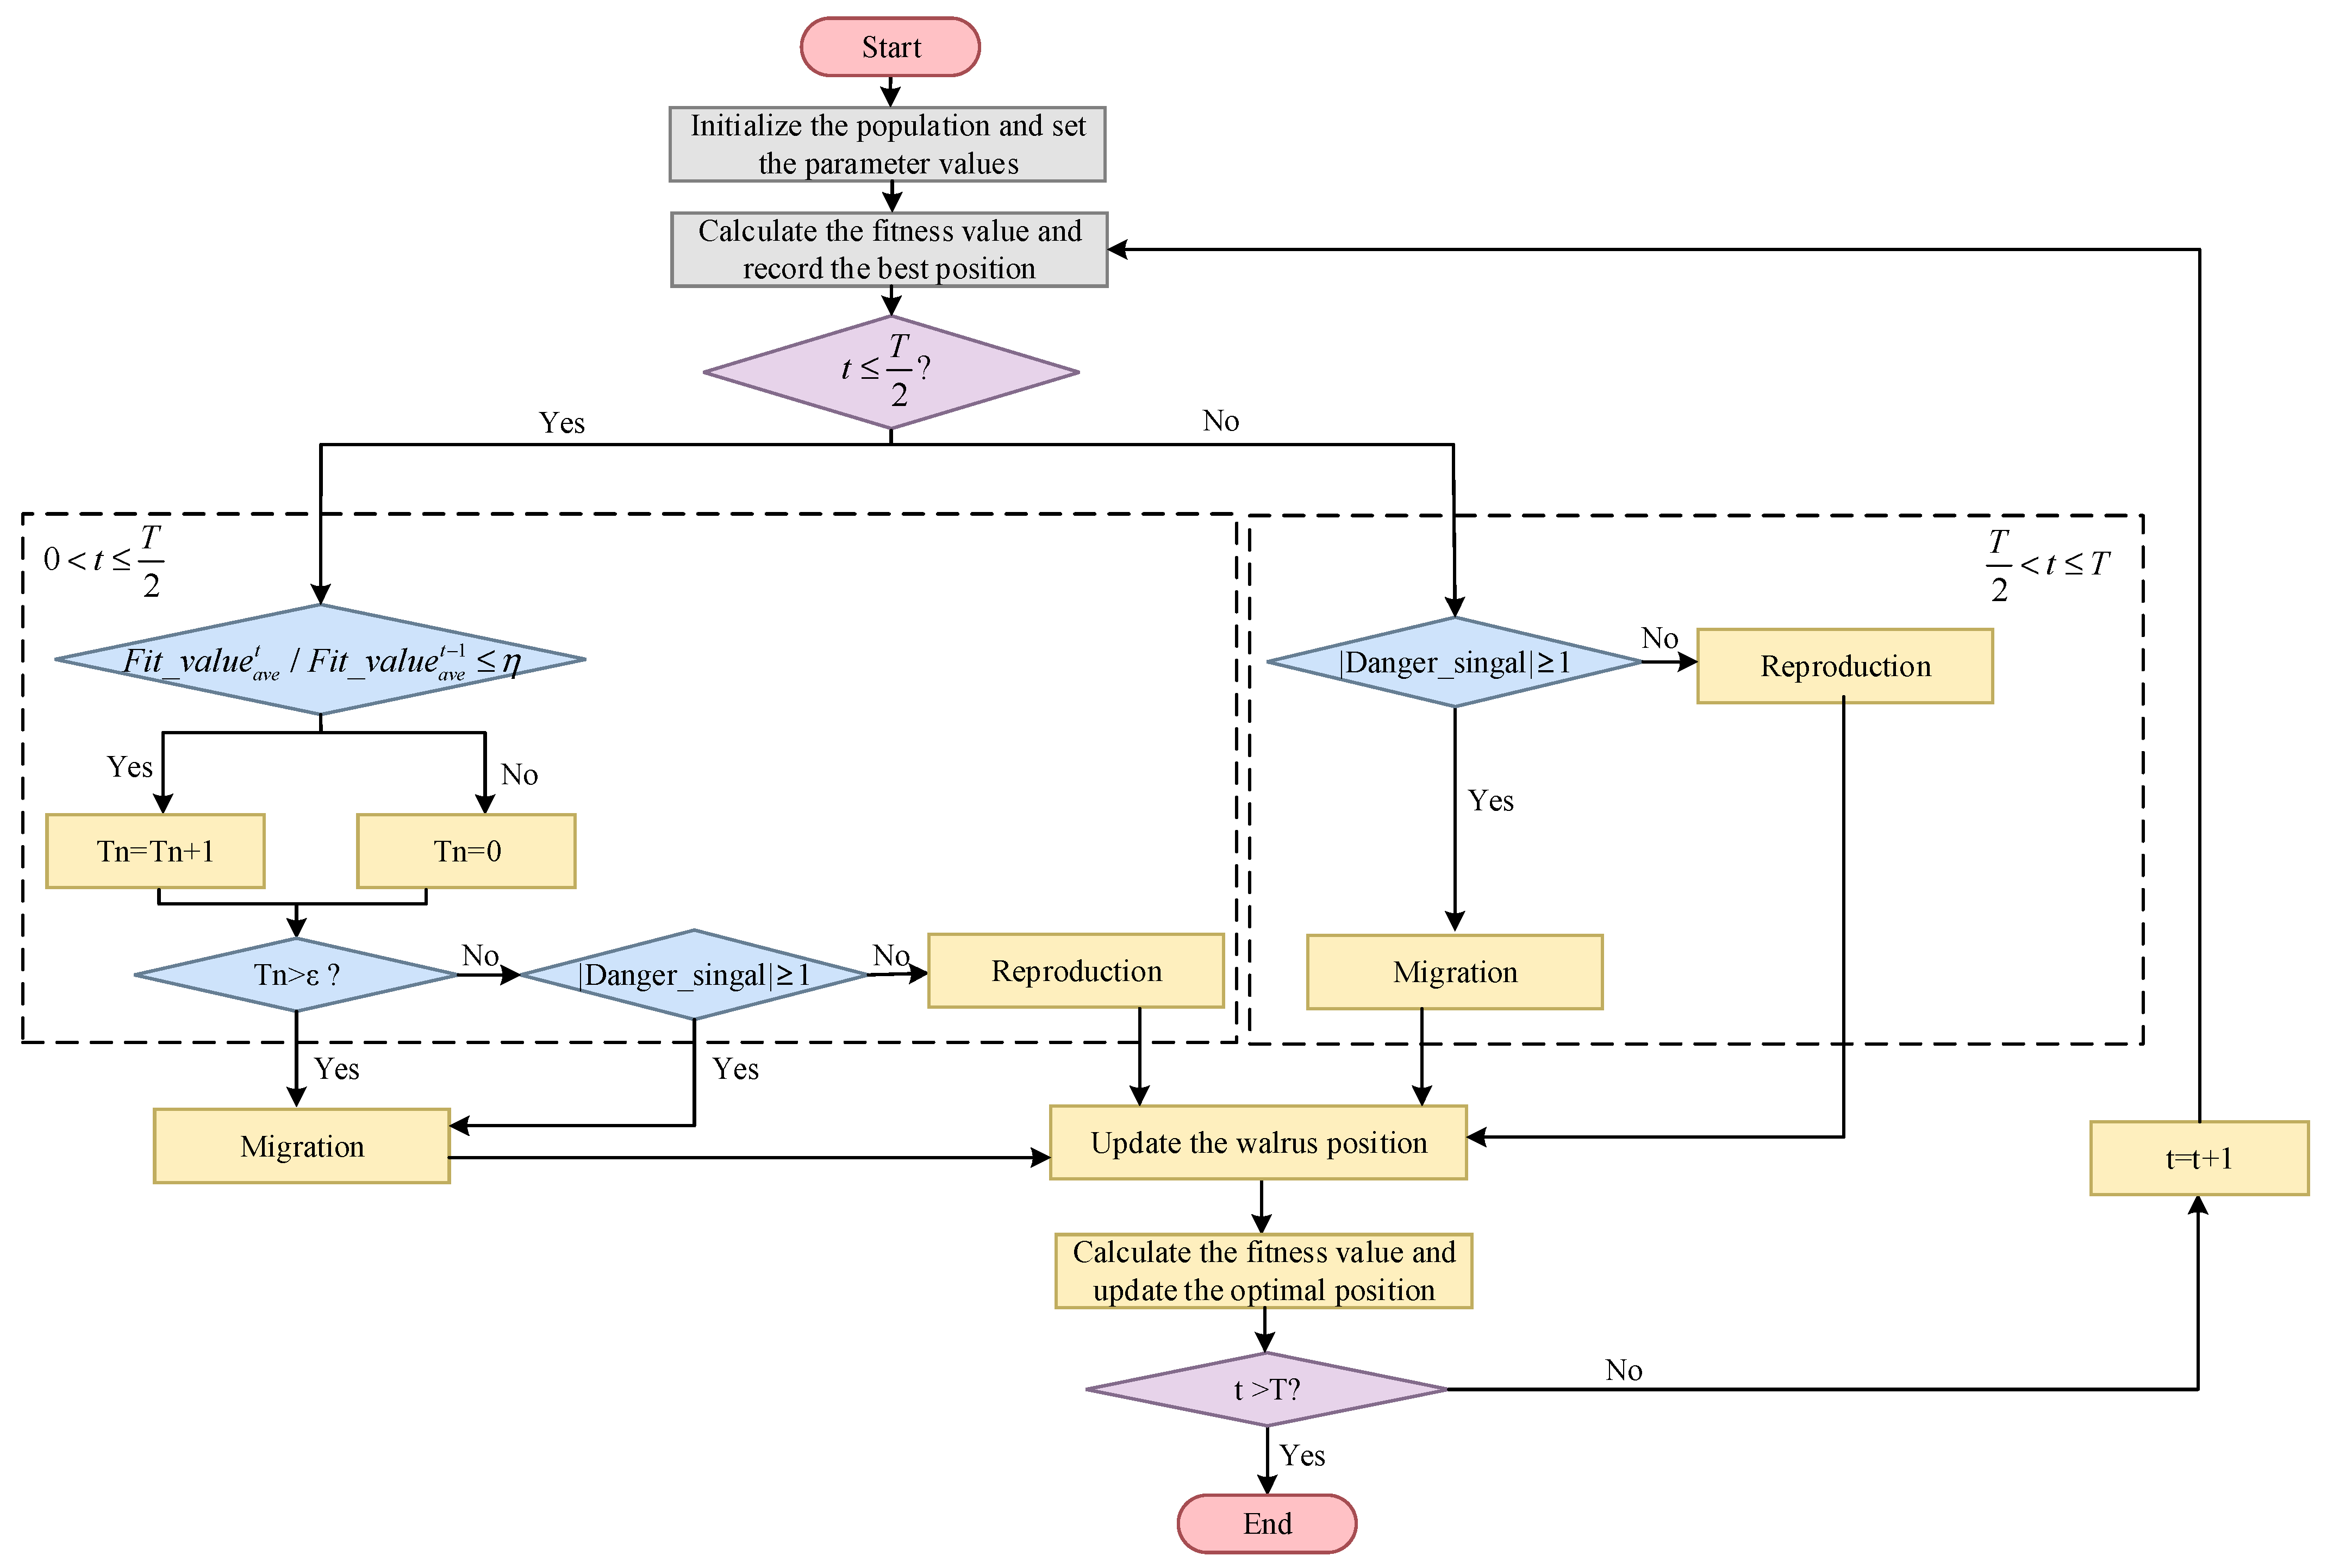
In the migration phase of WO, the number of iterations is considered, and the phenomenon of the average fitness value of the population hardly changing over multiple iterations, which is caused by the stagnation problem, is ignored. According to the changes in the average fitness value of the population over multiple iterations, the walruses are adaptively migrated to more suitable survival areas, thereby reducing the possibility of the algorithm falling into a local optimum. Therefore, a novel walrus optimizer algorithm based on an adaptive migration strategy (AMWO) is proposed. The detailed steps are as follows:
Input: Population size Num, maximum iteration T, Tn represents the number of times the average fitness value of the population hardly changes, Tn = 0.
Output: The optimal solution.
Step 1: Initialize the population.
Step 2: The F i t _ v a l u e of population is calculated by Equation (6), and the average fitness value of the population is F i t _ v a l u e a v e t = 1 N u m i = 1 N u m F i t _ v a l u e i .
Step 3: In 0 < t T 2 F i t _ v a l u e a v e t F i t _ v a l u e a v e t 1 F i t _ v a l u e a v e t / F i t _ v a l u e a v e t 1 and D _ s i g n a l are calculated. If F i t _ v a l u e a v e t / F i t _ v a l u e a v e t 1 η , then Tn = Tn + 1. If F i t _ v a l u e a v e t / F i t _ v a l u e a v e t 1 > η , then Tn =0. If Tn > ε, the migration is carried out by Equation (9). Otherwise, if D _ s i g n a l 1 , the migration is carried out by Equation (9).
Step 4: In T 2 < t T , D _ s i g n a l is calculated, if D _ s i g n a l 1 , the migration is carried out by Equation (9).
Step 5: If D _ s i g n a l < 1 , the reproduction phase is performed. The value of S _ s i g n a l is calculated by Equation (8). If S _ s i g n a l > 0.5 , the walruses choose roosting behavior. Otherwise, the walruses choose foraging behavior.
Step 6: If t = T, output the optimal solution. Otherwise, return to Step 2.
The schematic diagram of the AMWO algorithm is shown in Figure 2.
As shown in Figure 2, in 0 < t T 2 , besides the number of iterations, the phenomenon of the average fitness value of the population hardly changing over multiple iterations, which is caused by the stagnation problem, is also considered. If F i t _ v a l u e a v e t / F i t _ v a l u e a v e t 1 η , Tn = Tn + 1. Otherwise, Tn = 0. If Tn > ε, the walruses will migrate to more suitable survival areas. Otherwise, if D _ s i g n a l 1 , the walruses will migrate to more suitable survival areas. If D _ s i g n a l < 1 , the reproduction phase is performed. The AMWO algorithm adopts an adaptive migration strategy, which can reduce the possibility of the algorithm falling into a local optimum.

3.3. Balanced-Relative Density Peaks Clustering (BRDPC)

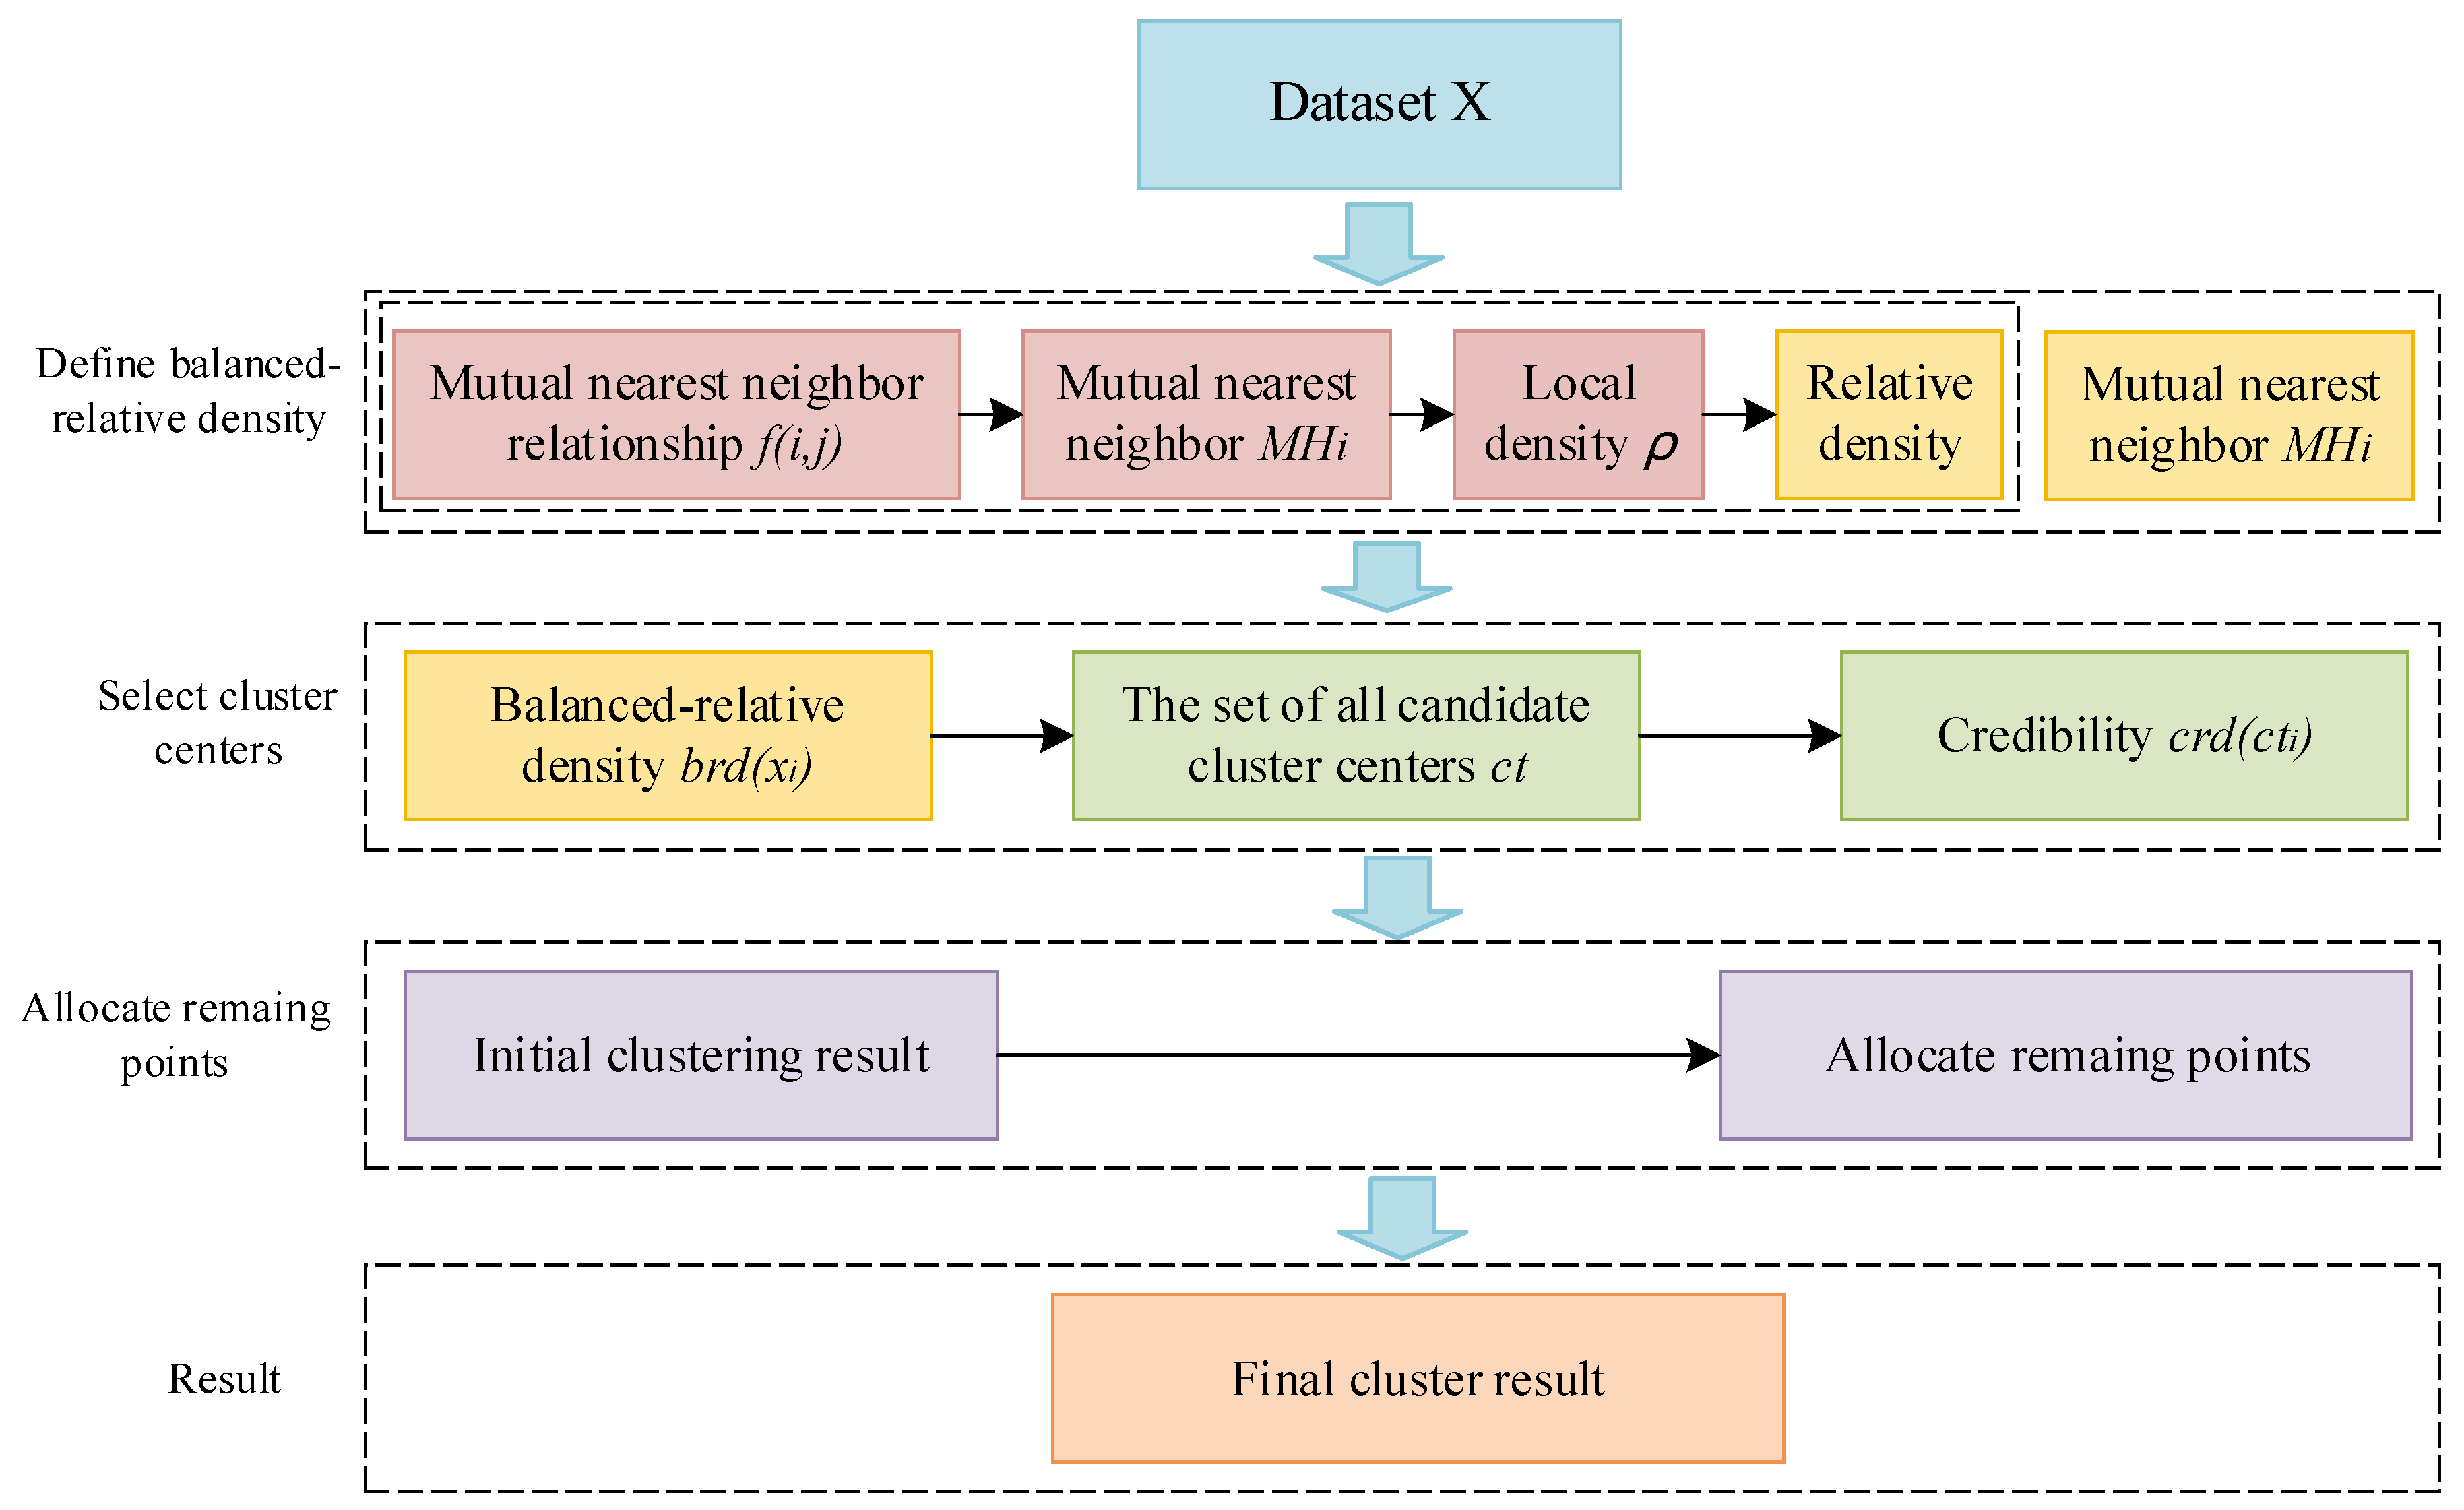
When large density differences among different clusters exist, DPC cannot eliminate the density difference among different clusters and will easily ignore the cluster centers with relatively low local density in datasets. Although NADPC [36] considers the issue of cluster centers with low local density, it cannot get desirable results for the density difference among different clusters. The mutual nearest-neighbor relationship depends on the distribution of data points and is insensitive to the change in distance. It can eliminate the influence of density differences among different clusters [44]. Therefore, a novel balanced-relative density peaks clustering (BRDPC) algorithm is proposed. The schematic diagram of the BRDPC algorithm is shown in Figure 3.
As shown in Figure 3, ρ is the local density of any point x i , its calculation formula is shown in Equation (13). M H i is the set of mutual nearest neighbors of any point x i , its calculation formula is shown in Equation (12). The balanced-relative density of x i is shown in Equation (18):
b r d ( x i ) = 0 , | μ 1 ( i ) | = 0 x j μ 1 ( i ) ρ ( x i ) ρ ( x j ) | μ 1 ( i ) | + | M H i | , | μ 1 ( i ) | > 0 ,
where |•| is the cardinality of set.
The balanced-relative density can improve the possibility of selecting the right cluster center. Furthermore, it can eliminate the influence of density differences among different clusters by considering the local density and the number of the mutual nearest neighbor of point x i .
Steps of the schematic diagram of BRDPC algorithm are shown as follows:
Step 1: For any point x i in X , M H i of x i is calculated by Equation (12).
Step 2: The local density of any point x i is calculated by Equation (13).
Step 3: The balanced-relative density of x i is calculated by Equation (18).
Step 4: The candidate cluster centers set based on Equation (15) is c t = c t 1 , c t 2 , , c t g .
Step 5: The relative distance ( δ i ) of x i is calculated by Equation (17).
Step 6: For any c t i , its credibility as a cluster center is calculated by Equation (16).
Step 7: Allocate sample points that are not cluster centers refers to Ref. [36].

3.3.1. Similarity Matching Algorithm

The source domain sample cluster set S c = S c 1 , S c 2 , , S c k and the target domain sample cluster set T c = T c 1 , T c 2 , , T c k are obtained by the BRDPC algorithm. In this section, the maximum mean discrepancy (MMD) method is applied to find the most matching cluster in the source domain for each cluster in the target domain [45]. Such as T c k = t c k , 1 , t c k , 2 , , t c k , T c k is a cluster in Tc. The most matching cluster S c c = s c c , 1 , s c c , 2 , , s c c , | S c c | ( c = 1 , 2 , , k ) with the smallest MMD value in Sc is found by Equation (19). Calculated the average MMD of all sample clusters in the target domain. Finally, the inverse of the MMD average value is taken as the overall similarity (Sid) between the source domain and the target domain samples. The higher the Sid value, the greater the similarity between the source domain and the target domain. The MMD is shown as follows:
M M D = m i n c = 1 , 2 , k 1 S c c j S c c ϕ s c c , j 1 T c k j T c k ϕ t c k , j H 2 ,

3.4. Transfer Strategy

Finding the most matching historical problem to the target problem in the source domain by MMD, the optimal solution set of the historical problem is transferred to generate new walruses to replace some walruses of the population in the target domain. In order to increase the population diversity and avoid negative transfer, the replaced proportion of the initial population is automatically set based on the Sid value between the historical problem and the target problem. The calculation formula is shown in Equation (20):
r a t = γ m i n + ( γ m a x γ m i n ) × Sid ,
where γ m a x = 0.5 and γ m i n = 0.1 are the upper and lower limits of the proportion of walruses initialized by transfer strategy to control the r a t value.
Assume the optimal solution set obtained from the source domain is S o l s = s o l s , 1 , s o l s , 2 , , s o l s , M . The target domain solution set is S o l t = s o l t , 1 , s o l t , 2 , , s o l t , N . Firstly, Q = r a t × N walruses, except for the optimal walrus, are randomly selected from S o l t to generate the solution set S o l t = s o l t , 1 , s o l t , 2 , , s o l t , Q to be initialized. Secondly, the individuals from S o l s with the closest distance to each walrus in S o l t are selected to form the solution set S o l s = s o l s , 1 , s o l s , 2 , , s o l s , Q . Finally, based on S o l s , all walruses in S o l t are updated by Equation (21) to generate Q new walruses. These Q new walruses are then applied to replace the corresponding walruses in S o l t .
s o l ˜ t , 1 s o l ˜ t , 2 s o l ˜ t , Q = s o l t , 1 s o l t , 2 s o l t , Q + s o l t , 1 s o l s , 1 0 0 0 0 s o l t , 2 s o l s , 2 0 0 0 0 0 s o l t , Q s o l s , Q × Δ V ,
where s o l ˜ t , q is a newly generated walrus and Δ V = [ N ( 0 , 1 ) , N ( 0 , 1 ) , , N ( 0 , 1 ) ] T is a random vector that obeys the standard normal distribution.

3.4.1. Updating the History Library

AMWO is iterated continuously to update the positions of the walruses in S o l t . Assume the current population is S o l = s o l 1 , s o l 2 , s o l N , and calculate the F i t _ v a l u e of each walrus. The walruses with the highest F i t _ v a l u e for each cluster are stored in representative set L = l 1 , l 2 , , l k , the distance between any two walruses in L is calculated, and the smallest distance value is taken as the initial cluster radius R1. During iterations, L and R1 are updated every μ × T (μ is a random number lies in the range of (0, 1)) iterations until the algorithm terminates.
The update strategy is as follows: starting with the first walrus in Sol, evaluate its position and fitness relationship with each walrus in L sequentially, until N walruses in Sol are evaluated.
Such as the distance between each walrus in L and s o l n is calculated. Find the walrus l m i n in L that is closest to s o l n , and their distance is denoted d . If d ( s o l n , l m i n ) < R 1 and F i t _ v a l u e s o l n > F i t _ v a l u e l m i n , then l m i n is replaced by s o l n . If d ( s o l n , l m i n ) < R 1 and F i t _ v a l u e s o l n < F i t _ v a l u e l m i n , retain l m i n in L . If d ( s o l n , l m i n ) > R 1 and F i t _ v a l u e s o l n > F i t _ v a l u e l m i n , then the walrus with the worst F i t _ v a l u e in L is replaced by s o l n . If d ( s o l n , l m i n ) > R 1 and F i t _ v a l u e s o l n < F i t _ v a l u e l m i n , s o l n is deleted and the walruses in L remain unchanged.
The distance between any two walruses in L is calculated, with the smallest distance value is taken as the new cluster radius. The statistical features and L of the target problem are stored in HL.

4. Results and Discussion

In order to verify the effectiveness of MTL-AMWO, a large number of experiments are conducted in this section. The convergence of MTL-AMWO is compared with MTL-WO and M-FNAS [21]. The accuracy of MTL-AMWO is compared with MTL-WO and M-FNAS. In this paper, the hyperparameter ‘maximum depth’ of the Cart tree is set to 25, and the hyperparameter ‘number of hidden layers’ of the BP neural network is set to 1. The hyperparameter ‘ft’ of AMWO is set to 10, and the hyperparameter ‘T’ is 100, the hyperparameter ‘Num’ is set to 40, the hyperparameter ‘ε’ is 5, and the hyperparameter ‘η’ is 1.01. The hyperparameter ‘T’ of WO is set to 100, and the hyperparameter ‘Num’ of WO is set to 40. The hyperparameter ‘T’ of DE in M-FNAS is set to 100, and the hyperparameter ‘Num’ of DE is set to 40. The other hyperparameters of the above algorithms are set to default values.
The experiments are carried out by the sklearn library of Python (version 3.9.13).

4.1. Experimental Datasets

In this paper, the six datasets collected from Refs [2,5,8,9,14,46,47,48,49,50,51,52] contain 986 samples, including 323 quinary HEA samples, 366 senary HEA samples, and 297 septenary HEA samples. For the convenience of readers, the six datasets are numbered as D1, D2, D3, D4, D5, and D6.
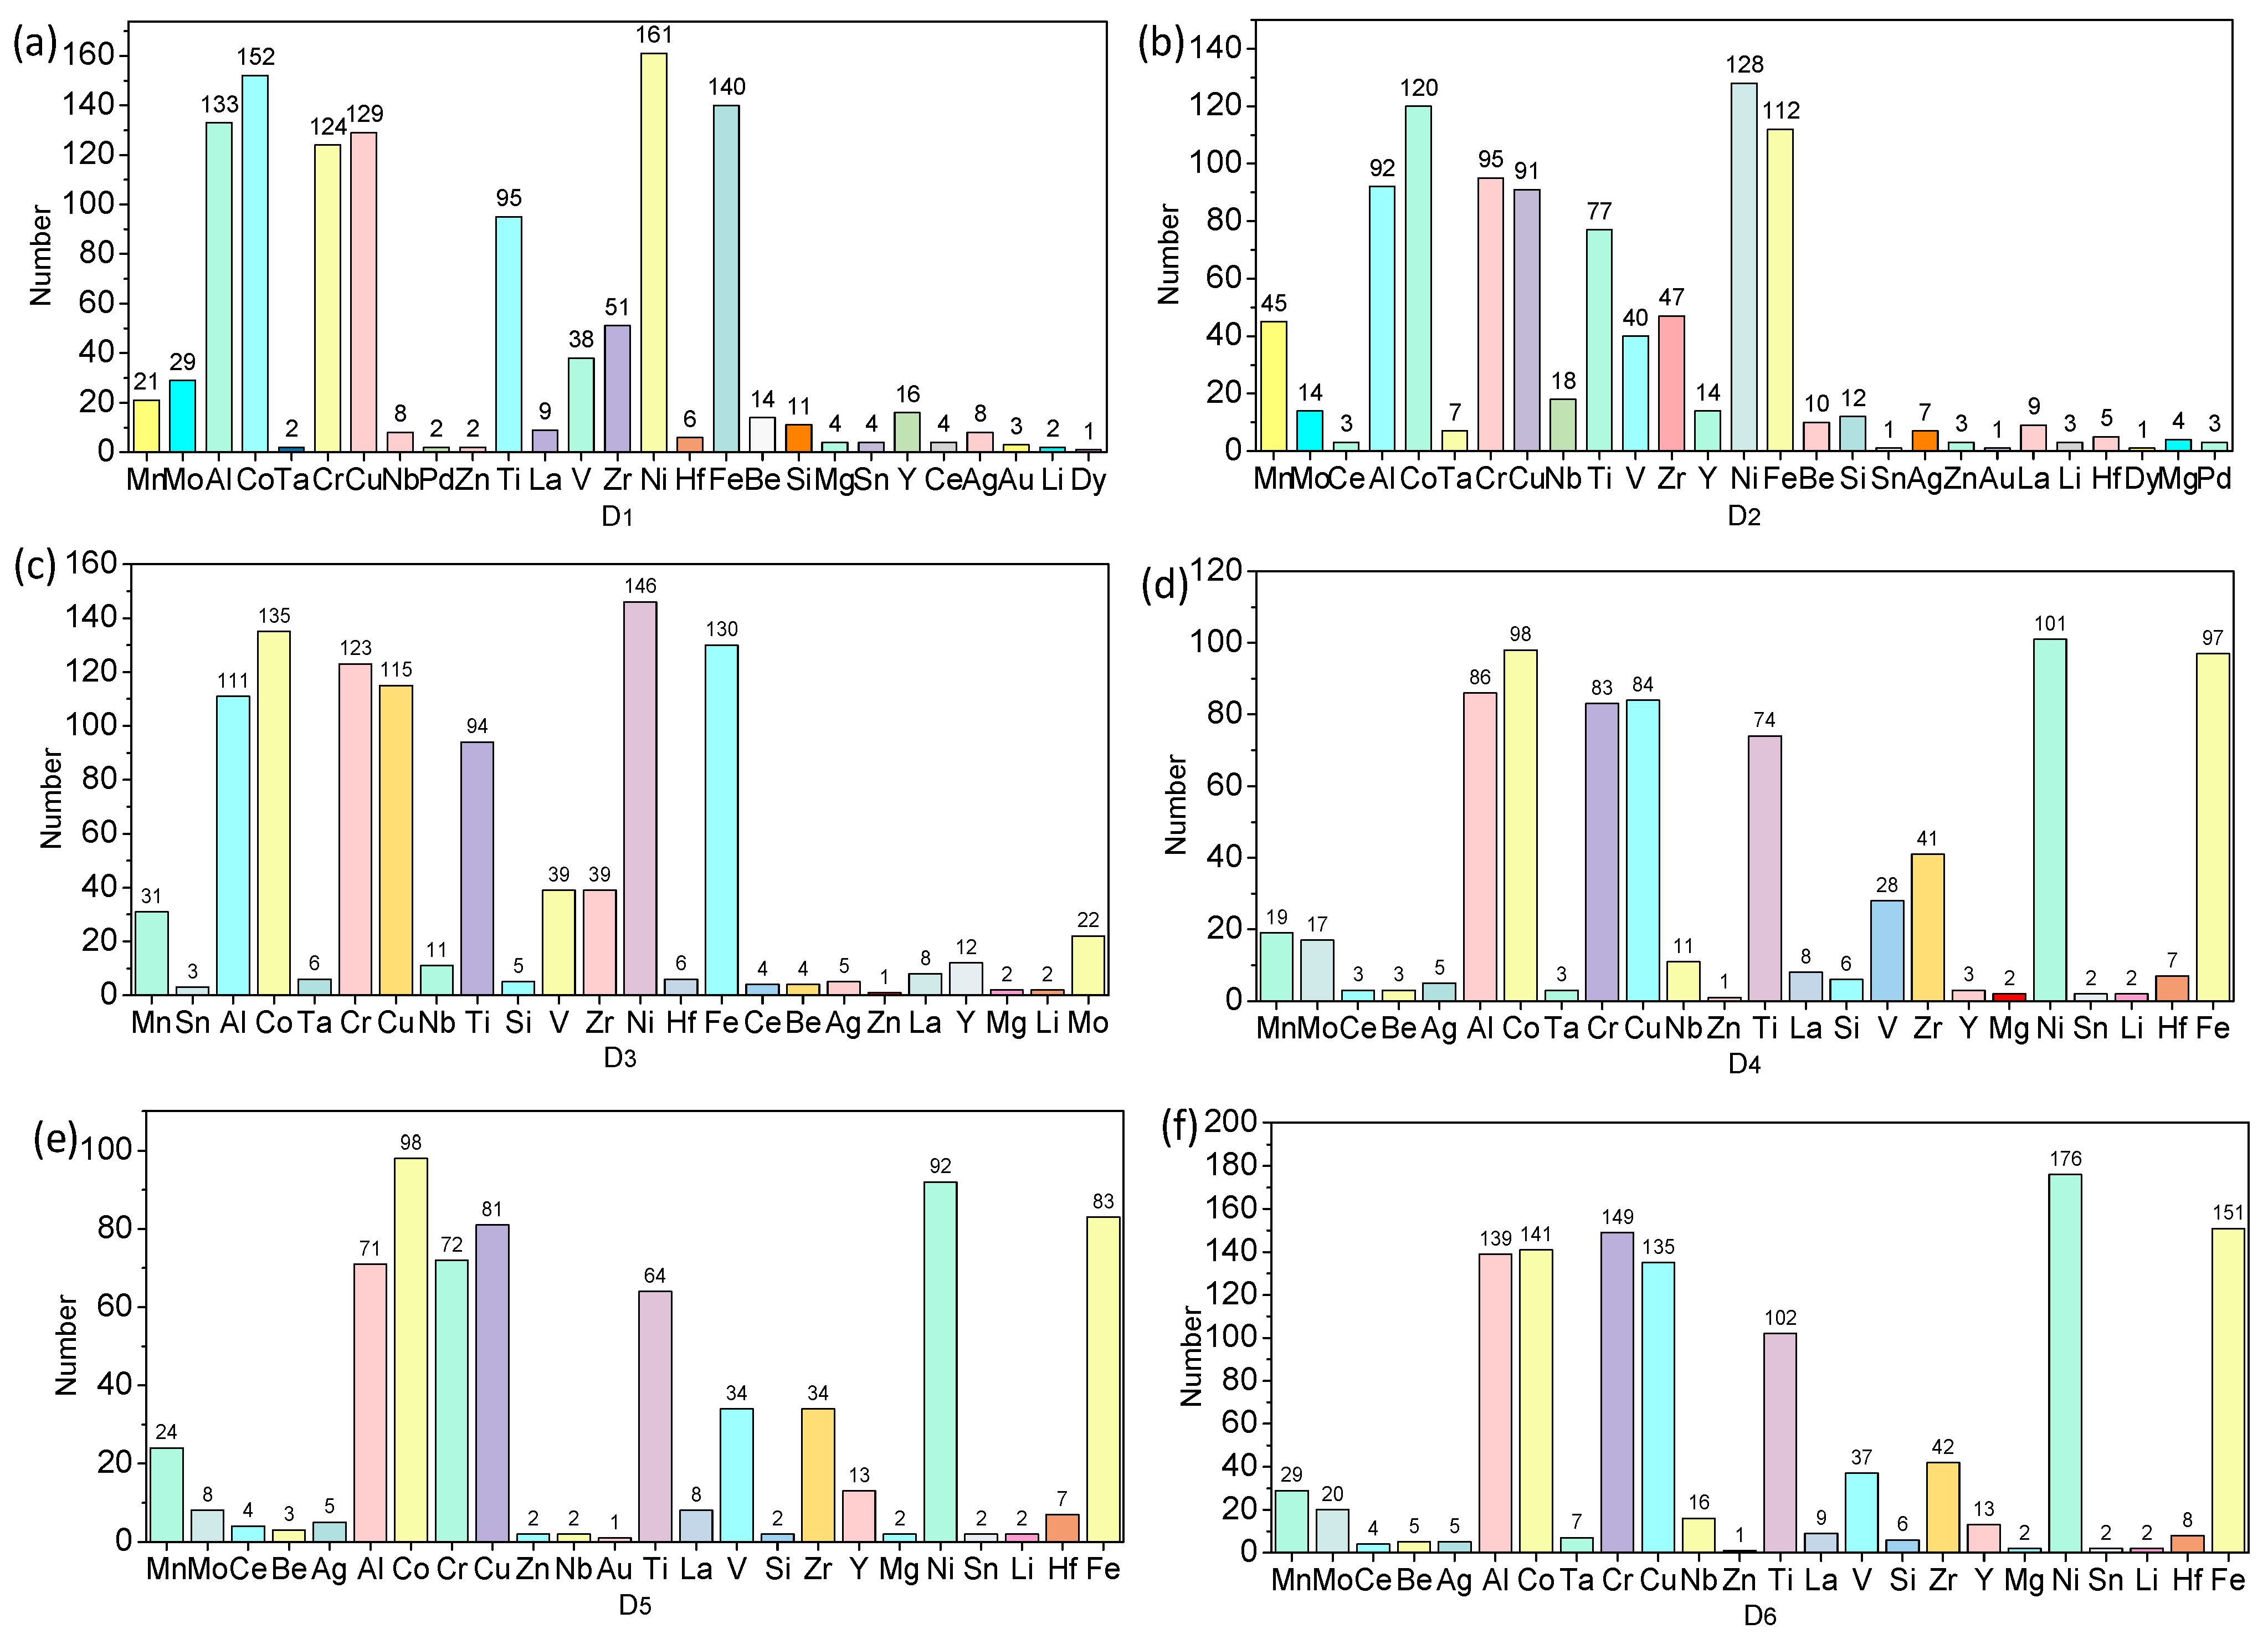
The 27 elements in the six datasets are Mn, Mo, Ce, Ag, Al, Co, Ta, Cr, Cu, Zn, Pd, Au, Nb, Ti, La, V, Si, Zr, Y, Mg, Ni, Sn, Li, Hf, Be, Dy, and Fe. The occurrence numbers of each element in each dataset are shown in Figure 4.
As shown in Figure 4, (a) represents D1, (b) represents D2, (c) represents D3, (d) represents D4, (e) represents D5, and (f) represents D6. The occurrence numbers of each element in D1, D2, D3, D4, D5, and D6 are different. The element Ni appears the most frequently, whereas the elements Dy only occur twice.
For the convenience of readers, a snapshot of the first six samples in the HEAs dataset in Pandas DataFrame format is shown in Table 1.
As shown in Table 1, the first column is the index, the second column is the name of HEA samples, the third to seventh columns are the parameter values of HEAs, and the eighth column is the phases of HEAs.
To understand the relationships between any two parameters in Table 1, the Pearson correlation coefficient H p q is selected to evaluate the correlation between the parameters of HEAs. Calculating correlations on HEA datasets can quantitatively describe the degree of correlation between these parameters and is very helpful in helping readers understand the characteristics of different parameters and data. The Pearson correlation coefficient ( H ) between parameters p and q is shown in Equation (22) [5]:
H p q = i = 1 n p i p ¯ q i q ¯ i = 1 n p i p ¯ 2 i = 1 n q i q ¯ 2 ,
where p i and q i are the sample values of parameters p and q , respectively. p ¯ and q ¯ are the mean values of parameters p and q , respectively. n is the number of samples. H p q = 1 indicates that p and q are perfectly positively correlated. H p q = 1 indicates that p and q are perfectly negatively correlated. The correlation among the five parameters is shown in Figure 5.
As shown in Figure 5, each cell represents the Pearson correlation coefficient value between the two parameters. Color intensity is proportional to the correlation coefficients. On the left side of the correlogram, the legend color shows the relationship between the correlation coefficients and the corresponding color. The darker the blue color, the higher the correlation; the darker the orange color, the lower the correlation. The range of the Pearson correlation coefficient value in the six datasets is between −0.81 and 0.78. Among them, ∆Smix and Ω in D5 have the highest correlation.
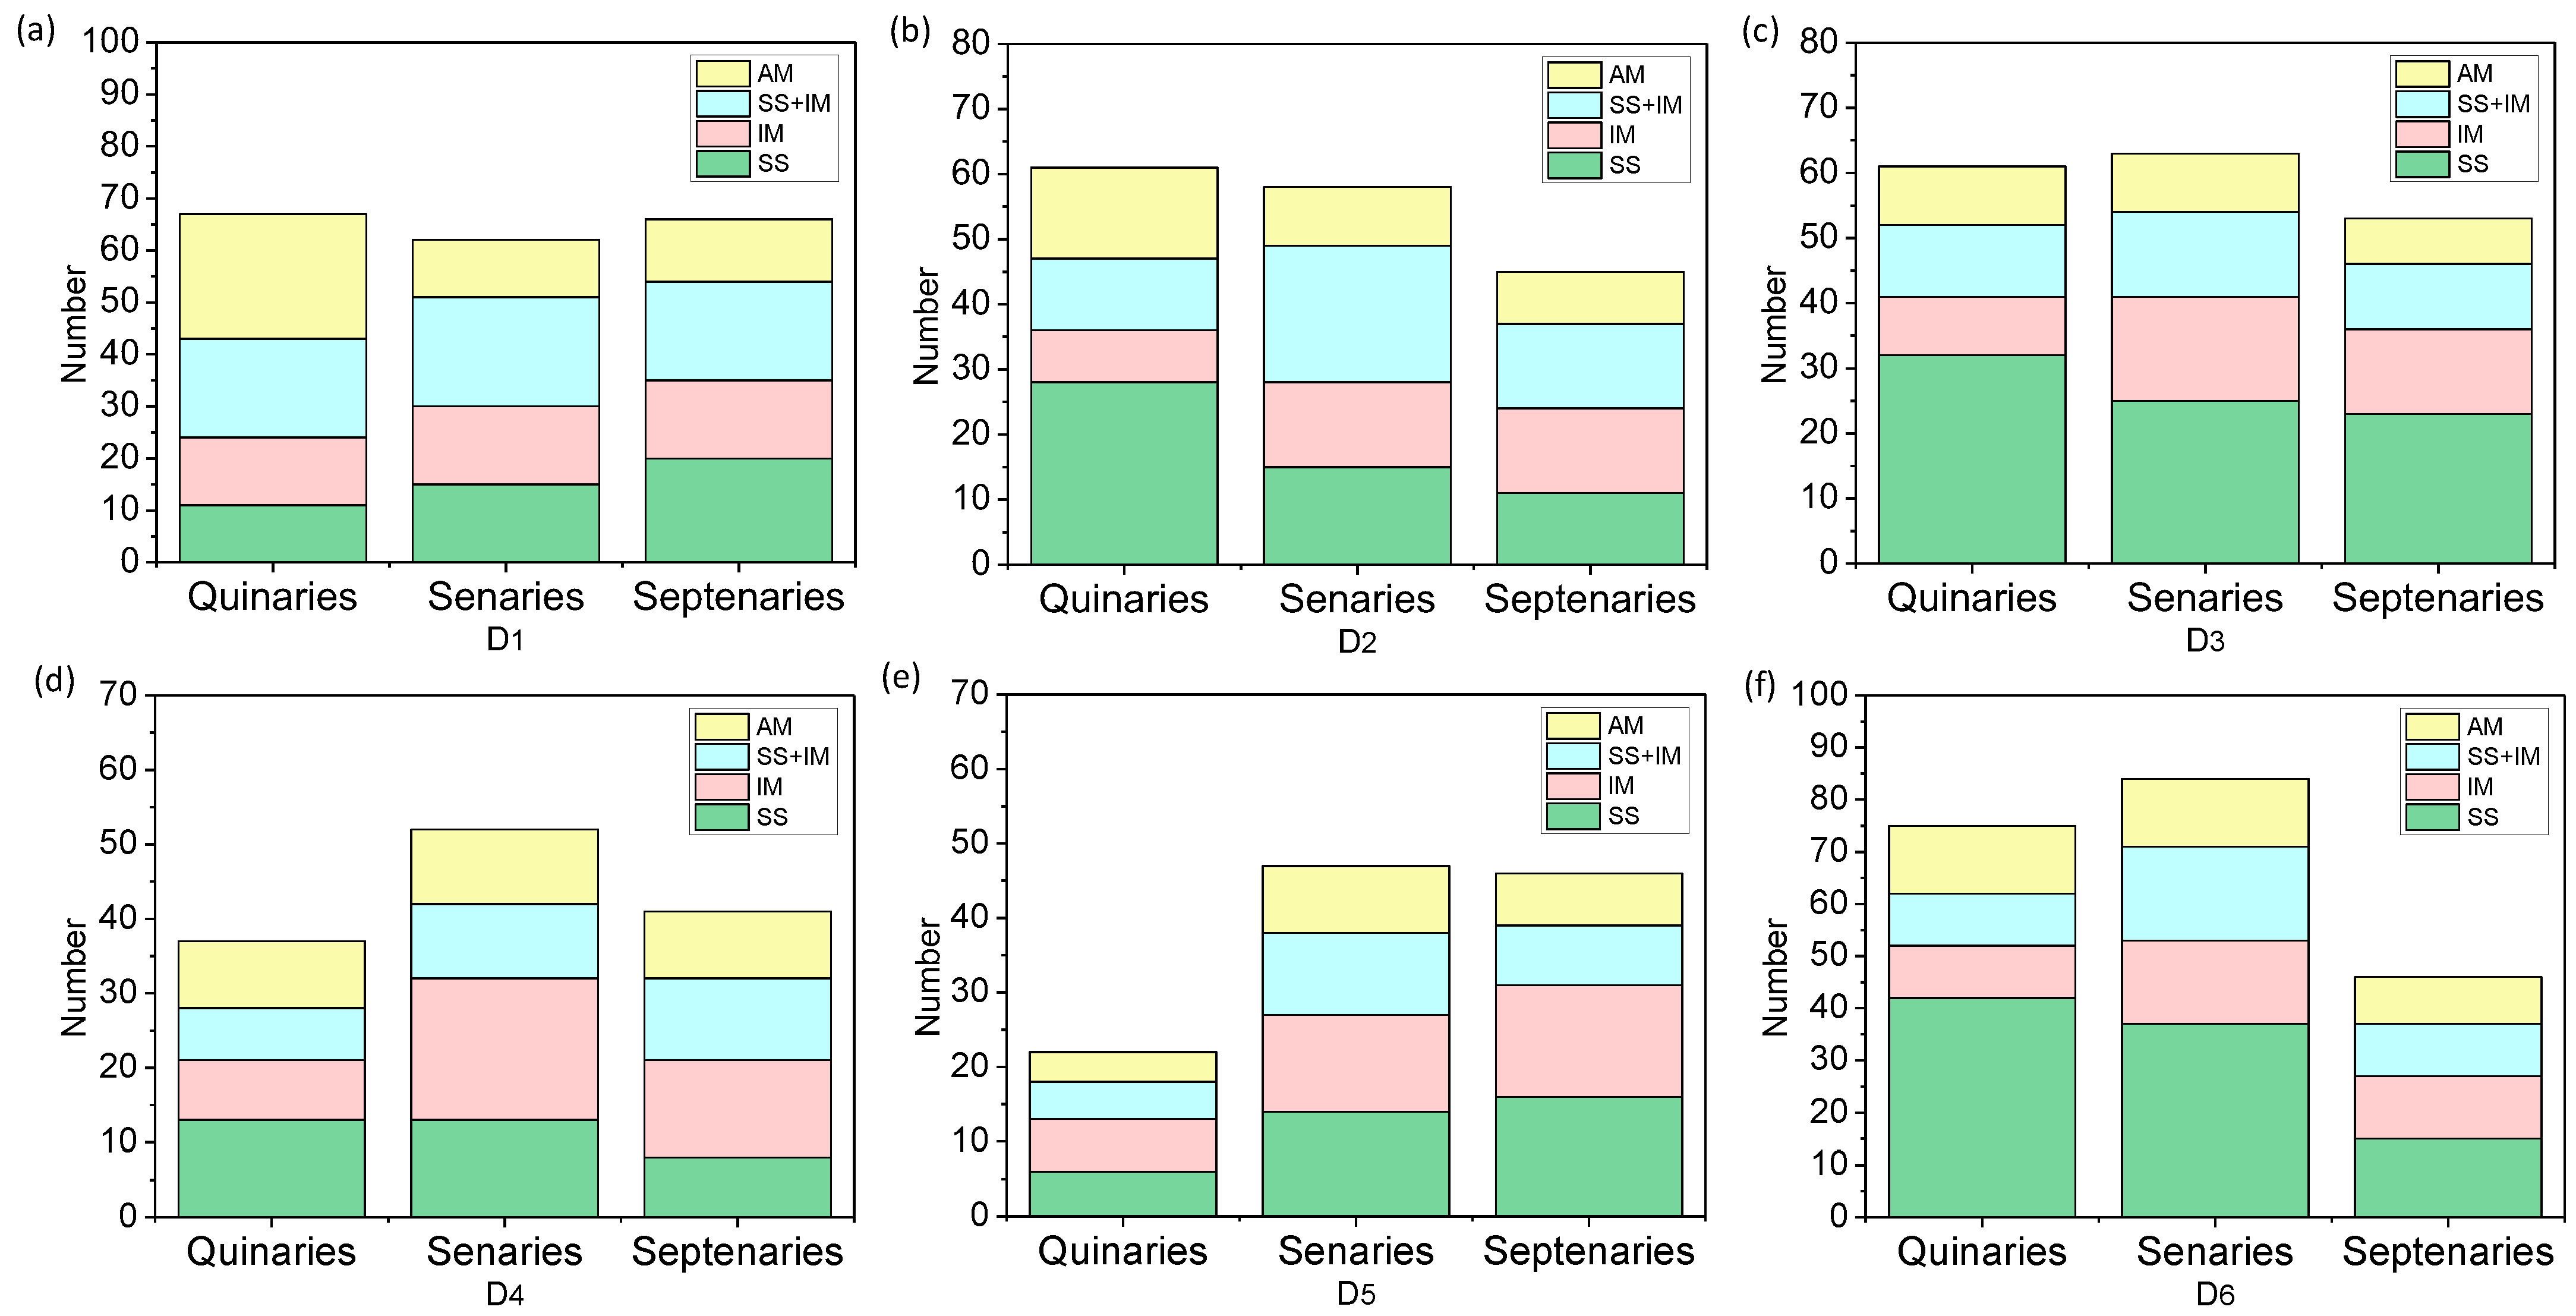
The phases of 986 HEA samples include SS, IM, AM, and SS + IM. The quantities of SS, IM, AM, and SS + IM of quinaries, senaries, and septenaries HEA samples in the six datasets are shown in Figure 6.
As shown in Figure 6, (a) represents D1, (b) represents D2, (c) represents D3, (d) represents D4, (e) represents D5, and (f) represents D6. The numbers of SS, IM, AM, and SS + IM in quinaries, senaries, and septenaries samples in D1, D2, D3, D4, D5, and D6 are different. In the six datasets, the number of samples with the SS phase is the largest, whereas the number of samples with the AM phase is the smallest.

4.2. Comparison of Convergence for MTL-AMWO, MTL-WO, and M-FNAS

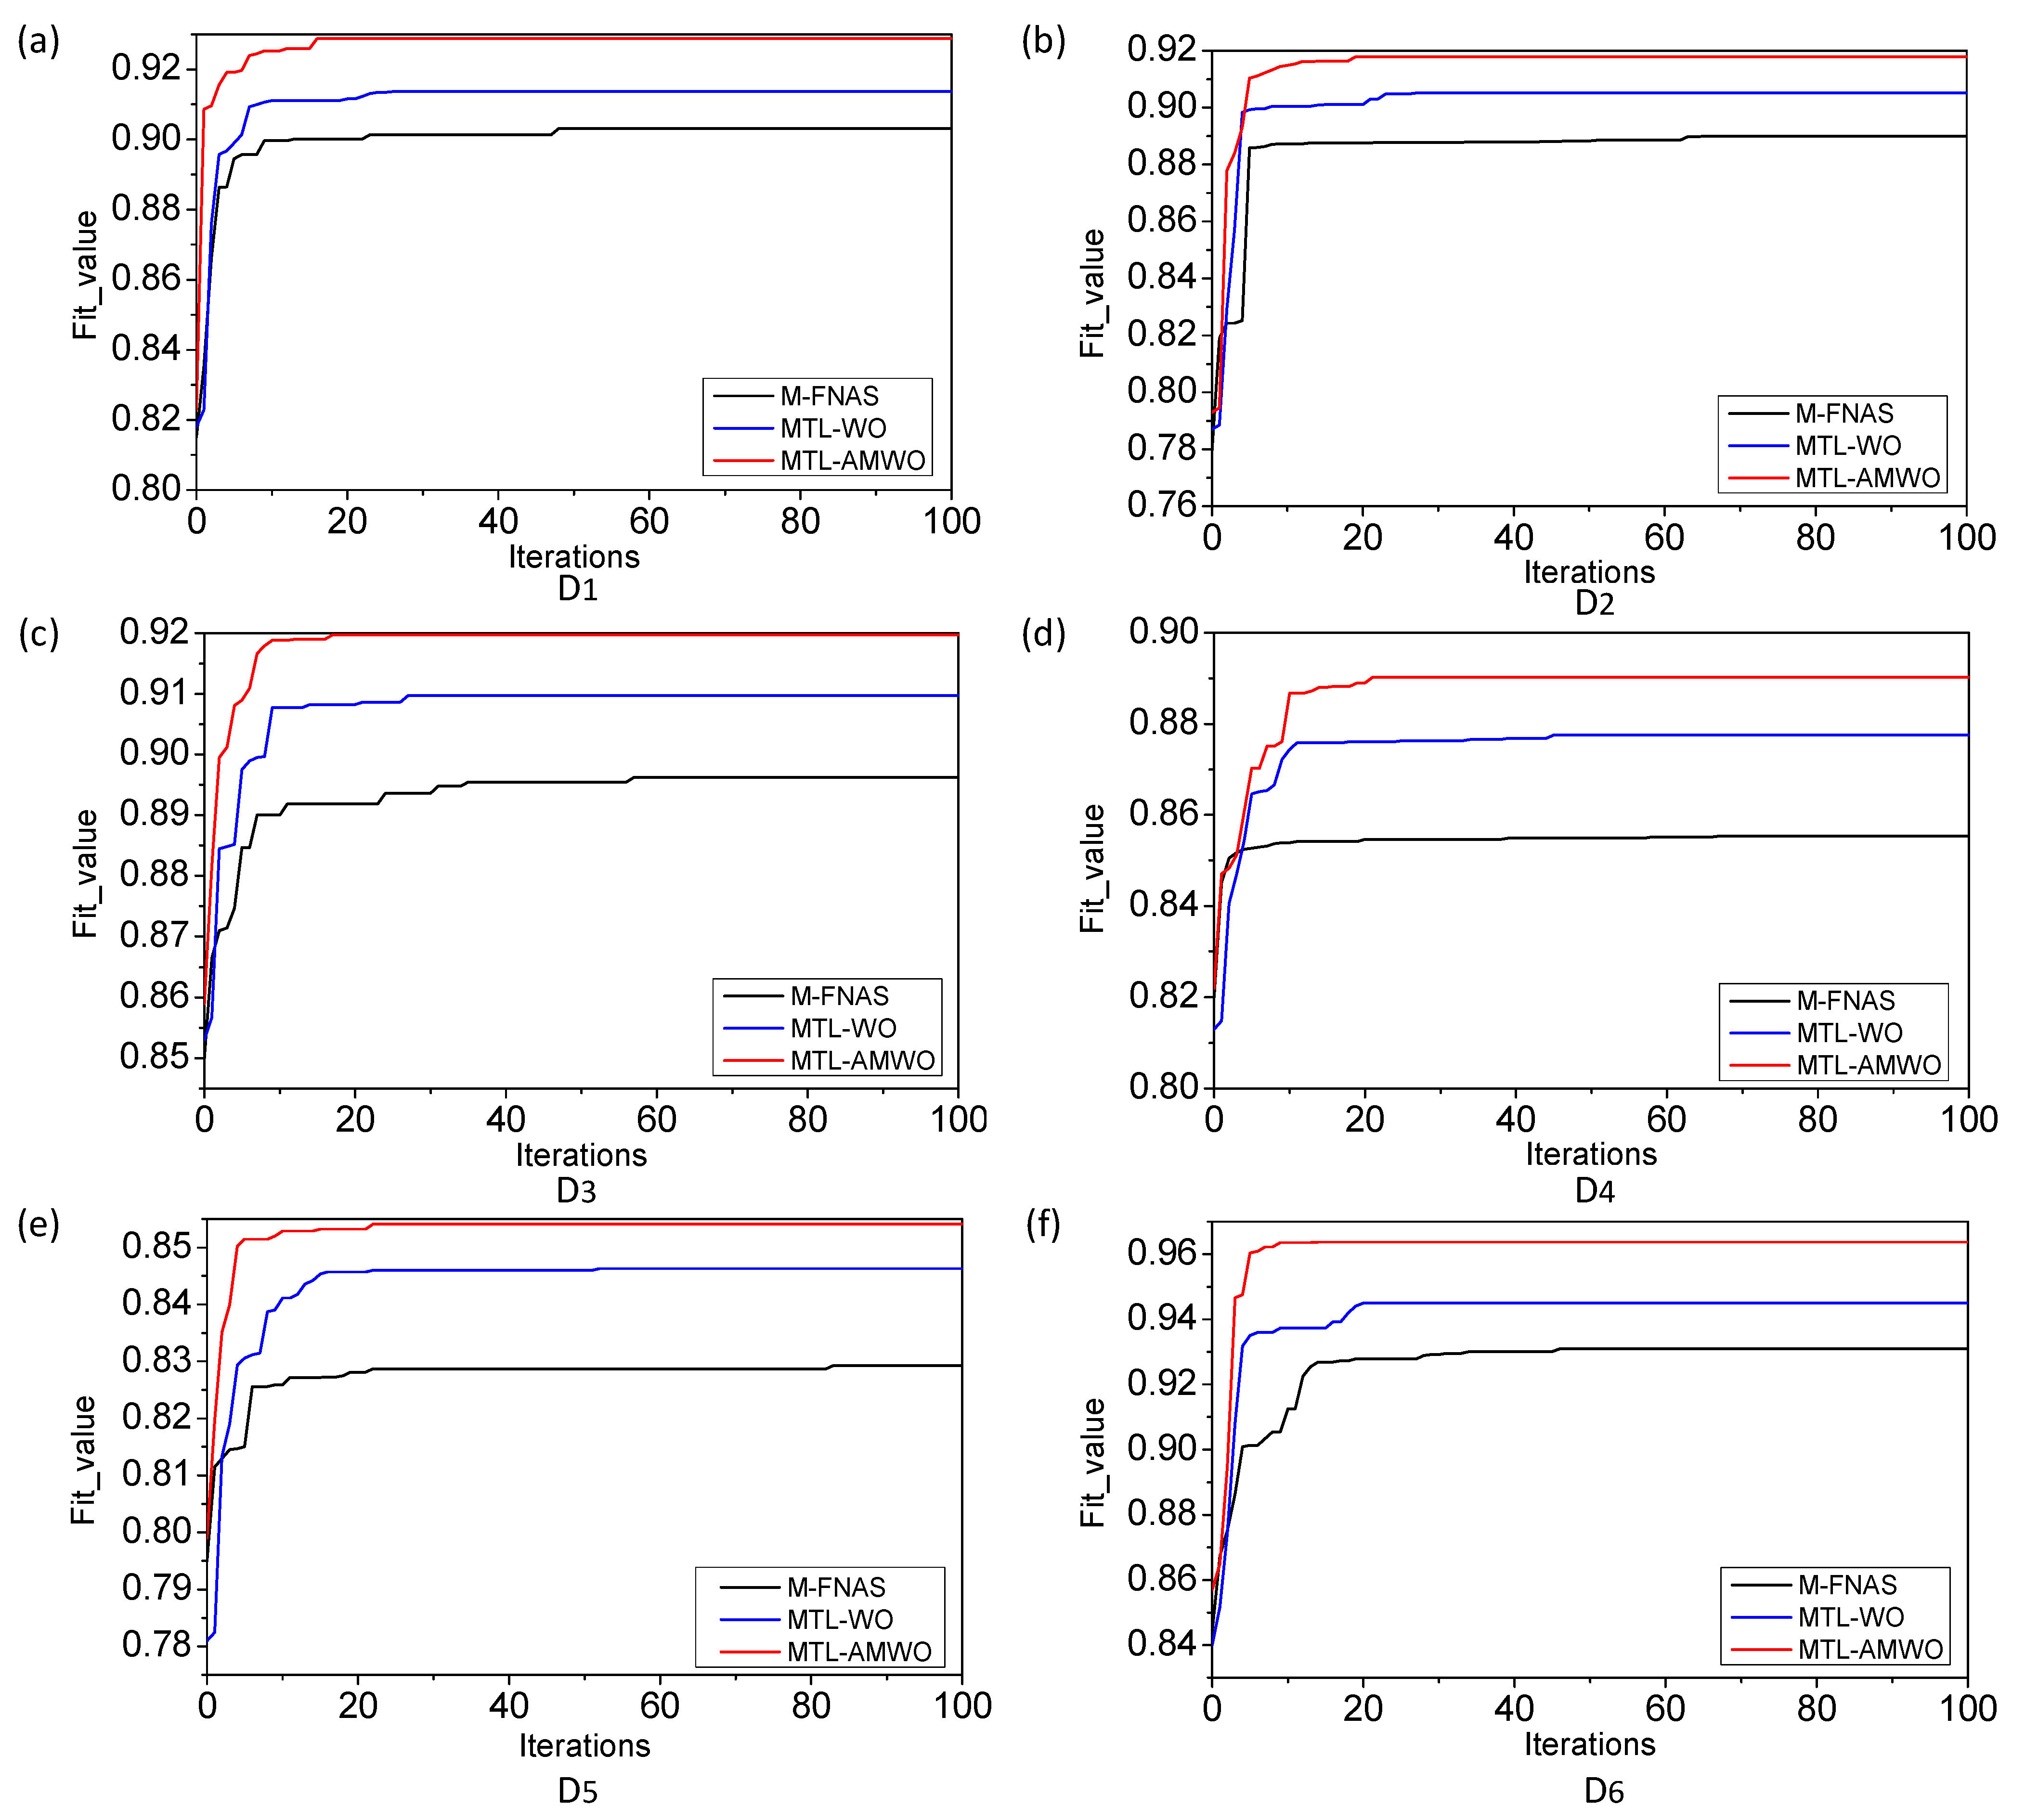
The compositional space of HEAs is vast. If the convergence speed of algorithm training can be improved, it would reduce the computational resources required for HEAs and achieve the desired accuracy in a shorter time, thereby improving the prediction accuracy of the model and accelerating the development of materials. To verify the convergence of MTL-AMWO, the experimental results of MTL-AMWO on the six datasets are compared with MTL-WO and M-FNAS in this section. The convergence curves of MTL-AMWO, MTL-WO, and M-FNAS in the six datasets are shown in Figure 7. The red line shows the convergence curve of MTL-AMWO. The blue line represents the convergence curve of MTL-WO. The black line shows the convergence curve of M-FNAS.
As shown in Figure 7, (a) represents D1, (b) represents D2, (c) represents D3, (d) represents D4, (e) represents D5, and (f) represents D6. In the six subfigures, the convergence speed of MTL-AMWO is the fastest and can achieve the expected accuracy in a shorter time. The convergence speed of MTL-AMWO is faster than MTL-WO. The reasons may be as follows: firstly, MTL-AMWO employs an adaptive migration strategy that allows the AMWO in MTL-AMWO to adaptively migrate walruses based on changes in the population’s average fitness value over multiple iterations, thereby avoiding falling into a local optimum. Secondly, the BRDPC algorithm in MTL-AMWO can further improve the effectiveness of the transfer by clustering the samples in the source and target domains into several clusters with similar distributions, respectively. The convergence speed of MTL-WO is faster than M-FNAS. The reason may be that MTL-WO adopts a transfer strategy to transfer the optimal solution set of similar historical problems in the source domain to the target problem, thereby improving the population’s search speed and efficiency in the search process.

4.3. Accuracy Comparison of MTL-AMWO, MTL-WO and M-FNAS

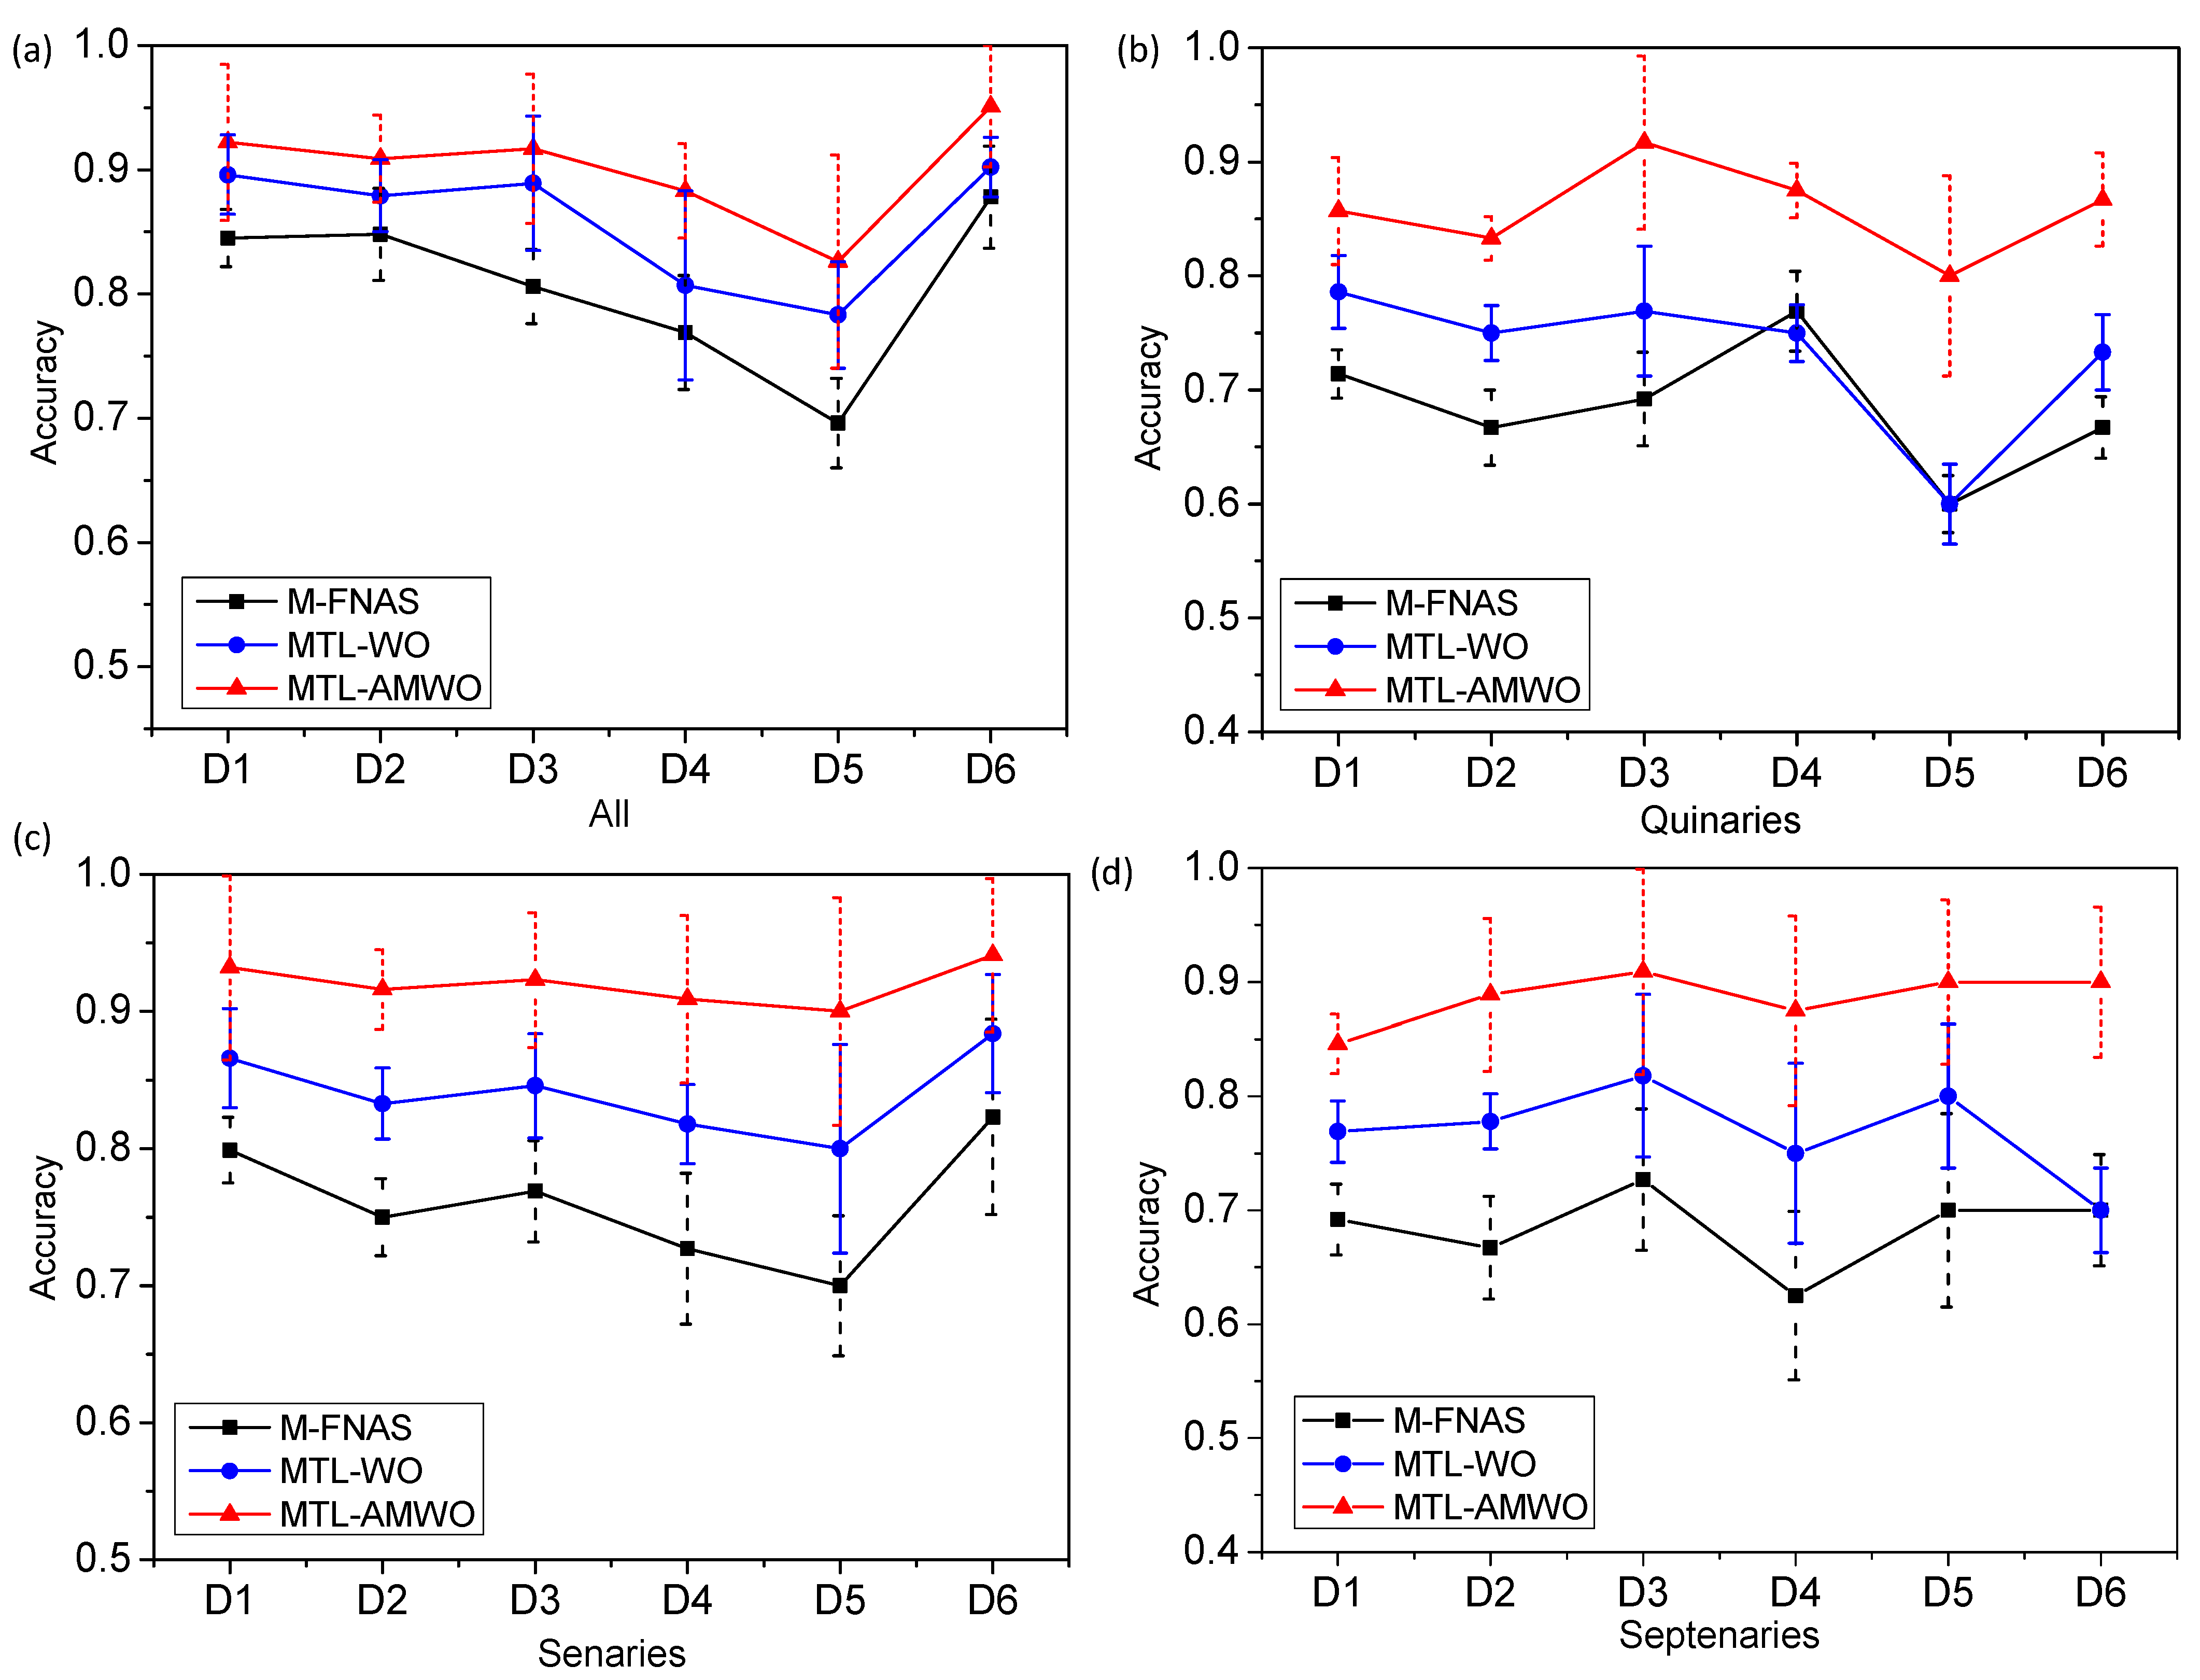
To verify the accuracy of MTL-AMWO, comparison experiments among MTL-AMWO, MTL-WO, and M-FNAS are carried out. In the experiment, 60% of the dataset is selected as the training dataset, 20% as the validation dataset, and the remaining 20% as the test dataset. The five-fold cross-validation method is carried out 20 times to avoid overfitting. The comparison experimental results of MTL-AMWO, MTL-WO, and M-FNAS for all, quinaries, senaries, and septenaries are shown in Figure 8.
As shown in Figure 8, the experimental results of all quinaries, senaries, and septenaries among MTL-AMWO, MTL-WO, and M-FNAS are shown in (a), (b), (c), and (d), respectively. In Figure 8, (a) represents all HEA samples of the six datasets. (b) represents the quinary HEA samples in the six datasets. (c) represents the senary HEA samples in the six datasets. (d) represents the septenary HEA samples in the six datasets. The red line with upward triangles shows the accuracy of MTL-AMWO. The blue line with circles represents the accuracy of MTL-WO. The black line with squares shows the accuracy of M-FNAS.
In order to facilitate the reader’s observation, the results of all quinaries, senaries, and septenaries are shown in Table 2, Table 3, Table 4 and Table 5. Column 1 is the ID of different datasets. Columns 2 to 4 are the experimental results of M-FNAS, MTL-WO, and MTL-AMWO, respectively. The bold part of the tables is the algorithm with the highest accuracy on the corresponding dataset.
As shown in Table 2, the accuracy of MTL-AMWO is the highest in D1, D2, D3, D4, D5, and D6; the accuracies are 0.922, 0.909, 0.917, 0.883, 0.826, and 0.951, respectively. The accuracy of MTL-WO is the second highest in D1, D2, D3, D4, D5, and D6; the accuracies are 0.896, 0.879, 0.889, 0.807, 0.783, and 0.902, respectively.
As shown in Table 3, the accuracy of MTL-AMWO is the highest in D1, D2, D3, D4, D5, and D6; the accuracies are 0.857, 0.833, 0.917, 0.875, 0.800, and 0.867, respectively. The accuracy of MTL-WO is the second highest in D1, D2, D3, and D6; the accuracies are 0.786, 0.750, 0.769, and 0.733, respectively.
As shown in Table 4, the accuracy of MTL-AMWO is the highest in D1, D2, D3, D4, D5, and D6; the accuracies are 0.932, 0.916, 0.923, 0.909, 0.900, and 0.941, respectively. The accuracy of MTL-WO is the second highest in D1, D2, D3, D4, D5, and D6; the accuracies are 0.866, 0.833, 0.846, 0.818, 0.800, and 0.884, respectively.
As shown in Table 5, the accuracy of MTL-AMWO is the highest in D1, D2, D3, D4, D5, and D6; the accuracies are 0.846, 0.889, 0.909, 0.875, 0.900, and 0.900, respectively. The accuracy of MTL-WO is the second highest in D1, D2, D3, D4, and D5. The accuracies are 0.769, 0.778, 0.818, 0.750, and 0.800, respectively.
As shown in Figure 8 and Table 2, Table 3, Table 4 and Table 5, the accuracy of MTL-AMWO is the highest. Meanwhile, the accuracy of MTL-WO is higher than M-FNAS; the reason may be that the transfer strategy in MTL-WO can improve the population’s search speed and efficiency in the search process by transferring the optimal solution set of similar historical problems in the source domain to the target problem. The accuracy of MTL-AMWO is higher than MTL-WO. There are two possible reasons. Firstly, the AMWO algorithm in MTL-AMWO can bring the population closer to the optimal solution by adaptively migrating walruses based on changes in the population’s average fitness value over multiple iterations. Secondly, the BRDPC algorithm in MTL-AMWO can further improve the effectiveness of the transfer by clustering the samples in the source domain and the target domain into several clusters with similar distributions, respectively. Therefore, the accuracy of MTL-AMWO is higher than MTL-WO and M-FNAS.

5. Conclusions

In conclusion, a transferable meta-learning phase prediction model for high-entropy alloys based on an adaptive migration walrus optimizer is proposed. The effectiveness of the proposed model is verified on six datasets.
Firstly, a transferable meta-learning algorithm frame is proposed, which consists of meta-learning based on adaptive migration walrus optimizer, balanced-relative density peaks clustering, and transfer strategy.
Secondly, a walrus optimizer model based on an adaptive migration strategy is proposed, which can adaptively migrate walruses according to the changes in the average fitness value of the population over multiple iterations.
Thirdly, a balanced-relative density peaks clustering algorithm is proposed to cluster the samples in the source and target domains into several clusters with similar distributions, respectively.
Finally, the transfer strategy adopts MMD to find the most matching historical problem in the source domain and transfer the optimal solution set information of the historical problem to the target domain.
Moreover, the experimental results show that the convergence speed of MTL-AMWO is faster than MTL-WO and M-FNAS. The accuracy of MTL-AMWO is higher than MTL-WO and M-FNAS. Among these, the accuracy of MTL-WO is higher than M-FNAS, and the accuracy of MTL-AMWO is higher than MTL-WO. Although our proposed model has achieved good results in accuracy, the reasons for misclassification include insufficient or imbalanced sample data, inaccurate feature extraction, inappropriate algorithm selection, data noise, outliers, underfitting, or overfitting. Therefore, future research will focus on these issues to further improve the performance of the model.
This paper provides a novel algorithm to predict the phases of HEAs. This method is not only applicable to the field of HEAs but also has a wide range of application potential and can be applied to prediction and optimization problems of other materials.
This study primarily focuses on adopting machine-learning methods to predict the phases of HEAs. In future research, we will explore the relationship between microstructure, mechanical properties, and phase prediction, combining experimental verification to further enhance the applicability of HEAs in practical scenarios.

Author Contributions

Conceptualization, S.H. and M.Z.; methodology, S.H. and M.Z.; validation, S.H., M.Z., M.B., W.L., H.G., B.Y. and H.L.; formal analysis, M.B., W.L., H.G., B.Y. and H.L.; data curation, M.Z.; writing—original draft preparation, M.Z.; writing—review and editing, M.B., W.L., H.G., B.Y. and H.L.; visualization, M.Z.; supervision, S.H.; funding acquisition, S.H., M.B. and W.L. All authors have read and agreed to the published version of the manuscript.

Funding

This research work was supported in part by the National Natural Science Foundation of China (No. 52175455), the Liaoning Province Natural Science Foundation of China (No. 2023-MSBA-006), and the Fundamental Research Funds for the Central Universities (No. DUT24MS006).

Institutional Review Board Statement

Not applicable.

Informed Consent Statement

Not applicable.

Data Availability Statement

The data presented in this study are available on request from the corresponding author. The data are not publicly available due to privacy.

Conflicts of Interest

The authors declare no conflicts of interest.

References

  1. Zhang, C.; Zhu, J.; Zheng, H.; Li, H.; Liu, S.; Cheng, G.J. A review on microstructures and properties of high entropy alloys manufactured by selective laser melting. Int. J. Extrem. Manuf. 2020, 2, 032003. [Google Scholar] [CrossRef]
  2. Miracle, D.B.; Senkov, O.N. A critical review of high entropy alloys and related concepts. Acta Mater. 2017, 122, 448–511. [Google Scholar] [CrossRef]
  3. Gorniewicz, D.; Przygucki, H.; Kopec, M.; Karczewski, K.; Jóźwiak, S. TiCoCrFeMn (BCC + C14) High-Entropy Alloy Multiphase Structure Analysis Based on the Theory of Molecular Orbitals. Materials 2021, 14, 5285. [Google Scholar] [CrossRef] [PubMed]
  4. Liu, L.; Paudel, R.; Liu, Y.; Zhao, X.L.; Zhu, J.C. Theoretical and Experimental Studies of the Structural, Phase Stability and Elastic Properties of AlCrTiFeNi Multi-Principle Element Alloy. Materials 2020, 13, 4353. [Google Scholar] [CrossRef]
  5. Dai, D.; Xu, T.; Wei, X.; Ding, G.; Xu, Y.; Zhang, J.; Zhang, H. Using machine learning and feature engineering to characterize limited material datasets of high-entropy alloys. Comput. Mater. Sci. 2020, 175, 109618. [Google Scholar] [CrossRef]
  6. Rickman, J.M.; Chan, H.M.; Harmer, M.P.; Smeltzer, J.A.; Marvel, C.J.; Roy, A.; Balasubramanian, G. Materials informatics for the screening of multi-principal elements and high-entropy alloys. Nat. Commun. 2019, 10, 2618. [Google Scholar] [CrossRef]
  7. Yang, X.; Zhang, Y. Prediction of high-entropy stabilized solid-solution in multi-component alloys. Mater. Chem. Phys. 2012, 132, 233–238. [Google Scholar] [CrossRef]
  8. Senkov, O.N.; Miracle, D.B. A new thermodynamic parameter to predict formation of solid solution or intermetallic phases in high entropy alloys. J. Alloys Compd. 2016, 658, 603–607. [Google Scholar] [CrossRef]
  9. Gao, M.C.; Zhang, C.; Gao, P.; Zhang, F.; Ouyang, L.Z.; Widom, M.; Hawk, J.A. Thermodynamics of concentrated solid solution alloys. Curr. Opin. Solid State Mater. Sci. 2017, 21, 238–251. [Google Scholar] [CrossRef]
  10. Ding, Q.; Zhang, Y.; Chen, X.; Fu, X.; Chen, D.; Chen, S.; Yu, Q. Tuning element distribution, structure and properties by composition in high-entropy alloys. Nature 2019, 574, 223–227. [Google Scholar] [CrossRef]
  11. Zhao, S.; Yuan, R.; Liao, W.; Zhao, Y.; Wang, J.; Li, J.; Lookman, T. Descriptors for phase prediction of high entropy alloys using interpretable machine learning. J. Mater. Chem. A 2024, 12, 2807–2819. [Google Scholar] [CrossRef]
  12. Li, Z.; Pradeep, K.G.; Deng, Y.; Raabe, D.; Tasan, C.C. Metastable high-entropy dual-phase alloys overcome the strength–ductility trade-off. Nature 2016, 534, 227–230. [Google Scholar] [CrossRef]
  13. Deshmukh, A.A.; Ranganathan, R. Recent advances in modelling structure-property correlations in high-entropy alloys. J. Mater. Sci. Technol. 2024, 204, 127–151. [Google Scholar] [CrossRef]
  14. Ye, Y.F.; Wang, Q.; Lu, J.; Liu, C.T.; Yang, Y. High-entropy alloy: Challenges and prospects. Mater. Today 2016, 19, 349–362. [Google Scholar] [CrossRef]
  15. Singh, P.; Smirnov, A.V.; Alam, A.; Johnson, D.D. First-principles prediction of incipient order in arbitrary high-entropy alloys: Exemplified in Ti0.25CrFeNiAlx. Acta Mater. 2020, 189, 248–254. [Google Scholar] [CrossRef]
  16. Bobbili, R.; Ramakrishna, B. Prediction of phases in high entropy alloys using machine learning. Mater. Today Commun. 2023, 36, 106674. [Google Scholar] [CrossRef]
  17. Zhang, X.; Jia, B.; Zeng, Z.; Zeng, X.; Wan, Q.; Pogrebnjak, A.; Zhang, J.; Pelenovich, V.; Yang, B. Machine Learning-Based Design of Superhard High-Entropy Nitride Coatings. ACS Appl. Mater. Interfaces 2024, 16, 36911–36922. [Google Scholar] [CrossRef] [PubMed]
  18. Yan, Q.; Gong, D.; Shi, Q.; Hengel, A.V.D.; Shen, C.; Reid, I.; Zhang, Y. Attention-guided network for ghost-free high dynamic range imaging. In Proceedings of the IEEE/CVF Conference on Computer Vision and Pattern Recognition, Long Beach, CA, USA, 15–20 June 2019; pp. 1751–1760. [Google Scholar]
  19. Ferrari, D.G.; De Castro, L.N. Clustering algorithm selection by meta-learning systems: A new distance-based problem characterization and ranking combination methods. Inf. Sci. 2015, 301, 181–194. [Google Scholar] [CrossRef]
  20. Cao, J.; Yuan, W.; Li, W.; E, X. Dynamic ensemble pruning selection using meta-learning for multi-sensor based activity recognition. In Proceedings of the 2019 IEEE SmartWorld, Ubiquitous Intelligence & Computing, Advanced & Trusted Computing, Scalable Computing & Communications, Cloud & Big Data Computing, Internet of People and Smart City Innovation (SmartWorld/SCALCOM/UIC/ATC/CBDCom/IOP/SCI), Leicester, UK, 19–23 August 2019; pp. 1063–1068. [Google Scholar]
  21. Li, L.; Wang, Y.; Xu, Y.; Lin, K.Y. Meta-learning based industrial intelligence of feature nearest algorithm selection framework for classification problems. J. Manuf. Syst. 2022, 62, 767–776. [Google Scholar] [CrossRef]
  22. Hou, S.; Li, Y.; Bai, M.; Sun, M.; Liu, W.; Wang, C.; Lin, D. Phase prediction of high-entropy alloys by integrating criterion and machine learning recommendation method. Materials 2022, 15, 3321. [Google Scholar] [CrossRef]
  23. Zhuang, F.; Qi, Z.; Duan, K.; Xi, D.; Zhu, Y.; Zhu, H.; Xiong, H.; He, Q. A comprehensive survey on transfer learning. Proc. IEEE 2020, 109, 43–76. [Google Scholar] [CrossRef]
  24. Dinh, T.T.H.; Chu, T.H.; Nguyen, Q.U. Transfer learning in genetic programming. In Proceedings of the 2015 IEEE Congress on Evolutionary Computation (CEC), Sendai, Japan, 25–28 May 2015; pp. 1145–1151. [Google Scholar]
  25. Feng, L.; Ong, Y.S.; Tan, A.H.; Tsang, I.W. Memes as building blocks: A case study on evolutionary optimization + transfer learning for routing problems. Memetic Comput. 2015, 7, 159–180. [Google Scholar] [CrossRef]
  26. Zhang, Y.; Yang, K.; Hao, G.; Gong, D. Evolutionary optimization framework based on transfer learning of similar historical information. Acta Autom. Sin. 2021, 47, 652–665. [Google Scholar]
  27. Shi, Y.; Eberhart, R.C. Empirical study of particle swarm optimization. In Proceedings of the 1999 Congress on Evolutionary Computation-CEC99 (Cat. No. 99TH8406), Washington, DC, USA, 6–9 July 1999; Volume 3, pp. 1945–1950. [Google Scholar]
  28. Mirjalili, S.; Lewis, A. The whale optimization algorithm. Adv. Eng. Softw. 2016, 95, 51–67. [Google Scholar] [CrossRef]
  29. Han, M.; Du, Z.; Yuen, K.F.; Zhu, H.; Li, Y.; Yuan, Q. Walrus optimizer: A novel nature-inspired metaheuristic algorithm. Expert Syst. Appl. 2024, 239, 122413. [Google Scholar] [CrossRef]
  30. Ahmed, H.R. An efficient fitness-based stagnation detection method for particle swarm optimization. In Proceedings of the Companion Publication of the 2014 Annual Conference on Genetic and Evolutionary Computation, Vancouver, BC, Canada, 12–16 July 2014; pp. 1029–1032. [Google Scholar]
  31. Deng, T.; Ye, D.; Ma, R.; Fujita, H.; Xiong, L. Low-rank local tangent space embedding for subspace clustering. Inf. Sci. 2020, 508, 1–21. [Google Scholar] [CrossRef]
  32. Xu, X.; Ding, S.; Wang, Y.; Wang, L.; Jia, W. A fast density peaks clustering algorithm with sparse search. Inf. Sci. 2021, 554, 61–83. [Google Scholar] [CrossRef]
  33. Ismkhan, H. Ik-means−+: An iterative clustering algorithm based on an enhanced version of the k-means. Pattern Recognit. 2018, 79, 402–413. [Google Scholar] [CrossRef]
  34. Rodriguez, A.; Laio, A. Clustering by fast search and find of density peaks. Science 2014, 344, 1492–1496. [Google Scholar] [CrossRef]
  35. Hou, J.; Zhang, A.; Qi, N. Density peak clustering based on relative density relationship. Pattern Recognit. 2020, 108, 107554. [Google Scholar] [CrossRef]
  36. Sun, L.; Qin, X.; Ding, W.; Xu, J. Nearest neighbors-based adaptive density peaks clustering with optimized allocation strategy. Neurocomputing 2022, 473, 159–181. [Google Scholar] [CrossRef]
  37. Dobrzański, L.A.; Labisz, K.; Jonda, E.; Klimpel, A. Comparison of the surface alloying of the 32CrMoV12-28 tool steel using TiC and WC powder. J. Mater. Process. Technol. 2007, 191, 321–325. [Google Scholar] [CrossRef]
  38. Zhang, Y.; Zuo, T.T.; Tang, Z.; Gao, M.C.; Dahmen, K.A.; Liaw, P.K.; Lu, Z.P. Microstructures and properties of high-entropy alloys. Prog. Mater. Sci. 2014, 61, 1–93. [Google Scholar] [CrossRef]
  39. Chang, X.; Zeng, M.; Liu, K.; Fu, L. Phase engineering of high-entropy alloys. Adv. Mater. 2020, 32, 1907226. [Google Scholar] [CrossRef] [PubMed]
  40. Zhang, Y.; Zhou, Y.J.; Lin, J.P.; Chen, G.L.; Liaw, P.K. Solid-solution phase formation rules for multi-component alloys. Adv. Eng. Mater. 2008, 10, 534–538. [Google Scholar] [CrossRef]
  41. Takeuchi, A.; Amiya, K.; Wada, T.; Yubuta, K.; Zhang, W. High-entropy alloys with a hexagonal close-packed structure designed by equi-atomic alloy strategy and binary phase diagrams. Jom 2014, 66, 1984–1992. [Google Scholar] [CrossRef]
  42. Chanda, B.; Das, J. Composition dependence on the evolution of nanoeutectic in CoCrFeNiNbx (0.45 ≤ x ≤ 0.65) high entropy alloys. Adv. Eng. Mater. 2018, 20, 1700908. [Google Scholar] [CrossRef]
  43. Yang, X.; Chen, S.Y.; Cotton, J.D.; Zhang, Y. Phase stability of low-density, multiprincipal component alloys containing aluminum, magnesium, and lithium. Jom 2014, 66, 2009–2020. [Google Scholar] [CrossRef]
  44. Zhang, Q.; Dai, Y.; Wang, G. Density peaks clustering based on balance density and connectivity. Pattern Recognit. 2023, 134, 109052. [Google Scholar] [CrossRef]
  45. Borgwardt, K.M.; Gretton, A.; Rasch, M.J.; Kriegel, H.P.; Schölkopf, B.; Smola, A.J. Integrating structured biological data by kernel maximum mean discrepancy. Bioinformatics 2006, 22, e49–e57. [Google Scholar] [CrossRef]
  46. Toda-Caraballo, I.; Rivera-Díaz-del-Castillo, P.E.J. A criterion for the formation of high entropy alloys based on lattice distortion. Intermetallics 2016, 71, 76–87. [Google Scholar] [CrossRef]
  47. Leong, Z.; Huang, Y.; Goodall, R.; Todd, I. Electronegativity and enthalpy of mixing biplots for High Entropy Alloy solid solution prediction. Mater. Chem. Phys. 2018, 210, 259–268. [Google Scholar] [CrossRef]
  48. Poletti, M.G.; Battezzati, L.J.A.M. Electronic and thermodynamic criteria for the occurrence of high entropy alloys in metallic systems. Acta Mater. 2014, 75, 297–306. [Google Scholar] [CrossRef]
  49. Sheng, G.U.O.; Liu, C.T. Phase stability in high entropy alloys: Formation of solid-solution phase or amorphous phase. Prog. Nat. Sci. Mater. Int. 2011, 21, 433–446. [Google Scholar]
  50. King, D.J.M.; Middleburgh, S.C.; McGregor, A.G.; Cortie, M.B. Predicting the formation and stability of single phase high-entropy alloys. Acta Mater. 2016, 104, 172–179. [Google Scholar] [CrossRef]
  51. Andreoli, A.F.; Orava, J.; Liaw, P.K.; Weber, H.; de Oliveira, M.F.; Nielsh, K.; Kaban, I. The elastic-strain energy criterion of phase formation for complex concentrated alloys. Materialia 2019, 5, 100222. [Google Scholar] [CrossRef]
  52. Peng, Y.T.; Zhou, C.Y.; Lin, P.; Wen, D.Y.; Wang, X.D.; Zhong, X.Z.; Pan, D.H.; Que, Q.; Li, X.; Chen, L.; et al. Preoperative ultrasound radiomics signatures for noninvasive evaluation of biological characteristics of intrahepatic cholangiocarcinoma. Acad. Radiol. 2020, 27, 785–797. [Google Scholar] [CrossRef]
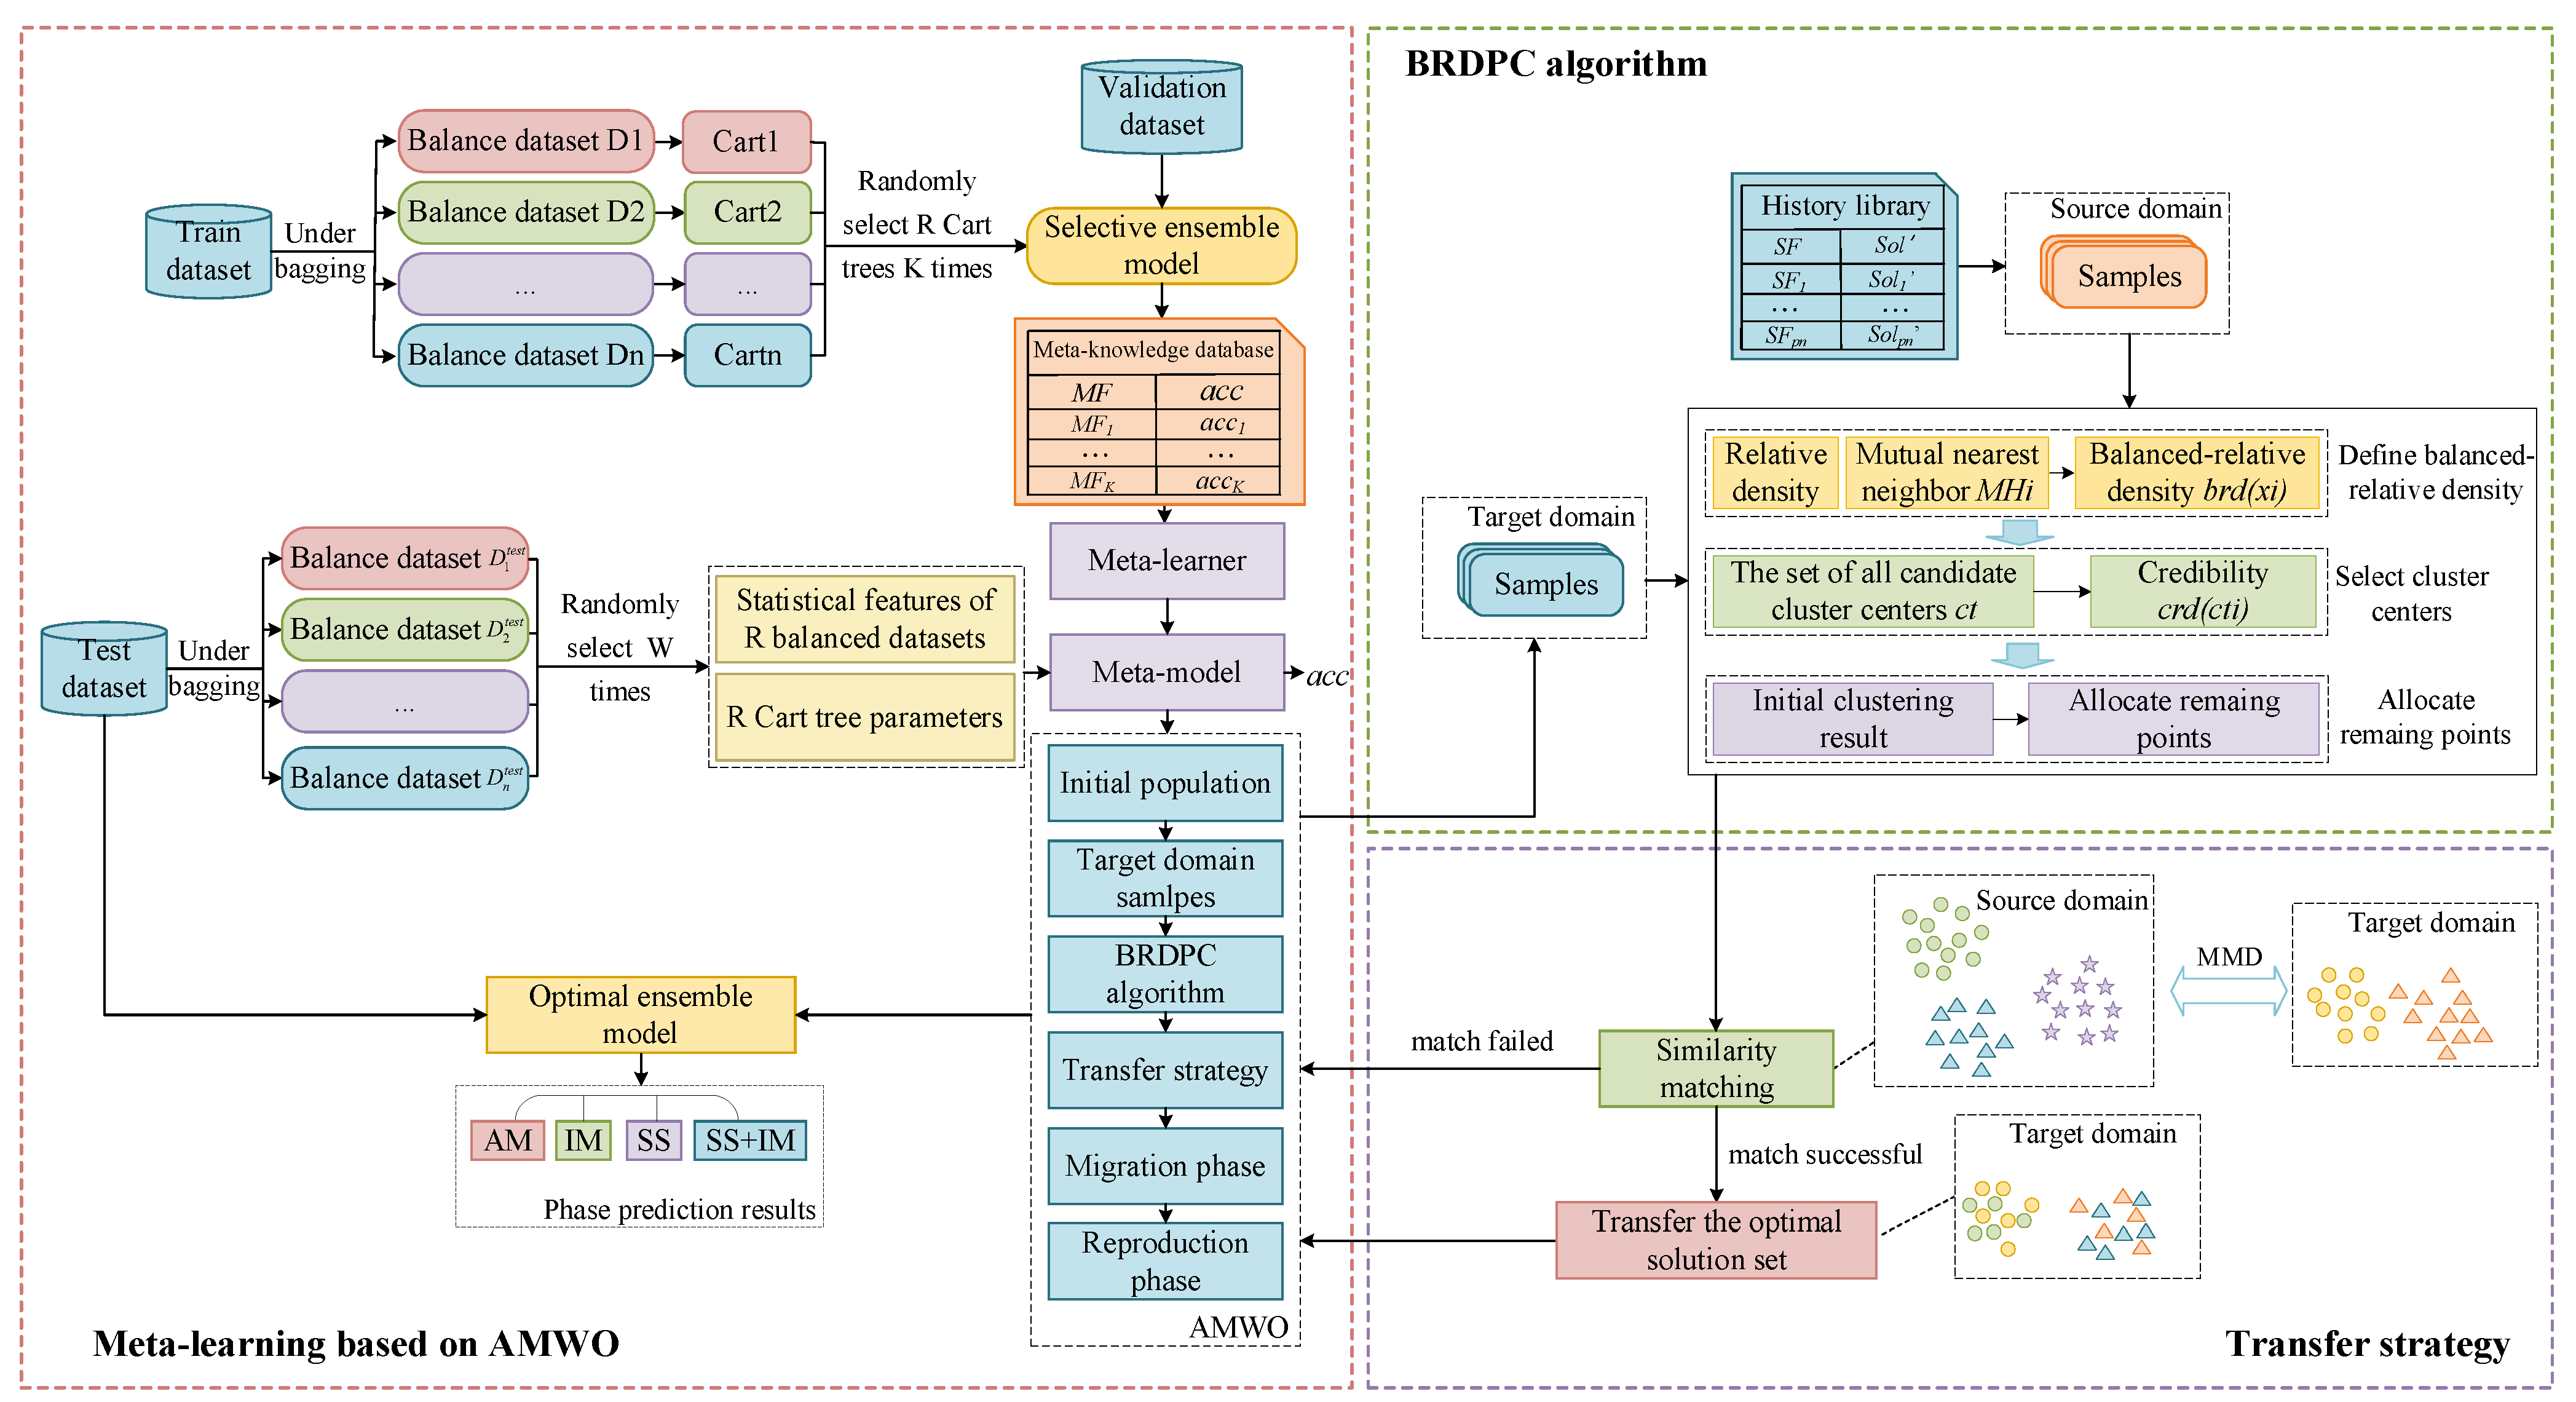
Figure 1. The schematic diagram of the transferable meta-learning algorithm frame.
Applsci 14 09977 g001
Figure 2. The schematic diagram of the AMWO algorithm.
Applsci 14 09977 g002
Figure 3. The schematic diagram of the BRDPC algorithm.
Applsci 14 09977 g003
Figure 4. The occurrence numbers of each element in six datasets.
Applsci 14 09977 g004
Figure 5. The heatmap of Pearson correlation coefficient matrix among five parameters in D1, D2, D3, D4, D5, and D6.
Applsci 14 09977 g005
Figure 6. The quantities of SS, IM, SS + IM, and AM in the quinaries, senaries, and septenaries HEA samples in the six datasets.
Applsci 14 09977 g006
Figure 7. Convergence curves of MTL-AMWO, MTL-WO, and M-FNAS in D1, D2, D3, D4, D5, and D6.
Applsci 14 09977 g007
Figure 8. The accuracy comparison of MTL-AMWO, MTL-WO, and M-FNAS. (a) All, (b) Quinaries, (c) Senaries, and (d) Septenaries.
Applsci 14 09977 g008
Table 1. A snapshot of the first six samples in HEAs dataset in Pandas DataFrame format.
IndexHigh Entropy AlloysΔHmixΔSmixδΔχΩPhase
0Co1.4CrFeMnNi−4.11522613.2954611.1004870.1364455.792101SS
1CrCu0.5FeMnNi0.09876513.1452131.1854780.142370233.301248SS
2CoCuFeNiSn0.075.06613412.0501422.8493060.0322783.909939SS + IM
3AlCoCrFeNiSi0.2−16.39053314.2215975.6340420.1205301.456954SS
4CoFeMoNiTiVZr−21.80000016.1782978.8000000.2540451.529411AM
5CoCrFeMnNbNi−12.00000014.8966885.9000000.1406432.424436IM
Table 2. Experiment results of M-FNAS, MTL-WO, and MTL-AMWO in all.
IDM-FNASMTL-WOMTL-AMWO
D10.845 ± 0.0230.896 ± 0.0320.922 ± 0.063
D20.848 ± 0.0370.879 ± 0.0290.909 ± 0.035
D30.806 ± 0.0300.889 ± 0.0540.917 ± 0.060
D40.769 ± 0.0460.807 ± 0.0760.883 ± 0.038
D50.696 ± 0.0360.783 ± 0.0430.826 ± 0.086
D60.878 ± 0.0410.902 ± 0.0240.951 ± 0.049
Table 3. Experiment results of M-FNAS, MTL-WO, and MTL-AMWO in quinaries.
IDM-FNASMTL-WOMTL-AMWO
D10.714 ± 0.0210.786 ± 0.0320.857 ± 0.047
D20.667 ± 0.0330.750 ± 0.0240.833 ± 0.019
D30.692 ± 0.0410.769 ± 0.0570.917 ± 0.076
D40.769 ± 0.0350.750 ± 0.0250.875 ± 0.024
D50.600 ± 0.0250.600 ± 0.0350.800 ± 0.088
D60.667 ± 0.0270.733 ± 0.0330.867 ± 0.041
Table 4. Experiment results of M-FNAS, MTL-WO, and MTL-AMWO in senaries.
IDM-FNASMTL-WOMTL-AMWO
D10.799 ± 0.0240.866 ± 0.0360.932 ± 0.067
D20.750 ± 0.0280.833 ± 0.0260.916 ± 0.029
D30.769 ± 0.0370.846 ± 0.0380.923 ± 0.049
D40.727 ± 0.0550.818 ± 0.0290.909 ± 0.061
D50.700 ± 0.0510.800 ± 0.0760.900 ± 0.083
D60.823 ± 0.0710.884 ± 0.0430.941 ± 0.056
Table 5. Experiment results of M-FNAS, MTL-WO, and MTL-AMWO in septenaries.
IDM-FNASMTL-WOMTL-AMWO
D10.692 ± 0.0310.769 ± 0.0270.846 ± 0.026
D20.667 ± 0.0450.778 ± 0.0240.889 ± 0.067
D30.727 ± 0.0620.818 ± 0.0710.909 ± 0.090
D40.625 ± 0.0740.750 ± 0.0790.875 ± 0.083
D50.700 ± 0.0850.800 ± 0.0630.900 ± 0.072
D60.700 ± 0.0490.700 ± 0.0370.900 ± 0.066
Disclaimer/Publisher’s Note: The statements, opinions and data contained in all publications are solely those of the individual author(s) and contributor(s) and not of MDPI and/or the editor(s). MDPI and/or the editor(s) disclaim responsibility for any injury to people or property resulting from any ideas, methods, instructions or products referred to in the content.