3.1. Static Test Results and Damage Observations
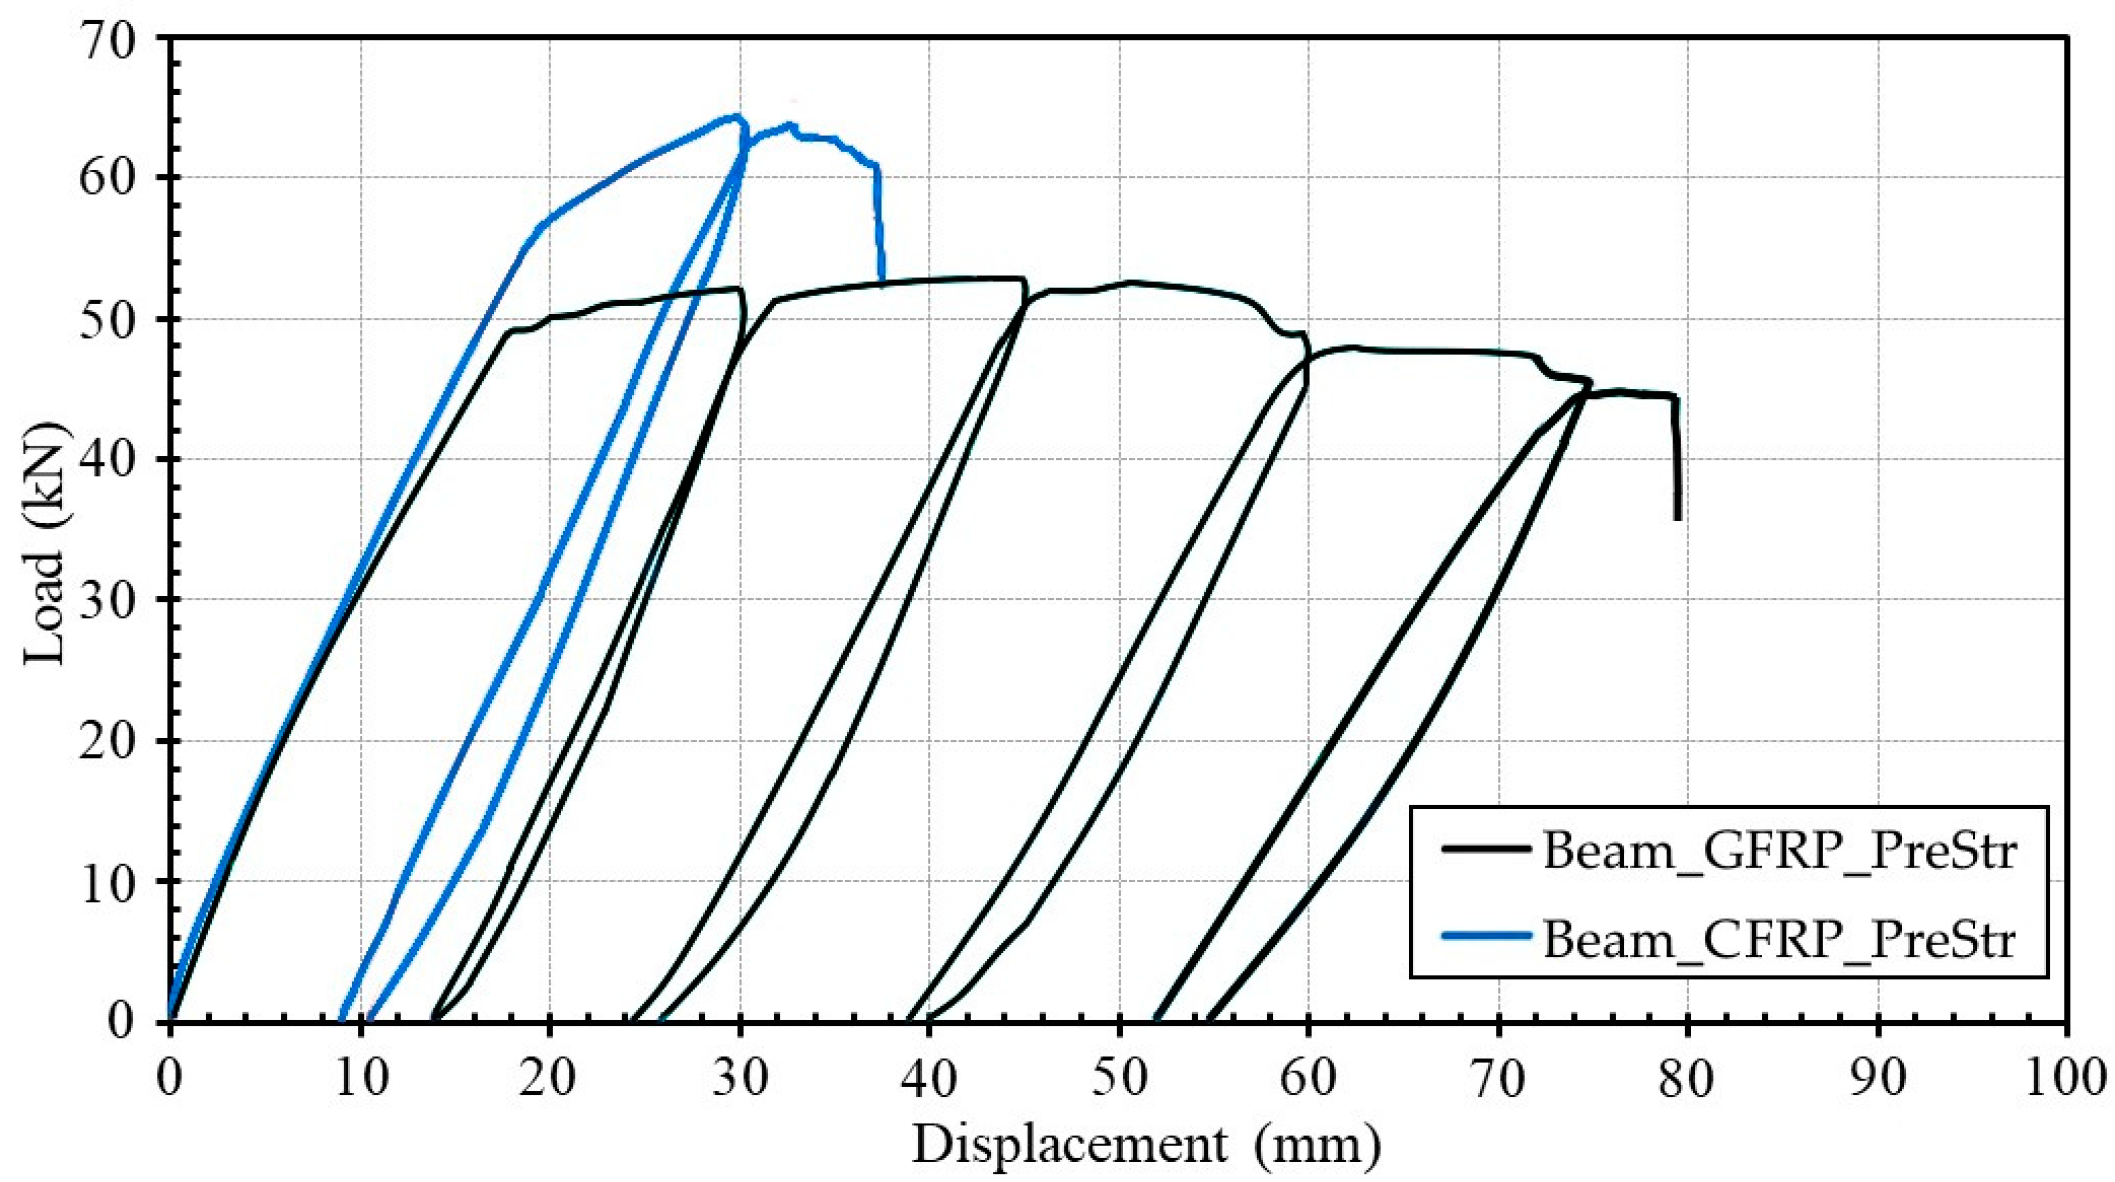
During the quasi-static loading test of Beam_GFRP_PreStr, the first flexural crack appears in the midspan region when the load reached 23.89 kN (i.e., at 7.47 mm displacement), corresponding to approximately 46% of the ultimate load of 51.94 kN. As the load increased, additional flexural cracks formed, and at a load of 49.18 kN (i.e., at 18.44 mm displacement), the longitudinal steel reinforcement yielded. Note that the yielding displacements of all beams were determined based on the reduced stiffness equivalent elasto-plastic yield [
50]. When the deflection reached 55.87 mm, the cracks in the concrete cover became more pronounced and propagated horizontally toward the right. A reduction in load values was observed during the third and fourth loading cycles (i.e., the D
3 and D
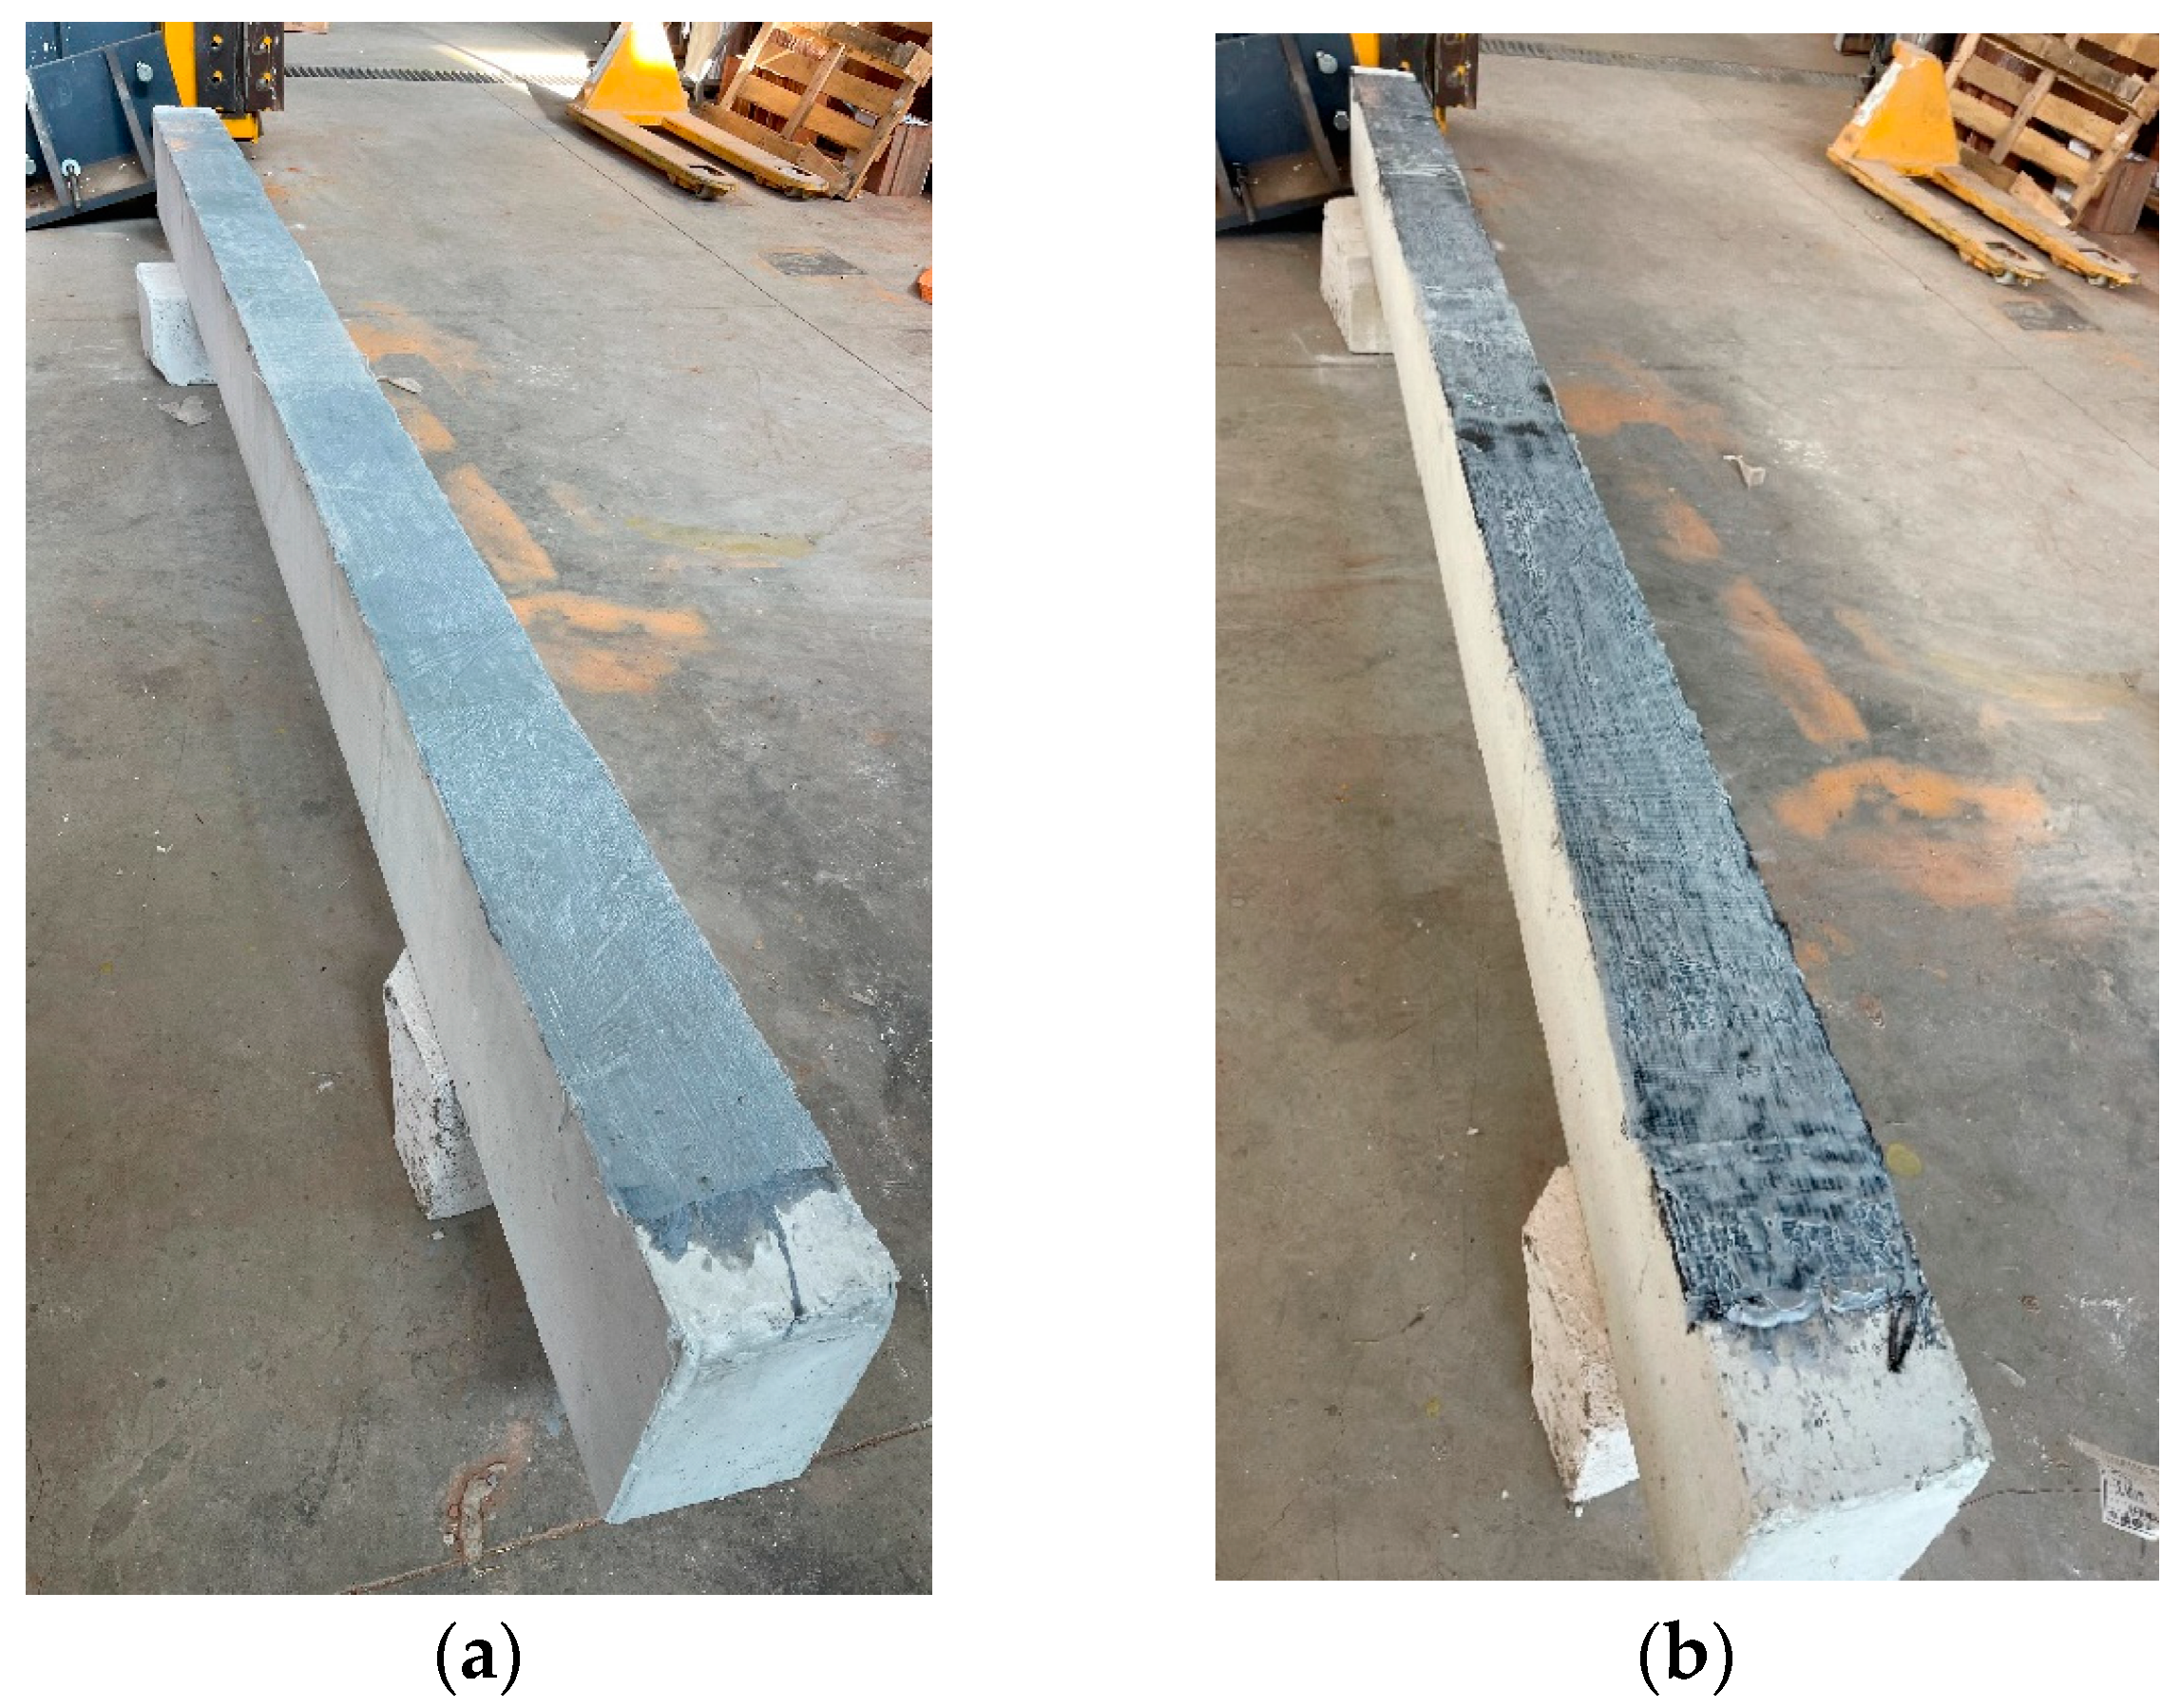
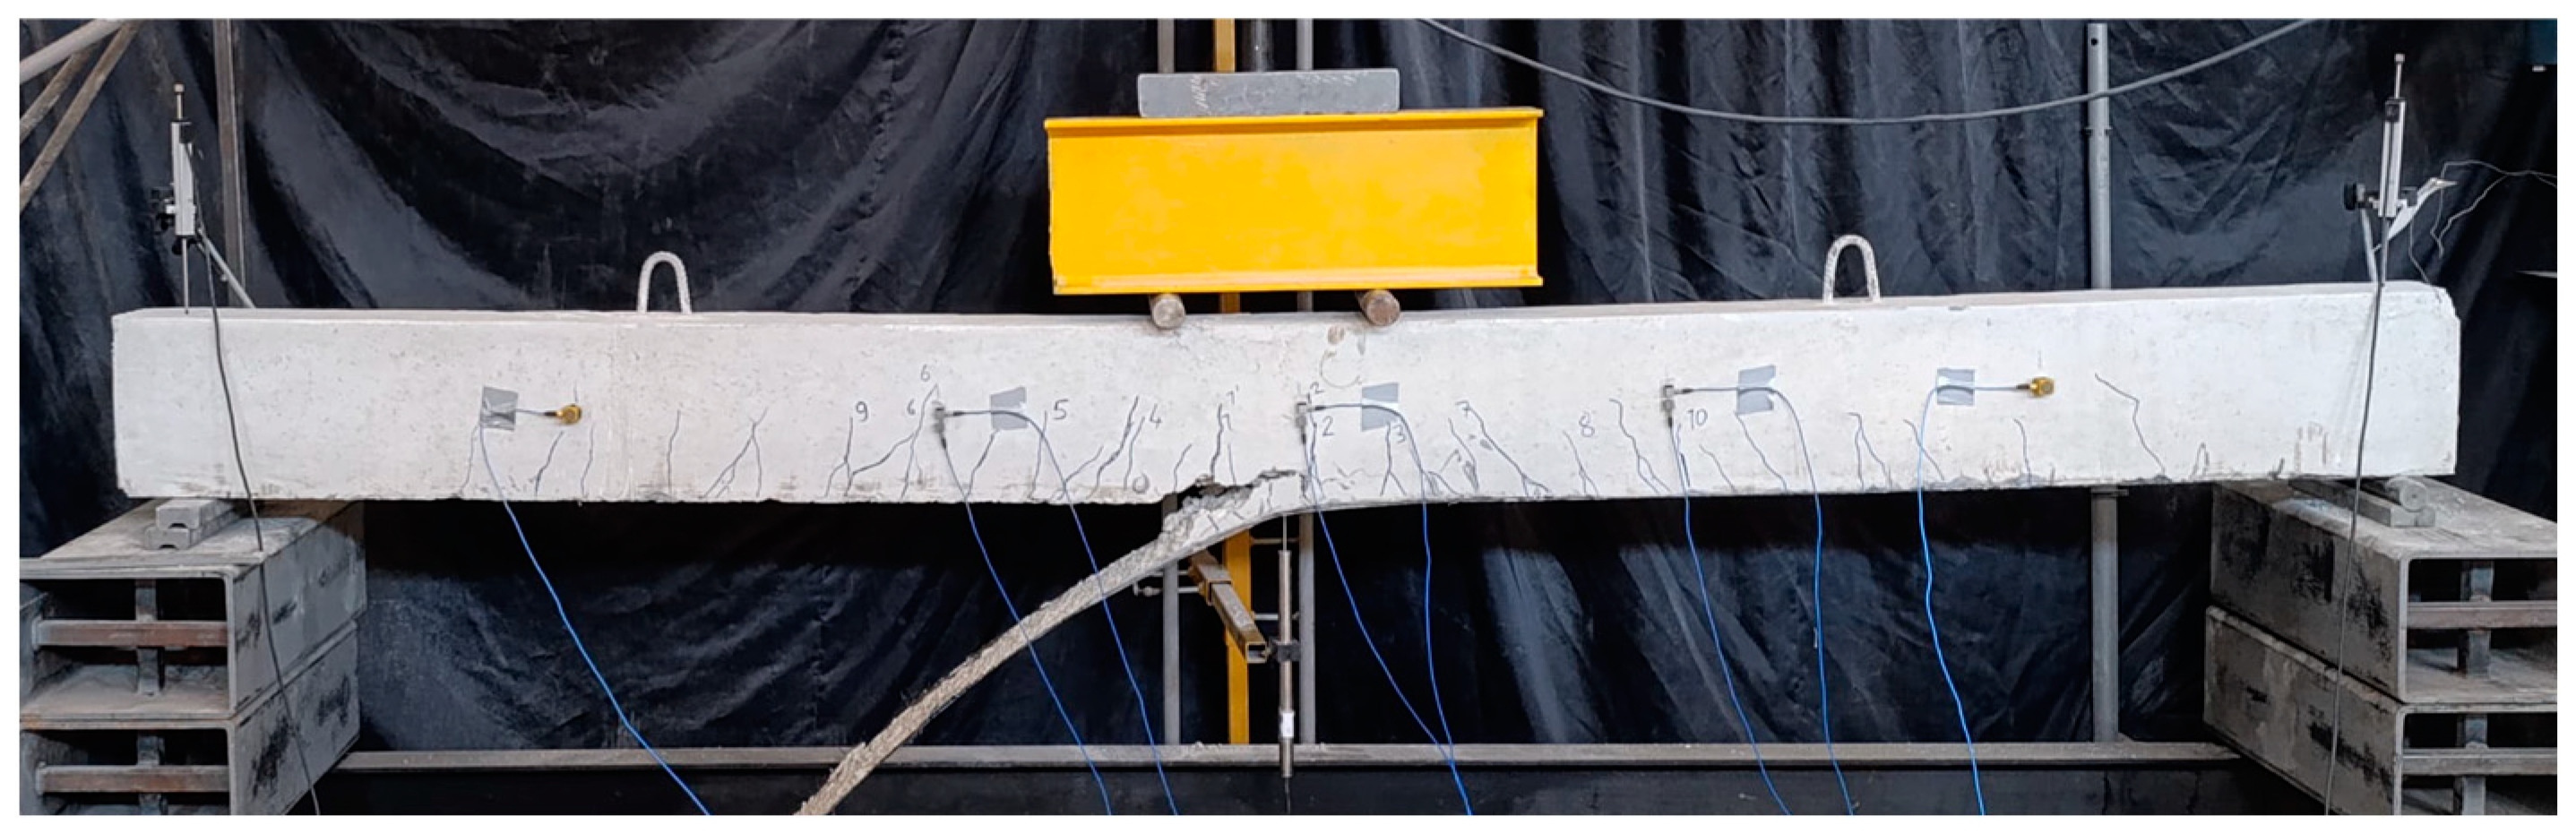
4 damage levels). At a displacement of 78.89 mm (i.e., at 44.45 kN load), the GFRP layer debonded from the concrete interface, leading to failure. At this stage, the concrete in the compression zone was fully crushed. As illustrated by the load–displacement curve in
Figure 4, Beam_GFRP_PreStr exhibits a ductile flexural failure mechanism. The failure mode of Beam_GFRP_PreStr is shown in
Figure 5.
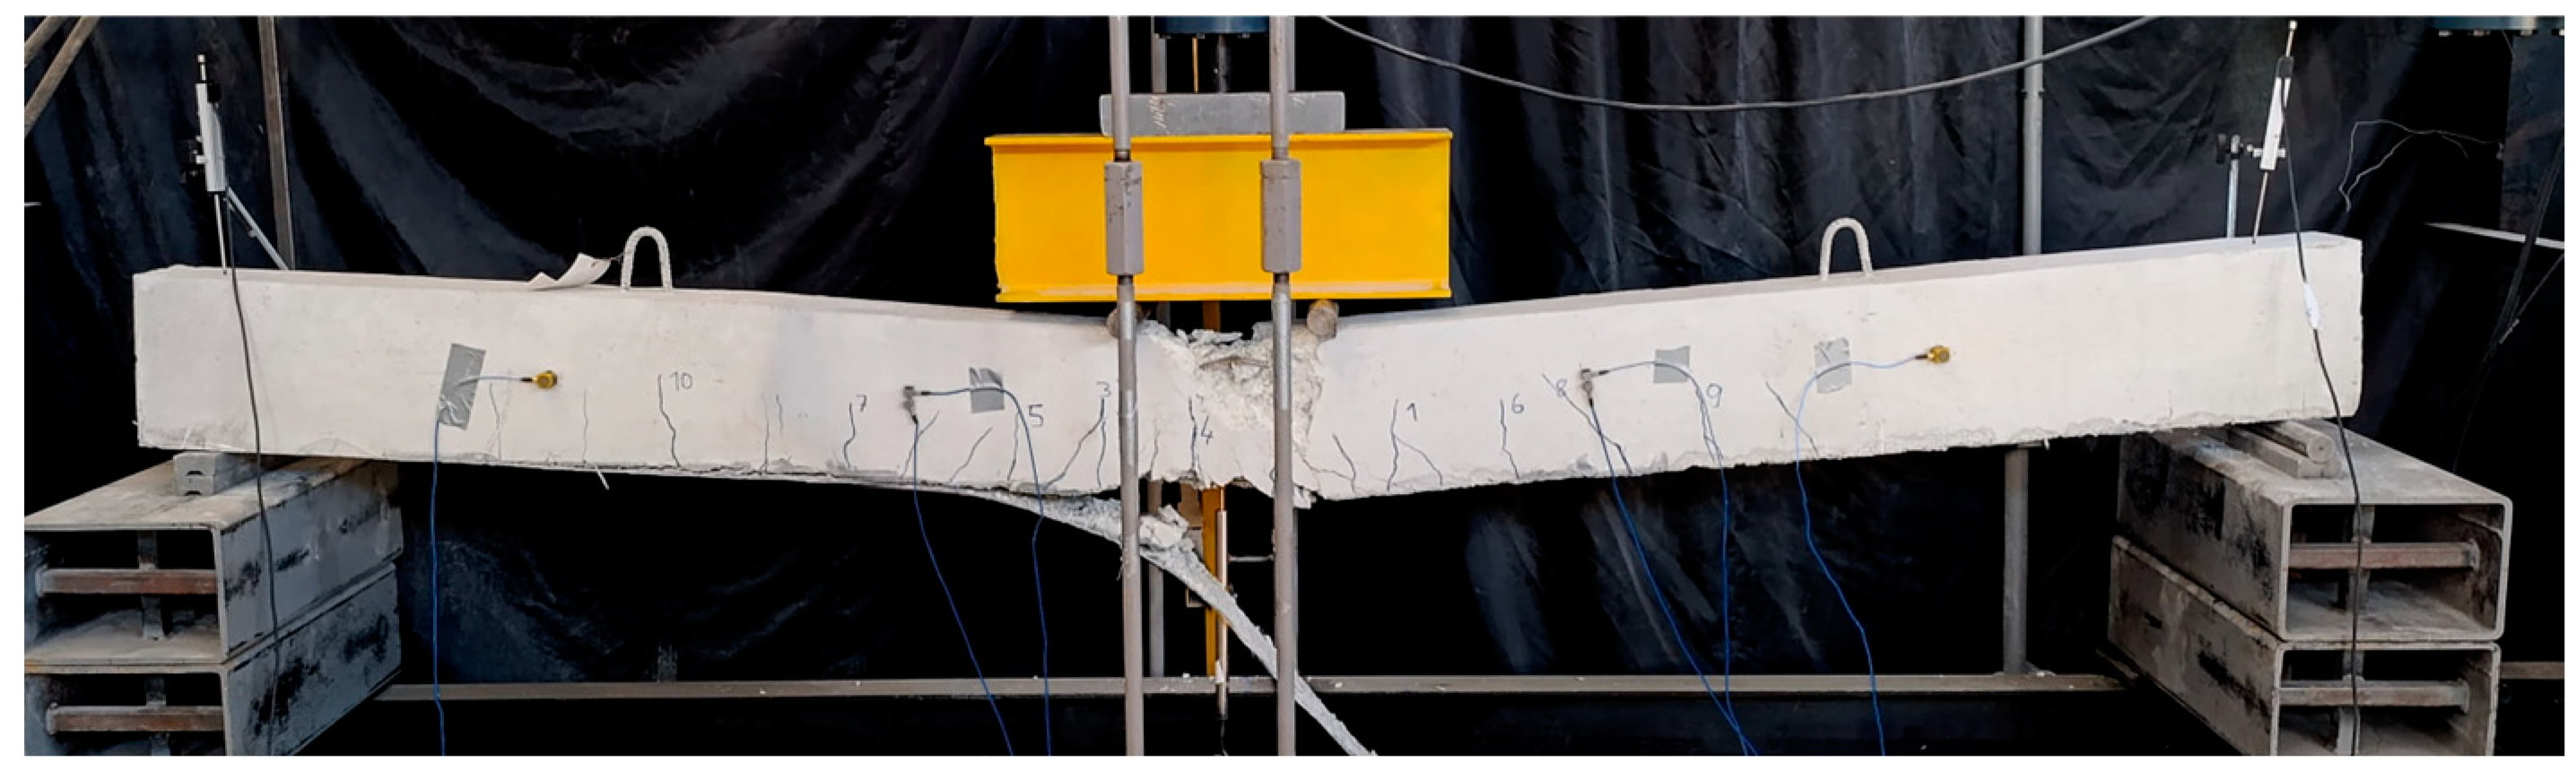
During the static loading test of Beam_CFRP_PreStr, the first flexural crack appeared in the tensile zone of the concrete when the applied load approached 24.51 kN (i.e., at 7.21 mm displacement), corresponding to approximately 37% of the ultimate load of 66.24 kN. As the load increased, numerous flexural cracks formed. These cracks were not concentrated in the midspan region but were distributed along the length of the beam. At a load of 58.12 kN (i.e., 21.34 mm displacement), the longitudinal steel reinforcement yielded. After the load reached a maximum of 66.24 kN, the cracks in the concrete cover became more pronounced and started to propagate toward the left. At a displacement of 37.65 mm (i.e., at 60.56 kN load), failure occurred due to the debonding of the CFRP strengthening material along with the concrete cover, resulting in a sudden drop in load and the termination of the test (see
Figure 4). Although slight crushing was observed in the concrete compression zone, debonding happened before the beam reached its full flexural capacity. Compared to Beam_GFRP_PreStr, which was strengthened with GFRP, Beam_CFRP_PreStr failed at a lower displacement level while bearing a higher load value (see
Figure 4). The failure mode of Beam_CFRP_PreStr is illustrated in
Figure 6.
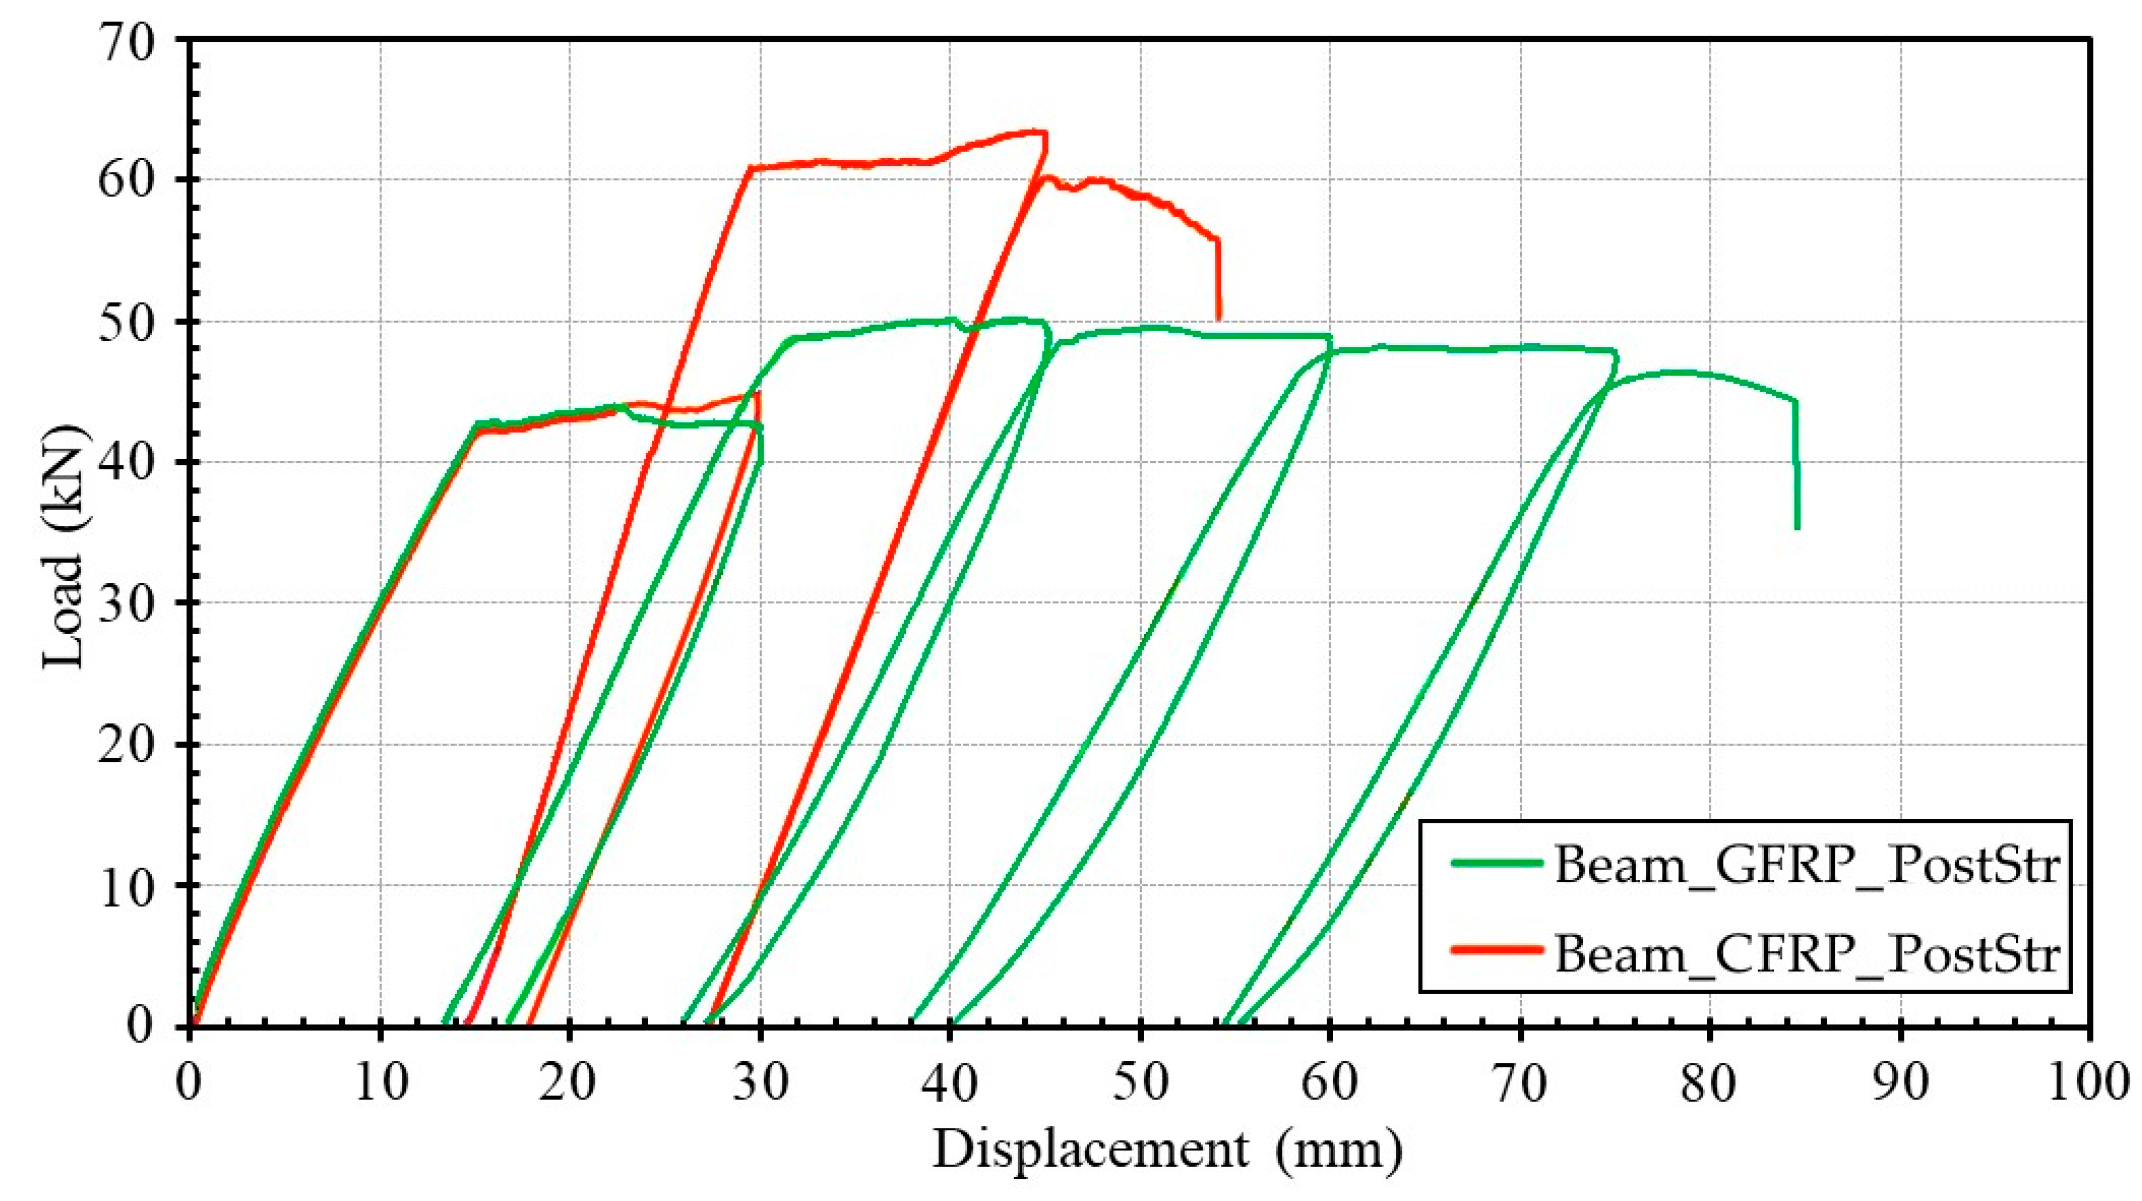
As mentioned earlier, Beam_GFRP_PostStr and Beam_CFRP_PostStr, which were initially bare beams, were pre-damaged up to 30 mm displacement (i.e., D
1 damage level) and strengthened with GFRP and CFRP, respectively. The load–displacement curves of Beam_GFRP_PostStr and Beam_CFRP_PostStr are presented in
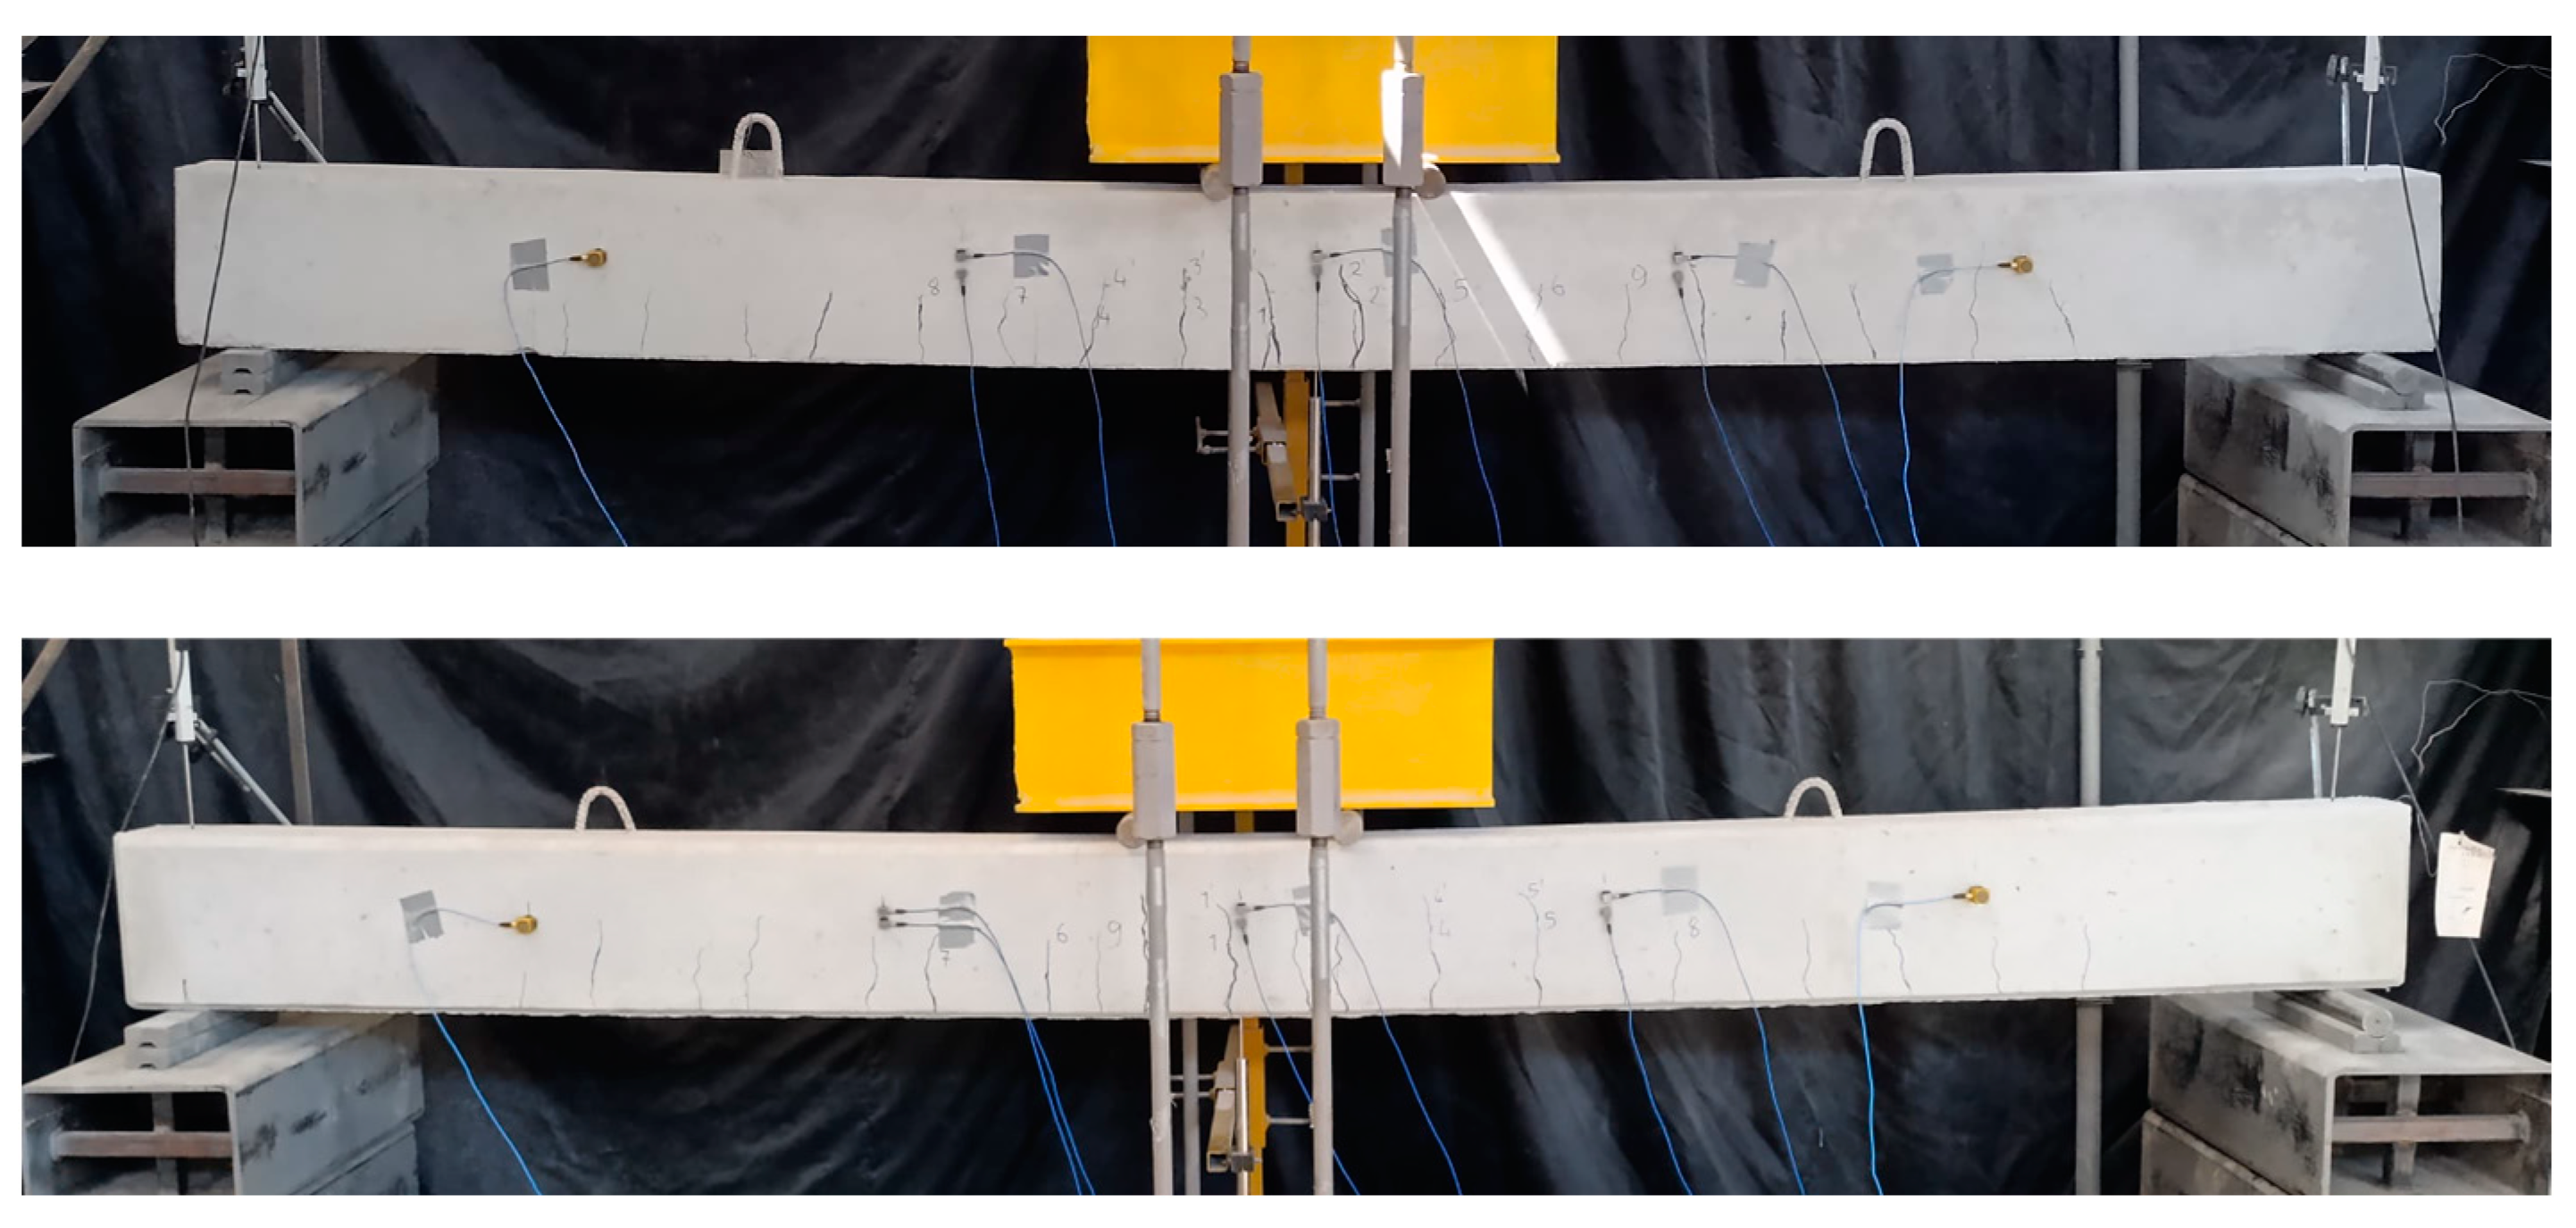
Figure 7. The pre-damaging procedure serves as a reference for the pre-strengthened beams, namely Beam_GFRP_PreStr and Beam_CFRP_PreStr. The first crack in the midspan region occurred at 18.83 kN (i.e., at 5.98 mm displacement) and 19.23 kN (i.e., at 6.18 mm displacement) for Beam_GFRP_PostStr and Beam_CFRP_PostStr, respectively. As the load increased, additional flexural cracks formed. The longitudinal steel reinforcement yielded at 42.61 kN (i.e., at 15.11 mm displacement) for Beam_GFRP_PostStr and 41.86 kN (i.e., at 15.23 mm displacement) for Beam_CFRP_PostStr. Representations of Beam_GFRP_PostStr and Beam_CFRP_PostStr at the D
1 damage level are given in
Figure 8.
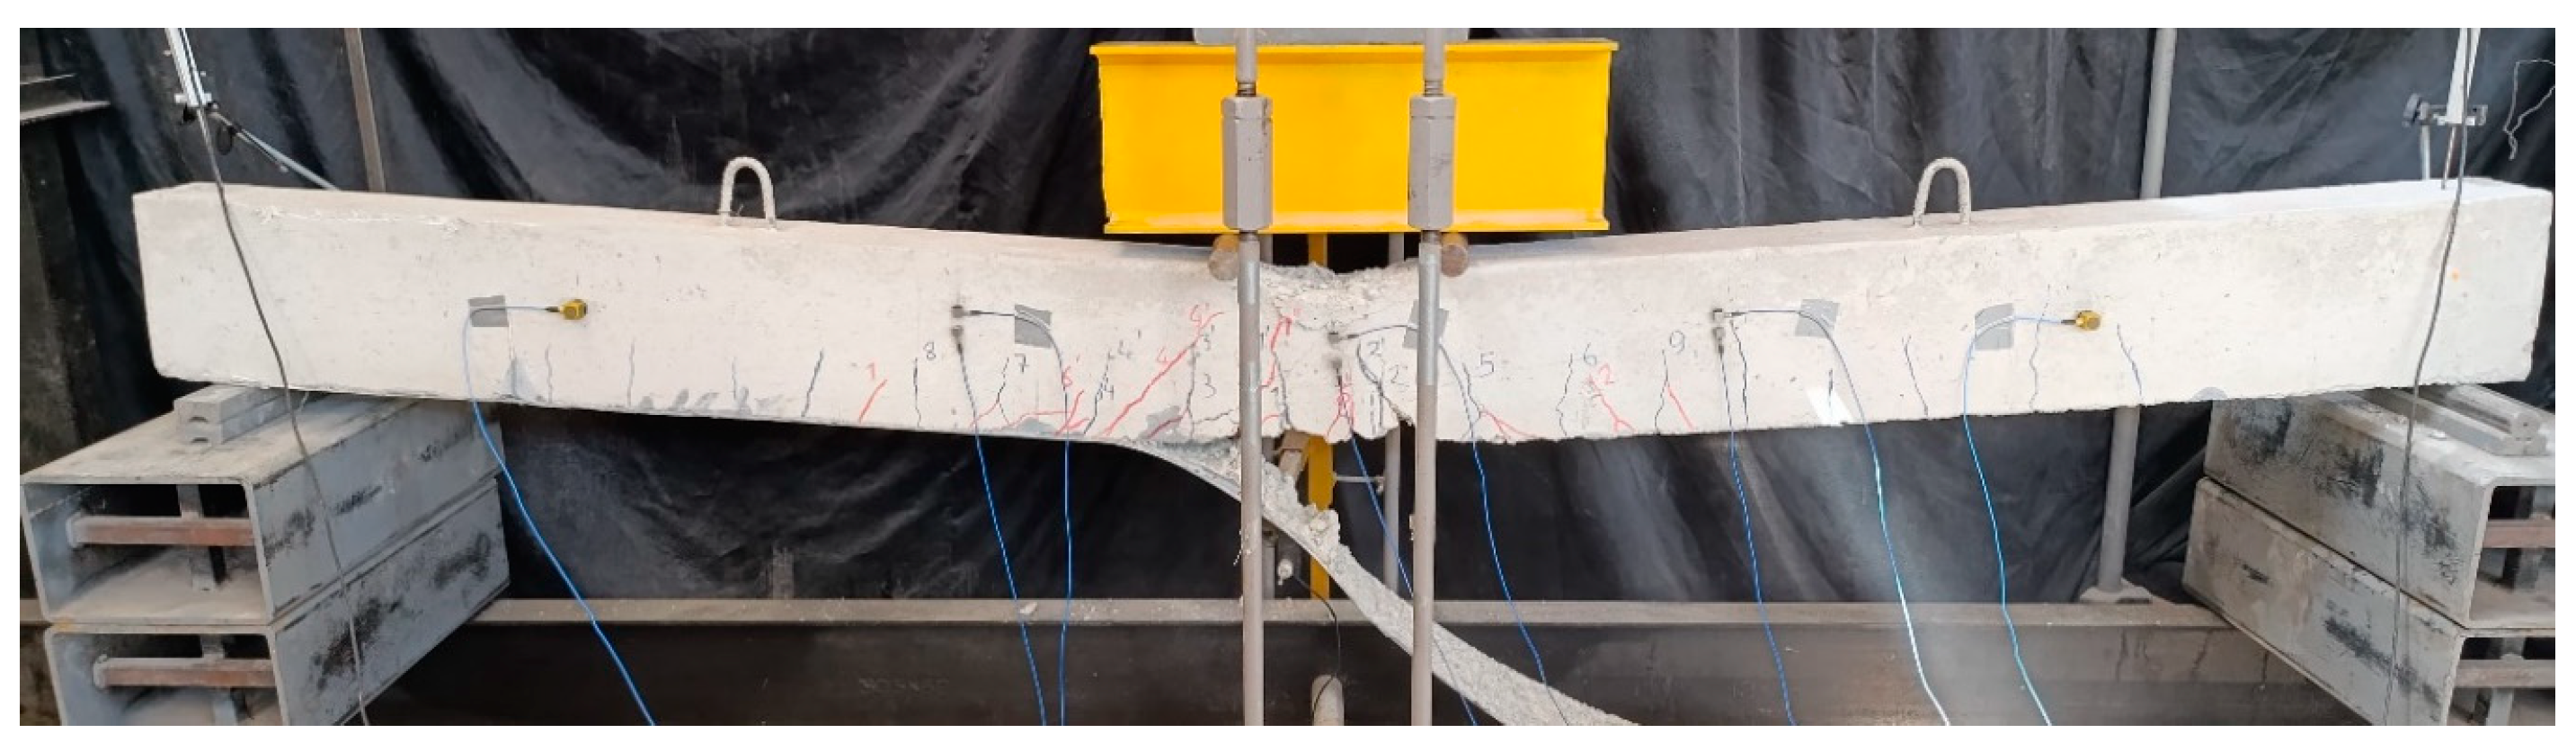
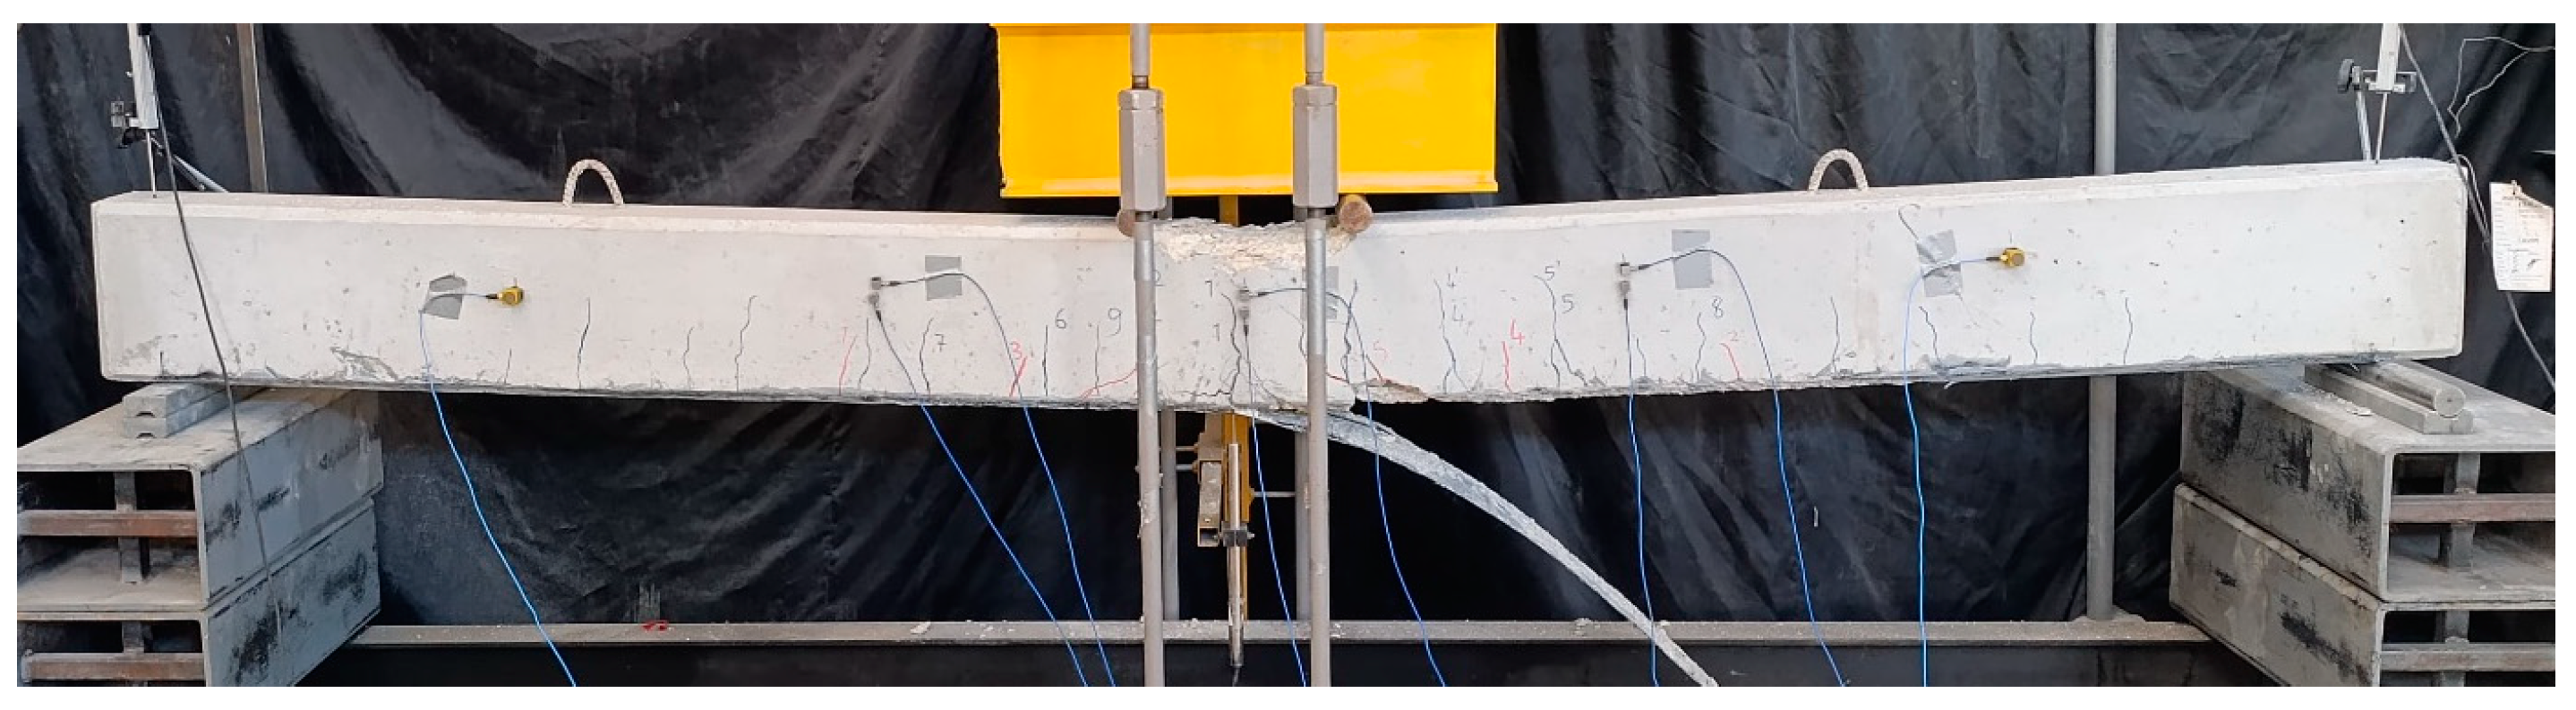
During the static test conducted after the strengthening of Beam_GFRP_PostStr with GFRP, the first new crack formed at a load value of 43.05 kN (i.e., at 28.71 mm displacement). As the load increased, additional flexural cracks developed. After the strengthening procedure, the maximum load value increased by 14.15% compared to the pre-strengthening state. At a midspan displacement of 62.52 mm, cracks in the concrete cover became more pronounced and extended horizontally to the right. A decrease in load values was observed during the fourth and fifth loading cycles. When the displacement reached 84.32 mm (i.e., at 44.13 kN load), the GFRP layer debonded from the concrete interface, leading to failure. Complete crushing occurred in the concrete of the compression zone, and Beam_GFRP_PostStr exhibited ductile flexural behavior similar to that of Beam_GFRP_PreStr, as shown in the load–displacement curve (see
Figure 7). The failure mode of Beam_GFRP_PostStr is presented in
Figure 9.
During the static test performed after the strengthening process of Beam_CFRP_PostStr strengthened with CFRP, the first new crack formed at a load value of 47.74 kN (i.e., at 26.12 mm displacement). As the load increased, additional flexural cracks developed. After the strengthening procedure, the maximum load value for Beam_CFRP_PostStr increased by 41.65% compared to the pre-strengthening state. After reaching a maximum load of 63.22 kN, cracks in the concrete cover became more pronounced and began to propagate to the right. After this point, the load decreased to 55.94 kN (i.e., at 54.32 mm displacement), and debonding of the CFRP with the concrete cover was observed as the failure mode, resulting in a sudden drop in load and the termination of the test (see
Figure 7). Beam_CFRP_PostStr exhibited a similar behavior trend to Beam_CFRP_PreStr. The failure mode of Beam_CFRP_PostStr is presented in
Figure 10. The static test results for all beams are collectively presented in
Table 4.
In the table above, F
cr, F
y, F
u, and F
f denote the first crack, steel yield, ultimate, and failure loads, respectively, while δ
cr, δ
y, δ
u, and δ
f represent their corresponding displacements. In addition, the ductility ratio is calculated and presented in
Table 4.
Beam_CFRP_PreStr shows a slightly higher load but a slightly lower displacement at first crack compared to Beam_GFRP_PreStr. This suggests that CFRP provides greater initial stiffness than GFRP, leading to a higher load capacity with less deformation before cracking occurs. Beam_GFRP_PostStr and Beam_CFRP_PostStr, which are bare frames in the undamaged state, exhibit lower loads and displacements at first crack compared to the beams that are strengthened before loading. After the strengthening of pre-damaged beams, Beam_GFRP_PostStr shows a lower first crack load compared to Beam_CFRP_PostStr, indicating the superior effect of CFRP in improving stiffness. Beam_CFRP_PreStr exhibits the highest yield load, followed by Beam_GFRP_PreStr, showing that CFRP provides a greater improvement in load-carrying capacity before yielding in pre-strengthened beams. The static test results reveal that Beam_GFRP_PreStr, which is strengthened with GFRP in the undamaged state, exhibits a good balance between strength and ductility, effectively enhancing load-bearing capacity while maintaining ductility. In contrast, Beam_CFRP_PreStr, strengthened with CFRP in the undamaged state, has the highest ultimate load capacity but demonstrates the lowest ductility ratio which is consistent with the findings of similar studies by Jankowiak [
18] and Jian-He et al. [
19]. Beams strengthened with GFRP exhibit significantly more ductile behavior compared to those strengthened with CFRP. This difference can be attributed to the increased internal forces within the CFRP-strengthened beams, corresponding to a substantial rise in the maximum load carried. Consequently, the debonding of the strengthening material from the concrete cover occurs at lower displacements. Beam_GFRP_PostStr, which is pre-damaged and then strengthened with GFRP, presents a slightly reduced load-carrying capacity compared to Beam_GFRP_PreStr; however, it shows improved ductility, suggesting that GFRP can still enhance the deformation capacity of damaged beams. Beam_CFRP_PostStr, strengthened with CFRP after pre-damage, exhibits a slightly lower load capacity than Beam_CFRP_PreStr but demonstrates greater ductility, indicating that CFRP effectively restores some structural performance even when applied to a damaged beam. Overall, CFRP consistently provided superior strength enhancement, while GFRP contributed more to ductility, demonstrating the varied benefits of each material.
3.2. Dynamic Test Results at Different Damage Levels
Using the collected dynamic data from various beams (i.e., Beam_GFRP_PreStr, Beam_CFRP_PreStr, Beam_GFRP_PostStr, and Beam_CFRP_PostStr) at different damage levels (i.e., the undamaged state, D
1, D
2, D
3, and D
4), modal parameters were estimated. In this context, the first three vibration modes of the beams in both vertical and horizontal directions were considered.
Table 5 provides the modal frequency estimates for all beams in their undamaged states.
In the table above, f
1, f
2, and f
3 indicate modal frequency estimates for the first, second, and third vibration modes, respectively, in both vertical and horizontal directions. As previously mentioned, Beam_GFRP_PostStr and Beam_CFRP_PostStr are bare in the undamaged state. Since the modal frequencies of these two identical beams are found to be very close to each other, they are presented in a single row in
Table 5. The results denote that strengthening with both GFRP and CFRP leads to noticeable increases in the frequency estimates of the beams, reflecting an improvement in their stiffness values. Among the two strengthening materials, CFRP provides a more significant increase in the frequency estimates in both directions, suggesting that it is more effective in enhancing structural rigidity compared to GFRP. The bare beams exhibit lower frequencies, confirming the baseline stiffness characteristics in the absence of any strengthening. The near-identical values between the two bare beams validate the consistency and reliability of the testing setup.
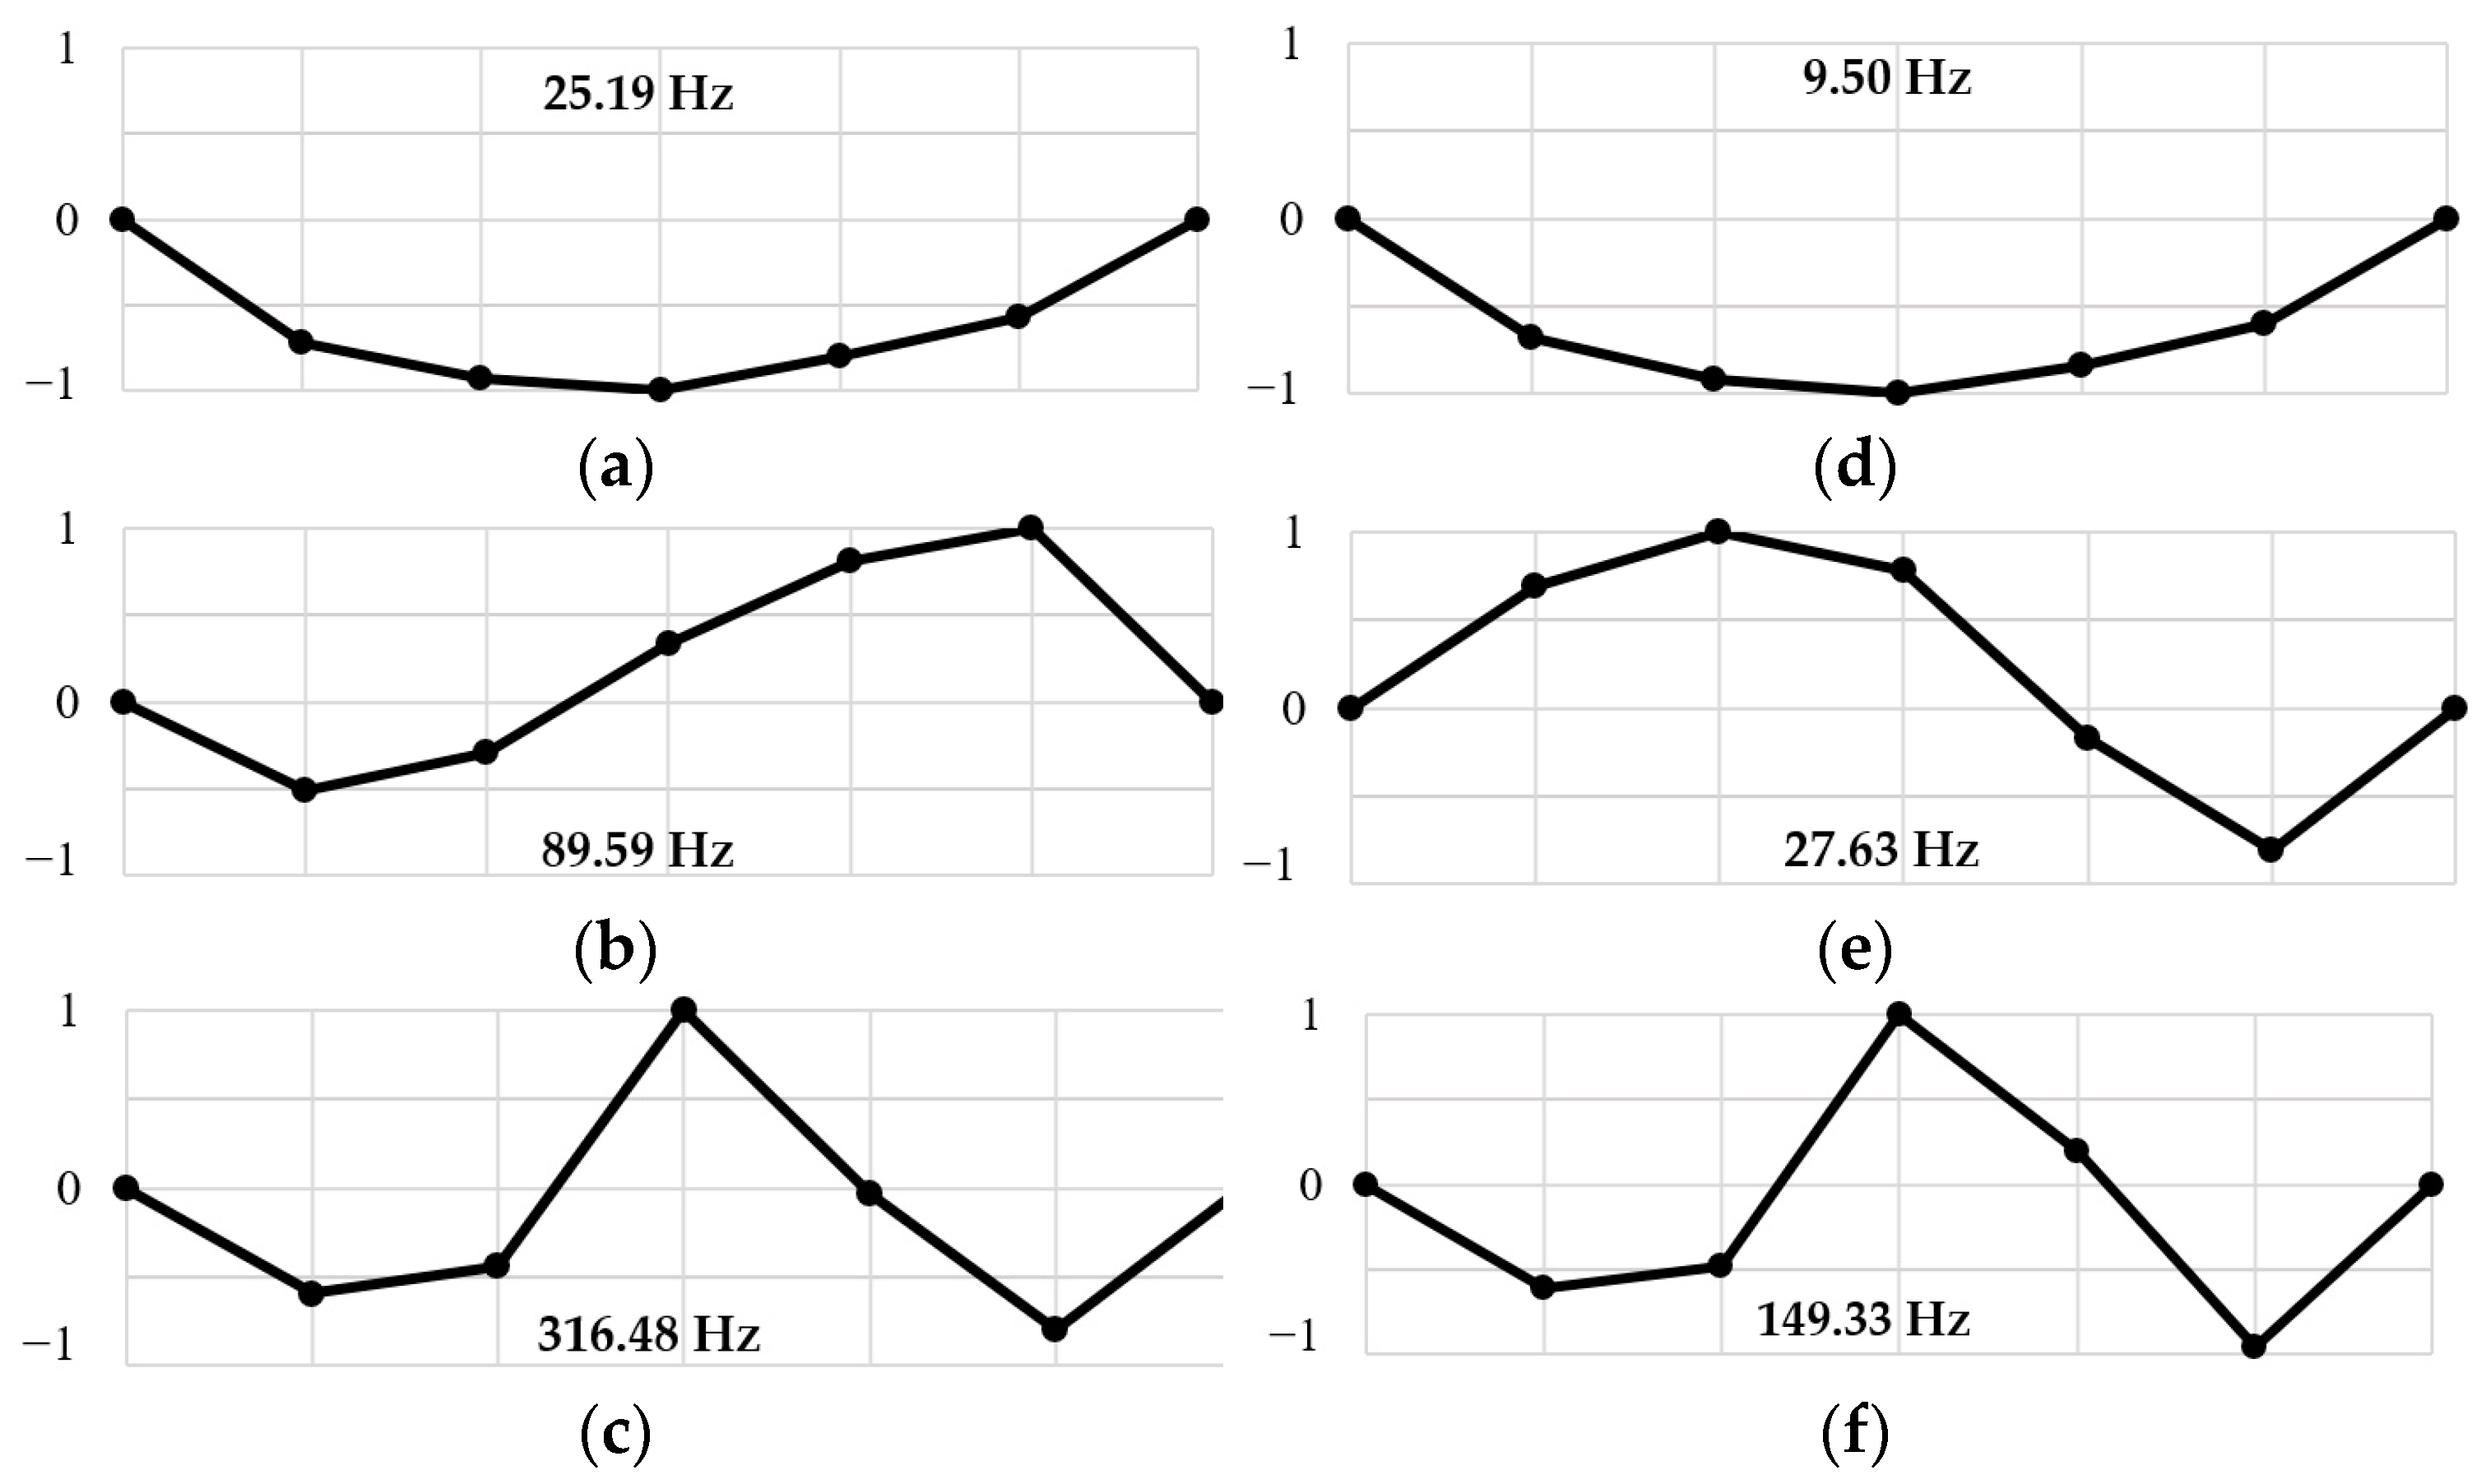
Figure 11 shows the mode shapes of Beam_GFRP_PostStr and Beam_CFRP_PostStr in the undamaged state, along with the corresponding modal frequencies. Additionally,
Table 6 presents the Modal Assurance Criterion (MAC) values of the mode shapes of strengthened beams compared to those of the bare beams (i.e., the reference mode shapes). The MAC value quantifies the similarity between two mode shapes, with values closer to 100% indicating greater similarity [
51].
The high MAC values, particularly in the first modes exceeding 90%, indicate that the mode shapes of the strengthened beams closely resemble those of the bare beams. This suggests that the strengthening process does not significantly alter the first mode shapes in both the vertical and horizontal directions, but rather enhances the stiffness values. The reduction in MAC values in the second and third modes reflects certain deviations in the mode shapes, likely due to the effects of the strengthening process.
Modal frequency ratios were calculated by dividing the modal frequency estimates at different damage levels by those in the undamaged state, enabling the proportional change in modal frequencies to be monitored. The focus was on the relative changes in frequency ratios rather than the absolute frequency values, highlighting the influence of damage and strengthening on the dynamic behavior of the beams.
Table 7 provides the modal frequency ratios for Beam_GFRP_PreStr at various damage levels, encompassing both the vertical and horizontal directions. These ratios offer insight into the effect of progressive damage on the modal frequencies of the beam.
Figure 12 illustrates the variation in these ratios for the vertical and horizontal directions.
In the table above, f1und, f2und, and f3und are the undamaged state modal frequencies of the first, second, and third modes, respectively.
As the level of damage increases, the modal frequencies of Beam_GFRP_PreStr decrease progressively. This indicates a reduction in stiffness caused by the damage and resulting in lower frequency values. The most significant reduction in the vertical direction is observed in the first mode, while the second mode is less affected. The second and third modes exhibit a slower rate of decline, indicating that higher modes are less sensitive to damage in the vertical direction. In the horizontal direction, the third mode shows the largest decrease in modal frequencies, whereas the second mode remains more stable across various damage levels. These findings highlight the influence of structural damage on dynamic properties, with the first mode being the most sensitive to changes in structural integrity.
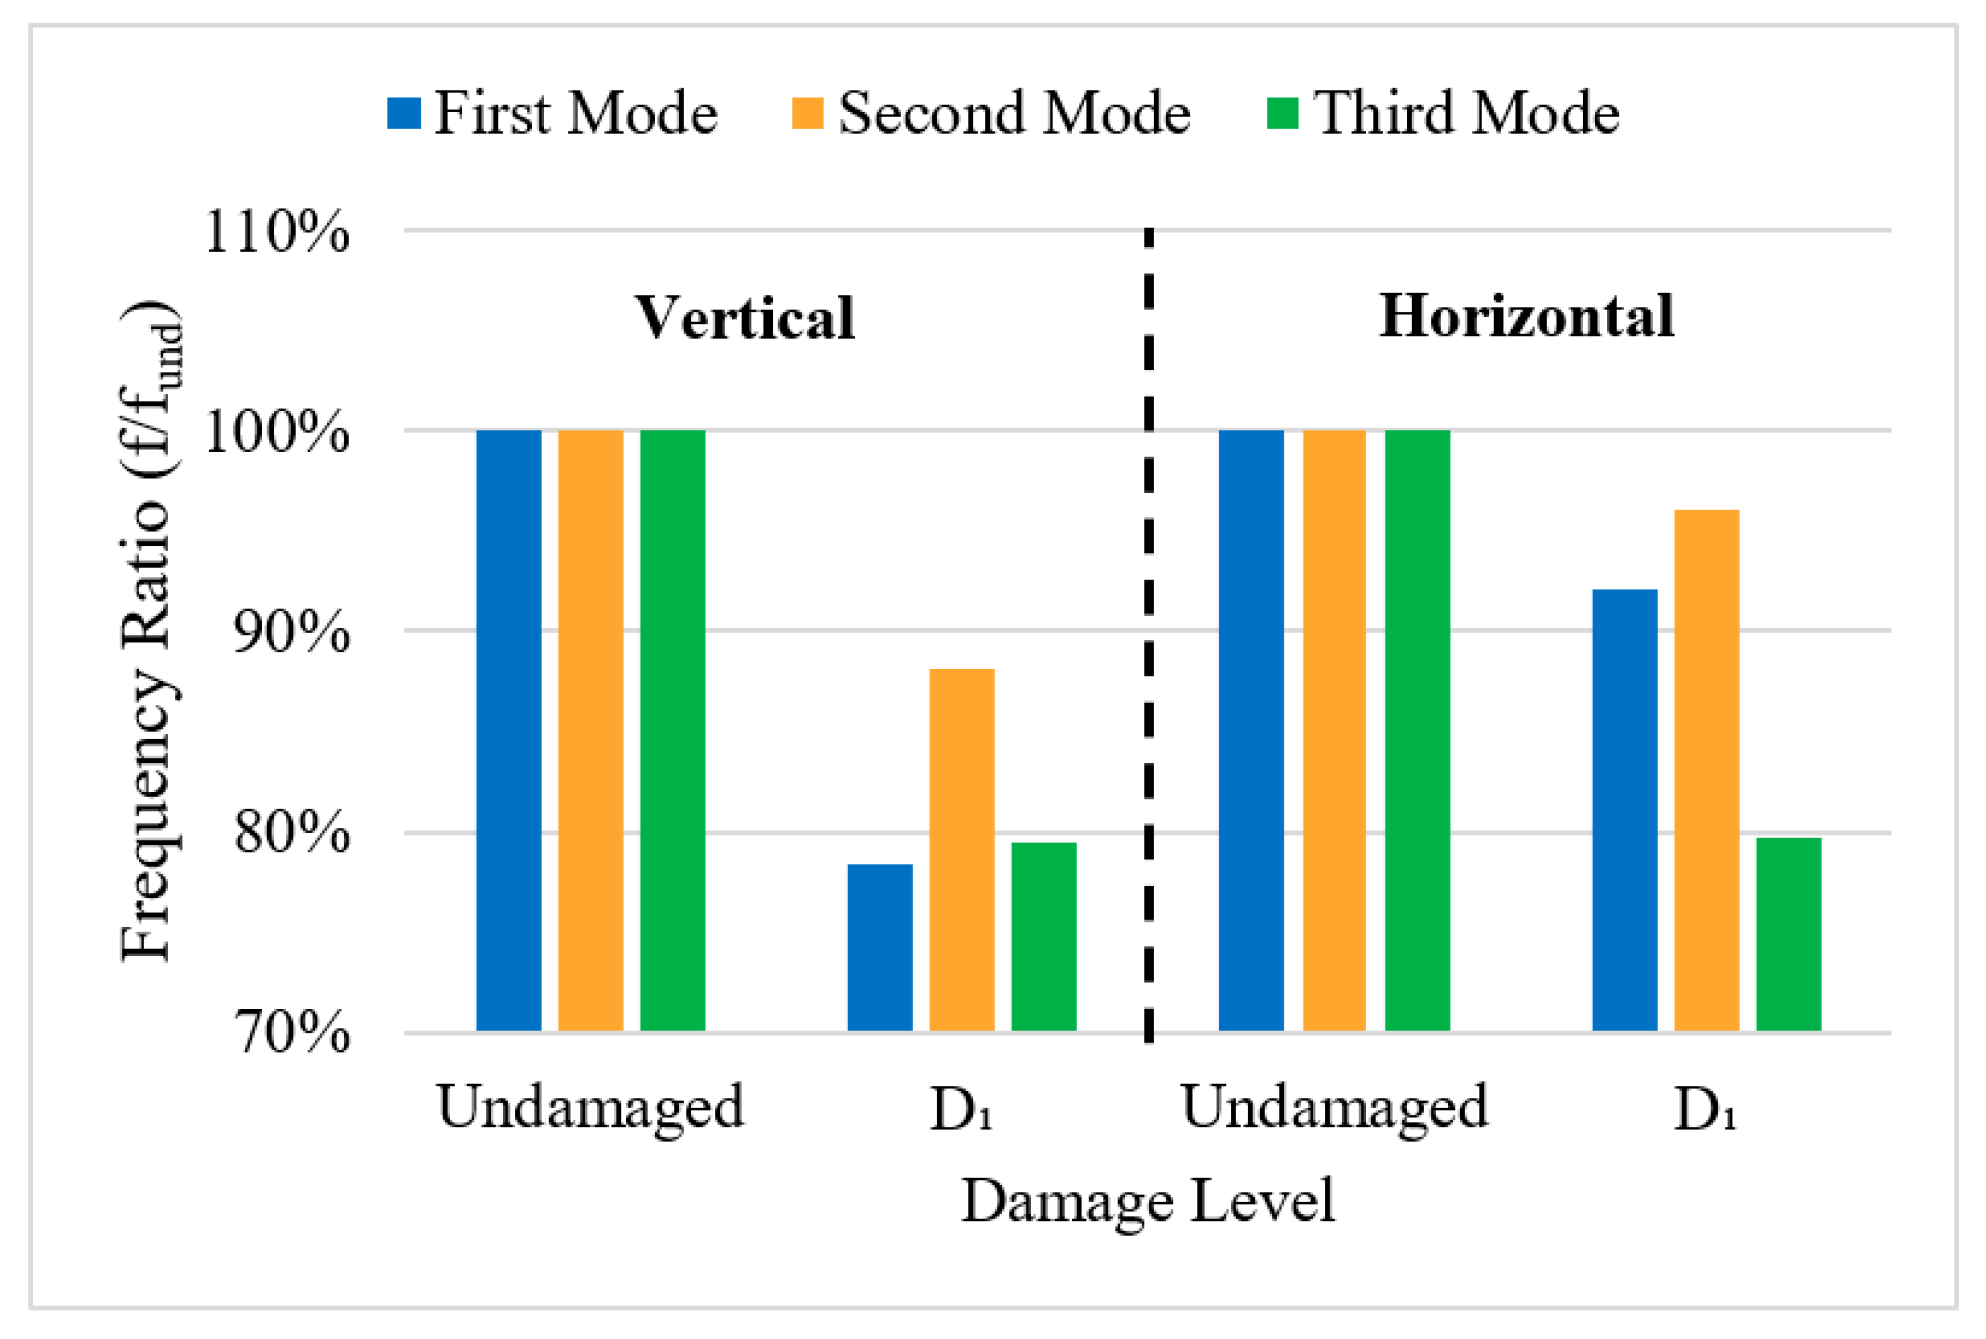
Table 8 presents the modal frequency ratios for Beam_CFRP_PreStr at the D
1 damage level, comparing the modal frequency estimates in both vertical and horizontal directions to those in the undamaged state. As previously mentioned, Beam_CFRP_PreStr failed before reaching the D
2 damage level. Therefore, only the frequency ratios at the D
1 damage level are given.
Figure 13 illustrates the variation in these modal frequency ratios for Beam_CFRP_PreStr in both directions, highlighting the effects of structural damage on the dynamic behavior of the beam.
Table 8 and
Figure 13 show a significant reduction in modal frequencies as the beam was damaged at the D
1 damage level, particularly in the vertical direction. The first and third modes exhibit the most pronounced decreases, indicating that these modes are more sensitive to damage. The second mode, however, shows a relatively moderate reduction, suggesting greater stability under damage. In the horizontal direction, the first and second modes exhibit smaller reductions compared to the vertical direction, indicating that horizontal dynamic behavior is less sensitive to damage at lower modes. These results suggest that while damage affects both directions, the vertical dynamic response is more significantly impacted, particularly in the first mode for the beam strengthened with CFRP.
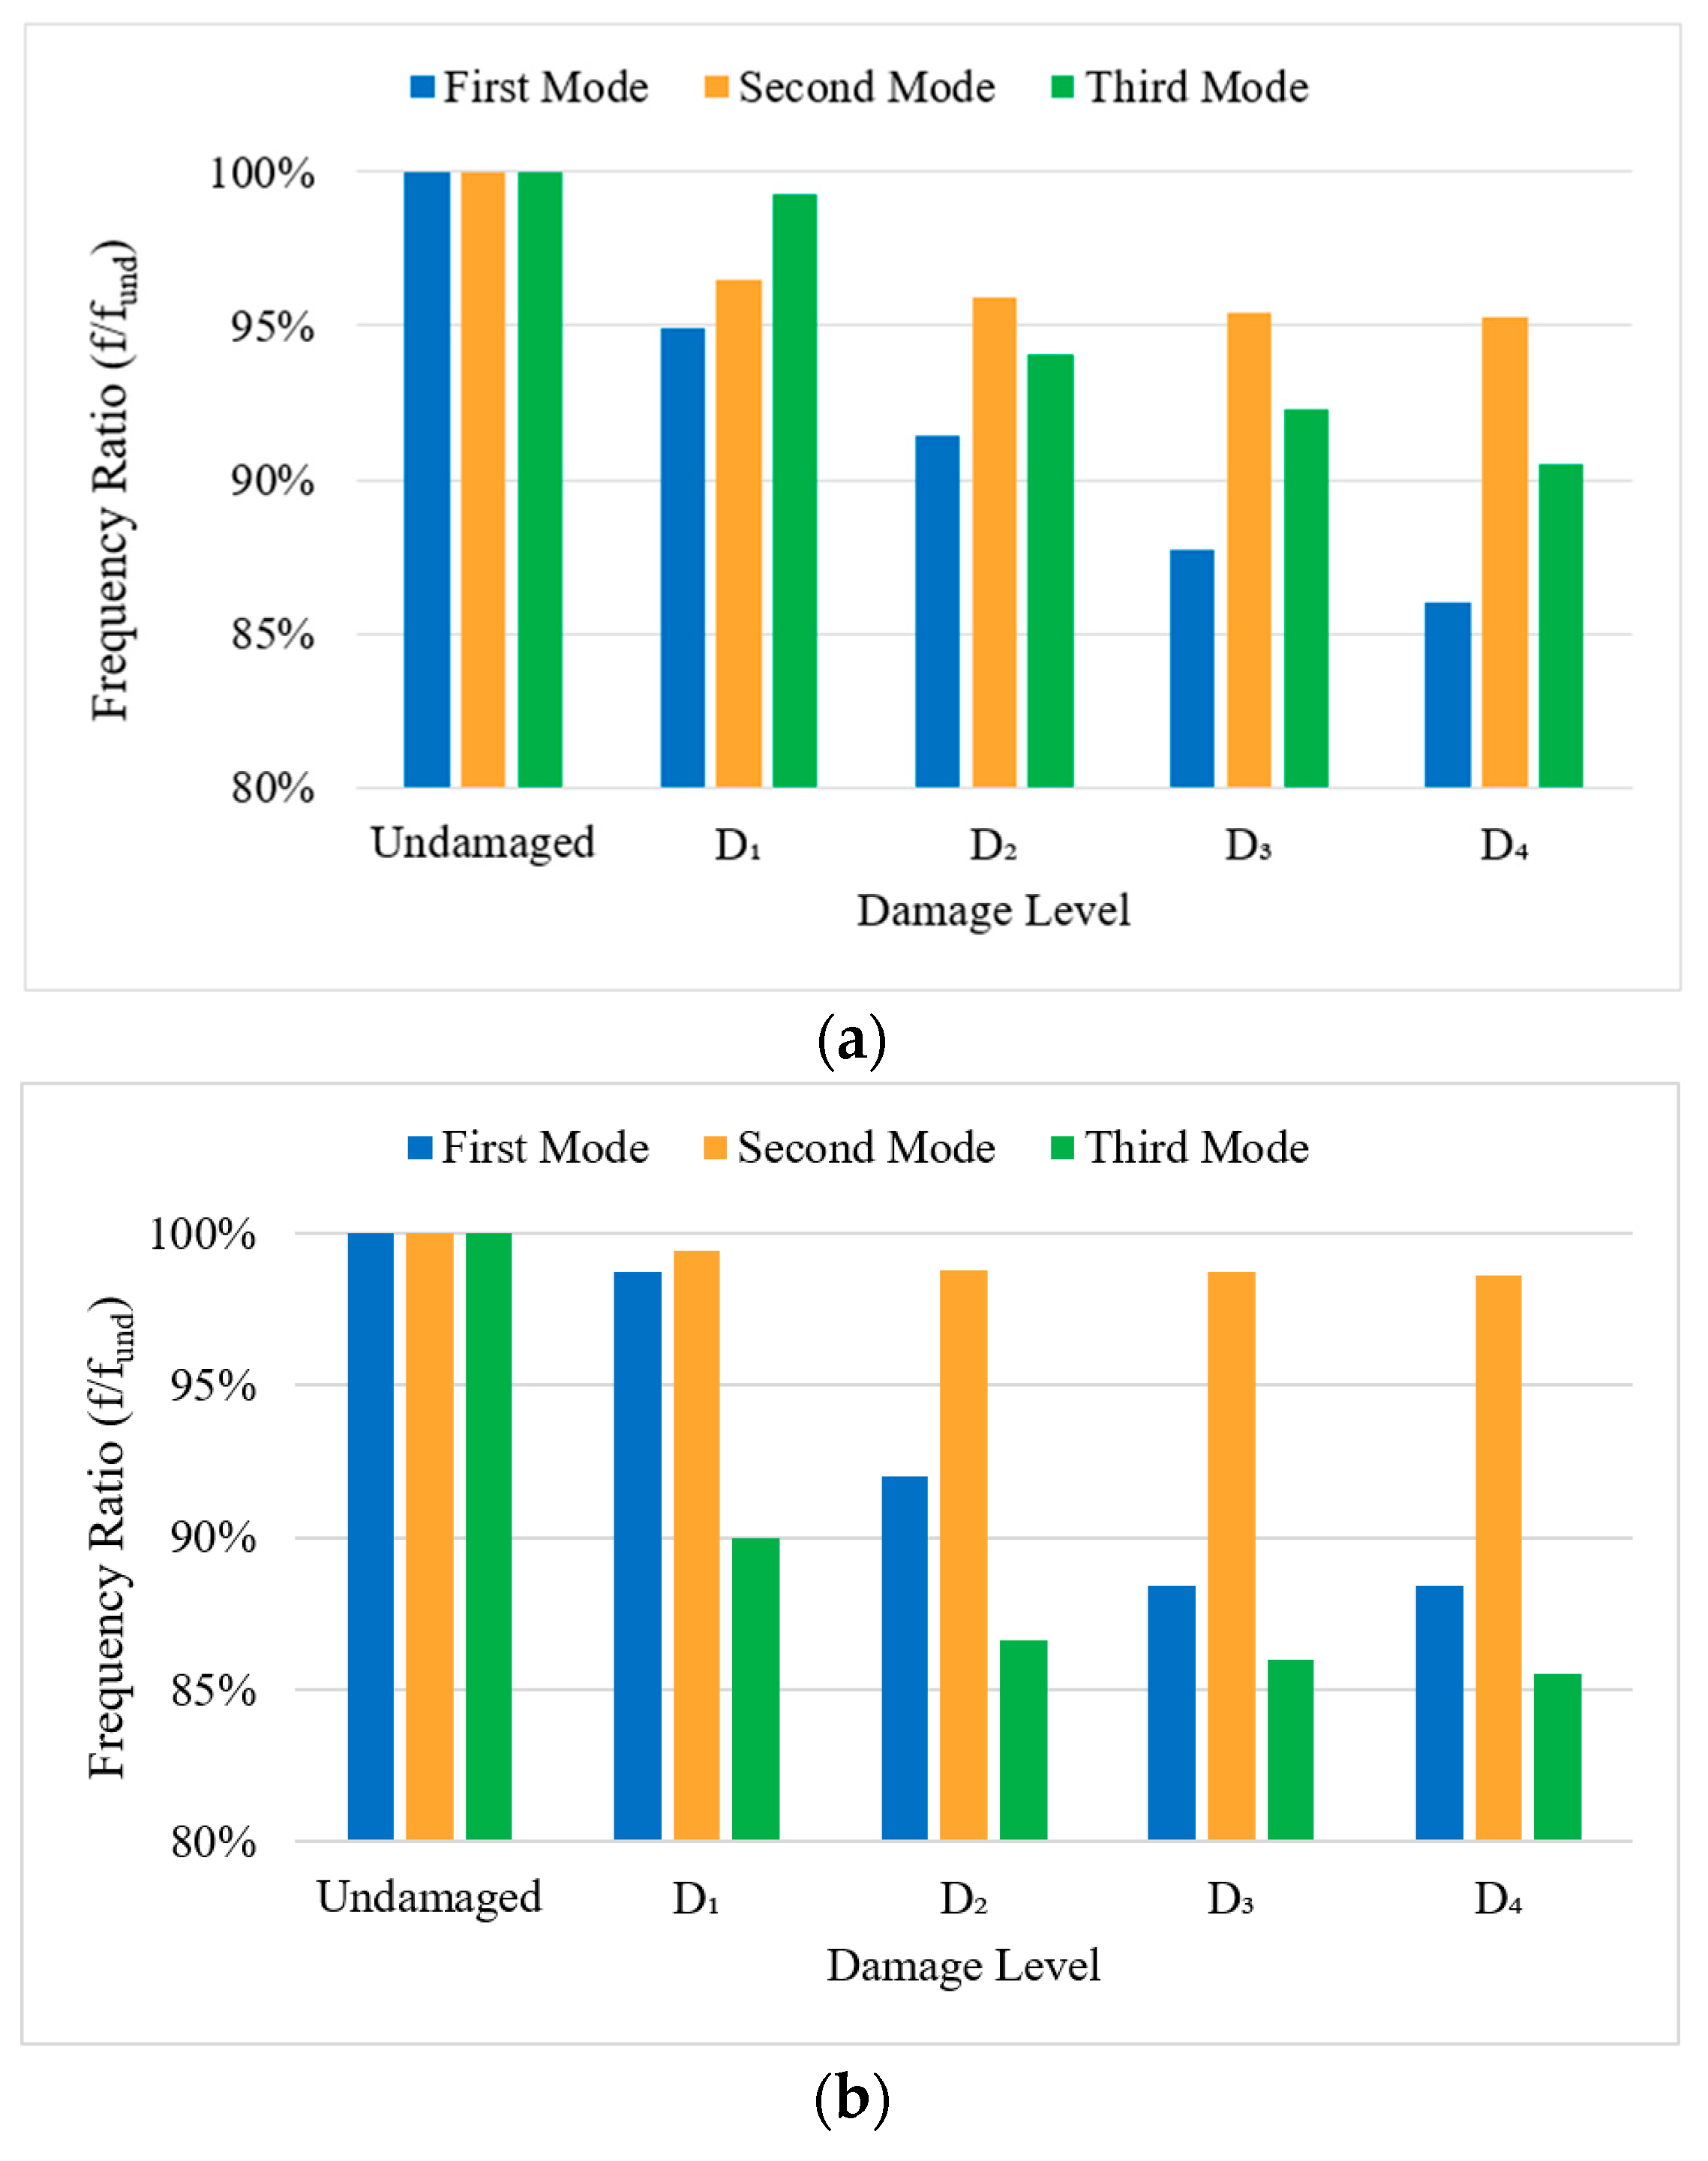
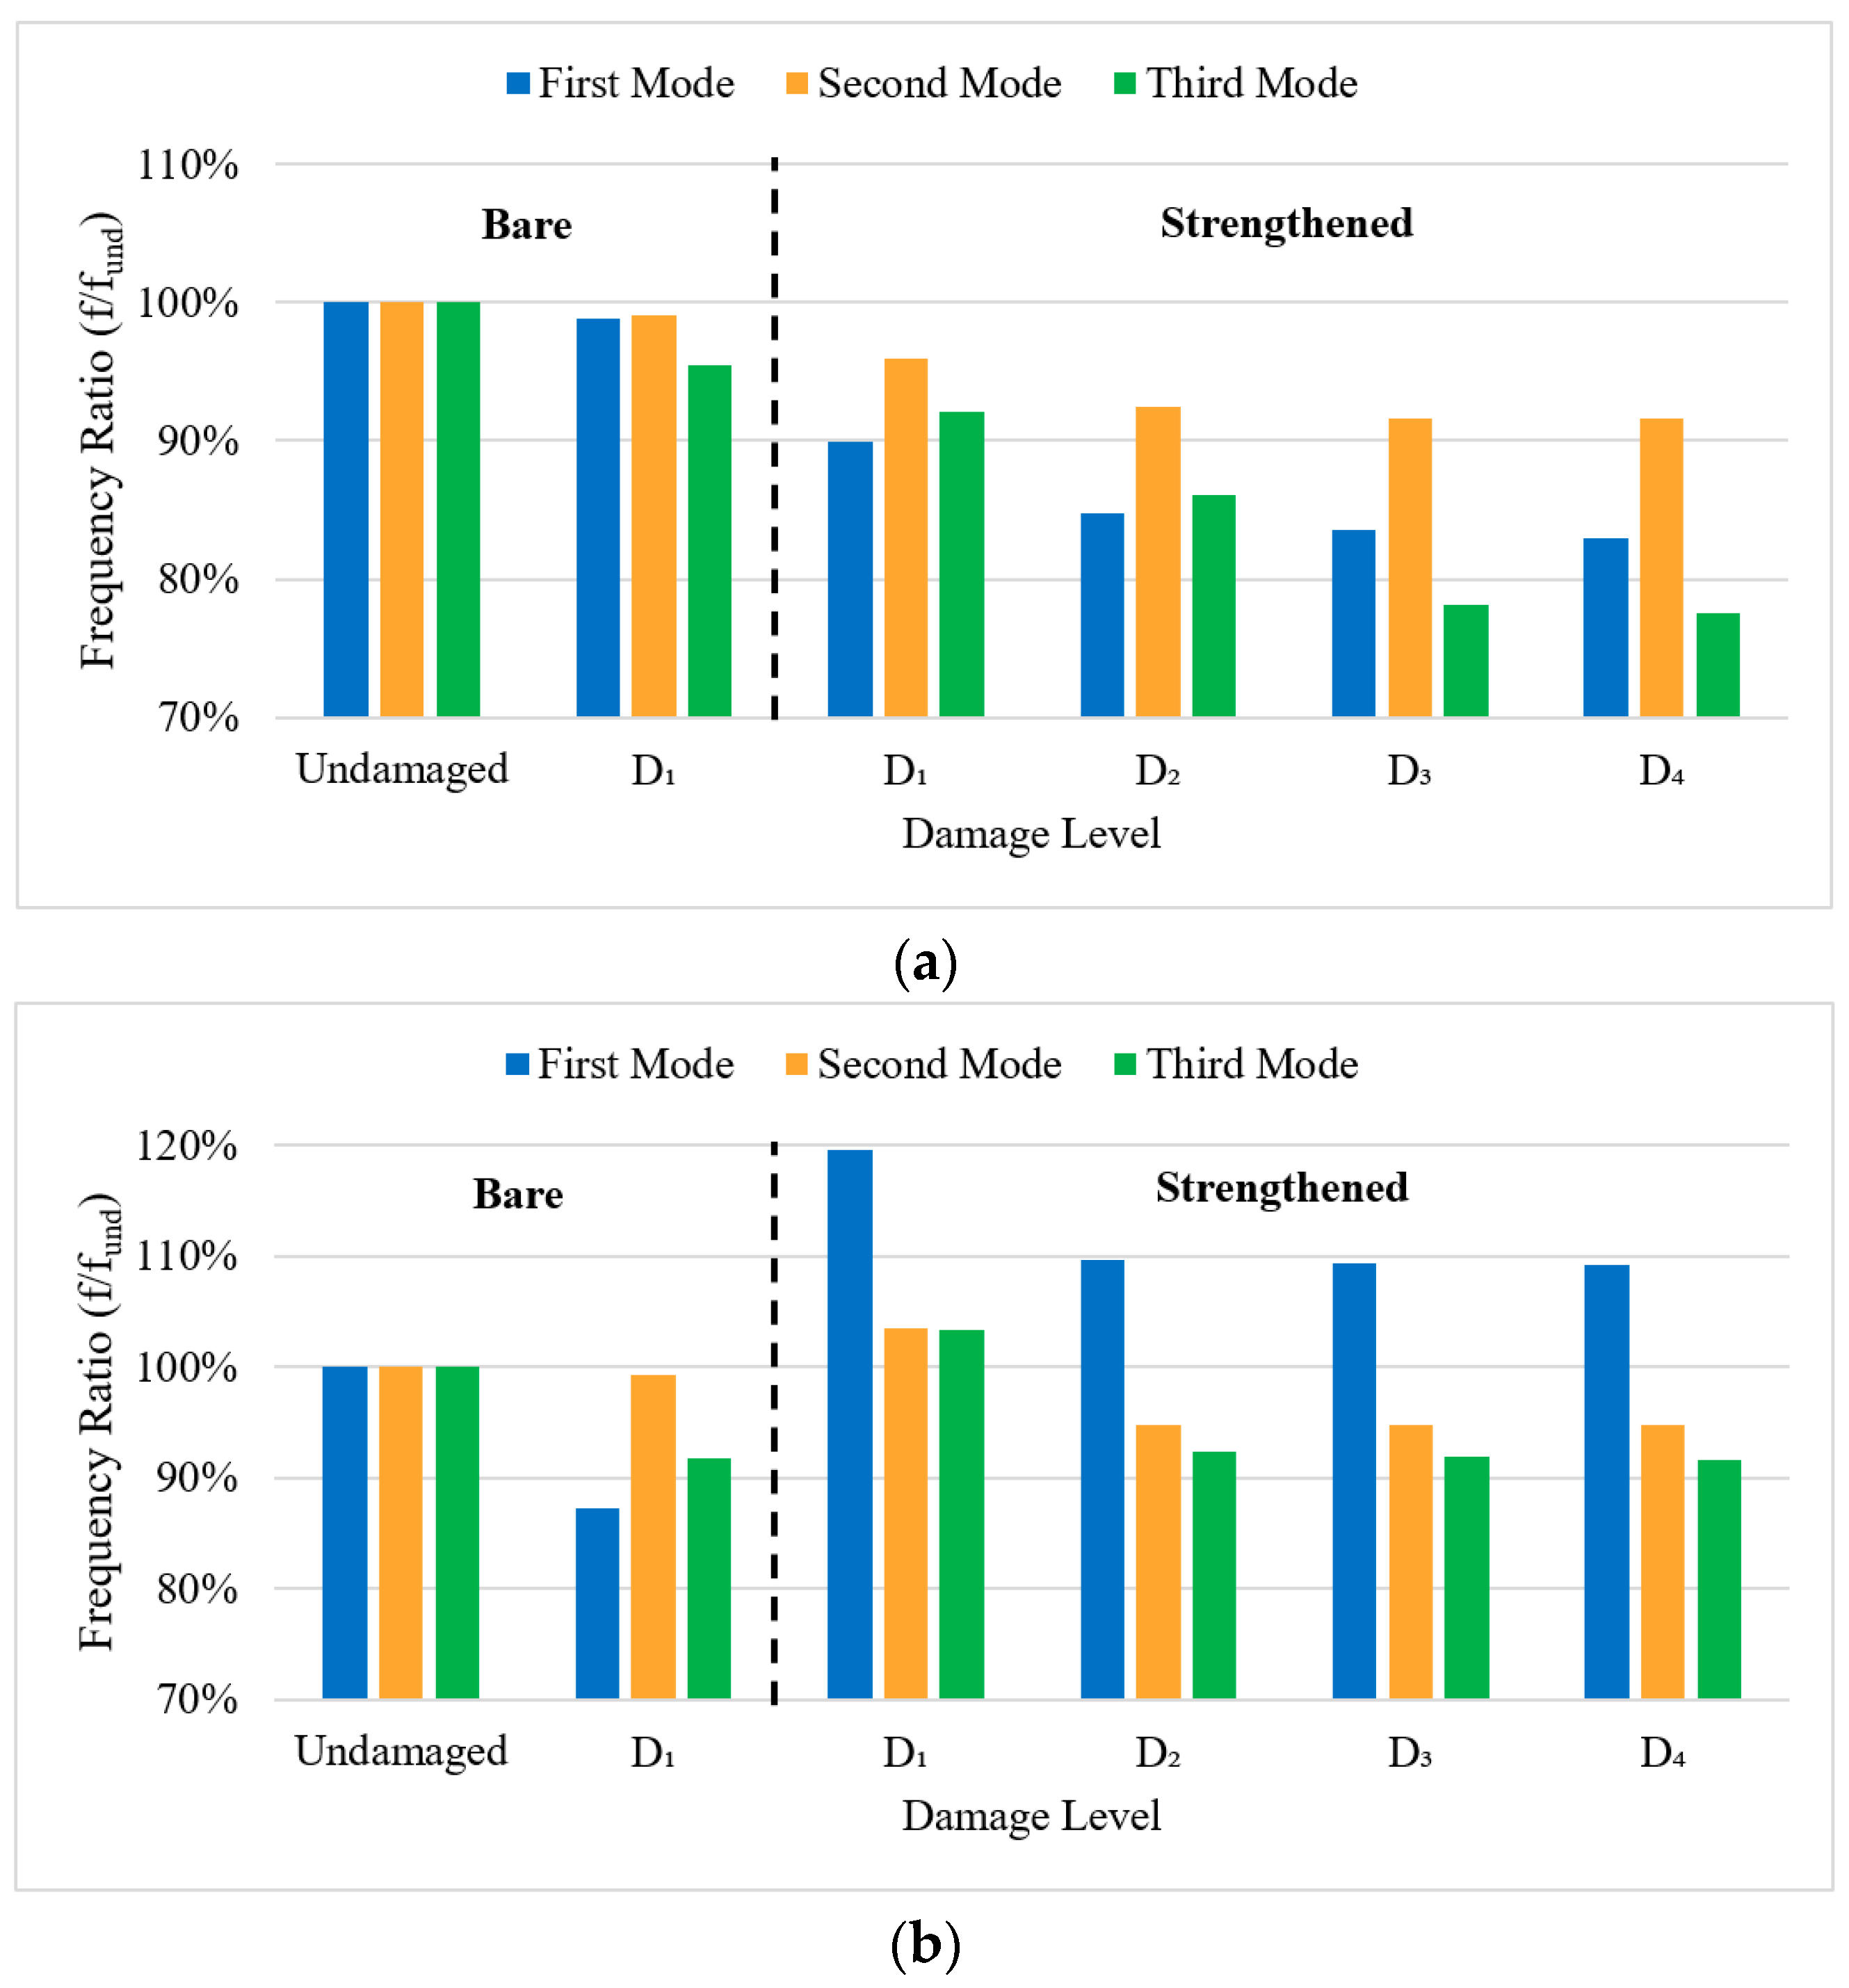
Table 9 presents the modal frequency ratios for Beam_GFRP_PostStr at various damage levels. Initially, Beam_GFRP_PostStr is a bare beam, and the modal frequencies are estimated for both the undamaged state and the D
1 damage level. Subsequently, the beam is strengthened with GFRP, and the modal frequencies are extracted again at the D
1 damage level. The beam is then subjected to further damage, and the modal frequencies are estimated at the D
2, D
3, and D
4 damage levels.
Figure 14 illustrates the variation in modal frequency ratios in both directions, tracking the effects of both damage progression and strengthening.
Table 9 and
Figure 14 present the dynamic response of Beam_GFRP_PostStr throughout its testing process. Initially, the bare beam exhibits a consistent decrease in modal frequencies as damage increases from the undamaged state to the D
1 damage level. After GFRP strengthening, the modal frequencies in the vertical direction show a decrease, which can be attributed to the effects of the beam’s transport during the strengthening process and the week-long waiting period for the strengthening material to cure under its own weight (i.e., in the vertical direction), potentially leading to additional damage. In the vertical direction, the third mode exhibits a more gradual decline, while the second mode remains relatively stable until higher damage levels. In the horizontal direction, after strengthening with GFRP at the D
1 damage level, the modal frequencies show a significant recovery, with all modes increasing beyond their undamaged state. This suggests that GFRP strengthening is effective in restoring and even enhancing the beam’s stiffness, particularly in the horizontal direction. However, as the beam is subjected to further damage at the D
2, D
3, and D
4 damage levels, the modal frequencies progressively decrease again, indicating that the strengthening cannot fully mitigate the impact of higher damage levels. In overall, the results suggest that the GFRP strengthening improves the dynamic response of Beam_GFRP_PostStr at lower damage levels, but its effectiveness diminishes as more severe damage is introduced.
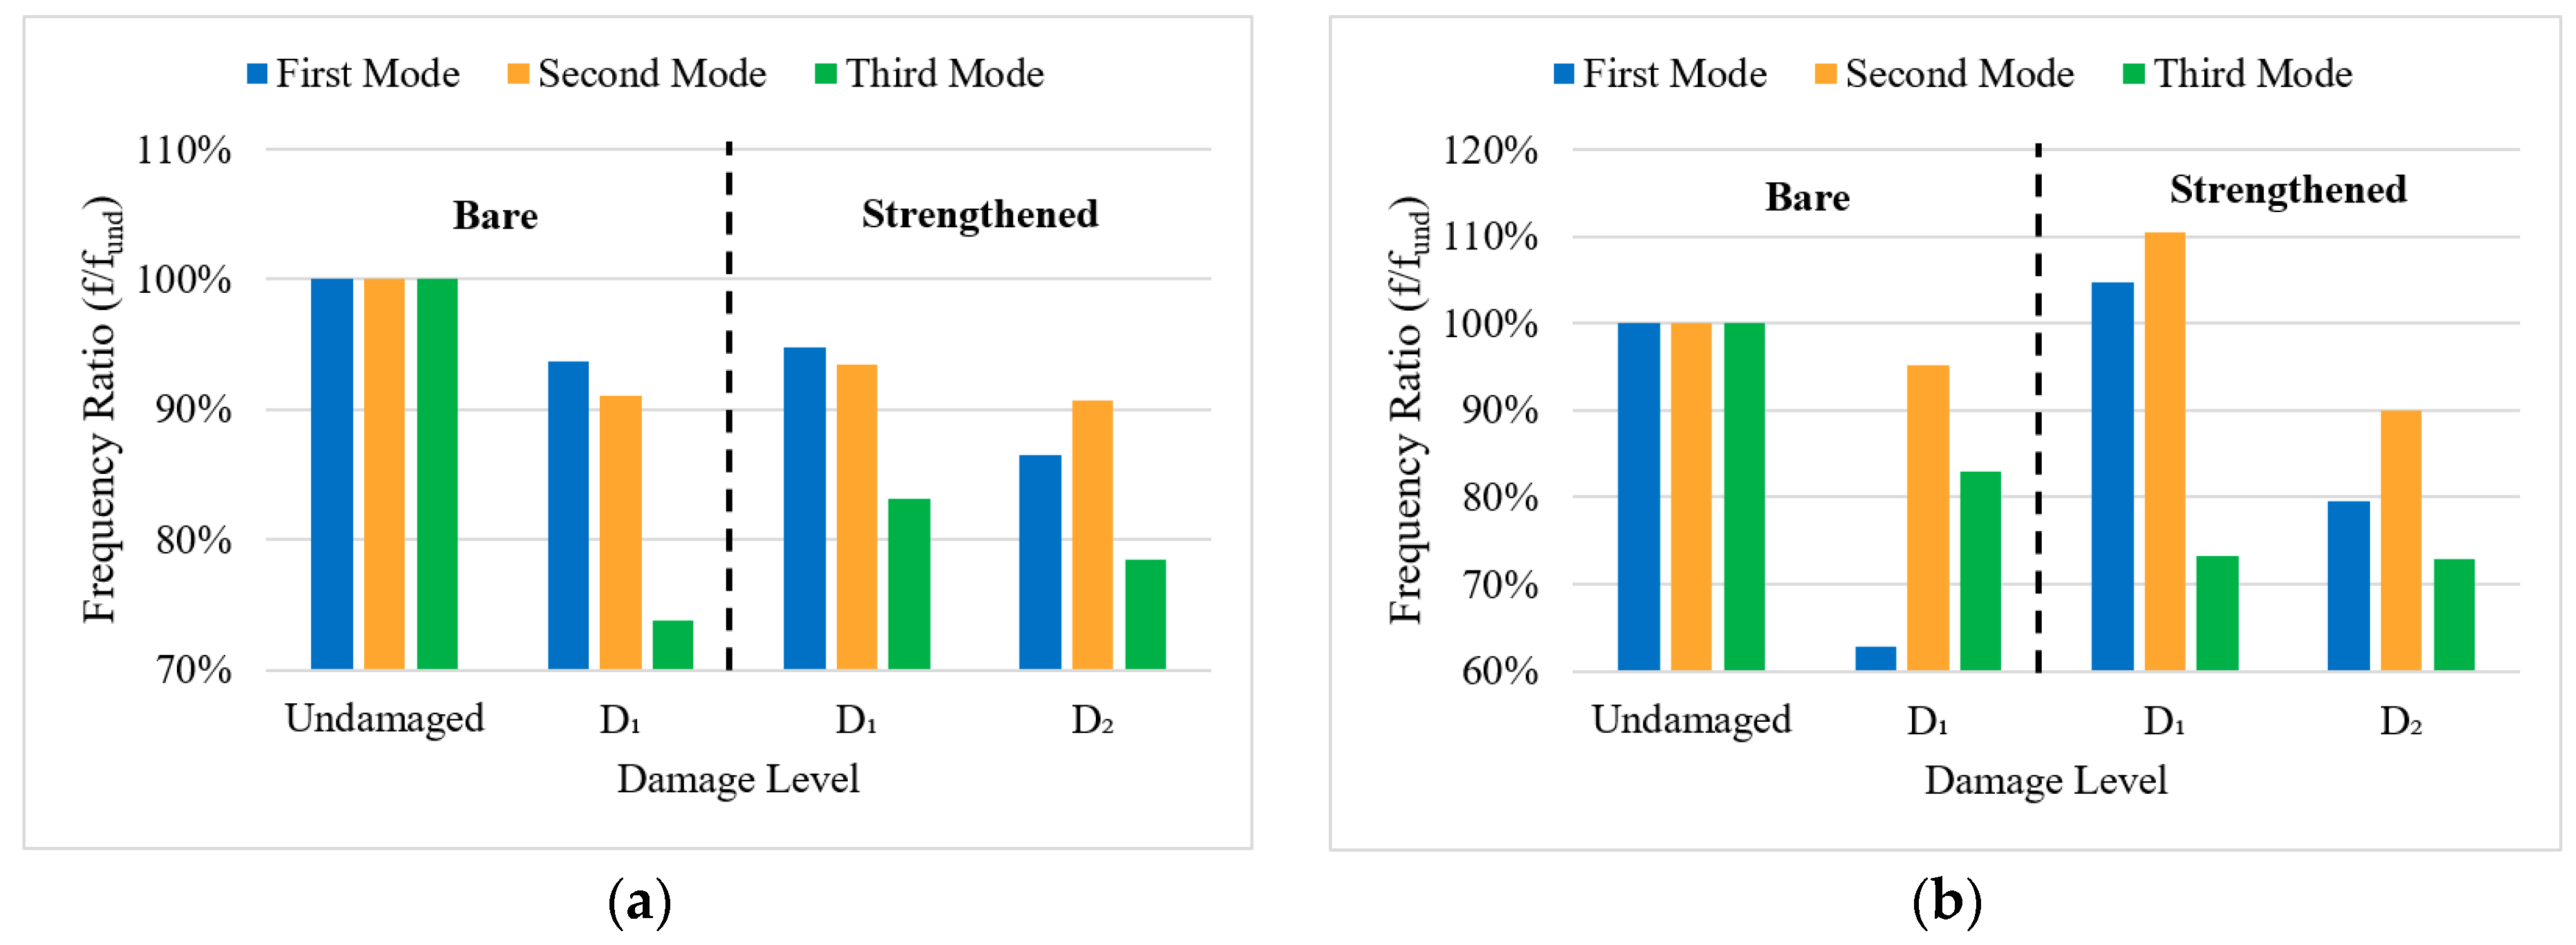
Table 10 shows the modal frequency ratios for Beam_CFRP_PostStr at different damage levels, both in the vertical and horizontal directions. Initially, Beam_CFRP_PostStr is tested as a bare beam, with modal frequencies estimated in the undamaged state and at the D
1 damage level. Subsequently, the beam is strengthened using CFRP, and the modal frequencies are estimated again at the D
1 damage level. The beam is then subjected to further damage, with modal frequencies estimated at the D
2 damage level.
Figure 15 illustrates the variation in modal frequency ratios in both directions.
Initially, as a bare beam, Beam_CFRP_PostStr experiences a reduction in modal frequencies at the D1 damage level. After strengthening with CFRP, there is a recovery in modal frequencies, especially in the horizontal direction, reflecting the effectiveness of CFRP in restoring stiffness. However, as damage progresses to the D2 damage level, a general decrease in modal frequency ratios is observed across all modes in both directions, signaling a reduction in stiffness as the beam’s structural integrity continues to degrade. In the vertical direction, the third mode shows a noticeable reduction in frequency at the D1 damage level, prior to strengthening. After strengthening with CFRP, there is a slight improvement at the D1 damage level, but the modal frequencies do not fully recover to the undamaged state. At the D2 damage level, all modes show further reductions, with the third mode being the most affected. In the horizontal direction, CFRP strengthening leads to a more pronounced recovery in modal frequencies at the D1 damage level. The first and second mode exceed their undamaged state values after strengthening, indicating a significant enhancement in stiffness due to CFRP strengthening. However, as the beam reaches the D2 damage level, all modes experience reductions in modal frequency estimates, with the third mode showing the most substantial decrease. Despite the decrease, the vertical direction remains more resilient to damage compared to the horizontal direction, indicating the effectiveness of CFRP in enhancing the beam’s dynamic behavior in the vertical direction.
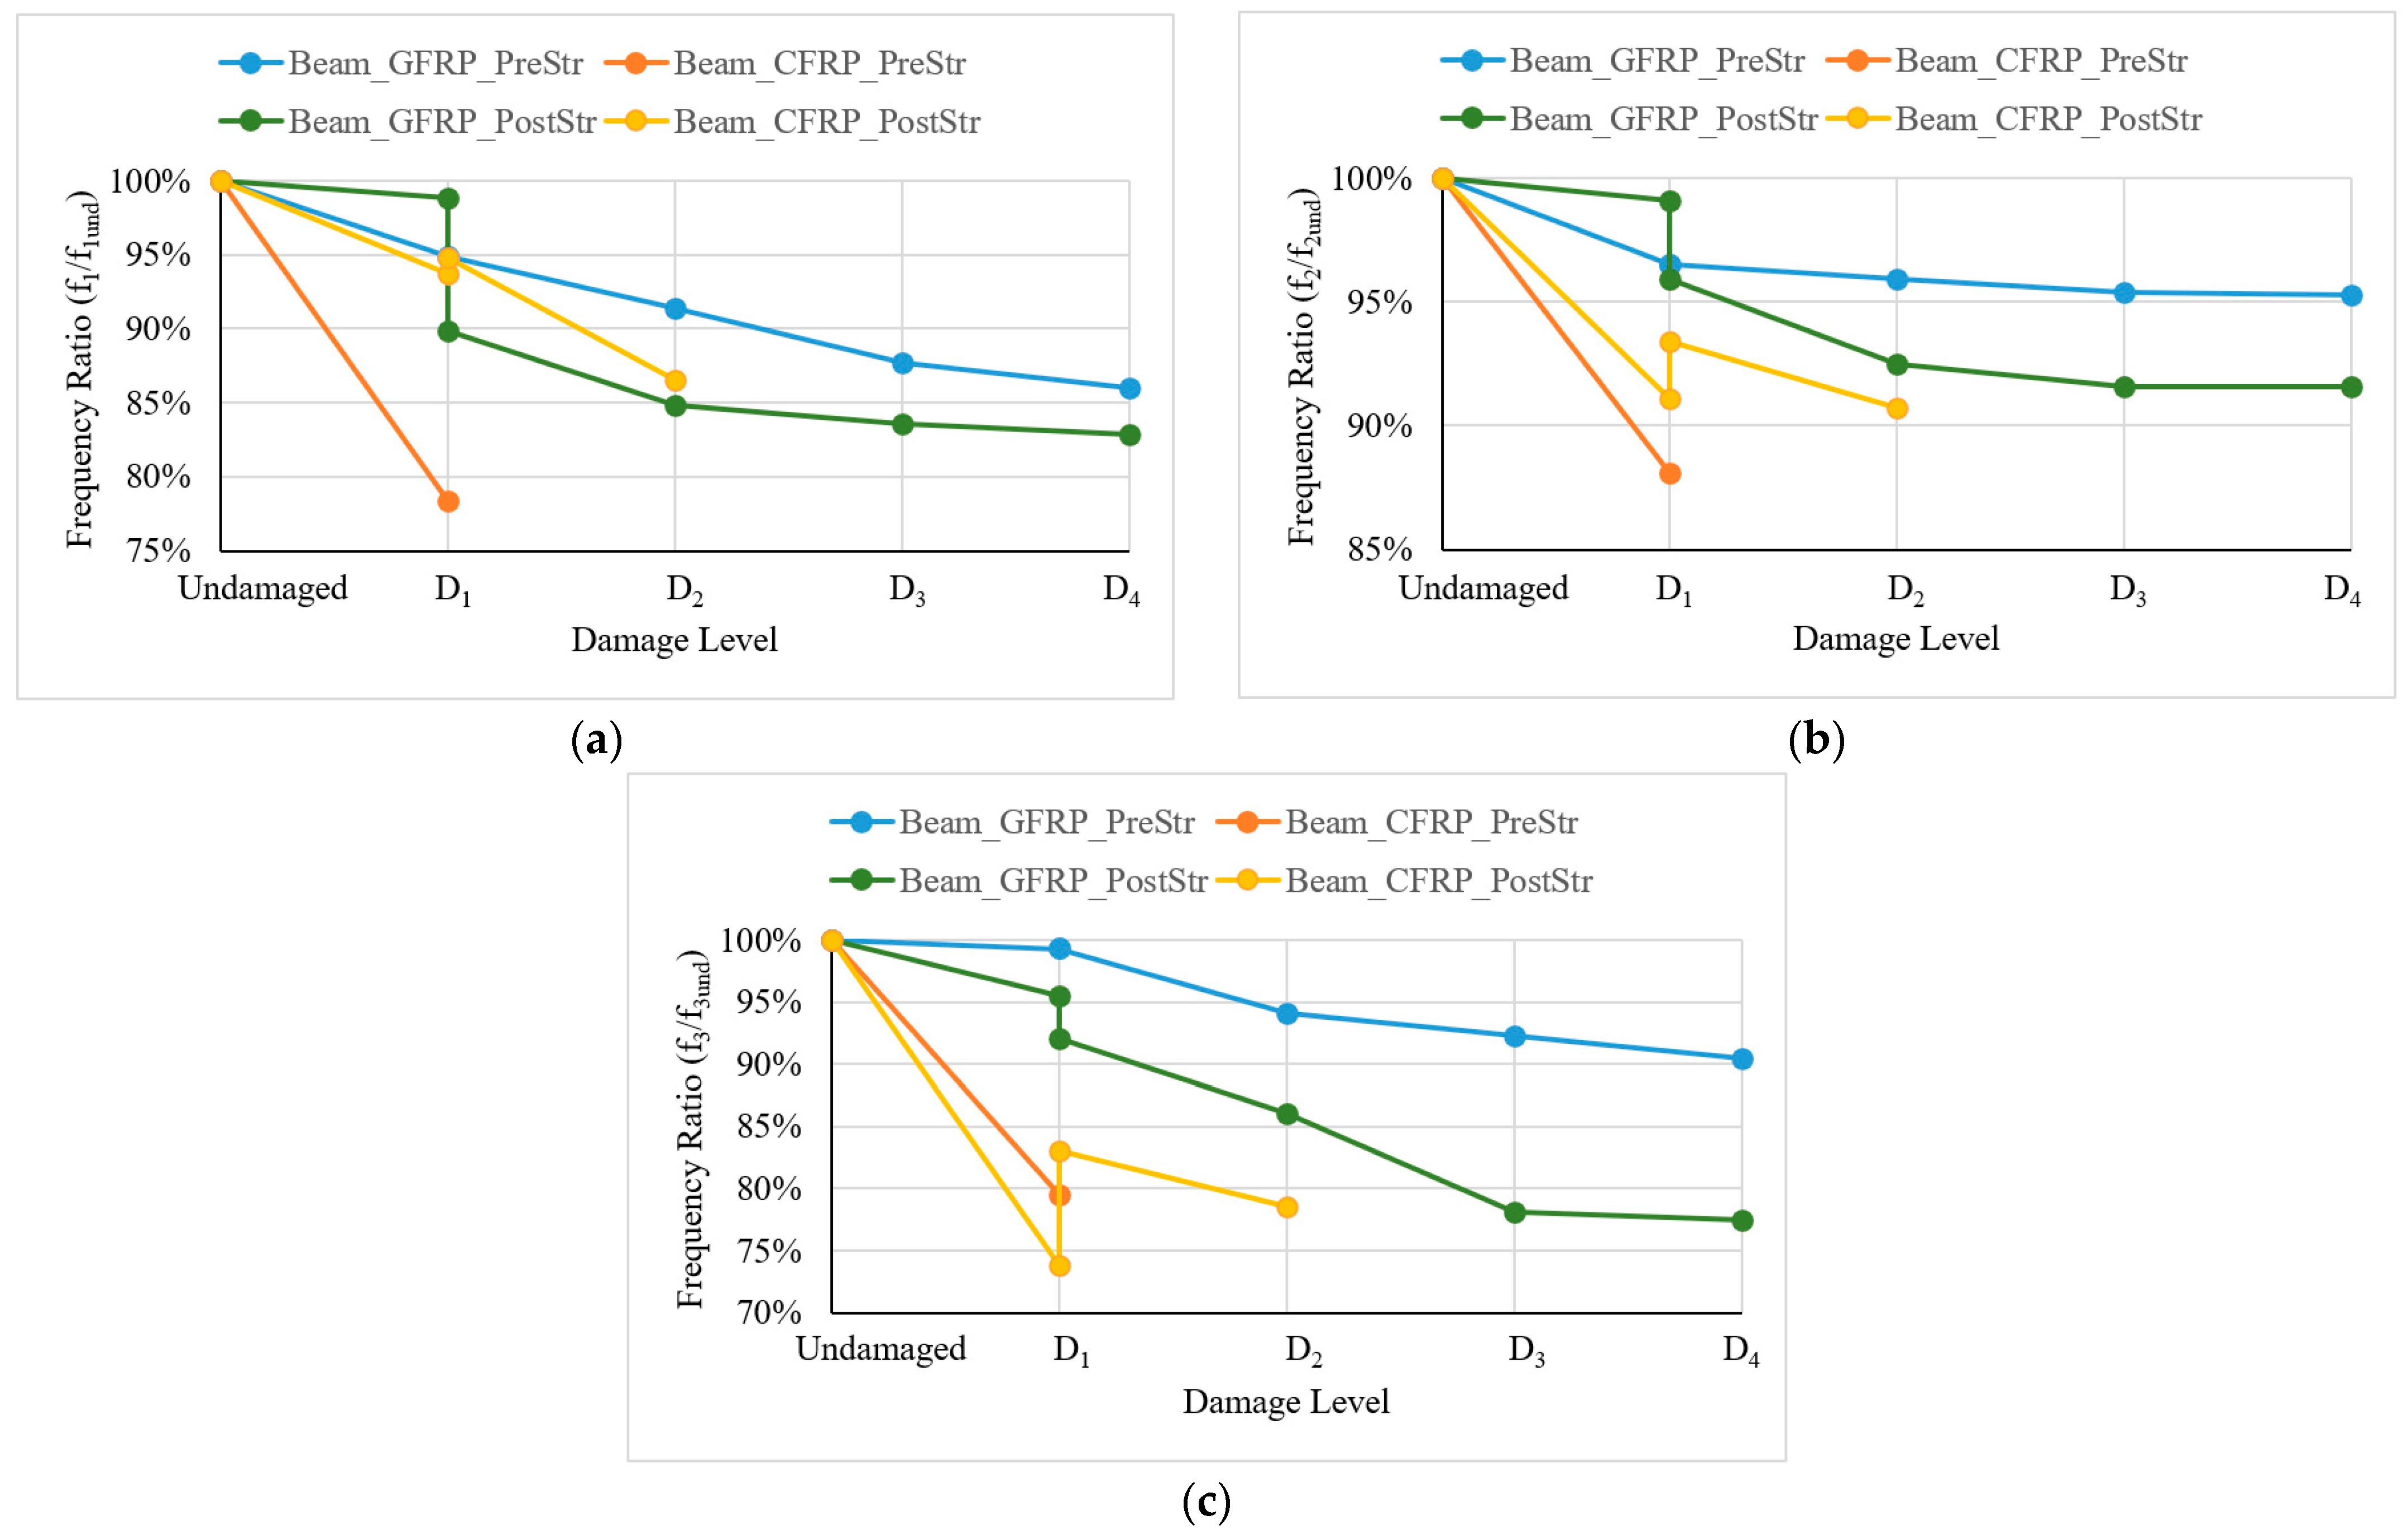
Figure 16 presents the modal frequency ratios for all beams in the vertical direction across different damage levels. Note that these ratios represent the proportional changes in frequencies relative to each beam’s undamaged state, enabling a comparative analysis of how each beam responds to damage in relative terms.
In the vertical direction, Beam_GFRP_PreStr displays a relatively stable frequency ratio for all modes. This indicates that GFRP contributes to maintaining the frequency ratios more consistently, with smaller proportional decreases as the damage level increases. Beam_CFRP_PreStr exhibits a larger decrease in the first and second modes compared to the other beams, reflecting a greater sensitivity to damage in these modes. After strengthening, Beam_CFRP_PostStr shows an increase in modal frequency values, while Beam_GFRP_PostStr exhibits a decrease. This difference in behavior can be attributed to the effects of transporting during the strengthening process and the week-long curing period for the strengthening material under the beam’s own weight, potentially leading to additional damage, especially in the vertical direction. When Beam_GFRP_PostStr and Beam_CFRP_PostStr are subjected to the D2 damage level, the second and third modal frequencies for both beams exhibit a similar decrease. However, the first modal frequency of Beam_CFRP_PostStr shows a more significant drop compared to Beam_GFRP_PostStr. This suggests that while both GFRP and CFRP help to maintain stability in the second and third modes, CFRP is less effective in preventing reductions in the first mode under higher damage levels.
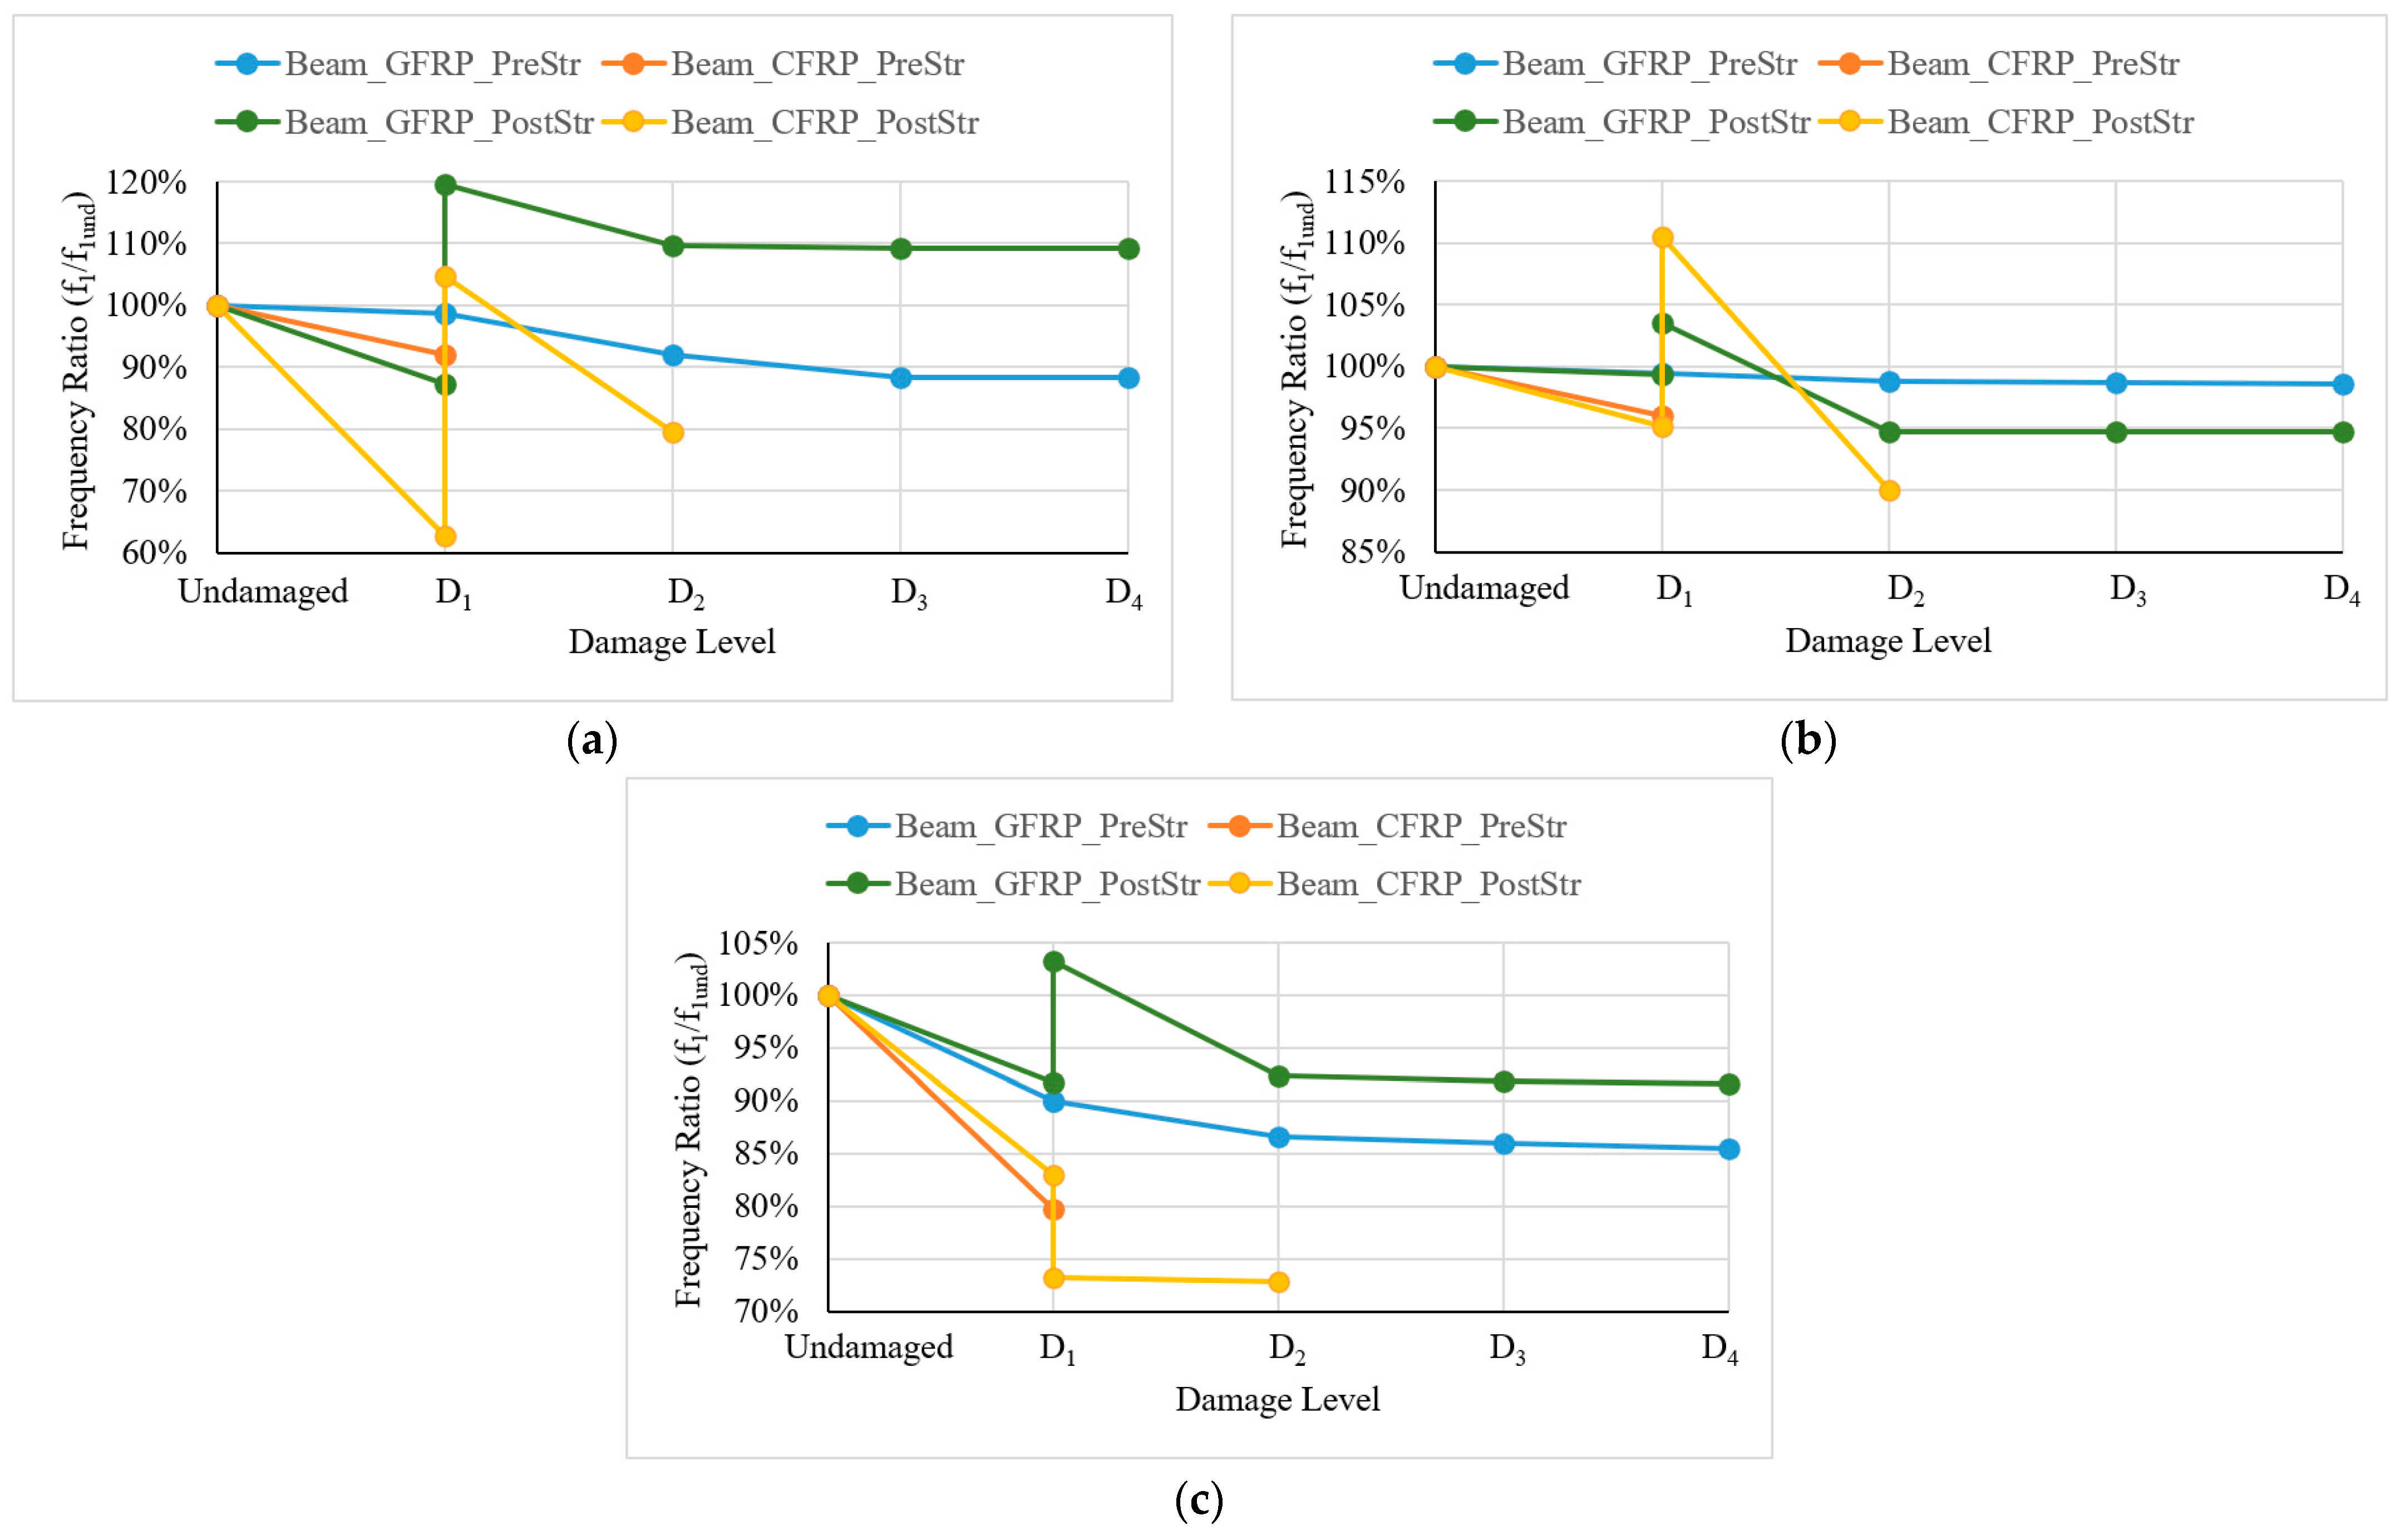
Figure 17 illustrates the modal frequency ratios for all beams in the horizontal direction across different damage levels. This figure highlights the effect of damage and strengthening on the dynamic behavior of each beam in the horizontal direction.
Beam_GFRP_PreStr and Beam_GFRP_PostStr show stable frequency ratios across all modes, with the ratios remaining close to 100% after damage, indicating that GFRP is effective in maintaining the beams’ horizontal stiffness values. Beam_CFRP_PreStr displays a more significant reduction in all modes compared to Beam_GFRP_PreStr, suggesting that CFRP is less effective than GFRP in the horizontal direction. Significant recovery in modal frequencies is observed in the first two modes of Beam_GFRP_PostStr and Beam_CFRP_PostStr after strengthening. The greater proportional recovery in Beam_CFRP_PostStr compared to Beam_GFRP_PostStr indicates that CFRP contributes more to the increase in stiffness than GFRP. The second mode remains the least affected across all beams, indicating that it is generally more resilient to damage.


