Article

Development and Experimental Study of an Experimental Setup for an Online Vibrating Tube Liquid Densitometer

1
College of Intelligent Manufacturing Modern Industry (College of Mechanical Engineering), Xinjiang University, Urumqi 830049, China
2
Xinjiang Institute of Measurement & Testing Technology, Urumqi 830011, China
*
Author to whom correspondence should be addressed.
Appl. Sci. 2024, 14(21), 9905; https://doi.org/10.3390/app14219905
Submission received: 26 March 2024 / Revised: 10 May 2024 / Accepted: 10 May 2024 / Published: 29 October 2024
(This article belongs to the Section Mechanical Engineering)

Abstract

:

Featured Application

This theoretical analysis examines the working principle of an online vibrating tube liquid densitometer. The analysis is based on the design and establishment of a series of experimental devices, the evaluation of device uncertainty, and the use of straight and curved-tube-type online densitometers to verify device reliability. The study also investigates the impact of pressure and temperature on the metrological performance of the vibrating tube densitometer.

Abstract

Density is a crucial parameter for quantitatively describing the physical properties of liquids. It serves as an important indicator for scientific research, production process control, pipeline transportation, and other aspects. In oil pipeline transportation and raw material processing, the real-time online measurement of liquid density is of great significance. This paper analyzes the working principle of an online vibrating tube densitometer and derives the fitting equation for temperature, pressure, and density; it also conducts experiments with an online vibrating tube liquid densitometer and establishes a traceability chain for the experimental device. The experimental setup includes a desktop densitometer system, a multi-temperature field constant-temperature stirring system, a walk-in constant-temperature box, an automatic blowing system, and a frequency acquisition and calculation system. The uncertainty of the device’s evaluation is U = 0.08 kg/m3, k = 2. We built a set of pressure-density static test systems, statically testing the online vibrating tube’s liquid-density meter vibration frequency at different pressures; the whole set of systems can be used to assess the specific density, temperature, and pressure range of online vibrating tube liquid density meters in the experimental research to derive the standard temperature. Through the experimental research, we can accurately derive the fitting coefficients under the standard temperature, specific temperature, and pressure of online vibrating tube liquid densitometers, and calculate the fitting error of online vibrating tube liquid densitometers under different temperatures and pressures within the experimental range through fitting equations and coefficients, so as to realize the practical application of online vibrating tube liquid densitometers in engineering by utilizing straight-tube-type and curved-type online vibrating tube densitometers. A preliminary study was conducted on the effects of different densities, temperatures, and pressures on the vibrating tube system’s vibration cycle. The fit coefficient and error were calculated, and the experimental results were compared to the theoretical analysis to confirm the device’s conformity. The study verified the device’s scientific and reasonable design, and demonstrated that it is feasible to use the device for follow-up research. Using this device in subsequent experiments can verify the effects of viscosity, inlet, installation, and other factors on the online vibrating tube liquid densitometer’s metrological performance. Further experimental research on the pressure–frequency–density test system and the establishment of a wide range of temperatures and pressures within the pressure standard density test system are needed to achieve a wide range of temperatures and pressures under the standard density test.

1. Introduction

Fluid density is a crucial physical parameter in the process of fluid pipeline transportation. The online measurement of its density can be obtained through its coefficient of thermal expansion, compression coefficient, and other indicators, ensuring the normal transportation of liquids [1]. For the measurement of liquid density, there are two main methods: One is the use of a density formula for direct measurements; this type of method generally needs to measure samples to be brought back to the laboratory so that an offline measurement is completed. The offline measurement is subject to low timeliness and human error, and cannot meet the needs of the measurements of modern pipelines.
Transportation. This is the other method based on the physical properties of fluids and the relationship between certain quantities generated by the indirect method of measurement used to determine the online density of fluid real-time measurements. this method is generally known as the online fluid density measurement [2,3]. The dynamic online measurement can be used to assess fluid density, present high measurement accuracy, good timeliness, a wide range of applications.
Based on the working principle of an online vibrating tube liquid densitometer, it is necessary to use reasonable experimental equipment to carry out scientific calibration experiments on the online vibrating tube liquid densitometer to achieve the accurate equation coefficients in different temperature bands and pressure ranges, and then to calculate the online density of the measured liquid in use.

2. Study on the Working Principle of an Online Vibrating Tube Liquid Densitometer

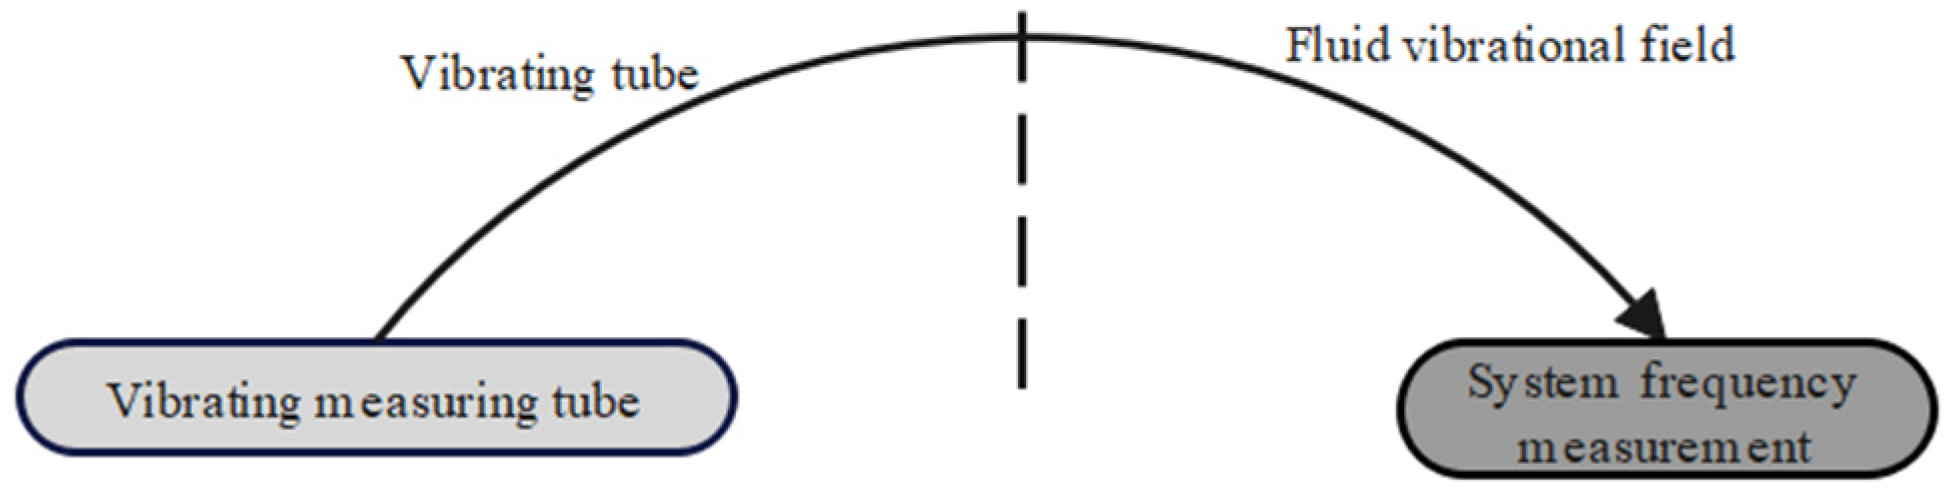
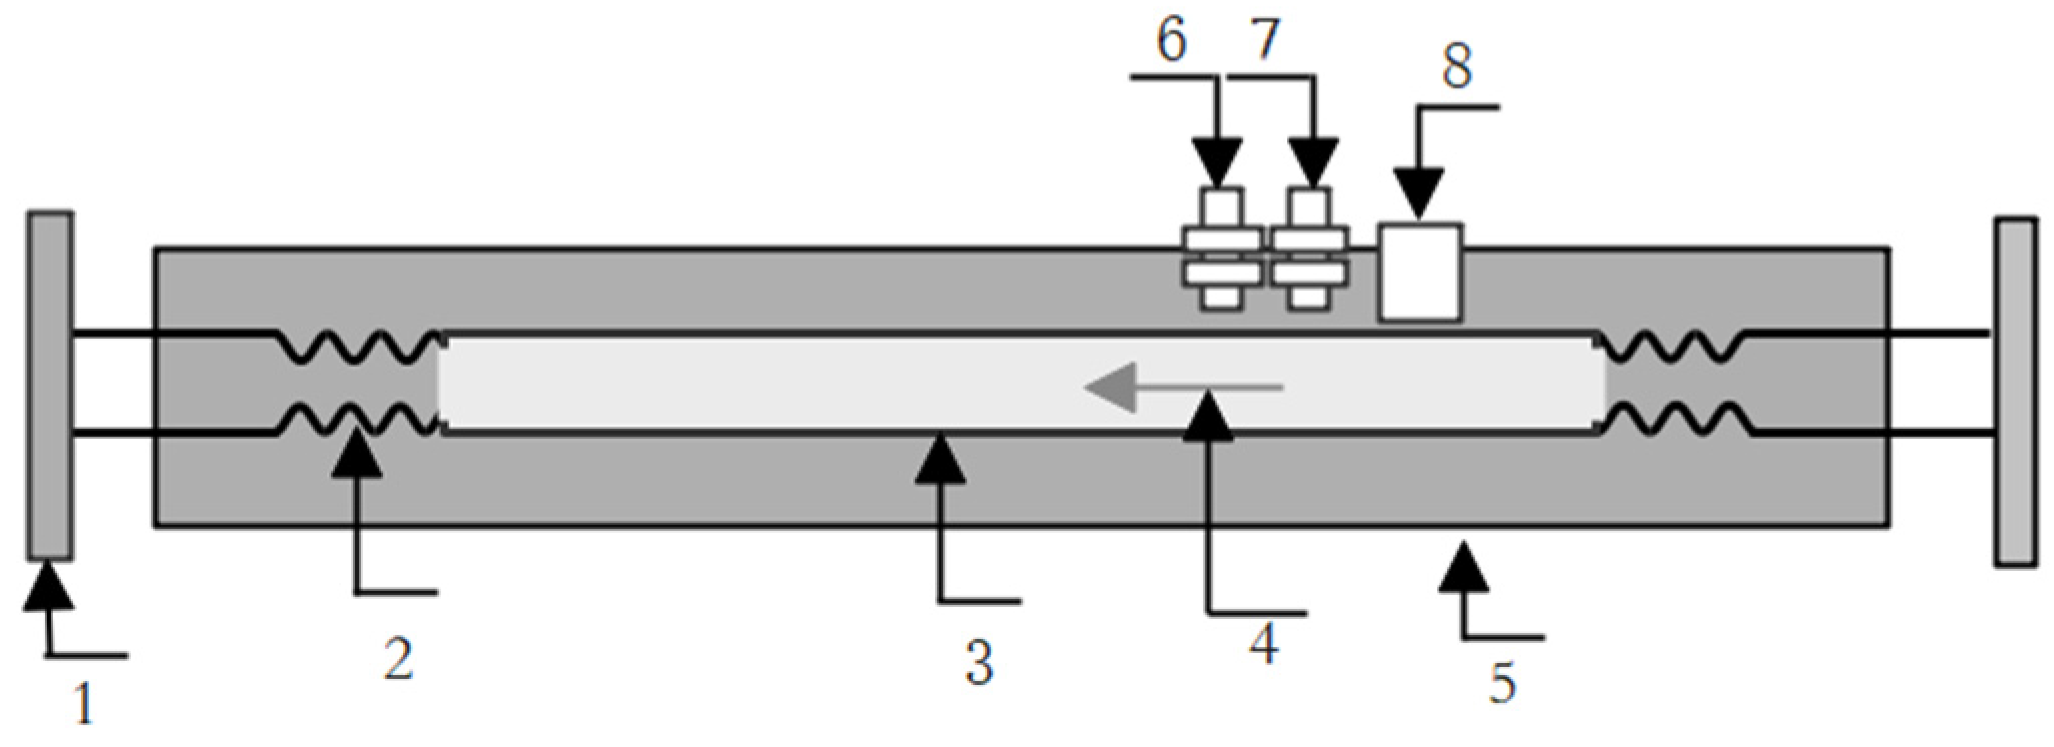
2.1. Working Principle of the Online Vibrating Tube Liquid Densitometer

A vibrating tube liquid density meter, according to the number and shape of the vibrating tube, can be divided into a single straight-tube type, double straight-tube type, multi-straight-tube type, or U-type vibrating tube. Regardless of the kind of online vibrating tube liquid density meter, the working principle is the same [3,4]. The vibration tube material and size of its intrinsic vibration frequency and mode are pre-established. When the fluid enters into the vibration tube, the total mass of the liquid changes the vibration. The fluid will vibrate in the vibration tube; the intrinsic vibration frequency in the vibration tube changes. The vibration tube’s volume is fixed. The vibration frequency can be measured by the change in the density of fluid in the tube [4,5]. Figure 1 shows the working principle of the on-line vibrating liquid densitometer.
The structure of single straight tube type on-line vibrating tube liquid densitometer is shown in Figure 2. When the vibrating tube is used, a free vibration is performed, according to the composition and working principle of the vibrating tube. The vibrating tube can be regarded as a spring–damping–mass system [5]. When no fluid passes through the vibrating tube, the vibrating tube vibrates at the natural frequency, and the vibration period can be measured by the sensor. When the fluid flows through the vibrating tube, the mass and stiffness of the vibrating system will change, the intrinsic frequency of the vibrating tube system will change, and the frequency–density system equation of the vibrating tube can be obtained after appropriate compensation and correction [5,6]. According to the principle of elastic mechanics, the two ends of the fixed spring support the vibration tube system’s transverse parallel vibration of the intrinsic angular frequency, which can be expressed as [7,8].
ω 0 = k M
ω 0 : Angular frequency of transverse vibration of the vibrating tube system (rad/s); k : modulus elasticity (Pa); and M : system quality (kg).
From (1), it can be seen that the vibration tube system’s spring modulus of elasticity, k, is a constant, and its natural frequency changes only with the system mass, M. The vibration tube material and volume are certain, so the quality of the fluid is determined only by the density of the fluid, that is, changes in the fluid density change the natural frequency of the vibration tube system. The vibration tube’s vacuum-state-resonance angular frequency can be used (2) expressed as follows:
ω 1 = k m
ω 1 : Resonant angular frequency in the vacuum state of the tube (rad/s); m : vibration tube system quality (kg).
At room temperature and pressure, the air mass inside the vibrating tube is much lower than the mass of the vibrating tube, so the air mass inside the tube can be ignored [9]. When calculating the mass of the empty tube in use, the resonant angular frequency under the empty tube state can also be expressed as (2). When fluid runs through the vibration tube system, the resonance angular frequency can be expressed as:
ω x = k m + Δ m
ω x : Resonant angular frequency of the vibrating tube after liquid flows through it (rad/s); Δ m : mass flowing through the vibrating tube (kg).
The combination of Equations (2) and (3) results in:
ρ x = ω 1 2 ω x 2 ρ ρ
ρ x : The flow through the vibration tube of the liquid density (kg/m3); ρ : the vibration tube material density (kg/m3). When the vibration tube material volume is certain, the vibration tube density and intrinsic frequency are constant.
ω 2 ρ = K 2 2 ρ = K 1 ρ x = K 1 + K 2 2 T x
Equation (5) is a mathematical model of density versus frequency obtained under ideal conditions. In practical applications, the relationship between the density and frequency of the vibrating tube vibration under an ideal conditions is:
ρ x = K 0 + K 1 T + K 2 T 2 T = 1 ω x
T is the vibrating tube’s vibration period (us), K0, K1, and K2 are constant. Due to the complexity of the actual working environment, the actual work cannot be directly calculated; theoretically, K0, K1, and K2 need to be experimentally calibrated through different liquid density and frequency fitting calculations of the above three coefficients [9,10].

2.2. Effect of Temperature Variation on Measurement Results

Equation (6) is the density–frequency fitting equation under ideal conditions, and the temperature is not constant in practical applications. Changes in temperature, which affect the structure, material properties, and density characteristics of the vibrating tube, will affect the intrinsic frequency of the vibrating tube itself, and the measured frequency signal will deviate from the actual value, so the system needs to be corrected for the temperature of the vibrating tube densitometer being experimented with ρ t x :
ρ t x = ρ x [ 1 + K 18 ( t 20 ) ] + K 19 ( t 20 )
ρ t x : Temperature-corrected liquid density (kg/m3).

2.3. Pressure Effects on Measurement Results

The use of the environment of the online vibrating tube densitometer for the actual online measurement is more complex. The actual use of the vibrating tube system is not only affected by inertial forces; it is also affected by the impact of the liquid force. The interaction of these forces and the family force is caused by the unnecessary deformation of the vibrating tube, thus affecting the vibration of the tube system, causing the change in the intrinsic frequency of the system.
The correction for the effect of pressure on the online vibrating tube liquid densitometer is made by measuring the vibration period, Tp, and the density of the liquid in the pressurized state condition of the tube and inserting them into fitted Equation (8) [10]. The density value and compression factor, F, of the liquid at a standard pressure are obtained from the table, and the actual density values at different pressures are calculated as follows [10]:
ρ p x = ρ 0 ( 1 + F × ρ p )
ρ p x : Density of liquids at different pressures (kg/m3); ρ 0 : density of liquids at standard pressure (kg/m3); F : liquid compression factor; ρ p : density values for liquids under pressure testing (kg/m3); and P : pipeline pressure (bar).
Refer to the table to observe the density value of different liquids under different pressures. The complete pressure correction formula shown in (8) can be used for type correction to obtain P as the actual pressure in pipelines K20 and K21 by the method of least squares [3,10].
ρ p x = ρ 0 ( 1 + K 20 × P ) + K 21 × P K 20 = K 20 A + K 20 B × ( P 1 ) K 21 = K 21 A + K 21 B × ( P 1 )

3. Research and Development of the Experimental Setup

3.1. Establishing the Traceability Chain

To obtain scientific, accurate, and peer-reviewed experimental data, the parameters of the instrument and the basis of construction must have a complete and accurate traceability chain to ensure that each parameter can be traced directly or indirectly to international units. Figure 3 shows the transfer chain of liquid density measurements from the in-line vibrating tube.

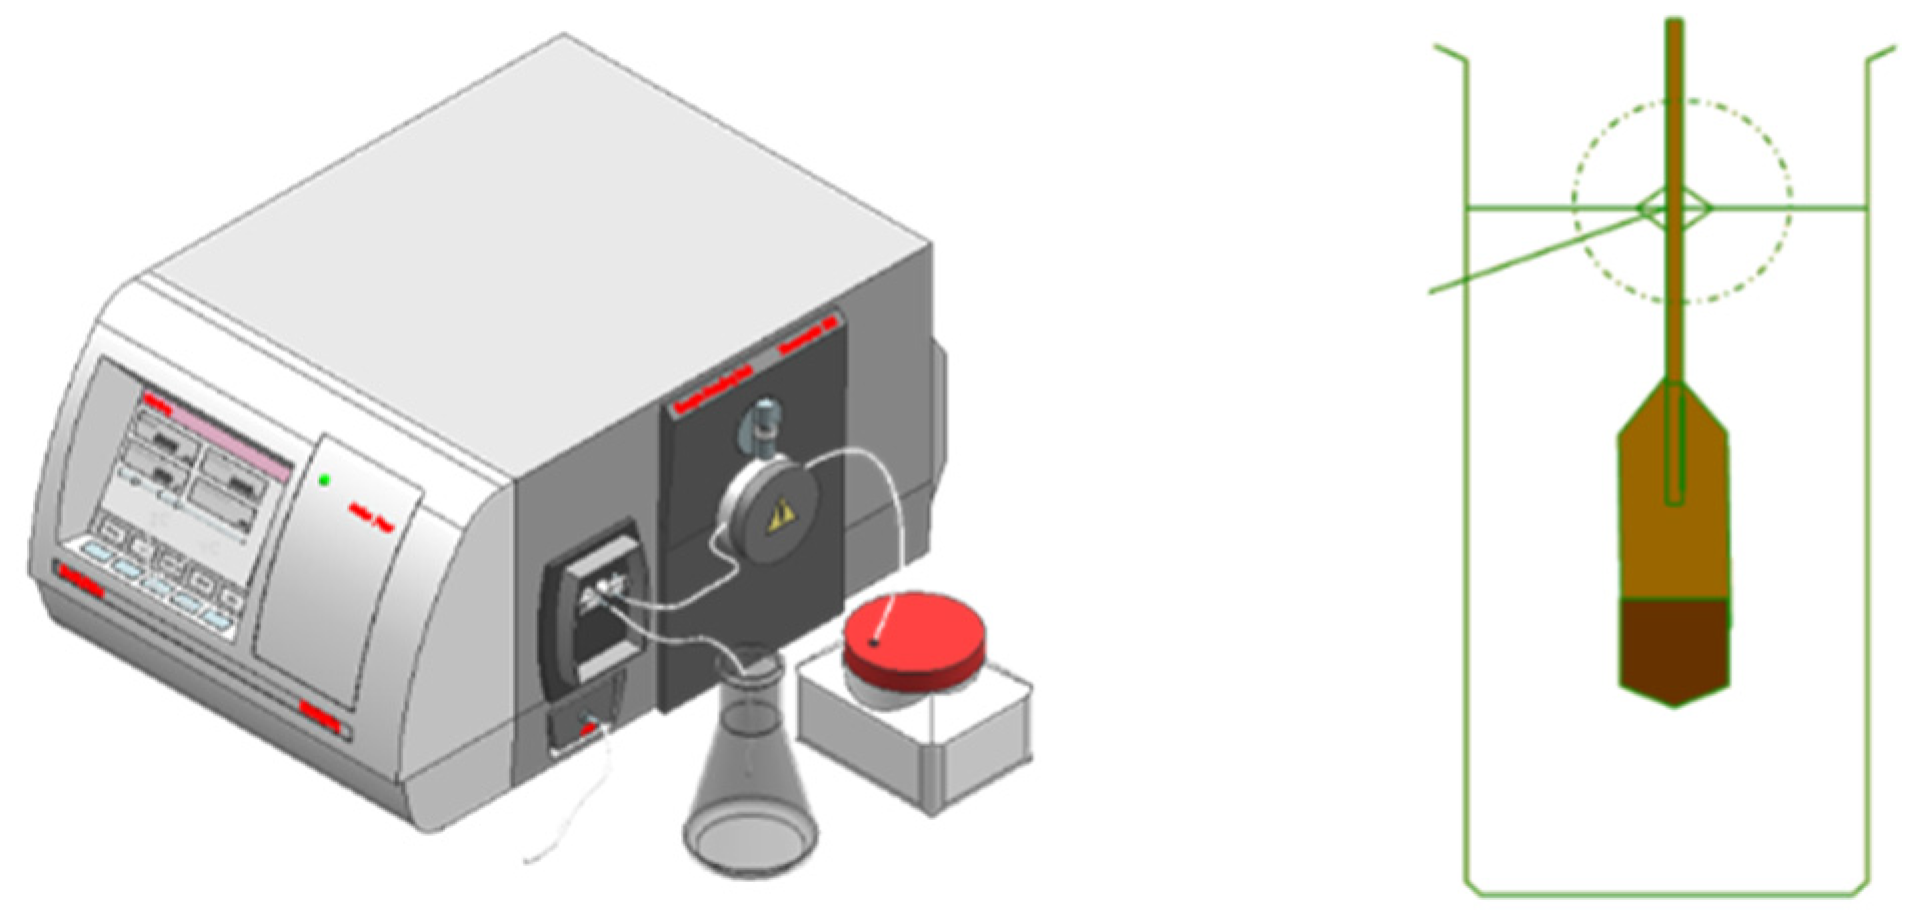
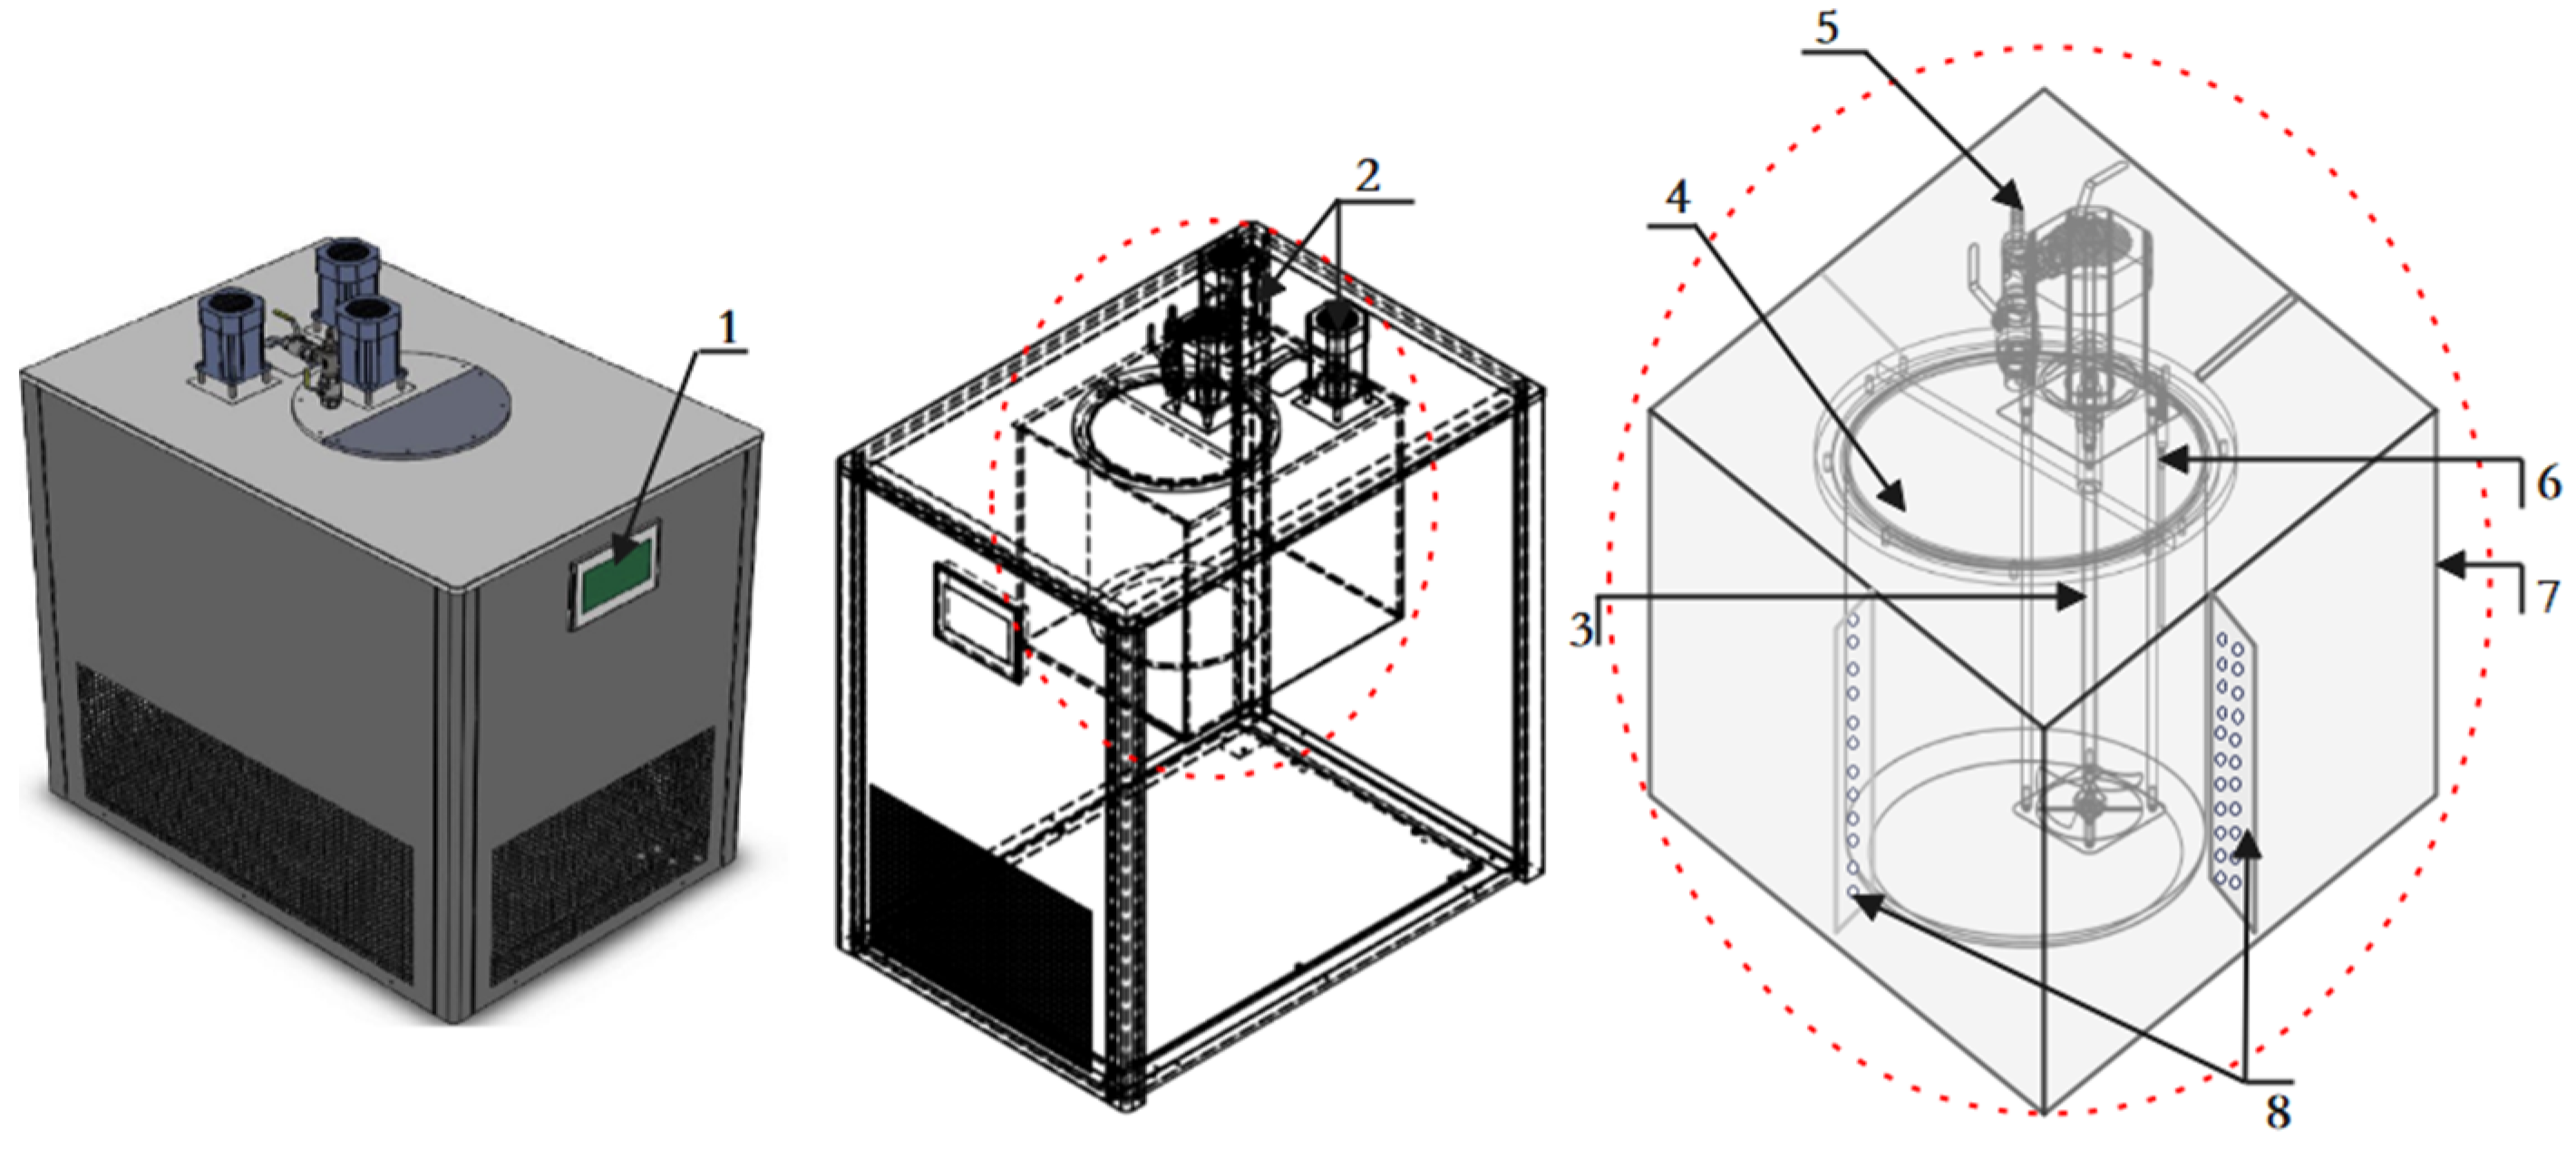
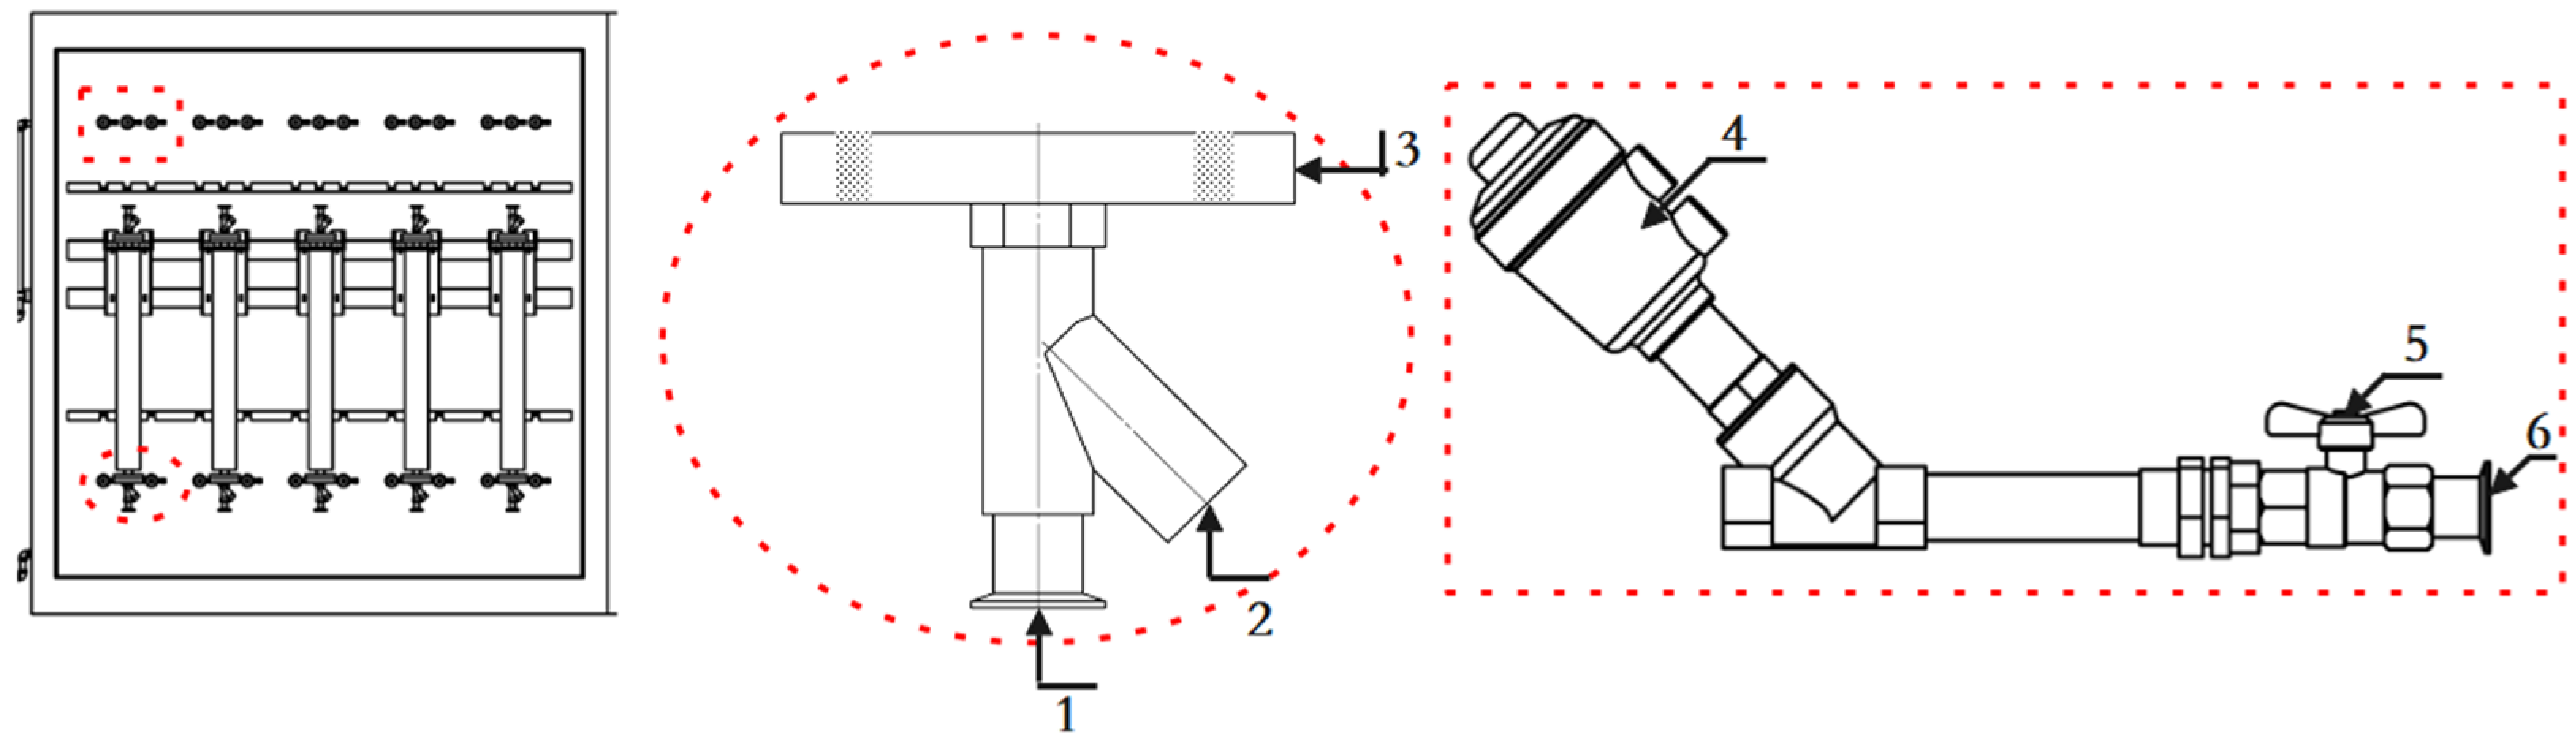
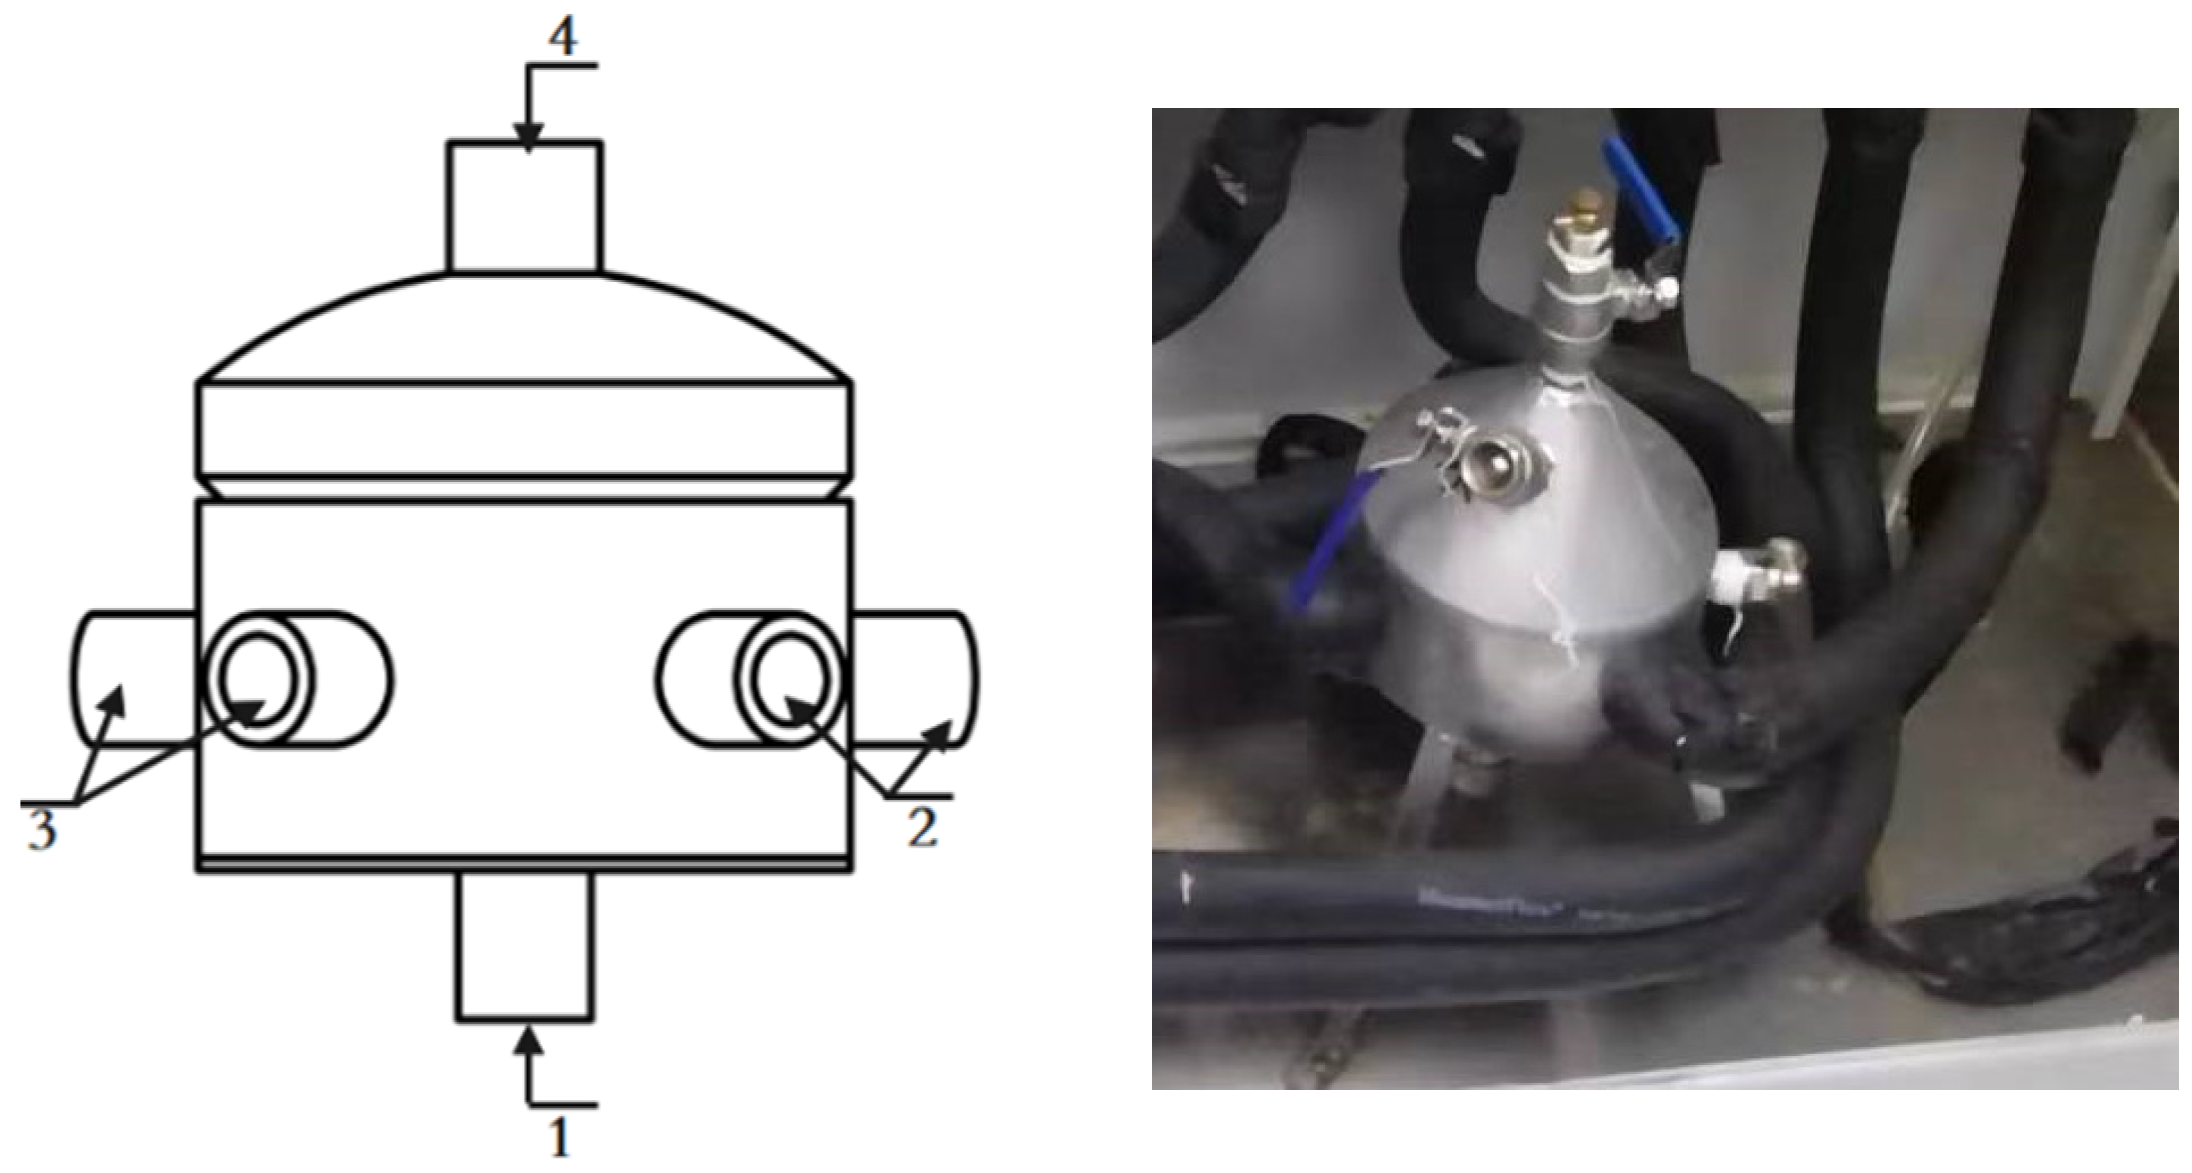
3.2. Device Composition and Structure

The whole equipment adopts the design of a variable temperature field and multiple pipelines, which can carry out five online densitometers and three kinds of liquid experiments at the same time. It consists of a thermostatic stirring control system, walk-in thermostatic field, high-precision benchtop densitometer, pipeline pressurization system, blowing system, and frequency acquisition system. The main standard uses the high-precision Anton Paar 5000, while the first-class densitometer group is used as the period of verification. Figure 4 shows the Anton Paar 5000 and first class densitometer sets
The composition of the whole set of experimental equipment and the object is shown in Figure 5.Temperature is one of the most important parameters affecting density change. The liquid in the circulation system is in a stable state to determine a stable vibration frequency. The constant-temperature tank adopts an internal and external double-layer design. The internal circulation system adopts a heatless magnetic stirring pump, which effectively prevents the pump from affecting the temperature field of the tank due to its own heat generation. The outer tank and inner tank are uniformly distributed around the four pieces of guide plate, which effectively ensures the uniformity of the fluid flow in the outer tank, and realizes the turbulence of the flow field in the inner tank and a high degree of uniformity of the temperature field. The volume ratio of the inner and outer tanks is 0.51, which can meet the requirements of low energy consumption and full pipe flow at the same time, and all the pipes in the whole system are insulated to ensure that the temperature change in the process of liquid circulation is in a small change interval.
The composition of the high-precision thermostat tank and the inner and outer tanks of the thermostat tank is shown in Figure 6. In order to reduce the stress on both ends of the vibration tube’s vibration impact, a density meter and the device to make the flange bolt connection are used. Vibration tube frequency measurement by the liquid temperature changes has a greater impact on the import and export of the experimental densitometer installed U = 0.02 °C, k = 2 thermometer. The thermometer installed in the flange at one end of the experimental densitometer at an angle of 45° can not only accurately measure the temperature, but can also effectively avoid the thermometer flange hole in the liquid residue.
Densitometer inlet flange connector and outlet separator structure, as shown in Figure 7. The system adopts the bottom-up liquid inlet mode, the circulating liquid is divided into five channels after flowing out of the thermostatic tank through the degassing system, corresponding to five different experimental stations, so it can realize the simultaneous experiments of five densitometers with three kinds of liquids. In order to prevent the experimental error caused by mixing liquids during the experiment, after the experiment on different liquids is finished, the corresponding pipe is purged and the frequency of the empty pipe is compared to check whether it was purged well. The structure of the standard liquid dispenser is shown in Figure 8.

3.3. Device Uncertainty Assessment

Online vibrating tube liquid densitometer experimental device uncertainty occurs mainly due to a benchtop densitometer, first-class densitometer group, temperature sensor, frequency collector, and other equipment introducing uncertainty. In this paper, the uncertainty of the theoretical model, assessment, and representation are in accordance with JJF1059-1999, the “Assessment and Representation of Measurement Uncertainty” [11]. The uncertainty of the whole set of instruments when using the table densitometer as a standardizer is estimated in the Table 1.

3.4. Workflow of the Experimental Setup

An online vibrating tube liquid density meter was sent to the laboratory for calibration experiments before the need to check the sensor for internal pollution, since dirty instruments need to be cleaned, by blowing, to keep the sensor wall clean. Use the endoscope to obtain real-time images or video data of the sensor wall, computer software to determine the cleanliness of the inner wall to determine whether it needs to be cleaned or not, as well as the end of the process, such as the need for cleaning, connecting piping, valves to be connected to the density meter connected to the end of the control pump, need to open the pump, select the time to clean, the end of the time, use a compressed air device, the compressed air blowing the internal sensors of the density meter, and the end of the process at the set time. Use the endoscope again to check the cleanliness of the inner wall of the sensor, until it meets the calibration requirements.

4. Online Vibrating Tube Densitometer Measurement Performance Experiment

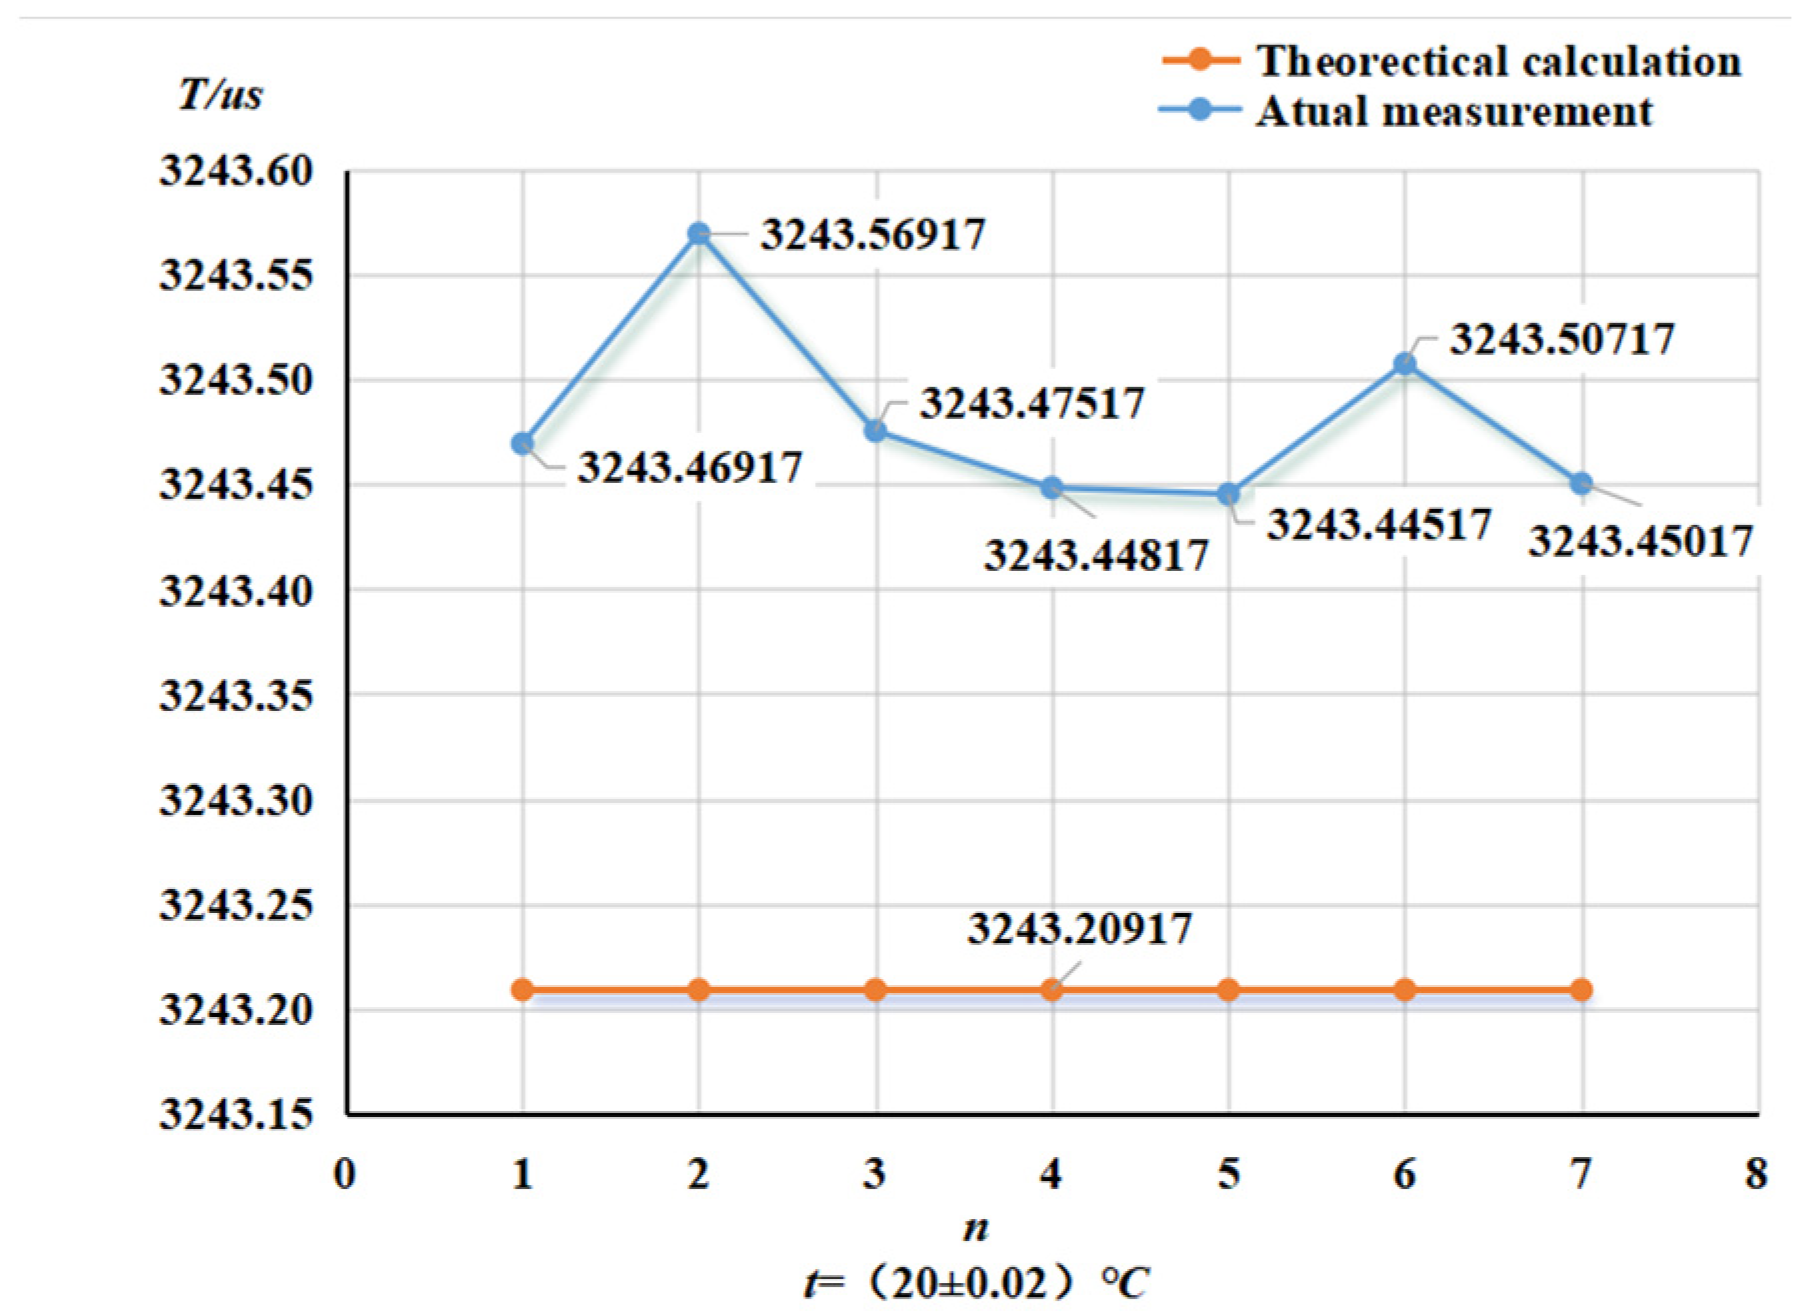
4.1. Temperature Vibration Frequency Test

Straight-tube and curved-tube online vibrating tube liquid densitometers were selected for experimental validation. Solutions of n-tridecane, anhydrous ethanol, lye, pure water, and sodium tungstate were selected for the experimental validation. Standard temperature calibration experiments were performed at a constant temperature of (20 ± 0.02) °C, and temperature tests were performed at (15~45) °C. The temperature of the liquid passing through the vibrating tube densitometer was measured by the inlet and outlet thermometers of the vibrating tube densitometer during the experimental process, the temperature was collected every 500 ms, the average value of the inlet and outlet temperatures was taken as the temperature of the liquid passing through the vibrating tube densitometer, and the standard density value was determined by Anton Paar 5000. In order to reduce the experimental errors caused by mixing the liquid in the experimental process, three thermostatic stirring tanks were used to hold water, mixed liquids and organic solvents, and each liquid after the completion of the experiments on the pipeline blown clean. The end of the blowing was compared to the frequency of 20 °C when the empty tube was used to verify whether it was blown clean.
The straight-tube type and curved-tube type showed two typical densitometer nominal accuracies of ±0.2 kg/m3 and ±0.1 kg/m3, respectively. In practice, it is not possible to directly calculate the theoretical Kx coefficient, which must be experimentally calibrated by a different density and frequency to calculate the above coefficients, and adjusted to the density of the difference between the density and the standard density to calculate the fit error. The system collects the vibration period of the vibrating tube, once every 500 ms, 10 times each time, and takes the average value of 10 times as a measurement value of the measured liquid.
According to the measured frequency values and standard density values calculated using the least squares method, the straight-tube type values were K0 = −1.233610 × 10³; K1 = −4.782074 × 10⁻²; K2 = 1.081764 × 10⁻³; K18 = 8.58998 × 10⁻⁶; and K19 = 5.94276 × 10⁻³.
According to (6) and (7), the experimental straight-tube-type density meter in the standard condition of the liquid density and vibration frequency of the relationship is:
ρx = −1233.610 − 0.04782074 × T + 0.001081764 × T2
ρ t x = ρ x [ 1 + 8.58998 × 10 6 × ( t 20 ) ] + 5.94276 × 10 3 × ( t 20 )
Calculation of straight-tube on-line densitometer at (20 ± 0.02) °C and (15~45) °C fitted with a density with error. Table 2 shows the fitting error and vibration frequency of straight tube densitometer at (20 ± 0.02) °C.
The experimental frequencies and fitting errors of straight tube densitometers at (15~45) °C are shown in Table 3. According to the measured frequency value and the standard density value calculated by the least squares method, the curved-tube-type online vibrating tube liquid densitometer coefficients were K0 = −3.642245 × 10³; K1 = 0; K2 = 3.464284 × 10⁻⁴; K18 = 1.418323 × 10⁻⁴; and K19 = −3.908279 × 10⁻¹. According to (6) and (7), the experimental straight-tube-type densitometer in the standard condition presented different temperatures of liquid density, and the standard condition of vibration presented the different temperature and density of liquid.
According to (6) and (7), the experimental straight-tube-type densitometer in the standard condition is (K19 = −3.908279 × 10⁻¹); different temperatures under the liquid density and vibration frequency relationship are:
ρ x = 3642.245 + 3.464284 ×   10 4 ×   T 2
ρ t x = ρ x [ 1 + 0.0001418323 × ( t 20 ) ] 0.3908279 × ( t 20 )
The vibration frequencies and fitting errors of the bent tube type densitometer at (20 ± 0.02) °C are shown in Table 4, The vibration frequencies and fitting errors at (15–45) °C are shown in Table 5.
Figure 9 and Figure 10 show the variation of the null frequency and the theoretical null value of the straight and curved tube densitometers, respectively, during the experimental process.At (20 ± 0.02) °C, at a (756~1400) kg/m3 range of accuracy experiments, the straight-tube and curved-tube change trends are consistent with the increase in density vibration frequency. At (15~45) °C, the two types of densitometers for the five types of liquids in the temperature experiment section on the change trend are also consistent with the increase in temperature vibration frequency. The decrease in the trend of change and the theoretical derivation is basically consistent, indicating that the instrument has a good degree of differentiation and reasonableness, with the follow-up to carry out the experimental requirements.
From the change in ATC frequency, it can be concluded that the environment maintained at 20 °C near the ATC frequency fluctuation is small; the resonance and the theoretical value of the difference are not significant. The straight-tube maximum ATC frequency fluctuation value was 0.009 us, the average value and the theoretical value was 0.11 us, the curved-tube maximum ATC frequency fluctuation value was 0.12 us, and the average value of the difference between the theoretical value was 0.27 us. The ATC frequency change is small and kept near the resonance frequency, indicating that the tubes are relatively clean and there is no risk of mixing in subsequent experiments.
Figure 11 and Figure 12 show the change rule of fitting error in the experimental process of curved tube type and straight tube type densitometer, respectively. The Kx coefficients were derived from different liquids and vibration frequencies using the principle of least squares, and the experimental fit errors of the two densitometers were obtained by comparing the fitted densities derived from the fitting equations with the standard densities. From the fitting error distribution, it can be seen that most of the fitting error distributions fall within the nominal error. The straight-tube-type maximum fitting error absolute value of 0.22 kg/m3 and curved-tube-type maximum absolute error absolute value of 0.12 kg/m3 are close to the nominal error.

4.2. Pressure Frequency Experiment

Six pressure test points were evenly distributed at (0~25) bar, and two liquids were selected for the static pressure test to determine the vibration frequency of the tested densitometer at each pressure point. The pressure generation system uses printer DPI612 Flex series as the pressure generator, and water and tridecane were used as the pressure test liquids for the pressure test in this study. The pressure generator is shown in Figure 13, the pressurization experiment is shown in Figure 14.
The pressure fitting coefficients for the straight and Curved tube are shown in Table 6.
Figure 15 and Figure 16 show the trend of pressure variation with vibration frequency for curved and straight densitometers, respectively. Form the vibration frequency and pressure, it can be seen that the vibration frequency increases with the pressure. A linear degree of adaptation by the adaptation coefficient can be seen from the change in pressure and frequency, which is not a linear relationship. Vibration in the family-type force and pressure under the action of the vibration tube’s impact are more significant, resulting in changes in the intrinsic frequency of the vibration tube. In addition, the increase in pressure in the pipe will lead to vibration pipe deformation at both ends of the bellows, equivalent to the elasticity coefficient, K, and the theoretical value of the deviation, resulting in a low resonance frequency, but the pressure and elasticity coefficient, K, changes still need to be studied further. The trend of change in the bending-type density meter by pressure is more obvious.

5. Conclusions

For an online vibrating tube densitometer, we carried out theoretical research and the derivation of fitting equations; built a number of experimental devices; and selected two kinds of densitometers, the straight-tube-type and curved-tube-type at (750~1400) kg/m3, (15~45) °C, and (0~25) bar, to assess densitometer metrological performance. The main conclusions are as follows:
  • A set of online vibrating tube liquid densitometer experimental devices were built based on a quantity and value transfer system. The whole device consists of a desktop densitometer, multi-temperature thermostatic stirring system, walk-in thermostat, blowing system, and frequency acquisition system. The experimental research on five densitometers can be carried out at the same time under different temperatures and densities, and the device evaluates an accuracy of U = 0.08 kg/m3, k = 2;
  • This device solves the problem of the traceability of online vibrating tube liquid densitometers, and can carry out the assessments of quantity and value transfer at (750~1400) kg/m3, (15~45) °C, and (0~25) bar and the accuracy grade ≥±0.1 kg/m3 of online vibrating tube liquid densitometer, and it is proved that this device has the ability to assess quantity and value transfer, as in the previous experiments;
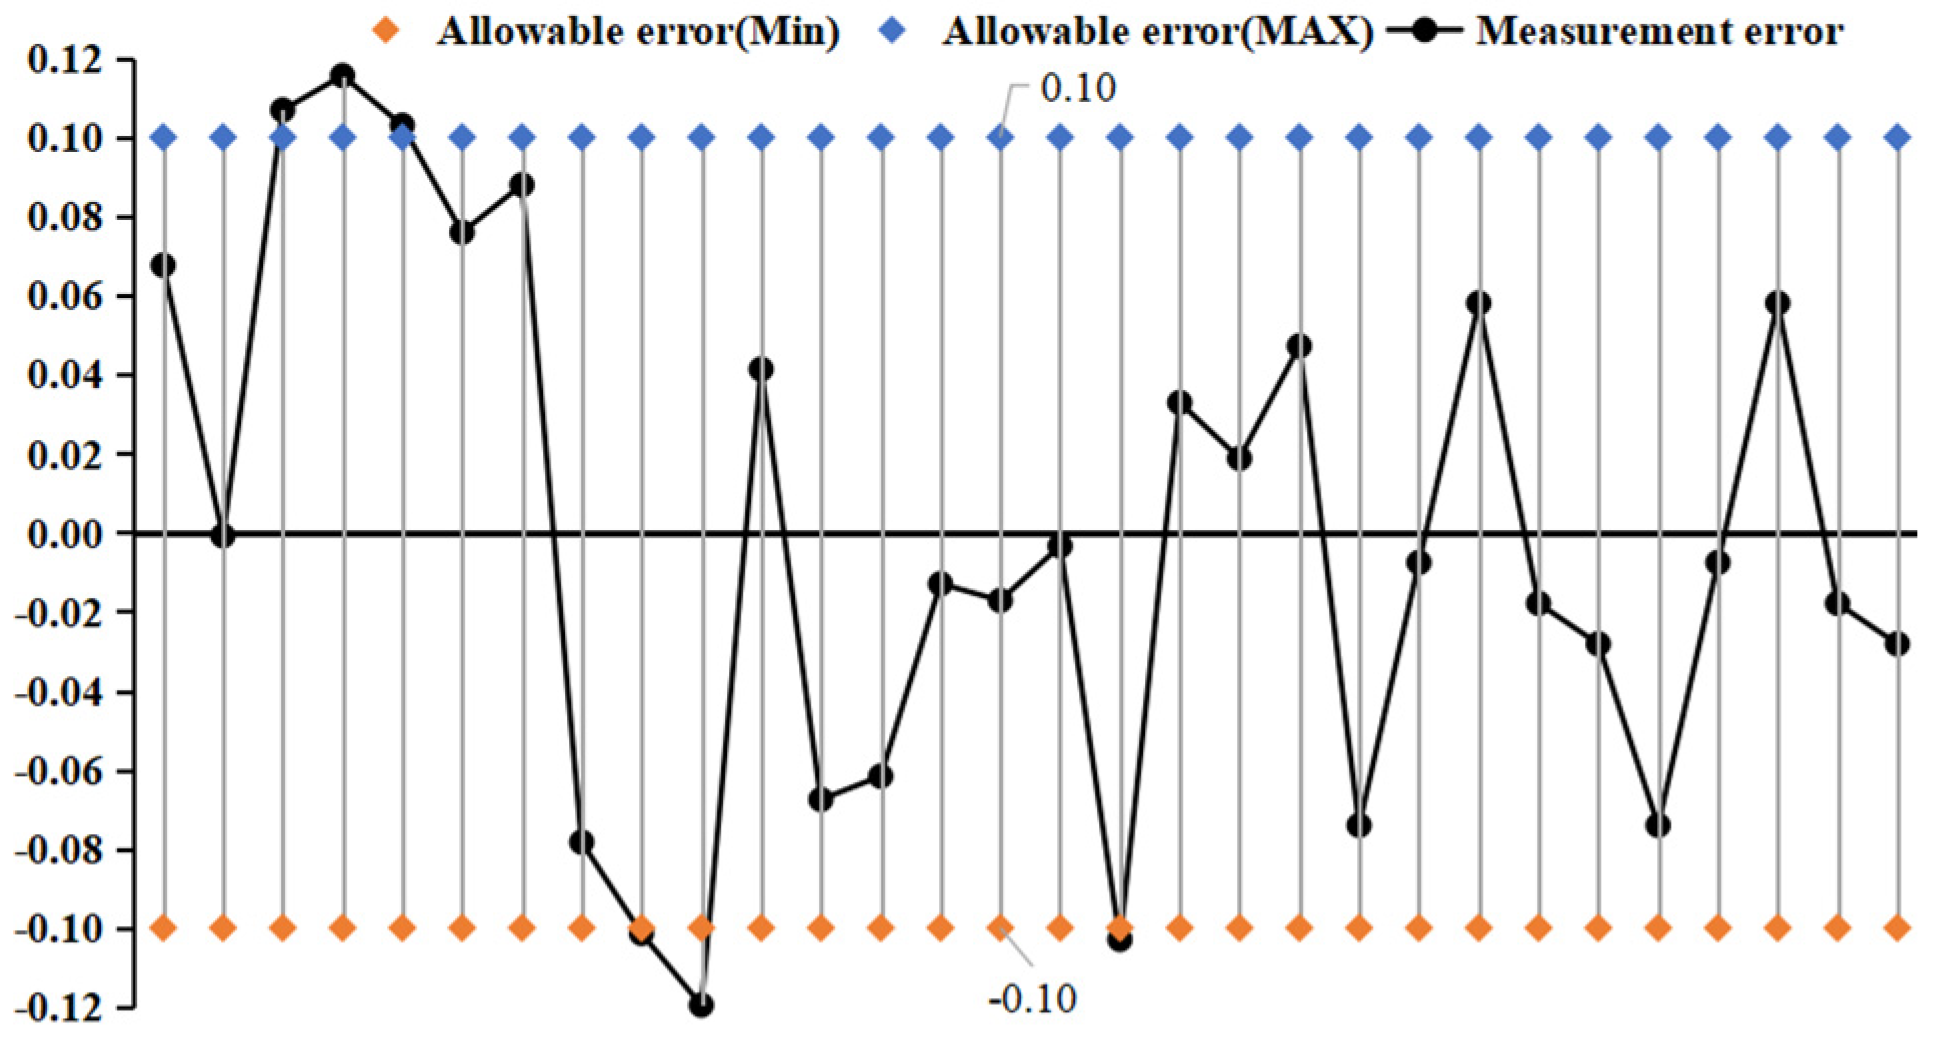
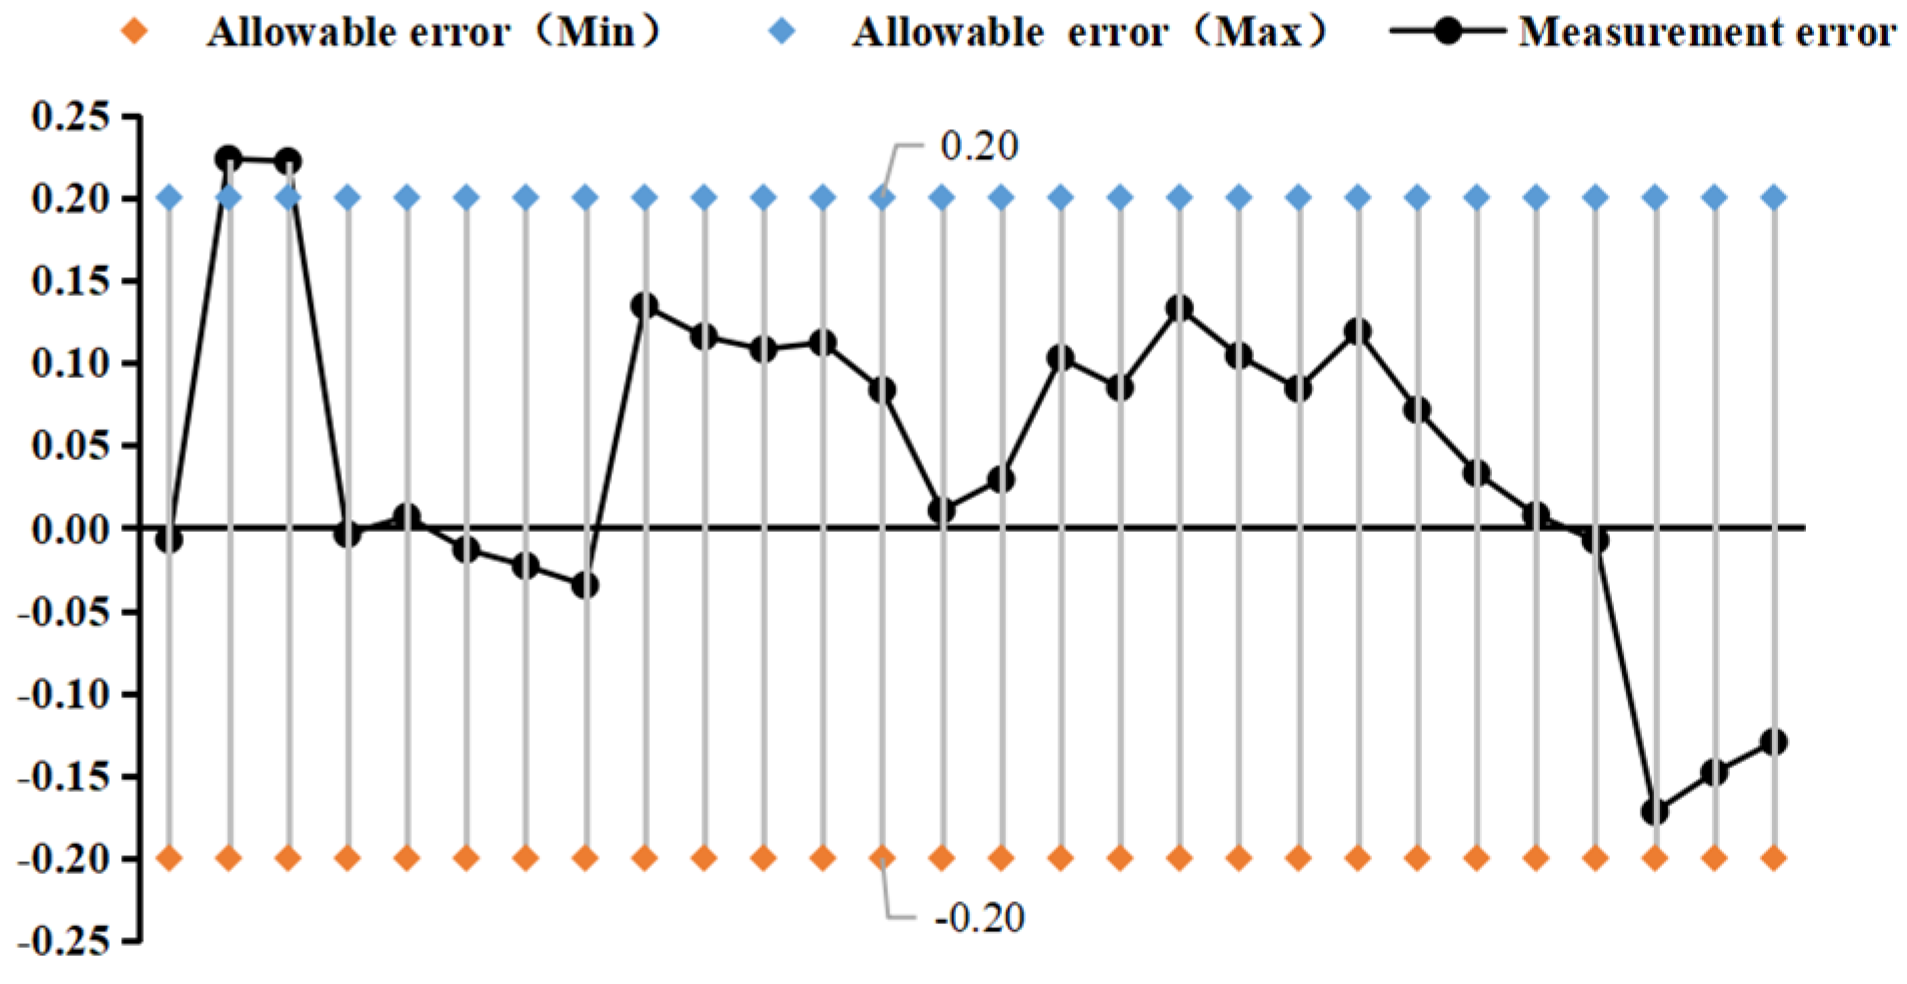
  • We selected straight-tube-type and elbow-type densitometers, at (15~45) °C, and selected five kinds of liquids to carry out online vibrating tube densitometer metrological experiments. We concluded that different density vibration tube frequencies increased with density and decreased with the increase in temperature. Using the frequency and density values obtained from the experiments, we calculated the K coefficient of the theoretical equations and determined the fitted density difference. The fitting errors of the two densitometers are basically within the nominal error, which indicates that the device has a good degree of differentiation and reasonableness. The fitting errors of the two densitometers at (15~45) °C are not a linear result in a uniform direction (positive or negative), and the factors contributing to this result still need to be determined by further research;
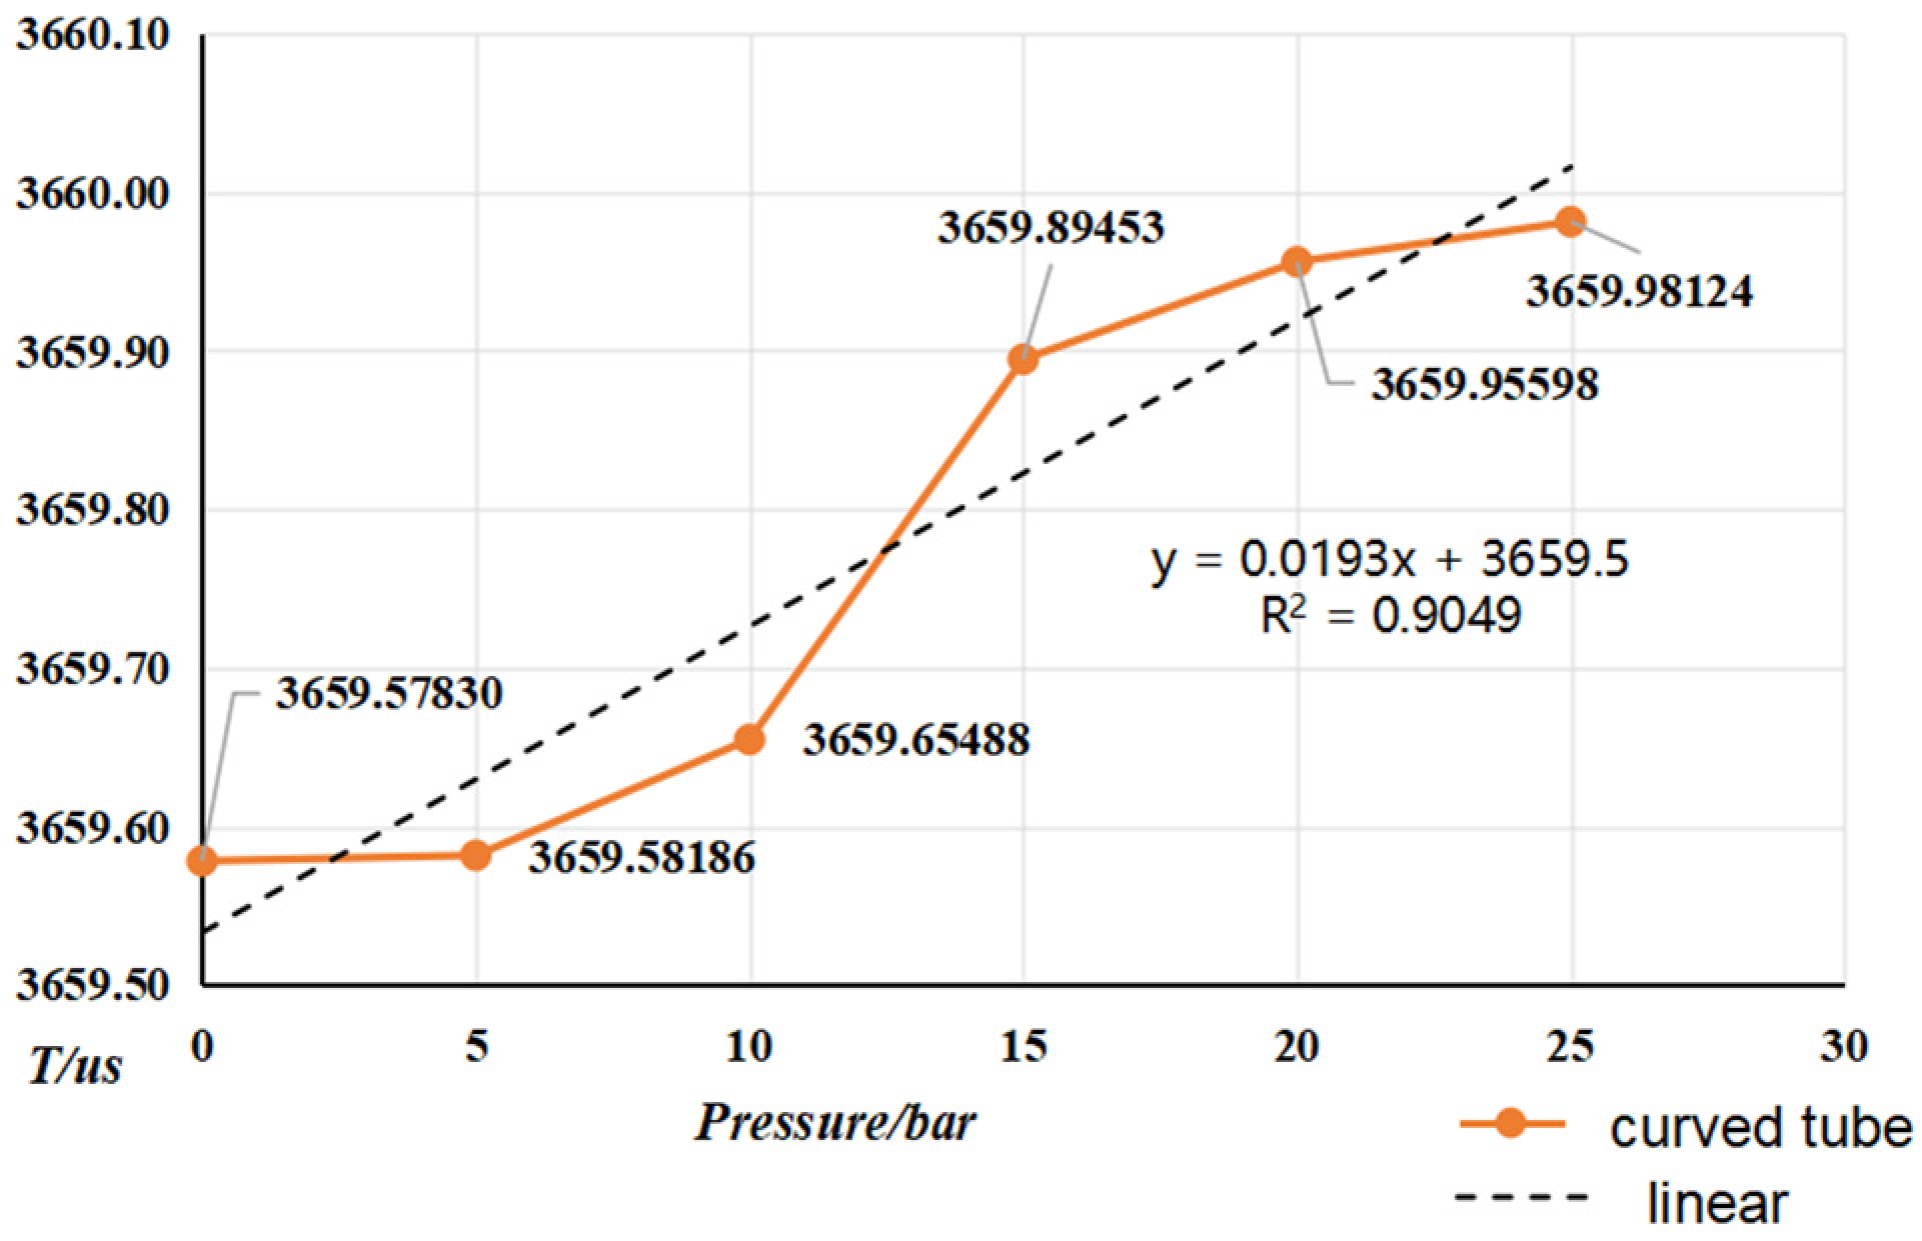
  • From the (0~25) bar carried out the online vibrating tube densitometer pressure–frequency experiments, it is concluded that the vibration frequency increases with the increase in pressure in the vibrating tube. The pressure in the pipe and the interaction of the coefficients of the vibrating tube at both ends of the equivalent elasticity coefficient of the corrugated pipe, K, deviate from the pressure and the elasticity coefficient of the K change rule. This still needs to be studied further. The trend of change in the curved-type density meter by the pressure is more obvious;
  • The experimental device will be used to carry out more experiments and tests in the later stage. It will assess the pressure and viscosity concerning the vibration frequency, combined with the fluid Reynolds number, inlet effect, and other factors to explore the influence of the velocity profile on fitting coefficients. At the same time, a set of standard density values of liquids under a wide range of temperatures and pressures will be assessed with the test device, because the standard density of the current test values at different pressures is only a theoretical calculation of the value;
  • Through the experiment, the rationality and scientific value of the device were verified, and the change rule of vibration frequency with the temperature and pressure of online vibrating tube densitometers was studied, which has certain significance for the use of an online vibrating tube densitometer and its subsequent applications.

Author Contributions

Conceptualization, Y.S. and D.X.; methodology, Y.S.; validation, Y.S. and D.X.; formal analysis, D.X.; investigation, D.X.; resources, D.X., W.C. and J.M.; data curation, D.X.; writing—original draft preparation, D.X.; writing—review and editing. D.X. and W.P.; funding acquisition, W.C. and J.M. All authors have read and agreed to the published version of the manuscript.

Funding

This research was supported by Natural Science Foundation of Xinjiang Uygur Autonomous Region [grant number 2022D01B51].

Data Availability Statement

All data generated or analyzed during this study are included in this manuscript.

Acknowledgments

The authors would like to sincerely thank the Flow Center of Xinjiang Metrology Institute.

Conflicts of Interest

The authors declare no conflict of interest.

References

  1. Lagourette, B.; Boned, C.; Saint-Guirons, H.; Xans, P.; Zhou, H. Densimeter Calibration Method versus Temperature and Pressure. Meas. Sci. Technol. 1992, 3, 699–703. [Google Scholar] [CrossRef]
  2. Wang, D.l.; Yang, T.T.; Mao, S.; Yuan, J. Analysis of liquid density measurement methods. Meas. Test. Technol. 2019, 46, 55–60. [Google Scholar] [CrossRef]
  3. Xu, C. Research on Online Monitoring System of Pipeline liquid Density; Harbin Institute of Technology: Harbin, China, 2021. [Google Scholar] [CrossRef]
  4. Puttmer, A.; Hauptmann, P.; Henning, B. Ultrasonic Density Sensor for Liquids. IEEE Trans. Ultrason. Ferroelectr. Freq. Control 2000, 47, 85–92. [Google Scholar] [CrossRef] [PubMed]
  5. Lv, F.; Zhang, X.Z. Experimental study on the performance of single straight tube vibrating fluid densitometer. Nucl. Power Eng. 2012, 33, 19–22. Available online: https://kns.cnki.net/kcms2/article/abstractv (accessed on 10 December 2023).
  6. Higuti, R.T.; Buiochi, F.; Adamowski, J.C.; de Espinosa, F.M. Ultrasonic Density Measurement Cell Design and Simulation of Non-Ideal Effects. Ultrasonics 2006, 44, 302–309. [Google Scholar] [CrossRef] [PubMed]
  7. Zheng, D.Z.; Ji, Y.S.; Shang, S.F. Design and Theoretical Analysis of a Resonant Sensor for Liquid Density Measurement. Sensors 2012, 12, 7905–7916. [Google Scholar] [CrossRef] [PubMed]
  8. Yin, J.; Wu, J.; Meng, X.; Abdulagatov, I. Compressed Liquid Density Measurements of Dimethyl Ether with a Vibrating Tube Densimeter. J. Chem. Thermodyn. 2011, 43, 1371–1374. [Google Scholar] [CrossRef]
  9. Majer, V.; Hui, L.; Crovetto, R.; Wood, R.H. Volumetric Properties of Aqueous 1-1 Electrolyte Solutions near and above the Critical Temperature of Water I. Densities and Apparent Molar Volumes of NaCl (Aq) from 0.0025 Mol·kg−1 to 3.1 Mol·kg−1, 604.4 K to 725.5 K, and 18.5 MPa to 38.0 MPa. J. Chem. Thermodyn. 1991, 23, 213–229. [Google Scholar] [CrossRef]
  10. Aida, T.; Yamazaki, A.; Akutsu, M.; Ono, T.; Kanno, A.; Hoshina, T.A.; Ota, M.; Watanabe, M.; Sato, Y.; Smith, R.L.; et al. Laser-Doppler Vibrating Tube Densimeter for Measurements at High Temperatures and Pressures. Rev. Sci. Instrum. 2007, 78, 115111. [Google Scholar] [CrossRef] [PubMed]
  11. JJF 1059-1999; Measurement Uncertainty Assessment and Representation. China National Metrological Specifications, Issued by the China Quality and Technical Supervision Bureau: Lanzhou, China, 1999.
Figure 1. Working principle of online vibrating tube liquid densitometer.
Applsci 14 09905 g001
Figure 2. Structure of a single straight-tube-type vibrating tube densitometer. 1. Flange; 2. Bellows; 3. Vibrating tube; 4. Fluid flow; 5. Protective shell; 6. Temperature sensor; 7. Pressure sensor; 8. Shaker.
Applsci 14 09905 g002
Figure 3. Traceability chain for online vibrating tube density measurements.
Applsci 14 09905 g003
Figure 4. Anton Paar 5000 and first-class densitometer set.
Applsci 14 09905 g004
Figure 5. Online vibrating tube liquid densitometer experimental device: general view. 1., 2., and 3. Thermostat tank; 4. System control cabinet; 5. Experimental densitometer; 6. Connecting densitometer flange; 7. Thermometer interface; 8. Walk-in thermostat boxes; 9. Piping connector; 10. Thermostat box control system.
Applsci 14 09905 g005
Figure 6. Inner and outer tanks of the thermostat. 1. LCD control board; 2. Outer tank circulation pump; 3. Inner tank agitator; 4. Inner tank body; 5. Liquid circulation inlet; 6. Temperature sensor; 7. Outer tank body; 8. Deflector plate.
Applsci 14 09905 g006
Figure 7. Density meter connecting the flange and pipeline connection valve. 1. Line connection port; 2. Thermometer interface; 3. Densitometer connection flange; 4. Pneumatic angle valve; 5. Manual valve; 6. Line connection port.
Applsci 14 09905 g007
Figure 8. Degassing liquid separator. 1. Liquid inlet; 2., 3. Liquid outlet; 4. One-way exhaust port.
Applsci 14 09905 g008
Figure 9. Variation in air tube frequency for straight-tube densitometer.
Applsci 14 09905 g009
Figure 10. Variation in air tube frequency for curved-tube densitometer.
Applsci 14 09905 g010
Figure 11. Distribution of fit errors for curved−tube densitometers.
Applsci 14 09905 g011
Figure 12. Distribution of fit errors for straight−tube densitometer.
Applsci 14 09905 g012
Figure 13. Pressure generating system.
Applsci 14 09905 g013
Figure 14. Pressure frequency density experiment.
Applsci 14 09905 g014
Figure 15. Variation in vibration frequency vs. pressure for curved-tube densitometer.
Applsci 14 09905 g015
Figure 16. Vibration frequency vs. pressure for straight-tube densitometer.
Applsci 14 09905 g016
Table 1. Device uncertainty assessment table.
NO.SourceTypeu(xi)
(kg/m³)
Combined Expanded UncertaintyCombined Expanded Uncertainty
1Desktop density meterB0.02250.039 kg/m3U = 0.08 kg/m3
k = 2
2Densitometer measurementA5.592 × 10−5
3Frequency meter measurementB0.00092
4Temperature measurementB0.007
5Fit processA0.031
Table 2. Straight-tube accuracy experiments on density, frequency, and fit error at (20 ± 0.02) °C.
Liquid NameMeasuring Temperature (°C)Vibration Period (us)Standard Density (kg/m3)Fit Density (kg/m3)Fit Error (kg/m3)
N-Tridecane20.001378.541607756.226756.2260.00
Anhydrous ethanol20.001401.152815823.136823.1360.00
Aqueous alcohol 119.991415.154277865.123865.1230.00
Industrial white oil20.001403.815470831.088831.0880.00
Aqueous alcohol 219.991423.031064888.930888.9300.00
Pure water20.001458.638571998.226998.2260.00
Tungstate solution20.011584.0487201405.0121405.0130.01
Table 3. Straight-tube temperature experiments on density, frequency, and fit error at (15–45) °C.
Liquid NameMeasuring Temperature (°C)Vibration Period (us)Standard Density (kg/m3)Fit Density (kg/m3)Fit Error (kg/m3)
Tridecane15.50 1379.68479759.442759.526−0.08
20.001378.53900756.226756.2180.01
29.411376.25237749.509749.630−0.12
40.231374.62239745.123744.9910.13
45.211372.95320740.369740.1700.20
Anhydrous ethanol l14.251404.62236833.236833.425−0.19
20.001403.81547831.088831.0880.00
30.121402.83650828.369828.2950.07
40.221402.19565826.326826.512−0.19
45.241400.63691822.136821.9250.21
Anhydrous ethanol 214.951424.40283892.909893.021−0.11
20.001423.03450888.930888.940−0.01
29.101420.48395881.237881.340−0.10
36.421419.56231878.639878.651−0.01
44.221418.32352875.236875.0110.22
Water14.361459.03692999.191999.382−0.19
15.561458.90888999.009999.0020.01
20.001458.63911998.221998.228−0.01
29.261457.84188995.898995.8850.01
43.891456.12524990.651990.767−0.12
Tungstate solution14.651585.585691410.2361410.1120.12
20.001584.048721405.0121405.0120.00
29.25 1582.869221401.2361401.1940.04
40.121582.012311398.3691398.496−0.13
45.371580.979001395.2371395.1040.13
Table 4. Curved-tube densitometer accuracy experiments on density, frequency, and fit error at (20 ± 0.02) °C.
Liquid NameMeasuring Temperature (°C)Vibration Period (us)Standard Density (kg/m3)Fit Density (kg/m3)Fit Error (kg/m3)
Tridecane20.003659.93511998.226998.208−0.02
Anhydrous ethanol20.003607.10110865.123865.1980.08
Mixture 120.003590.20928823.136823.080−0.06
Industrial white oil20.003563.23146756.226756.225−0.00
Mixing solution 219.993593.46230831.088831.1760.09
Pure water20.003616.59763888.930888.9630.03
Tungstate solution20.013816.986241405.0121405.004−0.01
Table 5. Curved-tube densitometer temperature experiments on density, frequency, and fit error at (15–45) °C.
Liquid NameMeasuring Temperature (°C)Vibration Period (us)Standard Density (kg/m3)Fit Density (kg/m3)Fit Error (kg/m3)
Tridecane15.553564.05124759.442759.5100.07
20.003563.23146756.226756.2250.00
29.313561.62569749.509749.6160.11
40.193561.10569745.123745.2390.12
45.113559.74569740.369740.4720.10
Anhydrous ethanol l14.333593.69892833.236833.3120.08
20.003593.46230831.088831.1760.09
30.003593.40000828.369828.291−0.08
40.223593.69000826.326826.225−0.10
45.253592.55426822.136822.016−0.12
Anhydrous ethanol 214.543617.61236892.909892.9500.04
20.003616.55763888.93888.862−0.07
29.033614.44563881.237881.175−0.06
36.443614.21369878.639878.626−0.01
44.223613.68000875.236875.219−0.02
Water14.213659.75236999.191999.1880.00
15.113659.73000999.009998.906−0.10
20.003659.95351998.221998.2540.03
29.153659.93123995.898995.9170.02
43.543659.29000990.651990.6980.05
Tungstate solution14.653818.550001410.2361410.162−0.07
20.003816.986241405.0121405.004−0.01
29.333816.260001401.2361401.2940.06
40.023815.923601398.3691398.496−0.13
45.443815.131231395.2371395.1040.13
Table 6. Pressure fit coefficients.
Fit Factork20ak20bk21ak21b
Straight tube−1.4209 × 10⁻⁴−2.74958× 10−71.88777 × 10−12.47360 × 10⁻⁴
Curved tube1.49944 × 10−20.000.000.00
Disclaimer/Publisher’s Note: The statements, opinions and data contained in all publications are solely those of the individual author(s) and contributor(s) and not of MDPI and/or the editor(s). MDPI and/or the editor(s) disclaim responsibility for any injury to people or property resulting from any ideas, methods, instructions or products referred to in the content.

