Article

Impedance Spectroscopy of Lanthanum-Doped (Pb0.75Ba0.25)(Zr0.70Ti0.30)O3 Ceramics

by
Małgorzata Adamczyk-Habrajska
1,
Jolanta Makowska
1,
Tomasz Pikula
2,
Beata Wodecka-Duś
1,
Joanna A. Bartkowska
1,*,
Rafał Panek
3 and
Katarzyna Osińska
1
1
Institute of Materials Engineering, Faculty of Science and Technology, University of Silesia, 75 Pułku Piechoty 1A, 41-500 Chorzow, Poland
2
Institute of Electronics and Information Technology, University of Technology, 38A Nadbystrzycka Str., 20-618 Lublin, Poland
3
Department of Construction Materials Engineering and Geoengineering, Lublin University of Technology, 40 Nadbystrzycka Str., 20-618 Lublin, Poland
*
Author to whom correspondence should be addressed.
Appl. Sci. 2024, 14(21), 9854; https://doi.org/10.3390/app14219854
Submission received: 24 September 2024 / Revised: 10 October 2024 / Accepted: 23 October 2024 / Published: 28 October 2024

Abstract

:
This study examines the effects of La3+ doping on (Pb0.75Ba0.25)(Zr0.70Ti0.30)O3(PBZT) ceramics, which were synthesized using the conventional solid-state reaction method. X-ray diffraction analysis confirmed that the PBZT structure, including PBZT doped with La3+ at concentrations x = 1 at.% and x = 2 at.%, exhibited a rhombohedral (R3c) space group, while higher doping levels of x = 3 at.% and x = 4 at.% led to a dominant cubic (Pm-3m) phase with approximately 30% of a remnant rhombohedral component. Scanning electron microscopy (SEM, JEOL JSM-7100F TTL LV, Jeol Ltd., Tokyo, Japan) and energy dispersive X-ray spectroscopy (EDS) were utilized to investigate the structure and morphology of these ceramics. The findings indicated that the chemical composition of the ceramic samples closely corresponded to the initial stoichiometry of the ceramic powder. An increase in the amount of lanthanum results in a decrease in the average grain size of the ceramics. The electrical properties were further evaluated using complex impedance spectroscopy (IS) over a range of temperatures and frequencies, as well as temperature dependence of DC conductivity. The similarity in the changes in activation energy for DC conductivity and grain boundary conductivity, caused by lanthanum ion modification, allows for the conclusion that grain boundaries are the primary microstructural element responsible for conductivity in these materials.

1. Introduction

Among intelligent materials, a special place is occupied by ferroelectric ceramics with a perovskite-type structure, which play a key role in modern technologies due to their unique electrical, dielectric, and piezoelectric properties [1,2,3]. Among them, materials based on lead zirconate titanate (PZT) enjoy particular interest. This is attributed to their elevated Curie temperature (Tc), high dielectric constant (ɛr), and significant electromechanical coupling coefficient (k) [4]. These characteristics make these materials suitable for a broad spectrum of applications, including sensors, actuators, transducers, and ferroelectric memories [5,6,7,8,9,10]. However, the need to limit the content of lead in materials, resulting from environmental regulations, has led researchers to search for new materials and doping PZT, which would allow for the modification of its properties and their improvement [11,12,13,14,15,16,17]. In addition, it is well established that modifying PZT ceramics by substituting a small amount of isovalent or heterovalent elements for Pb or Zr/Ti sublattices significantly enhances their properties [18,19,20,21,22,23]. Numerous studies have suggested that these dopants affect the temperatures of structural phase transitions between phases with different electric orders (FE, AFE, and PE) and influence various parameters, including dielectric, pyroelectric, piezoelectric, and electro-optic properties [24,25,26].
The Ba-modified Pb(Zr1−xTix)O3 (PBZT) ceramic composition has been of great interest for a long time due to its exceptional ferroelectric properties, such as its high electrical permittivity, which shows minimal dependence on temperature [27,28,29]. The creation of the (Pb,Ba)(Zr,Ti)O3 (PBZT) system was initiated by Smolenskii et al. [30]. Structural analysis of these ceramic materials was later conducted by Ikeda [31], who established the phase diagram for this system. Li and Haertling [32] continued these investigations, discovering that ceramics with compositions near the phase boundaries between the ferroelectric (FE) rhombohedral, tetragonal, and paraelectric (PE) cubic phases exhibit characteristics typical of ferroelectric relaxors. In this context, the development of La-doped PBZT ceramics represents a promising direction in the quest for high-performance, environmentally friendly materials. By carefully selecting the doping concentration and optimizing the synthesis process, researchers aim to achieve a balance between performance and sustainability, paving the way for next-generation ferroelectric materials with minimized environmental impact.
The aim of this study was to understand the effect of La3+ doping on the impedance properties of (Pb0.75Ba0.25)(Zr0.70Ti0.30)O3 ceramics. The substitution of Ba2+ or Pb2+ ions with La3+ ions leads to the creation of oxygen vacancies, which can significantly influence the concentration and distribution of space charge in the material. Comprehensive analysis of the material’s impedance response, examined across a wide range of temperatures and frequencies and correlated with the results of the DC conductivity measurements and thermally stimulated depolarization currents described in a previous article, provided the answer to the question of the actual role of lanthanum doping and the associated oxygen vacancies in shaping the material’s electrical properties. Understanding this issue is essential for tuning the material’s electrical response to meet the demands of various applications, such as capacitors, sensors, and actuators. Furthermore, the insights gained from this research could guide the design of new, high-performance ceramic materials with tailored properties for advanced electronics.

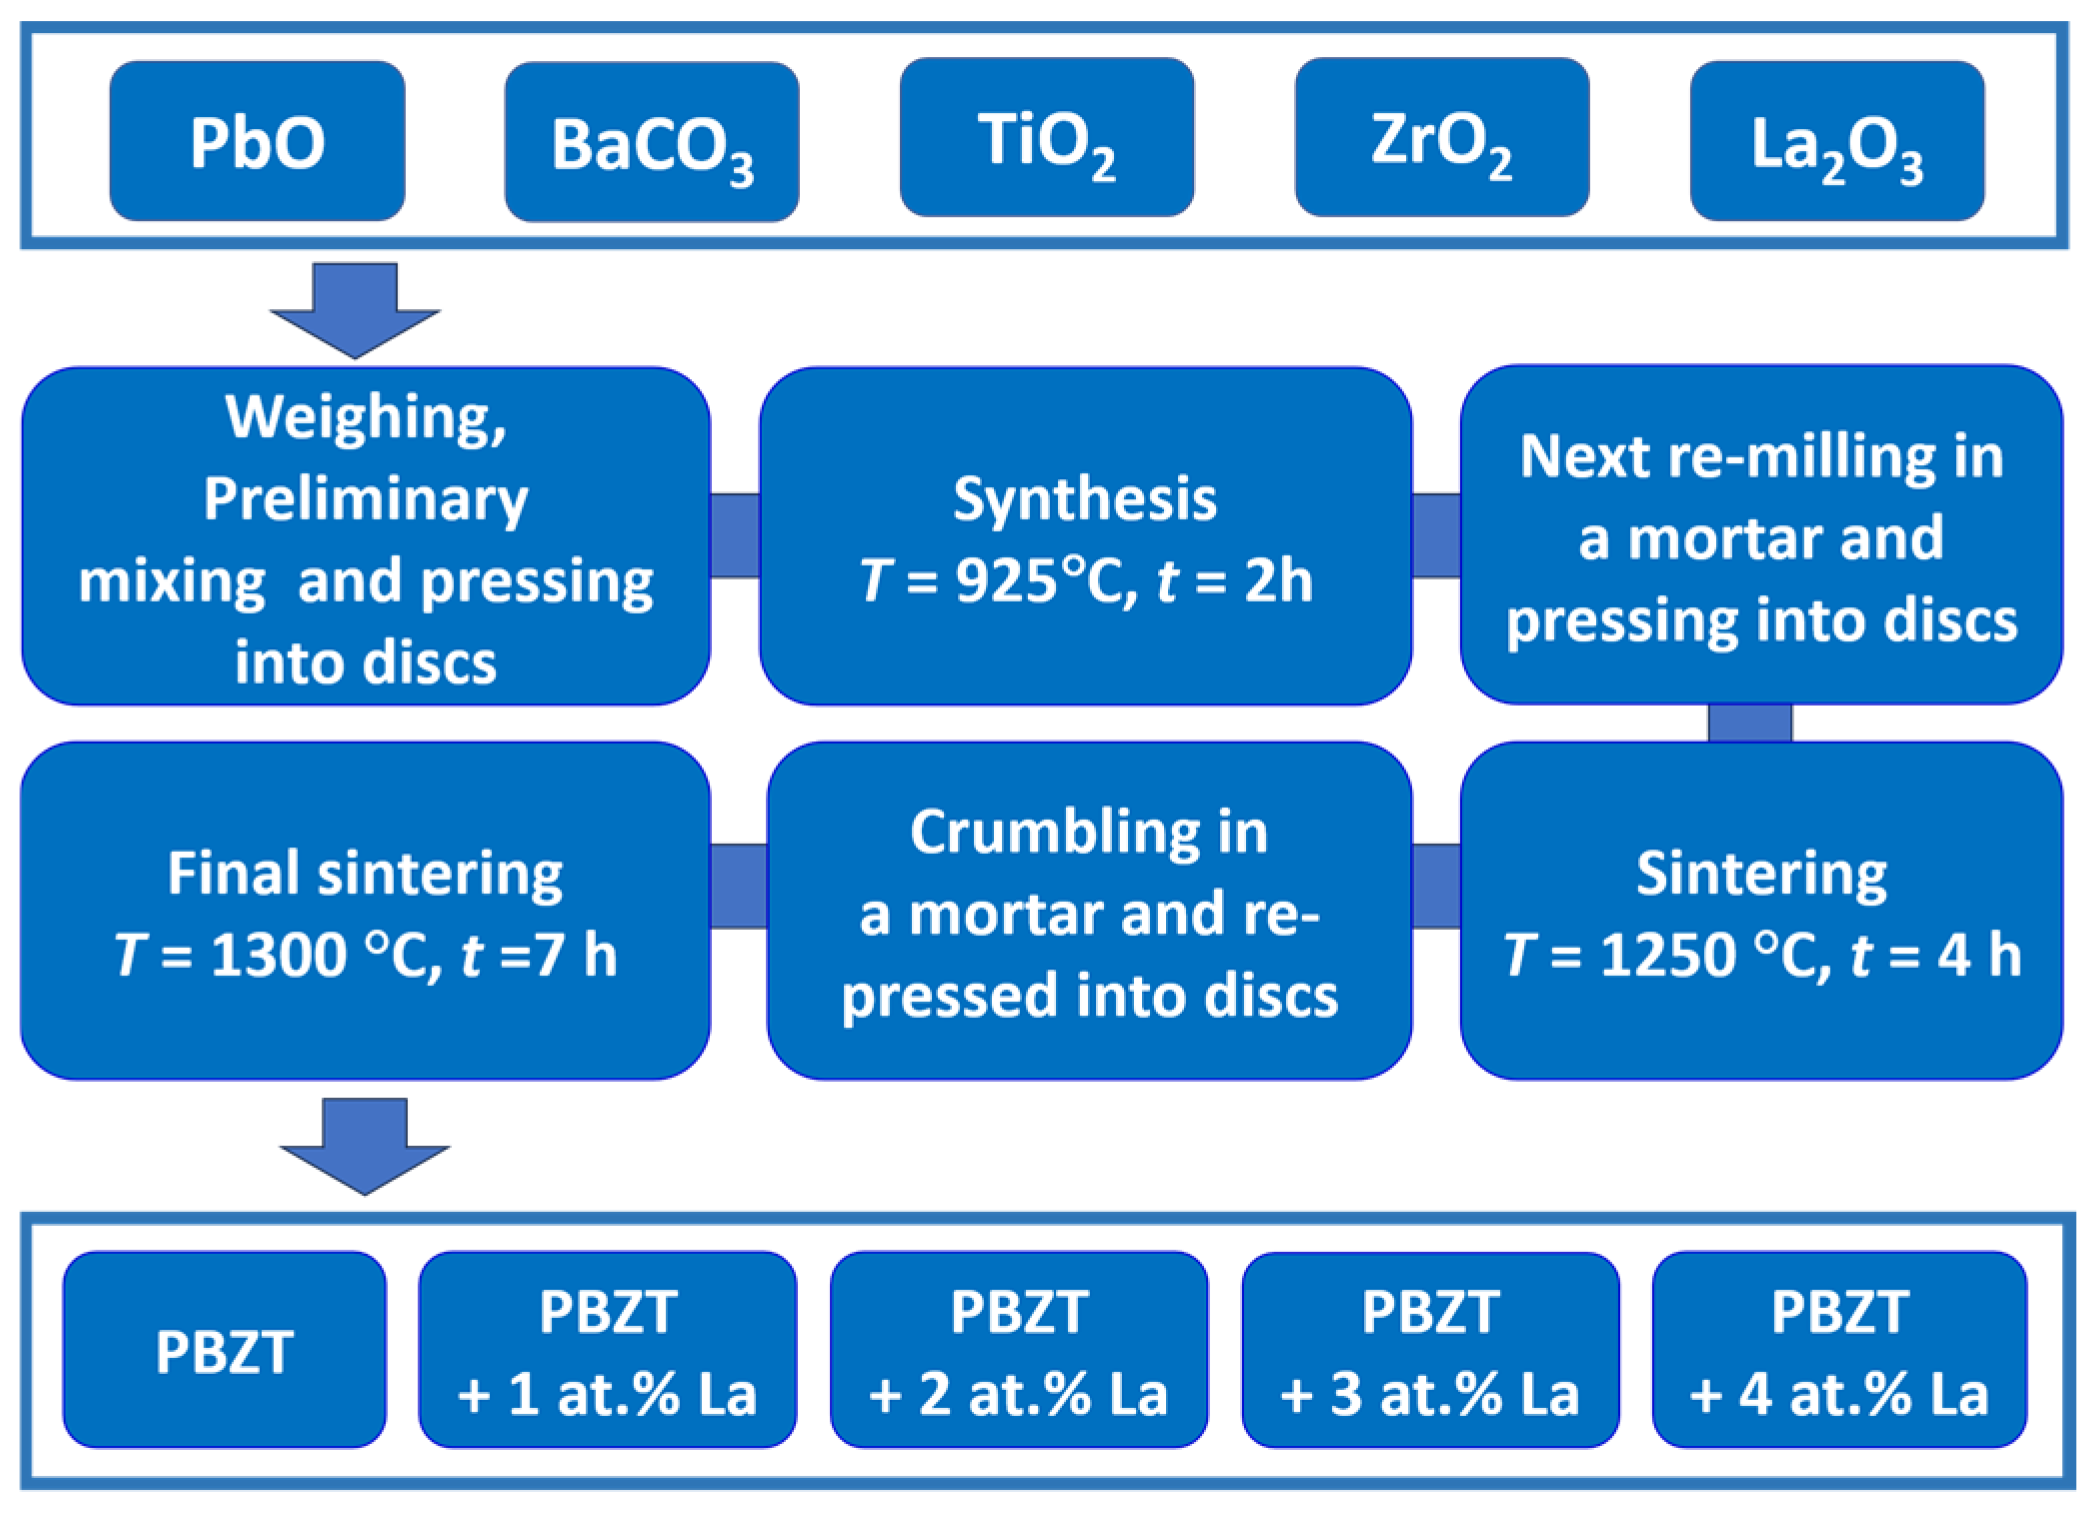
2. Materials and Methods

PBZT ceramics with the composition Ba/Zr/Ti = 25/70/30, both in pure form and doped with 1–4 at.% lanthanum, were prepared from simple oxides and carbonates via solid-state synthesis. The reagents, including PbO (Avantor, POCH, 99.0%, Gliwice, Poland), BaCO3 (99.99%, Sigma-Aldrich, St. Louis, MO, USA), TiO2 (Avantor, 99.9%, Gliwice, Poland), ZrO2 (Avantor, 99.0%, Gliwice, Poland), and La2O3 (99.99%, Sigma-Aldrich, St. Louis, MO, USA), were weighed in stoichiometric amounts according to the formula (Pb0.75Ba0.25)1−3x/2Lax(Zr0.70Ti0.30)O3. The weighed and mixed powders were formed into compacts in steel dies using a hydraulic press and then synthesized in crucibles. Synthesis was carried out at T = 925 °C for t = 2 h. After synthesis, the compacts were crushed, ground, and then re-pressed into disks and sintered at T = 1250 °C for t = 4 h. This procedure was repeated before final sintering at T = 1300 °C for t = 7 h. The sintering and synthesis process was carried out in a double crucible using a PbO and ZrO2 backfill to eliminate PbO sublimation. The flowchart of the complete fabrication process is shown in Figure 1.
The microstructure and chemical composition of the obtained ceramics were investigated using a JEOL JSM-7100F TTL LV scanning electron microscope (Akishima, Japan). This microscope is equipped with a JEOL-EDXS energy dispersive X-ray spectrometer (EDS) offering an energy resolution of 138 eV.
The phase composition of the prepared samples was analyzed using X-ray diffraction (XRD) with a Panalytical X’pert PRO MPD diffractometer (Eindhoven, The Netherlands) in the standard Θ–2Θ configuration. This diffractometer was equipped with a PW 3050 goniometer, a PIXcel 1D detector, and a copper (Cu) source (CuKα = 1.54178 Å). For phase and structural analysis, the HighScore Plus v. 3.0e software, along with the PDF-2 DL database (2022 edition) provided by JCPDS-ICDD, was utilized.
The impedance spectroscopy testing were performed using a computerized automatic system based on an Agilent E4980A LRC meter (Agilent, Santa Clara, CA, USA). Measurements were taken across a temperature range of T = (500–823) K, with increments of T = 10 K, and a frequency range spanning from f = 20 Hz to f = 2 MHz. Prior to data analysis, a preliminary test was conducted each time to ensure data consistency by employing Kramers–Kronig relations.
Temperature measurements of DC electrical conductivity were made using a computerized system, which included a Keithley 6485 picoammeter (Keithley Instruments, Solon, OH, USA) as an integral part. A low-intensity DC field of 10 V/cm was applied to the sample to measure the electrical conductivity.

3. Results and Discussion

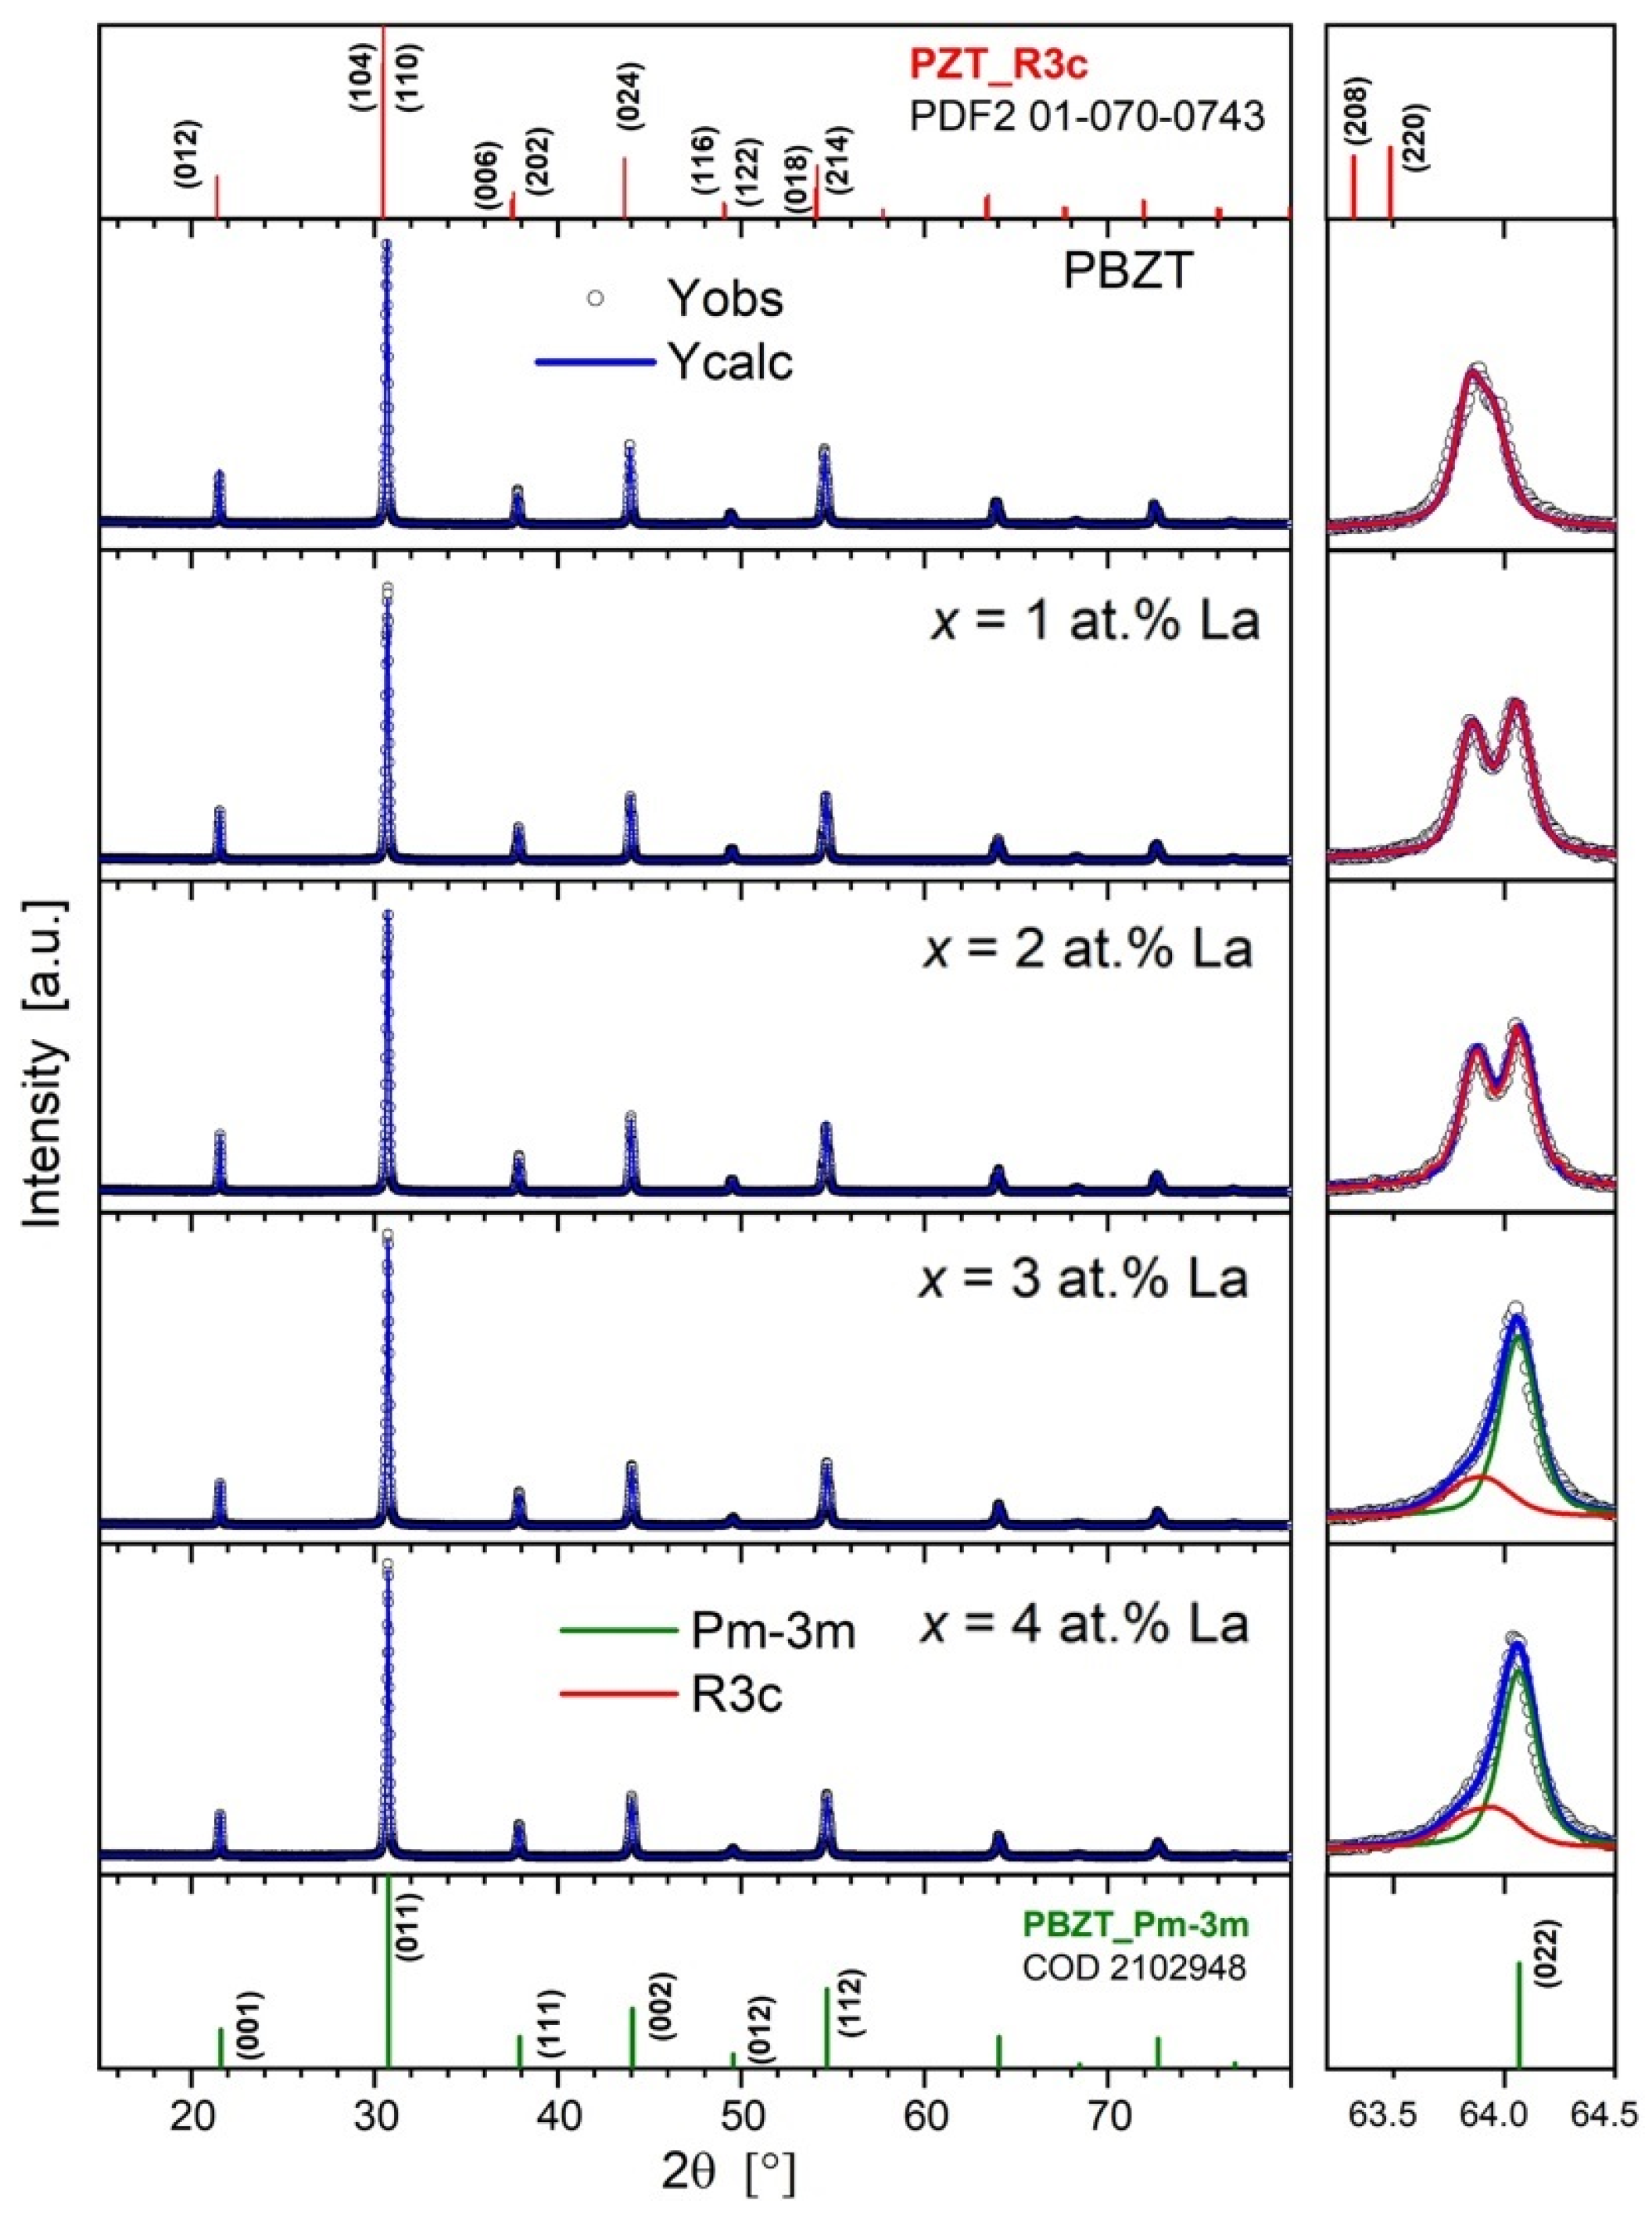
3.1. X-Ray Diffraction

The phase composition and crystal structure of the PBZT doped with La3+ samples were studied via the powder XRD technique, and the obtained diffractograms are shown in Figure 2.
At first glance, they are very similar, but closer inspection shows substantial differences. In order to study the lattice parameters and contribution of phases in the samples, the Rietveld refinement method was used. Table 1 summarizes the results of the Rietveld procedure. In the case of PBZT, PBZT doped with La3+ at concentrations x = 1 at.% and x = 2 at.%, the best numerical fit was obtained assuming a rhombohedral unit cell and R3c space group.
For PBZT doped with La3+ at concentrations x = 3 at.% and x = 4 at.%, two components (phases) were necessary to achieve satisfactory agreement between the model and the experiment (see the right panel of Figure 2). In this case, the dominating phase is cubic (Pm-3m space group). However, significant left-hand asymmetry of XRD peaks reveals the occurrence of a remnant rhombohedral component (red color in Figure 2). The value of lattice parameters of the rhombohedral component gradually increases with the growth of La concentration. One can note significantly broadened and overlapping peaks for the PBZT sample, possibly due to a relatively high level of internal strains. In contrast, for PBZT doped with La3+ at concentrations x = 1 at.% and x = 2 at.%, well-separated twin peaks are visible. It seems that a small admixture of La (1–2 at.%) stabilizes the rhombohedral lattice of PBZT, while the higher concentration (3–4 at.% of La) causes a transformation to the cubic perovskite structure.

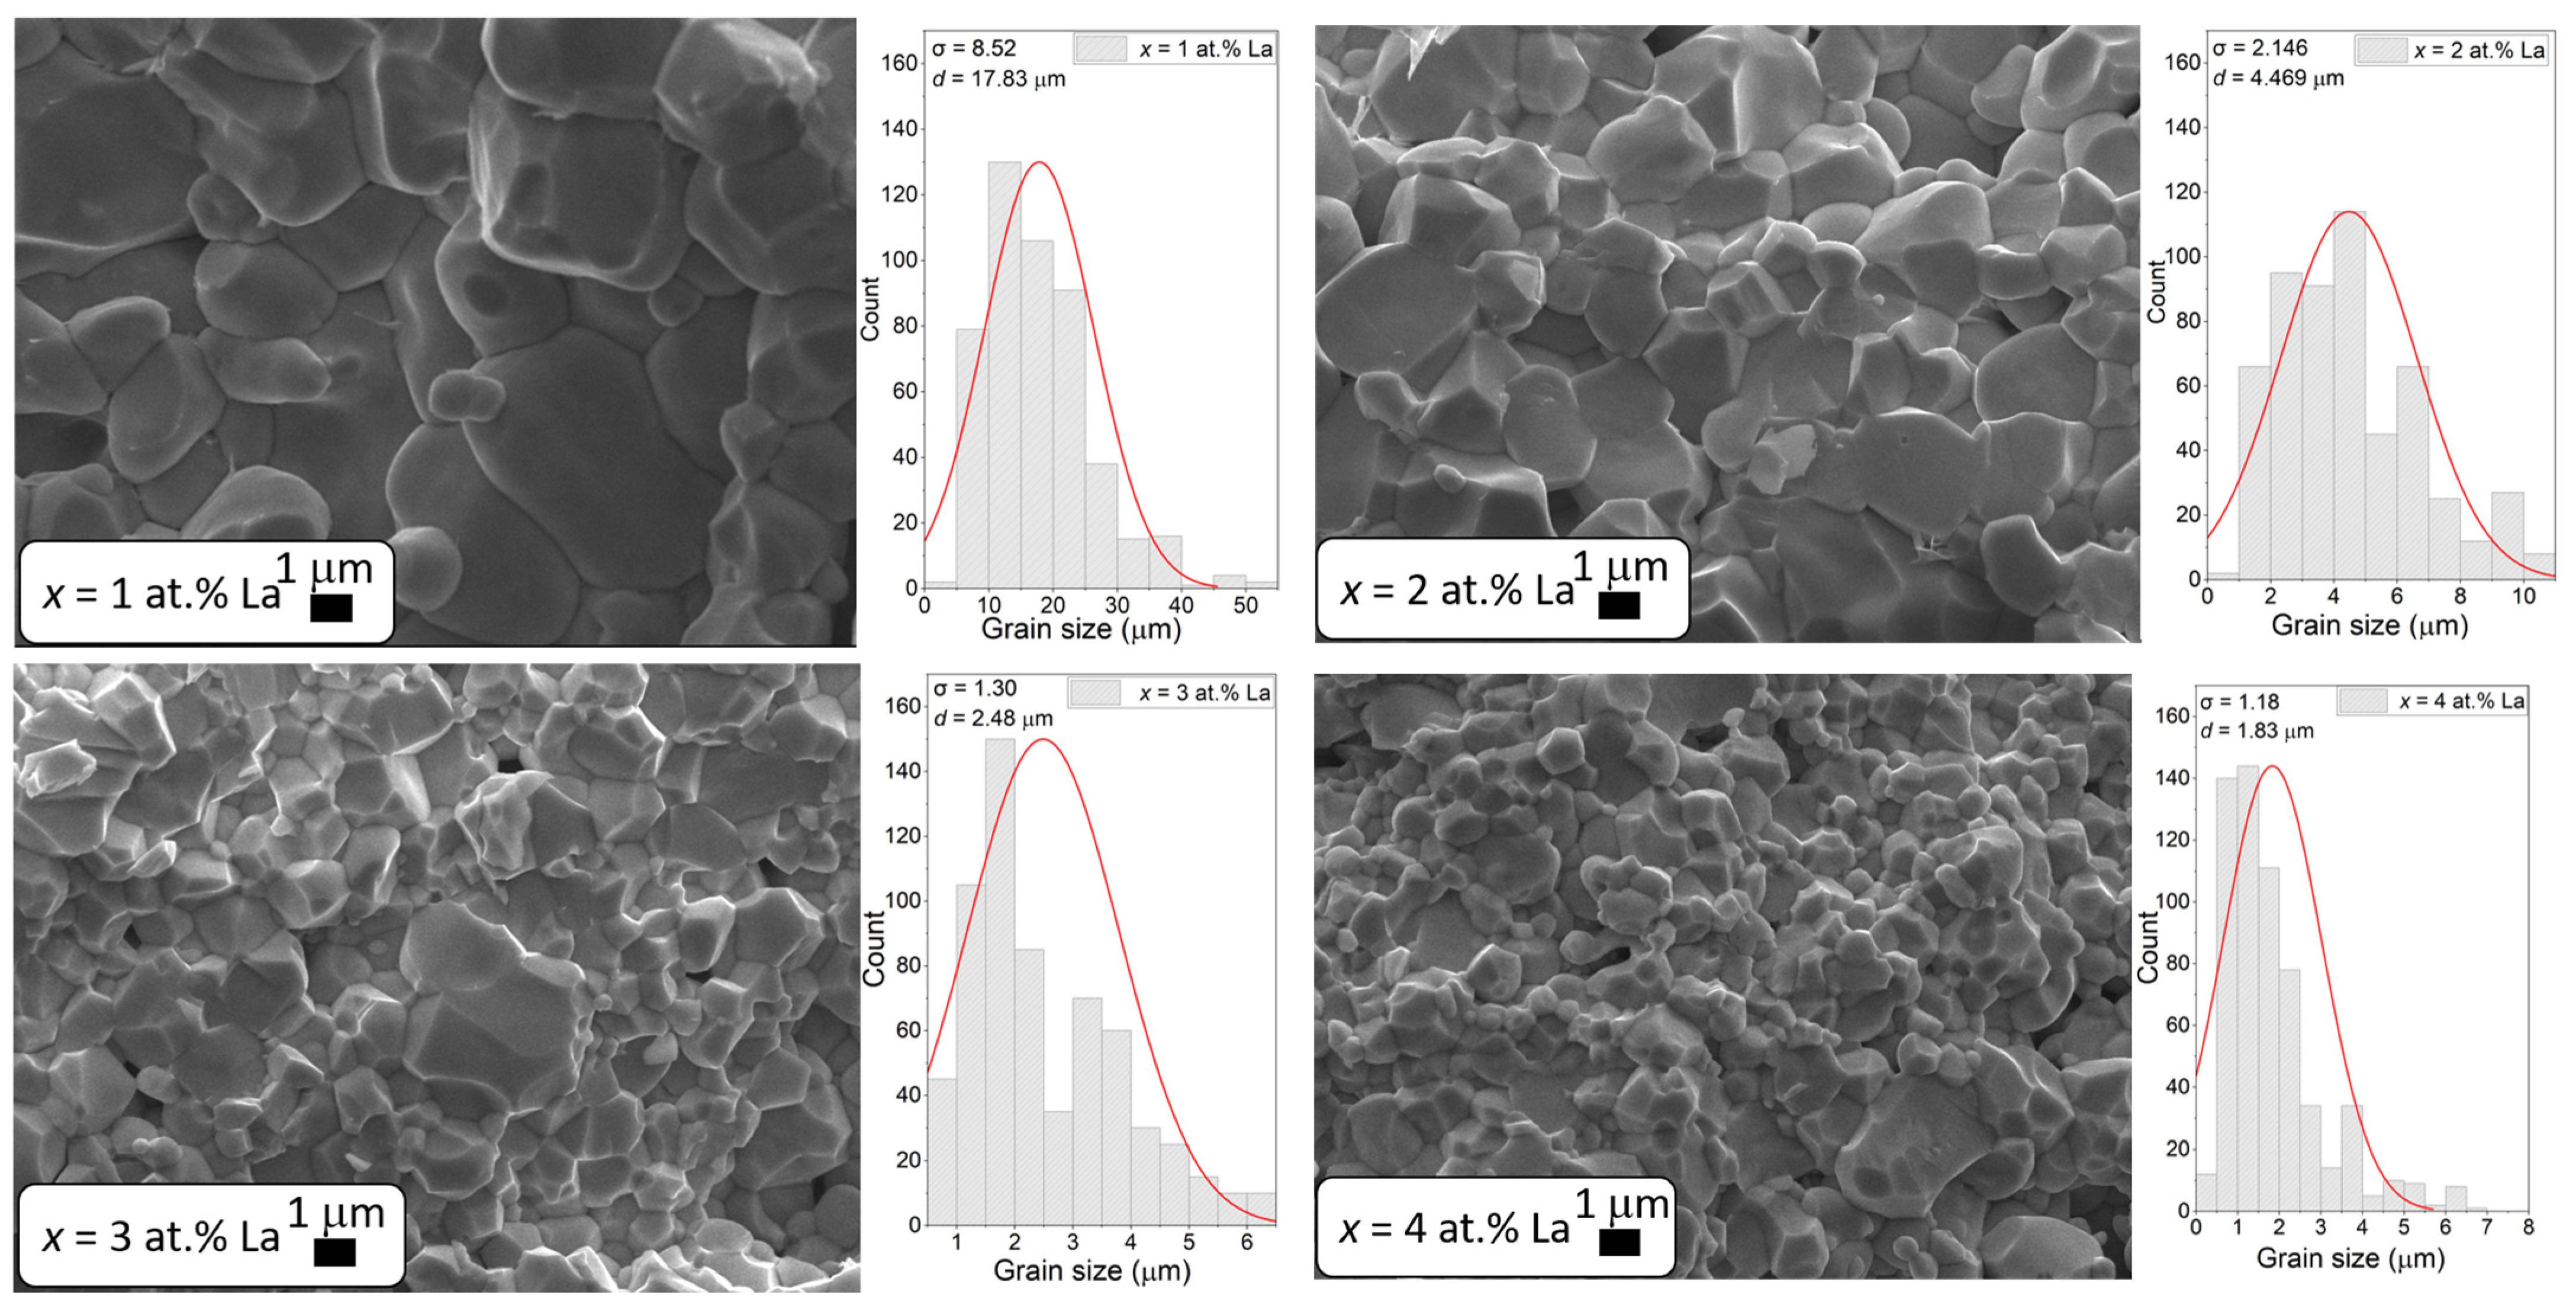
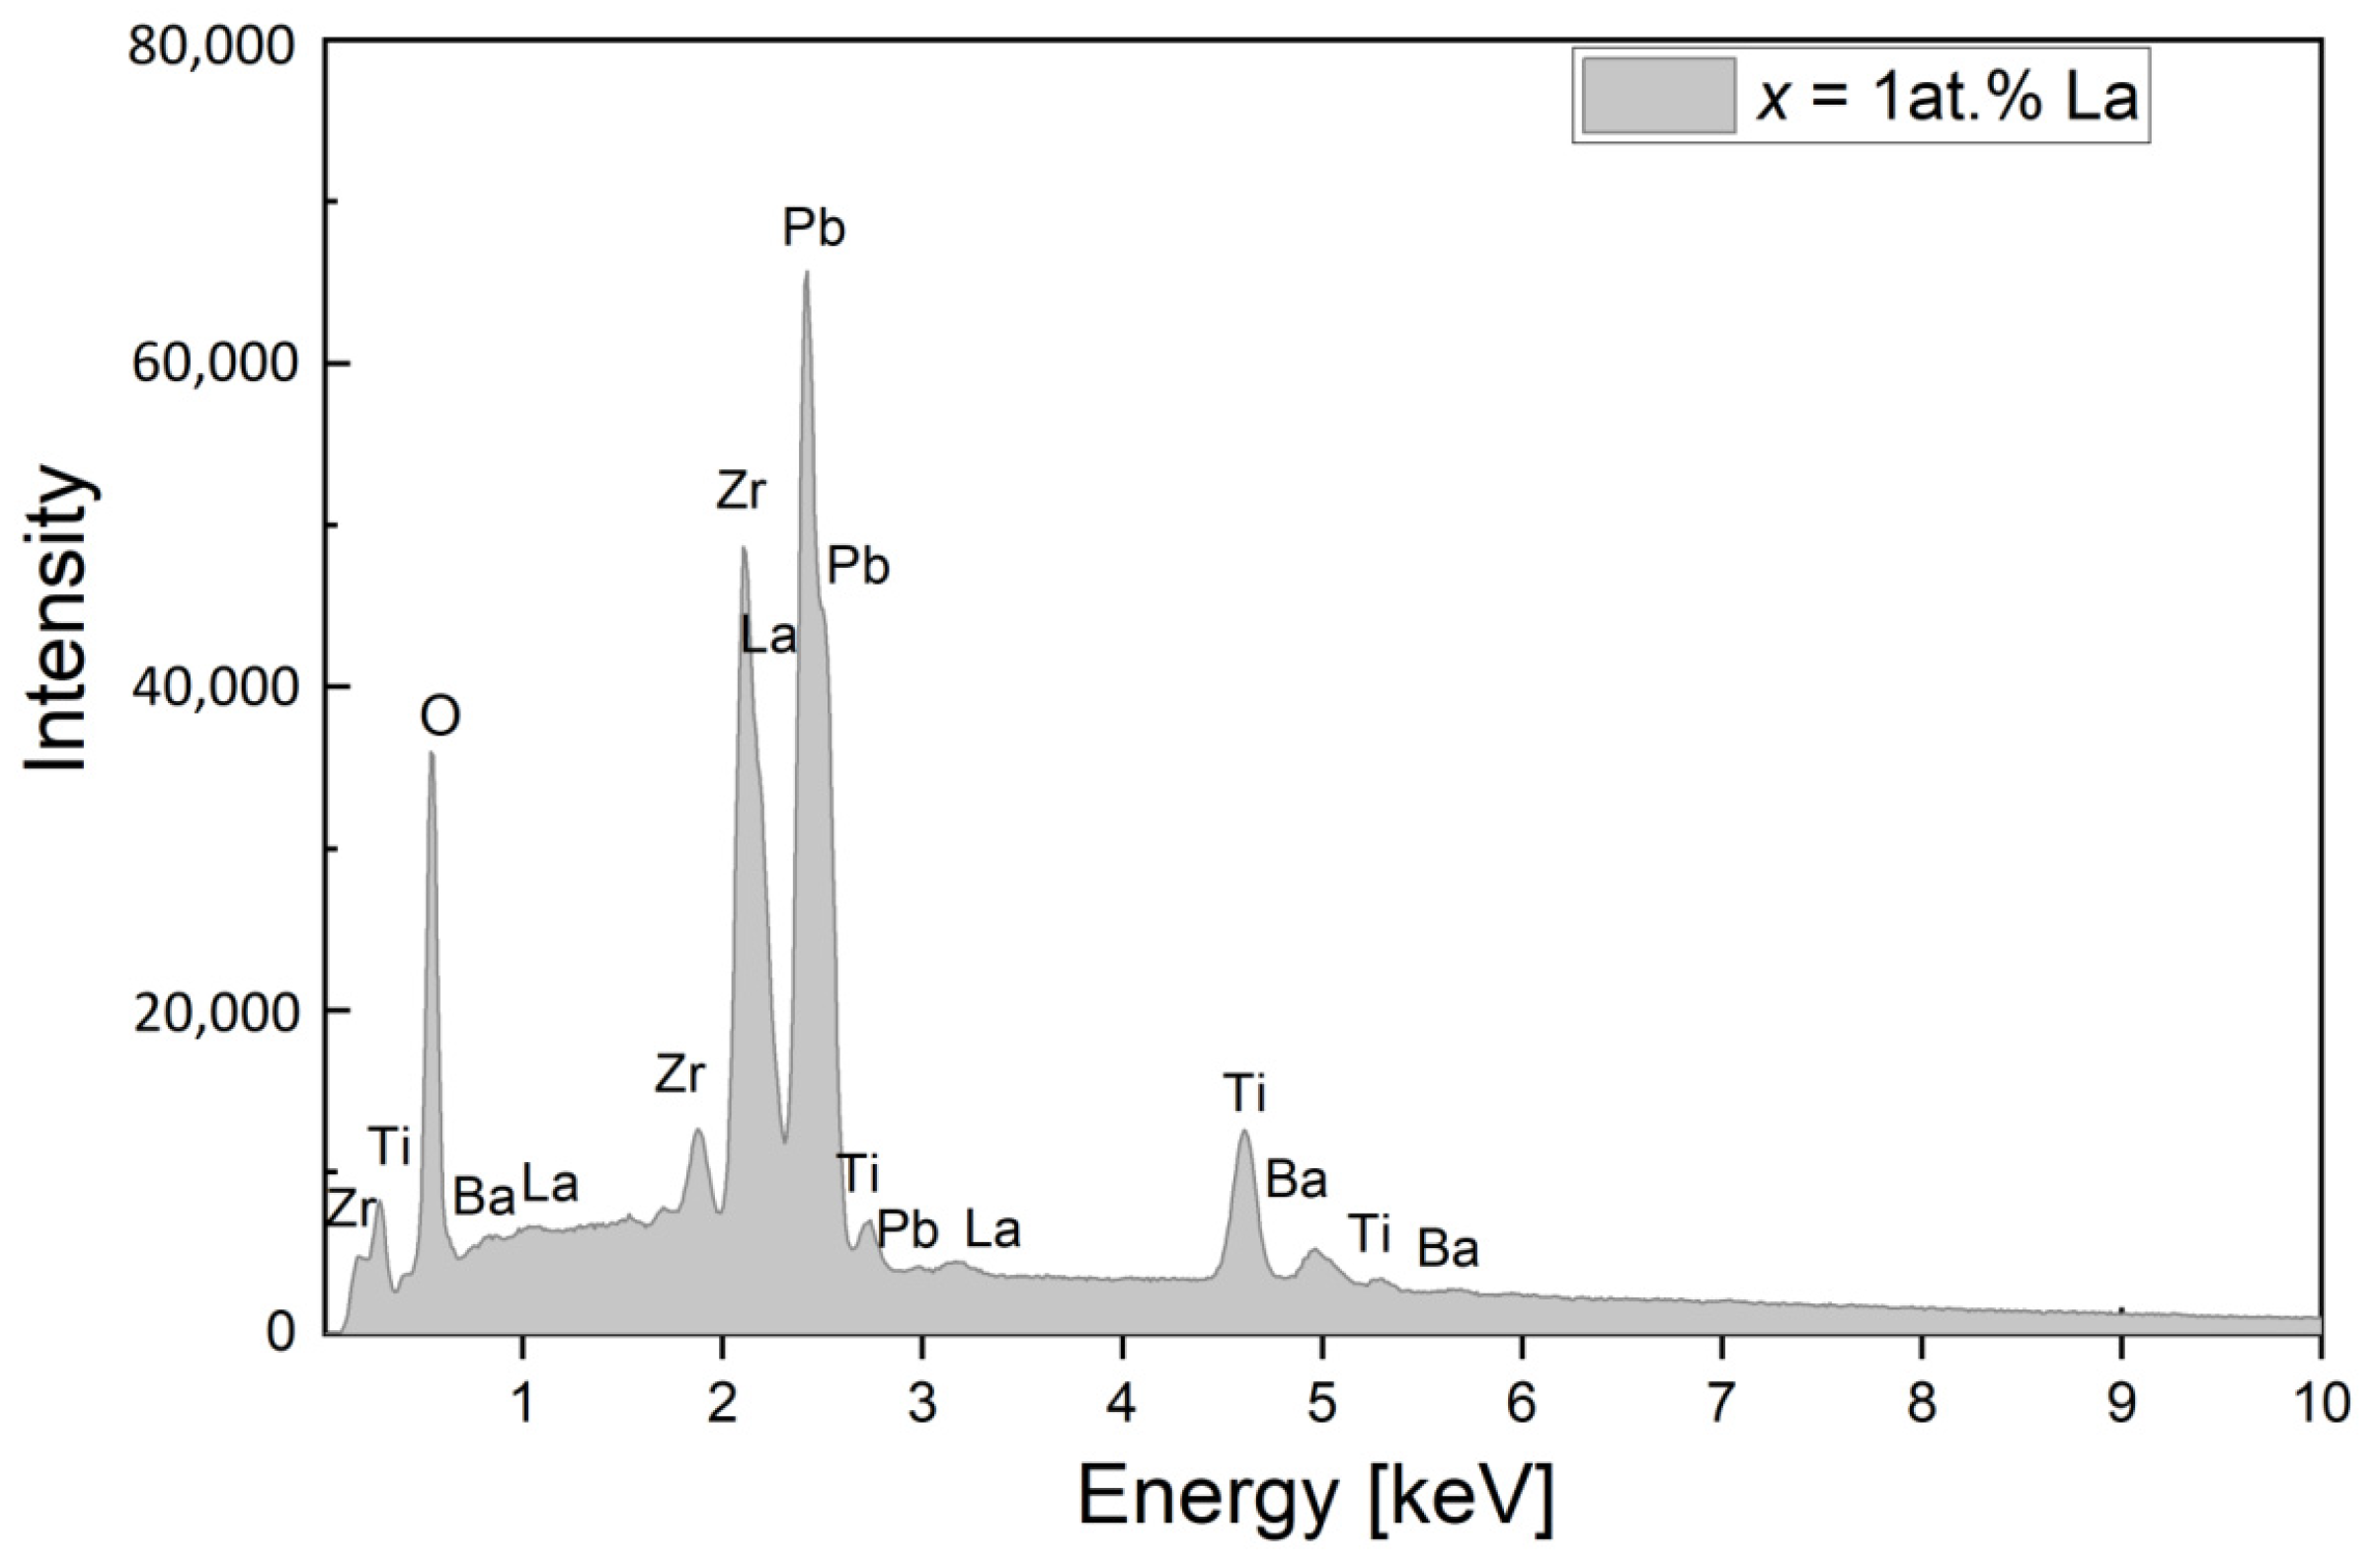
3.2. Analysis of Microstructure and Chemical Composition

For the purpose of image analysis enabling microstructural classification of ceramics, 20 images were taken from each sample. The procedure for recording the images of samples involved randomly selecting fields distributed over the entire surface of the tested ceramics. The selection of magnifications was made separately for each tested sample, taking into account its grain size as well as image readability. Images of the microstructure and gain size distribution diagrams of PBZT-25/70/30 ceramics doped with La3+ at concentrations of x = 1 at.%, x = 2 at.%, x = 3 at.%, and x = 4 at.% are shown in Figure 3. The microstructure is characterized by a compact structure with well-developed grains. There is visible variation not only in grain size but also in their orientation throughout the volume.
It can be seen that the lanthanum concentration has a significant effect on the grain size. Grain size distribution charts, created by analyzing multiple images for each concentration at the same magnification, are also shown in Figure 3. Based on the results, it can be observed that as the concentration of the La3+ dopant increases, the grain size decreases from d = 17.83 μm for x = 1 at.% La to d = 1.83 μm for x = 4 at.% La. Lanthanum doping causes a reduction in grain size compared to undoped PBZT [33], where the average grain size of undoped ceramics was larger than 15 µm. The grain structure refinement and homogenization of grain sizes under the influence of lanthanum doping are also observed in other materials with a perovskite structure, including barium titanate [34,35] and lead titanate [36].
Figure 4 shows an example of an EDS spectrum for PBZT x = 1 at.% La ceramics. The graph shows the peaks originating from the spectral lines of the elements in the obtained ceramics. EDS studies confirmed the purity of the examined samples and ruled out the presence of other elements. It can be concluded that the produced ceramics maintain the intended chemical composition.

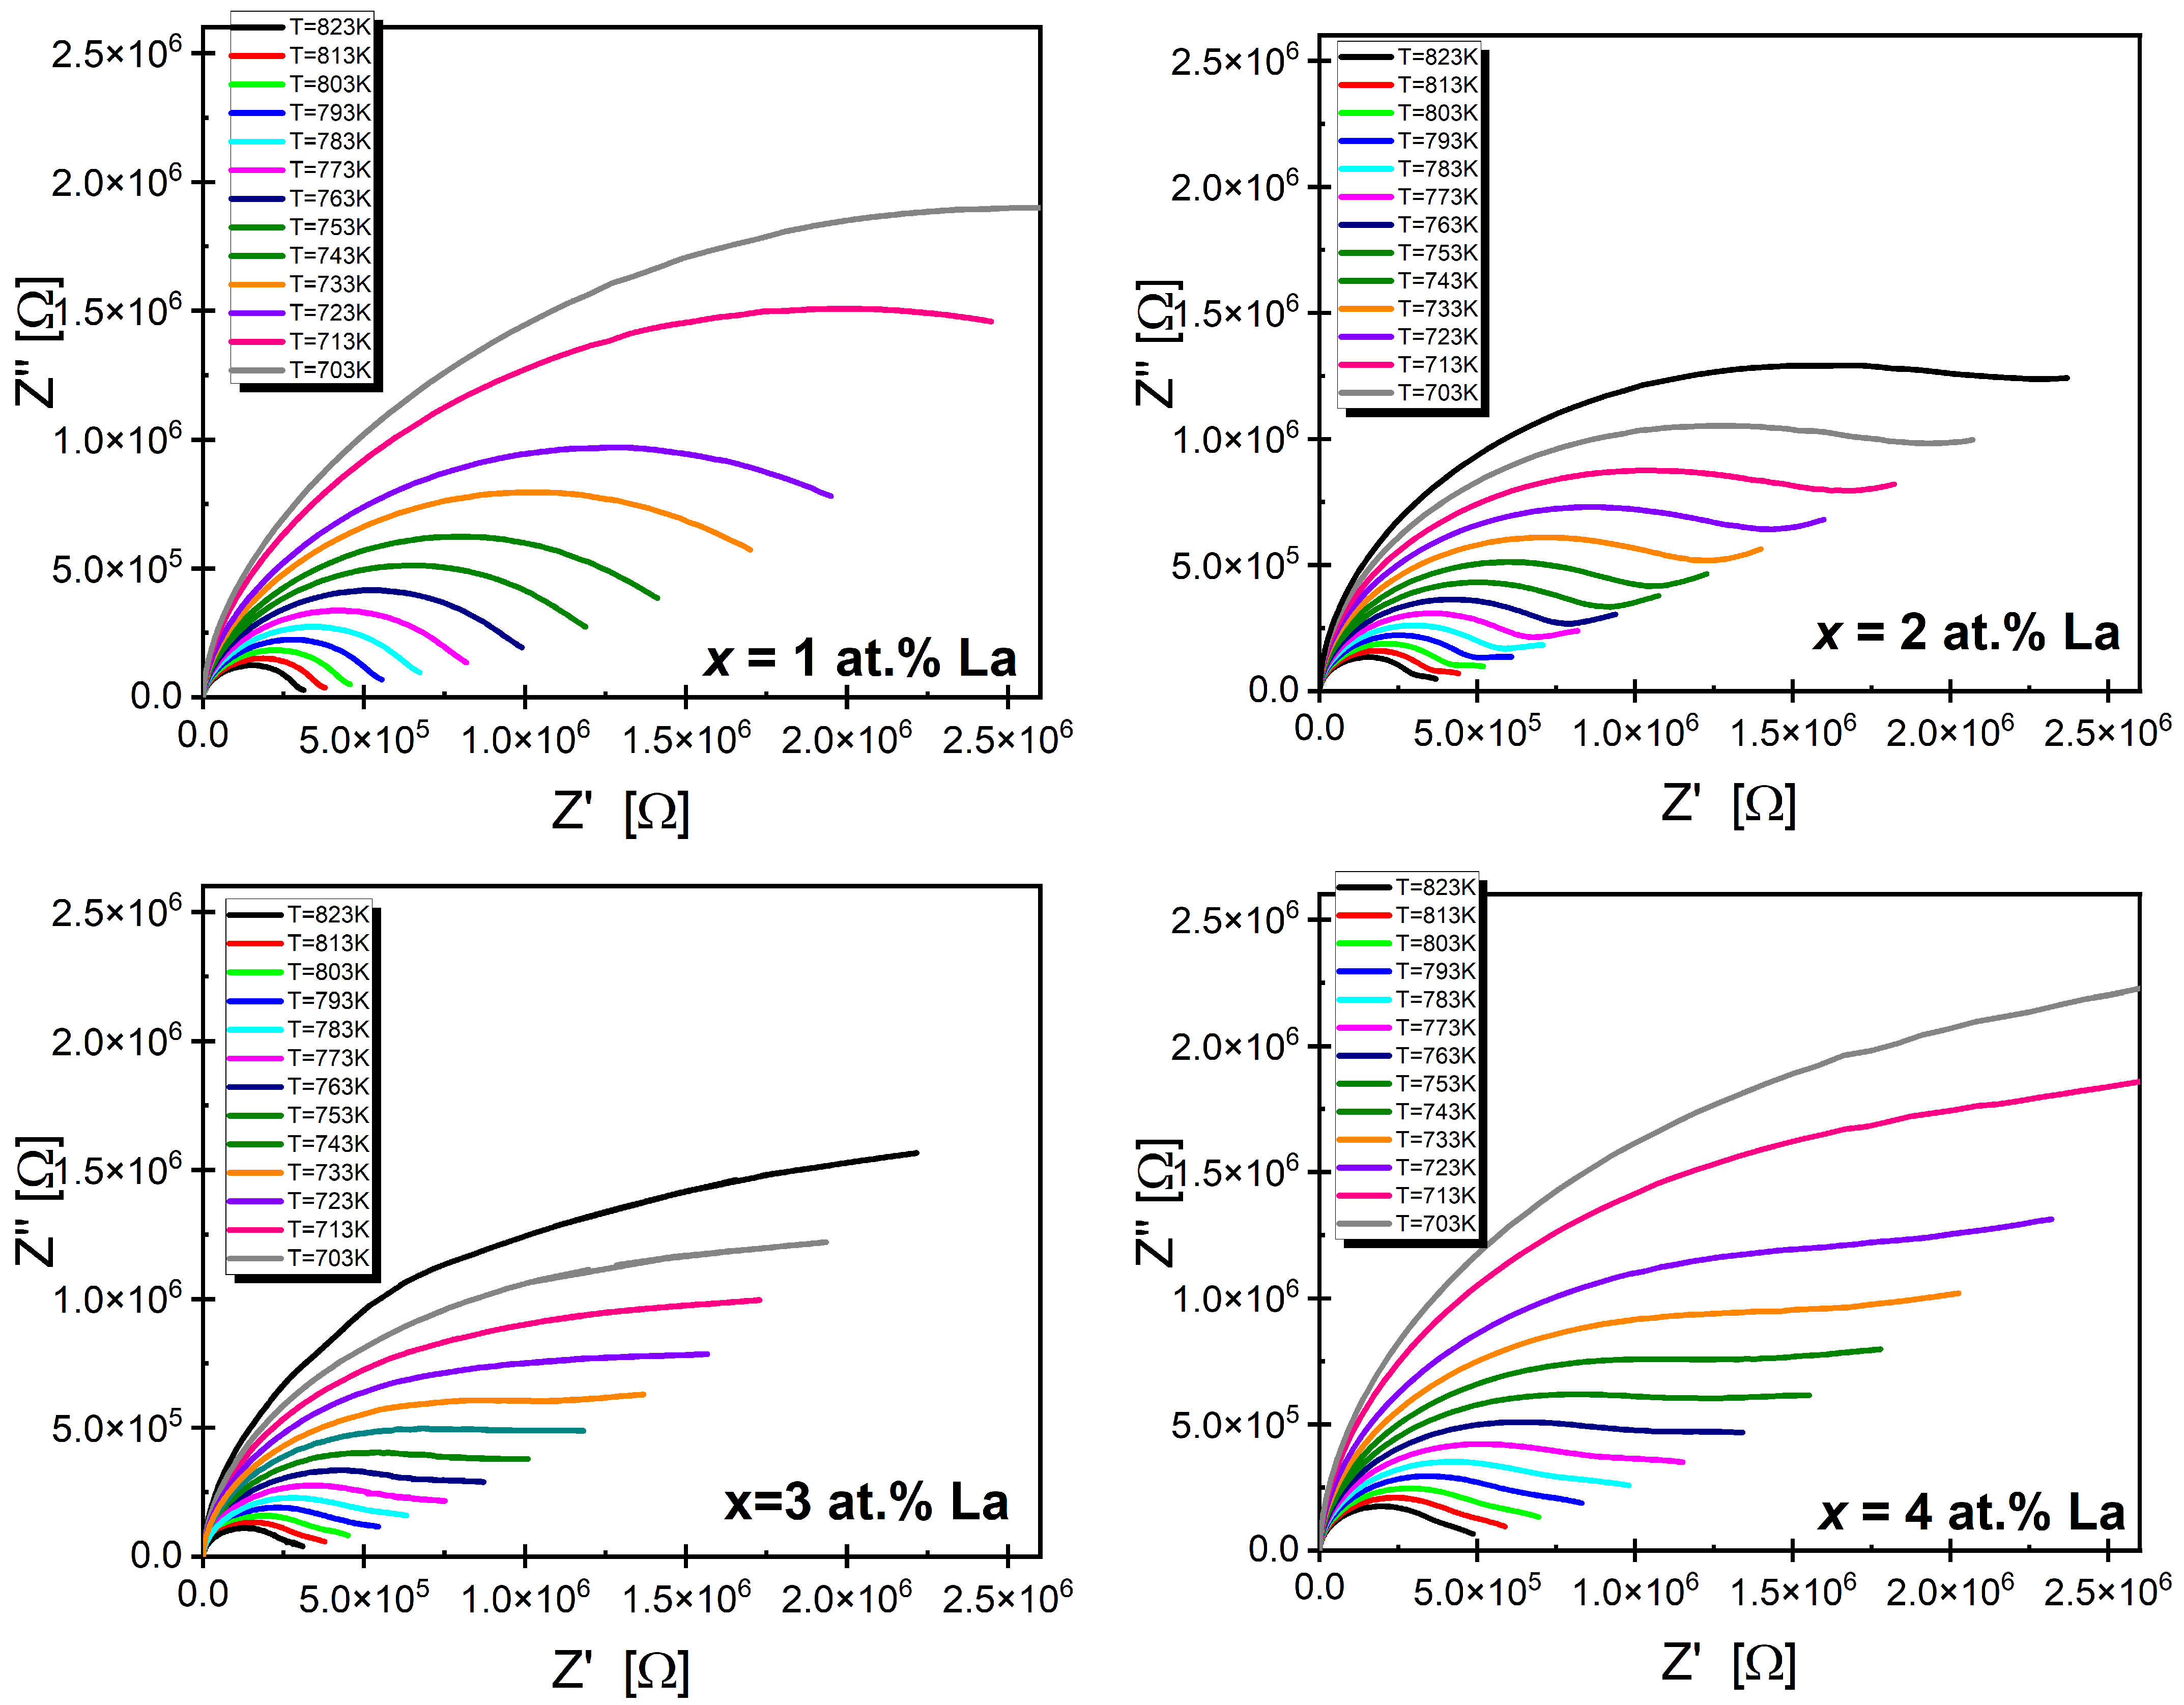
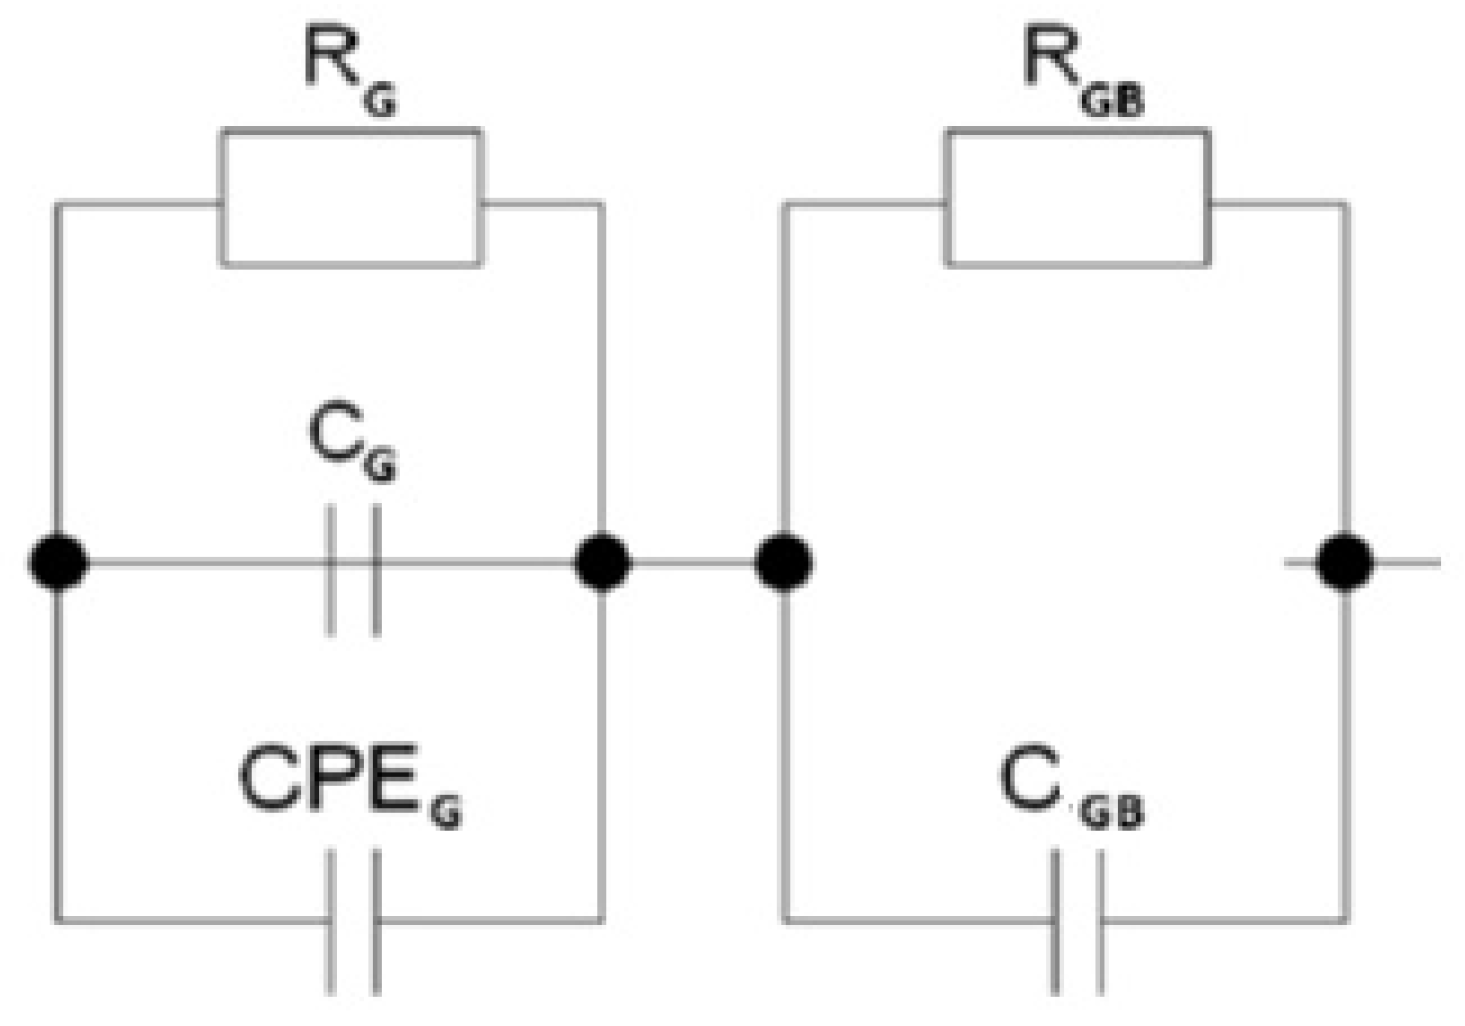
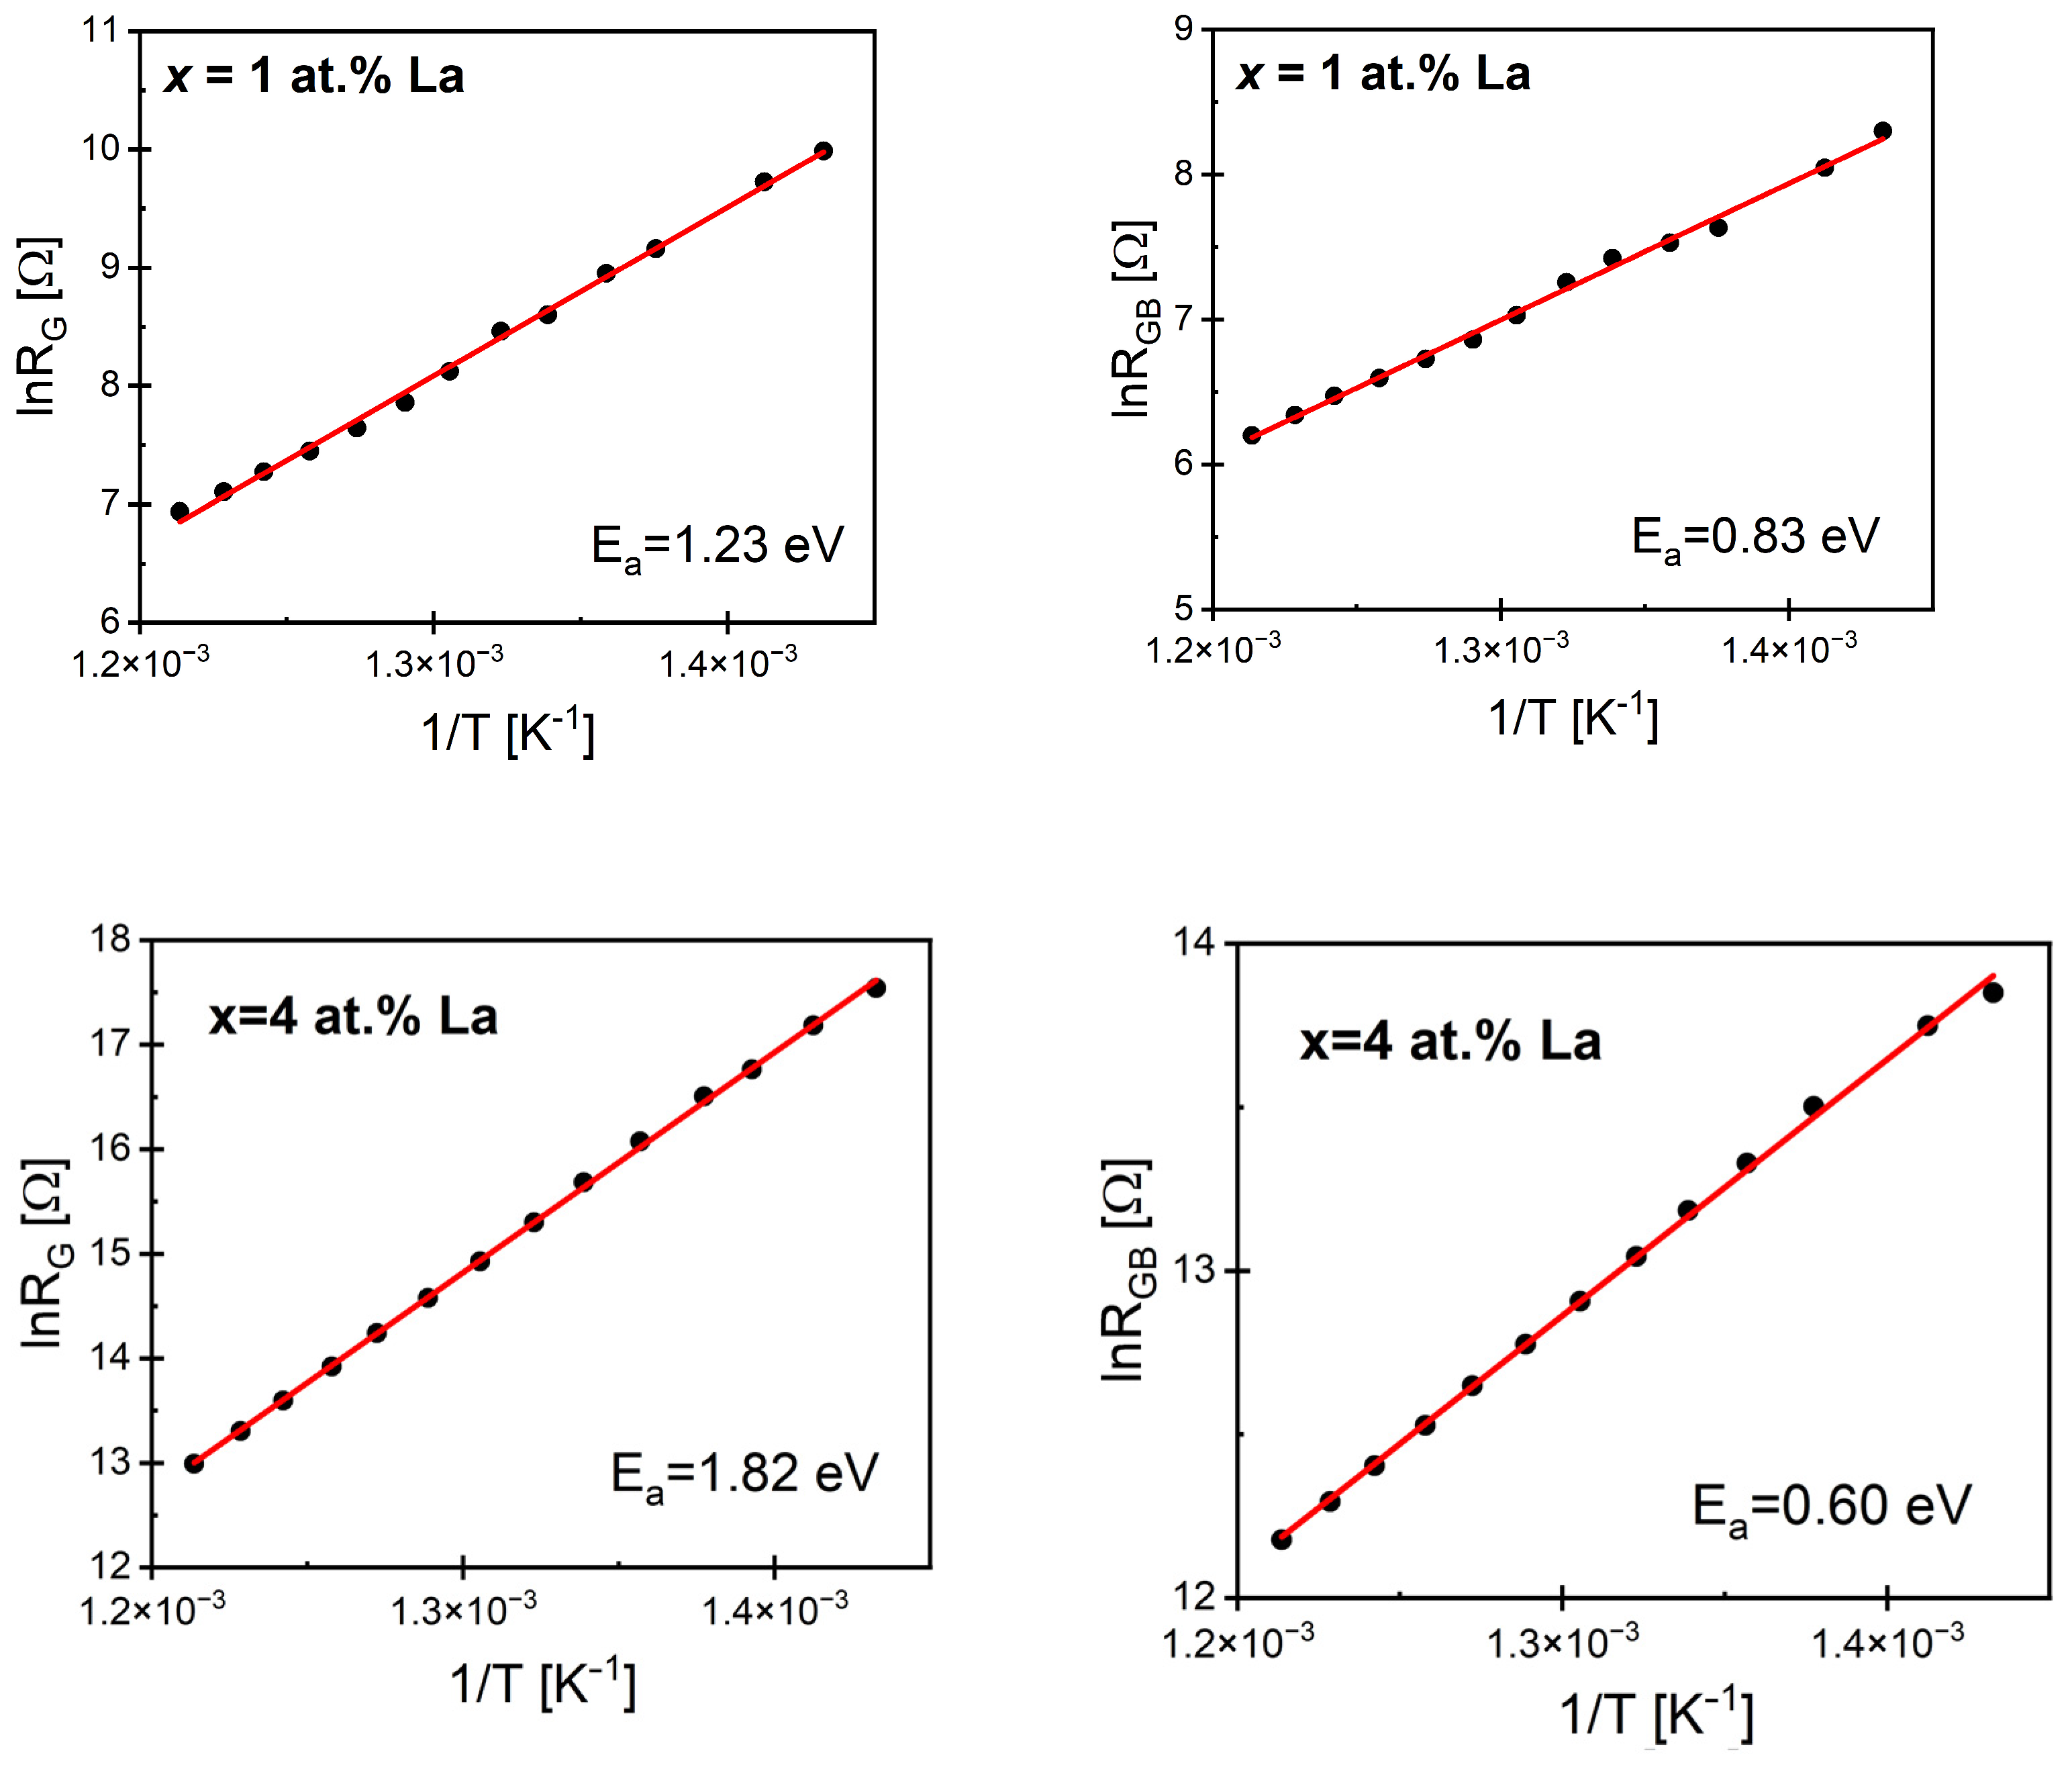
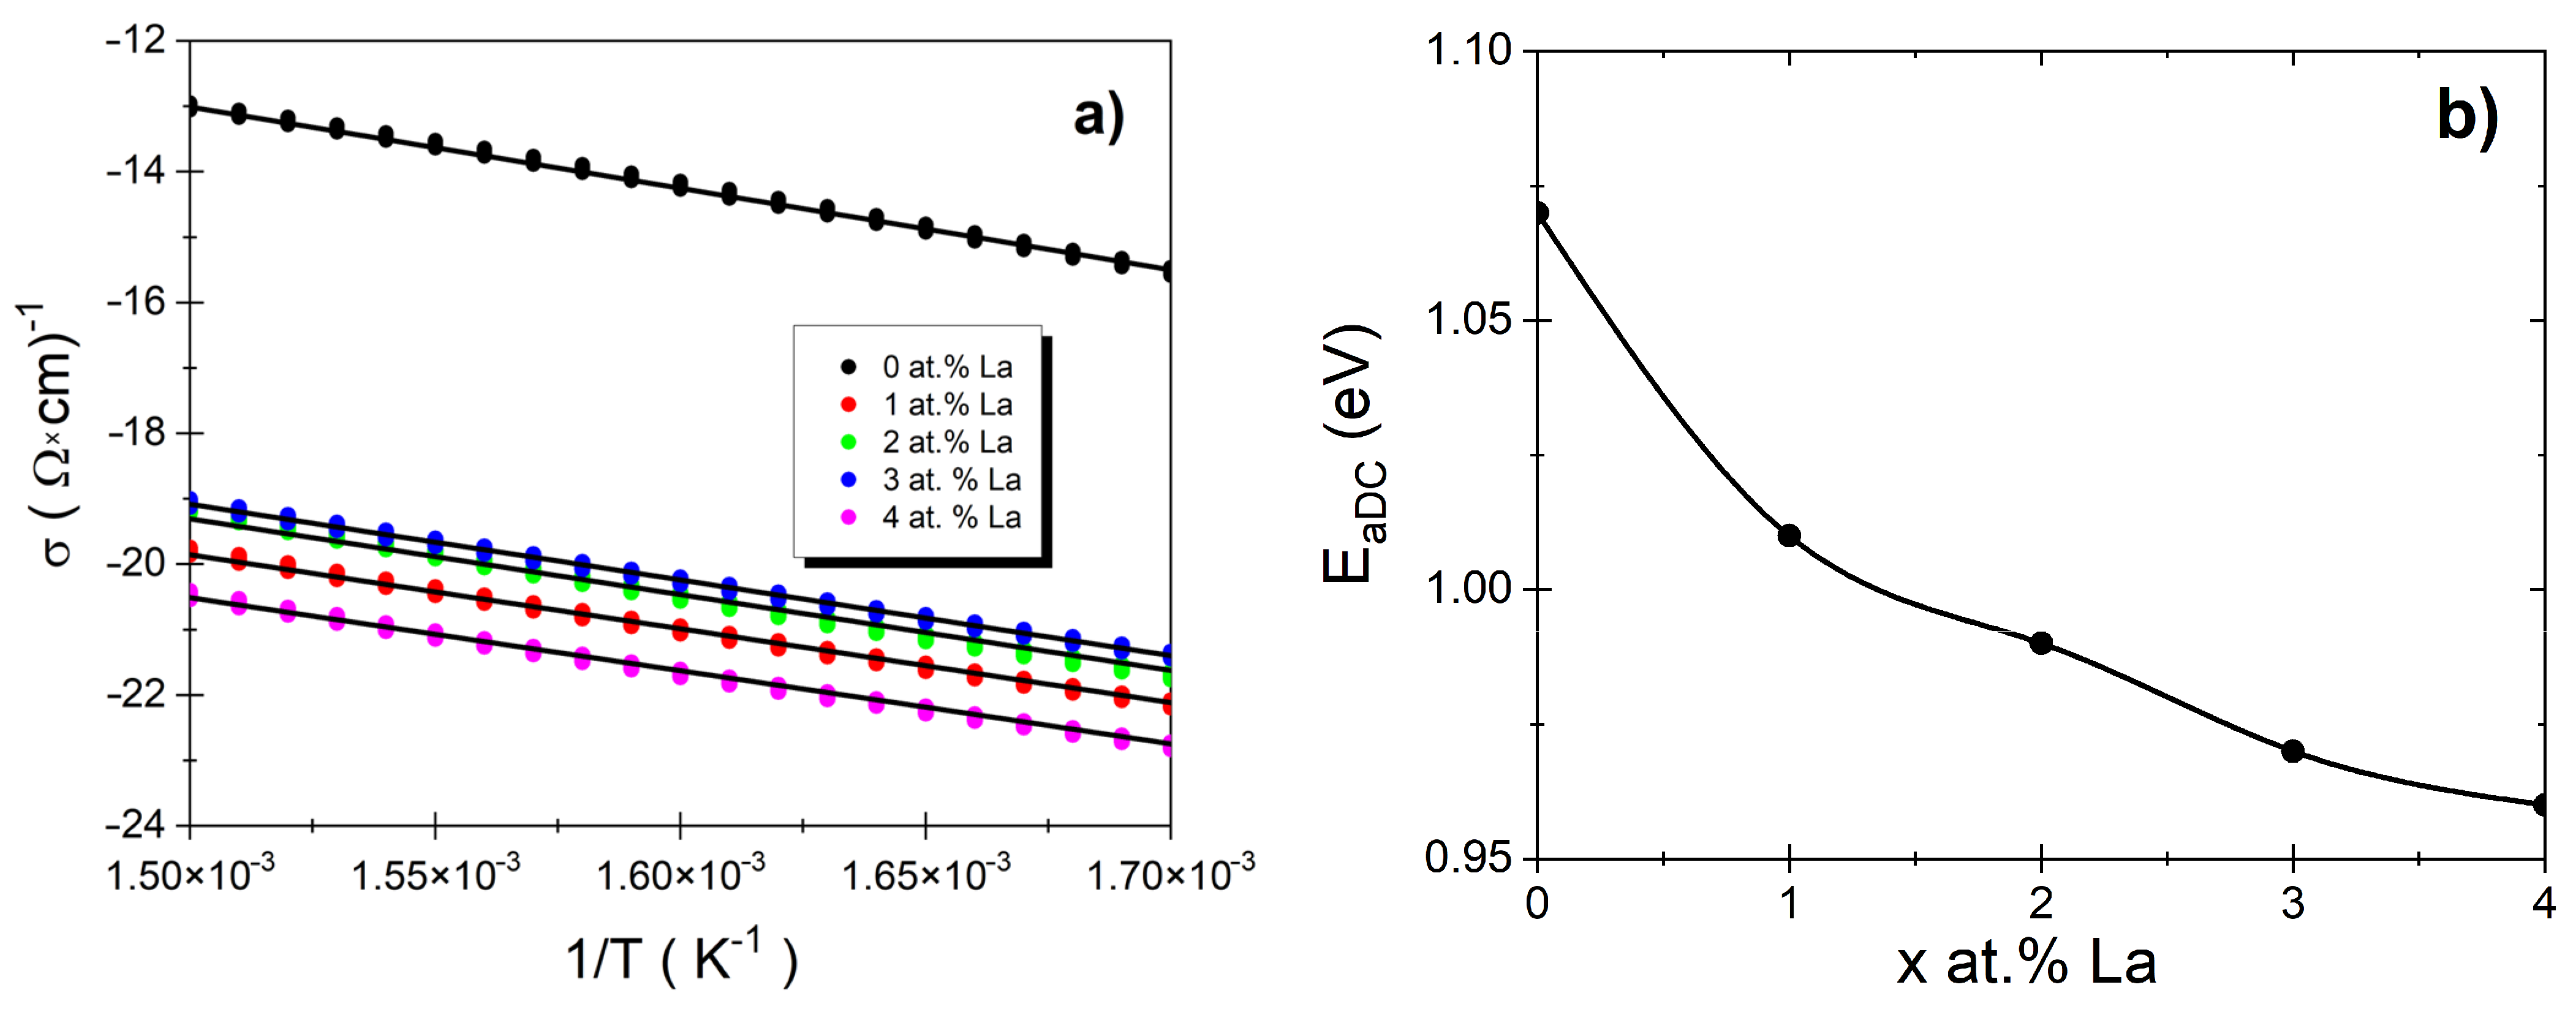
3.3. Impedance Spectroscopic Studies

As was mentioned in the introduction, impedance studies allow us to understand the contribution of individual microstructural elements to electrical properties. Although the studies were carried out over a wide temperature range (from T = 473 to T = 824 K), for the purposes of this publication, only the results obtained at high temperatures are discussed, where the resulting characteristics of the imaginary part of impedance (Z″) as a function of the real part (Z′) exhibit semicircular arcs (rather than only arcs), allowing for the identification of the contributions from grains and grain boundaries. Investigations described in our previous publications have proven that extrapolating the results obtained at high temperatures to room temperature provides accurate information about the resistance of microstructure components. The obtained results were directly confirmed using atomic force microscopy techniques [37]. Figure 5 present the real and imaginary parts of the impedance as a function of frequency on a double logarithmic scale at several temperatures for PBZT 25/70/30 ceramics modified by the minimum and maximum amounts of lanthanum.
The characteristics of the remaining discussed ceramic materials are included in Supplements S1 and S2. It was observed that Z′ decreases slowly in the first frequency range, and then the rate of decrease increases significantly. The frequency boundary between these two regions shifts to higher values as the temperature increases. Moreover, the increase in temperature also leads to a decrease in Z′ values across the entire frequency range studied, which is a consequence of the increase in electrical conductivity [38]. In the frequency dependencies of Z″ appears a maximum which decreases in value and moves to a high-frequency region with increasing temperatures. The movement of the peak results from a temperature-dependent relaxation process occurring in the sample [39]. In turn, the asymmetry of the observed peaks suggests the presence of electrical processes in the material with a distribution of relaxation times. The source of this relaxation may likely be electrons or immobile charges at lower temperatures and defects at higher temperatures. The absolute values of the high-frequency slopes are, indeed, very close to unity and appear to be independent of temperature. Similar behavior has also been observed in other ceramic materials, for example, in PLZT 2/95/5 ceramics [40]. The merging of the logZ″(logf) characteristics into a single curve observed in the high-frequency range indicates significant space charge accumulation [41,42].
Figure 6 shows the impedance data taken over a wide range of frequencies at several temperatures, presented as a Nyquist diagram (complex impedance spectrum).
The diagrams take the shape of highly distorted semicircles with lowered centers, indicating the existence of separate impedance responses from the grains and grain boundaries. The similar effect of lanthanum ions on the shape of implantation characteristics was noted, among others, by the authors of the study [43].The interior of the ceramics cannot be treated as a homogeneous whole. Therefore, the equivalent electrical circuit used to describe the impedance response consists of two branches. For pure PBZT 25/70/30 ceramics, each branch was a classic Voigt element, i.e., a capacitor and a resistor connected in parallel. In the case of lanthanum-modified ceramics, the first branch, describing the dielectric properties of the grains, is a modified Voigt element, which includes not only resistance and capacitance but also a CPE element. The second branch, corresponding to the electrical properties of the grain boundaries, is a classical Voigt element (Figure 7). The equivalent circuit designed in this way successfully described the impedance results in other materials, such as Pb(Fe0.5Nb0.5)O3, BiHoZnZrO6, and BiHoCuTiO6 [44,45,46]. Based on the proposed equivalent circuit model, and using Zview 4 software (Scribner Associates, Southern Pines, NC, USA), the impedance spectroscopy results obtained for all discussed samples in the temperature range of T = 703–823 K were fitted. The example of the fitting procedure results for unmodified and La-doped ceramics at selected temperature is presented in Table 2, together with the errors of the fits for each parameter. The obtained values of grain and grain boundary capacitances fall within the range characteristic for these microstructural components [47], while the resistance values of grains and grain boundaries are of the same order of magnitude as other ceramic materials with perovskite structure [48].
The fitting values of grain and grain boundary resistance for all investigated temperatures are presented as natural logarithm dependencies versus reciprocal temperature in Figure 8 for PBZT 25/70/30 ceramics modified by the minimum and maximum amounts of lanthanum. The characteristics of the remaining discussed ceramic materials are included in Supplements S3 and S4. Table 3 presents the activation energy for all obtained materials. The obtained results clearly indicate a significant increase in the resistance of both the grains and the grain boundaries.
For example, the grain resistance at a temperature of T = 773 K increases from approximately 217 Ω for undoped PBZT 25/70/30 [37] ceramics to about 3.53 × 10⁵ Ω for ceramics modified with 4 at.% lanthanum ions. At the same temperature, the grain boundary resistance increases from 3.6 × 10³ Ω for pure ceramics [37] to 2.5 × 10⁶ Ω for doped ceramics.
The linear character of the presented dependencies made it possible to determine the activation energy (Ea) of the conductivity process in grains and grain boundaries for ceramics with various lanthanum content. Undoped PBZT 25/70/30 ceramics are characterized by the following activation energy values: 0.95 for grain conductivity and 0.85 for grain boundary conductivity [37]. The value of Ea for grains increases rapidly with the increase in La3+ ion content, whereas the Ea for grain boundaries decreases slightly. The explanation for the observed changes is connected with space charge, which plays a crucial role in the case of undoped ceramics. The pyroelectric measurements, widely described in our previous paper [49], reveal the presence of significant thermally stimulated depolarization currents (TSDC), which are proof of the existence of a large amount of space charge in the ceramic material. The discussed TSDC completely disappear in the case of lanthanum-modified PBZT 25/70/30 ceramics [33], causing the aforementioned increase in grain and grain boundary resistance. The presented results seem to remain consistent with the results shown for PLZT-type ceramics, where the La dopant reduces p-type conductivity [50,51]. In order to check this possible effect, measurements of electric conductivity (σ) as a function of temperature were carried out over a wide temperature range. The results are shown in the form of the dependence lnσ vs. 1/T (Figure 9a). The lanthanum ion modification caused a significant reduction in electric conductivity in comparison with undoped ceramics, which is in good agreement with our assumptions. The linear character of the lnσ vs. 1/T dependence allows for determining the activation energy of DC conductivity (EaDC) for ceramics with various La contents. The value decreases with the increase in lanthanum ion concentration (Figure 9b).
The similarity in the nature of the changes in activation energy for DC conductivity and conductivity in grain boundaries, caused by modification with lanthanum ions, suggests that the main microstructural element responsible for conductivity in the discussed materials is the grain boundaries.

4. Conclusions

The study examined the effect of La3+ doping on (Pb0.75Ba0.25)(Zr0.70Ti0.30)O3(PBZT) ceramics, which were obtained using the conventional solid-state synthesis method. The structure and morphology of the ceramics were analyzed using scanning electron microscopy and energy dispersive X-ray spectroscopy. The results indicate that the chemical composition of the ceramic samples corresponded to the initial stoichiometry of the ceramic powder. An increase in lanthanum content led to a decrease in the average grain size of the ceramics. Additionally, X-ray diffraction analysis confirmed that the structure of PBZT and PBZT doped with La3+ at concentrations of x = 1 at.% and x = 2 at.% was rhombohedral (R3c space group), while for PBZT doped with La3+ at concentrations x = 3 at.% and x = 4 at.%, the dominating phase was cubic (Pm-3m space group), with about 30% admixture of a remnant rhombohedral component. The electrical properties were investigated using impedance spectroscopy over a wide range of temperatures and frequencies. A detailed analysis of the obtained results revealed an increase in grain and grain boundary resistivity caused by lanthanum modification. The results are in good agreement with the thermally stimulated depolarization current measurements presented earlier and confirm the reduction of space charge with increasing lanthanum concentration. The presented changes in grain and grain boundary resistance, although determined for high temperatures, will allow for the extrapolation of the electrical properties of microstructural elements at room temperature, which will undoubtedly be helpful in designing materials for practical applications. The lanthanum dopant has a very positive effect not only on electrical properties but also improves the piezoelectric properties of lead-based perovskite materials. In the next stage of our research, we will focus on this aspect.

Supplementary Materials

The following supporting information can be downloaded at https://www.mdpi.com/article/10.3390/app14219854/s1: S1a,b and S2a,b: The frequency dependence of the (a) real and (b) imaginary components of the impedance of PBZT 25/70/30 ceramics modified with lanthanum ions; S3a,b and S4a,b: Dependence of the lnRG(1/T) and lnRGB(1/T) of PBZT 25/70/30 ceramics doped with lanthanum.

Author Contributions

Conceptualization, M.A.-H.; methodology, M.A.-H.; results analysis, J.A.B., B.W.-D., K.O., and T.P.; investigation, M.A.-H., B.W.-D., and J.A.B.; data curation, M.A.-H., J.M., and R.P.; writing—original draft preparation, M.A.-H. and J.M.; writing—review and editing, M.A.-H., J.M., and K.O.; visualization, T.P. and M.A.-H.; supervision, M.A.-H.; project administration, M.A.-H.; funding acquisition, M.A.-H. All authors have read and agreed to the published version of the manuscript.

Funding

This research received no external funding.

Institutional Review Board Statement

Not applicable.

Informed Consent Statement

Not applicable.

Data Availability Statement

Data are contained within the article.

Conflicts of Interest

The authors declare no conflicts of interest.

References

  1. Li, G.; Wang, B.; Feng, W.; Wang, X.; Xian, W. Improved Interfacial Mechanical Properties between PZT Piezoelectric Ceramic and Ag Metallization Layer by In-Situ-Formed CuO Nanoparticles. J. Alloys Compd. 2024, 1005, 176057. [Google Scholar] [CrossRef]
  2. Butt, Z.; Pasha, R.A.; Qayyum, F.; Anjum, Z.; Ahmad, N.; Elahi, H. Generation of Electrical Energy Using Lead Zirconate Titanate (PZT-5A) Piezoelectric Material: Analytical, Numerical and Experimental Verifications. J. Mech. Sci. Technol. 2016, 30, 3553–3558. [Google Scholar] [CrossRef]
  3. Hernández-García, M.; Durr uthy-Rodríguez, M.D.; Costa-Marrero, J.; Calderón-Piñar, F.; Guerra, J.D.S.; Yañez-Limón, J.M. Photoluminescence in Pb0.95Sr0.05(Zr1−xTix)1−yCryO3 Ferroelectric Ceramic System. J. Appl. Phys. 2014, 116, 043510. [Google Scholar] [CrossRef]
  4. Siddiqui, M.; Mohamed, J.J.; Ahmad, Z.A. Structural, Piezoelectric, and Dielectric Properties of PZT-Based Ceramics without Excess Lead Oxide. J. Aust. Ceram. Soc. 2020, 56, 371–377. [Google Scholar] [CrossRef]
  5. Bhugra, H. Piezoelectric MEMS Resonators; Springer: Berlin, Germany, 2022. [Google Scholar]
  6. Luo, C.; Cao, G.Z.; Shen, I.Y. Development of a Lead-Zirconate-Titanate (PZT) Thin-Film Microactuator Probe for Intracochlear Applications. Sens. Actuators A Phys. 2013, 201, 1–9. [Google Scholar] [CrossRef]
  7. Zhang, Y.; Tang, M.; Wang, Y.; Liu, X.; Ren, X.; Xu, Z.; Yan, Y. Structural Characteristics and Crystalline Nature of PZT Powders Topochemically Synthesized from Needle-Like TiZrO4 Precursors. J. Alloys Compd. 2024, 1003, 175661. [Google Scholar] [CrossRef]
  8. Lin, C.-H.; Chou, A.-P. Modeling of Visco-Electro-Elastic Responses of PZT-Based Functionally Graded Beam Benders. Int. J. Solids Struct. 2024, 304, 113034. [Google Scholar] [CrossRef]
  9. Chen, C.; Wang, X.; Wang, Y.; Yang, D.; Yao, F.; Zhang, W.; Wang, B.; Sewvandi, G.A.; Yang, D.; Hu, D. Additive Manufacturing of Piezoelectric Materials. Adv. Funct. Mater. 2020, 30, 2005141. [Google Scholar] [CrossRef]
  10. Shung, K.K.; Cannata, J.M.; Zhou, Q.F. Piezoelectric Materials for High Frequency Medical Imaging Applications: A Review. J. Electroceram. 2007, 19, 141–147. [Google Scholar] [CrossRef]
  11. Bian, L.; Qi, X.; Li, K.; Fan, J.; Li, Z.; Sun, E.; Wang, Q.; Yang, Y. High-Performance Pb(Ni1/3Nb2/3)O3-PbZrO3-PbTiO3 Ceramics with the Triple Point Composition. J. Eur. Ceram. Soc. 2021, 41, 6983–6990. [Google Scholar] [CrossRef]
  12. Gao, X.; Wu, J.; Yu, Y.; Chu, Z.; Shi, H.; Dong, S. Giant Piezoelectric Coefficients in Relaxor Piezoelectric Ceramic PNN-PZT for Vibration Energy Harvesting. Adv. Funct. Mater. 2018, 28, 1706895. [Google Scholar] [CrossRef]
  13. Guo, F.; Zhang, S.; Long, W.; Fang, P.; Li, X.; Xi, Z. SnO2 Modified PNN-PZT Ceramics with Ultra-High Piezoelectric and Dielectric Properties. Ceram. Int. 2022, 48, 23241–23248. [Google Scholar] [CrossRef]
  14. Wang, S.; Li, X.; Wang, J.; Wu, X.; Li, L.; Zhang, J.; Zhang, Y.; Chen, Q. Enhanced Electromechanical Properties in MnCO3-Modified Pb(Ni,Nb)O3-PbZrO3-PbTiO3 Ceramics via Defect and Domain Engineering. J. Am. Ceram. Soc. 2023, 106, 1970–1980. [Google Scholar] [CrossRef]
  15. Wang, H.; Zhang, F.; Chen, Y.; Huang, C.; Wang, X.; Wu, X.; Lu, Y. Giant Piezoelectric Coefficient of PNN-PZT-Based Relaxor Piezoelectric Ceramics by Constructing an R-T MPB. Ceram. Int. 2021, 47, 12284–12291. [Google Scholar] [CrossRef]
  16. Pu, T.; Chen, H.; Xing, J.; Luo, Y.; Fan, S.; Liu, H.; Yang, Z. High Piezoelectricity of Low-Temperature Sintered Li2CO3-Added PNN-PZT Relaxor Ferroelectrics. J. Mater. Sci. Mater. 2022, 33, 4819–4829. [Google Scholar] [CrossRef]
  17. Guo, F.; Zhang, S.; Qiu, R.; Bai, W.; Zhou, H.; Chen, Y.; Yang, M. Dramatical Improvement in Temperature Stability of ZnO Modified PNN-PZT Ceramics via Synergistic Effect of Doping and Composite. Ceram. Int. 2023, 49, 18878–18885. [Google Scholar] [CrossRef]
  18. Shen, Z.Y.; Zhang, N.; Zhang, J.L.; Li, J.F. Enhanced Electromechanical Properties in La-Modified Pb(Zr,Ti)O3 Ceramics. J. Eur. Ceram. Soc. 2013, 33, 911–918. [Google Scholar]
  19. Kalem, V.; Çam, İ.; Timuçin, M. Dielectric and Piezoelectric Properties of PZT Ceramics Doped with Strontium and Lanthanum. Ceram. Int. 2011, 37, 1265–1275. [Google Scholar] [CrossRef]
  20. Deng, J.; Liu, C.; Wang, S.; Zhang, B.; Yan, T.; Han, Y.; Gong, W.; Liu, L. Enhanced Ferroelectric and Piezoelectric Properties of Sb/Nb Co-Doped BiScO3-PbTiO3-Based Ceramics via Relaxation Regulation near Morphotropic Phase Boundary. Mater. Res. Bull. 2024, 177, 112840. [Google Scholar] [CrossRef]
  21. Craciun, F.; Dimitriu, E.; Vasile, B.S.; Negrila, C.C.; Trusca, R.; Birjega, R.; Cernea, M. The Enhancement Mechanism of Dielectric Properties of Pb(Zr,Ti)O3 via (Mg2+,Sb3+) Incorporation for Supercapacitors. Mater. Today Chem. 2020, 18, 100350. [Google Scholar] [CrossRef]
  22. Peng, W.; Chang, J.; Zhao, J.; Wang, D.; Liu, Z.; Wang, G.; Dong, S. Enhanced Piezoelectric Properties and Thermal Stability of LiNbO3-Modified PNN–PZT Ceramics. J. Mater. 2024, 10, 995–1003. [Google Scholar] [CrossRef]
  23. Wang, C.; Ning, L.; Li, Y.; Li, F. MnCO3 Modified PMN-PZT Piezoelectric Ceramics with Enhanced Mechanical Quality Factor and Low Loss. Ceram. Int. 2024, 50, 10835–10842. [Google Scholar] [CrossRef]
  24. Du, J.; Qiu, J.; Zhu, K.; Ji, H.; Pang, X.; Luo, J. Effects of Fe2O3 Doping on the Microstructure and Piezoelectric Properties of 0.55Pb(Ni1/3Nb2/3)O3–0.45Pb(Zr0.3Ti0.7)O3 Ceramics. Mater. Lett. 2012, 66, 153–155. [Google Scholar] [CrossRef]
  25. Liu, H.; Nie, R.; Yue, Y.; Zhang, Q.; Chen, Q.; Zhu, J.; Yu, P.; Xiao, D.; Wang, C.; Wang, X. Effect of MnO2 Doping on Piezoelectric, Dielectric, and Ferroelectric Properties of PNN–PZT Ceramics. Ceram. Int. 2015, 41, 11359–11364. [Google Scholar] [CrossRef]
  26. Liu, W.; Zheng, T.; Ruan, X.; Man, Z.; Xue, H.; Jiang, L.; Zhang, F.; Li, G.; Wu, J. Synergy of Lead Vacancies and Morphotropic Phase Boundary to Promote High Piezoelectricity and Temperature Stability of PBZTN Ceramics. J. Mater. Sci. Technol. 2023, 137, 1–7. [Google Scholar] [CrossRef]
  27. Mesquita, A.; Michalowicz, A.; Mastelaro, V.R. Influence of Ba-Substitution on the Structural and Ferroelectric Properties of Pb1-xBaxZr0.40Ti0.60O3 Ceramic Materials. Phase Transit. 2012, 85, 8. [Google Scholar] [CrossRef]
  28. Bochenek, D.; Skulski, R.; Wawrzała, P.; Brzezińska, D. Dielectric Properties of Pb0.75Ba0.25(Zr0.65Ti0.35)1-zSnzO3 Ceramics. Ferroelectrics 2011, 418, 82–87. [Google Scholar] [CrossRef]
  29. Mesquita, A.; Michalowicz, A.; Moscovici, J.; Pizani, P.S.; Mastelaro, V.R. Relationship Between Ferroelectric Properties and Local Structure of Pb1-xBaxZr0.40Ti0.60O3 Ceramic Materials Studied by X-ray Absorption and Raman Spectroscopies. J. Solid State Chem. 2016, 240, 16–22. [Google Scholar] [CrossRef]
  30. Smolenskii, G.A.; Agranovskaya, A.I.; Krainik, N. Segnetoelektricheskie svoistva tverdykh rastvorov BaTiO3-PbZrO3. Dokl. Nauk SSSR 1953, 91, 55. [Google Scholar]
  31. Ikeda, T.J. Studies on (Ba-Pb)(Ti-Zr)O3 System. Phys. Soc. Jpn 1958, 14, 1959. [Google Scholar] [CrossRef]
  32. Li, G.; Heartling, G.H. Dielectric, ferroelectric and electric field-induced strain properties of (Pb1-xBax)(Zr1-yTiy)O3 ceramics. Ferroelectrics 1995, 166, 31–45. [Google Scholar] [CrossRef]
  33. Adamczyk, M.; Ujma, Z.; Hańderek, J. Relaxor behavior of La-modified ceramics. J. Appl. Phys. 2001, 89, 542–547. [Google Scholar] [CrossRef]
  34. Wodecka-Dus, B.; Adamczyk, M.; Osinska, K.; Plonska, M.; Czekaj, D. Dielectric properties of Ba1−xLaxTi1−x/4O3 ceramics with different La3+ content. Adv. Sci. Technol. 2012, 77, 35–40. [Google Scholar]
  35. Wodecka-Duś, B.; Płońska, M.; Czekaj, D. Synthesis, microstructure, and the crystalline structure of barium titanate ceramics doped with lanthanum. Arch. Metall. Mater. 2013, 2013, 1305–1308. [Google Scholar] [CrossRef]
  36. Goudarzi, H.; Baghshahi, S. The effect of lanthanum substitution on the sintering behavior and the dielectric and piezoelectric properties of niobium doped Pb(Zr0.95Ti0.05)O3 ceramics. J. Mater. Sci. Mater. Electron. 2016, 28, 4863–4870. [Google Scholar] [CrossRef]
  37. Kozielski, L.; Adamczyk, M.; Pilch, M. Comparison Study of Macro and Micro Scale AC and DC Conductivity Measurements with Impedance Spectroscopy and Atomic Force Microscopy Techniques Applied in PBZT Ceramics. Ceram. Int. 2012, 38, 3105–3109. [Google Scholar] [CrossRef]
  38. Triyono, D.; Fitria, S.N.; Hanifah, U. Dielectric Analysis and Electrical Conduction Mechanism of La1−xBixFeO3 Ceramics. RSC Adv. 2020, 31, 18323. [Google Scholar] [CrossRef]
  39. Dutta, S.; Choudhary, R.N.P.; Sinha, P.K. Impedance Spectroscopy Studies on Fe3+ Ion Modified PLZT Ceramics. Ceram. Int. 2007, 33, 13–20. [Google Scholar] [CrossRef]
  40. Park, J.-H.; Choi, B.-C. Impedance Spectroscopy of (Pb0.98La0.02)(Zr0.95Ti0.05)O3(PLZT-2/95/5) Ceramics above Ferroelectric Phase Transition Temperatures. J. Cryst. Growth 2005, 276, 465–470. [Google Scholar] [CrossRef]
  41. Kumari, L.K.; Prasad, K.; Choudhary, R.N.P. Impedance spectroscopy of (Na0.5Bi0.5)(Zr0.25Ti0.75)O3 lead-free ceramic. J. Alloys Compd. 2008, 453, 325–331. [Google Scholar]
  42. Bauerle, J.E. Study of solid electrolyte polarization by a complex admittance method. J. Phys. Chem. Solids 1969, 30, 2657–2670. [Google Scholar] [CrossRef]
  43. Vasudevan, S.; Tharani, S.D.; Manickam, M.; Sivasubramanian, R. A sol-gel derived LaCoO3 perovskite as an electrocatalyst for Al-air batteries. Dalton Trans. 2024, 53, 3713–3721. [Google Scholar] [CrossRef] [PubMed]
  44. Parida, B.N.; Das, P.R.; Padhee, R.; Choudhary, R.N.P. Synthesis and Characterization of a Tungsten Bronze Ferroelectric Oxide. Adv. Mater. Lett. 2012, 3, 231–238. [Google Scholar] [CrossRef]
  45. Sahoo, S.; Choudhary, R.N.P.; Mathur, B.K. Structural, Ferroelectric and Impedance Spectroscopy Properties of Y3+ Modified Pb(Fe0.5Nb0.5)O3 Ceramics. Phys. B Condens. Matter 2011, 406, 1660–1664. [Google Scholar] [CrossRef]
  46. Achary, P.G.R.; Dehury, S.K.; Choudhary, R.N.P. Structural, Electrical and Dielectric Properties of Double Perovskites: BiHoZnZrO6 and BiHoCuTiO6. J. Mater. Sci. Mater. Electron. 2018, 29, 6805–6816. [Google Scholar] [CrossRef]
  47. Schmidt, R. Impedance spectroscopy of electroceramics. In Ceramic Materials Research Trends; Lin, P.B., Ed.; Nova Science Publishers: New York, NY, USA, 2006; pp. 321–351. [Google Scholar]
  48. Chen, P.-Y.; Chou, C.-C.; Tseng, T.-Y.; Chen, H. Correlation of microstructures and conductivities of ferroelectric ceramics using complex impedance spectroscopy. Jpn. J. Appl. Phys. 2010, 49, 061505. [Google Scholar] [CrossRef]
  49. Ujma, Z.; Adamczyk, M.; Hańderek, J. Relaxor Properties of (Pb0.75Ba0.25)(Zr0.70Ti0.30)O3 Ceramics. J. Eur. Ceram. Soc. 1998, 18, 2201–2207. [Google Scholar] [CrossRef]
  50. Haertling, G.H. PLZT Electrooptic Materials and Applications—A Review. Ferroelectrics 1987, 75, 25–55. [Google Scholar] [CrossRef]
  51. Haertling, G.H. Ceramic Materials for Electronics. In Ceramic Materials for Electronics; Buchanan, R.C., Ed.; Marcel Dekker: New York, NY, USA, 1991; Chapter 3. [Google Scholar]
Figure 1. The flowchart of the fabrication process of La-doped (Pb0.75Ba0.25)(Zr0.70Ti0.30)O3 ceramics.
Applsci 14 09854 g001
Figure 2. The results of XRD studies for PBZT-25/70/30 ceramics doped with La3+ at concentrations x = 1 at.%, x = 2 at.%, x = 3 at.%, and x = 4 at.%. The right panel shows a magnification of the peaks at 2θ = 64°. For reference, the top and bottom panels depict standard PDF2/COD XRD patterns for rhombohedral PZT and cubic PBZT.
Applsci 14 09854 g002
Figure 3. SEM image and gain size distribution diagrams of PBZT-25/70/30 ceramics doped with La3+ at concentrations x = 1 at.%, x = 2 at.%, x = 3 at.%, and x = 4 at.%.
Applsci 14 09854 g003
Figure 4. EDS spectrum of PBZT-25/70/30 ceramics doped with La3+ at concentration x = 1 at.%.
Applsci 14 09854 g004
Figure 5. The frequency dependence of the real and imaginary components of the impedance of PBZT 25/70/30 ceramics modified with lanthanum ions.
Applsci 14 09854 g005
Figure 6. Nyquist plots for the lanthanum-modified PBZT 25/70/30 ceramics in the temperature range of 703–823 K.
Applsci 14 09854 g006
Figure 7. The equivalent circuit used for describing lanthanum-ion-modified PBZT 25/70/30 ceramics.
Applsci 14 09854 g007
Figure 8. Dependence of the lnRG(1/T) and lnRGB(1/T) of PBZT 25/70/30 ceramics doped with lanthanum.
Applsci 14 09854 g008
Figure 9. (a) The natural logarithm of electric conductivity vs. inverse temperature for the undoped and La-modified PBZT 25/70/30 ceramics. (b) The activation energy of DC conductivity as a function of lanthanum dopant concentration.
Applsci 14 09854 g009
Table 1. The results of structural investigations derived from Rietveld refinement of XRD data.
SampleCrystal SystemSpace GroupLattice Param. [A]Contrib.
[wt. % ]
PBZTrhombohedral
(hex. axes)
R3ca = 5.8155
c = 14.279
100
x = 1 at.% Larhombohedral
(hex. axes)
R3ca = 5.8069
c = 14.285
100
x = 2 at.% Larhombohedral
(hex. axes)
R3ca = 5.8070
c = 14.285
100
x = 3 at.% LacubicPm-3ma = 4.105670.0
rhombohedral
(hex. axes)
R3ca = 5.8169
c = 14.290
30.0
x = 4 at.% LacubicPm-3ma = 4.105771.1
rhombohedral
(hex. axes)
R3ca = 5.8170
c = 14.290
28.9
Table 2. Parameters of the components of the applied electrical circuit for the impedance response of the lanthanum-modified PBZT 25/70/30 ceramics.
ElementParameterSamples
x = 1 at.% Lax = 2 at.% Lax = 3 at.% Lax = 4 at.% La
RGValue [Ω]8.90 × 1057.73 × 1052,487,4002.14 × 106
Absolute error [Ω]258925902.85 × 10546,909
Relative error [%]0.290.3411.452.19
CPE-TGValue [F]1.13 × 10−81.61 × 10−83.80 × 10−71.39 × 10−7
Absolute error [F]2.69 × 10−105.05 × 10−102.68 × 10−83.86 × 10−9
Relative error [%]2.393.137.052.79
CPE-PGValue [a.u.]0.540.440.240.34
Absolute error [a.u.]0.0030.0030.0080.004
Relative error [%]0.580.733.171.1876
CGValue [F]5.90 × 10−104.36 × 10−108.25 × 10−107.58 × 10⁻¹⁰
Absolute error [F]2.37 × 10−121.59 × 10−131.36 × 10−116.46 × 10⁻¹²
Relative error [%]0.400.041.650.85219
RGBValue [Ω]23,2013.69 × 105163,960353,410
Absolute error [Ω]954327077624187
Relative error [%]4.1150.884.731.19
CPE-TGBValue [F]4.03 × 10−93.26 × 10−82.64 × 10−91.11 × 10−9
Absolute error [F]1.08 × 10−103.27 × 10−101.43 × 10−101.44 × 10⁻¹¹
Relative error [%]2.691.015.411.30
χ 2 1.53 × 10−57.45 × 10−64.8 × 10−59.89 × 10−6
Table 3. Activation energy for lanthanum-doped PBZT ceramics.
SamplesEaG [eV]EaGB [eV]
x = 1 at.% La1.230.83
x = 2 at.% La1.590.8
x = 3 at.% La2.050.66
x = 4 at.% La1.820.6
Disclaimer/Publisher’s Note: The statements, opinions and data contained in all publications are solely those of the individual author(s) and contributor(s) and not of MDPI and/or the editor(s). MDPI and/or the editor(s) disclaim responsibility for any injury to people or property resulting from any ideas, methods, instructions or products referred to in the content.

