Article

Ship Type Selection and Cost Optimization of Marine Container Ships Based on Genetic Algorithm

1
School of Transportation and Logistics Engineering, Wuhan University of Technology, Wuhan 430063, China
2
School of Management, Wuhan Institute of Technology, Wuhan 430205, China
*
Author to whom correspondence should be addressed.
Appl. Sci. 2024, 14(21), 9816; https://doi.org/10.3390/app14219816
Submission received: 5 September 2024 / Revised: 19 October 2024 / Accepted: 24 October 2024 / Published: 27 October 2024
(This article belongs to the Section Marine Science and Engineering)

Abstract

:
In the context of the deep-sea transportation supply chain, this paper addresses the complex decision-making problem of vessel allocation and carbon emission optimization for container shipping routes. A bi-level programming model is established, with the upper level aiming to minimize the total operational cost and the lower level focusing on minimizing carbon emissions. Using an example of an operator with five different types of vessels, a genetic algorithm is employed to determine the optimal vessel allocation scheme. The results indicate that the vessel allocation scheme obtained through multiple iterations of the model effectively reduces both carbon emissions and operational costs. Under the condition that the preset labor cost increases year by year, the use of model optimization can significantly reduce the growth of total operating costs. This paper provides theoretical support and practical guidance for shipping companies aiming to optimize decision-making in order to reduce operational costs and carbon emissions.

1. Introduction

A low-carbon economy is a growth model characterized by low energy consumption, low pollution, and low emissions, aimed at addressing climate change and achieving sustainable development. It is considered a major advancement in human society following agricultural and industrial civilizations. The shipping industry, which is responsible for about 90% of global trade transport, has emissions that are mobile, boundaryless, and cross-regional. Therefore, achieving low-carbon development in shipping requires unique approaches. Within the deep-sea transportation supply chain system, the optimization of the allocation of different types of vessels to various shipping routes involves meeting the technical and operational requirements of each route while ensuring optimal economic benefits for the entire fleet. This is a key optimization decision problem.
The problem of vessel allocation for shipping routes has been continuously evolving and has attracted widespread research attention. Current research focuses primarily on constructing and solving models for route allocation and speed optimization, and on studies considering the impact of carbon reduction policies. In terms of constructing models and algorithms for route allocation and speed optimization, Meng et al. [1,2,3] provided a systematic review of the liner service vessel allocation problem. They developed mixed-integer linear programming models considering factors such as container trans-shipment, demand uncertainty, empty container repositioning, speed optimization, and vessel reallocation. Meng et al. [4] further summarized the container liner route allocation problem and developed mixed-integer linear or nonlinear programming models from ten different research perspectives. Ng et al. [5] relaxed the assumption of normally distributed demand due to the difficulty in obtaining demand distribution functions, describing demand uncertainty through means, variances, and upper bounds, and established a route allocation model. Ng et al. [6] further relaxed the requirement for demand information inputs, describing uncertainty with only means and variances, and considering the stochastic dependence of transport demand between different routes, expanding the application conditions of route allocation models under uncertain demand. Ng [7] improved existing route allocation models by introducing an incomplete voyage representation and changing one decision variable from complete voyage count to port call count. Verification through examples showed that the new model effectively reduced costs. Bukljaš-M et al. [8] focused on uncertainty in container liner transportation, proposing an integrated optimization tool that combines mathematical models, metaheuristic algorithms, and computer programs to minimize costs and maximize customer demand satisfaction. Gelareh et al. [9] studied the optimization of short-term liner vessel speed and route allocation, establishing a mixed-integer nonlinear route allocation and speed optimization model by integrating optimal vessel speed with sailing time. Sheng et al. [10] aimed to minimize operational costs, constructing a mixed-integer convex optimization model with ship speed as a continuous decision variable and fleet size as an integer decision variable. Wu et al. [11] introduced the Energy Efficiency Operational Indicator (EEOI) and developed a bi-objective optimization model for route allocation, route planning, and speed optimization with the goals of minimizing total weekly operational cost and average EEOI. Ronen [12] found that the fuel consumption of liners is almost proportional to the cube of sailing speed. Wang et al. [13] unified route allocation and speed optimization issues, establishing a joint optimization model with the objectives of minimizing total operating cost or maximizing total profit. Gelareh et al. [9] further studied the optimization problem of short-term liner vessel speed and route allocation, linking optimal speed with optimal sailing time for different routes and constructing a mixed-integer nonlinear programming model. Pierre Cariou [14] analyzed the emission reduction effects of lowering vessel speed under different vessel types and route conditions, noting that when the price of heavy fuel oil exceeds the breakeven point (i.e., USD 260–470 per ton), container liner fleets tend to reduce speed, resulting in a 11% reduction in CO2 emissions within two years. Norstad et al. [15] introduced sailing speed as a decision variable to construct a new route allocation model. Dong-Ping Song et al. [16] studied the joint tactical planning problem of vessel numbers, maximum planned speed, and liner service plans, establishing relationships between objectives and decision variables and proposing a non-dominated sorting genetic algorithm.
Regarding studies on route allocation under carbon reduction policies, with more and more attention being paid to environmental protection, carbon reduction has become an inevitable part of various transportation behaviors. Lindstad et al. [17] analyzed three emission reduction measures—installing scrubbers, using distillate oil, and switching to low-sulfur fuel—based on annual fuel consumption for different vessel types and operating modes. Xiao [18] proposed a bi-level programming model for deep-sea container vessel operations, converting carbon emissions into carbon taxes with the aim of minimizing vessel operating costs. Wang et al. [19] studied speed optimization issues considering vessel carbon emissions, demurrage fees, and vessel scheduling, establishing speed optimization models under three different forms of carbon tax and verifying the model’s effectiveness through examples. Chen et al. [20] examined optimal order quantities and transport mode selection under different carbon reduction policies, considering customer demand uncertainty. Chang et al. [21] analyzed the main factors influencing shipping companies’ implementation of green shipping through structural equation modeling and explored the effects of green shipping on environmental and economic performance. Zhu et al. [22] proposed a stochastic programming model for route allocation, constructing 12 scenarios with different carbon prices to analyze the impact of maritime carbon emission trading policies on container fleet deployment and carbon emissions. Xing et al. [23] studied the route allocation and speed optimization problem under carbon tax and carbon cap policies, establishing a nonlinear programming model with the objective of minimizing weekly operational costs.
Despite extensive research on route allocation, including aspects such as speed optimization, vessel allocation, and carbon reduction strategies, several key areas still lack comprehensive investigation. Firstly, most current research often separates ship type selection and cargo allocation, ignoring their interdependencies. The complex relationship between vessel type selection and cargo allocation is crucial for optimizing route allocation but lacks systematic study. Secondly, while the impact of carbon emission policies on shipping operations has been acknowledged, research on bi-level programming models that simultaneously aim to minimize company operational costs and carbon emissions under carbon emission policy contexts is still limited. Particularly, integrating upper-level operational cost minimization with lower-level carbon emission optimization using energy efficiency indices is rare. Therefore, the challenge of effectively modeling and solving joint optimization of vessel type selection and cargo allocation while balancing cost and carbon emission goals remains an area for further exploration.
In response to these gaps, this paper proposes a bi-level programming model for vessel selection in different container liner routes to analyze route allocation optimization under carbon reduction policies. The upper-level programming aims to minimize the company’s operational costs across long-distance routes, while the lower-level programming focuses on minimizing carbon emissions. Carbon emissions in the lower-level programming are calculated based on the vessel’s energy efficiency index. Given the inter-relationship between cargo allocation and vessel type selection, the model integrates these aspects, treating cargo allocation quantities and vessel type selection as decision variables and addressing vessel selection and cargo allocation optimization with constraints to minimize cost and carbon emissions in a single transport task. Finally, a genetic algorithm is designed to solve the model and verify its effectiveness through specific examples, aiming to achieve optimized operational costs and reduced carbon emissions. This paper provides theoretical support for shipping companies in making route allocation decisions under carbon reduction policies. The structure of the paper is as follows: Section 2 introduces the development process of the bi-level programming model, detailing the model’s assumptions and variable definitions, proposing a genetic algorithm-based solution method, and designing the related algorithm steps. Section 3 validates the model’s effectiveness through example analysis. Section 4 summarizes the main conclusions of the study and suggests directions for future research.

2. Establishment of the Bi-Level Programming Model

2.1. Assumptions and Variable Descriptions

In the context of international cargo transportation services provided by container liner shipping companies, the choice of ship type is typically based on cost optimization, aiming for rapid capital accumulation. However, with the increasing competition in the international shipping industry, especially in the contexts of the global production chain becoming more globalized and industrial decarbonization, the shipping industry must not only optimize operational costs but also ensure that carbon emissions meet national carbon neutrality and peak carbon emission requirements. To stand out in future high-standards competition and achieve sustainable development, container liner shipping companies must consider not only economic efficiency and cost reduction but also environmental concerns and the reduction of carbon emissions from large cargo ships. To address this, this paper employs a bi-level programming model for analysis. The upper-level programming (U) aims to minimize the operational cost of a single cargo transport task for the container liner shipping company, focusing on streamlining international cargo transport services. The lower-level programming (L) aims to minimize the carbon emissions of a single transport task, aiming to enhance customer satisfaction through optimized logistics services. The hierarchical structure of the bi-level programming model reflects the mutual influence between the upper and lower levels, and through multiple iterations, an optimal solution integrating cost and service quality is obtained [24]. The basic assumptions are as follows:
  • The international cargo transport service covers only transportation and simple value-added services (e.g., sorting, packing, etc.), and costs are calculated per container.
  • Logistics service costs consist only of fixed costs, transportation costs, and value-added service costs, with fixed unit prices for transportation and value-added services.
  • Different types of ships used by the shipping company correspond to fixed routes.
  • The transportation cost of logistics business is related only to the unit transportation cost of the ship and the shipment volume, while the value-added service cost is related only to the handling volume.
The Settings of parameter variables are shown in Table 1.

2.2. Constraints

(1)
Transport Cost in for Single Shipping Task for the Shipping Company
The transport cost is primarily influenced by the assigned cargo volume and the sailing distance of different ship types on their respective routes. The formula for transport cost F1 is as follows:
F 1 = i = 1 n λ i α i κ i x i
(2)
Value-Added Service Cost for a Single Shipping Task for the Shipping Company
When a ship docks at various ports for loading, unloading, sorting, and handling cargo, value-added service costs are incurred. Therefore, the value-added service cost is related to the assigned cargo volume. The formula for value-added service cost F2 is as follows:
F 2 = i = 1 n λ i β i x i
(3)
Fixed Cost in a Single Shipping Task for the Shipping Company
Due to the different types of ships purchased by the shipping company, the depreciation and other fixed costs vary by ship type. Thus, the fixed cost is only related to the type of ship. The formula for fixed cost F3 is as follows:
F 3 = i = 1 n λ i η i
(4)
C O 2 Emissions Generated by Completing a Single Order
Different ship types procured by the shipping company have corresponding Energy Efficiency Design Index (EEDI) values. Therefore, C O 2 emissions can be calculated based on the EEDI coefficient, the cargo transport distance, and the cargo load of the ship. The total C O 2 emissions X for an order can be calculated using the following formula:
X = i = 1 n EEDI i λ i κ i x i
(5)
Total Operating Cost of the Shipping Company
The total operating cost of a single transport mission for the shipping company consists of three parts: transport cost, value-added service cost, and the fixed cost corresponding to different ship types. The formula for the total cost F is as follows:
F = i = 1 n λ i α i κ i x i + i = 1 n λ i β i x i + i = 1 n λ i η i

2.3. Objective Function
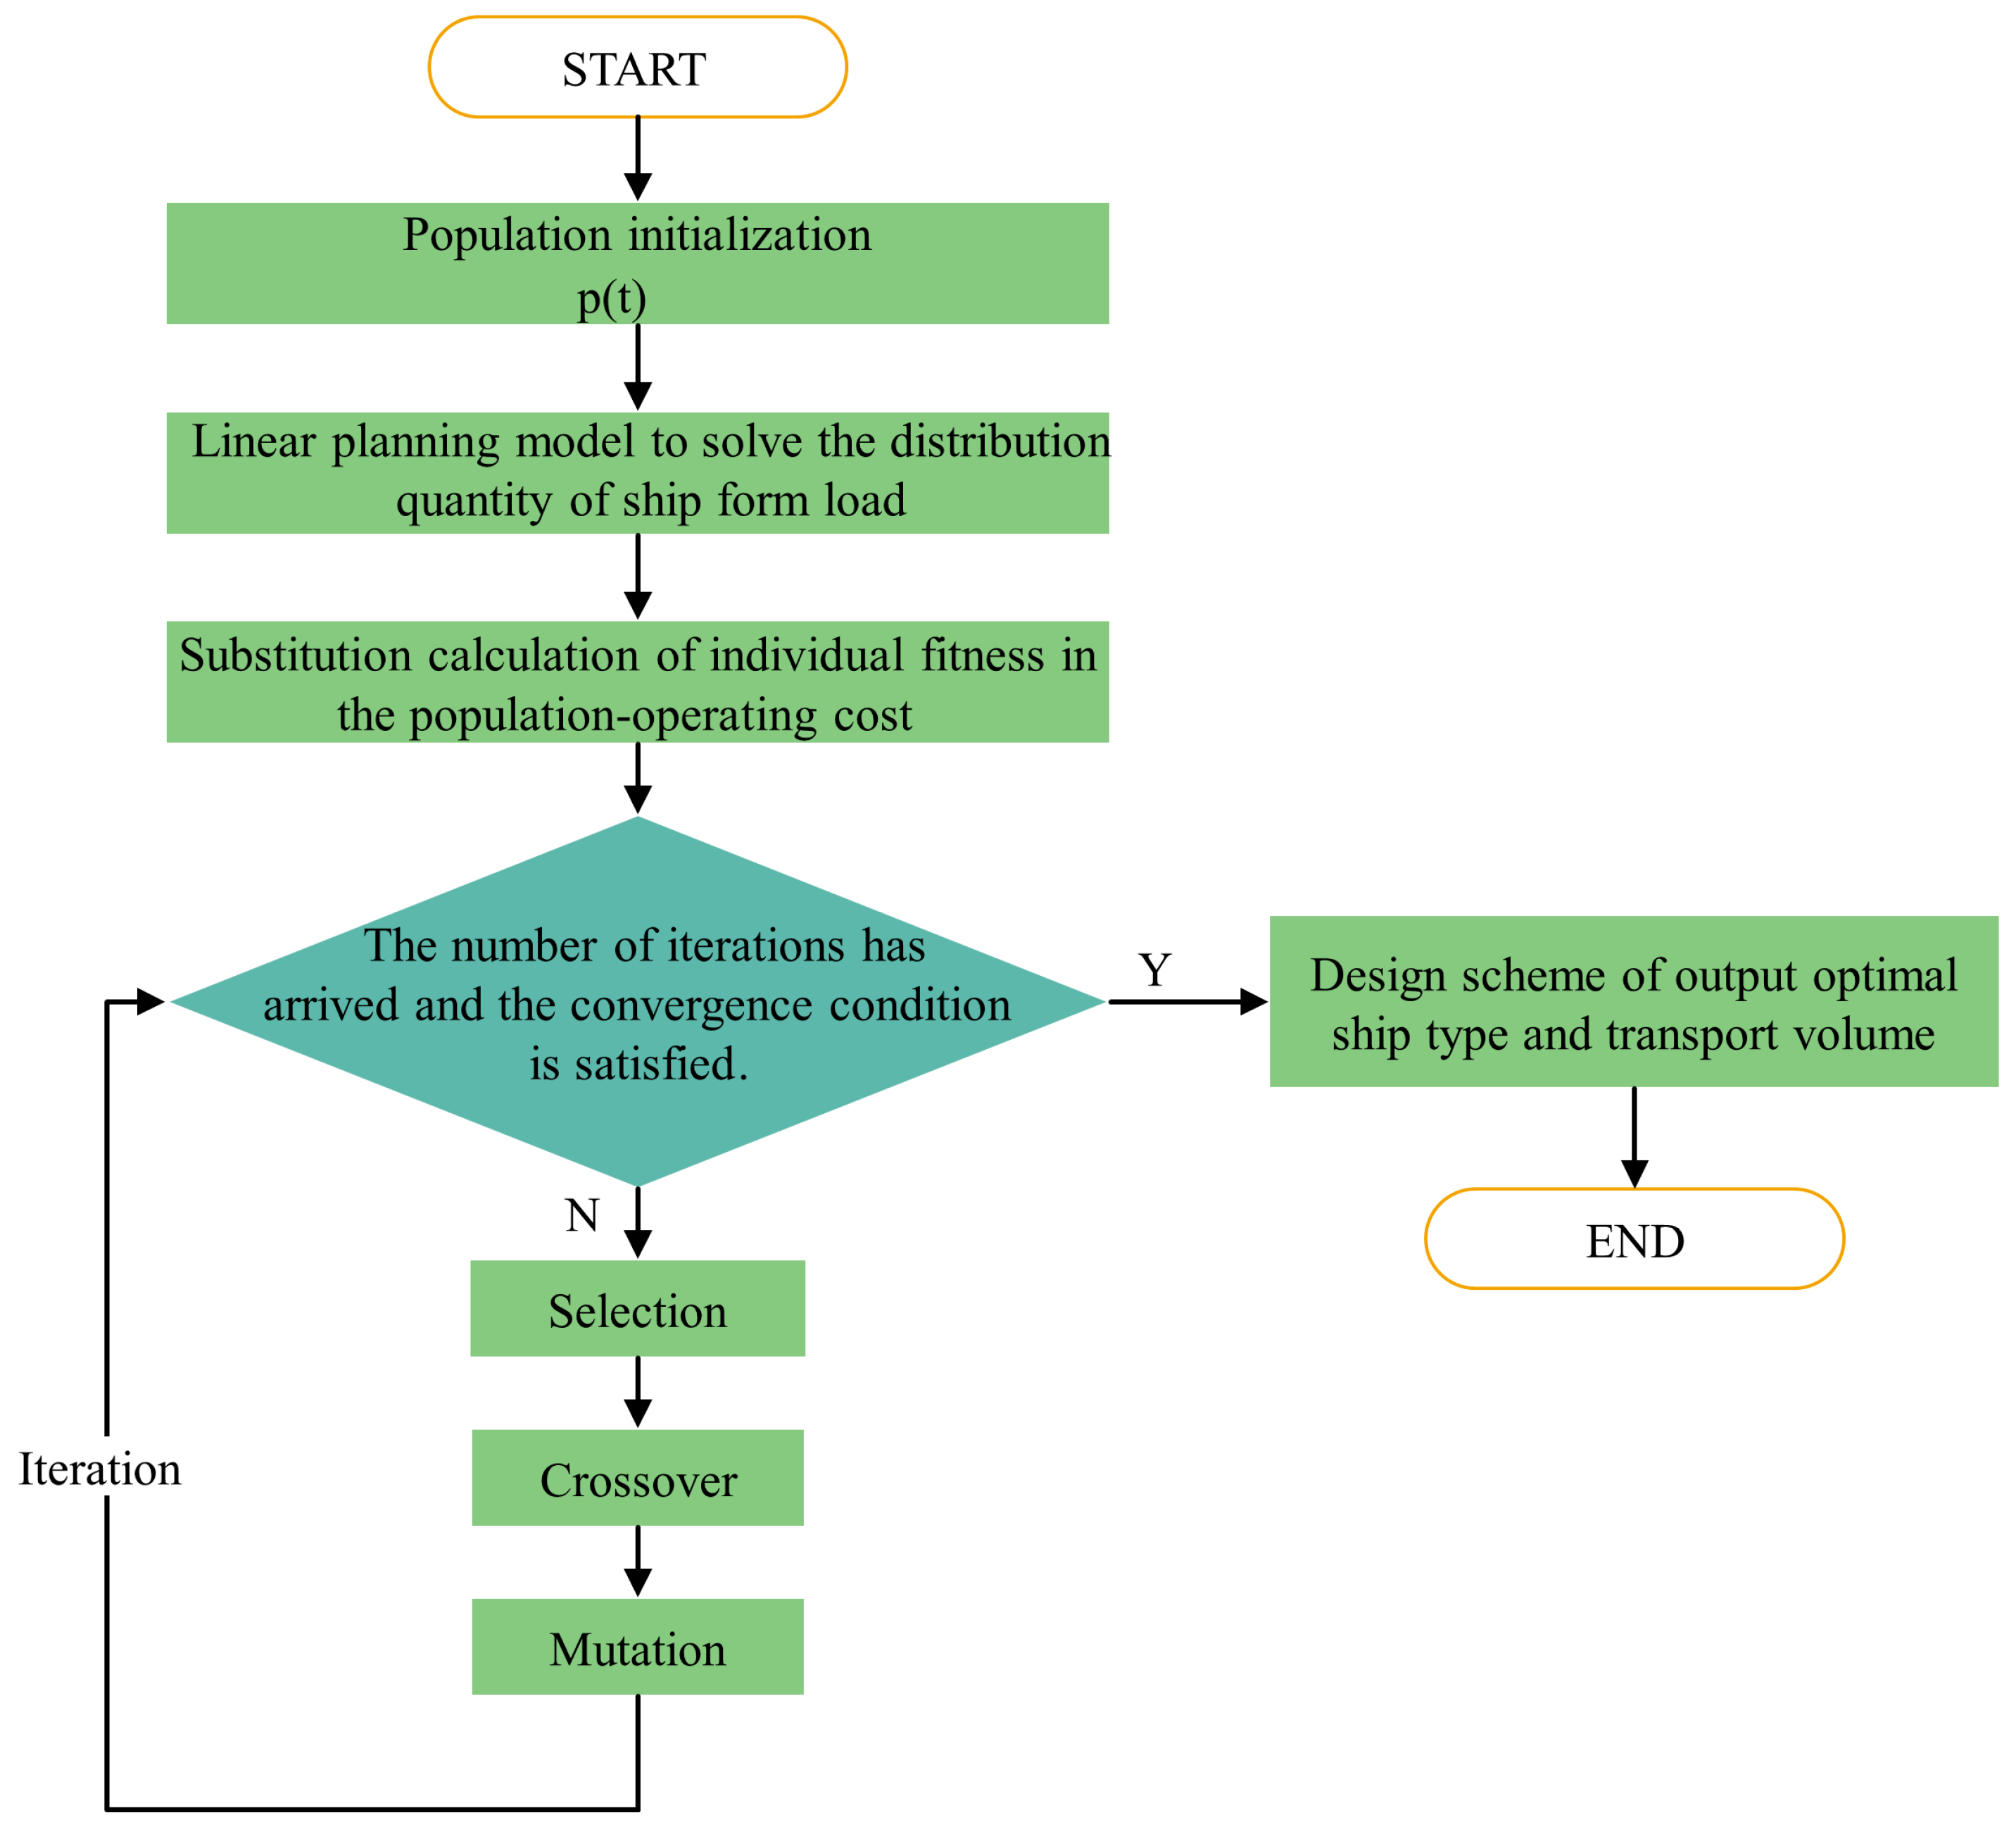
Based on the above analysis, a bi-objective bi-level programming model can be established. The upper-level programming aims to minimize the operating costs of the company’s ocean routes, while the lower-level programming aims to minimize carbon emissions. The objective function of the upper-level programming is as follows:
F = + , i = 1 n λ i = 0 , i { 1 , 2 , , n } i = 1 n λ i α i κ i x i + i = 1 n λ i β i x i + i = 1 n λ i η i , i = 1 n λ i 0 , i { 1 , 2 , , n }
From the above formula, it can be observed that when the shipping company’s ship type allocation plan derived from the lower-level decision-making function has no solution, the cost is considered infinite. This definition is intended to exclude cases with no solutions for the lower-level decisions from the optimal cost plan, allowing for the derivation of the lowest cost under the optimal ship type selection. Since the lower-level programming directly targets carbon emissions as its objective function, the objective function of the lower-level programming is represented by Equation (4).
The constraints are as follows:
s . t . x i λ i w i , i { 1 , 2 , , n } i = 1 n x i λ i = 4000 , i { 1 , 2 , , n }

2.4. Model Solution

For the bi-level planning model discussed in this paper, we first analyze the lower-level planning model: based on the objective function of minimizing carbon emissions, the coefficients of the objective function correspond to the ship’s EEDI (Energy Efficiency Design Index), the 0–1 variable for ship type selection, the distance that ship type i provides logistics services to the destination, and the quantity of logistics transported by ship type i . Among these variables, all except the 0–1 variable for ship type selection and the logistics transportation quantity assigned to ship type i are constants. The 0–1 variable for ship type selection is derived from the optimal planning model for minimizing the upper-level shipping company’s costs. In summary, this model can be solved through linear planning.
The ship type selection plan is solved using a genetic algorithm. The overall algorithm design for the bi-level programming model in this paper is shown in Figure 1.
(1)
Encoding Strategy
Using a binary encoding strategy, let λ = λ 1 , λ 2 , λ 3 , , λ n represent a chromosome, where each λ i is a 0–1 variable. If a ship type is assigned to a route, λ i is 1; otherwise, it is 0. Each random sequence corresponds to an individual in the population. For example, if λ = 0 , 1 , 1 , 0 , 1 , 0 , 0 , it represents that the company selects ship types 2, 3, and 5 to complete the current voyage.
(2)
Random Initialization of Population
Set the total number of individuals in each generation N and the maximum number of generations T . Use the decision variable λ = λ 1 , λ 2 , λ 3 , , λ n as the chromosome encoding, and randomly generate N initial individuals to form the initial population p 0 .
(3)
Fitness Calculation
Based on the constraint conditions and the upper-level planning target function, calculate the transportation scheme for the company’s current voyage corresponding to the ship type configuration. Let X i = x 1 , x 2 , x 3 , , x n represent the solution for each individual. The fitness of each individual is then calculated, which corresponds to the shipping cost:
F = i = 1 n λ i α i κ i x i + i = 1 n λ i β i x i + i = 1 n λ i η i
(4)
Selection of crossover operation
Our crossover operation adopts a single-point crossover. The design is as follows: For two selected parent genotypes λ 1 = λ 1 , λ 2 , λ 3 , , λ n , λ 2 = λ 1 , λ 2 , λ 3 , , λ n , we randomly select the t -th gene as the crossover point. After the crossover operation, the child genotypes obtained are S 1 and S 2 . The genes of S 1 before the crossover point come from the first t genes of λ 1 , and after the crossover point come from the last n t genes of λ 2 . Similarly, the genes of S 2 before the crossover point come from the first t genes of λ 2 , and after the crossover point come from the last n t genes of λ 1 . For example:
λ 1 = ( 0 , 1 , 0 , 1 , 0 , 1 , 0 , 1 ) , λ 2 = ( 1 , 1 , 0 , 1 , 0 , 0 , 0 , 1 )
If the crossover point is set at the fourth gene position, then:
λ 1 = ( 0 , 1 , 0 , 1 , 0 , 0 , 0 , 1 ) , λ 2 = ( 1 , 1 , 0 , 1 , 0 , 1 , 0 , 1 )
There are many different ways to perform crossover operations, and we should try to choose the best crossover method to ensure that the offspring can inherit the favorable traits of the parents. At the same time, this crossover operation also acts as a mutation operation.
(5)
Mutation Operation
Mutation is also a method to achieve population diversity, and at the same time, it is a guarantee for global optimization. The specific design is as follows: according to the given mutation rate, for the selected individual, three integers are randomly selected, satisfying 1 < u < v < w < 7 , and the segment of genes between u and v (including u and v ) is inserted behind w .
(6)
First termination condition judgment
The population p t passes through selection, crossover, and mutation operations to obtain the next-generation population p t + 1 . If t > T , then the individual with the maximum fitness obtained during the evolutionary process has λ t + 1 = λ 1 , λ 2 , λ 3 , , λ n as the optimal solution. This will be brought into the next-level planning to calculate X t + 1 = x 1 , x 2 , x 3 , , x n , and the algorithm will stop. The optimal solution λ and X are output, and the optimal value is calculated.
(7)
Second termination condition judgment
Substitute λ t + 1 into the next-level planning, calculate X t + 1 = x 1 , x 2 , x 3 , , x n , and stop the algorithm when the solution meets the constraints of the optimization problem. Output the optimal solution λ t + 1 = λ 1 , λ 2 , λ 3 , , λ n and X t + 1 = x 1 , x 2 , x 3 , , x n , and calculate the optimal value.

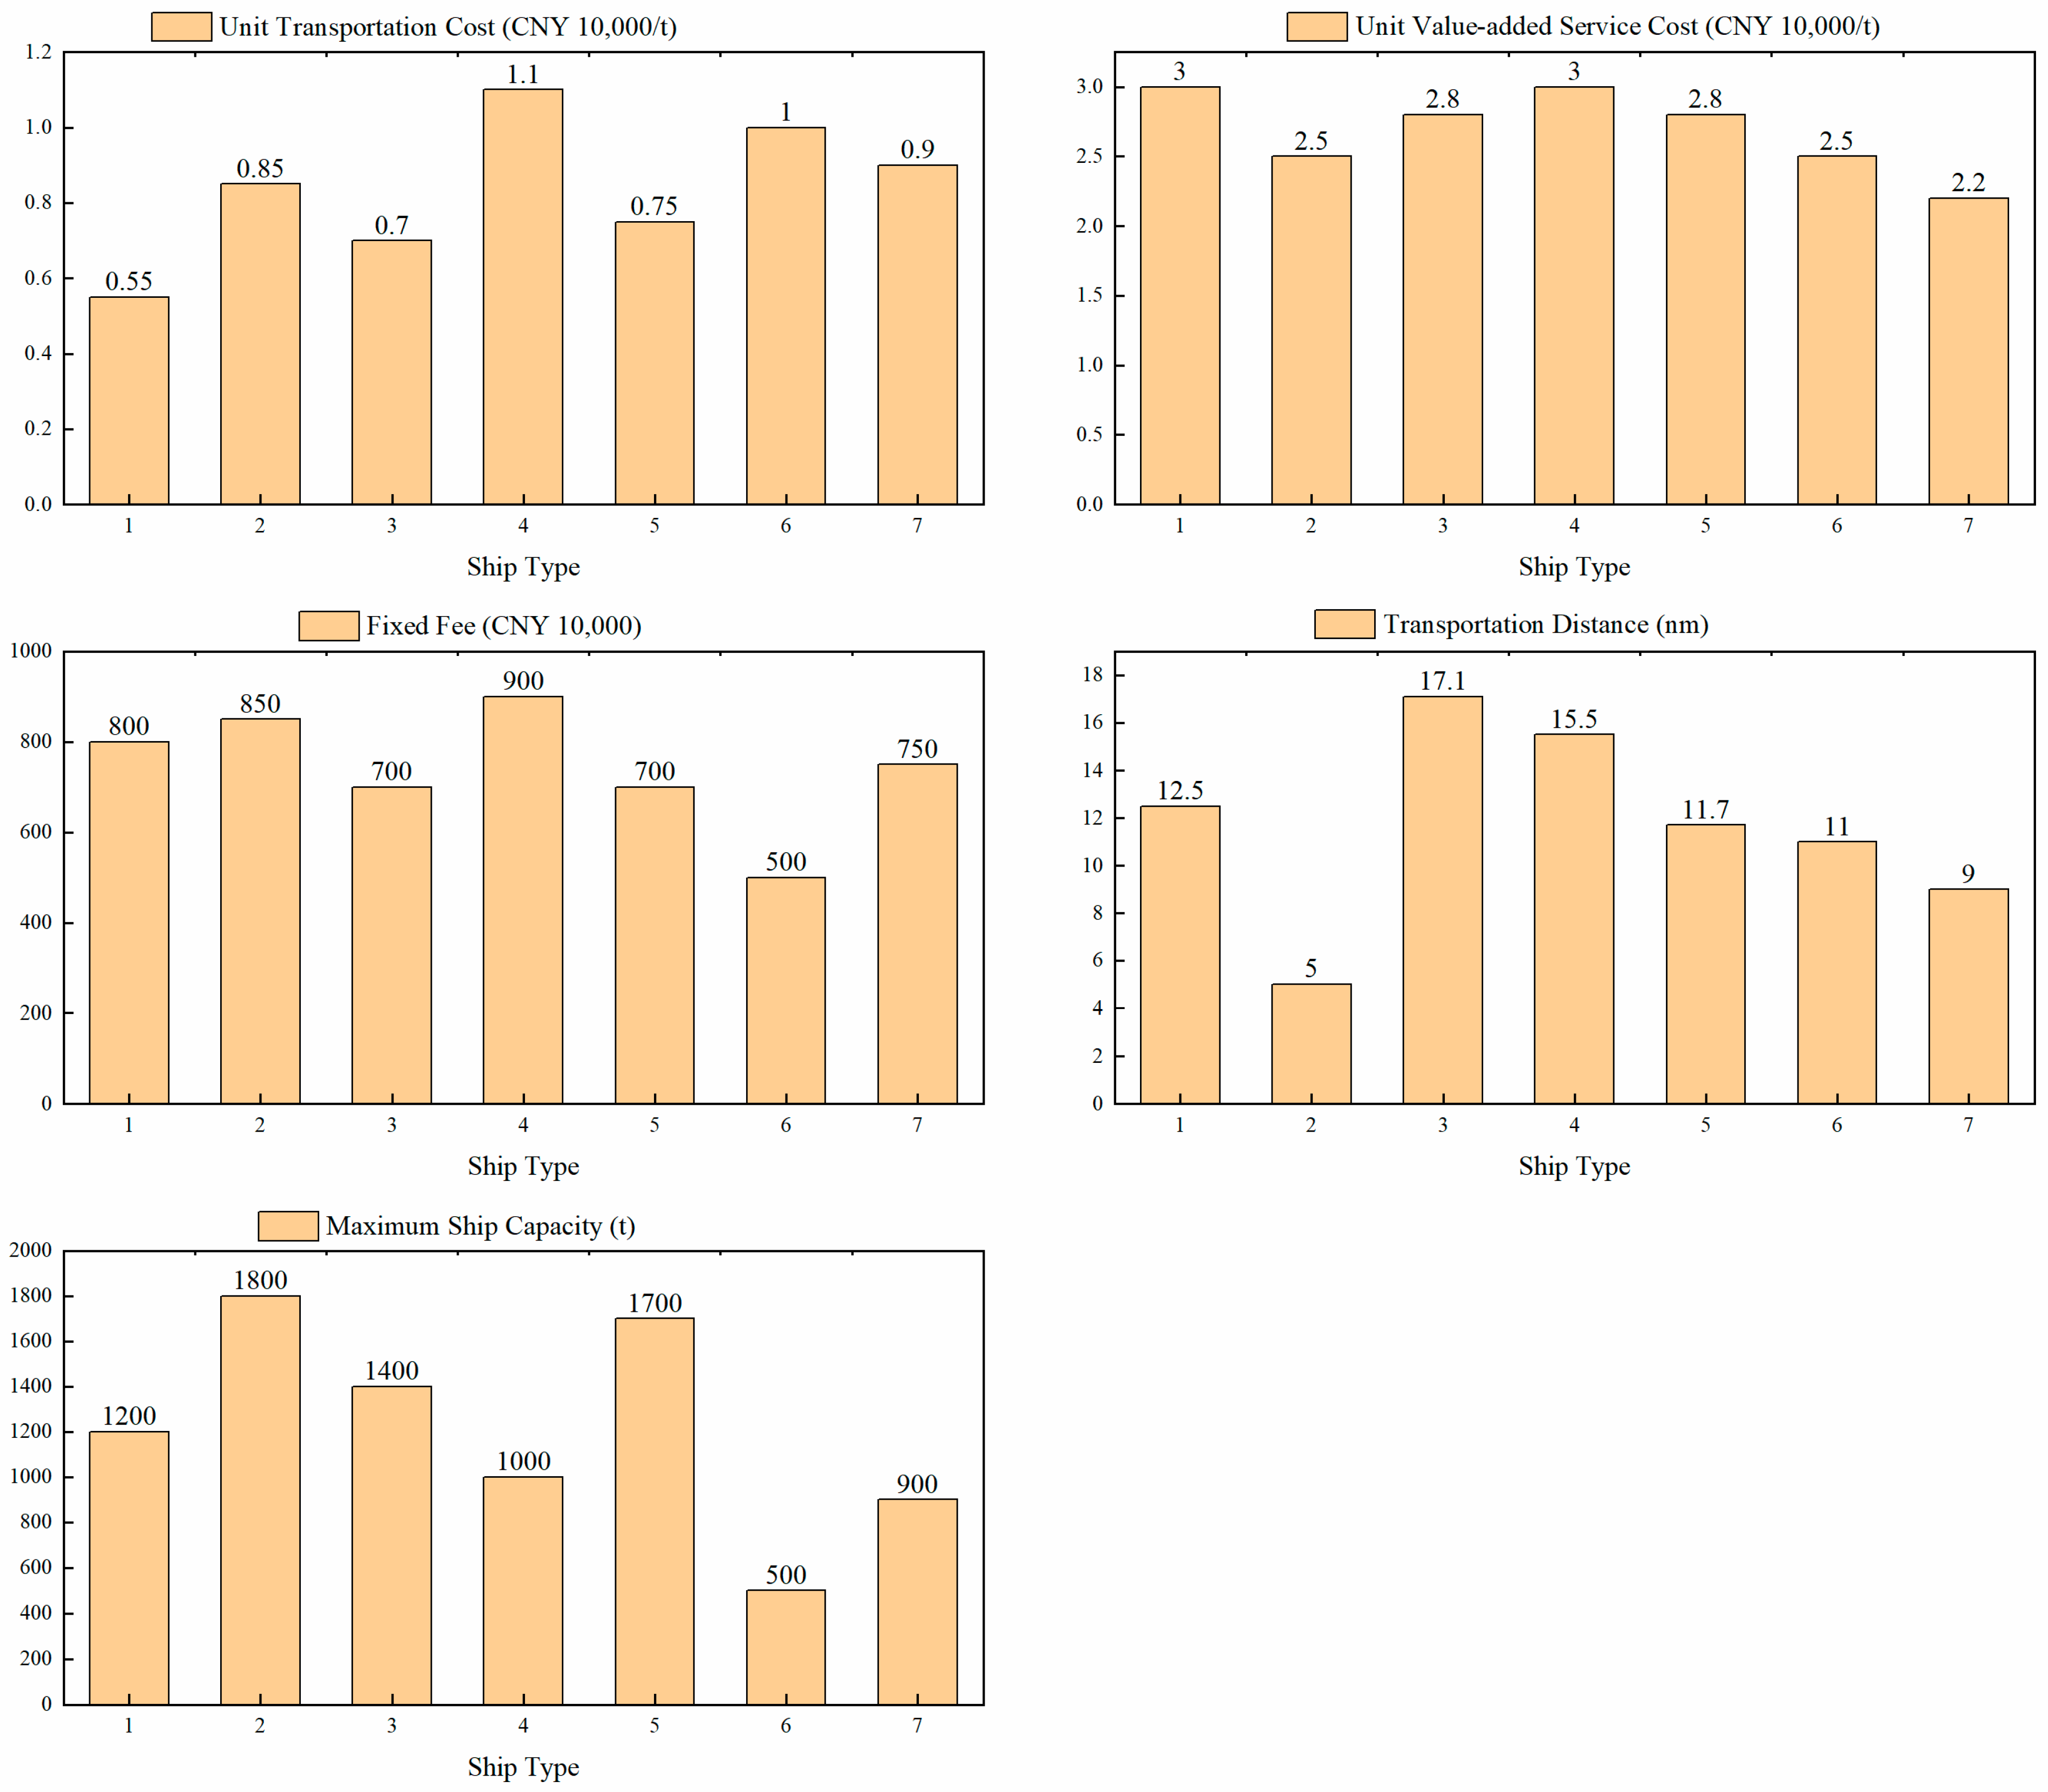
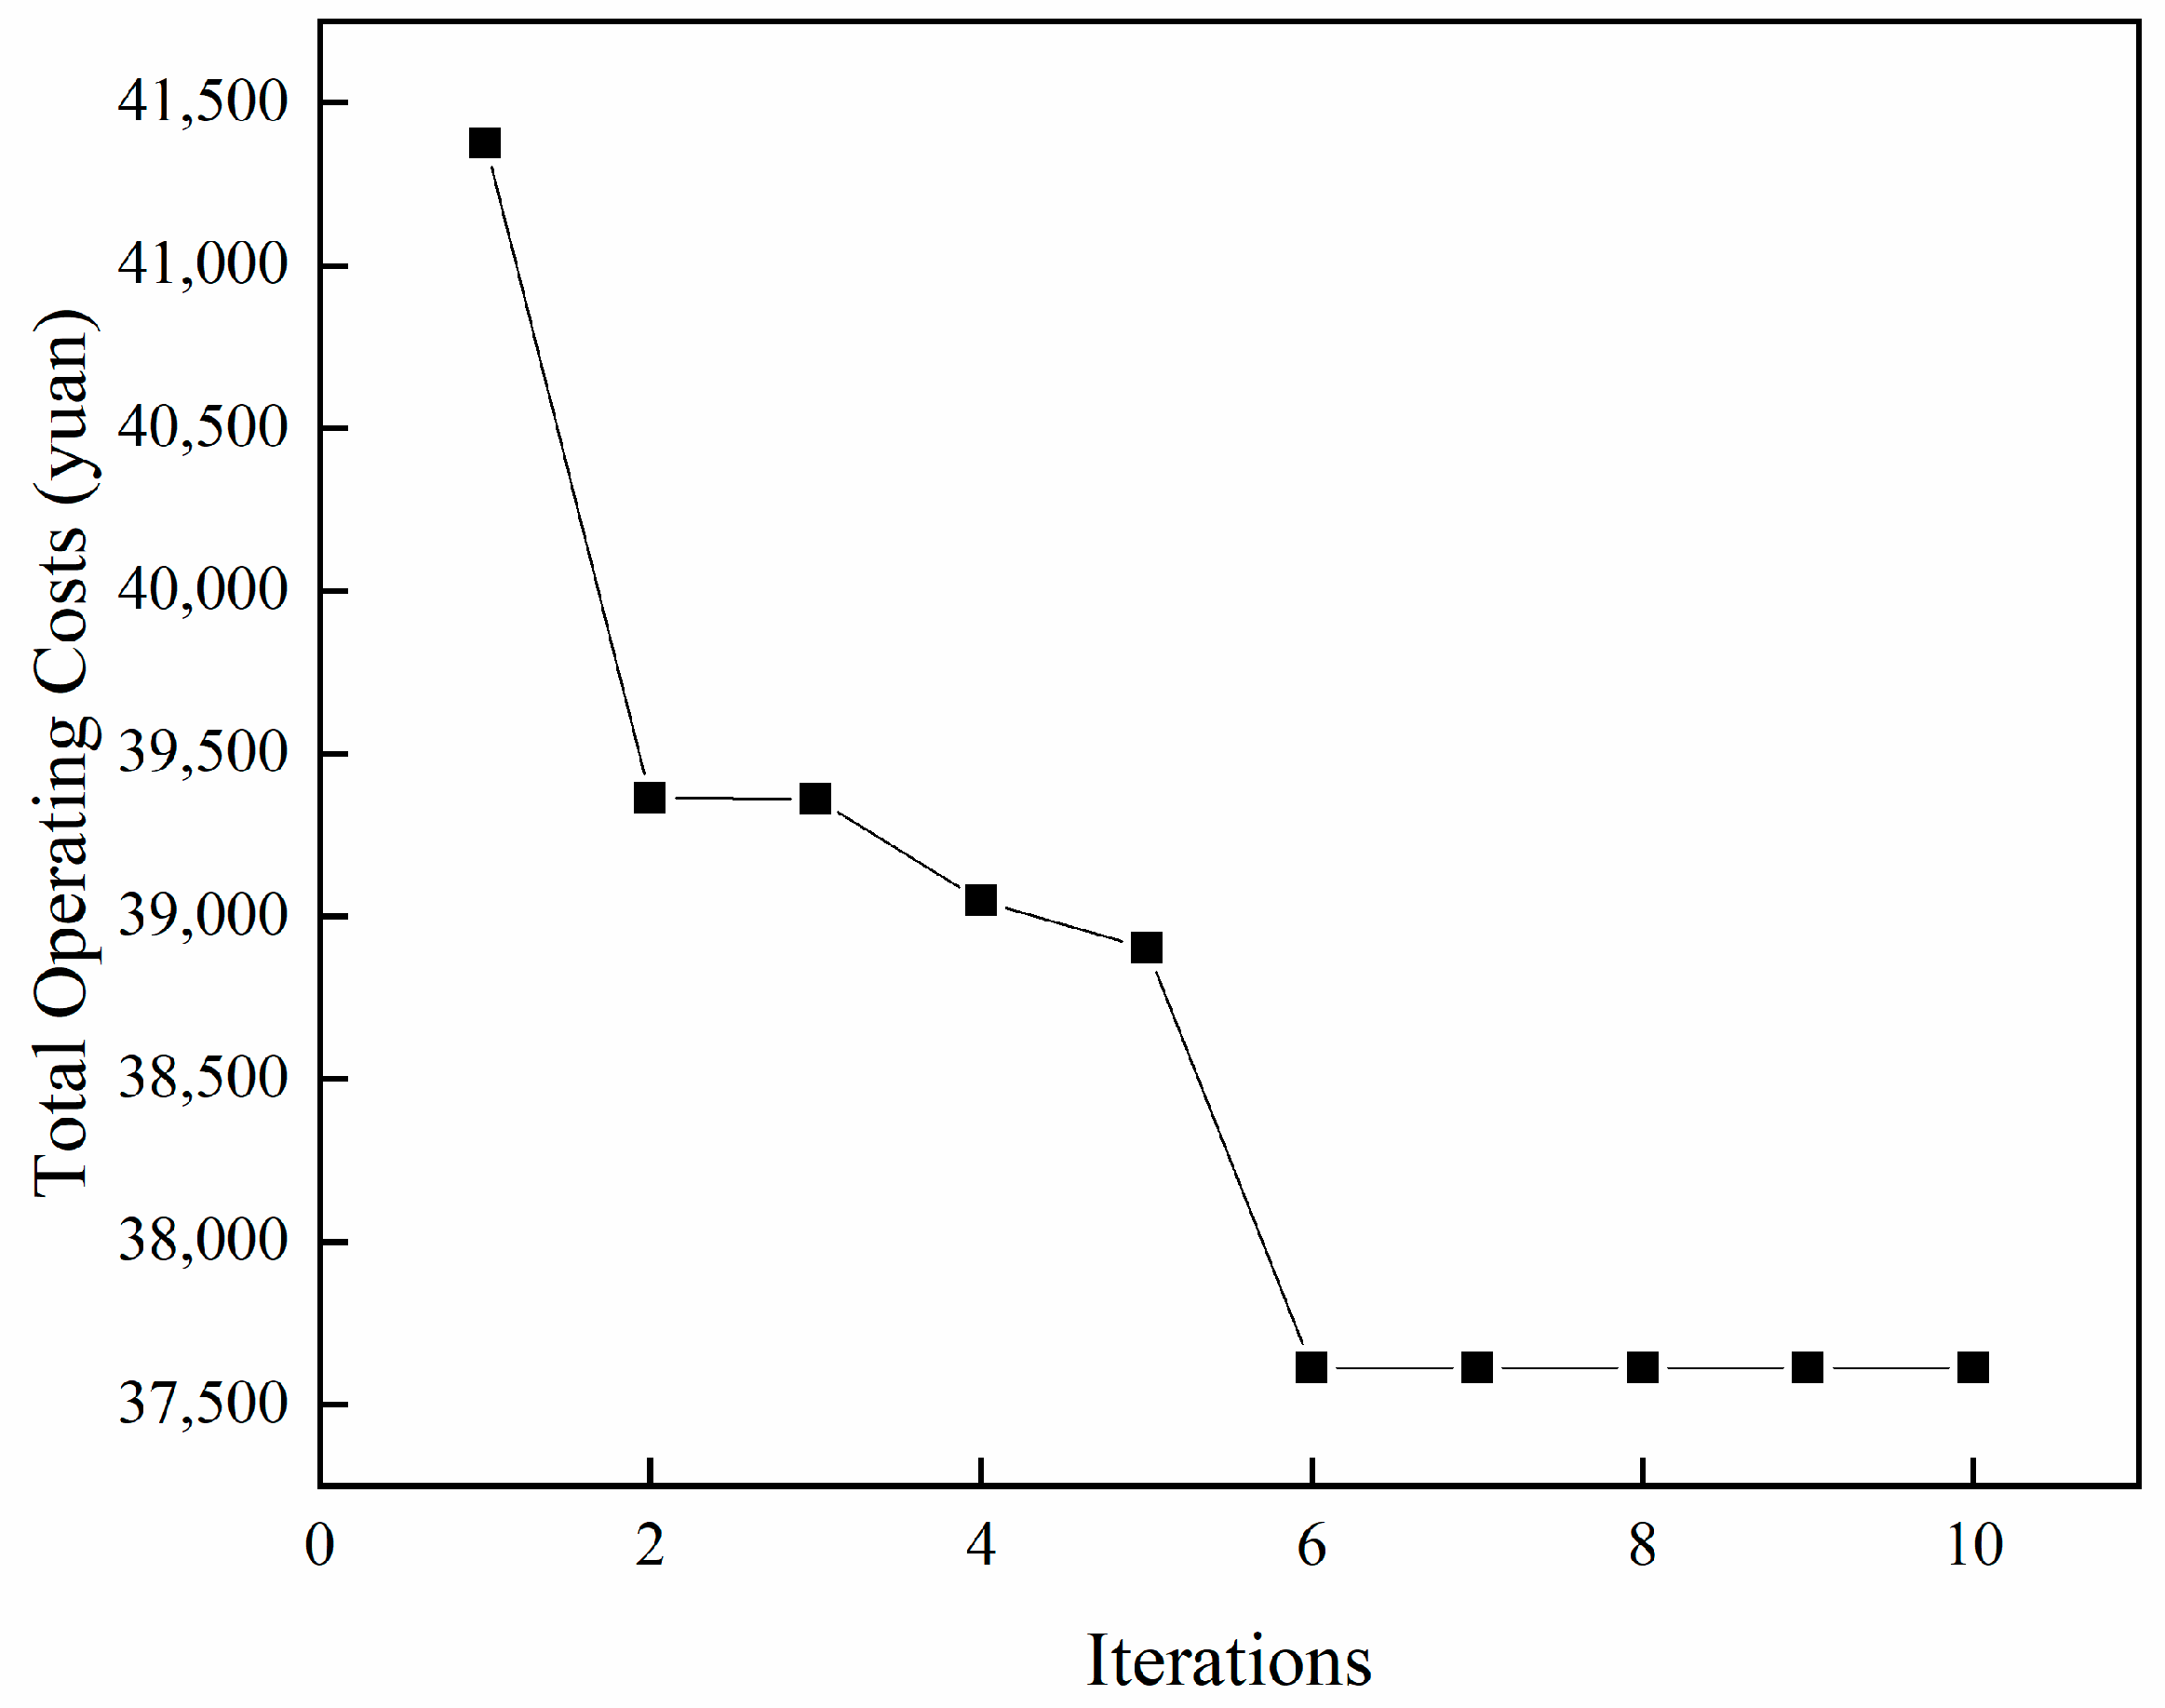
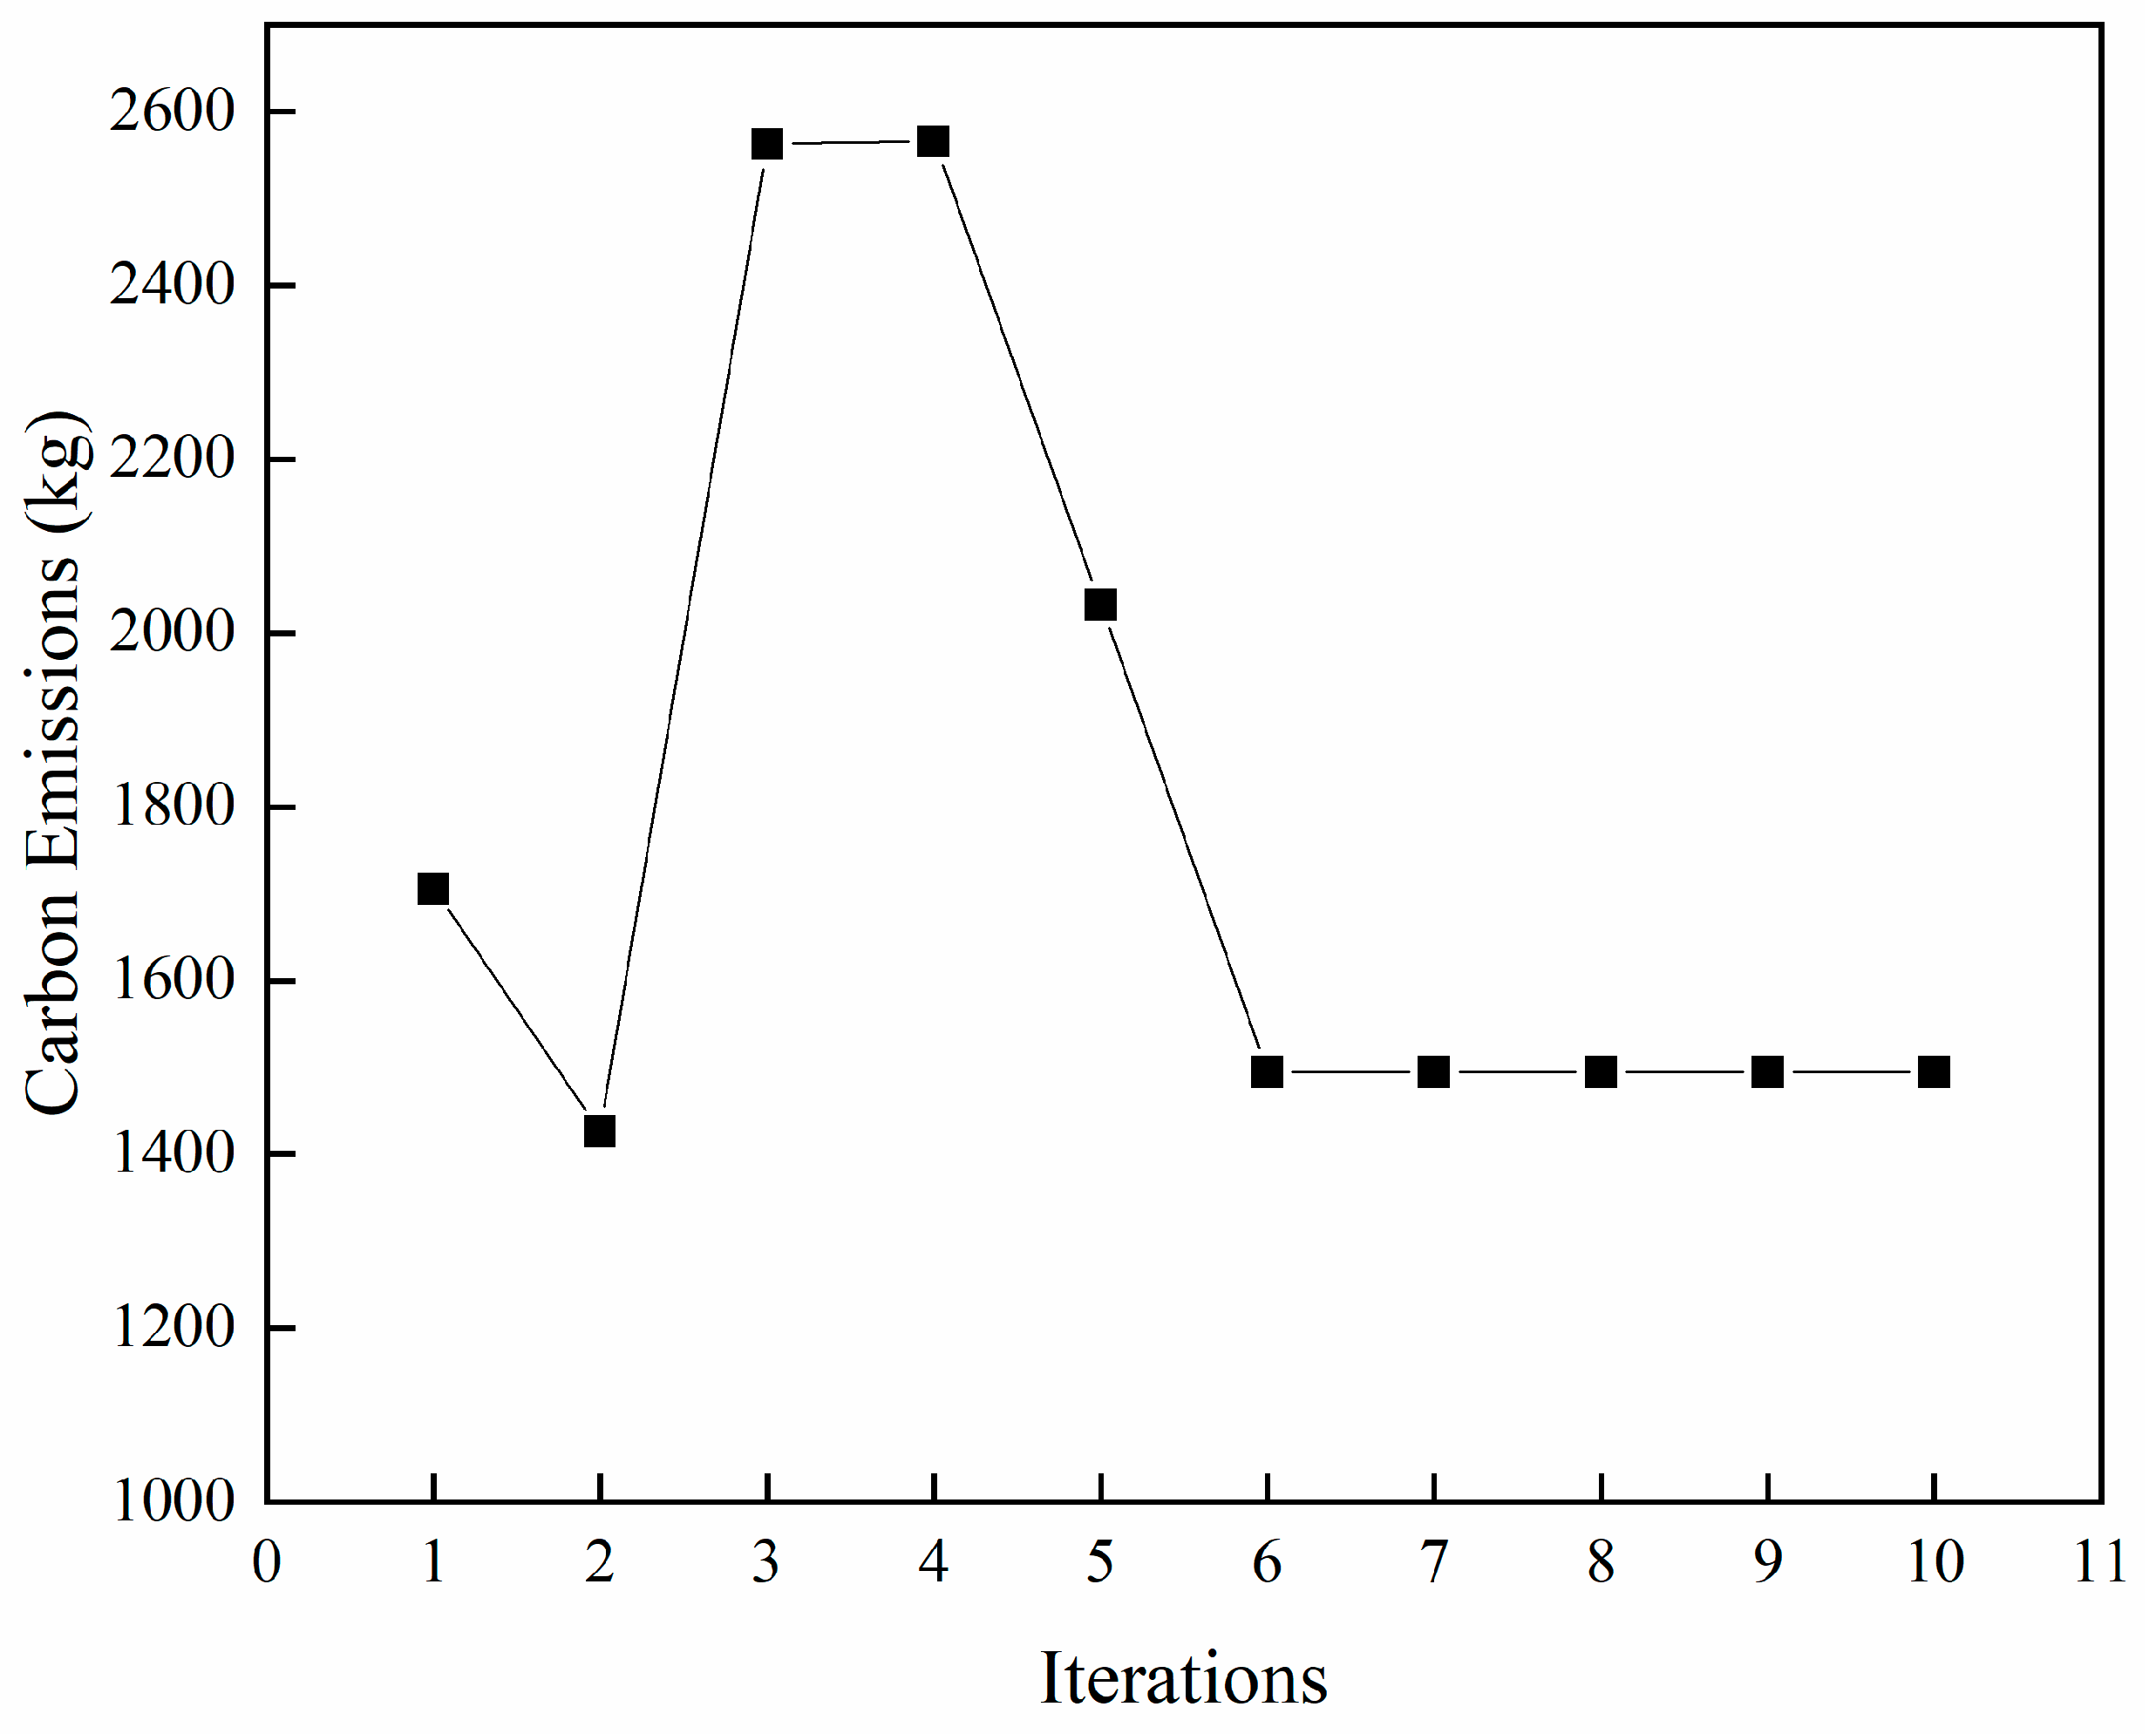
3. Case Study Analysis

This paper uses the example of an international shipping logistics company selecting from seven candidate ship types and allocating a monthly cargo volume of 4000 tons for logistics transportation to validate the model and algorithm. The population size and number of iterations used by the genetic algorithm are 50 and 8, respectively. The unit transportation costs, unit value-added service prices, and fixed outsourcing costs for the candidate ship models are shown in Figure 2 below:
The EEDI is a key technical indicator for measuring the energy efficiency level of ship design and construction, used to control carbon emissions. It was adopted as an amendment to Annex VI of the International Convention for the Prevention of Pollution from Ships at the 62nd meeting of the IMO Marine Environment Protection Committee (MEPC) on 15 July 2011, and has been in effect since 1 January 2013. The EEDI parameters for the transport ships purchased by the shipping company are shown in Table 2.
By combining genetic algorithms with linear planning, the optimal ship type selection scheme and the optimal allocation scheme for each ship type’s cargo capacity, under the upper-level planning goal of minimizing the company’s operational costs and the lower-level planning goal of minimizing carbon emissions, are determined as shown in Table 3.
From Table 3, it can be observed that the selected ship types are four in total: Ship Type 1, Ship Type 2, Ship Type 6, and Ship Type 7. In the allocation scheme, Ship Types 1, 2, and 7 have been assigned the maximum cargo weight within their capacity range. It can be concluded that for this transport task, Ship Types 1, 2, and 7 are the optimal choices for minimizing both carbon emissions and costs, with Ship Type 6 being the next best option. Table 3 presents the operational cost and carbon emissions per unit weight for each ship type.
In the bi-level programming model designed in this paper, the upper-level planning objective is to minimize operational costs, leading to the selection of ship types. Through the upper-level model centered on genetic algorithms, the chosen ship types are those with lower cargo unit operational costs. The lower-level planning aims to minimize carbon emissions, resulting in an optimal allocation scheme for cargo volume based on the ship types determined in the upper-level programming. The results from Table 3 demonstrate the rationality of the model design. Specifically, Ship Types 1, 2, and 7 not only have lower unit cargo operational costs but also lower unit cargo carbon emissions, which is why their cargo volumes are maximized. The trends in operational costs through iterations is shown in Figure 3.
During the solving process of the bi-level programming model, observing how the total operational costs of the shipping company approach the optimal solution through multiple iterations further verifies the advantages of genetic algorithms in handling multi-objective optimization problems. The mutation operations in the genetic algorithm effectively avoid the risk of falling into local optima and accelerate the convergence to the optimal solution. The genetic algorithm model designed in this paper reaches the optimal solution by the 6th generation, and after multiple training sessions, with 10 generations of iterations, the accuracy of the optimal solution reaches 93.7%. Throughout the algorithm’s execution, both bi-level objectives—minimizing operational costs and minimizing carbon emissions—converge simultaneously in successive iterations, showcasing the substantial application potential of this algorithm in addressing practical issues related to ship type selection and transport task allocation in shipping companies. The trend of carbon emissions is shown in Figure 4.
In recent years, with the continuous increase in human resource costs, the transportation service cost per unit of goods has inevitably been rising annually. Therefore, the unit added-value service cost for ship types can be set to increase by 10% per year. Figure 5 shows the growth of unit service costs over the next three years.
By applying the algorithm for calculation, the optimal operating cost change under this condition can be obtained in Figure 6 as follows: when the cost increases by 10% in the first year, the total operating cost increases by CNY 38,553; when the cost increases by 10% in the second year, the total operating cost increases by CNY 39,697; when the cost increases by 10% in the third year, the total operating cost increases by CNY 40,942.
It can be observed that with a 10% annual increase in unit value-added service costs, the total operating cost growth rates each year are 2.75%, 2.97%, and 3.14%, respectively. The contribution rates of unit value-added service costs to the total cost growth are 27.5%, 29.7%, and 31.4%, respectively.
From these data, it can be concluded that unit value-added service costs will be the primary factor driving cost increases for shipping companies in the future. Therefore, in future development, shipping companies can invest a portion of fixed capital in purchasing industrial automation equipment, such as automated loading and unloading systems, and automatic sorting and packing robotic arms. This will help reduce the total number of laborers, improve labor efficiency, and lower overall operating costs.

4. Conclusions

Focusing on the ship deployment problem for container liner companies, and balancing both economic and environmental benefits, we established a bi-level planning model. The upper-level model aims to minimize the operating costs across the company’s ocean routes, while the lower-level model focuses on minimizing carbon emissions. This dual-level approach takes into account both operating costs and carbon emissions. Through a genetic algorithm, the optimal solution can be obtained after more than six iterations. Under the preset condition of a 10% annual increase in labor cost, the total operating cost optimized by the model will increase by 2.75%, 2.97%, and 3.14% in the first three years. In the context of carbon emission policies, to better optimize fleet operating costs, further sensitivity analysis of relevant parameters could be conducted, as well as optimizing the model under additional constraints such as emission control areas, to improve the accuracy of the model’s predictions.

Author Contributions

Conceptualization, P.X. and H.W.; Methodology, P.X. and H.W.; Software, P.X. and H.W.; Validation, P.X. and H.W.; Formal analysis, P.X. and H.W.; Investigation, P.X. and H.W.; Resources, P.X. and H.W.; Data curation, P.X. and H.W.; Writing—original draft, P.X.; Writing—review & editing, H.W.; Visualization, P.X. and H.W.; Supervision, P.X. and H.W. All authors have read and agreed to the published version of the manuscript.

Funding

This research received no external funding.

Institutional Review Board Statement

Not applicable.

Informed Consent Statement

Not applicable.

Data Availability Statement

The original contributions presented in the study are included in the article, further inquiries can be directed to the corresponding author.

Conflicts of Interest

The authors declare no conflicts of interest.

References

  1. Meng, Q.; Wang, S. Liner ship fleet deployment with week-dependent container shipment demand. Eur. J. Oper. Res. 2012, 222, 241–252. [Google Scholar] [CrossRef]
  2. Meng, Q.; Wang, T.; Wang, S. Short-term liner ship fleet planning with container transshipment and uncertain container shipment demand. Eur. J. Oper. Res. 2012, 223, 96–105. [Google Scholar] [CrossRef]
  3. Wang, S.; Meng, Q. Liner ship fleet deployment with container transshipment operations. Transp. Res. Part E Transp. Res. Part 2012, 48, 470–484. [Google Scholar] [CrossRef]
  4. Wang, S.; Meng, Q. Container liner fleet deployment: A systematic overview. Transp. Res. Part C Emerg. Technol. 2017, 77, 389–404. [Google Scholar] [CrossRef]
  5. Ng, M.W. Distribution-free vessel deployment for liner shipping. Eur. J. Oper. Res. 2014, 238, 858–862. [Google Scholar] [CrossRef]
  6. Ng, M.W. Container vessel fleet deployment for liner shipping with stochastic dependencies in shipping demand. Transp. Res. Part B Methodol. 2015, 74, 79–87. [Google Scholar] [CrossRef]
  7. Ng, M.W. Revisiting a class of liner fleet deployment models. Eur. J. Oper. Res. 2017, 257, 773–776. [Google Scholar] [CrossRef]
  8. Bukljaš, M.; Rogić, K.; Jerebić, V. Distributionally Robust Model and Metaheuristic Frame for Liner Ships Fleet Deployment. Sustainability 2022, 14, 5551. [Google Scholar] [CrossRef]
  9. Gelareh, S.; Meng, Q. A novel modeling approach for the fleet deployment problem within a short-term planning horizon. Transp. Res. Part E Logist. Transp. Rev. 2010, 46, 76–89. [Google Scholar] [CrossRef]
  10. Sheng, D.; Meng, Q.; Li, Z.C. Optimal vessel speed and fleet size for industrial shipping services under the emission control area regulation. Transp. Res. Part C Emerg. Technol. 2019, 105, 37–53. [Google Scholar] [CrossRef]
  11. Wu, Y.; Huang, Y.; Wang, H. Nonlinear programming for fleet deployment, voyage planning and speed optimization in sustainable liner shipping. Electron. Res. Arch. 2023, 31, 147–168. [Google Scholar] [CrossRef]
  12. Ronen, D. The effect of oil price on containership speed and fleet size. J. Oper. Res. Soc. 2011, 62, 211–216. [Google Scholar] [CrossRef]
  13. Wang, S.; Meng, Q.; Liu, Z. Bunker consumption optimization methods in shipping: A critical review and extensions. Transp. Res. Part E Logist. Transp. Rev. 2013, 53, 49–62. [Google Scholar] [CrossRef]
  14. Cariou, P. Is slow steaming a sustainable means of reducing CO2 emissions from container shipping? Transp. Res. Part D Transp. Environ. 2011, 16, 260–264. [Google Scholar] [CrossRef]
  15. Norstad, I.; Fagerholt, K.; Laporte, G. Tramp ship routing and scheduling with speed optimization. Transp. Res. Part C Emerg. Technol. 2011, 19, 853–865. [Google Scholar] [CrossRef]
  16. Song, D.P.; Li, D.; Drake, P. Multi-objective optimization for planning liner shipping service with uncertain port times. Transp. Res. Part E Logist. Transp. Rev. 2015, 84, 1–22. [Google Scholar] [CrossRef]
  17. Lindstad, H.E.; Rehn, C.F.; Eskeland, G.S. Sulphur abatement globally in maritime shipping. Transp. Res. Part D. Transp. Environ. 2017, 57D, 303–313. [Google Scholar] [CrossRef]
  18. Xiao, P.; Wang, H. Operation Optimization of the Sea Container Fleet Based on the Double-Level Planning Model. Appl. Sci. 2024, 14, 1624. [Google Scholar] [CrossRef]
  19. Wang, C.; Xu, C. Sailing speed optimization in voyage chartering ship considering different carbon emissions taxation. Comput. Ind. Eng. 2015, 89, 108–115. [Google Scholar] [CrossRef]
  20. Chen, X.; Wang, X. Effects of carbon emission reduction policies on transportation mode selections with stochastic demand. Transp. Res. Part E. Logist. Transp. Rev. 2016, 90E, 196–205. [Google Scholar] [CrossRef]
  21. Chang, Y.-T.; Danao, D. Green Shipping Practices of Shipping Firms. Sustainability 2017, 9, 829. [Google Scholar] [CrossRef]
  22. Zhu, M.; Yuen, K.F.; Ge, J.W.; Li, K.X. Impact of maritime emissions trading system on fleet deployment and mitigation of CO2 emission. Transp. Res. Part D Transp. Environ. 2018, 62, 474–488. [Google Scholar] [CrossRef]
  23. Xing, Y.; Yang, H.; Ma, X.; Zhang, Y. Optimization of ship speed and fleet deployment under carbon emissions policies for container shipping. Transport 2019, 34, 260–274. [Google Scholar] [CrossRef]
  24. Tian, X.; Yan, R.; Qi, J.; Zhuge, D.; Wang, H.J.S. A Bi-Level Programming Model for China’s Marine Domestic Emission Control Area Design. Sustainability 2022, 14, 3562. [Google Scholar] [CrossRef]
Figure 1. Genetic algorithm flow chart.
Applsci 14 09816 g001
Figure 2. Unit transportation cost for each ship type.
Applsci 14 09816 g002
Figure 3. Iterative trend in operating costs.
Applsci 14 09816 g003
Figure 4. Trend in carbon emissions.
Applsci 14 09816 g004
Figure 5. Unit service cost data.
Applsci 14 09816 g005
Figure 6. Annual growth trend in operating costs.
Applsci 14 09816 g006
Table 1. Parameter variable meaning.
VariableMeaning
F Total operating cost of a single transport mission for the shipping company
F 1 Transport cost for a single transport mission of the shipping company
F 2 Value-added service cost of the transportation of a single unit of cargo by ship i
F 3 Fixed cost of transportation of a single unit of cargo by ship i
λ i 0–1 variable: 1 when type i ship is configured on the route, otherwise 0
α i Transportation cost per nautical mile (nm)
β i Indicates the value-added service cost per unit ton of cargo incurred when the type i ship provides simple value-added services (such as handling, sorting, etc.)
η i Indicates the fixed cost incurred when selecting type i ship
x i Indicates the logistics business volume that type i ship receives from the shipping company’s business, that is, the cargo volume (TEU)
n The number of different types of ships owned by the shipping company
K i The distance from the destination for which type i ship provides logistics services; varies with the different routes arranged by different ships.
X The total carbon emissions of a single transport mission of the shipping company
E E D I i Ship energy efficiency design index of type i ship
w i The maximum cargo carrying capacity of ship i in a single transport
Table 2. Energy efficiency design index for ships.
Ship Type1234567
EEDI/(g(CO2)t·nm)22.8103.45.386.2680.7749.2719.56
Table 3. Optimal ship type selection and allocation scheme.
Ship TypeAllocated Cargo Volume (t)Transport Cost/CNYService Cost/CNYFixed Cost/CNYTotal Operating Cost/CNYCarbon Emissions (kg)Operating Cost per Unit of Cargo/CNYCarbon Emissions per Unit of Cargo/CNY
112008250360080012,65034210.540.285
21800150.1493.985013,000930.67.220.517
61001100250500185054.218.50.542
79007290198075010,020158.411.130.176
Total40008682.54982.7290037,5201485.20
Disclaimer/Publisher’s Note: The statements, opinions and data contained in all publications are solely those of the individual author(s) and contributor(s) and not of MDPI and/or the editor(s). MDPI and/or the editor(s) disclaim responsibility for any injury to people or property resulting from any ideas, methods, instructions or products referred to in the content.

