Abstract
To meet the increasing demand for rapid and efficient evaluation of tunnel blasting quality, this study presents a comprehensive review of the current state of the art in tunnel blasting evaluation, organized into five key areas: Blasting Techniques and Optimization, 3D Reconstruction and Visualization, Monitoring and Assessment Technologies, Automation and Advanced Techniques, and Half Porosity in Tunnel Blasting. Each section provides an indepth analysis of the latest research and developments, offering insights into enhancing blasting efficiency, improving safety, and optimizing tunnel design. Building on this foundation, we introduce a digital identification method for assessing half porosity through 3D image reconstruction. Utilizing the Structure from Motion (SFM) technique, we re-construct the 3D contours of tunnel surfaces and bench faces after blasting. Curvature values are employed as key indicators for extracting 3D point cloud data from boreholes. The acquired postblasting point cloud data is processed using advanced software that incorporates the RANSAC algorithm to accurately project and fit the borehole data, leading to the determination of the target circle and borehole axis. The characteristics of the boreholes are analyzed based on the fitting results, culminating in the calculation of half porosity. Field experiments conducted on the Huangtai Tunnel (AK20 + 970.5 to AK25 + 434), part of the new National Highway 109 project, provided data from shell holes generated during blasting. These data were analyzed and compared with traditional onsite measurements to validate the proposed method’s effectiveness. The computed half porosity value using this technique was 58.7%, showing minimal deviation from the traditional measurement of 60%. This methodology offers significant advantages over conventional measurement techniques, including easier equipment acquisition, non-interference with construction activities, a comprehensive detection range, rapid processing speed, reduced costs, and improved accuracy. The findings demonstrate the method’s potential for broader application in tunnel blasting assessments.
1. Introduction
Tunnel blasting plays a pivotal role in modern subsurface engineering, particularly in the construction of essential infrastructures such as railways and highways. The effectiveness of blasting operations significantly influences not only the structural integrity of tunnels but also safety, cost-efficiency, and environmental impact. An essential aspect of evaluating blasting effectiveness is the assessment of half porosity, which refers to the residual voids left in the rock mass post-blasting. Half porosity serves as a critical indicator of blasting precision, as a higher rate of visible holes suggests better control over the blasting process and minimal overbreak. This metric is widely used to evaluate the quality of smooth blasting, ensuring that the energy from the blast is efficiently utilized and the tunnel wall remains as close to the design as possible [1]. Accurate measurement of half porosity is crucial for determining the quality of the excavation and ensuring compliance with engineering specifications.
As tunnel construction projects grow in complexity, recent advancements in evaluation methodologies have highlighted the necessity for improved techniques to assess blasting effects comprehensively. Optimizing blasting parameters remains essential for enhancing both operational efficiency and safety in underground construction. Foundational studies in this field have examined how blast hole patterns and controllable blasting parameters impact rock fragmentation and overall structural stability, establishing principles that inform more effective blasting designs. Recent research has further emphasized the importance of maximizing half porosity, which allows for improved control over the blasting process and helps to minimize material waste. Collectively, these advancements reflect a growing emphasis on precision and sustainability in tunnel blasting practices, underscoring the field’s continued evolution towards more refined and efficient techniques.
Further progress has been made in 3D reconstruction and visualization techniques, which are essential for accurate and reliable blasting assessments. Methods such as Structure-from-Motion (SfM) photogrammetry enable the creation of detailed spatial representations of tunnel faces post-blasting, allowing for comprehensive evaluations of blasting impacts. Additionally, recent developments in point cloud data processing and noise reduction have improved the clarity and accuracy of 3D models, supporting safer and more precise maintenance strategies [2]. Table 1 summarizes these and other significant research advancements in the field of tunnel blasting effect evaluation, illustrating the evolution and sophistication of methodologies aimed at enhancing our understanding of blasting impacts. These advancements reflect a concerted effort to develop more precise, reliable, and efficient methods for assessing half porosity and other critical parameters.

Table 1.
Evolution of Tunnel Blasting Impact Assessment Methods: Key Research Milestones.
Building on this foundation, our research aims to achieve two primary objectives. First, we conduct a comprehensive review of current methodologies in tunnel blasting evaluation, with particular emphasis on the advances in 3D reconstruction technologies and their applications [29]. Second, we introduce and validate an innovative approach for assessing half porosity by adapting established algorithms from other fields—namely, Structure-from-Motion (SfM), Scale-Invariant Feature Transform (SIFT), and Random Sample Consensus (RANSAC)—for the specific challenges encountered in tunnel blasting contexts. By applying these computer vision techniques in a new domain, we demonstrate the potential for a more precise, efficient, and digitally driven approach to blasting evaluation, ultimately supporting safer and more effective blasting practices in tunnel construction.
To reflect these dual objectives, this paper is organized into two main parts. Part 1 presents a thorough review of the current state-of-the-art in tunnel blasting evaluation, including techniques for optimizing blasting parameters and recent advancements in 3D reconstruction and visualization methods. Part 2 provides a detailed account of our proposed methodology, focusing on the adaptation of SfM, SIFT, and RANSAC algorithms specifically for tunnel blasting. This section explains how these algorithms are utilized to perform accurate 3D reconstruction of the tunnel face, extract borehole structures, and calculate half porosity, and by validating these techniques through field experiments, we demonstrate the practicality and precision of our approach for assessing blasting outcomes. This research provides crucial support for the subsequent optimization of blasting parameters and adjustments to construction plans. By promoting the application of three-dimensional reconstruction technologies in tunnel engineering, the study seeks to realize digital evaluations of blasting effectiveness, thereby improving the efficiency and quality of tunnel blasting operations. Furthermore, it aspires to deliver reliable technical support for the design, execution, and safety management of blasting projects, contributing to a more intelligent and precise evolution in underground engineering practices. Building upon this foundational work, the paper focuses specifically on the assessment of half porosity through 3D image reconstruction techniques, offering insights that could lead to enhanced practices in tunnel blasting operations.
2. Methods
2.1. Literature Review Methodology
This section provides a detailed explanation of the methodology employed in conducting the literature review. It outlines the processes of selecting, analyzing, and synthesizing the relevant studies, ensuring that the review is comprehensive, objective, and methodologically rigorous.
2.1.1. Literature Search Strategy
The literature search was conducted using a systematic approach to ensure the identification of relevant studies in the field of tunnel blasting assessment and 3D image reconstruction. Several electronic databases were used, including CNKI, Web of Science, Scopus, Google Scholar, and IEEE Xplore. These databases were selected due to their extensive coverage of engineering, construction, and computer vision topics. The search terms included combinations of keywords such as “tunnel blasting”, “3D reconstruction”, “half porosity”, “point cloud analysis”, and “laser scanning”. Boolean operators (AND, OR) were used to refine the search results and retrieve relevant studies [30].
The search was limited to articles published in peer-reviewed journals, conference papers, and books between 1978 and 2024. This time frame was chosen to capture both foundational and recent advancements in the field, ensuring a balance between historical context and the latest technological developments. Additional searches were conducted in gray literature sources to identify technical reports and standards from professional organizations.
2.1.2. Selection Criteria
The selection of studies was guided by strict inclusion and exclusion criteria to ensure relevance and quality. Studies were included if they met the following criteria:
The study explicitly focused on tunnel blasting assessment or related digital image reconstruction techniques.
The study provided quantitative or qualitative data applicable to half porosity evaluation or point cloud analysis.
The research was published in English and provided sufficient methodological detail for replication [31].
Studies were excluded if:
They did not directly address tunnel blasting or 3D reconstruction technologies.
They were abstracts, editorials, or papers without substantive research findings.
They were published in non-peer-reviewed or non-reputable sources, or they lacked robust methodological transparency.
To ensure comprehensive coverage, cross-referencing of key studies was performed to identify additional relevant literature that might not have been captured by the initial database search.
2.1.3. Data Extraction and Synthesis
Data from the selected studies were extracted using a standardized template that captured key information, including the study’s objective, methodology, sample size, key findings, and limitations. Particular attention was given to the techniques used for 3D point cloud generation, laser scanning, and the assessment of half porosity.
Thematic analysis was employed to identify common methodologies, trends, and gaps across the selected studies. The literature was categorized into key themes, such as:
Blasting Techniques and Optimization
3D Reconstruction Contributions to Rock Fracture Induced by High Ground Stress in Deep Mining
Point Cloud Data Processing and Noise Reduction
Computer Vision
Evaluation Methods for Half Porosity
For each theme, the studies were synthesized to provide an overview of how the field has evolved, comparing traditional techniques with more recent advancements in digital technologies. Where relevant, the effectiveness of different methods was compared, and the limitations of existing approaches were highlighted [32].
2.1.4. Ensuring Relevance and Quality
To ensure the relevance and quality of the included studies, only those published in peer-reviewed journals or reputable conference proceedings were considered. The quality of the studies was further assessed by examining the rigor of their methodologies, the appropriateness of their statistical analyses, and the relevance of their findings to the topic of tunnel blasting and 3D reconstruction.
Additionally, to minimize bias, multiple authors independently reviewed the selected studies, and disagreements were resolved through discussion. A quality assessment checklist, adapted from established guidelines for systematic reviews, was used to evaluate the methodological rigor of each study. This process ensured that the review was comprehensive, objective, and reflective of the most current research in the field.
2.2. Algorithm Design and Validation for Tunnel Blasting Evaluation
This section outlines the algorithmic framework specifically adapted for evaluating the effects of tunnel blasting, addressing the unique challenges presented by tunnel environments. This study leverages three advanced algorithms—Structure-from-Motion (SfM) for 3D reconstruction, Scale-Invariant Feature Transform (SIFT) for feature matching, and Random Sample Consensus (RANSAC) for noise filtering and outlier rejection. While these algorithms have been widely applied in other fields, such as archaeology, architecture, and remote sensing, this study represents a novel application of these techniques to tunnel blasting assessment. The proposed framework thus demonstrates how well-established computer vision and modeling techniques can be adapted to meet the needs of complex engineering challenges in tunnel construction, enhancing both the precision and practicality of blasting evaluations.
2.2.1. Algorithm Selection and Workflow
The selected algorithmic workflow was designed to systematically process and refine spatial data in three main stages: 3D reconstruction, feature matching, and data refinement. This workflow is particularly suited for tunnel environments, where low lighting, airborne particulates, and irregular surfaces are common. The algorithms work synergistically to produce a highly accurate representation of tunnel conditions post-blast, providing a robust tool for evaluating half porosity as a key metric of blasting effectiveness.
1. 3D Reconstruction using Structure-from-Motion (SfM)
The initial stage of evaluation involves reconstructing a 3D model of the tunnel face following a blast, utilizing the SfM technique. SfM processes multiple 2D images taken from various angles to create a 3D spatial model, taking advantage of perspective shifts. In this study, images were captured using a Nikon Z50 camera with a 50–80 mm lens from a distance of 6–8 meters. The SfM process includes:
- (1)
- Image Overlap: Ensuring at least 30% overlap between images to facilitate effective feature matching and depth calculation.
- (2)
- Pre-Capture Calibration: Correcting lens distortion prior to image capture to improve accuracy.
SfM is traditionally employed in fields such as archaeology and geosciences, where environmental challenges such as lowlight conditions and irregular surfaces also prevail. Its adaptation here to the unique conditions of tunnel environments—specifically, its resilience to dust and lighting inconsistencies—demonstrates the technique’s versatility and capacity for providing detailed spatial information in demanding engineering contexts. By accurately capturing the geometry of the post-blast tunnel face, SfM provides the foundational data required for assessing blast-induced structural changes with precision.
2. Feature Matching with Scale-Invariant Feature Transform (SIFT)
To improve the precision of the 3D reconstruction process, SIFT was used to match features across the image set. SIFT detects and describes stable image features that are invariant to changes in scale, rotation, and lighting—an essential quality in tunnels, where lighting is uneven and often limited. The SIFT process includes:
- (1)
- Key Point Detection: Identifying distinct, reliable points within each image that can be matched consistently.
- (2)
- Orientation Assignment: Assigning an orientation to each key point based on local image gradients, ensuring the descriptors remain rotation invariant.
- (3)
- Descriptor Generation: Creating robust feature descriptors that encode local gradient information, enhancing the reliability of feature matching.
Originally developed for object recognition in computer vision applications, SIFT’s implementation here allows for accurate feature tracking across images taken under challenging conditions. This adaptation to tunnel blasting evaluation highlights SIFT’s capacity for handling environmental variability, ensuring a coherent and detailed 3D model of the tunnel surface. This model subsequently allows for precise analysis of residual voids and blast induced changes in rock integrity.
3. Noise Filtering and Outlier Rejection using Random Sample Consensus (RANSAC)
Following 3D reconstruction, the RANSAC algorithm was applied to filter out noise and reject outliers, refining the quality of the point cloud data. RANSAC iteratively identifies the most relevant data points, fitting them to a geometric model while discarding those that fall outside of a defined threshold. The process operates as follows:
- (1)
- Random Selection: Randomly selecting subsets of points from the 3D point cloud.
- (2)
- Model Fitting: Fitting a model (e.g., plane or cylinder) to these subsets.
- (3)
- Consensus Set Formation: Counting inliers (points that fit the model within a threshold).
- (4)
- Iteration: Repeating the process to maximize the inlier count, ultimately selecting the best fitting model.
RANSAC’s robustness to noise is particularly beneficial in the context of tunnel blasting, where surface irregularities and environmental debris can skew data. The algorithm ensures that only the most relevant data points contribute to the final model, allowing for accurate identification of half porosity. This application of RANSAC, though commonly used in robotics and image processing, demonstrates its utility in a new field—enhancing precision in the analysis of post-blast tunnel conditions.
2.2.2. Algorithm Validation
To validate the algorithmic framework’s performance, field experiments were conducted at the Huangtai Tunnel, part of the National Highway 109 project. The tunnel face was imaged following a controlled blast, and the images were processed using SfM, SIFT, and RANSAC to create a dense, high-resolution 3D model of the tunnel interior. Half porosity was then calculated from this model and compared with traditional manual measurements.
The calculated half porosity from the algorithmic framework was 58.7%, closely matching the manual measurement of 60%. This minimal deviation—within 1.3%—demonstrates the algorithm’s reliability, suggesting it can effectively serve as a practical and accurate alternative to traditional methods. By successfully adapting these computer vision techniques to tunnel blasting evaluation, this study illustrates how well-established algorithms from other domains can be repurposed to meet the specific challenges of a new field. The framework presented here provides a detailed and accurate means of assessing blast quality and tunnel integrity, offering significant benefits over traditional methods in terms of precision, efficiency, and real-time applicability. As such, this approach holds substantial promise for improving safety and operational effectiveness in tunnel construction projects.
To provide a clear overview of this process, Figure 1 presents a flowchart that outlines each stage of the 3D reconstruction and evaluation workflow, from data acquisition to the final calculation of half porosity and assessment of blasting effectiveness. This chart visually represents the full workflow, highlighting the synergy of the individual algorithms—Structure-from-Motion (SfM), Scale-Invariant Feature Transform (SIFT), and Random Sample Consensus (RANSAC)—within the context of tunnel blasting evaluation.
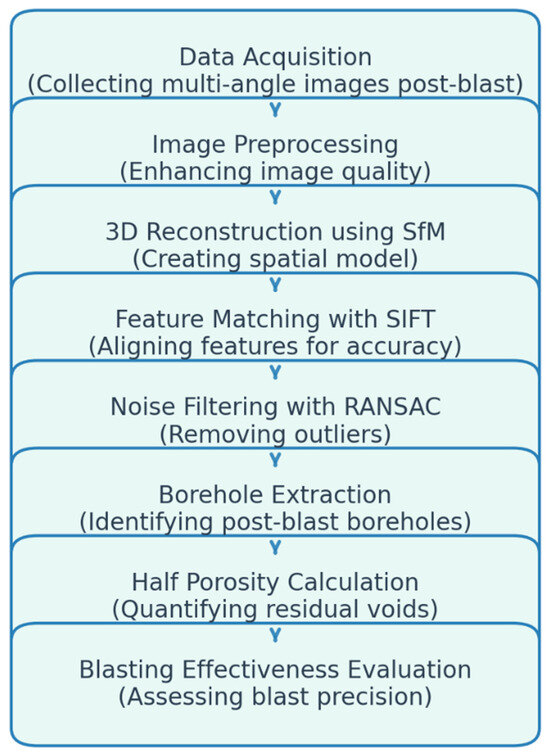
Figure 1.
3D Reconstruction Workflow for Tunnel Blasting Evaluation.
3. The State-of-the-Art Review in Tunnel Blasting Evaluation
This section provides a comprehensive review of the current state of the art in tunnel blasting evaluation, organized into five key areas. First, we explore Blasting Techniques and Optimization, focusing on the methodologies used to enhance blasting efficiency and minimize adverse effects on the surrounding rock mass. Next, we delve into 3D Reconstruction and Visualization, examining the cutting-edge technologies used for accurate 3D modeling of tunnel environments post-blasting. The third area, Monitoring and Assessment Technologies, highlights the importance of real-time monitoring systems in providing critical data for ensuring tunnel safety and structural integrity. In the fourth section, we discuss Automation and Advanced Techniques, emphasizing the role of machine learning and automated systems in improving the precision and efficiency of blasting evaluations. Finally, we address Half Porosity in Tunnel Blasting, underscoring its significance in evaluating the effectiveness of blasting operations and optimizing tunnel design and safety. Each section provides an in-depth analysis of the latest research and developments, offering insights into the evolving landscape of tunnel blasting evaluation.
3.1. Blasting Techniques and Optimization
Blasting techniques are fundamental to successful tunnel excavation, significantly impacting both the efficiency of operations and the integrity of surrounding rock formations. The optimization of blasting parameters is critical not only for minimizing rock damage but also for enhancing overall safety and cost-effectiveness. Numerous studies have focused on understanding how various blasting methods and configurations influence the outcome of tunnel construction.
Holmberg and Persson (1979) laid the groundwork for this field by utilizing finite element analysis (FEA) to explore the effects of different blast hole patterns on rock damage [3]. Their work established a crucial understanding of how the arrangement and depth of blast holes can impact the integrity of the surrounding rock, effectively paving the way for more sophisticated blasting designs tailored to specific geological conditions. The significance of optimizing these parameters cannot be overstated, as improper blasting can lead to excessive fragmentation, which complicates the excavation process and increases costs.
Hagan (1984) expanded on this foundation by investigating controllable blasting parameters such as charge weight, timing, and hole spacing [5]. This research highlighted the direct correlation between optimized blasting and reduced mining costs, thereby demonstrating the economic feasibility of employing precise blasting techniques. By focusing on fragmentation and its relationship with various parameters, Hagan’s work emphasized that tailored blasting not only enhances operational efficiency but also minimizes environmental impact by reducing the volume of overexcavated material.
The advent of computational modeling techniques has further revolutionized the optimization of blasting operations. Hartley and Zisserman (2003) introduced multiple-view geometry as a mathematical framework for three-dimensional reconstruction from two-dimensional images, which laid the foundation for various applications in computer vision [6]. These methodologies have since been employed in tunnel blasting assessments to visualize and analyze the effects of different blasting techniques, enabling engineers to make data-driven decisions regarding blasting configurations.
In recent years, the introduction of advanced algorithms, such as the Scale-Invariant Feature Transform (SIFT) developed by Lowe (2004), has improved the accuracy of image matching in rock assessments, which is crucial for evaluating blasting effects in three-dimensional space [7]. The ability to match and track distinct features across images facilitates a more comprehensive understanding of rock behavior during and after blasting, leading to enhanced optimization strategies.
Furthermore, modern approaches have begun to incorporate machine learning and artificial intelligence into blasting optimization processes. These technologies enable the analysis of vast amounts of data collected from past blasting operations to identify patterns and predict outcomes under varying conditions. For instance, machine learning algorithms can analyze historical data to recommend optimal blasting parameters based on specific geological profiles and project requirements.
The integration of real-time monitoring technologies has also been instrumental in optimizing blasting techniques. As highlighted by Nuttens et al. (2014), methodologies that utilize laser scanning for monitoring tunnel deformation provide immediate feedback on the effectiveness of blasting operations [11]. This real-time data can inform adjustments to blasting plans, allowing for on-the-fly optimizations that enhance both safety and efficiency.
Overall, the field of blasting techniques and optimization has witnessed significant advancements driven by computational modeling, data analytics, and real-time monitoring technologies. The ongoing evolution of these methodologies underscores the importance of optimizing blasting parameters to achieve not only improved operational outcomes but also enhanced safety and reduced environmental impacts. As the construction industry continues to embrace innovative technologies, the future of tunnel blasting optimization holds great promise for increasing efficiency and minimizing risks associated with underground excavation.
3.2. 3D Reconstruction and Visualization
The advent of 3D reconstruction and visualization techniques has transformed the evaluation and assessment of tunnel blasting effects, providing engineers with sophisticated tools to analyze complex geological environments. These methods are pivotal in enhancing our understanding of tunnel conditions, rock integrity, and the overall impact of blasting operations. By leveraging advanced imaging and modeling technologies, researchers have been able to create detailed representations of tunnel structures and assess the effects of blasting with unprecedented accuracy.
A significant contribution to this field came from Westoby et al. (2012), who introduced Structure-from-Motion (SfM) photogrammetry as a low-cost and effective approach for three-dimensional modeling in geoscience applications [10]. SfM utilizes multiple overlapping images to reconstruct three-dimensional structures, making it particularly useful in tunnel environments where traditional surveying methods may be impractical. This technique allows for efficient documentation of tunnel geometries, which is essential for assessing the impact of blasting on rock formations and ensuring compliance with engineering specifications.
The integration of SfM with machine learning algorithms has further enhanced the capabilities of 3D reconstruction. For instance, Ankang et al. (2023) developed a semi-supervised learning-based point cloud network specifically for segmenting 3D tunnel scenes, significantly improving the automation and accuracy of tunnel inspections [25]. Automating the analysis of point cloud data not only accelerates the evaluation process but also reduces the potential for human error, leading to more reliable assessments of tunnel conditions post-blasting.
Moreover, the utilization of the Scale-Invariant Feature Transform (SIFT) algorithm, introduced by Lowe (2004), has been instrumental in the accurate matching and recognition of features across images used in 3D reconstruction [7]. This capability is critical for assessing changes in tunnel structures over time, especially after blasting operations. By reliably identifying distinct features within the tunnel environment, engineers can create detailed models that reflect the true state of the tunnel, allowing for better-informed decisions regarding maintenance and remediation strategies.
In recent years, 3D laser scanning has emerged as a powerful tool for capturing detailed spatial data of tunnel environments. Zou et al. (2016) employed this technology to develop algorithms that identify and quantify over and underexcavation areas in tunnels [13]. Additionally, methods utilizing 3D laser scanning have been proposed for detecting the volume of blasted rock in tunnel environments. These methods allow for accurate calculation of soil and rock displacement by extracting and analyzing the global spatial axis from 3D point cloud data obtained from tunnel sections. The high-resolution data generated by 3D laser scanning not only enhances the accuracy of excavation evaluations but also enables real-time monitoring of tunnel conditions, providing immediate feedback on the effectiveness of blasting techniques. Such advancements in laser scanning technologies offer more comprehensive and efficient ways to assess and optimize blasting results in complex tunnel environments.
The significance of 3D reconstruction extends beyond mere visualization; it also plays a crucial role in the analysis of half porosity in tunnel blasting. Li et al. (2018) proposed a digital identification technique for detecting half porosity based on 3D point cloud data extraction [15]. Analyzing post-blast residual holes enhances the precision of assessing blasting effects, contributing to more effective monitoring and optimization of blasting performance.
Furthermore, the continuous improvement of 3D visualization technologies allows for the integration of various data sources, enhancing the comprehensiveness of tunnel assessments. For example, Xu et al. (2023) developed a novel SfMDLT method that integrates multiple data sources for detailed and accurate visualization of metro tunnels [26]. This holistic approach aids in operational planning and risk assessment during construction phases, ensuring that blasting operations are conducted safely and efficiently.
In essence, the advancements in 3D reconstruction and visualization techniques have significantly improved our ability to assess the effects of tunnel blasting. These methodologies provide a detailed understanding of tunnel conditions, allowing for better decision-making and optimization of blasting practices. As technology continues to evolve, the integration of advanced imaging techniques with data analytics will undoubtedly enhance the precision and reliability of tunnel assessments, ultimately leading to safer and more efficient construction practices.
3.3. Monitoring and Assessment Technologies
Monitoring and assessment technologies have become essential components in the evaluation of tunnel blasting effects, enabling real-time data collection and analysis of structural integrity. These advancements not only enhance safety but also improve the overall efficiency of tunnel construction and maintenance. Various methodologies have emerged that leverage innovative technologies to monitor tunnel conditions, assess the impact of blasting, and ensure compliance with engineering standards.
One of the most significant contributions in this area is the work by Nuttens et al. (2014), who developed a methodology for monitoring newly constructed circular train tunnels using laser scanning technology. This approach allows for precise tracking of changes in tunnel shape and stability over time, providing valuable data that informs maintenance strategies and enhances safety measures [11]. By employing laser scanning, engineers can detect minute deformations and assess the structural integrity of tunnels, which is critical in identifying potential issues before they escalate.
Moreover, the integration of remote sensing data with distinct element analysis has been highlighted by Zhang et al. (2021). Their research illustrated the effectiveness of combining these analytical methods to enhance safety assessments in challenging geological conditions [21]. This integration facilitates a comprehensive understanding of the interactions between blasting activities and geological factors, leading to more informed decision-making during tunnel construction and operation.
In addition to laser scanning and remote sensing, the utilization of advanced imaging technologies such as 3D reconstruction plays a pivotal role in monitoring tunnel conditions. Yang et al. (2020) proposed a method for detecting over and underdigging of tunnels using 3D reconstruction from images, specifically applying Structure-from-Motion (SfM) and semiglobal matching techniques [18]. This innovative methodology enables real-time monitoring of excavation deviations, ensuring that tunnel construction adheres to specified engineering requirements and enhancing safety throughout the blasting process.
The role of data analytics in monitoring and assessment technologies cannot be overstated. Lin (2017) emphasized the importance of processing and visualizing tunnel point cloud data, focusing on techniques for noise reduction and accuracy enhancement [14]. Effective noise reduction methods significantly improve the reliability of tunnel assessments, which is crucial when analyzing the effects of blasting operations on rock integrity and tunnel stability. The ability to produce clear and accurate visual representations of tunnel conditions allows engineers to make timely interventions and optimize blasting strategies.
Furthermore, the digital identification techniques developed by Li et al. (2018) for detecting half porosity in tunnel blasting underscore the role of monitoring technologies in enhancing blasting performance. Utilizing 3D point cloud data extraction provides a reliable means of assessing the effects of blasting, enabling engineers to monitor and optimize blasting outcomes effectively [15]. This method not only improves the accuracy of assessments but also aids in the continuous evaluation of tunnel integrity post-blasting.
Recent advancements in machine learning and artificial intelligence are also revolutionizing monitoring technologies in tunnel construction. For instance, Ankang et al. (2023) explored a semi-supervised learning-based point cloud network for segmenting 3D tunnel scenes, which enhances automation in tunnel inspections [25]. This innovative approach significantly improves the speed and accuracy of inspections, allowing for better maintenance practices and ensuring compliance with safety standards.
Consequently, monitoring and assessment technologies are crucial for evaluating the effects of tunnel blasting. The integration of laser scanning, remote sensing, 3D reconstruction, and advanced data analytics enables comprehensive assessments of tunnel conditions. These methodologies not only enhance safety and operational efficiency but also support proactive maintenance and informed decision-making throughout the tunnel construction process. As these technologies continue to evolve, they will play an increasingly vital role in ensuring the structural integrity and safety of tunnel infrastructures.
3.4. Automation and Advanced Techniques
In the field of tunnel blasting evaluation, automation, and advanced techniques have emerged as transformative forces, significantly enhancing efficiency, precision, and safety. As technology progresses, the integration of automated systems into tunnel construction and assessment processes allows for more accurate monitoring of blasting effects and the overall health of tunnel structures. This shift not only streamlines operations but also mitigates risks associated with human error.
One of the significant advancements in tunnel evaluation is the application of 3D laser scanning technology, as thoroughly reviewed by Mukupa et al. (2015) [12]. Their comprehensive study emphasized the effectiveness of terrestrial laser scanning (TLS) for detecting structural deformations and changes during tunnel construction. By enabling real-time generation of high-resolution 3D point cloud data, TLS facilitates the precise monitoring of displacement and deformation, allowing engineers to quickly identify potential structural issues. This ensures both the safety and efficiency of construction processes while also significantly enhancing the accuracy of evaluations and minimizing the risks associated with human error. Building on these advancements, Zou et al. (2016) explored the use of 3D laser scanning for tunnel profile extraction, developing algorithms for the automated identification and quantification of over and underexcavation areas [13]. This approach not only improves the precision of excavation assessments but also ensures compliance with design specifications. The automation of data extraction reduces manual labor and accelerates the evaluation process, enabling timely decision-making in response to any detected discrepancies. Further contributing to automation in tunnel monitoring, Yao et al. (2021) introduced a novel OverUnderCut algorithm that analyzes tunnel excavation efficiency using 3D laser scanning technology. Their findings highlight the potential for real-time analysis of excavation performance, enabling proactive adjustments during construction to address inefficiencies [19]. By automating the analysis process, construction teams can quickly adapt to changing conditions, reducing the risk of suboptimal blasting outcomes and enhancing safety measures.
Another significant development is the semi-supervised learning-based point cloud network proposed by Ankang et al. (2023). This innovative approach enables the segmentation of 3D tunnel scenes, which enhances the automation of tunnel inspections [25]. The adoption of machine learning techniques facilitates a more comprehensive analysis of tunnel conditions, allowing for quicker identification of potential issues and ensuring adherence to safety standards. By automating the inspection process, construction teams can allocate resources more effectively and reduce the time required for manual assessments.
The integration of RANSAC-based methods, as demonstrated by Li et al. (2022), further exemplifies the advancements in automation and its application to tunnel blasting evaluation [22]. Their research focused on multiprimitive building reconstruction from 3D point clouds, which is crucial for improving the geometric accuracy of tunnel structures. By automating the reconstruction process, engineers can achieve higher precision in assessing tunnel integrity, thereby supporting informed decision-making during blasting operations.
Moreover, monitoring technologies such as real-time data analytics have become increasingly vital in the automation landscape. The work by Lin (2017) emphasizes the importance of effective data processing techniques, which enhance the reliability of tunnel assessments by reducing noise in point cloud data [14]. Automated noise reduction processes contribute to the accuracy of monitoring systems, allowing for clearer visualization of tunnel conditions and more reliable evaluations of blasting impacts.
The evolution of these technologies is not only improving the efficiency of tunnel assessments but also revolutionizing the way engineers approach safety management. With advanced automated systems in place, continuous monitoring becomes feasible, allowing for real-time interventions based on data-driven insights. For example, Yang et al. (2020) developed methodologies for detecting over and underdigging tunnels, applying advanced imaging techniques that incorporate automation [18]. This capability is instrumental in ensuring that tunnels remain within specified parameters throughout the blasting process, minimizing the risk of structural failures.
To summarize, automation and advanced techniques are reshaping the landscape of tunnel blasting evaluation. The integration of 3D laser scanning, machine learning algorithms, and real-time data analytics enhances both the precision and efficiency of monitoring systems. As these technologies continue to advance, they will play an increasingly critical role in ensuring the safety and integrity of tunnel infrastructures, ultimately contributing to more effective and reliable blasting practices. The move towards automation not only streamlines operations but also empowers engineers to make data-informed decisions that enhance overall project outcomes.
3.5. Introduction to Half Porosity in Tunnel Blasting
Half porosity is a critical factor in evaluating the effectiveness of tunnel blasting, significantly influencing rock fragmentation and overall excavation quality. The presence of half porosity can affect the structural integrity of tunnel walls, impact the efficiency of blasting operations, and pose safety risks during construction. Recent advancements in the assessment and monitoring of half porosity have leveraged innovative techniques, particularly in the realm of three-dimensional image reconstruction and analysis.
Li et al. (2018) were pioneers in developing a digital identification technique for detecting half porosity in tunnel blasting. Utilizing 3D point cloud data extraction, their work provided a reliable framework for assessing the impacts of blasting on rock structures [15]. This method not only improved the accuracy of half porosity detection but also facilitated better monitoring of blasting outcomes, allowing for timely interventions if structural issues arose. The integration of advanced imaging techniques has thus proven essential in enhancing the understanding of how half porosity affects tunnel integrity.
Furthermore, Xie et al. (2019) proposed a method that combines machine vision with digital imaging to analyze the rock surface characteristics of tunnel excavation faces. This approach underscores the importance of understanding surface features and their correlation with half porosity, thereby contributing to more informed decision-making in blasting strategies [17]. By integrating visual analysis with structural assessments, researchers can better predict how half porosity may impact excavation efficiency and safety.
The ongoing research in this field emphasizes the need for accurate monitoring and assessment methods. For instance, Yang et al. (2020) developed techniques for detecting over and underdigging, which are critical in contexts where half porosity may affect excavation outcomes [18]. These methodologies contribute to a more comprehensive understanding of the interplay between blasting practices and rock characteristics, ensuring that potential risks associated with half porosity are effectively managed.
As a final point, the study of half porosity in tunnel blasting is gaining momentum, driven by advancements in imaging technology and analytical methods. The integration of 3D reconstruction and machine learning techniques presents new opportunities for accurately assessing the implications of half porosity on tunneling projects, ultimately leading to enhanced safety and efficiency in tunnel construction. As research progresses, it will be essential to continue exploring these innovative approaches to mitigate risks and optimize blasting outcomes.
4. Research on Image Acquisition and Theoretical Methods
4.1. Depth Image Acquisition
Camera calibration is the initial and crucial step in acquiring post-blast images at various depths within the tunnel. This is because camera calibration plays a vital role in the 3D reconstruction process, as its results directly impact the accuracy of the reconstructed object.
During the process of capturing post-blast images at different depths within the tunnel, the initial and crucial step is camera calibration. This step is essential because camera calibration is fundamental to the 3D reconstruction process; its outcomes directly influence the accuracy of the reconstructed objects. During the manufacturing of cameras, deviations in precision and component installation can lead to lens distortions, which subsequently cause image distortions. These image distortions can be classified into two primary types: pillow-shaped distortion and barrel-shaped distortion (as illustrated in Figure 2) [33]. Correcting these distortions, which are caused by lens aberrations, significantly improves the quality of stereo matching. Without such correction, straight lines in the real world may appear wavy or distorted in the images captured by the camera [34]. Fortunately, specialized calibration plugins are available to correct these types of aberrations, ensuring higher image accuracy. This correction process not only enhances the visual fidelity of the captured images but also plays a pivotal role in accurate 3D modeling and analysis, which are critical for assessing post-blast scenarios. Consequently, thorough and precise camera calibration becomes indispensable in the acquisition of reliable and accurate data for subsequent analysis and interpretation.

Figure 2.
Pillow distortion and barrel distortion.
An experimental camera should first be used to capture images of a black-and-white checkerboard grid to calibrate the camera. This calibration process can be executed using Matlab’s self-calibration function. We need to input the checkerboard grid image and provide the physical dimensions of the checkerboard squares, along with other necessary calibration parameters. The system will then automatically detect the corners of the checkerboard grid and proceed with the calibration. Upon completion of the calibration, several key metrics can be obtained, including the reprojection error for each corner in the current image (Figure 3a), the pixel variations in the image before and after calibration (represented by different colored lines in Figure 3b, which indicate the image quality before and after calibration), the Euclidean distances between the detected corner points and their corresponding projected coordinates (Figure 3c), and the attitude map of the camera’s coordinate system relative to the checkerboard grid (Figure 3d). These metrics are crucial for assessing the accuracy and reliability of the camera calibration, ensuring that the camera is properly calibrated for precise 3D reconstruction and analysis. By using these detailed calibration results, we can fine-tune the camera settings and improve the overall quality of the captured images, which is essential for accurate and reliable post-blast analysis [35,36].
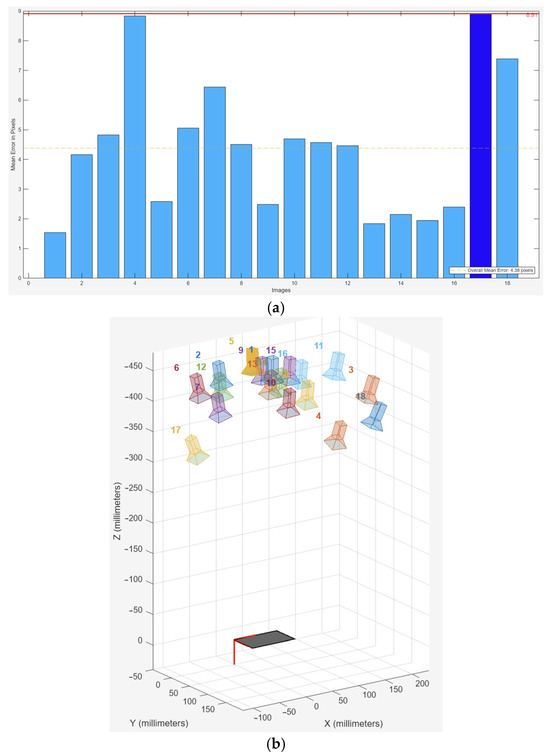
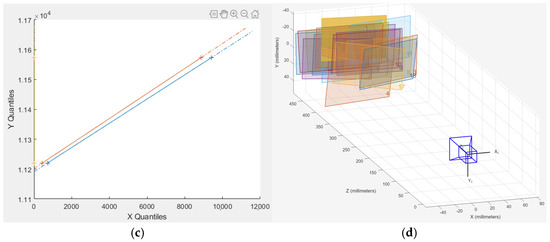
Figure 3.
(a) Reprojection error; (b) Euclidean distance; (c) Pixel Change Difference; (d) Chessboard position.
(1) The significant effect of tunnel explosions on the quality of depth image acquisition of the profile surface and palm face is vital to the accuracy of the 3D point cloud data model. This process is critical in the postprocessing of relevant data, thereby making the image acquisition phase the most pivotal part of the entire experiment. The experiment employs a Nikon Z50 mirrorless camera equipped with a 50–80 mm lens, a portable explosion-proof industrial-grade mine searchlight, and an industrial tape measure for capturing images. These tools are essential for ensuring high-quality image acquisition, which is a fundamental step in creating an accurate 3D model. The use of specialized equipment like the explosionproof searchlight helps to maintain consistent lighting conditions, which is crucial for obtaining clear and precise images necessary for depth analysis.
(2) Proper positioning of the camera is crucial. Two camera positions, as shown in Figure 4, should be selected for capturing images. These positions should be at the one-third and two-thirds points of the tunnel cross-section, at a straight-line distance of 6–8 m from the palm face, with the camera height set between 1.5 and 1.7 m. In Figure 4, the blue arrows represent the direction and angles of capture, while the red dot indicates the camera’s position and height. Correct camera placement ensures optimal angle and distance for capturing detailed images of the tunnel’s profile surface and palm face. This precise positioning is key to achieving high-quality depth images that are essential for constructing an accurate 3D point cloud data model. Properly positioned cameras help minimize distortions and capture comprehensive details, thereby enhancing the overall effectiveness of the experiment [37,38].
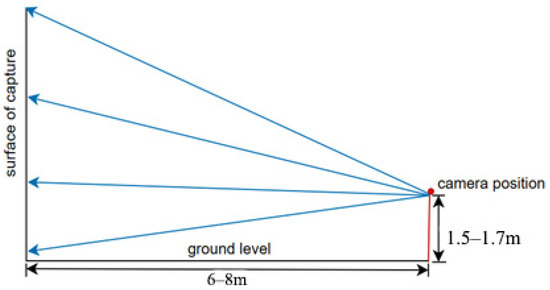
Figure 4.
Camera shooting position schematic.
(3) Adjustments to camera settings and lighting equipment are essential; the environmental conditions within the tunnel, characterized by dust and dim lighting resulting from explosions and construction operations, significantly increase the complexity of image acquisition, particularly when compared to outdoor photography. Therefore, it is necessary to finetune the camera parameters and lighting equipment before shooting to accommodate these unique tunnel conditions. Proper adjustment of camera settings, such as aperture and shutter speed, is crucial to ensure that the images captured are of high quality and suitable for subsequent analysis. Additionally, adjusting the lighting equipment to provide adequate illumination despite the challenging conditions will help in reducing shadows and enhancing the clarity of the captured images. This careful preparation is vital for obtaining accurate and reliable data from the tunnel environment.
(4) Image Acquisition Methodology. Seven photographs are taken from each of the two designated shooting positions on both the profile surface and palm face. Each image must overlap by at least 30% with the adjacent image to ensure accurate feature point matching during image processing (see Figure 5) [39]. During image capture, the camera lens should be perpendicular to the tunnel surface, maintaining a steady angle and avoiding any tilt or rotation. This precise alignment is crucial for minimizing distortions and ensuring that the captured images can be accurately stitched together during postprocessing. By adhering to these guidelines, the integrity of the feature points across the images is preserved, facilitating the creation of a reliable and detailed 3D point cloud model of the tunnel’s interior. Proper overlap between images also helps in reducing errors during the stitching process, ensuring a seamless and accurate representation of the tunnel surfaces.
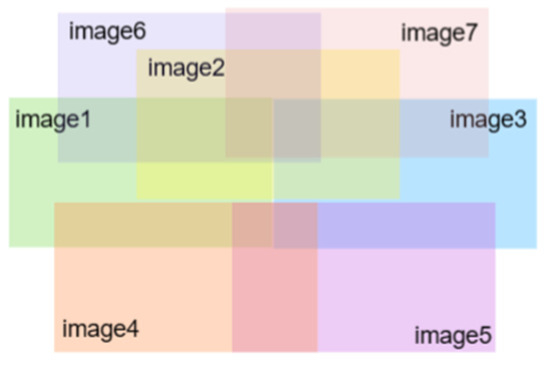
Figure 5.
Image Acquisition Schematic.
4.2. Scene 3D Reconstruction Study
After acquiring the post-blast depth images of the tunnel, the 3D reconstruction of the tunnel’s palm face and contour surface is conducted using the motion-based Structure from Motion (SfM) method. This method involves extracting and matching feature points from a series of 2D depth images containing motion information, ultimately reconstructing a highly accurate 3D point cloud model of the target object. The SfM method is particularly effective because it leverages the motion between images to identify and align corresponding feature points, resulting in a detailed and precise 3D representation [40]. This process ensures that the complex structures within the tunnel are accurately captured, providing valuable data for further analysis and evaluation of the tunnel’s condition post-blast. By utilizing this method, we can achieve a comprehensive and reliable 3D model that supports various engineering and research applications.
(1) Feature Point Detection and Scale Space Extreme Detection: Identifying feature points that exist in the same image at different scales involves generating a series of images at varying scales by continuously down-sampling and smoothing the original depth map [41]. This process ultimately identifies the feature points present in each image. The Gaussian kernel is the unique kernel capable of producing multiple scales. The image is convolved with Gaussian kernels of different scale space factors (standard deviations) to obtain depth maps with varying levels of blur [42]. These depth maps are then converted to the Gaussian scale space, as shown in the formula. The Gaussian scale space allows for the detection of feature points across different scales, ensuring that the most significant points are accurately identified regardless of their size or orientation. This method is crucial for robust feature matching in subsequent 3D reconstruction processes, as it provides a reliable set of feature points that can be used to align and integrate multiple images into a cohesive 3D model.
is the Gaussian kernel function and represents the Gaussian scale space of the image, and is the point corresponding to the point in image I, and is the scale coordinate, whose value is 0 in the original depth map, when the value becomes smaller the resolution will be higher accordingly, and the details in the image will be more obvious.
Remove unstable points. The extreme points in the scale space may be feature points, so it is necessary to search the 26 neighbors of each point in the Gaussian difference scale space, and if the point is a local extreme point, it is saved as a candidate key point. However, since the image is a discrete sampling of a continuous signal, the pixel-level extreme points obtained in the previous step may be inaccurate, and further computation is needed to determine the exact location of the key point. For each extreme point, a second-order Taylor expansion of the DoG function is performed:
By taking the derivative of the equation and making the derivative zero, the solution obtained is the offset of the extreme point:
, if the offset is greater than 0.5 in either dimension, then the extreme point has been offset to another pixel and needs to be culled. If the DoG value of the point is not large enough, it also needs to be culled:
As a rule of thumb, take up to this point, the part of feature point detection is completed.
(2) Feature point matching: after the step of feature point extraction is completed, the matching of feature points will be carried out, using Euclidean distance for neighborhood search and building a KD vocabulary tree to narrow down the search scope and improve the search efficiency. Denote the feature points around depth image I by denote the feature points around depth image I. For each set of depth images I and J, consider each feature, find the nearest neighbor feature vector
Using the data structure of the established KD vocabulary tree for the nearest neighbor matching calculation, the distance of the nearest neighbor is first made to be d1, and then the distance to the second nearest match is found to be d2, and if the ratio of the distances between the two points, d1, and d2, is less than the set threshold, then it can be determined to be an acceptable matching pair [43].
(3) Scene sparse reconstruction, each 3D pointXj, obtained after feature matching, is projected onto the 2D image plane of the camera through the projection equation, which produces a certain projection error, which is the actual distance between the real point on the image and the projected point [44] (Figure 6).

Figure 6.
Projection Error Schematic.
The sparse reconstruction of the target object based on the SFM algorithm starts with obtaining the relative rotations and translations by decomposing the essential matrix. The essential matrix satisfies the following relationship:
K is the intrinsic matrix of the camera, and with the matching point pairs in the form of chi-square coordinates, the essential matrix can be obtained stably by incorporating the RANSAC algorithm. By decomposing the essential matrix, we can obtain the two-view relative R and t.
The global rotation matrix is then calculated from the relative rotation matrix, Equation:
Splitting the Equation (8) and solving them sequentially and then combining them to get the results can reduce the reliability difference between the equations and the splitting results are as follows:
is the kth column of R [45,46,47].
Since the SFM algorithm is an iterative algorithm, it is necessary to continuously adjust the parameters and optimize the results in each step to obtain more accurate and stable results. For a viewpoint a and b trajectory on the same image, the objective of the projection error is optimized with the equation:
When camera i observes trajectory j is taken as 1, and 0 at other times, and is the cumulative sum of the projection errors of trajectory j in camera i. The purpose of the SFM algorithm is to optimize the objective function by finding suitable camera and scene parameters for the optimal reconstruction of the 3D scene [48,49]. After completing the 3D reconstruction of each image, they need to be fused to construct the geometric information of the whole scene, that is, the sparse 3D point cloud [42].
(4) Scene density reconstruction [50], after completing the step of sparse reconstruction, Poisson dense reconstruction of the 3D scene model is also needed to get a more detailed and complete 3D model. With the known camera position and the existing sparse reconstruction model, MVS is used to perform the dense reconstruction to find the points with pixel consistency in the space, then to find the image consistency through the camera position, and finally to get the dense point cloud to generate a smooth, continuous and precise 3D model.
The reconstructed 3D model consists of a myriad of 3D point coordinates, and the formation of a 3D point cloud is significantly different from the way a 2D image is formed. A 2D image is an optical phenomenon in which light from the environment is captured using a lens that produces an inverted image on a 2D image plane, which is then adjusted to form an orthographic image. In contrast, 3D point clouds are typically acquired using cameras, scanning instruments, sensors, and so on [51]. The main characteristics of 3D point clouds compared to traditional 2D image data are shown in Table 2.
Table 2.
Comparison of 2D image and 3D point cloud.
4.3. Analysis and Processing of Point Cloud Data
After obtaining the data for the 3D reconstruction of the borehole, it is essential to perform cutting point cloud filtering and denoising of the 3D model. This involves removing noise and irrelevant data points to enhance the quality and accuracy of the point cloud [52]. Additionally, curve fitting of the borehole point cloud projection data should be carried out based on the RANSAC (Random Sample Consensus) algorithm [53]. The RANSAC algorithm is particularly effective for fitting curves to data sets that contain a significant proportion of outliers. By iteratively selecting random subsets of the data and fitting a model to these subsets, RANSAC identifies the model that best represents the inlier data points, thereby ensuring a robust and accurate curve fitting. This process is crucial for accurately modeling the borehole’s geometry and for further analysis and applications in geological studies and engineering projects [54]. Properly filtered and fitted point cloud data enables more precise measurements and a better understanding of the borehole characteristics.
The RANSAC algorithm is a classical parameter estimation algorithm for estimating model parameters from datasets containing outliers. The basic idea is to find a model that fits the interior points best by random sampling and iteration. It has the advantage of being able to robustly estimate the model parameters and get better results even in the presence of a large number of outliers [55]. In order to reduce the computational effort, the RANSAC algorithm introduces a probability factor z and determines the number of iterations k based on the proportion of local interior points in the data set ω. The specific calculation method is:
denotes the probability that none of the selections are all bureau points, and denotes the probability that none of the selections are all bureau points. Then there are:
By setting the appropriate z and ω (where z is generally required to satisfy greater than 95%), a reasonable number of iterations can be determined based on the characteristics of the data set k. This reduces the amount of computation while ensuring that a sufficient number of the n points selected are local points and improves the accuracy of the fitting results [56].
After fitting the arc of the borehole, set a reasonable threshold to reject the arc of the borehole, and finally carry out the calculation of the halfhole rate and evaluate the blasting effect according to the evaluation criteria. The experimental flow chart is shown in Figure 7.
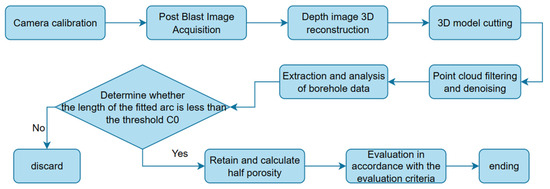
Figure 7.
Flow chart of the experiment.
5. Field Experimental Studies
5.1. Engineering Background
The new highspeed project of National Highway 109 is located in the Mentougou District of Beijing. The project begins at the Junzhuang Interchange on the Western Sixth Ring Road, extending through several areas including Junzhuang Town, Miaofengshan Town, and Zhaitang, ultimately reaching the municipal boundary near the Beijing–Hebei border. The total length of this highway is 65.535 km, designed for a target speed of 80 km per hour. The roadbed width from the Western Sixth Ring Road to Zhaitang is 33.0 m, while the width from Zhaitang to the municipal boundary is 28.5 m. The Huangtai Tunnel is situated within one of the project’s three work areas, as depicted in Figure 8. The left line of the Huangtai Tunnel measures 3967 m, while the right line measures 4014 m. The inclined shaft is located near Huangtai Village in Miaofengshan Township, with a line mileage of AK23 + 635. The distance from the inlet is 2155 m, and the distance from the outlet is 1859 m, as shown in Figure 9.

Figure 8.
Tunnel Location Map.

Figure 9.
Huangtai tunnel.
5.2. Image Acquisition and Model Reconstruction
The best time for image acquisition in the experiment is after the completion of slag removal from the palm face (Figure 10) and before the completion of the support lining. Although there may be lining cart advancement and surveyor’s placement operation (Figure 11) at this stage, the environment of dust and light inside the tunnel is more stable than that of other stages, which is the most suitable for image shooting and acquisition. The resulting depth image is cropped and pixel-adjusted and then imported into the relevant software for sparse reconstruction, and the reconstruction results are shown in Figure 12.
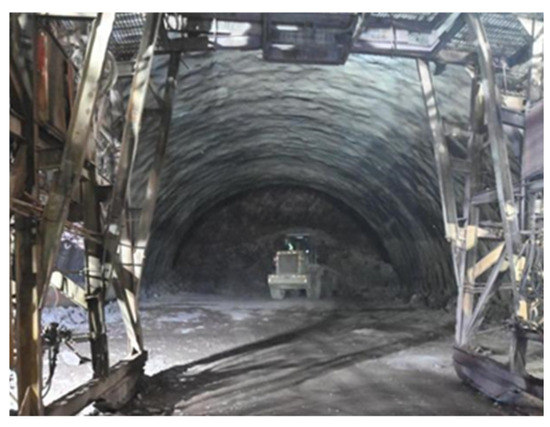
Figure 10.
Slagging after tunnel blast.

Figure 11.
Tunnel palm surface.
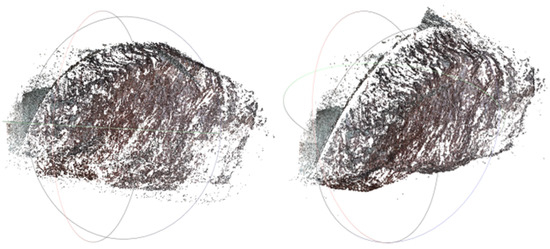
Figure 12.
Sparse reconstruction.
The point cloud model obtained from the sparse reconstruction is not fine enough for the next step of subprocessing, so it is necessary to use MVS for dense reconstruction to obtain a smooth and continuous dense point cloud model, as shown in Figure 13 [57].

Figure 13.
Dense reconstruction.
Taking the tunnel boring direction as the axis, the 3D point cloud model is rendered and colored according to the boring depth. In this model, the colors range from orange, yellow, green, to blue, representing decreasing boring depth—from the deepest areas (orange) to the shallowest areas (blue). A 3D scene scalar domain map can thus be obtained, facilitating the direct observation of the tunnel boring situation after the explosion and the subsequent cutting of the point cloud model (Figure 14).
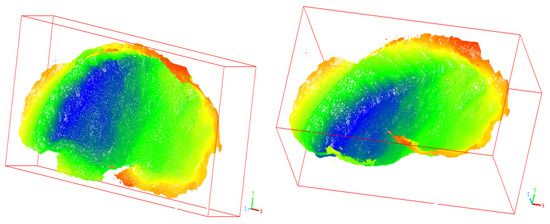
Figure 14.
Elevation ramp diagram.
5.3. Cutting of Tunnel Model After Explosion
After obtaining the 3D model of the post-burst scene of the tunnel, the whole model needs to be segmented using 3D point cloud processing software in order to obtain the next required research object, i.e., the contour surface residual hole model (Figure 15).

Figure 15.
Segmented point cloud model.
5.4. Point Cloud Filtering and Denoising Process
When acquiring depth images and point cloud data, due to the limitations of equipment accuracy, environmental factors, experimenters’ operating experience, changes in the surface properties of the measured object, and the influence of data splicing and alignment operation process, some noise points affecting the experimental results will appear in the point cloud data, so that the original point cloud data contains a large number of hash points and isolated points. Only in the filtering preprocessing will noise points, outliers, holes, data compression, and other filtering processing be used in order to better visualize and perform other subsequent applications.
The processing principle of filtering denoising is to fit a plane in the local range of the model and set a reasonable threshold to delete the points away from the plane as outliers so as to get a more accurate 3D model point cloud [58,59,60]. The specific filtering effect is shown in Figure 16.
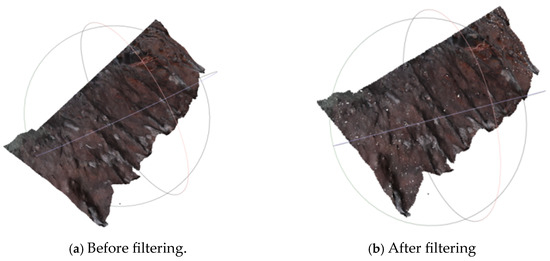
Figure 16.
Contrast before and after filtering.
5.5. Analysis of HalfHole Point Cloud Data
After obtaining the filtered and denoised 3D point cloud data, the halfhole point cloud data can be analyzed, and the curvature value is selected as the eigenvalue of the halfhole point cloud for analysis and processing.
The principle of the processing is as follows: the normal vector difference of the point cloud is used as the point cloud expression signal. If the curvature of the point cloud at a certain place of the 3D model is larger than the set threshold, the point cloud expresses a changing signal, and if the curvature of the point cloud at a certain place is smaller than the set threshold, the point cloud expresses an unchanging signal [61,62]. The halfhole point cloud coordinates data with curvature values as eigenvalues are visualized and colored according to curvature magnitude. In Figure 17, the colors range from orange to blue, where orange, yellow, and green represent higher curvature values, and blue represents lower curvature values. Thank you for your comment. In Figure 17, the different colors represent the curvature magnitude at various points of the model. The color gradient ranges from orange (indicating higher curvature) to blue (indicating lower curvature). We have added this explanation to the text for clarity. Please let us know if any further clarification is needed.
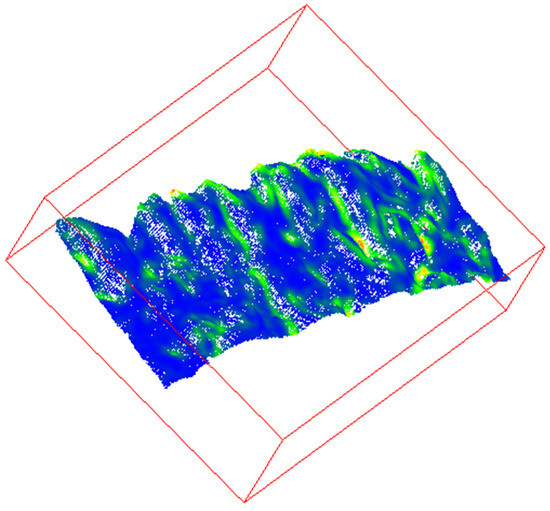
Figure 17.
Visualization of halfhole point cloud data.
As shown in the figure above, in the actual construction process of the project, the retention of the blast holes after blasting is often not very good, and only through the visualization of the point cloud data can we get the desired results, so it is necessary to carry out a more in-depth analysis of the point cloud model. After the 3D point cloud model is cut again, the point cloud model of a single gun hole is extracted for analysis (Figure 18). Similar to Figure 17, the colors in Figure 18 represent the curvature magnitude, with orange indicating higher curvature values and blue indicating lower curvature values, providing further insights into the detailed geometry of the blast hole.

Figure 18.
Extraction and Analysis of Single Blast Hole Point Cloud Model.
The 3D point cloud coordinates of individual boreholes were projected onto a plane perpendicular to the borehole axis, with the colors representing the curvature magnitude. In Figure 19, orange indicates areas of higher curvature, while blue represents areas of lower curvature (Figure 19).

Figure 19.
Borehole point cloud projection.
In a large amount of noise data, according to the chance of occurrence of the correct data on the sampling data for random selection, according to the law of large numbers, stochastic simulation can be approximated by the correct results obtained so as to halfhole point cloud projection data fitted to the target circle can be obtained halfhole aperture diameter as well as the location of the center of the circle. The colors in Figure 20 represent the curvature magnitude, and the small circle in the middle indicates the location of the center of the circle based on curvature fitting. The effect of the fit is shown in Figure 20.
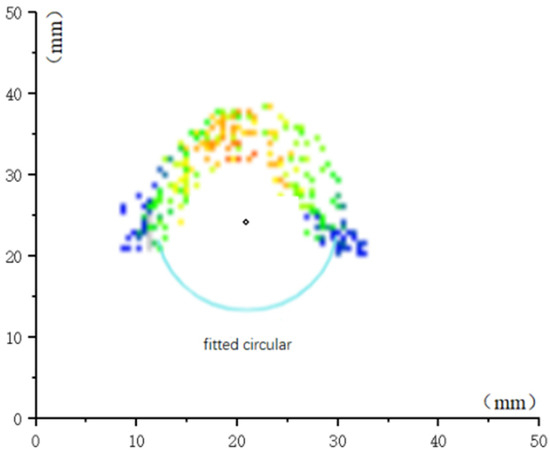
Figure 20.
Schematic diagram of arc fitting.
The straight line through which the center of the fitted circle passes is the halfhole axis. The 3D point cloud processing software was used to fit the cylinder using the halfhole axis as the center axis and the radius of the fitted circle as the bottom radius, intersecting the halfhole point cloud model.
The point clouds located inside the cylinder were labeled as compliant halfhole point cloud data. With a spacing of d = 3 cm on the fitted cylinder along the direction of the central axis of the slice cut, and each cutting plane again using the RANSAC algorithm for fitting, calculated the arc length C of the fitted circular arc, set the threshold C0 = πr (65 mm), when the arc length C is greater than the threshold value of C0, the halfhole segments are considered to be noncompliant with the requirements, need to be removed; when the arc length C is less than the threshold value of C0, it is believed that the halfhole segment is compliant with the requirements. The recognition effect of a single borehole is shown in Figure 21.
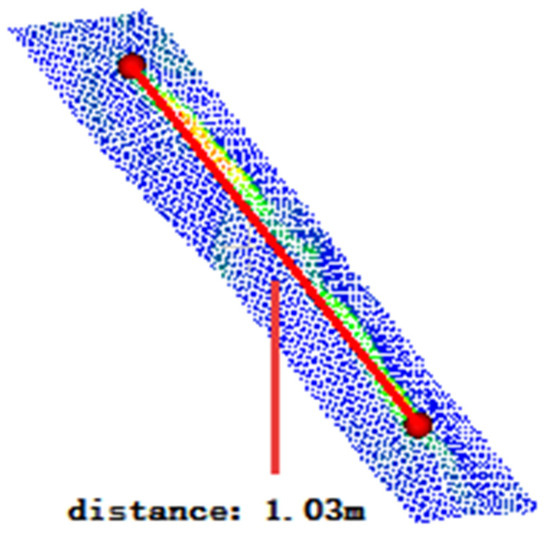
Figure 21.
Individual borehole identification.
6. Verification of Blast Hole Digit Recognition Method Applied in Tunnels
6.1. Results of Engineering Experiments
The point cloud data model of each borehole in the half-hole point cloud model was extracted sequentially, the analysis and processing of the above steps were carried out. The boreholes were numbered 1–6 to represent their respective positions and shapes as identified through the analysis. The 3D point cloud processing software was then used to calculate the length of each borehole, and the results are shown in Figure 22. The fitting of the half-hole positions is shown in Figure 23.

Figure 22.
Borehole Length Diagram.
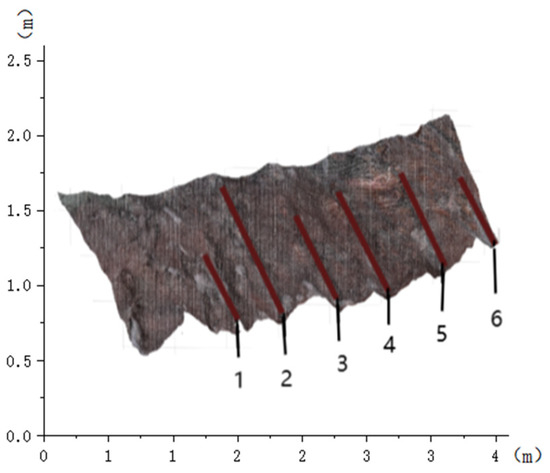
Figure 23.
Borehole Fitting Position.
Comparison and analysis of the fitted borehole data with the site construction design parameters (the design value of the site borehole length is 2 m), and finally, get the half porosity of the tunnel after blasting (Table 3).
Table 3.
Identification table of halfhole point cloud data.
According to the geological exploration at the construction site, the stratum lithology of Huangtai Tunnel is mainly limestone, dolomite, and sandstone, and the groundwater has not been developed. The surrounding rocks are of Class III, IV, and V, of which Class III is 3315 m, Class IV is 2952 m, and Class V is 1714 m. The data collected from the experiment are located in Class IV and Class V, which are medium-hard rocks. The quality evaluation standard of half porosity after tunnel blasting is shown in Table 4.
Table 4.
Quality criteria for evaluating half porosity.
The experimental data indicate a peripheral half-porosity of 58.7%, which is classified as medium according to the evaluation criteria. To validate the accuracy of the measurements taken using this method, site construction personnel also employed the traditional half-porosity measurement method when the half-porosity approached 60%. The results obtained from both methods showed relatively small discrepancies.
6.2. Discussion
As tunnel construction projects grow increasingly complex, the demand for highly accurate and efficient detection methods continues to escalate. Recent advancements in integrating 3D laser scanning with artificial intelligence and UAV measurement technologies offer promising avenues to address these needs [63] For instance, Li et al. proposed a 3D reconstruction method for tunnel surfaces based on point cloud data, specifically addressing issues of high data volume and redundancy that often complicate surface reconstruction [64]. Similarly, XuRan Li and colleagues emphasized the critical role of precision in data acquisition, introducing a method that combines 3D laser scanning with blast-site data to assess the impact on halfhole structures, further underlining the need for exacting detail in post-blast assessments [65].
Despite the effectiveness of technologies like 3D laser scanners and UAVs, our approach offers substantial cost savings without compromising accuracy [66]. The deployment of advanced digital imaging technologies, particularly high-resolution cameras and precision scanners, significantly enhances post-blast assessments by capturing high-detail visual data [67]. Through cutting-edge photographic and scanning techniques, this data enables an unprecedented depth of analysis. Specialized 3D reconstruction software, such as Matlab 2024a, CloudCompare2.13.2, and COLMAP 3.5, processes the data rapidly, delivering precise visualizations of post-blast conditions and enabling immediate acquisition of blast-depth measurements. Such efficiency is vital in modern tunnel construction, where timely and accurate data underpin the optimization of blast parameters, operational continuity, and project efficiency.
The ability to make data-driven adjustments based on these insights is invaluable in enhancing both the efficacy and quality of tunnel blasting. Real-time adjustments informed by comprehensive data play a pivotal role not only in immediate operational decisions but also in broader structural design, safety protocols, and long-term project planning. By delivering a holistic evaluation of blast quality from multiple perspectives, this method ensures that tunneling projects adhere to rigorous standards of safety and efficiency. While this study focuses on road tunnels, the findings are directly transferable to mining operations, such as open-pit blasting, underscoring the method’s adaptability across varied geological conditions and its practical value for projects with unique structural and environmental challenges.
However, the precision of these methods remains sensitive to environmental factors, such as dust and suboptimal lighting—conditions that are often prevalent in tunnel settings. Future research should prioritize refining these technologies to better handle such challenges, potentially through advanced filtering algorithms and calibration techniques that can mitigate the impacts of environmental variables on data quality. As digital imaging technology continues to advance, overcoming these limitations will be essential for further improving the accuracy and reliability of data capture in tunnel engineering [68].
7. Conclusions
This study presents a thorough review of the current state of tunnel blasting evaluation, organized into five critical areas: Blasting Techniques and Optimization, 3D Reconstruction and Visualization, Monitoring and Assessment Technologies, Automation and Advanced Techniques, and Half Porosity in Tunnel Blasting. Each section provides an in-depth analysis of recent advancements and ongoing research, showcasing the rapid evolution in tunnel blasting methodologies and highlighting key areas for continued innovation. The growing application of digital technologies in this field reflects a concerted effort to improve precision, operational efficiency, and safety in tunnel engineering.
Building upon this foundation, we introduce a novel technique for half porosity recognition that utilizes computer vision to enhance post-blast analysis in tunnel construction. This approach leverages advanced 3D reconstruction principles to provide a non-intrusive, rapid, and accurate assessment of tunnel blast quality. By capturing high-resolution depth images with a handheld digital camera and applying the Structure-from-Motion (SfM) algorithm, our method enables precise visual and quantitative evaluation of the palisade surface and tunnel contour. Additionally, specialized software processes the 3D point cloud model using the Random Sample Consensus (RANSAC) algorithm to calculate half porosity based on the arc length of fitted curves.
Compared to traditional methods, this technique offers several advantages: it reduces costs, expands the detection range, and achieves higher accuracy without disrupting ongoing construction activities. The practical value of this method was validated through field experiments on the Huangtai Tunnel segment of China’s National Highway 109, where the calculated half porosity of 58.7% closely aligned with conventional measurements of 60%. The minimal deviation observed demonstrates not only the method’s robustness but also its potential to surpass the accuracy of traditional approaches. Furthermore, these findings underscore the broader applicability of our method to other geotechnical and mining contexts, such as open-pit blasting, where precise post-blast assessment is equally critical.
In addition to improving tunnel blasting practices, this study paves the way for further technological integration in subsurface construction. The combination of computer vision, 3D reconstruction, and algorithmic analysis represents a significant step toward more sophisticated and scalable blast evaluation techniques. Future research will benefit from exploring enhancements such as machine learning algorithms for predictive modeling, enabling proactive adjustments to blasting parameters based on site-specific geological data. Additionally, real-time data processing capabilities will further expand the practical utility of this method, facilitating immediate feedback that can inform decision-making throughout the blasting process.
As the demands of modern tunnel engineering continue to grow, the integration of these advanced digital methods promises not only to improve operational safety and efficiency but also to contribute to more sustainable and cost-effective practices. By setting a new standard for accuracy and practicality in blasting assessments, this approach aligns with the ongoing shift toward digitalization in construction, underscoring the importance of adopting innovative solutions in challenging engineering environments.
Author Contributions
Conceptualization, J.S., H.A., Y.W., Z.Y. and W.S.; methodology, H.A., J.S., Y.W., and Z.Y.; software, J.S., Y.W. and Z.Y.; validation, Y.W. and Z.Y.; formal analysis, J.S. and H.A.; investigation, J.S., Z.Y. and W.S.; resources, J.S.; data curation, Y.W. and Z.Y.; writing—original draft preparation, Y.W. and Z.Y.; writing—review and editing, H.A., J.S. and Y.W.; visualization, Z.Y. and W.S.; supervision, J.S. and H.A.; project administration, H.A. and J.S.; funding acquisition, H.A. and J.S. All authors have read and agreed to the published version of the manuscript.
Funding
This research was in part supported by the Yunnan Province “Caiyun” Postdoctoral Innovative Project Plan (No. CG24056E004A).
Institutional Review Board Statement
Not applicable.
Informed Consent Statement
Not applicable.
Data Availability Statement
The data used to support the findings of this study are available from the corresponding author upon request.
Conflicts of Interest
The authors declare no conflict of interest.
References
- Zhang, W.; Liu, D.; Tang, Y.; Qiu, W.; Zhang, R. Multifractal Characteristics of Smooth Blasting Overbreak in Extra-Long Hard Rock Tunnel. Fract. Fract. 2023, 7, 842. [Google Scholar] [CrossRef]
- Wang, S.; Gong, M.; Wu, H.; Wu, X.; Liu, X. Optimization Study of Water Interval Charge Structure Based on the Evaluation of Rock Damage Effect in Smooth Blasting. Appl. Sci. 2024, 14, 2868. [Google Scholar] [CrossRef]
- Holmberg, R. Design of tunnel perimeter blasthole patterns to prevent rock damage. In Proceedings of the 2nd International Symposium on Tunnelling ’79, London, UK, 3–6 February 1979; pp. 280–283. [Google Scholar]
- Marr, D. Vision: A Computational Investigation into the Human Representation and Processing of Visual Information; MIT Press: Cambridge, MA, USA, 2010. [Google Scholar]
- Hagan, T.N. The influence of controllable blast parameters on fragmentation and mining costs. In Proceedings of the 1st International Symposium on Rock Fragmentation by Blasting, Luleå, Sweden, 23–26 August 1983; Volume 1, pp. 31–32. [Google Scholar]
- Hartley, R.; Zisserman, A. Multiple View Geometry in Computer Vision; Cambridge University Press: Cambridge, UK, 2003. [Google Scholar]
- Lowe, D.G. Distinctive image features from scale-invariant keypoints. Int. J. Comput. Vis. 2004, 60, 91–110. [Google Scholar] [CrossRef]
- Remondino, F.; El-Hakim, S. Image-based 3D modelling: A review. Photogramm. Rec. 2006, 21, 269–291. [Google Scholar] [CrossRef]
- Hirschmuller, H. Stereo processing by semiglobal matching and mutual information. IEEE Trans. Pattern Anal. Mach. Intell. 2007, 30, 328–341. [Google Scholar] [CrossRef]
- Westoby, M.J.; Brasington, J.; Glasser, N.F.; Hambrey, M.J.; Reynolds, J.M. Structure-from-Motion photogrammetry: A low-cost, effective tool for geoscience applications. Geomorphology 2012, 179, 300–314. [Google Scholar] [CrossRef]
- Nuttens, T.; Stal, C.; De Backer, H.; Schotte, K.; Van Bogaert, P.; De Wulf, A. Methodology for the ovalization monitoring of newly built circular train tunnels based on laser scanning. Automat. Constr. 2014, 43, 1–9. [Google Scholar] [CrossRef]
- Francioni, M.; Salvini, R.; Stead, D.; Litrico, S. A Case Study Integrating Remote Sensing and Distinct Element Analysis to Quarry Slope Stability Assessment in the Monte Altissimo Area, Italy. Eng. Geol. 2014, 183, 290–302. [Google Scholar] [CrossRef]
- Mukupa, W.; Roberts, G.W.; Hancock, C.M.; Al-Manasir, K. A review of the use of terrestrial laser scanning application for change detection and deformation monitoring of structures. Surv. Rev. 2016, 49, 99–116. [Google Scholar] [CrossRef]
- Cheng, Y.; Qiu, W.; Lei, J. Automatic Extraction of Tunnel Lining Cross-Sections from Terrestrial Laser Scanning Point Clouds. Sensors 2016, 16, 1648. [Google Scholar] [CrossRef] [PubMed]
- Lin, Y. Research on Key Technology of Tunnel Point Cloud Data Processing and Visualization. Ph.D. Thesis, China University of Mining and Technology, Beijing, China, 2017. [Google Scholar]
- Li, X.; Shi, F.; Liao, X. Digital Detection Technology for Half Porosity Based on 3D Point Cloud. Eng. Blasting 2018, 24, 45–49. [Google Scholar]
- Qiu, Z.; Li, H.; Hu, W.; Wang, C.; Liu, J.; Sun, Q. Real-Time Tunnel Deformation Monitoring Technology Based on Laser and Machine Vision. Appl. Sci. 2018, 8, 2579. [Google Scholar] [CrossRef]
- Xie, Z.; Chen, B.; Fu, J. Digital Identification Method and Application of Tunnel Face Rock Mass Structure Based on 3D Reconstruction Technology of Machine Vision. J. Railw. Sci. Eng. 2019, 16, 1001–1007. [Google Scholar]
- Yang, J.; Zhang, Y.; Zhu, Z.; Fu, J.; Xie, Z.; Wang, L. Study on tunnel under-over break detection method based on 3D reconstruction. J. Cent. South Univ. 2020, 51, 714–723. [Google Scholar]
- Li, Y.; Zhuo, Y.; Wu, Y.; Zheng, R.; Su, G.; Wen, Y.; Ceng, G. Application of Over-Under-Cut Algorithm in Tunnel Excavation Based on 3D Laser Scanning Technology. Railw. Stand. Des. 2021, 65, 200–204. [Google Scholar]
- Jiang, Q.; Shi, Y.; Yan, F.; Zheng, H.; Kou, Y.; He, B. Reconstitution method for tunnel spatiotemporal deformation based on 3D laser scanning technology and corresponding instability warning. Eng. Fail. Anal. 2021, 125, 105391. [Google Scholar] [CrossRef]
- Li, Z.; Shan, J. RANSAC-based multi primitive building reconstruction from 3D point clouds. ISPRS J. Photogramm. Remote Sens. 2022, 185, 247–260. [Google Scholar] [CrossRef]
- Yang, L.; Li, Y.; Li, X.; Meng, Z.; Luo, H. Efficient plane extraction using normal estimation and RANSAC from 3D point cloud. Comput. Stand. Interfaces 2022, 82, 103608. [Google Scholar] [CrossRef]
- Ai, Z.; Bao, Y.; Guo, F.; Kong, H.; Bao, Y.; Lu, J. Central Axis Elevation Extraction Method of Metro Shield Tunnel Based on 3D Laser Scanning Technology. J. Beijing Univ. Technol. 2023, 26, 68–71+77. [Google Scholar]
- Ji, A.; Zhou, Y.; Zhang, L.; Tiong, R.L.K.; Xue, X. Semi-supervised learning-based point cloud network for segmentation of 3D tunnel scenes. Automat. Constr. 2023, 146, 104668. [Google Scholar] [CrossRef]
- Xue, Y.; Zhang, S.; Zhou, M.; Zhu, H. Novel SfM-DLT method for metro tunnel 3D reconstruction and Visualization. Undergr. Space 2021, 6, 134–141. [Google Scholar] [CrossRef]
- Bao, Y.; Wen, Y.; Tang, C.; Sun, Z.; Meng, X.; Zhang, D.; Wang, L. Three-Dimensional Point Cloud Denoising for Tunnel Data by Combining Intensity and Geometry Information. Sustainability 2024, 16, 2077. [Google Scholar] [CrossRef]
- Dotto, M.S.; Pourrahimian, Y. The Influence of Explosive and Rock Mass Properties on Blast Damage in a Single-Hole Blasting. Mining 2024, 4, 168–188. [Google Scholar] [CrossRef]
- Amenta, N.; Choi, S.; Kolluri, R.K. The power crust, unions of balls, and the medial axis transform. Comput. Geom. 2001, 19, 127–153. [Google Scholar] [CrossRef]
- Martín-Martín, A.; Orduna-Malea, E.; Thelwall, M.; Delgado López-Cózar, E. Google Scholar, Web of Science, and Scopus: A systematic comparison of citations in 252 subject categories. J. Informetr. 2018, 12, 1160–1177. [Google Scholar] [CrossRef]
- Higgins, J.P.; Green, S. Cochrane Handbook for Systematic Reviews of Interventions; Wiley: Chichester, UK, 2019. [Google Scholar]
- Moher, D.; Liberati, A.; Tetzlaff, J.; Altman, D.G.; PRISMA Group. Preferred reporting items for systematic reviews and meta-analyses: The PRISMA statement. PLoS Med. 2009, 6, e1000097. [Google Scholar] [CrossRef]
- Chari, V.; Veeraraghavan, A. Lens Distortion, Radial Distortion. In Computer Vision; Ikeuchi, K., Ed.; Springer: Cham, Switzerland, 2021. [Google Scholar]
- Janiszewski, M.; Torkan, M.; Uotinen, L.; Rinne, M. Rapid Photogrammetry with a 360-Degree Camera for Tunnel Mapping. Remote Sens. 2022, 14, 5494. [Google Scholar] [CrossRef]
- Xiong, P.; Wang, S.; Wang, W.; Ye, Q.; Ye, S. Model-Independent Lens Distortion Correction Based on Sub-Pixel Phase Encoding. Sensors 2021, 21, 7465. [Google Scholar] [CrossRef]
- Álvarez, H.; Alonso, M.; Sánchez, J.R.; Izaguirre, A. A Multi Camera and Multi Laser Calibration Method for 3D Reconstruction of Revolution Parts. Sensors 2021, 21, 765. [Google Scholar] [CrossRef]
- Stelldinger, P.; Schönherr, N.; Biermann, J. PuzzleBoard: A New Camera Calibration Pattern with Position Encoding. In Proceedings of the German Conference on Pattern Recognition (GCPR 2024), Munich, Germany, 10–13 September 2024. [Google Scholar]
- Zhao, H.; Hu, Q. 3D Reconstruction and Rendering Visualization of Tunnel Point Cloud. Int. Arch. Photogramm. Remote Sens. Spat. Inf. Sci. 2022, 48, 93–101. [Google Scholar] [CrossRef]
- Zhang, R.; Jing, M.; Yi, X.; Li, H.; Lu, G. Dense Reconstruction for Tunnels Based on the Integration of Double-Line Parallel Pho-tography and Deep Learning. Int. Arch. Photogramm. Remote Sens. Spat. Inf. Sci. 2022, 43, 1117–1123. [Google Scholar] [CrossRef]
- Xue, Y.; Shi, P.; Jia, F.; Huang, H. 3D reconstruction and automatic leakage defect quantification of metro tunnel based on SfM-Deep learning method. Undergr. Space 2022, 7, 311–323. [Google Scholar] [CrossRef]
- Merras, M.; El Hazzat, S.; Bouazi, A.; Chana, I.; El Akkad, N.; Satori, K. Camera self-calibration with varying parameters based on planes basis using particle swarm optimization. Vis. Comput. 2023, 39, 3109–3122. [Google Scholar] [CrossRef]
- Yan, S.; Ma, M. Image Stitching based on an Improved SIFT Algorithm. In Proceedings of the 7th International Conference on Electronic Technology and Information Science (ICETIS), Harbin, China, 21–23 January 2022; pp. 1–5. [Google Scholar]
- Zhang, F.; Gao, Y.; Xu, L. An adaptive image feature matching method using mixed Vocabulary-KD tree. Multimed. Tools Appl. 2020, 79, 16421–16439. [Google Scholar] [CrossRef]
- Chao, C.; Han, Z.; Liu, Y.; Zwicker, M. Unsupervised Learning of Fine Structure Generation for 3D Point Clouds by 2D Projection Matching. In Proceedings of the 2021 IEEE/CVF International Conference on Computer Vision (ICCV), Montreal, QC, Canada, 10–17 October 2021; pp. 12446–12457. [Google Scholar]
- Son, M.; Ko, K. Learning-based essential matrix estimation for visual localization. J. Comput. Des. Eng. 2022, 9, 1097–1106. [Google Scholar] [CrossRef]
- Barath, D.; Cavalli, L.; Pollefeys, M. Learning to Find Good Models in RANSAC. In Proceedings of the 2022 IEEE/CVF Conference on Computer Vision and Pattern Recognition (CVPR), New Orleans, LA, USA, 18–24 June 2022; pp. 15723–15732. [Google Scholar]
- Cui, H.; Gao, X.; Shen, S.; Hu, Z. HSfM: Hybrid Structure-from-Motion. In Proceedings of the 2017 IEEE Conference on Computer Vision and Pattern Recognition (CVPR), Honolulu, HI, USA, 21–26 July 2017; pp. 2393–2402. [Google Scholar]
- Liu, L.; Wang, C.; Feng, C.; Gong, W.; Zhang, L.; Liao, L. Incremental SFM 3D Reconstruction Based on Deep Learning. Electronics 2024, 13, 2850. [Google Scholar] [CrossRef]
- Wang, C.; Wang, X.; Zhang, J.; Zhang, L.; Bai, X.; Ning, X.; Zhou, J.; Hancock, E. Uncertainty estimation for stereo matching based on evidential deep learning. Pattern Recognit. 2022, 124, 108498. [Google Scholar] [CrossRef]
- Pan, H.; Guan, T.; Luo, Y.; Duan, L.; Tian, Y.; Yi, L.; Zhao, Y.; Yu, J. Dense 3D reconstruction combining depth and RGB information. Neurocomputing 2016, 175, 644–651. [Google Scholar] [CrossRef]
- Xu, C.; Yang, S.; Galanti, T.; Wu, B.; Yue, X.; Zhai, B.; Zhan, W.; Vajda, P.; Keutzer, K.; Tomizuka, M. Image2Point: 3D Point-Cloud Understanding with 2D Image Pretrained Models. In Computer Vision—ECCV 2022: 17th European Conference; Springer: Cham, Switzerland, 2022; pp. 638–656. [Google Scholar]
- Huang, H.; Li, D.; Zhang, H.; Ascher, U.; Cohen-Or, D. Consolidation of unorganized point clouds for surface reconstruction. ACM Trans. Graph. 2009, 28, 1–7. [Google Scholar] [CrossRef]
- Ke, J.; Watras, A.J.; Kim, J.-J.; Liu, H.; Jiang, H.; Hu, Y.H. Efficient online real-time video stabilization with a novel least squares formulation and parallel AC-RANSAC. J. Vis. Commun. Image Represent 2023, 96, 103922. [Google Scholar] [CrossRef] [PubMed]
- Li, X.; Chen, J.; Zhu, H. A new method for automated discontinuity trace map on rock mass 3D surface model. Comput. Geosci. 2016, 89, 118–131. [Google Scholar] [CrossRef]
- Martínez-Otzeta, J.M.; Rodríguez-Moreno, I.; Mendialdua, I.; Sierra, B. RANSAC for Robotic Applications: A Survey. Sensors 2023, 23, 327. [Google Scholar] [CrossRef] [PubMed]
- Wei, T.; Patel, Y.; Shekhovtsov, A.; Matas, J.; Barath, D. Generalized Differentiable RANSAC. In Proceedings of the 2023 IEEE/CVF International Conference on Computer Vision (ICCV), Paris, France, 1–6 October 2023; pp. 17603–17614. [Google Scholar]
- Schönberger, J.L.; Frahm, J.M. Structure-from-Motion Revisited. In Proceedings of the 2016 IEEE Conference on Computer Vision and Pattern Recognition (CVPR), Las Vegas, NV, USA, 27–30 June 2016; pp. 4104–4113. [Google Scholar]
- Rusu, R.B.; Cousins, S. 3D is here: Point Cloud Library (PCL). In Proceedings of the 2011 IEEE International Conference on Robotics and Automation, Shanghai, China, 9–13 May 2011; pp. 1–4. [Google Scholar]
- Wang, L.; Chen, Y.; Song, W.; Xu, H. Point Cloud Denoising and Feature Preservation: An Adaptive Kernel Approach Based on Local Density and Global Statistics. Sensors 2024, 24, 1718. [Google Scholar] [CrossRef]
- Bae, K.H.; Lichti, D. A method for automated registration of unorganised point clouds. ISPRS J. Photogramm. Remote Sens. 2008, 63, 36–54. [Google Scholar] [CrossRef]
- Rabbani, T.; Heuvel, F.V.; Vosselman, G. Segmentation of Point Clouds Using Smoothness Constraint. ISPRS Comm. V Symp. Image Eng. Vis. Metrol. 2006, XXXVI, 248–253. [Google Scholar]
- Pauly, M.; Keiser, R.; Gross, M. Multi-scale Feature Extraction on Point-Sampled Surfaces. Comput. Graph. Forum 2003, 22, 281–289. [Google Scholar] [CrossRef]
- Han, Y.; Feng, D.; Wu, W.; Yu, X.; Wu, G.; Liu, J. Geometric shape measurement and its application in bridge construction based on UAV and terrestrial laser scanner. Automat. Constr. 2023, 151, 104880. [Google Scholar] [CrossRef]
- Li, J.; Song, C.; Lin, J. Research on 3D Reconstruction Method for Tunnel Surface Based on Point Cloud Data. Urban Surveying 2021, 6, 90–94+99. [Google Scholar]
- Li, X.; Shi, F.; Liao, X.; Li, F. Digital detection technology for smooth blasting semi-hole ratio based on 3D point clouds. Eng. Blasting 2018, 24, 45–49. [Google Scholar]
- Fang, L.W. Application Analysis of 3D Laser Scanning Technology in Tunnel Engineering. Surv. Mapp. Spat. Geogr. Inf. 2023, 46, 163–165. [Google Scholar]
- Xuan, J.Z.; Ning, Z.; Shuang, Y.X. Data on point cloud scanning and ground radar of composite lining in jointly constructed tunnel. Data Brief 2022, 41, 107993. [Google Scholar]
- Zou, Z.; Lang, H.; Lou, Y.; Lu, J. Plane-based global registration for pavement 3D reconstruction using hybrid solid-state LiDAR point cloud. Automat. Constr. 2023, 152, 104907. [Google Scholar] [CrossRef]
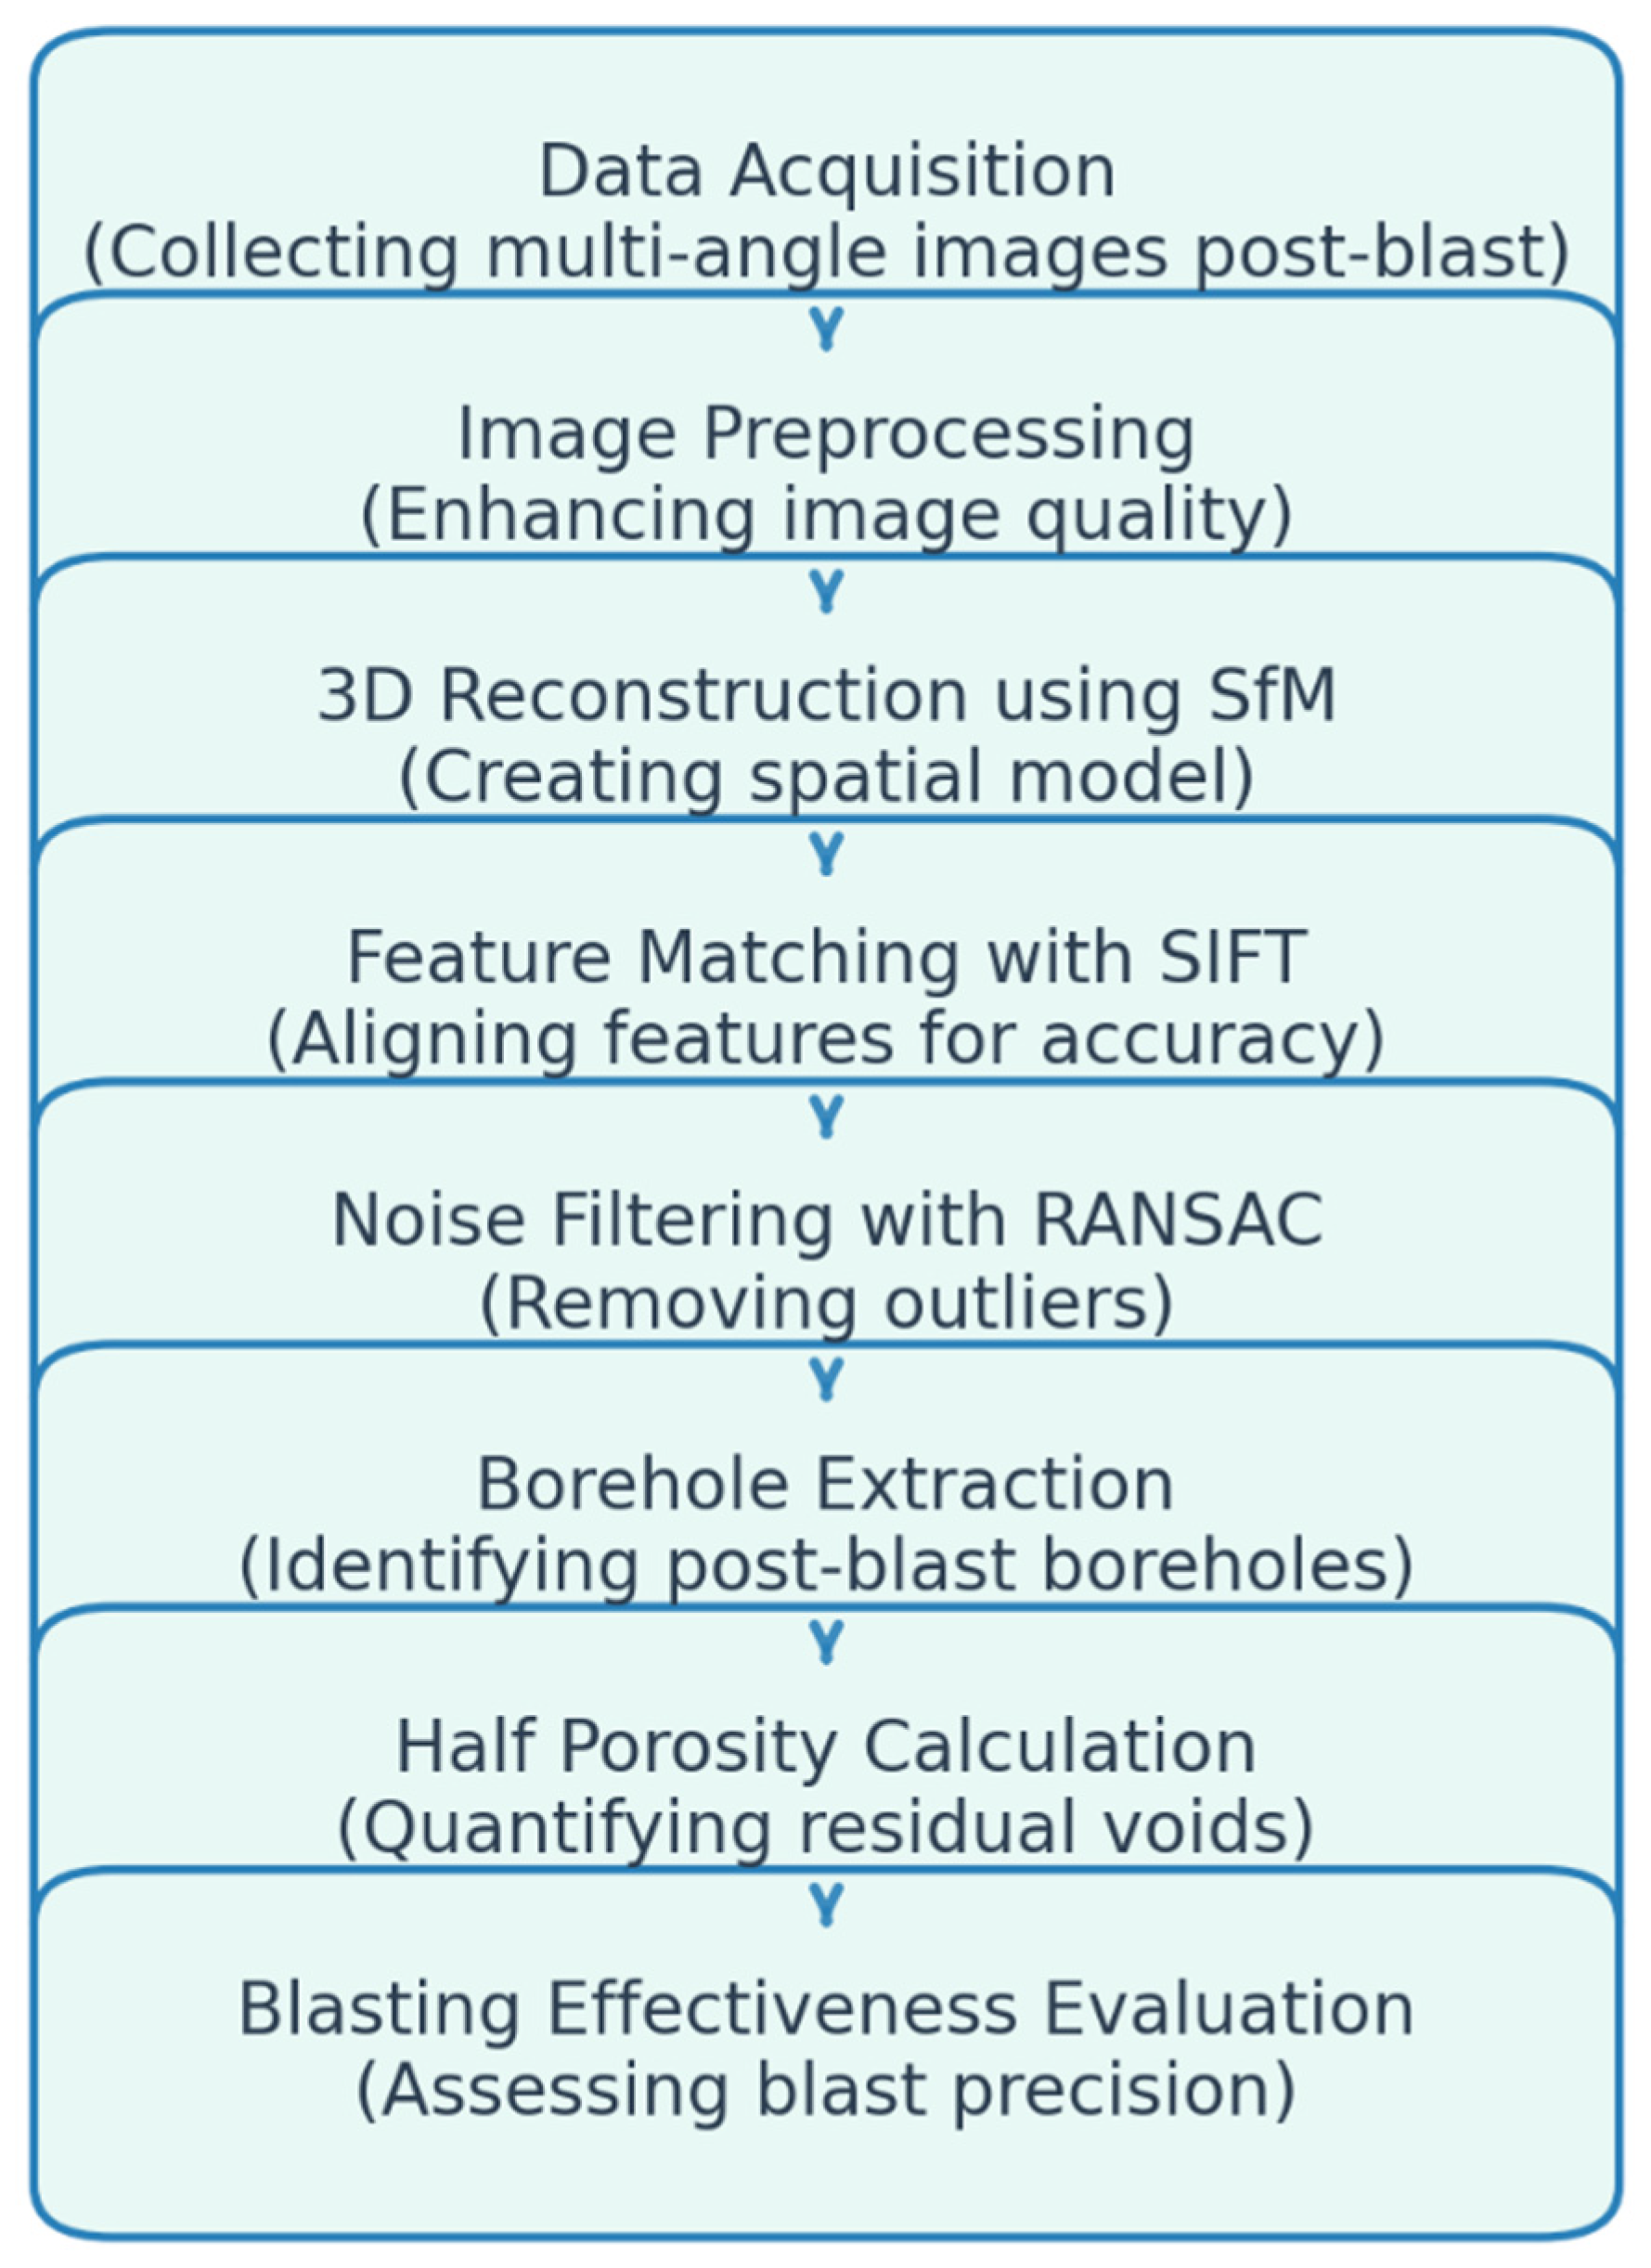
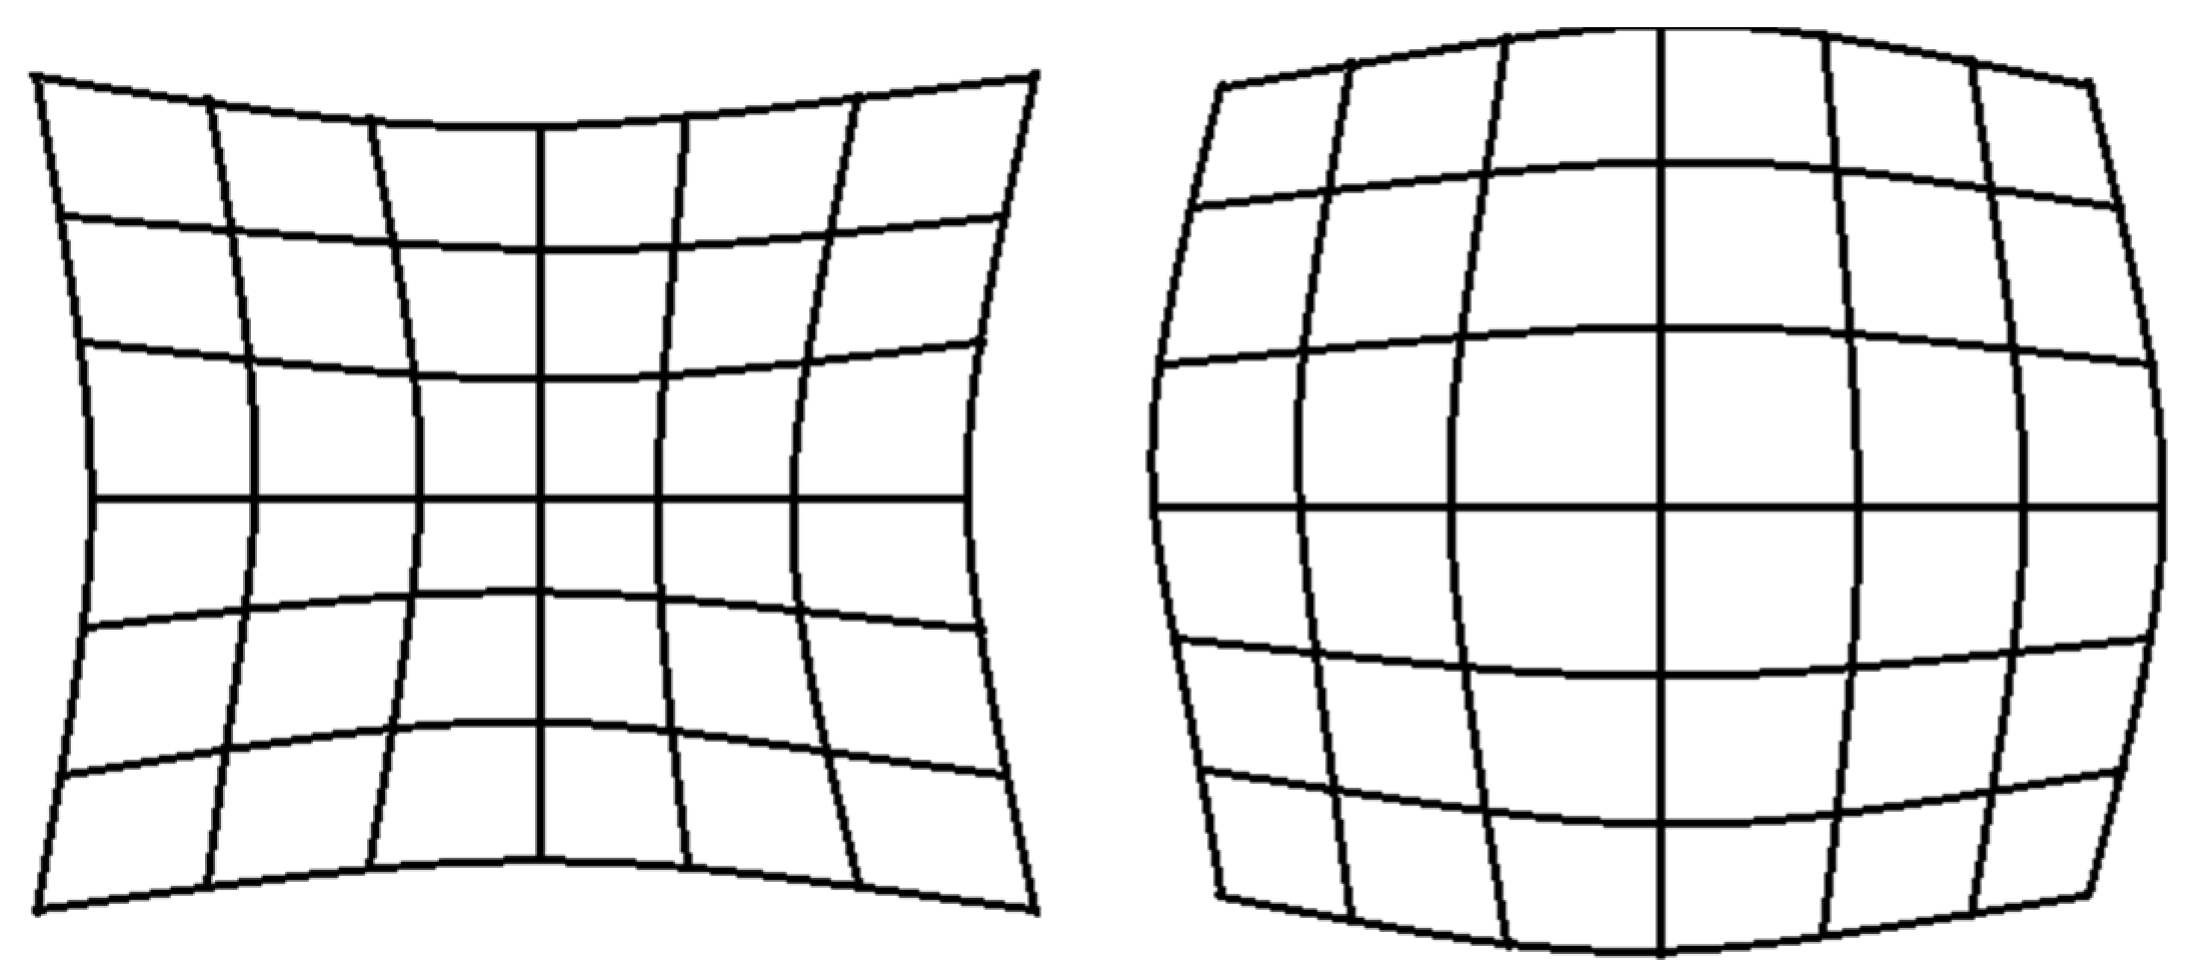

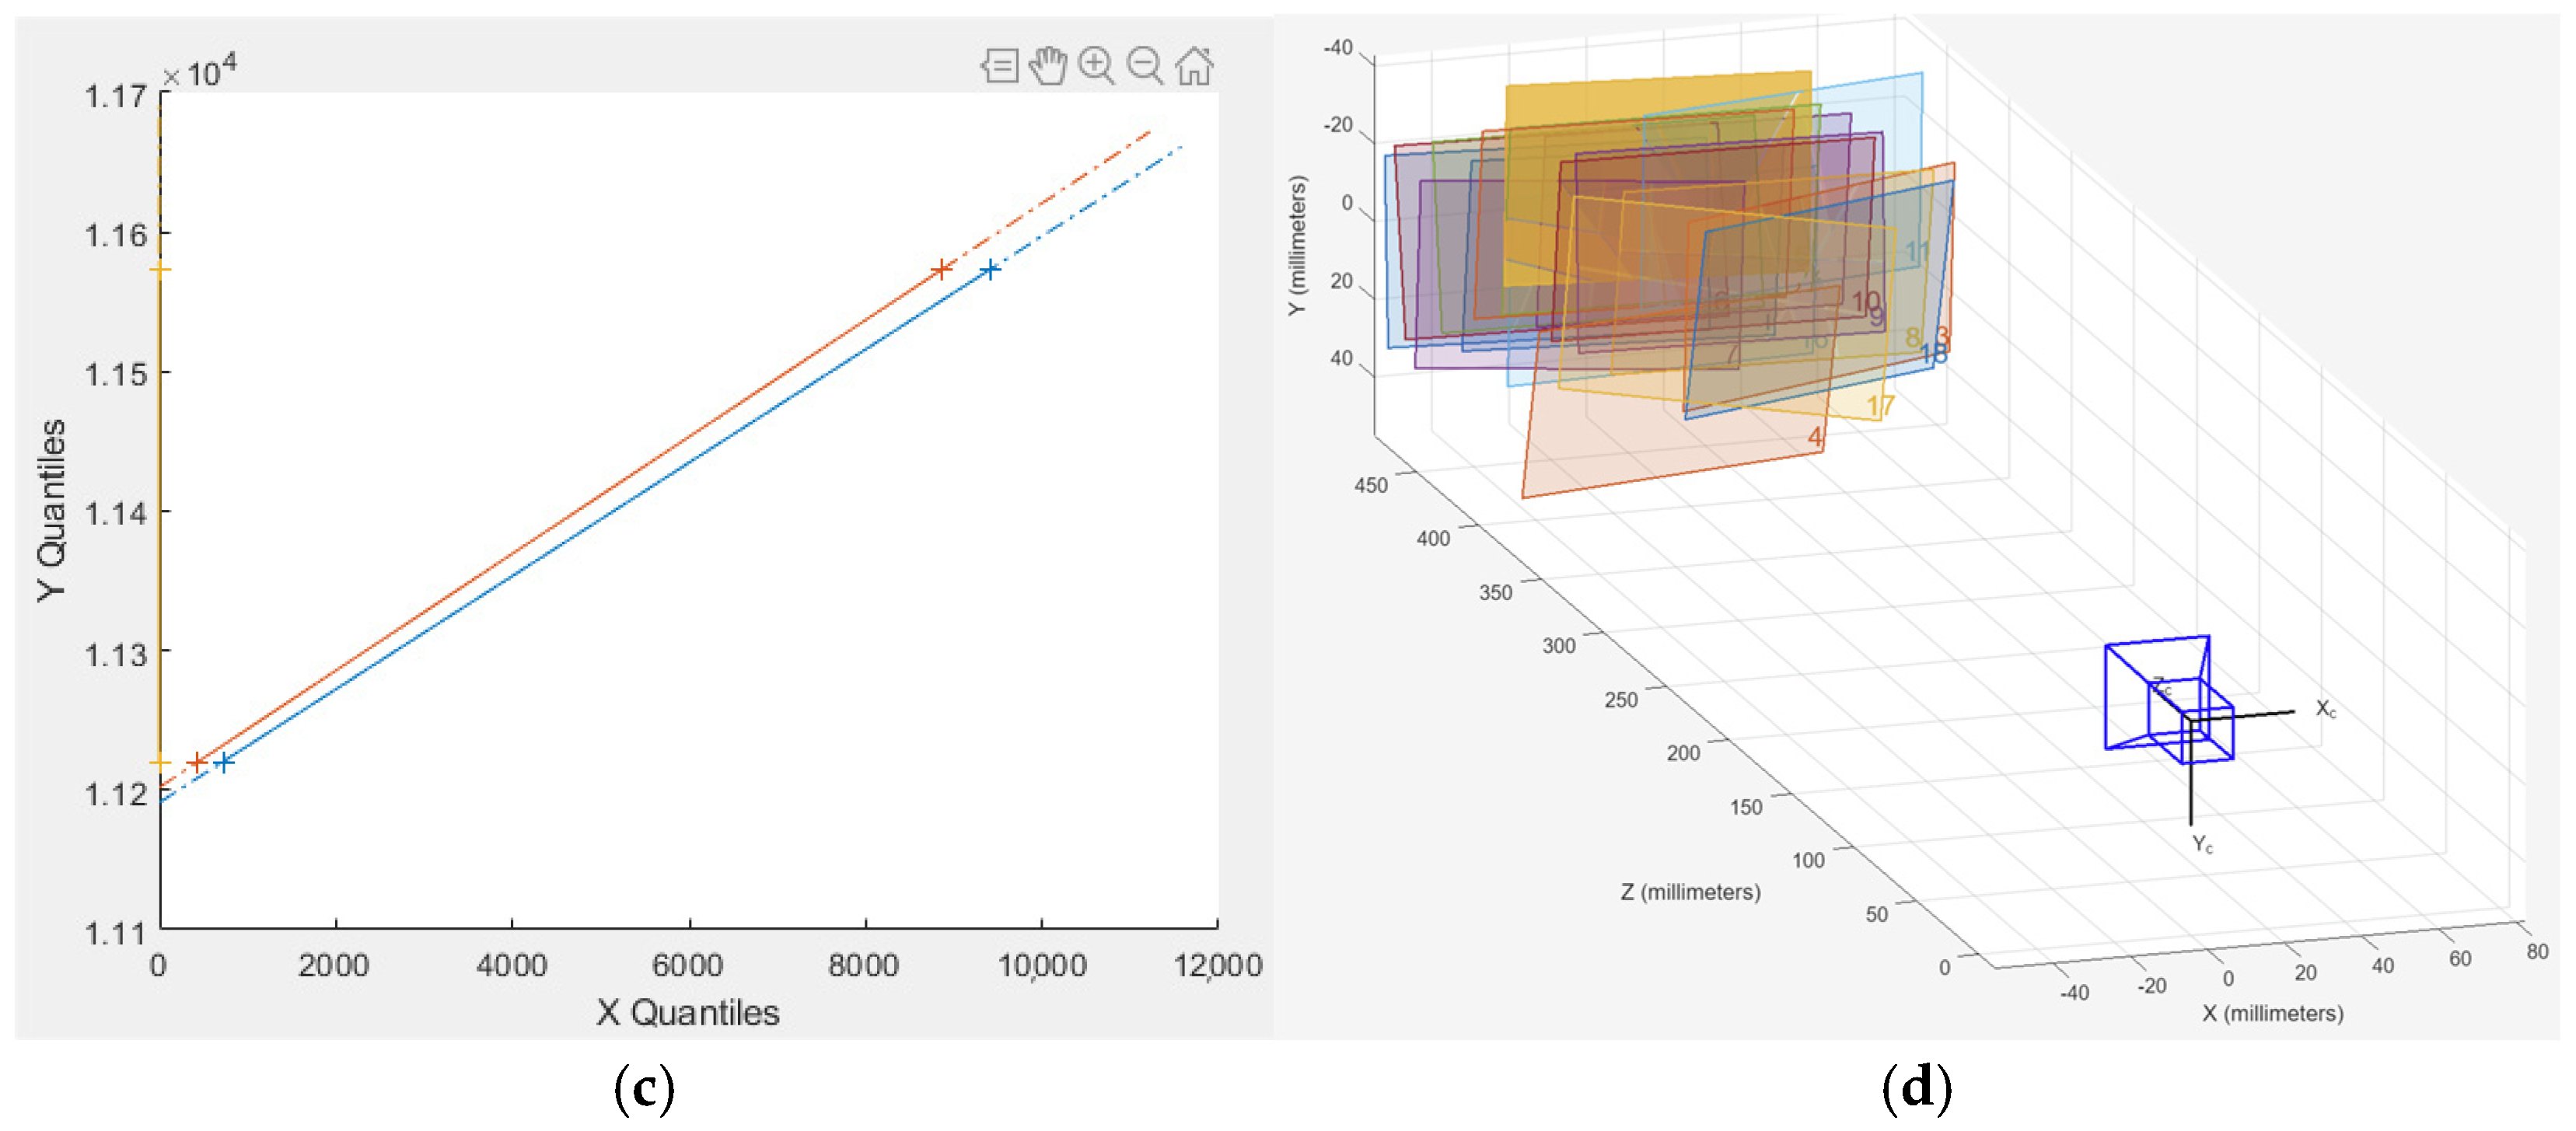
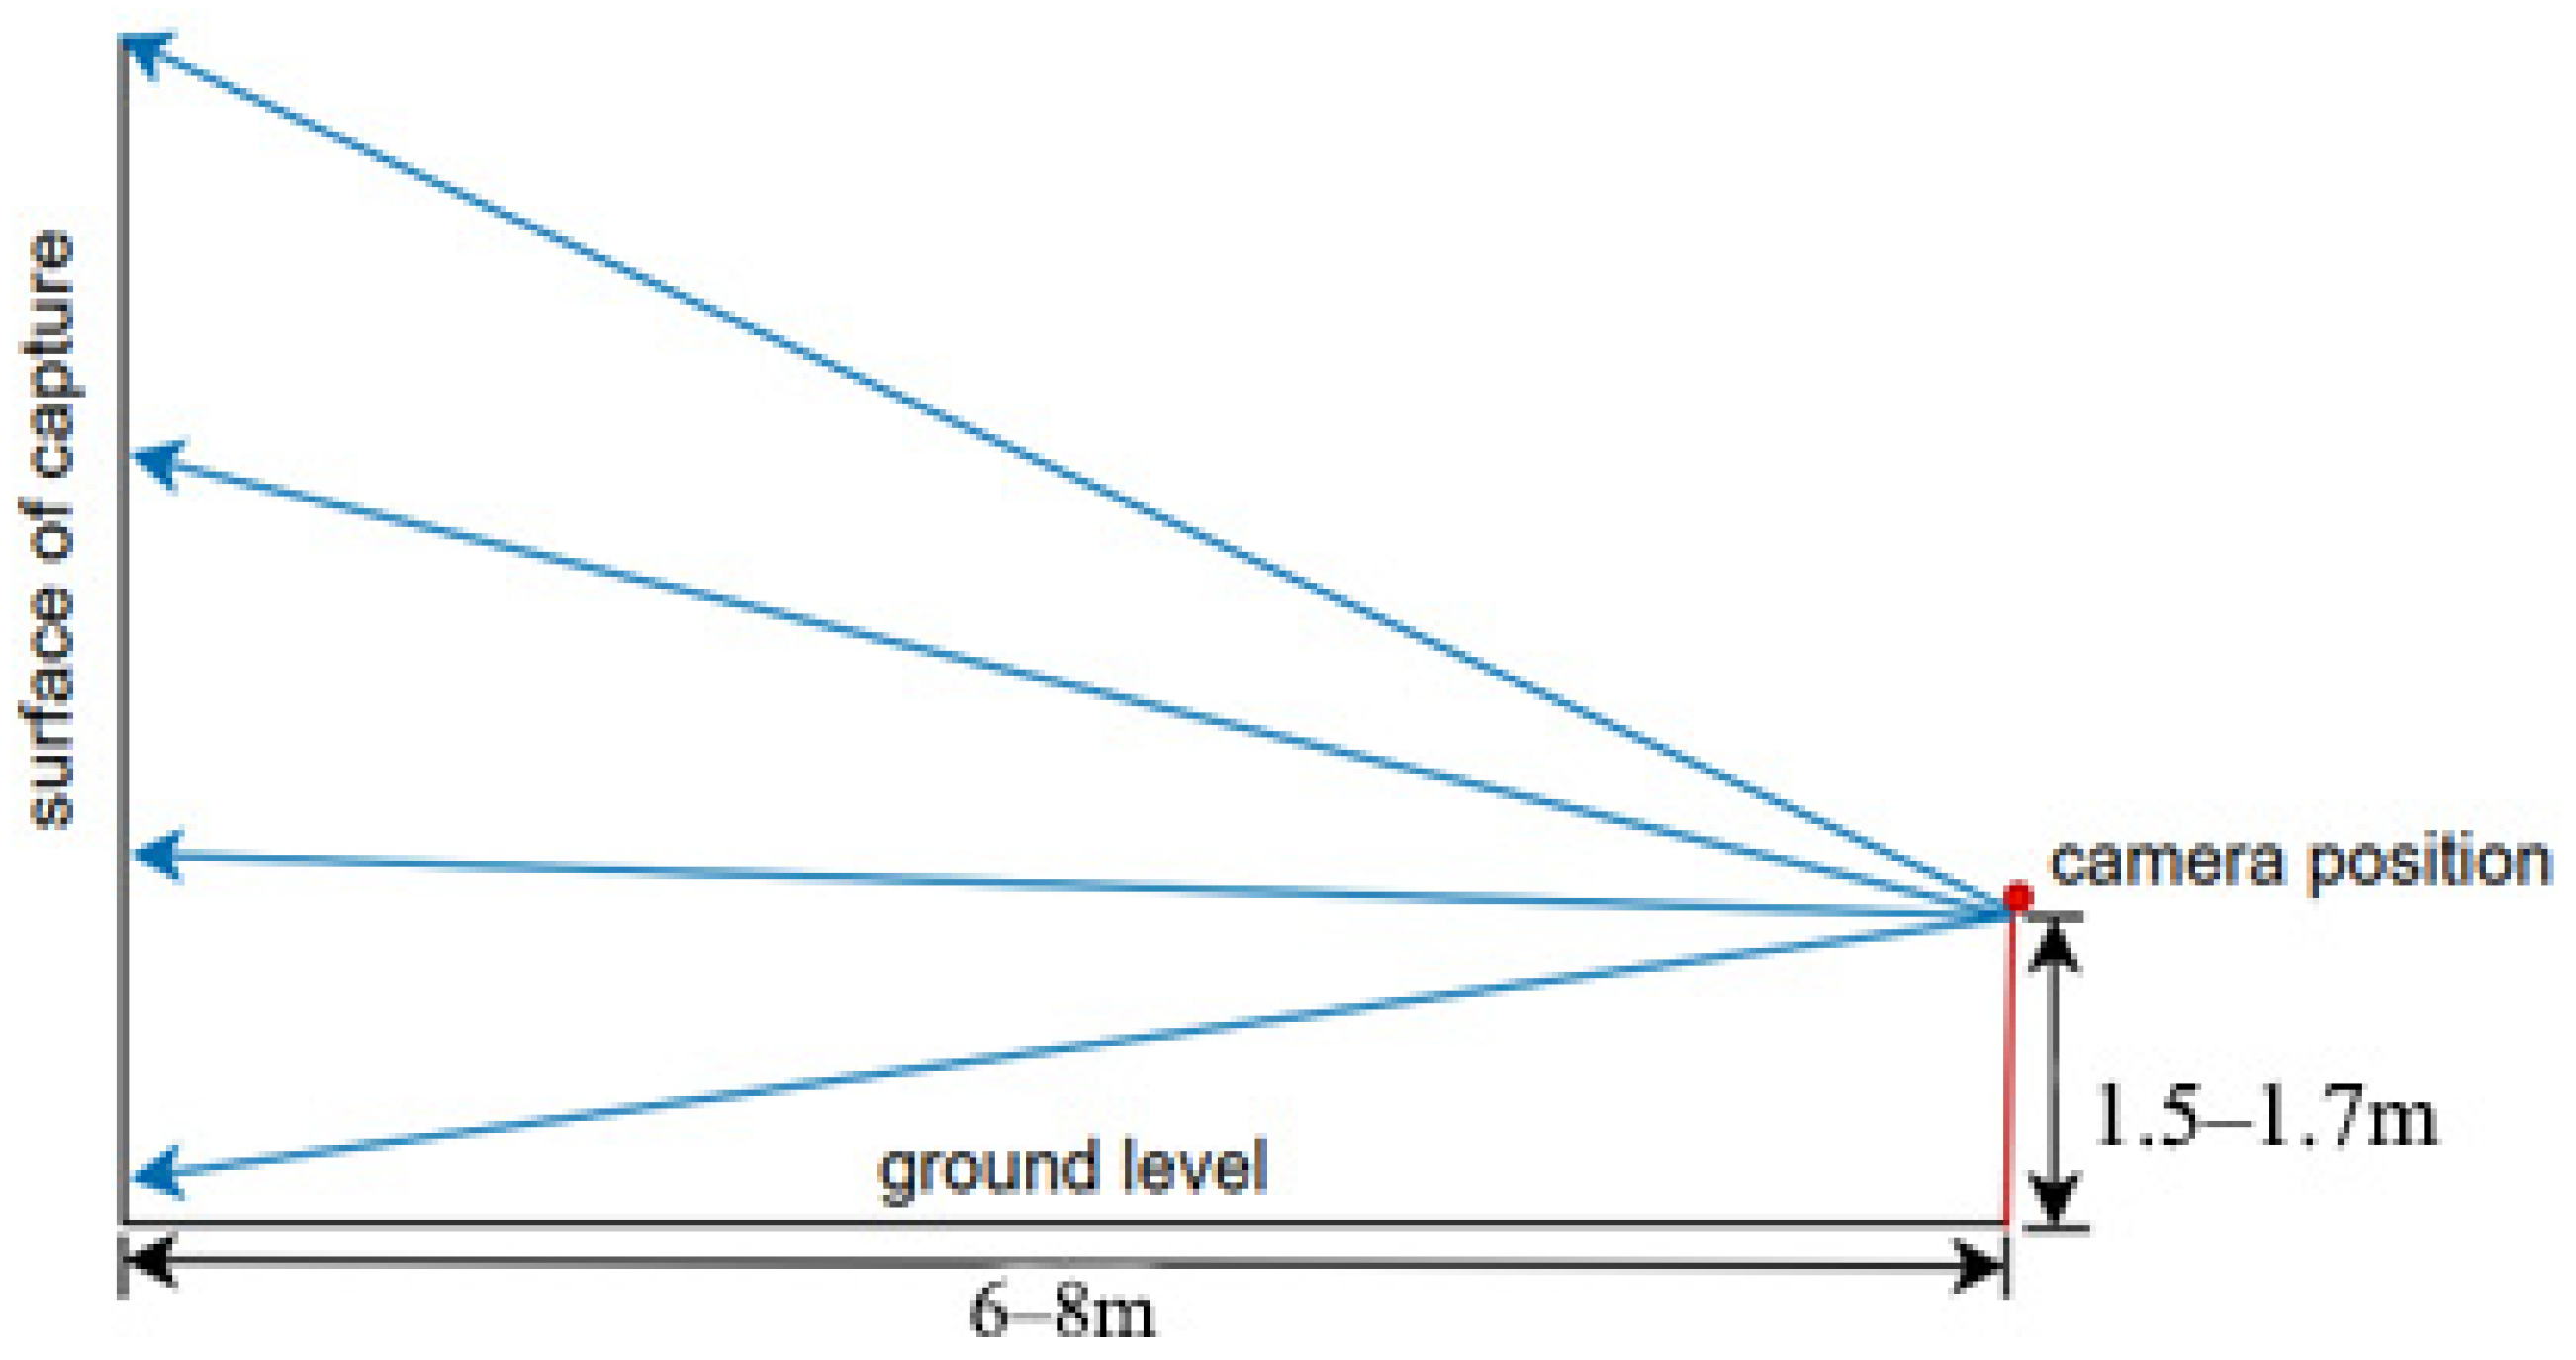
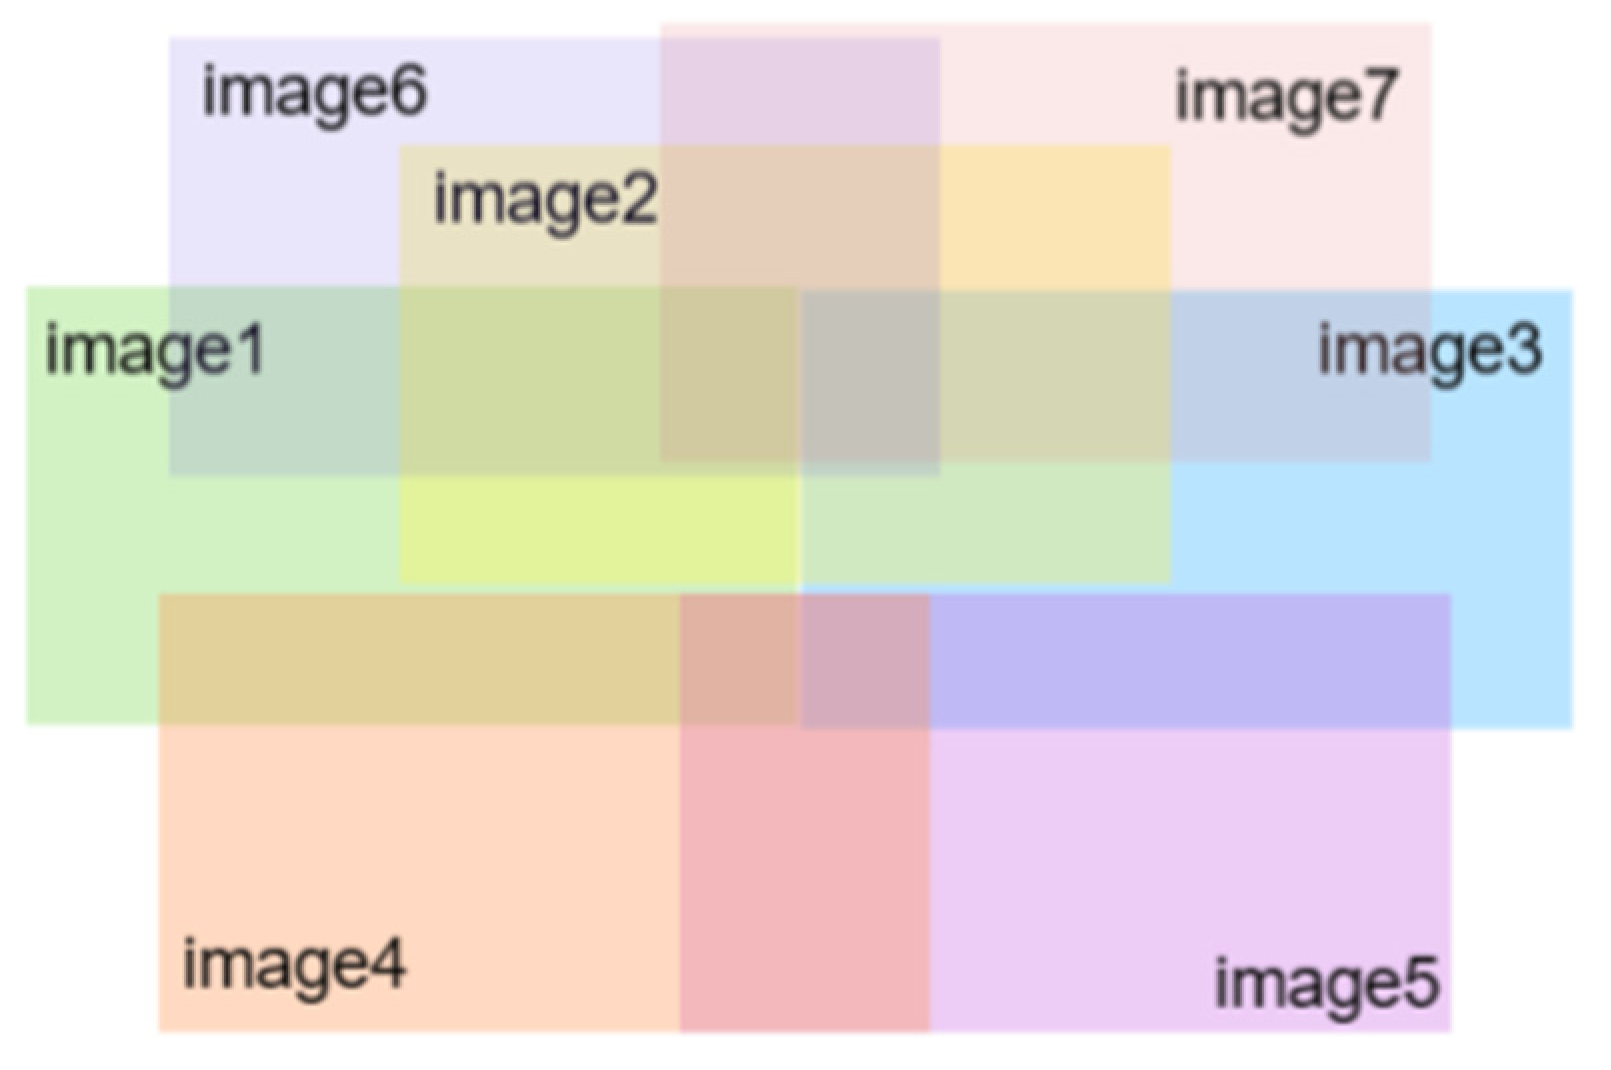
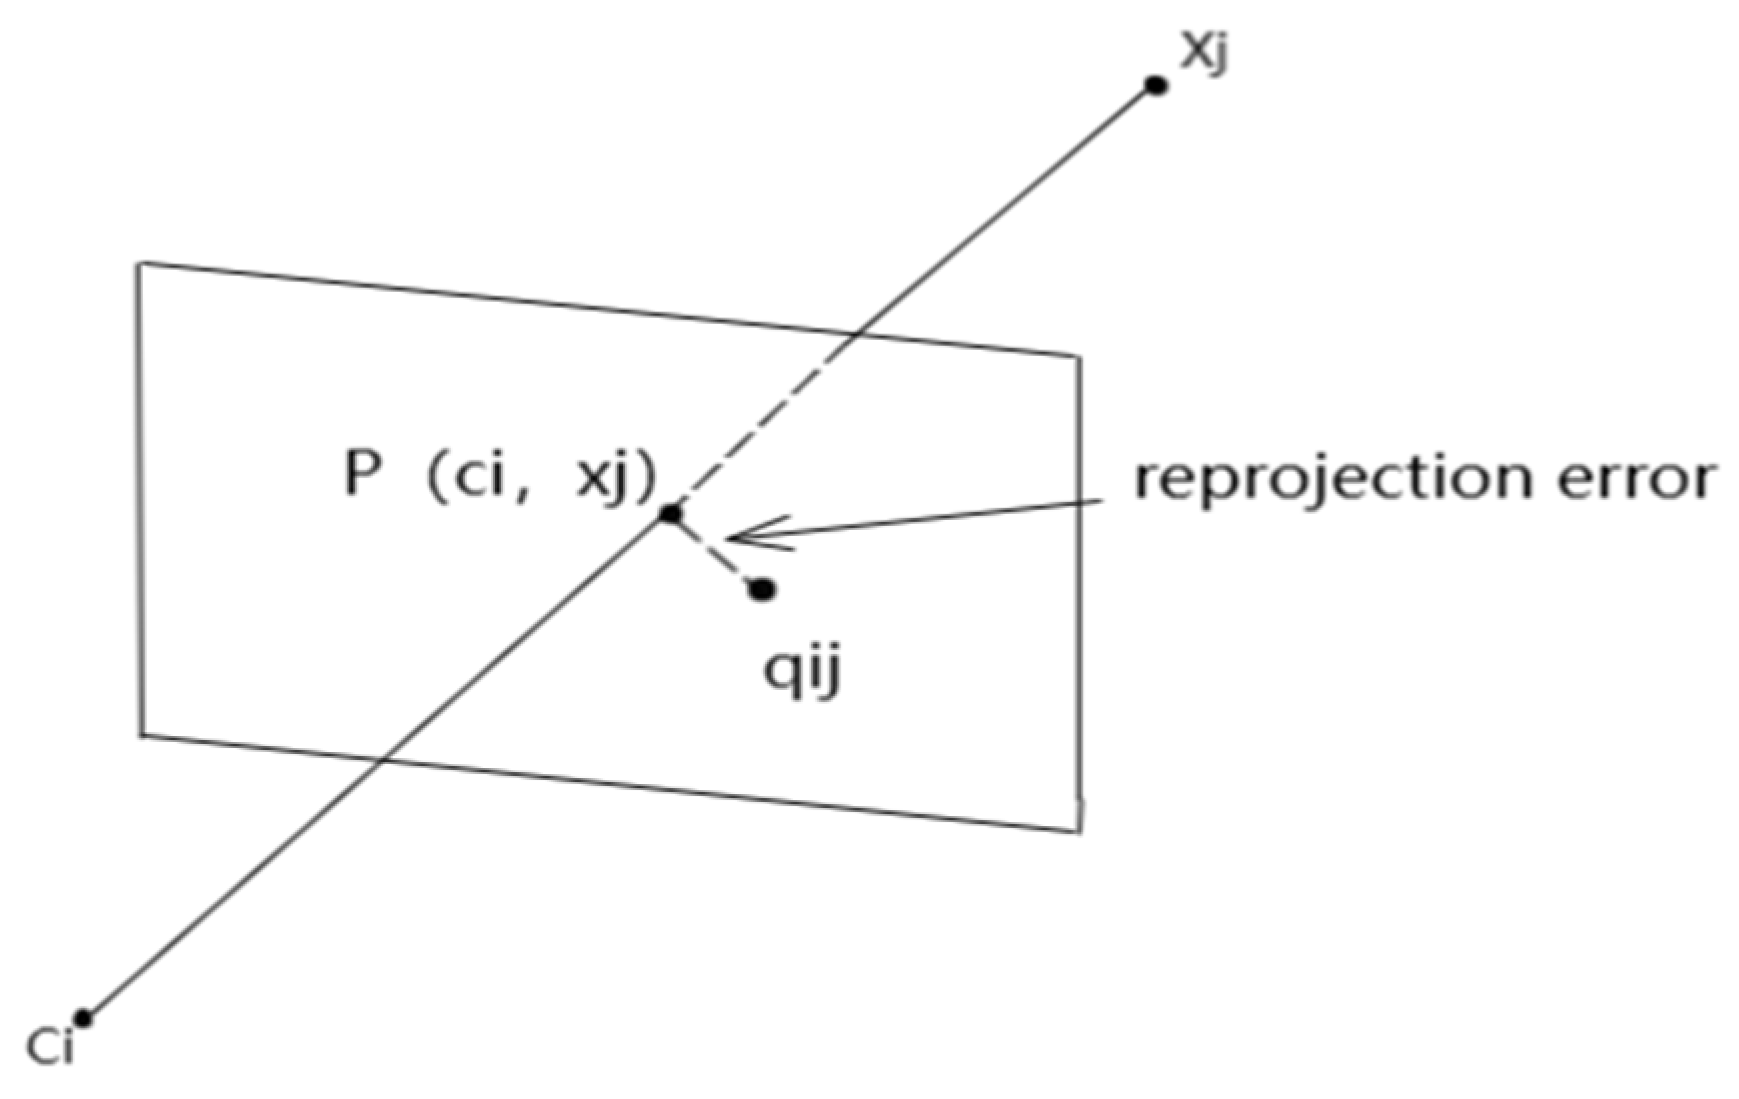
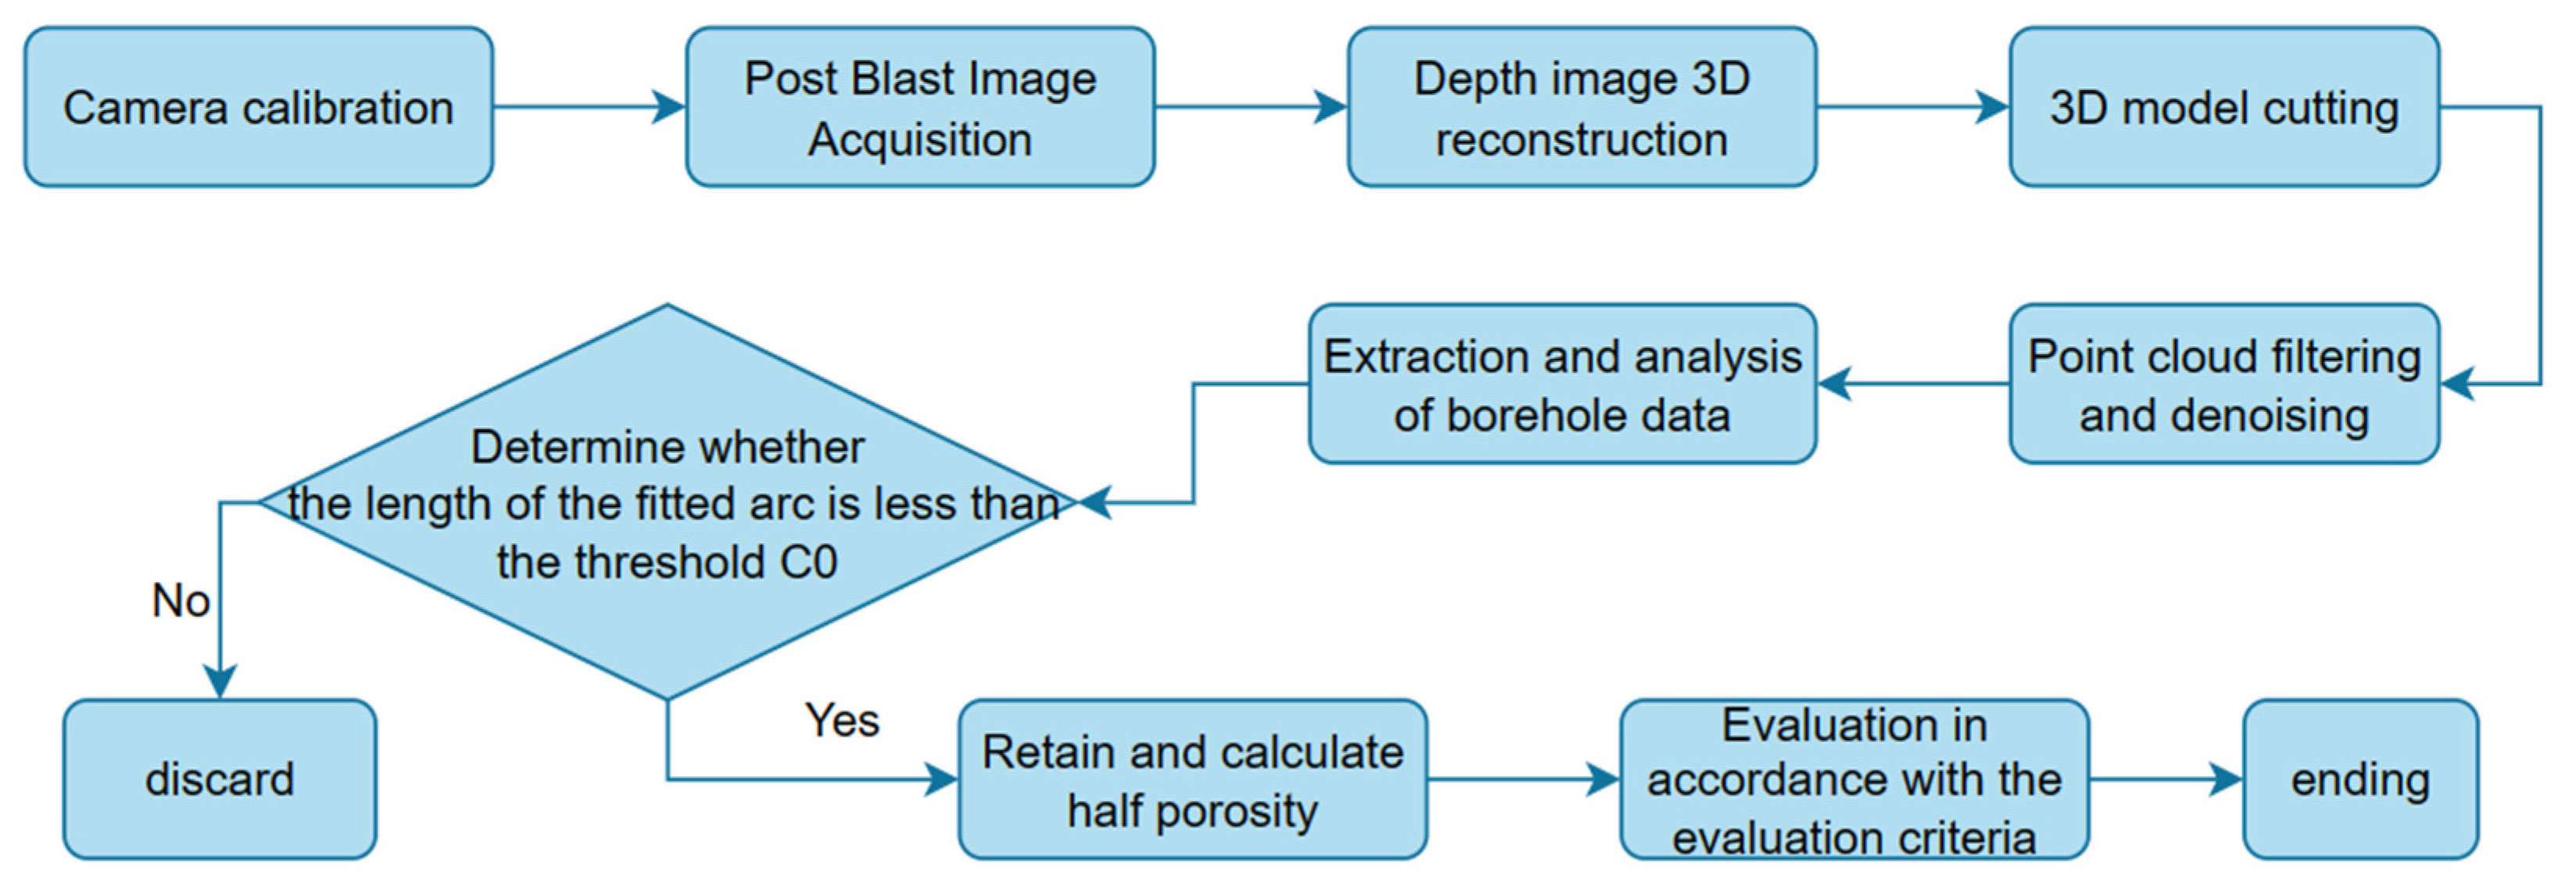
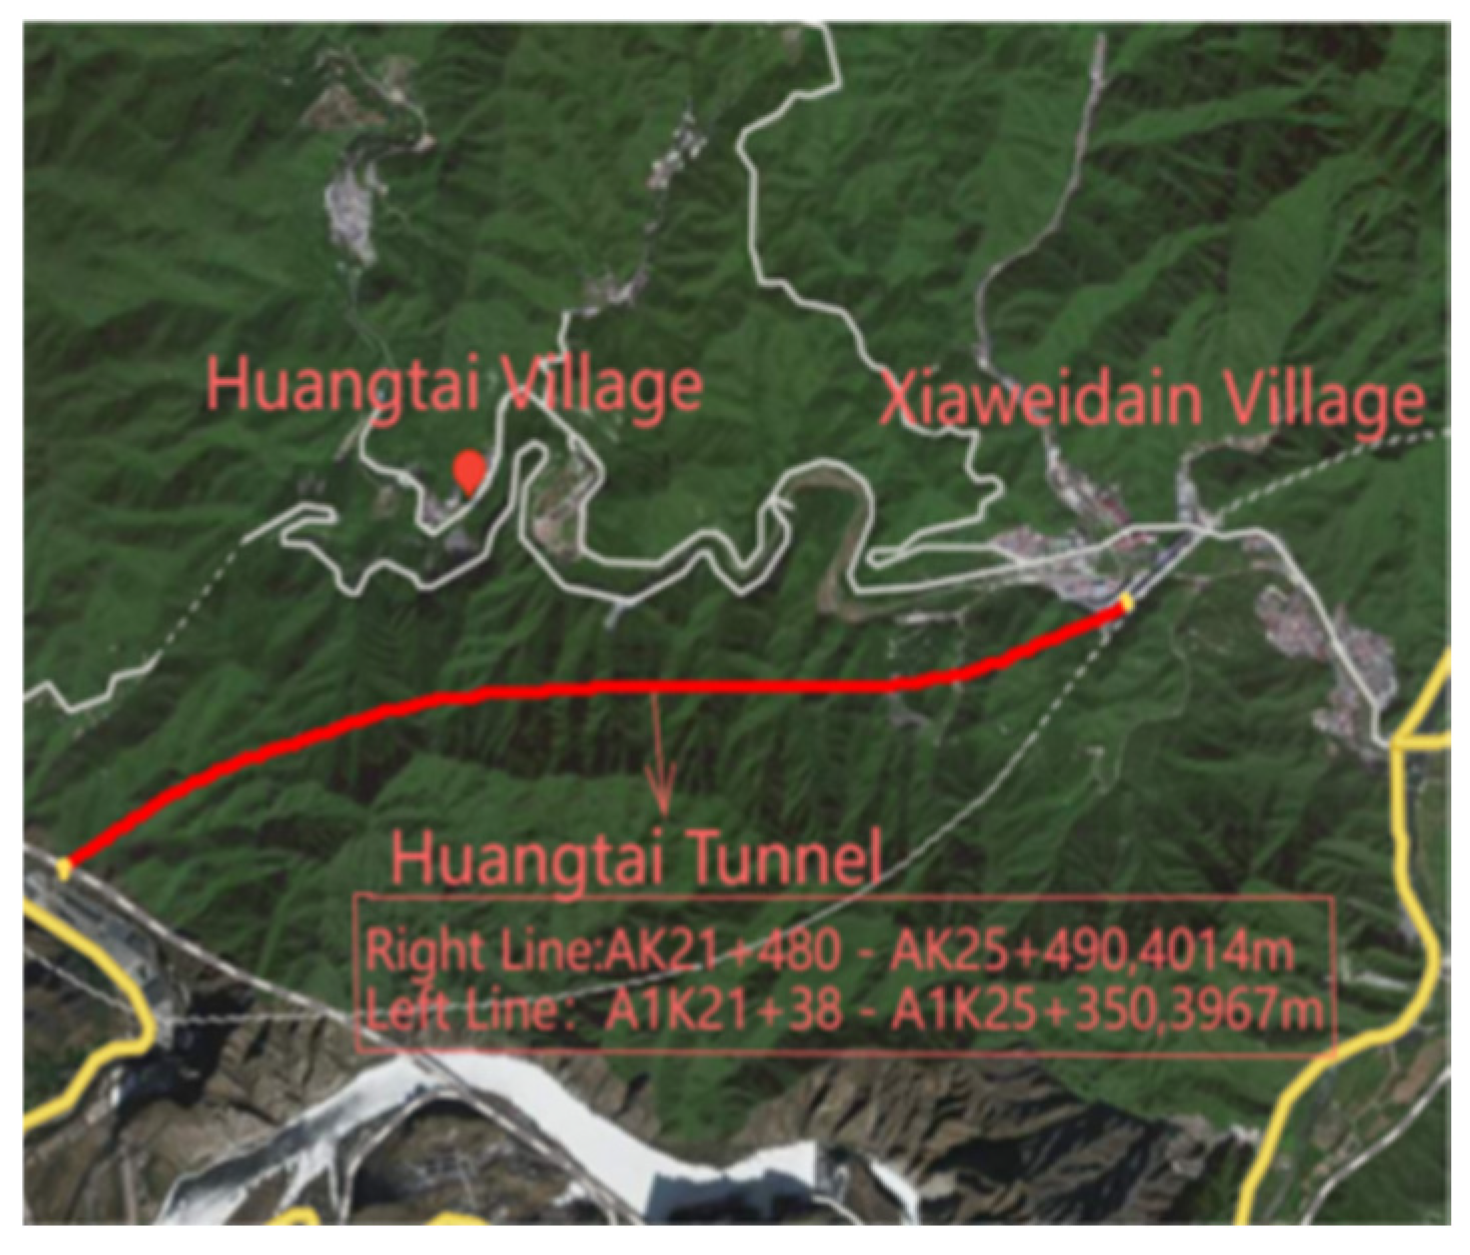
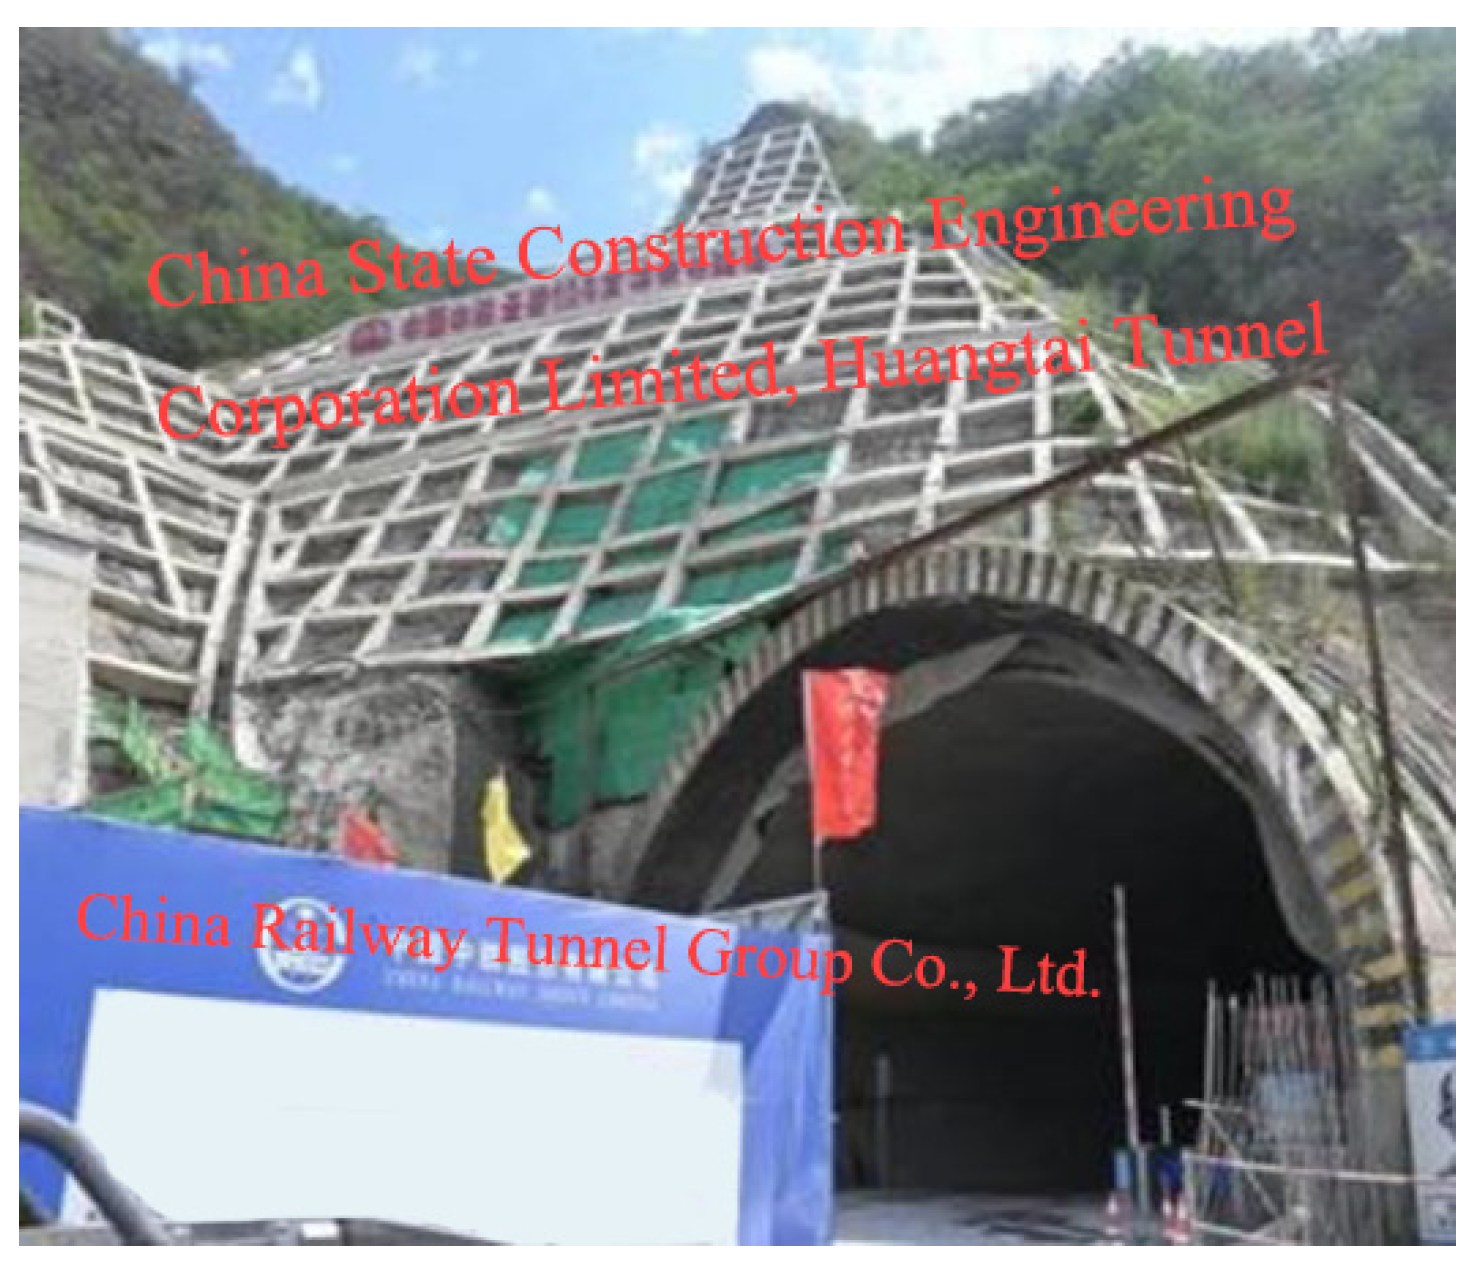
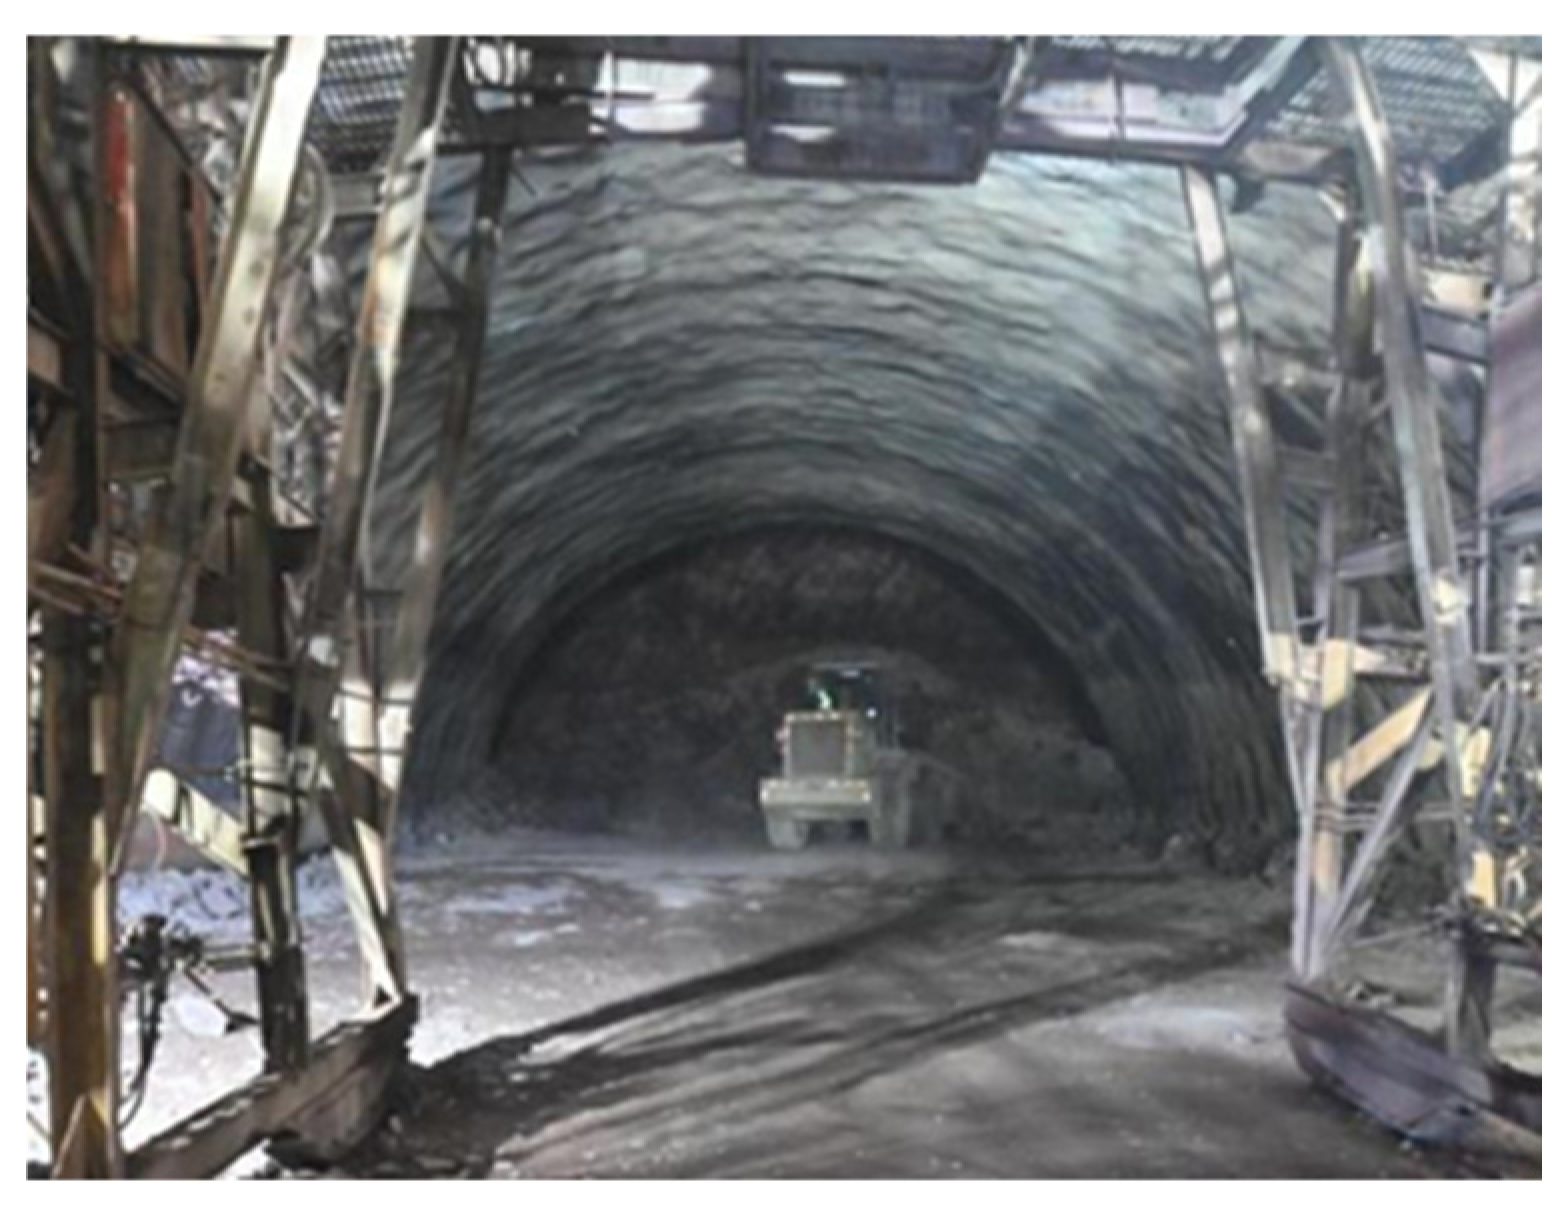
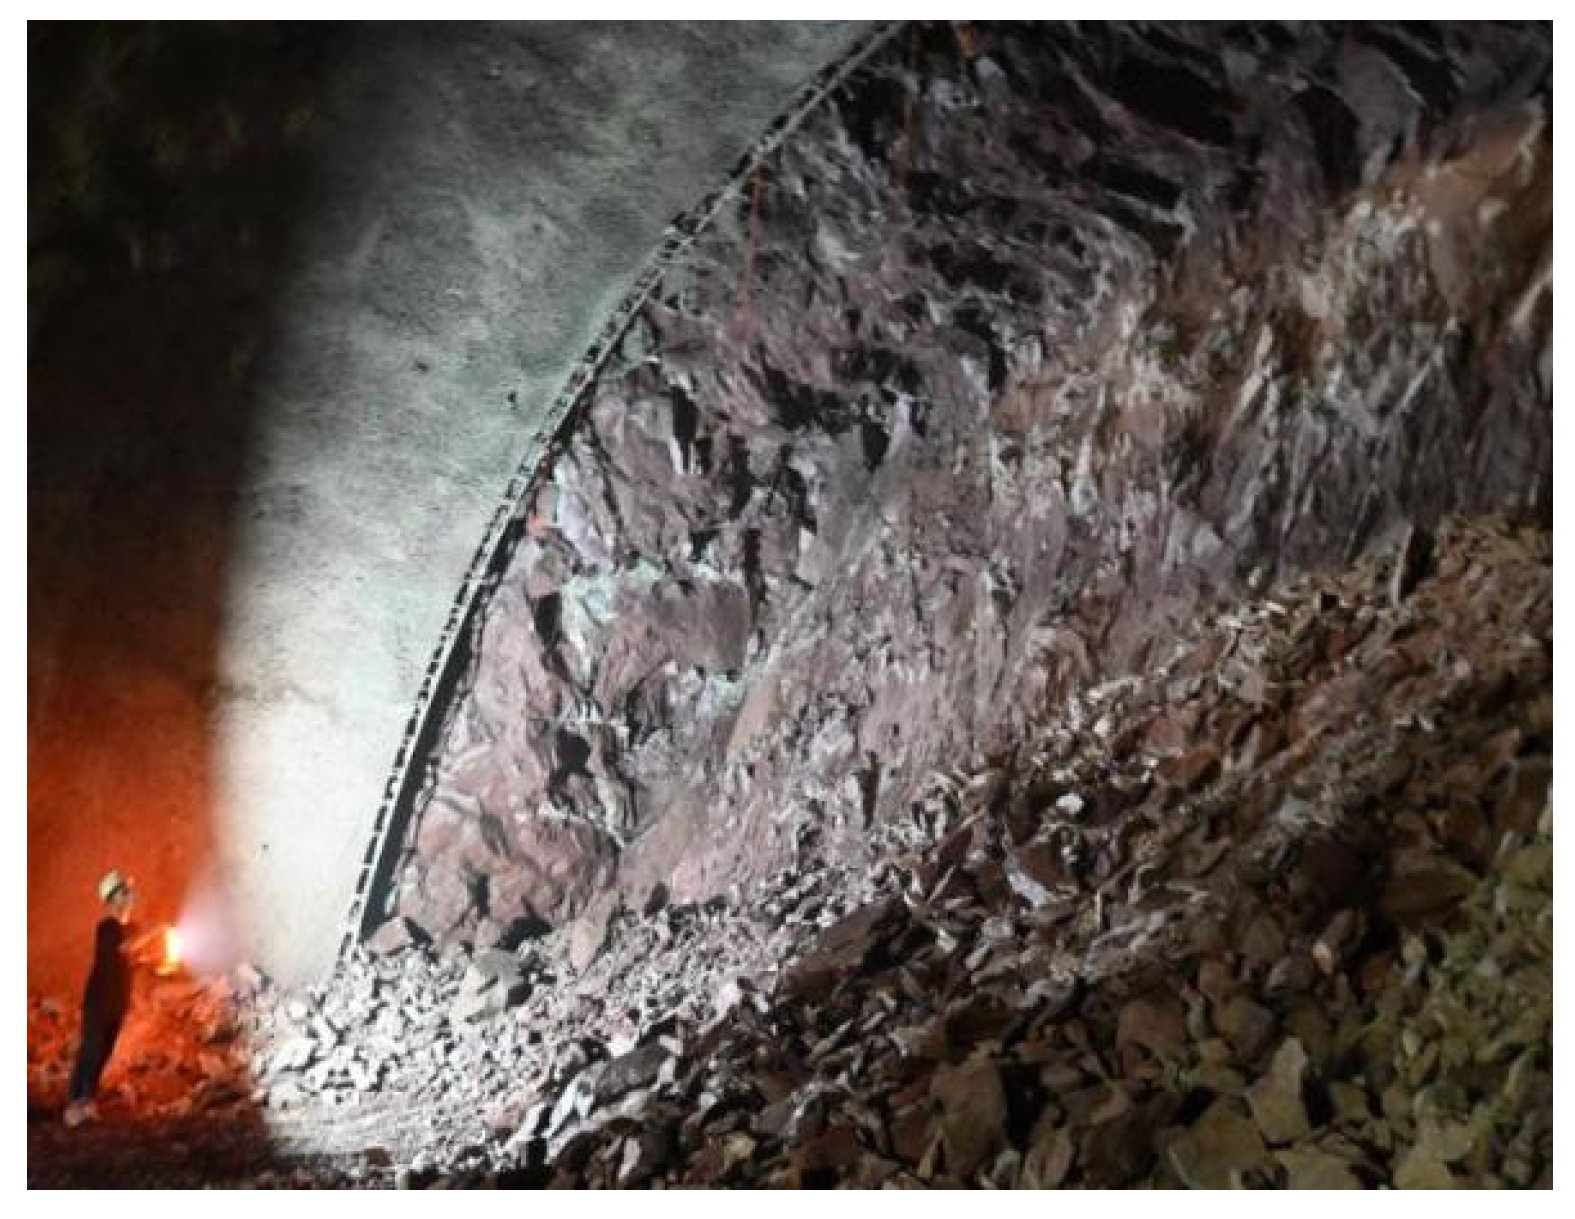
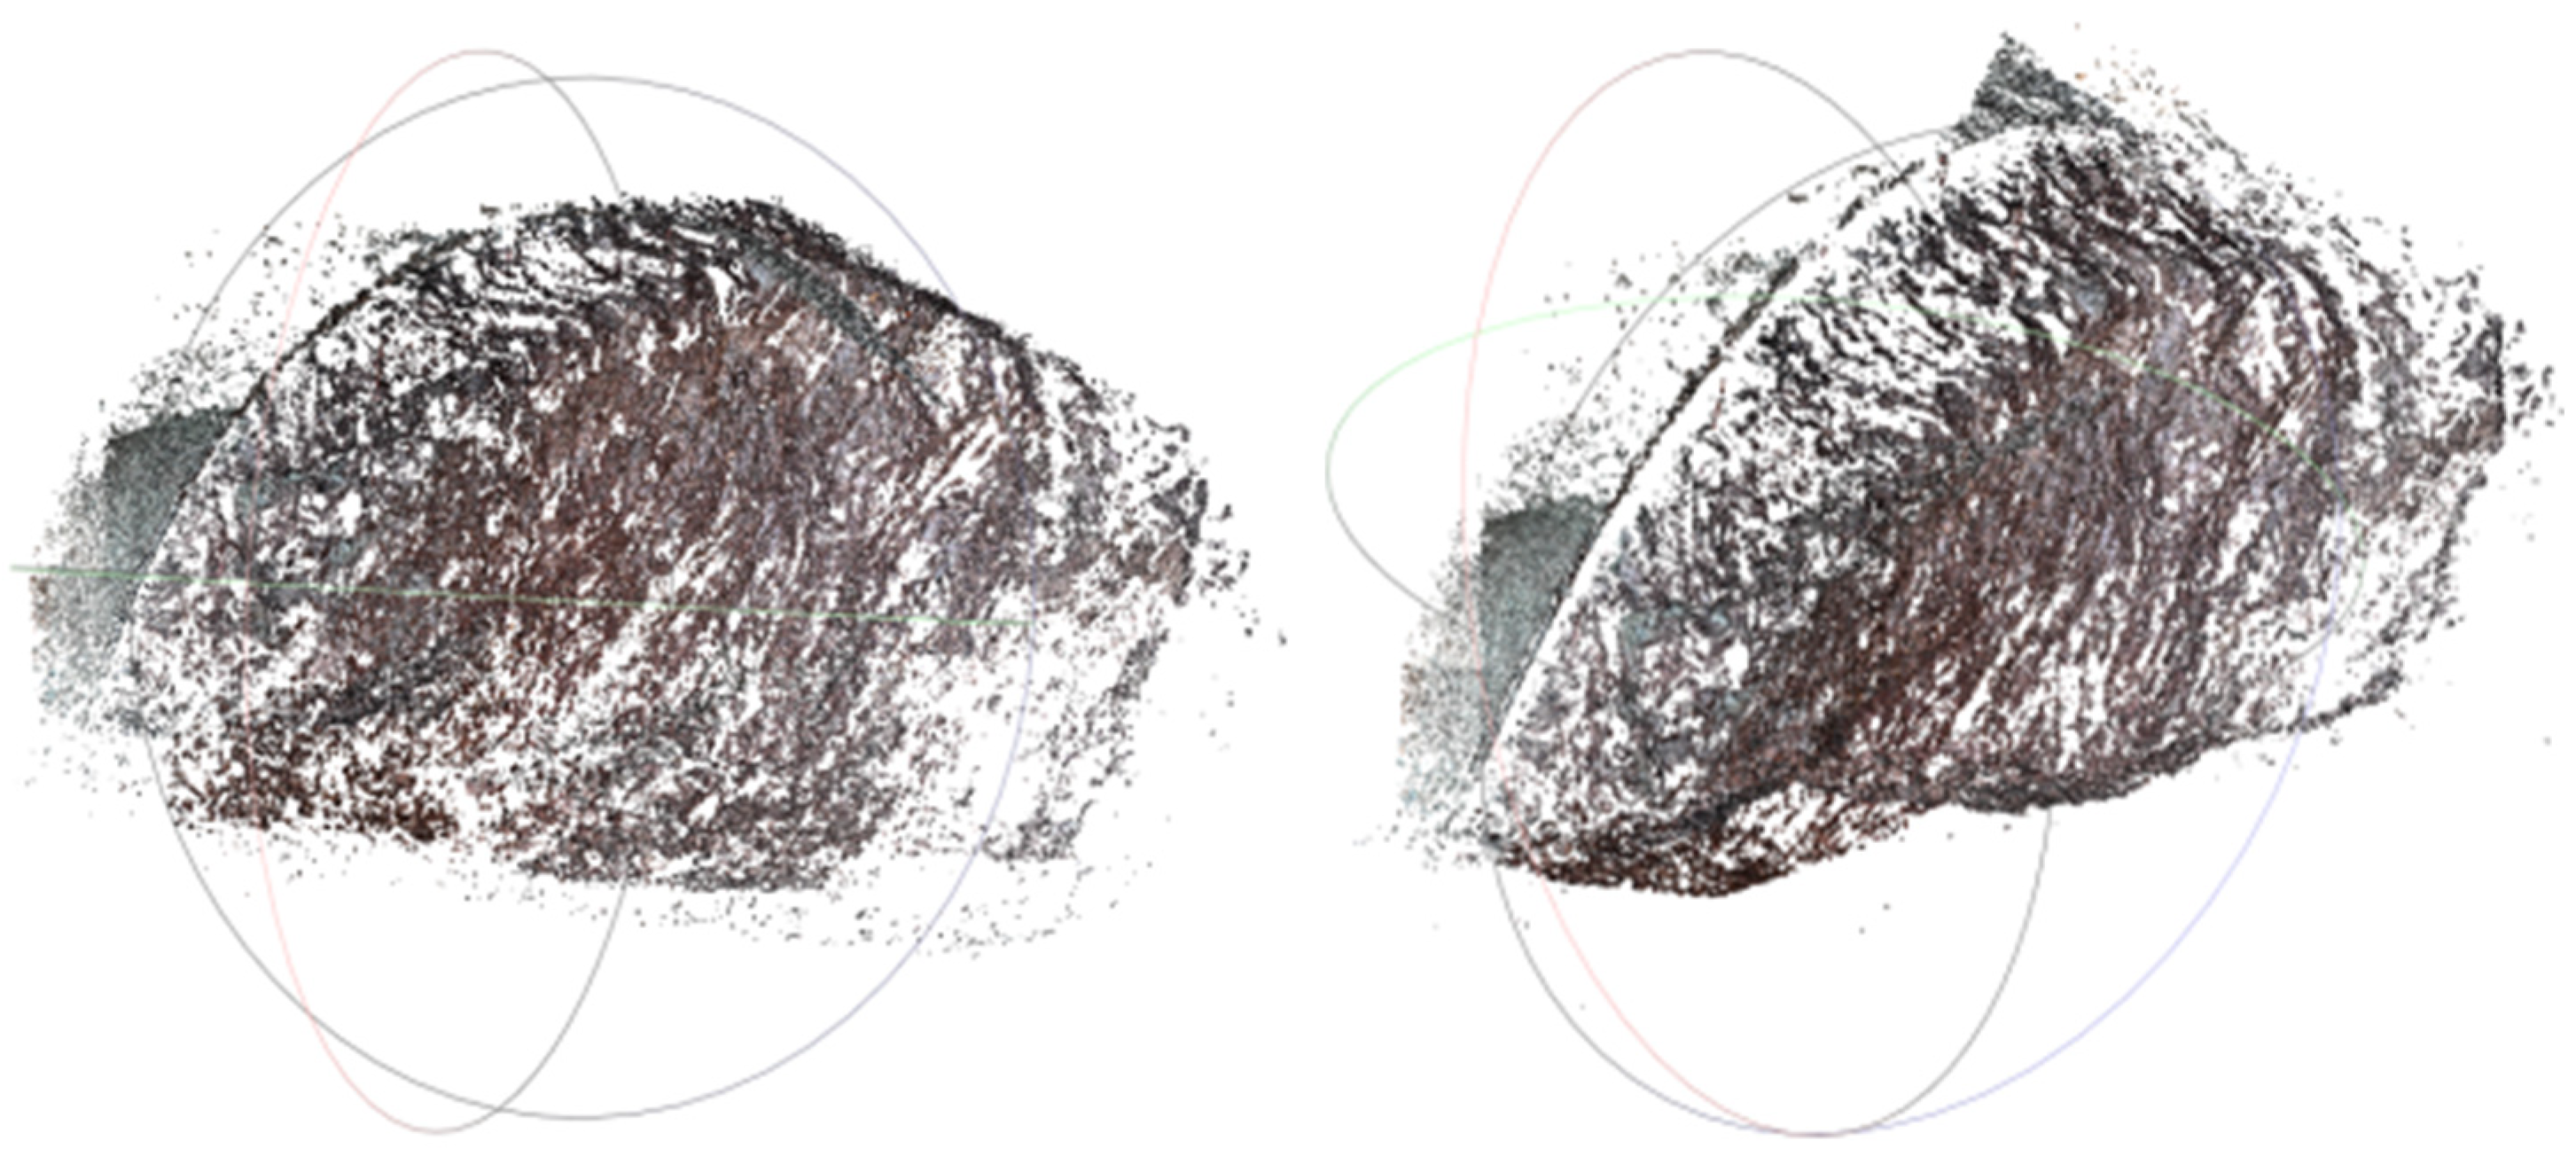
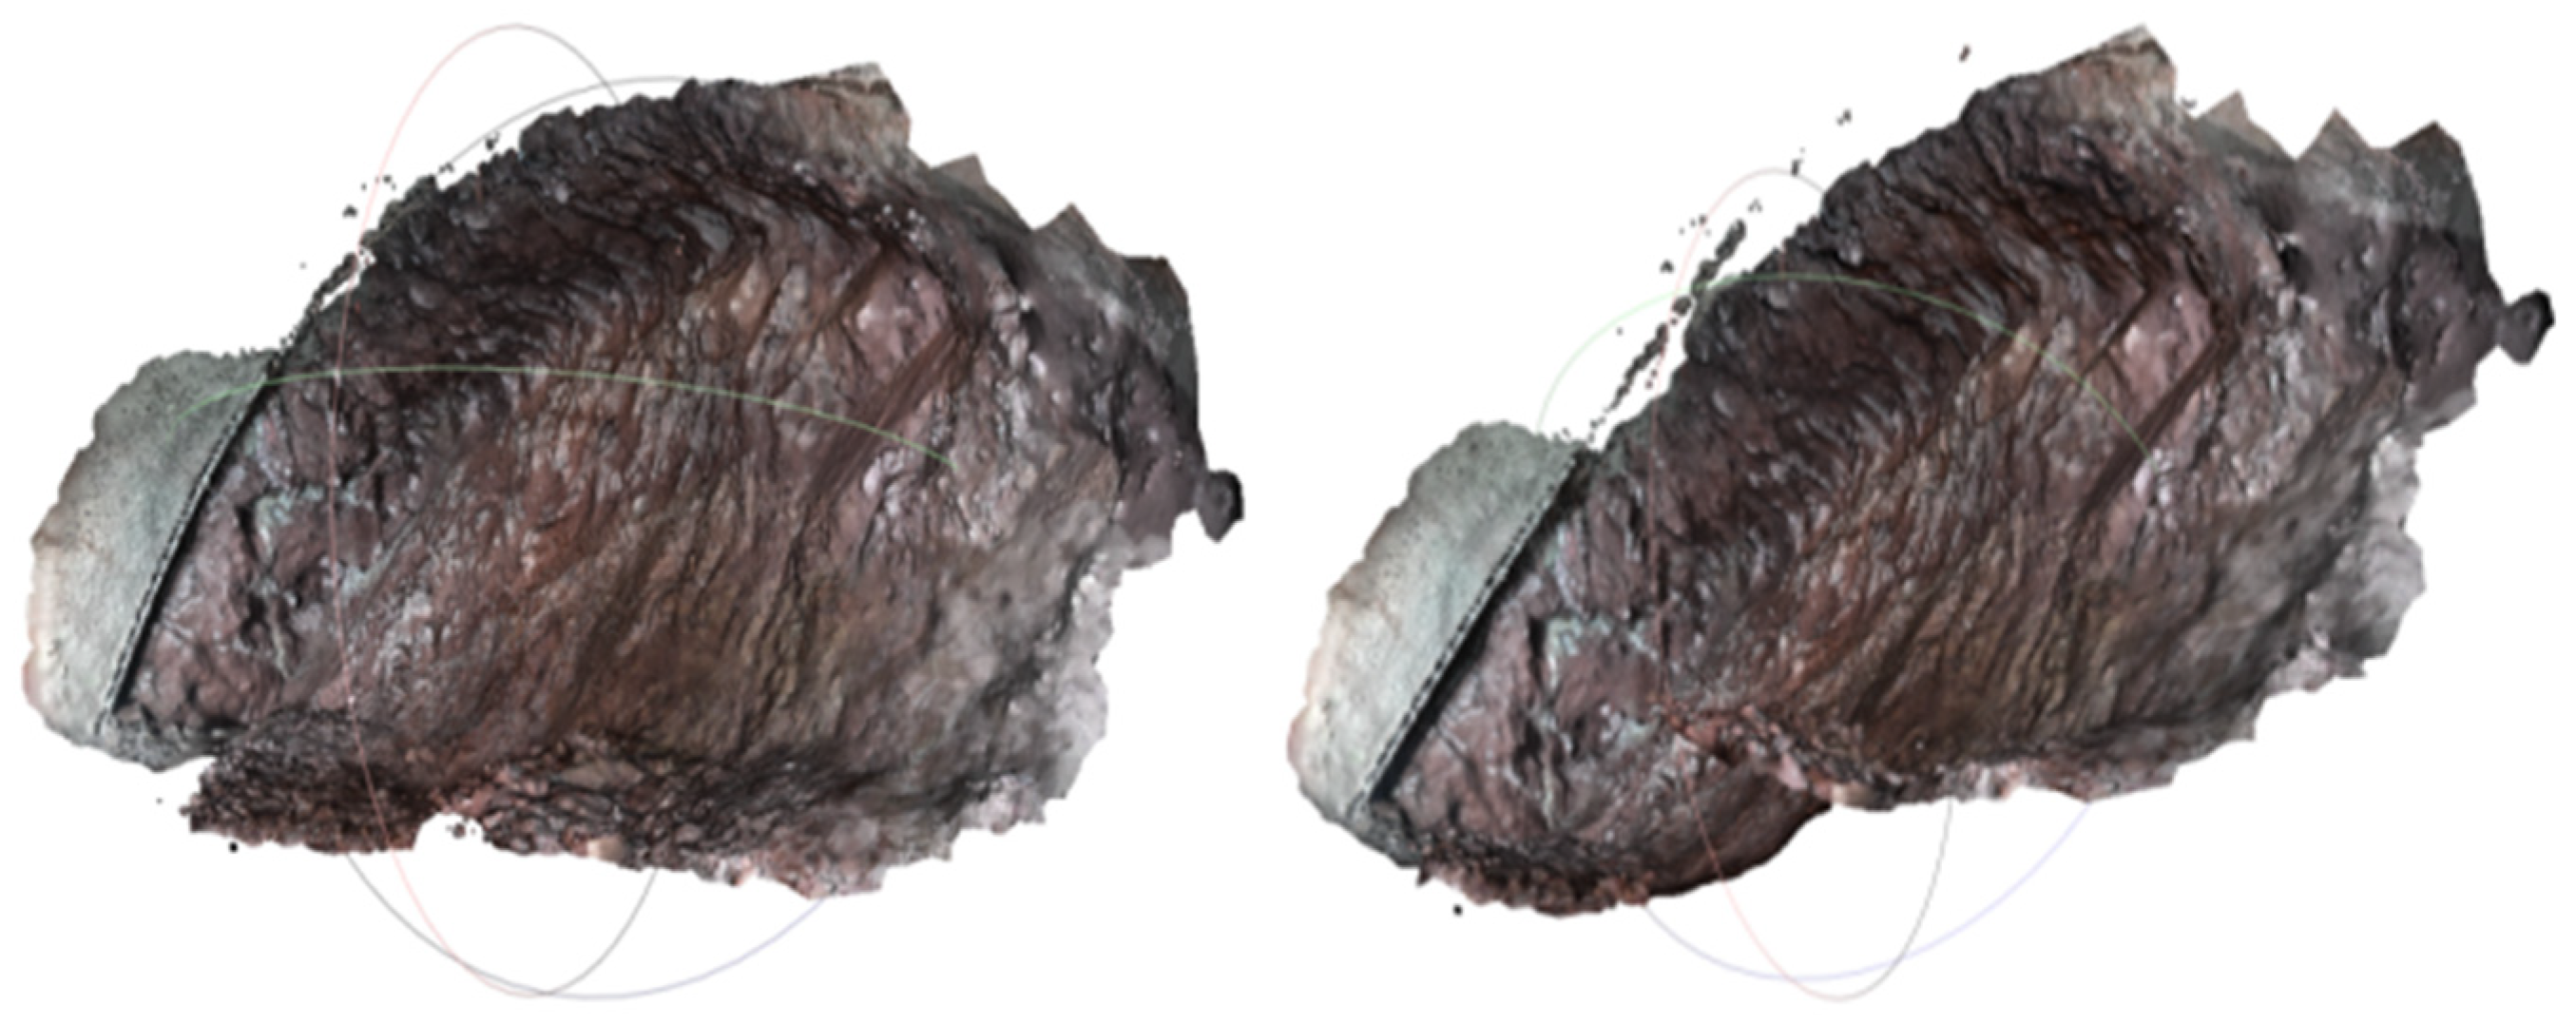

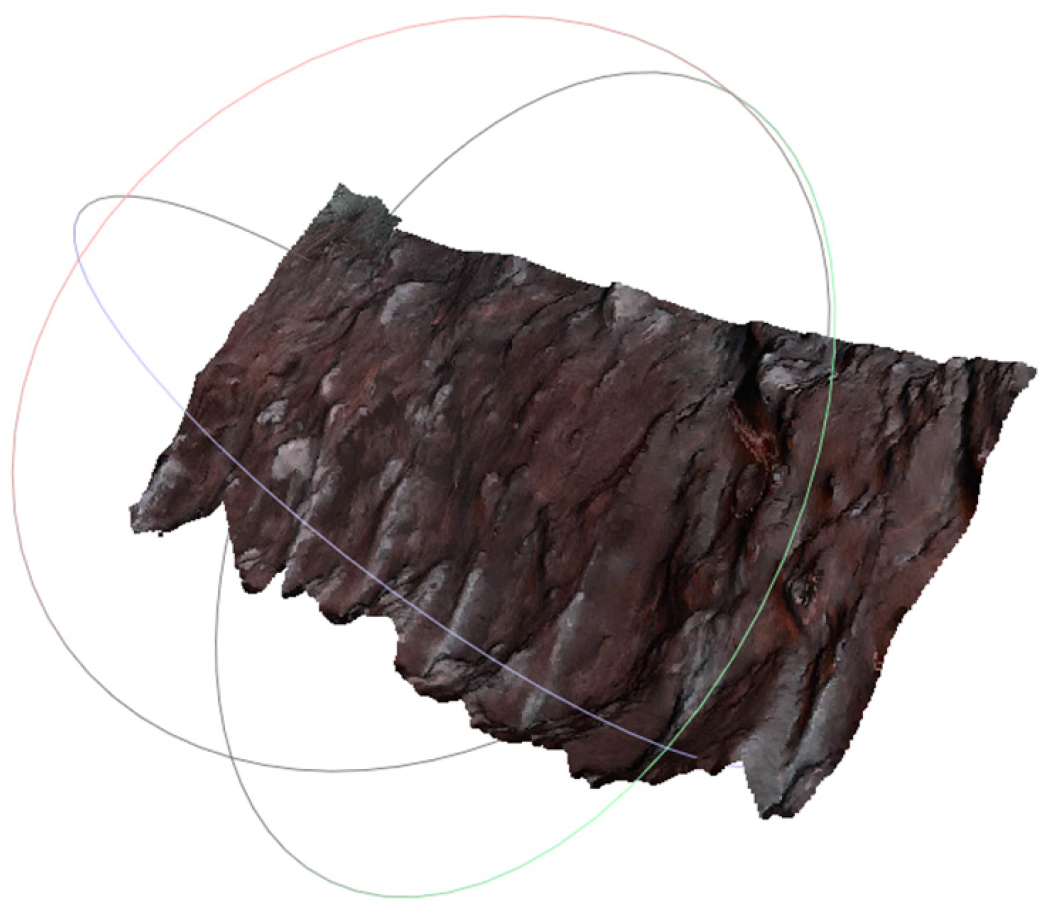


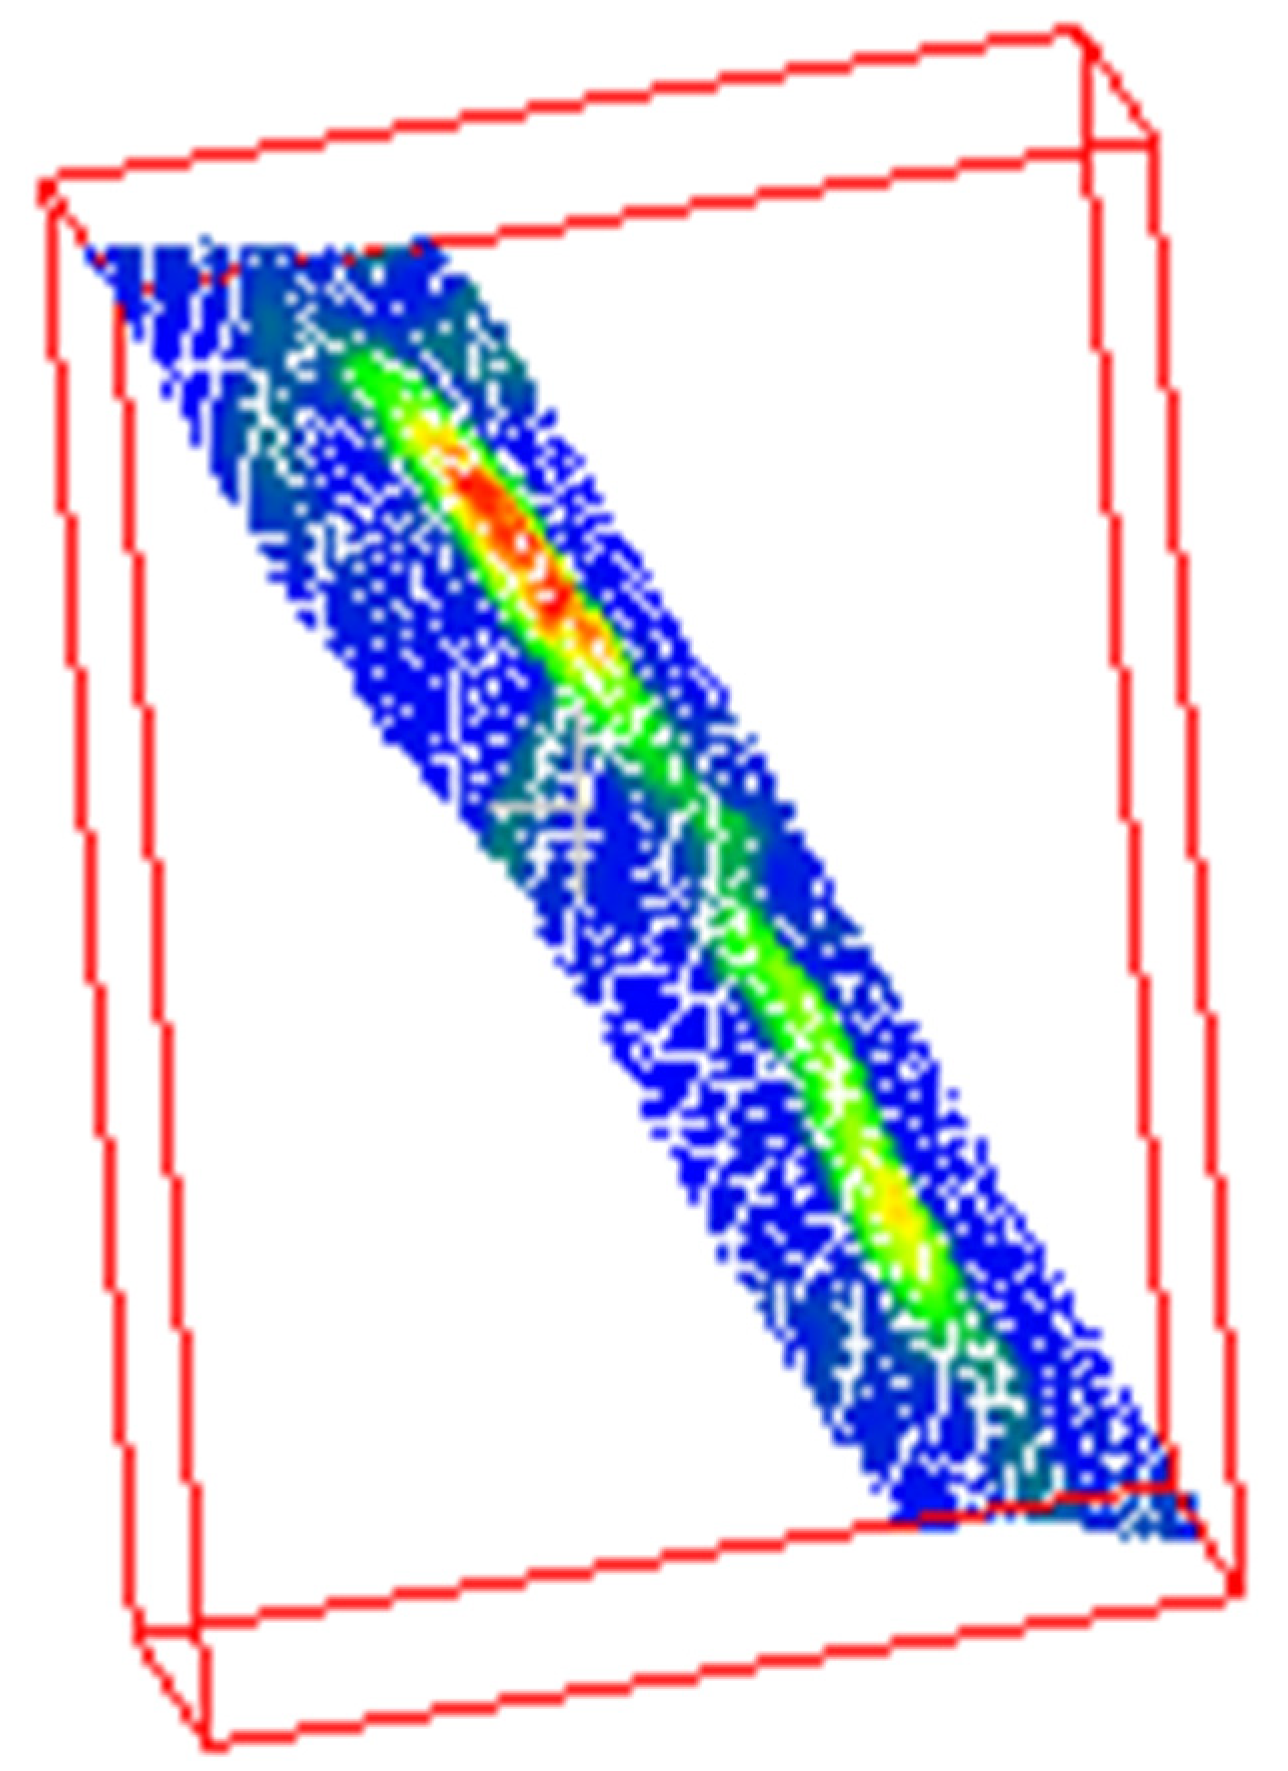
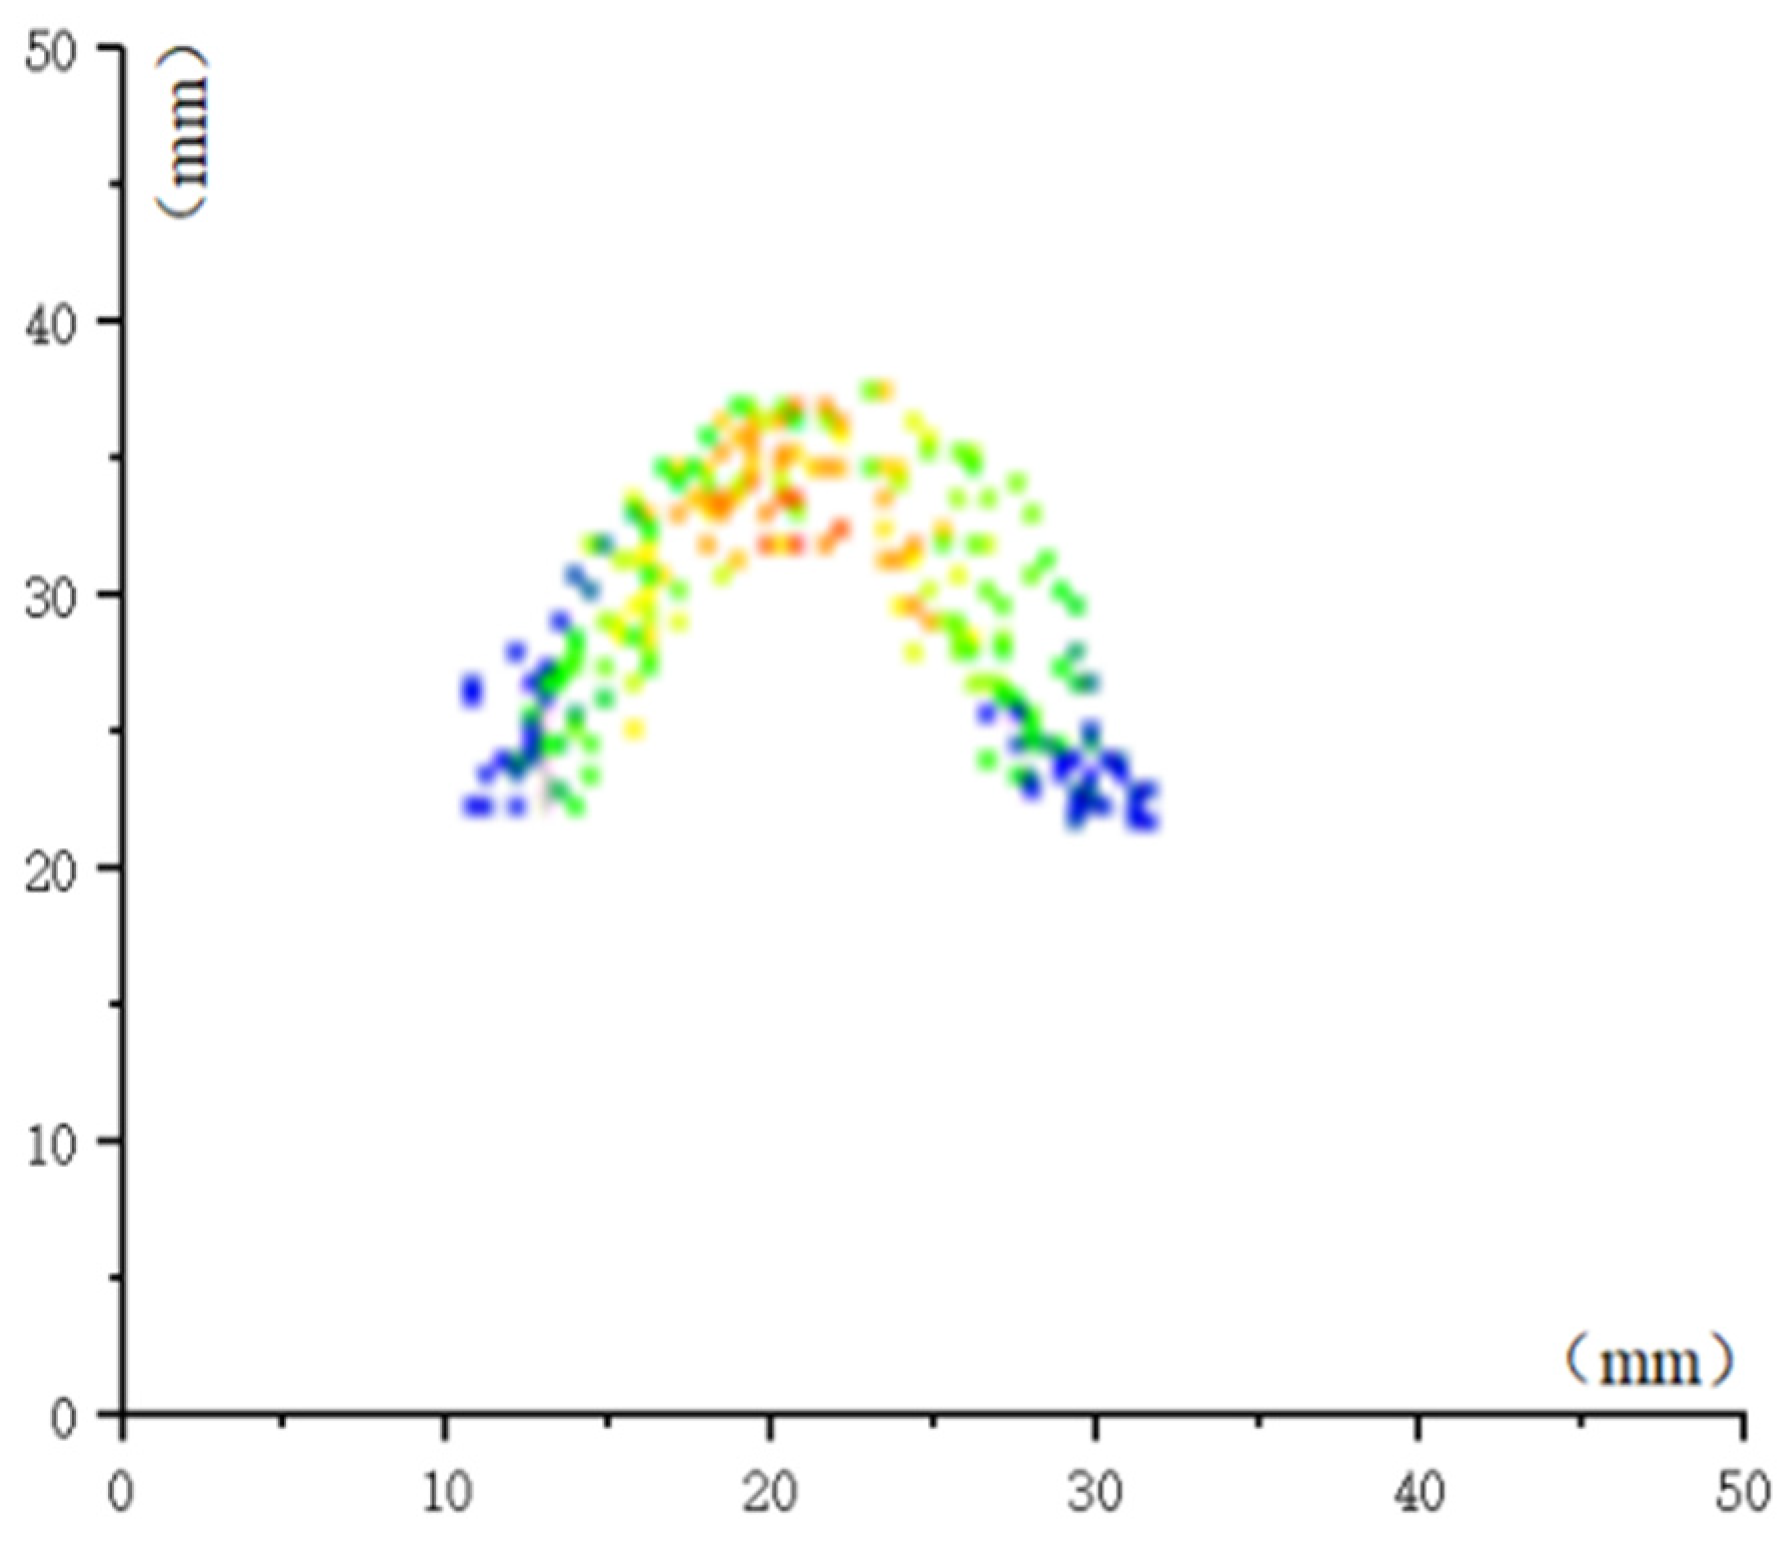


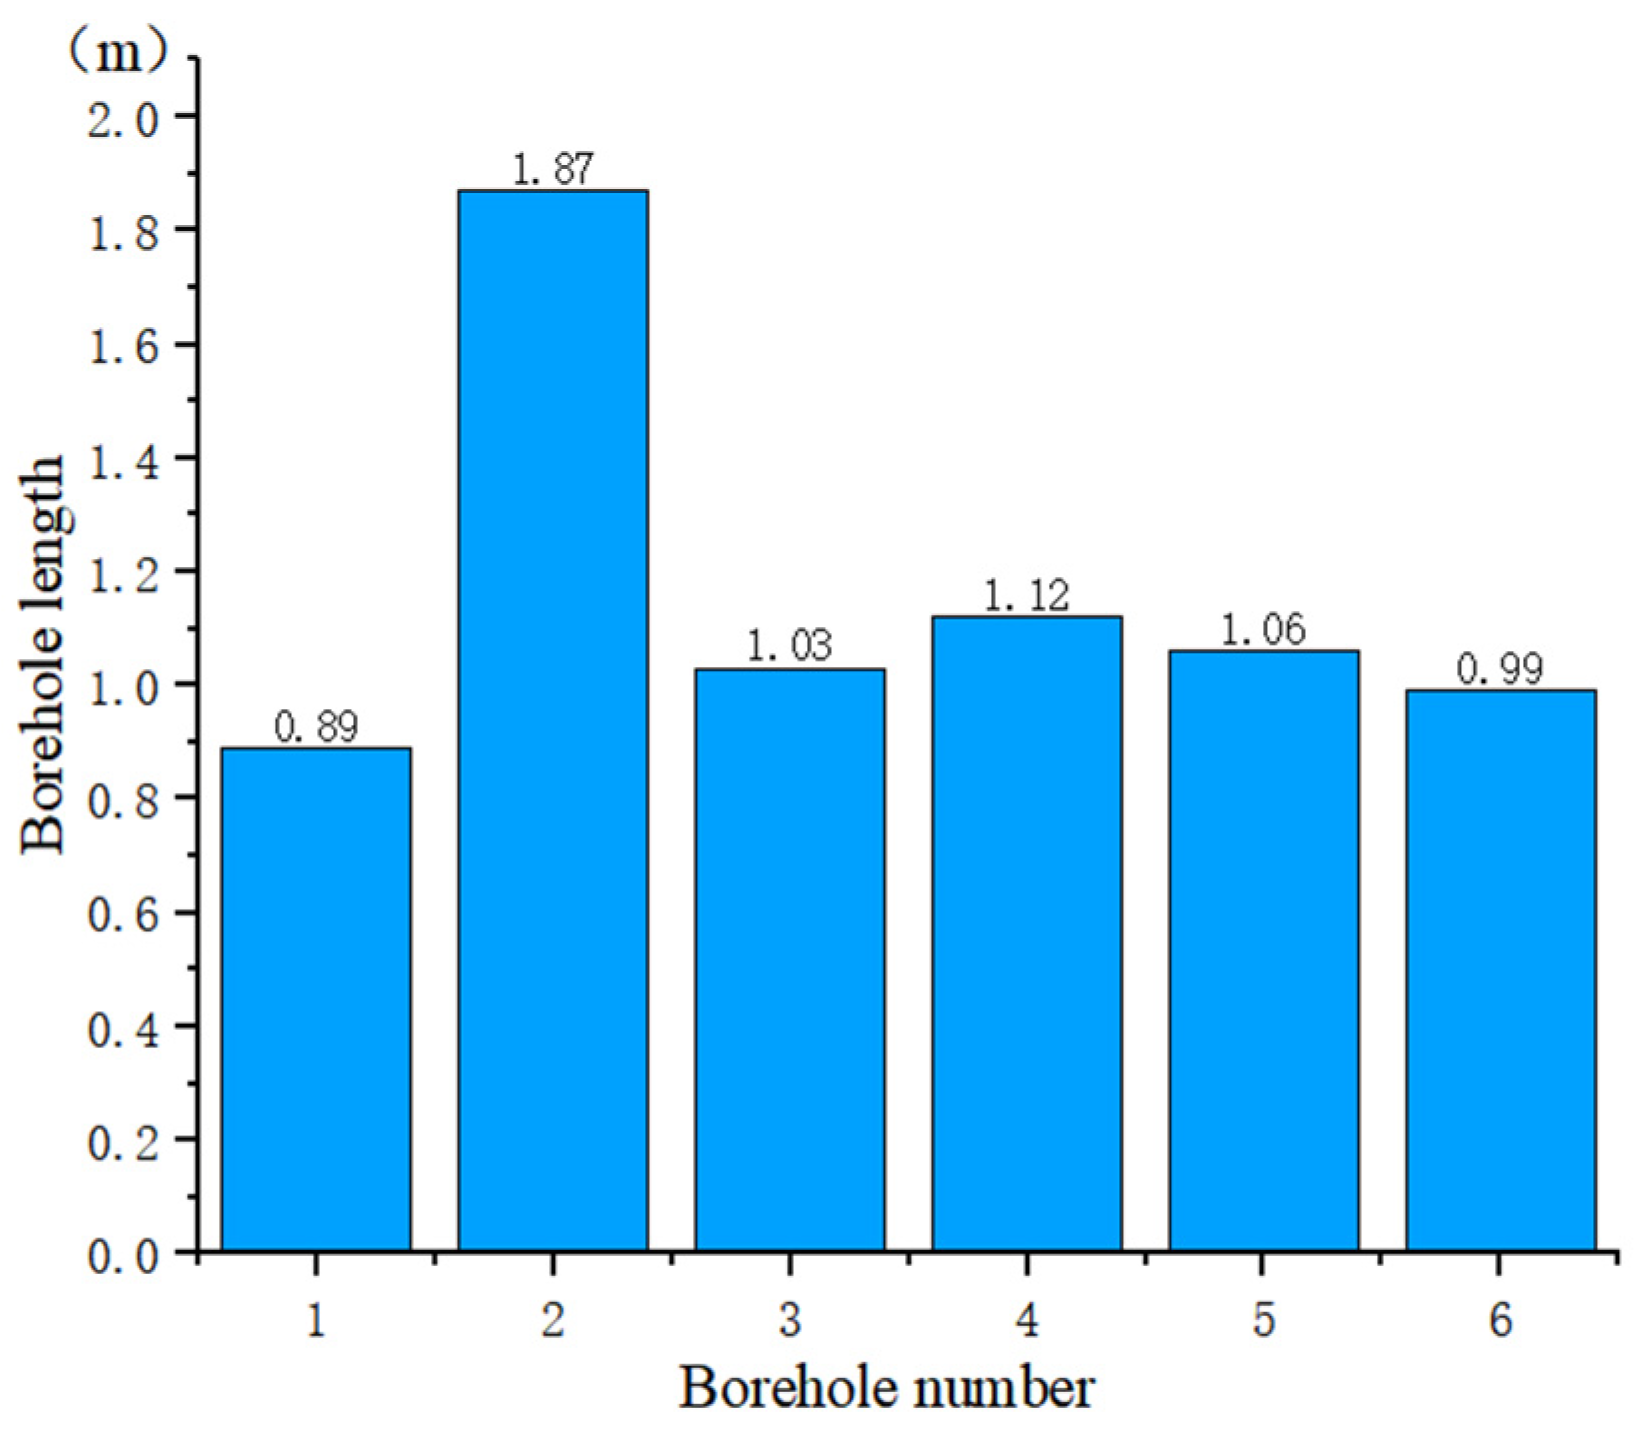

Disclaimer/Publisher’s Note: The statements, opinions and data contained in all publications are solely those of the individual author(s) and contributor(s) and not of MDPI and/or the editor(s). MDPI and/or the editor(s) disclaim responsibility for any injury to people or property resulting from any ideas, methods, instructions or products referred to in the content. |
© 2024 by the authors. Licensee MDPI, Basel, Switzerland. This article is an open access article distributed under the terms and conditions of the Creative Commons Attribution (CC BY) license (https://creativecommons.org/licenses/by/4.0/).