Article

Research on Region Noise Reduction and Feature Analysis of Total Focus Method Ultrasound Image Based on Branch Pipe Fillet Weld

1
College of Safety and Ocean Engineering, China University of Petroleum, Beijing 102249, China
2
PipeChina North Pipeline Company, Langfang 065000, China
3
Pipeline Technology and Safety Research Center, China University of Petroleum, Beijing 102249, China
4
Hefei General Machinery Research Institute, Hefei 230031, China
5
Key Laboratory of Oil and Gas Safety and Emergency Technology, Ministry of Emergency Management, Beijing 102249, China
*
Author to whom correspondence should be addressed.
Appl. Sci. 2024, 14(21), 9737; https://doi.org/10.3390/app14219737
Submission received: 23 September 2024 / Revised: 13 October 2024 / Accepted: 19 October 2024 / Published: 24 October 2024
(This article belongs to the Section Acoustics and Vibrations)

Abstract

:
As a technological advantage of ultrasonic non-destructive testing, fully focused imaging can accurately feedback the defective characteristics of the inspected object, greatly improving the detection efficiency. This article aims to address the challenges of outdated and low detection rates in the detection technology of branch pipe fillet welds. The full matrix acquisition (FMC) and total focus method (TFM) ultrasonic detection technology are used for detection and defect image feature analysis. Firstly, a multi-mode, fully focused real-time imaging software system was developed to address the specificity of the detection object; secondly, a phased array detection system based on 64 elements was constructed; finally, a region wavelet denoising method based on TFM images was proposed to solve the problem of artifacts caused by poor coupling; and based on the feature extraction method for a minimum rectangle, we analyzed the size, position, angle, and other information regarding defects. Through experiments, it has been found that this technology can effectively improve the detection efficiency of branch pipe weld defects, with a detection rate of 100%. Based on the partition fusion denoising method, the defect imaging quality can be further improved; at the same time, based on the feature extraction method, the error is 0.1 mm, the length range of various defects is 2.3 mm–6.3 mm, the width range is 0.6 mm–0.8 mm, and the angle range is 52°–75°, which can provide an application basis for the localization, classification, and risk assessment of corner weld defects in branch pipes.

1. Introduction

Ultrasonic phased array detection has the technical advantages of high sensitivity, good applicability, and diversified application fields [1]. Ultrasonic phased array detection technology uses a phased array probe to generate and receive ultrasonic waves. Each chip of the phased array probe is an array element, and each array element has an independent transmitting and receiving circuit. By controlling the time each array element transmits (or receives) pulses, the position and deflection angle of a beam focus can be changed, and then ultrasonic imaging can be realized by mechanical scanning or electronic scanning. The concept of full matrix capture (FMC) is proposed in relevant studies, and the total focusing method (TFM) based on an FMC is established and used [2,3,4]. Compared with traditional ultrasonic phased array detection, TFM can focus on any point in the measurement area through the post-processing of full matrix data [5]. FMC-TFM ultrasonic imaging detection has high detection accuracy and can provide full play to the advantages of data. Experts and scholars have performed a lot of outstanding work in the research direction of TFM imaging quality, data acquisition, and system optimization. Prashar K et al. used the mixed linear system model to compare and analyze the imaging quality of FMC-TFM, plane wave imaging (PWI), and virtual source aperture (VSA) technology and found that FMC-TFM has high imaging quality, but the speed of data acquisition is not high [6]. L. P. Piedade et al. studied the imaging quality and speed based on FMC, cs-FMC, and sparse compression methods. The image quality generated by cs-FMC and FMC is equivalent, and the implementation of a sparse array improves the compression reconstruction efficiency by 11 times, and the imaging speed is close to 7 times [7]. Shi BZ et al. proposed the F-TFM system, applied the TFM imaging system to FPGA, optimized the balance mechanism of recalculation and memory access in TFM, and upgraded the accelerator architecture. The results show that F-TFM can maintain high-quality images and provide the best data throughput [8]. Theodosia S et al. performed array imaging using a laser. The array data were captured using the full matrix and imaged by TFM. The experiment was carried out by lifting it 5 mm–20 mm away, which could improve the spatial resolution and defect detection ability of the side borehole [9]. Kerr W et al. proposed surface reconstruction technology based on three-dimensional ultrasonic data. Compared with the TFM imaging method, synthetic aperture technology can improve the signal-to-noise ratio but reduces the resolution and coverage [10]. Chen J et al. proposed a laser-induced full matrix imaging method for complex-shape objects, extracted surface Rayleigh waves for surface analysis, and used longitudinal wave imaging. TFM is suitable for complex surface imaging [11]. Piedade LP et al. proposed an optimal sparse matrix layout and proved that when its data acquisition reached three trigger points, the sparse matrix was superior to plane wave imaging (PWI) and sparse periodic arrangement (SPA) in terms of the noise contrast and array performance index [12]. Zhu W et al. proposed a sparse TFM imaging method based on directivity correction (dc-TFM) to solve the problems of inaccurate TFM imaging methods and long calculation time in rail defect detections. The experimental results show that the signal-to-noise ratio and array performance index are slightly reduced, but the imaging time is shortened by more than 40% [13]. Xu Q et al. introduced a segmented prime search method (SSM) to quickly determine the incident point of the wedge-shaped double-layer medium. By imposing constraints between the point source and the target, the search interval was reduced, the efficiency of PAUT (FMC) captured by the full matrix was improved, and the accuracy of the beam was ensured [14]. Zhu W et al. proposed the sign coherence factor total focus method (scf-TFM), studied the ultrasonic Lamb wave imaging when the defect spacing was less than the resolution limit, and concluded that the transverse resolution of scf-TFM is twice that of the full-focus method [15]. Xu Q et al. proposed a compressed sensing-based ultrasonic phased array (cs-TFM) TFM method. The optimal mesh generation method based on accuracy and speed can ensure imaging accuracy and reduce the TFM imaging time [16]. Ponseenivasan S et al. discussed the influence of elastic anisotropy on the ultrasonic imaging of coating defects. Elastic coating will cause image distortion, and they proposed to enhance the imaging quality of FMC-TFM by using alternative isotropic velocities. This method has universal applicability [17]. Park S believes that when the ultrasonic imaging system uses the dynamic emission characteristics of the overlapping wave field of the transmitted beam to reconstruct the image, it can avoid the imaging effect of the plane angle and has good reception performance [18]. Lewandowski M et al. developed an ultrasound system based on GPU cluster parallel mechanisms, which can realize high-speed FMC data acquisition and image acquisition at a high frame rate [19]. Njiki M et al. developed a real-time TFM imaging architecture based on FPGA using the FMC method, which greatly improves the efficiency of data transmission [20]. Tseng P et al. have developed a non-real-time ultrasonic array system based on the FMC method, which is superior to the commercial ultrasonic array system in terms of lateral resolution and signal-to-noise ratio but increases the time cost [21]. Yu Z et al. proposed an adaptive ultrasonic imaging method for anisotropic carbon fiber polymer based on FMC-TFM, which can effectively reconstruct various internal defects, such as cracks and voids [22]. Le J et al. proposed an adaptive ultrasonic imaging method based on the fusion of phased array and full-focus technology and verified the different shape defects with a flexible wedge [23].
It can be seen from the above that the TFM imaging quality greatly affects the recognition rate of defects, especially in the field of industrial detection, where the complex morphology of the tested object surface will lead to worse imaging quality. Therefore, image processing is an important research direction of FMC-TFM ultrasonic testing, in which the elimination of image artifacts and noise reduction can greatly improve image quality. Rodrigues J proposed a probe standoff optimization method (PSOM) to solve the problems of artifacts and resolution degradation in the detection of curved objects. By comparing the signal artifact ratio (SAR) and array performance index (API), the feasibility of this method was proved, but its performance for the array performance index of the convex model was poor [24]. By comparing the noise reduction effect of the time reversal multi-signal classification algorithm and full-focus algorithm, Fan C et al. found that the time reversal multi-signal classification algorithm has a relatively better effect for high noise processing [25]. Cantero C et al. proposed a deep learning architecture based on the principle of full focus and self-coding, which can effectively remove and suppress the artifacts of ultrasonic array images, but its applicability is narrow [26]. Teng D et al. proposed a delay multiplication sum algorithm based on the TFM, which can effectively use the three-dimensional feature information to generate the frequency component, greatly improve the signal-to-noise ratio of the reconstructed image, and have high lateral resolution [27]. Bruder D et al. carried out laser ultrasonic total focus detection for welds and determined that the guided wave generated by lasers can be used for TFM remote evaluation, but the image reconstruction effect due to edge reflection and a scattering effect is poor [28]. Wang H et al. studied the automatic classification of different defects in TFM images, used different machine learning models to reconstruct the images of pipeline crack defects and pore defects, proved the superiority of the hog poly SVM algorithm, and proposed a TFM imaging method for small targets of buried pipelines [29]. Zhao J et al. proposed an improved adaptive window genetic algorithm gcForest (AWGA-gcForest), which is based on FMC data processing, eliminates the interference of incident wave and a back wall echo, reduces the computational complexity of the gcForest algorithm, and improves the classification accuracy [30]. Osman A et al. proposed an automatic interpretation method of ultrasonic data, tested artificial defects with different characteristics in carbon-fiber-reinforced polymer composites (CFRP), and verified the correctness of the segmentation method, but the classification accuracy needs to be improved [31]. Zhang J et al. proposed a weighted TFM to image defects through simulation and experimental data, which can improve the signal-to-noise ratio and resolution of ultrasonic imaging of coarse-grained steel and can distinguish the images of adjacent defects [32]. He H et al. proposed a post-processing algorithm that uses the directivity of laser ultrasounds to suppress artifacts in the full-focus image. The results show that the artifact suppression effect is good, so larger element spacing can be used to reduce the data acquisition time [33]. Molinier N et al. proposed to replace the traditional FMC acquisition and TFM processing with a single zero plane wave (PW) transmission and conditional generation countermeasure network (cGAN). This method reconstructs the TFM image with the same resolution, and the artifact suppression effect is good. The calculation time and file memory are reduced by 120 times and 75 times, respectively [34]. Wang S et al. proposed a fusion factor coefficient for TFM image processing, which adjusts the weights of different modes for image fusion and denoising, thereby maintaining the integrity of the fused image defect information [35]. Liu Z et al. used Phase Circular Statistical Vectors (PCSVs) for weighted optimization, which improved the quality of fully focused images and suppressed background noise and multi-modal artifacts [36]. Qin Y et al. proposed a fully focused imaging algorithm based on acoustic tracking, which can suppress artifacts, improve the imaging quality of fully focused detection, and have a defect localization error of less than 0.3 mm [37]. Chen M et al. proposed a fast Fourier domain full matrix imaging algorithm that ensures image accuracy and resolution in wide-angle situations, suitable for the oblique incidence detection of welds [38].
The reinforcement of branch pipe fillet welds and the difference in branch structures lead to the inapplicability of a variety of detection technologies. In this paper, FMC-TFM technology based on ultrasonic detection is used to detect the small-diameter branch pipe fillet weld, and a set of multi-mode focusing imaging software is developed based on the industrial detection requirements of the branch pipe fillet weld. The pipe surface is convex, with poor surface smoothness and low coupling, resulting in serious image artifacts. Therefore, this paper proposes an image post-processing strategy based on the fusion of regional wavelet denoising and adaptive denoising, which is verified by experiments and can effectively eliminate artifacts. In addition, based on the above work, for the analysis of weld defect characteristics, the minimum rectangle method is used for feature extraction, and the feature analysis is carried out combined with the welding process. The key information, such as the size, location, and type of defects, can be obtained through experimental verification.

2. Methodology

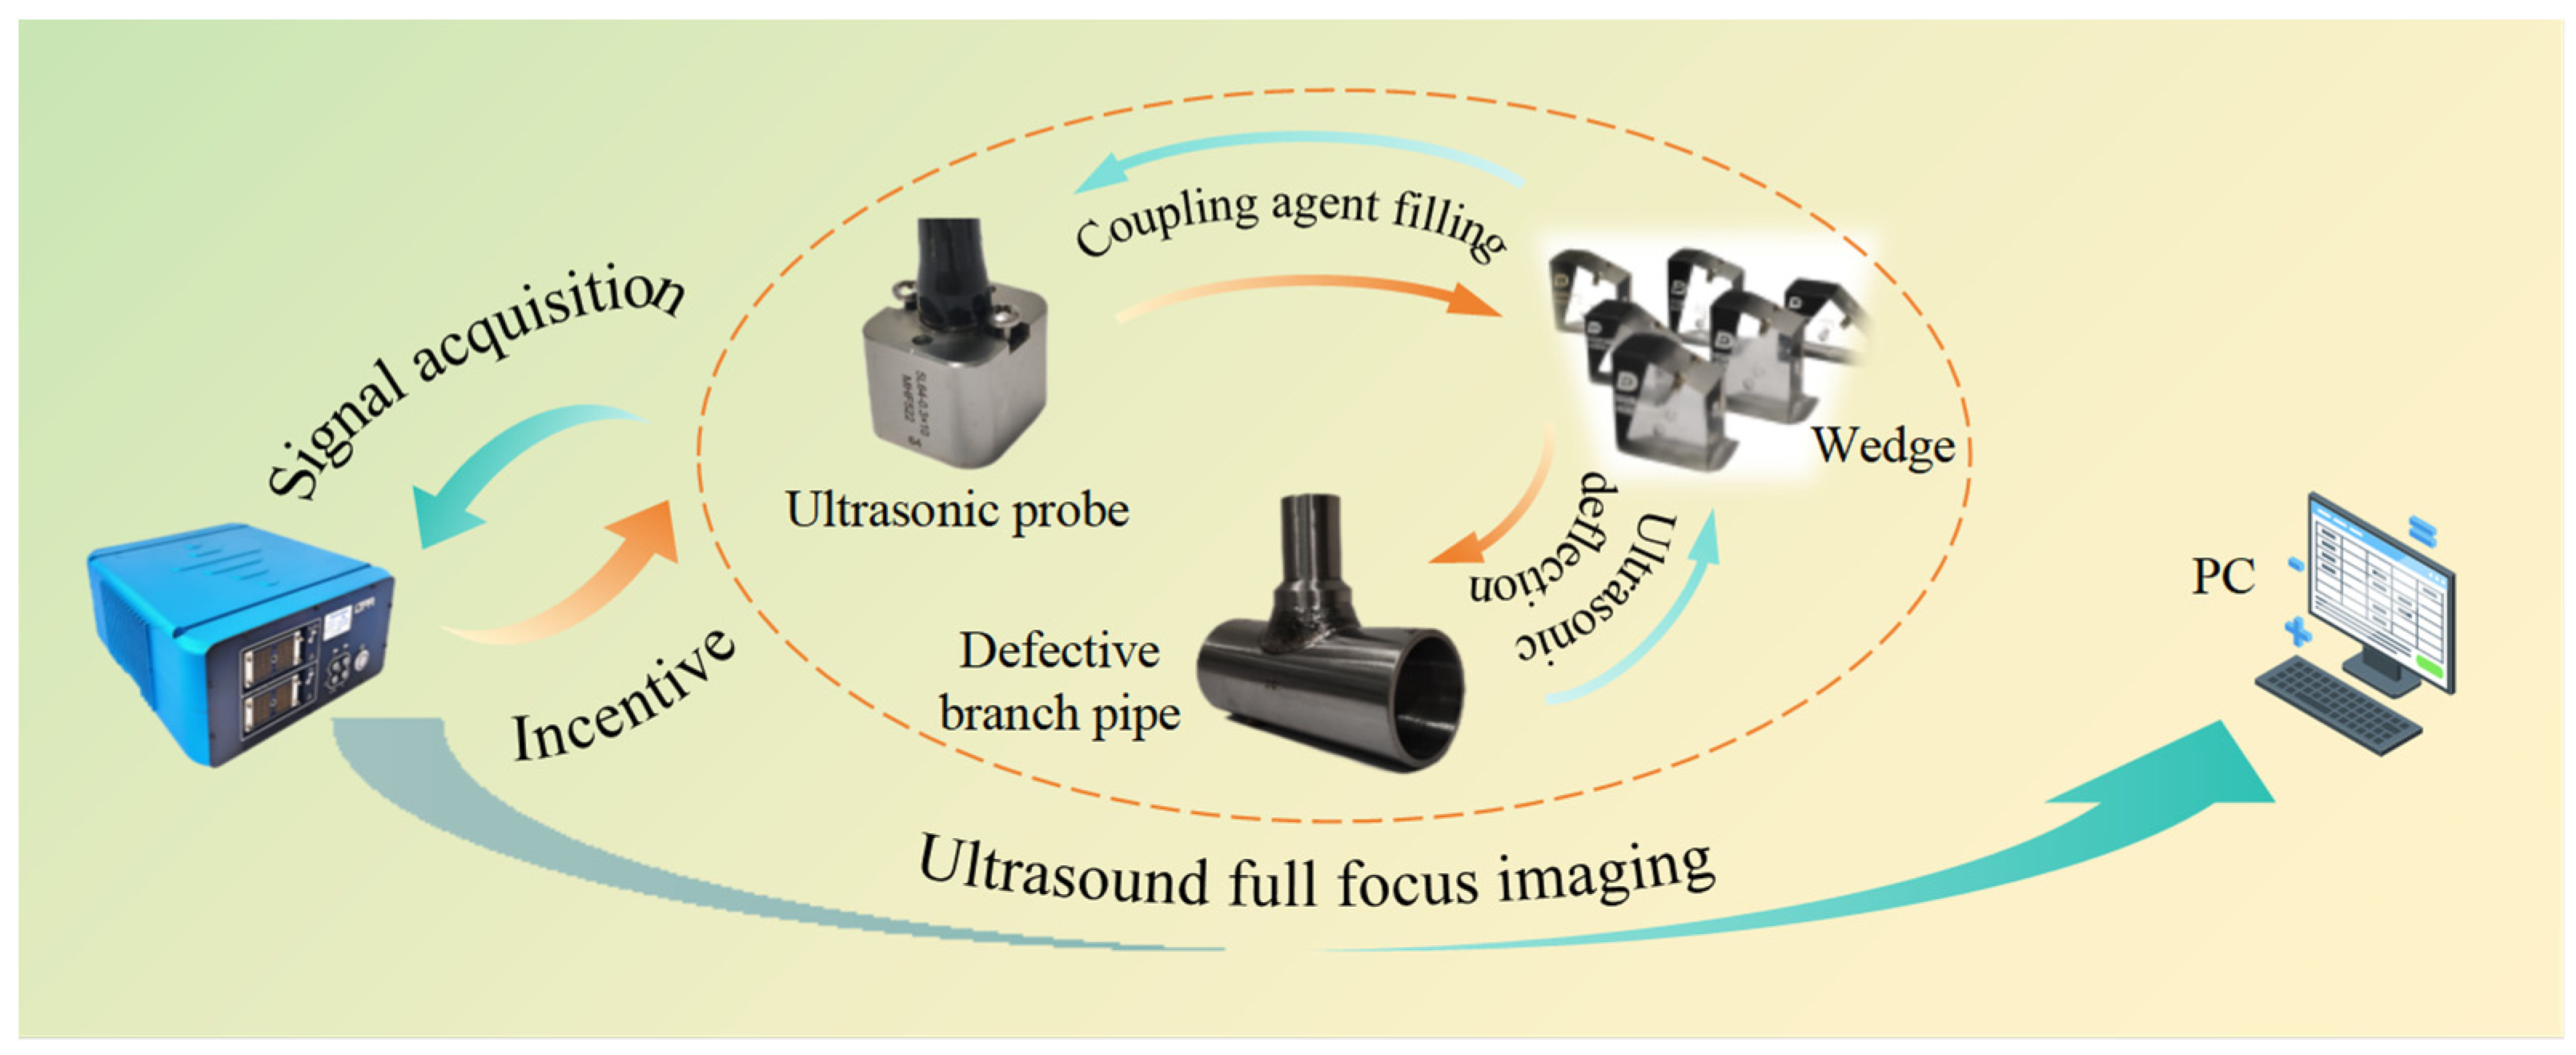
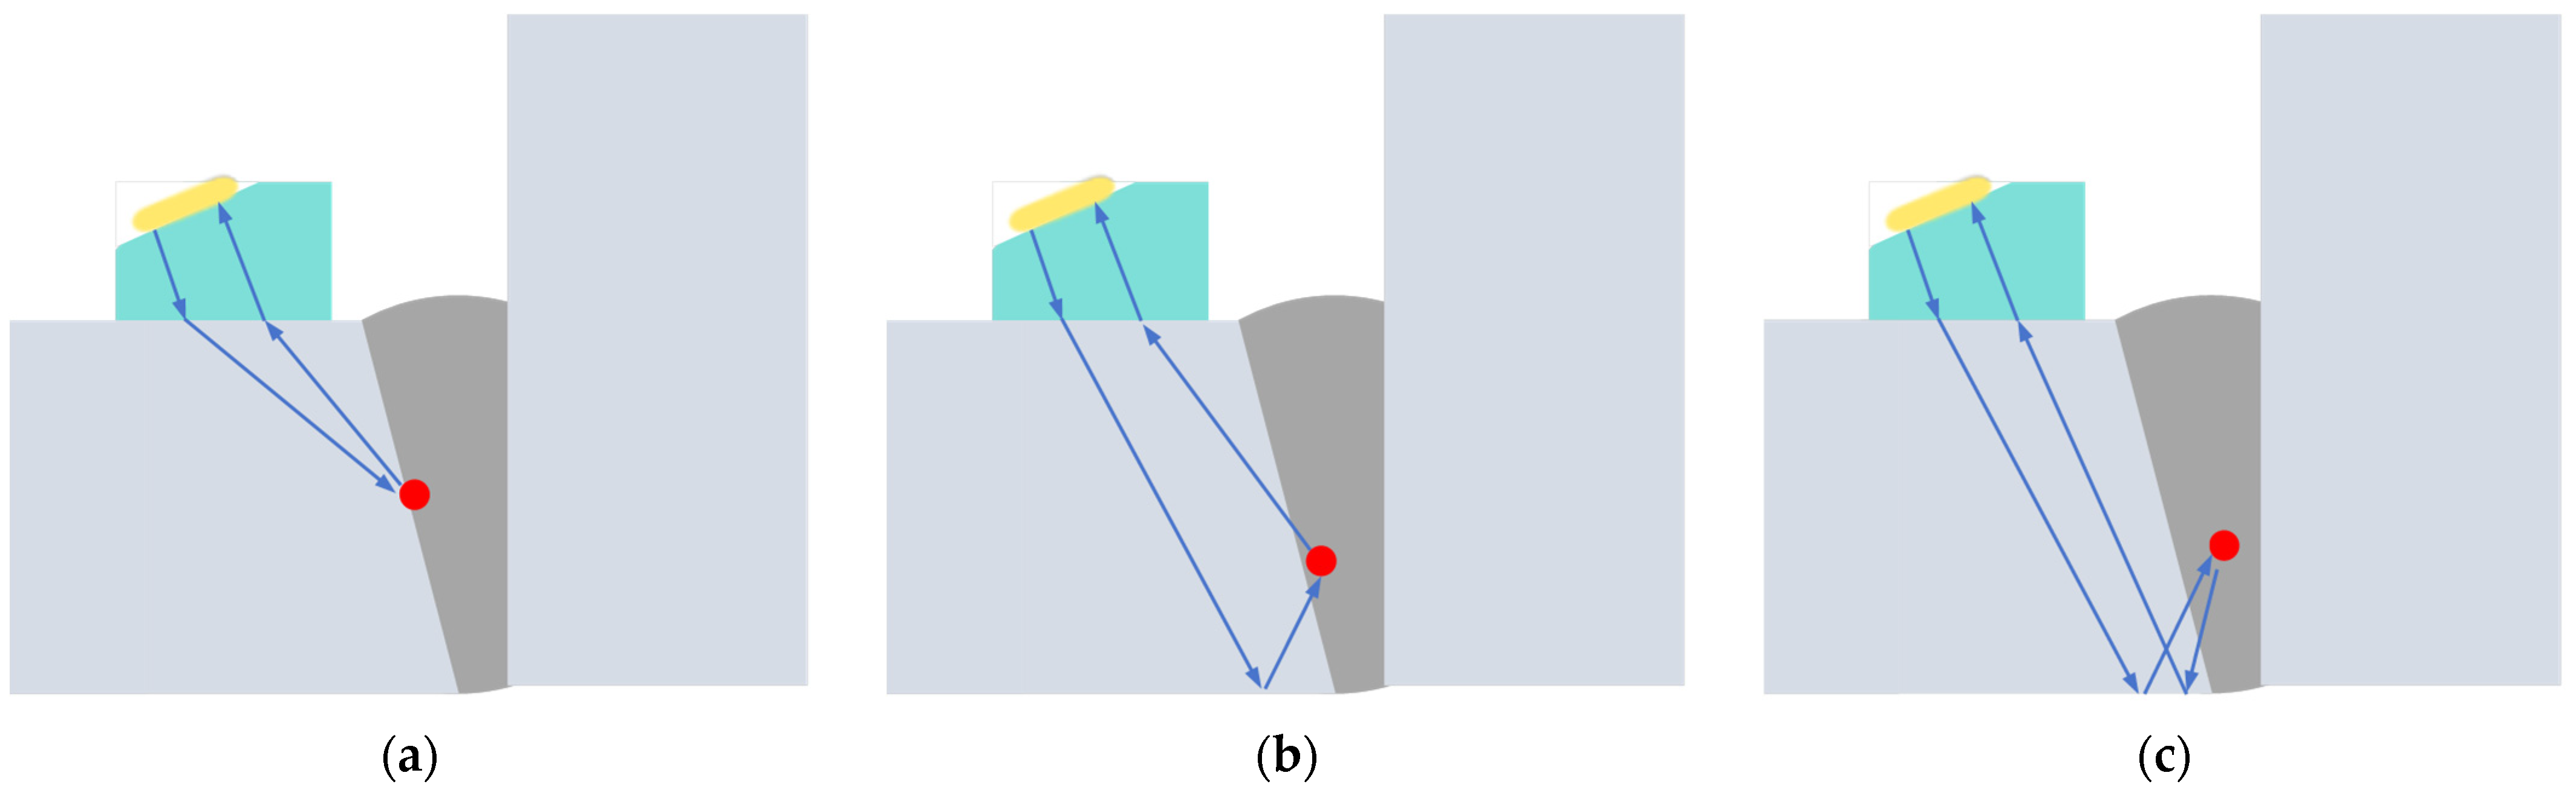
2.1. Branch Pipe Detection FMC-TFM Detection Model

FMC is the basis of TFM images. The full matrix data acquisition model is shown in Figure 1. The ultrasonic transducer with the number of array elements of N excites a single array element of the transducer, which, in turn, collects and stores the echo data of n array elements and finally obtains the matrix data S i j ( t ) of N*N, where 1 i N , 1 j N .
TFM focuses the full matrix data to each point of the detection image and obtains the image by using the amplitude number of ultrasonic echo. The inclined wedge is used as the intermediary for branch pipe detection, and the principle diagram of the full-focus imaging algorithm is shown in Figure 2.
The wedge is in close contact with the branch pipe through the coupling agent. In this paper, the projection point of array element 1 on the surface of the sample is taken as the origin o, the transverse axis X is along the axis of the main pipe, and the longitudinal axis Z is along the axis of the branch pipe. The detection area is divided into a certain number of pixels, as shown by the dots in Figure 2. These pixel points are the focus of the acoustic beam. Take point ( x ,   z ) as an example; to obtain the ultrasonic echo amplitude value of this point, all signals of the full matrix data set are superimposed at this point, and the point amplitude S  ( x ,   z ) is shown in Formula (1).
S ( x , z ) = i = 1 N j = 1 N S i , j ( t i , j ( x , z ) )
In Formula (1), S i , j ( t i , j ( x , z ) ) is the echo amplitude of the point ( x ,   z ) transmitted by the i-array element and received by the j-array element, where t i , j ( x , z ) represents the delay time of the sound wave from the i-array element to the j-array element. In combination with the branch pipe detection model, t i , j ( x , z ) is represented by Formula (2).
t i , j ( x , z ) = ( x i x ) 2 + z 2 + ( x j x ) 2 + z 2 c s + T w
In Formula (2), T w is the delay time of the sound wave in the wedge during the transmission of the i array element and the reception of the j array element, and c s is the wave velocity of the sample. Combined with the branch pipe detection model, T w is specifically expressed in Formula (3).
T w = x i x i 0 2 + z i 2 + ( x j x j 0 ) 2 + z j 2 c w
In Formula (3), c w is the wedge wave velocity.

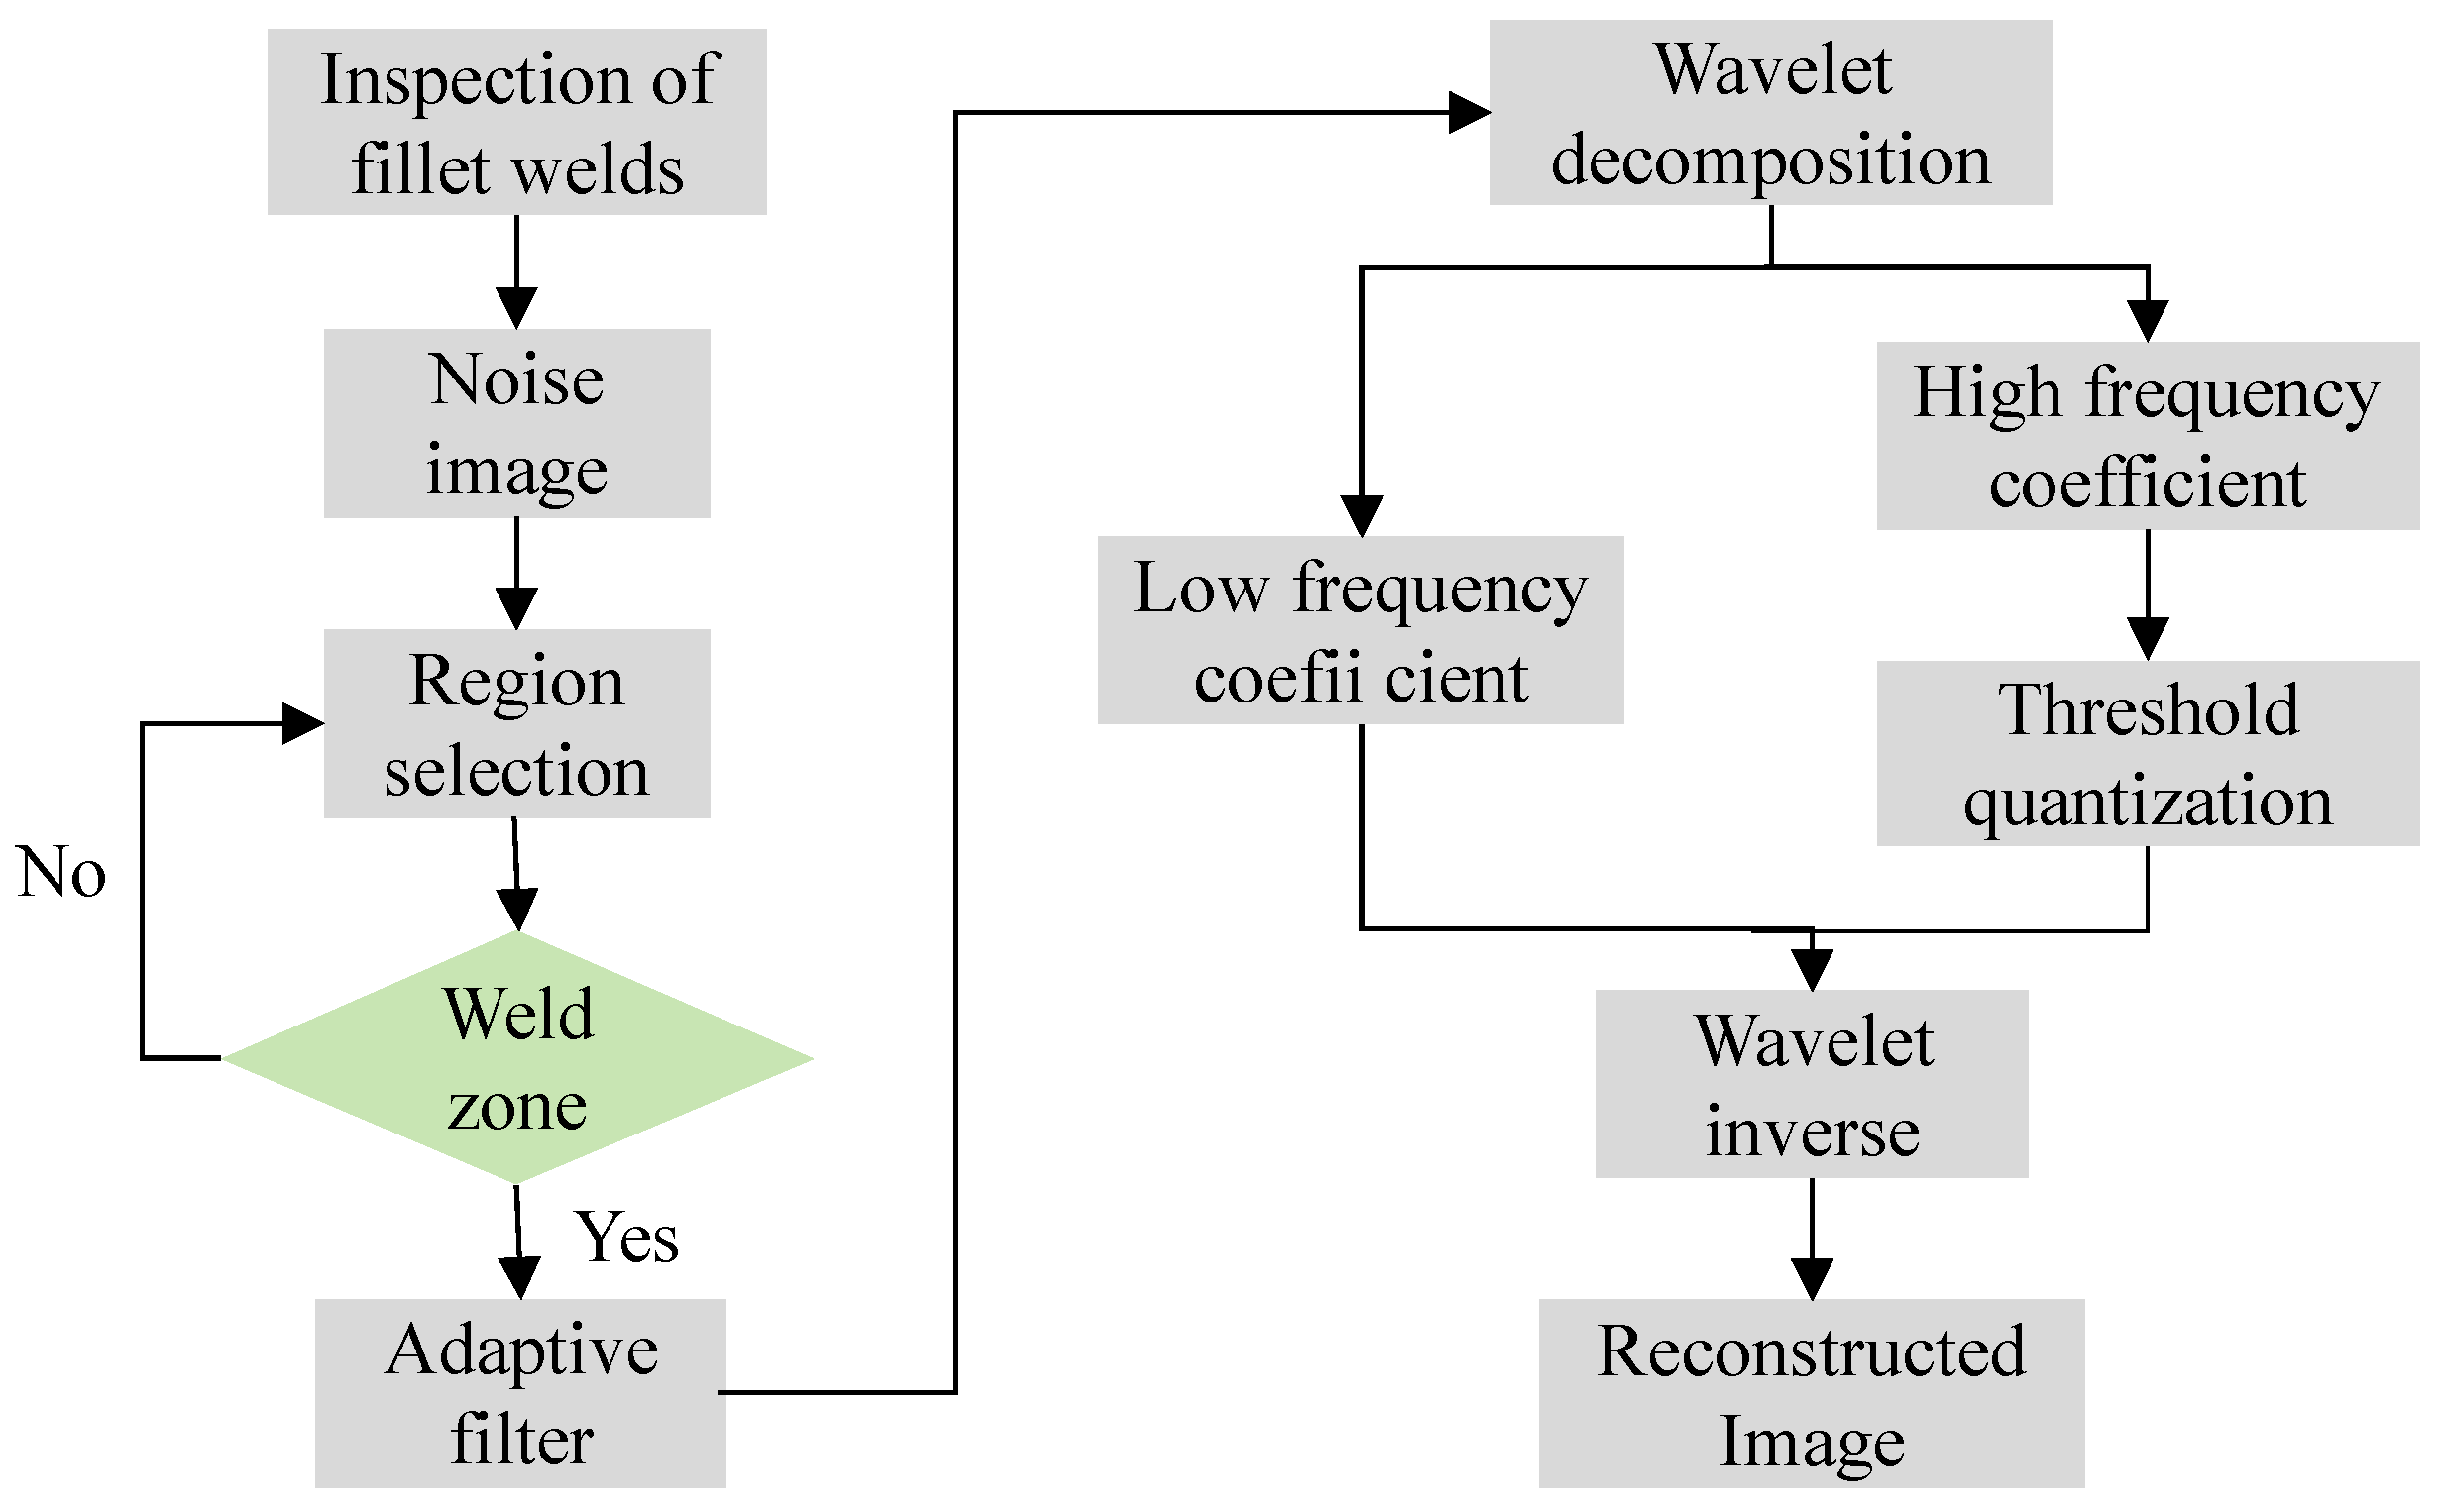
2.2. Regional Wavelet Fusion Denoising Model

Imaging quality is related to the effect of full-focus real-time dynamic detection, and there are many interference factors in industrial detection; the poor flatness of the artificial welding surface at the connection between the main pipe and branch pipe of the oil and gas pipeline makes it difficult for the wedge to make contact closely with the surface of the main pipe, which leads to serious artifacts and seriously affects the effective identification of defects. Therefore, image filtering is an effective method to improve the recognition rate of branch fillet weld defects. Wavelet analysis can better represent the local features of images in the time and frequency domains and has great advantages in image denoising and feature extraction. In the process FMC, each burst element has the function of transmitting and receiving, and the array element width is small, the acoustic beam diffusion angle generated by the array is large, and the scanning angle is increased, so the imageable area is large; the position of the branch pipe welding area relative to the main pipe is determined, so the image region denoising can retain the image features of the target region to the greatest extent without affecting the weld detection so as to provide a high-quality data set for the subsequent research on the classification and size quantization of full-focus defect images.
In this paper, a wavelet region denoising method is used for branch pipe full-focus ultrasound images. The specific method is shown in Figure 3, which mainly includes three steps:
Generate a TFM noise image containing artifacts through the detection of branch pipe corner welds and then perform region division to select the weld area. Adaptive filtering denoising is applied to the weld seam area, followed by wavelet denoising for non-weld seam areas. In the process of wavelet denoising, high-frequency and low-frequency coefficients are first generated, and the threshold quantization method is used to process the high-frequency coefficients. Finally, the TFM image is reconstructed using the wavelet inverse transform method based on two types of coefficients.
(1) Firstly, according to the cross-sectional morphology of the welding area, the region of the full-focus original image was selected. Combined with the location of the welding area and the pre-experiment, the defect location was located on the right side of the image. In order to retain the image characteristics of the welding area to the greatest extent, the welding area was defined as a rectangular area.
(2) Secondly, pixel adaptive filtering was applied to the welding region.
(3) Finally, the non-welding area was denoised by wavelet filtering: multi-resolution wavelet decomposition was adopted, and the number of decomposition layers was set to 3; then, the compromise threshold method was used to process the wavelet coefficients, and finally, the multi-scale two-dimensional discrete wavelet was used for image reconstruction.
The soft and hard threshold compromise functions can improve the defect that the soft threshold function has a large constant deviation and alleviate the image distortion caused by discontinuous threshold points.
W j , k = s i g n ( W j , k ) ( W j , k α T ) ,                   W j , k T                                     0                                       ,                   W j , k < T
where W j , k is the estimated wavelet high-frequency coefficient; W j , k is the high-frequency coefficient after wavelet decomposition; the sign is a symbolic function, as shown in Formula (5); j and k are the positions of wavelet coefficients; T is the wavelet threshold; α is the adjustment parameter with a value range of 0–1. When α is 0, the threshold function is a hard threshold function, and when α is 1, the threshold function is a soft threshold function.
s i g n = 1       ,           W j , k > 0 0       ,           W j , k = 0 1 ,           W j , k < 0

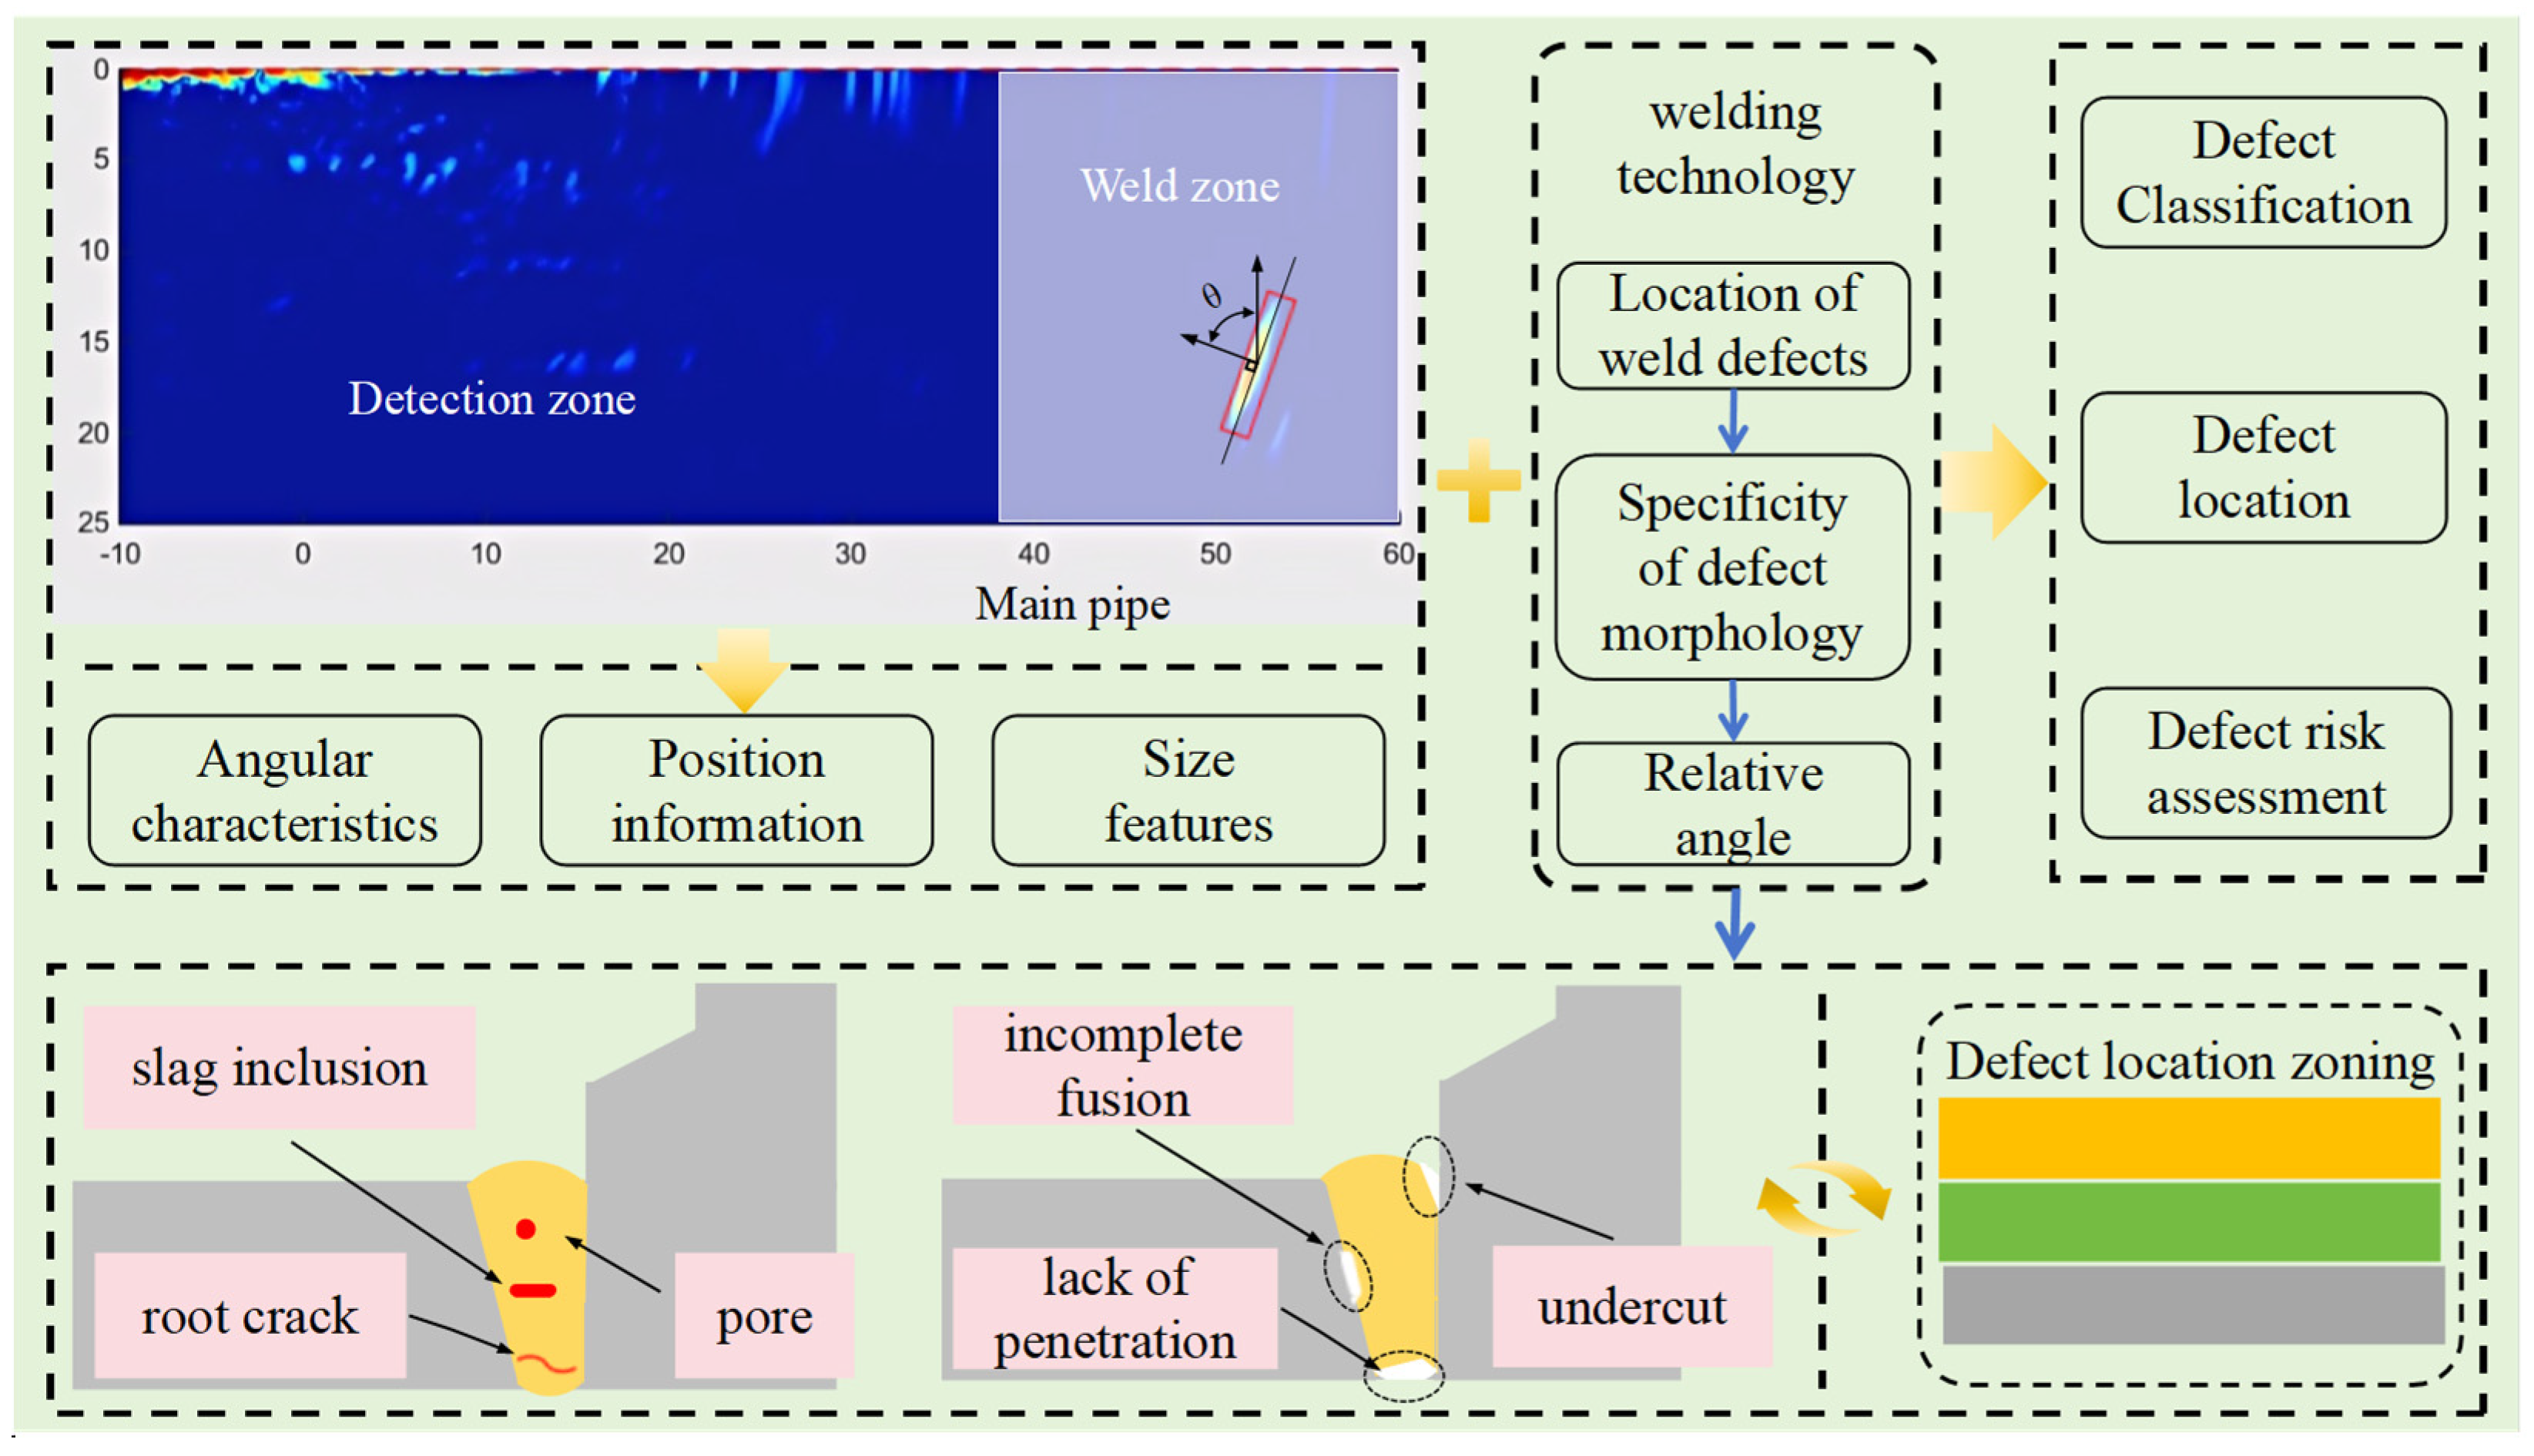
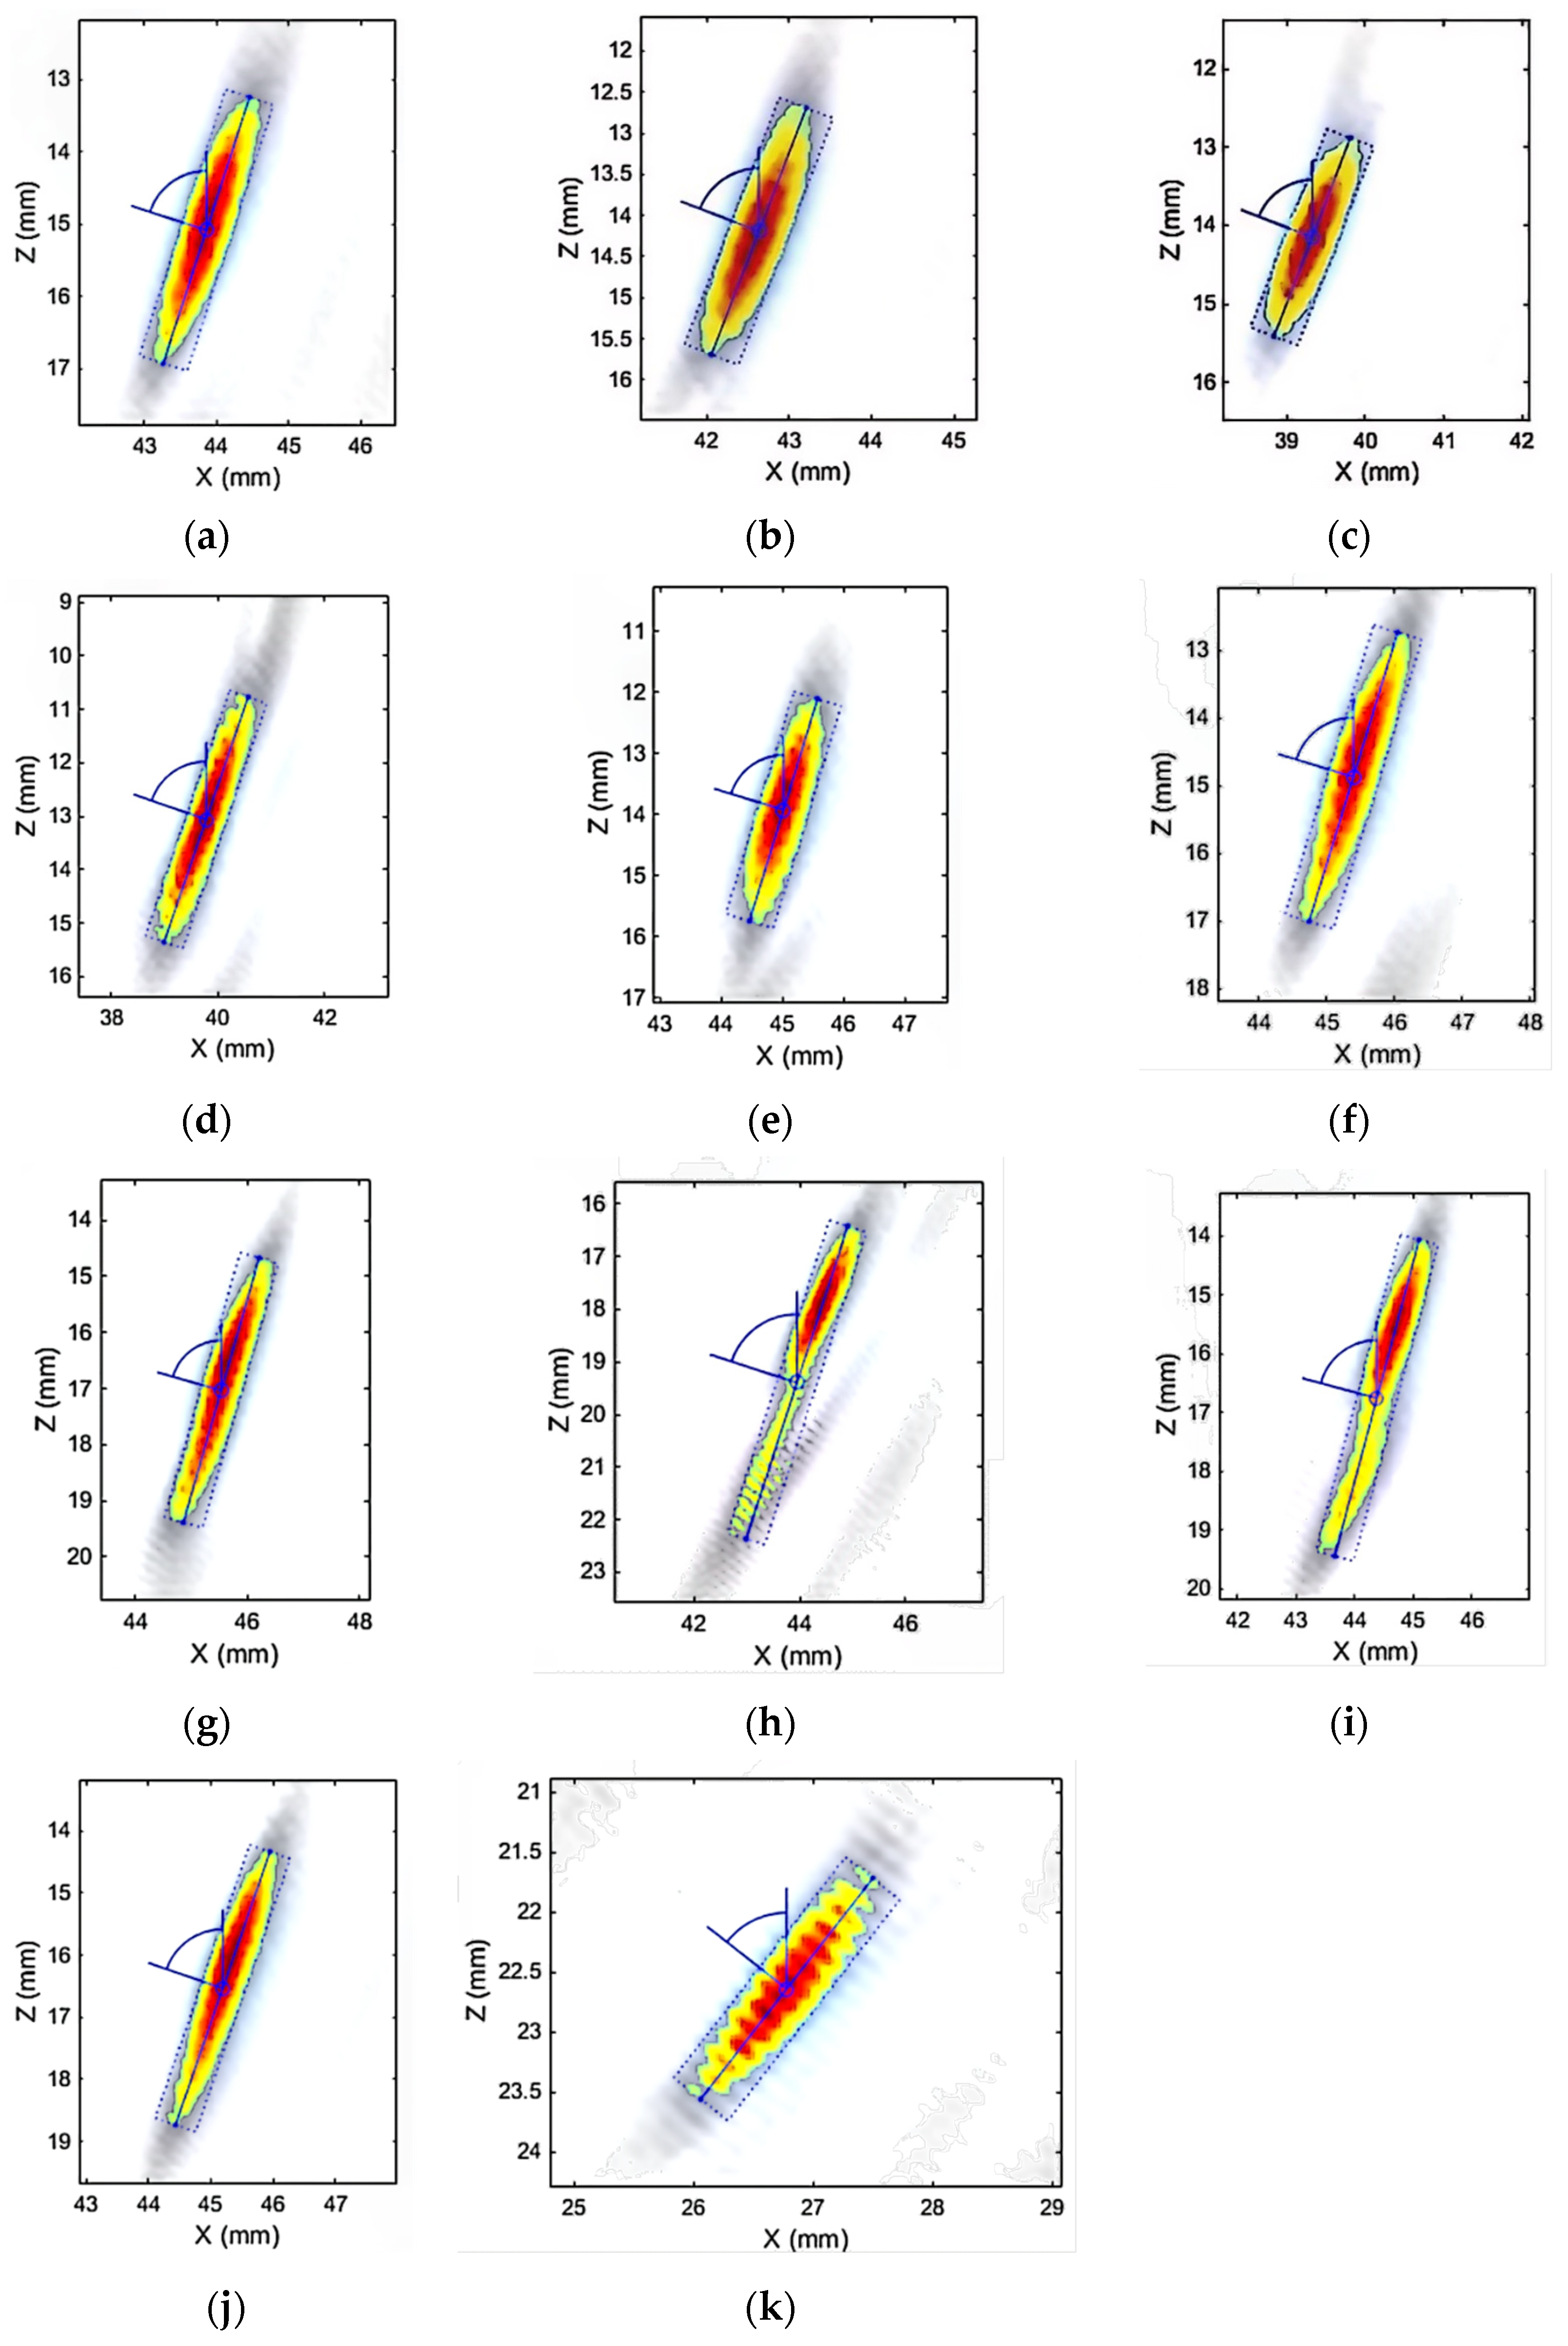
2.3. Feature Extraction

In this paper, the intelligent minimum rectangle method is used for quantitative analysis of defect characteristics. The minimum rectangle method can effectively determine the minimum envelope area of the defect so as to determine the size of the defect according to the size mapping relationship between the image and the tested sample; at the same time, based on the length direction of the rectangle and the incident direction of the sound wave, the extension direction of the defect can be determined, which, combined with the welding process, can provide the basis for the identification of the defect type. The image feature extraction and analysis methods are shown in Figure 4.
It can be seen from Figure 4 that there are randomly distributed artifacts in the detection of branch fillet welds, which will affect the recognition of image defect features. The minimum rectangle method can completely envelop the defect characteristics of the welding area. At the same time, the angle vector perpendicular to the center line of the rectangle is established according to the direction of the coordinate axis constructed in Figure 2. The center position (x, z) of the smallest rectangle can be used as the location information of defects. Combined with the basis that different types of defects are located in different positions of the weld, we can preliminarily determine the type of defects. The length and width of the minimum rectangle can be approximated as the range size of the defect and can be used as an auxiliary judgment method for the type of defect. At the same time, the range size of the defect can be used as the main basis for weld risk assessments. The angle vector is an important characteristic of the spatial morphology of weld defects and can be used as an auxiliary criterion for the type discrimination and risk assessment of weld defects. The position of the fillet weld area relative to the branch pipe is determined. In order to avoid nonstandard welding, we choose a rectangle as the maximum area of the weld to ensure the effective capture of defect features. The defect location area is a discrimination mechanism established according to the vertical distribution of different defects. The fillet weld defects involved in this paper mainly include six types: incomplete fusion, incomplete penetration, undercut, slag inclusion, porosity, and root crack.

3. Experiment

The multi-mode ultrasonic phased array detector adopts a modular design and can support secondary development. It integrates multiple modules, such as a precision analog circuit, a high-speed digital circuit, phased array signal processing, a software system, and a network transmission. It has 64 fully parallel hardware channels and can realize real-time full-focus imaging. Probe specification: 5 MHz, 64 array elements, spacing 0.3 mm, and country of origin: China. The wedge is designed for the probe model to ensure overall adaptability. The material used is polystyrene, which has high sound permeability, and the ultrasonic propagation performance and coupling effect are much higher than those of traditional plexiglass. The curvature diameter of the wedge is from 180 mm to 25 mm, effectively covering the diameter of the branch pipe below 180 mm. The main pipe diameter of the sample is 90 mm, and the branch pipe diameter is 25 mm to 45 mm, which is welded by Tungsten Inert Gas (TIG) Welding. The software system can realize TFM and HMC focusing imaging, multi-mode oblique incidence detection, and semi-quantitative size analysis of defects and other functions and meet the full-focus real-time detection of branch pipe fillet welds. The relationship of each part of the detection system is shown in Figure 5. The actual detection system is shown in Figure 6.
The configuration of key parameters, such as the detection model, resolution, and sound velocity of the branch pipe imaging system, is shown in Table 1 below.
The construction of the TT model is shown in Figure 2. The other two models (TTT and TTTT) can refer to the TT model for construction. The three models can meet the detection of weld defects at different positions, adjust the detection position, and better adapt to the detection conditions. The three models are shown in Figure 7.
General branch pipe welding includes variable diameter types and base reinforced types, which are mainly employed to increase the strength of the connection and avoid stress failure caused by a high-pressure environment. Secondly, it can facilitate welding and improve the quality of manual welding. The minimum diameter of the test object in this paper is 25 mm, and the material is 316 stainless steel. The test sample is shown in Figure 8, where T and Y, respectively, represent the relative positions of the main pipe and branch pipe (two types); moreover, 90 mm is the diameter of the main pipe, and 25–45 mm is the diameter of the branch pipe; B/NB represents whether there is a base, and DC represents the variable diameter branch pipe. There are two prefabricated defects in the T-shaped branch pipe located on the left and right sides, respectively. There is one prefabricated defect in the Y-shaped branch pipe, located at the weld seam with an obtuse angle shape.
The steps involve applying a coupling agent on the contact surfaces between the probe and wedge block, as well as between the wedge block and the pipe fitting, and then performing multiple repeated tests according to the testing method shown in Figure 8. The maximum moving scanning speed in the experiment is 1 mm/s. After the detection is completed, capture the TFM image and save it, and then use the region wavelet denoising algorithm to read the image and perform denoising processing; synchronize the use of adaptive filtering methods to process defect areas. Finally, use the minimum rectangle method to analyze the defect features of the image.

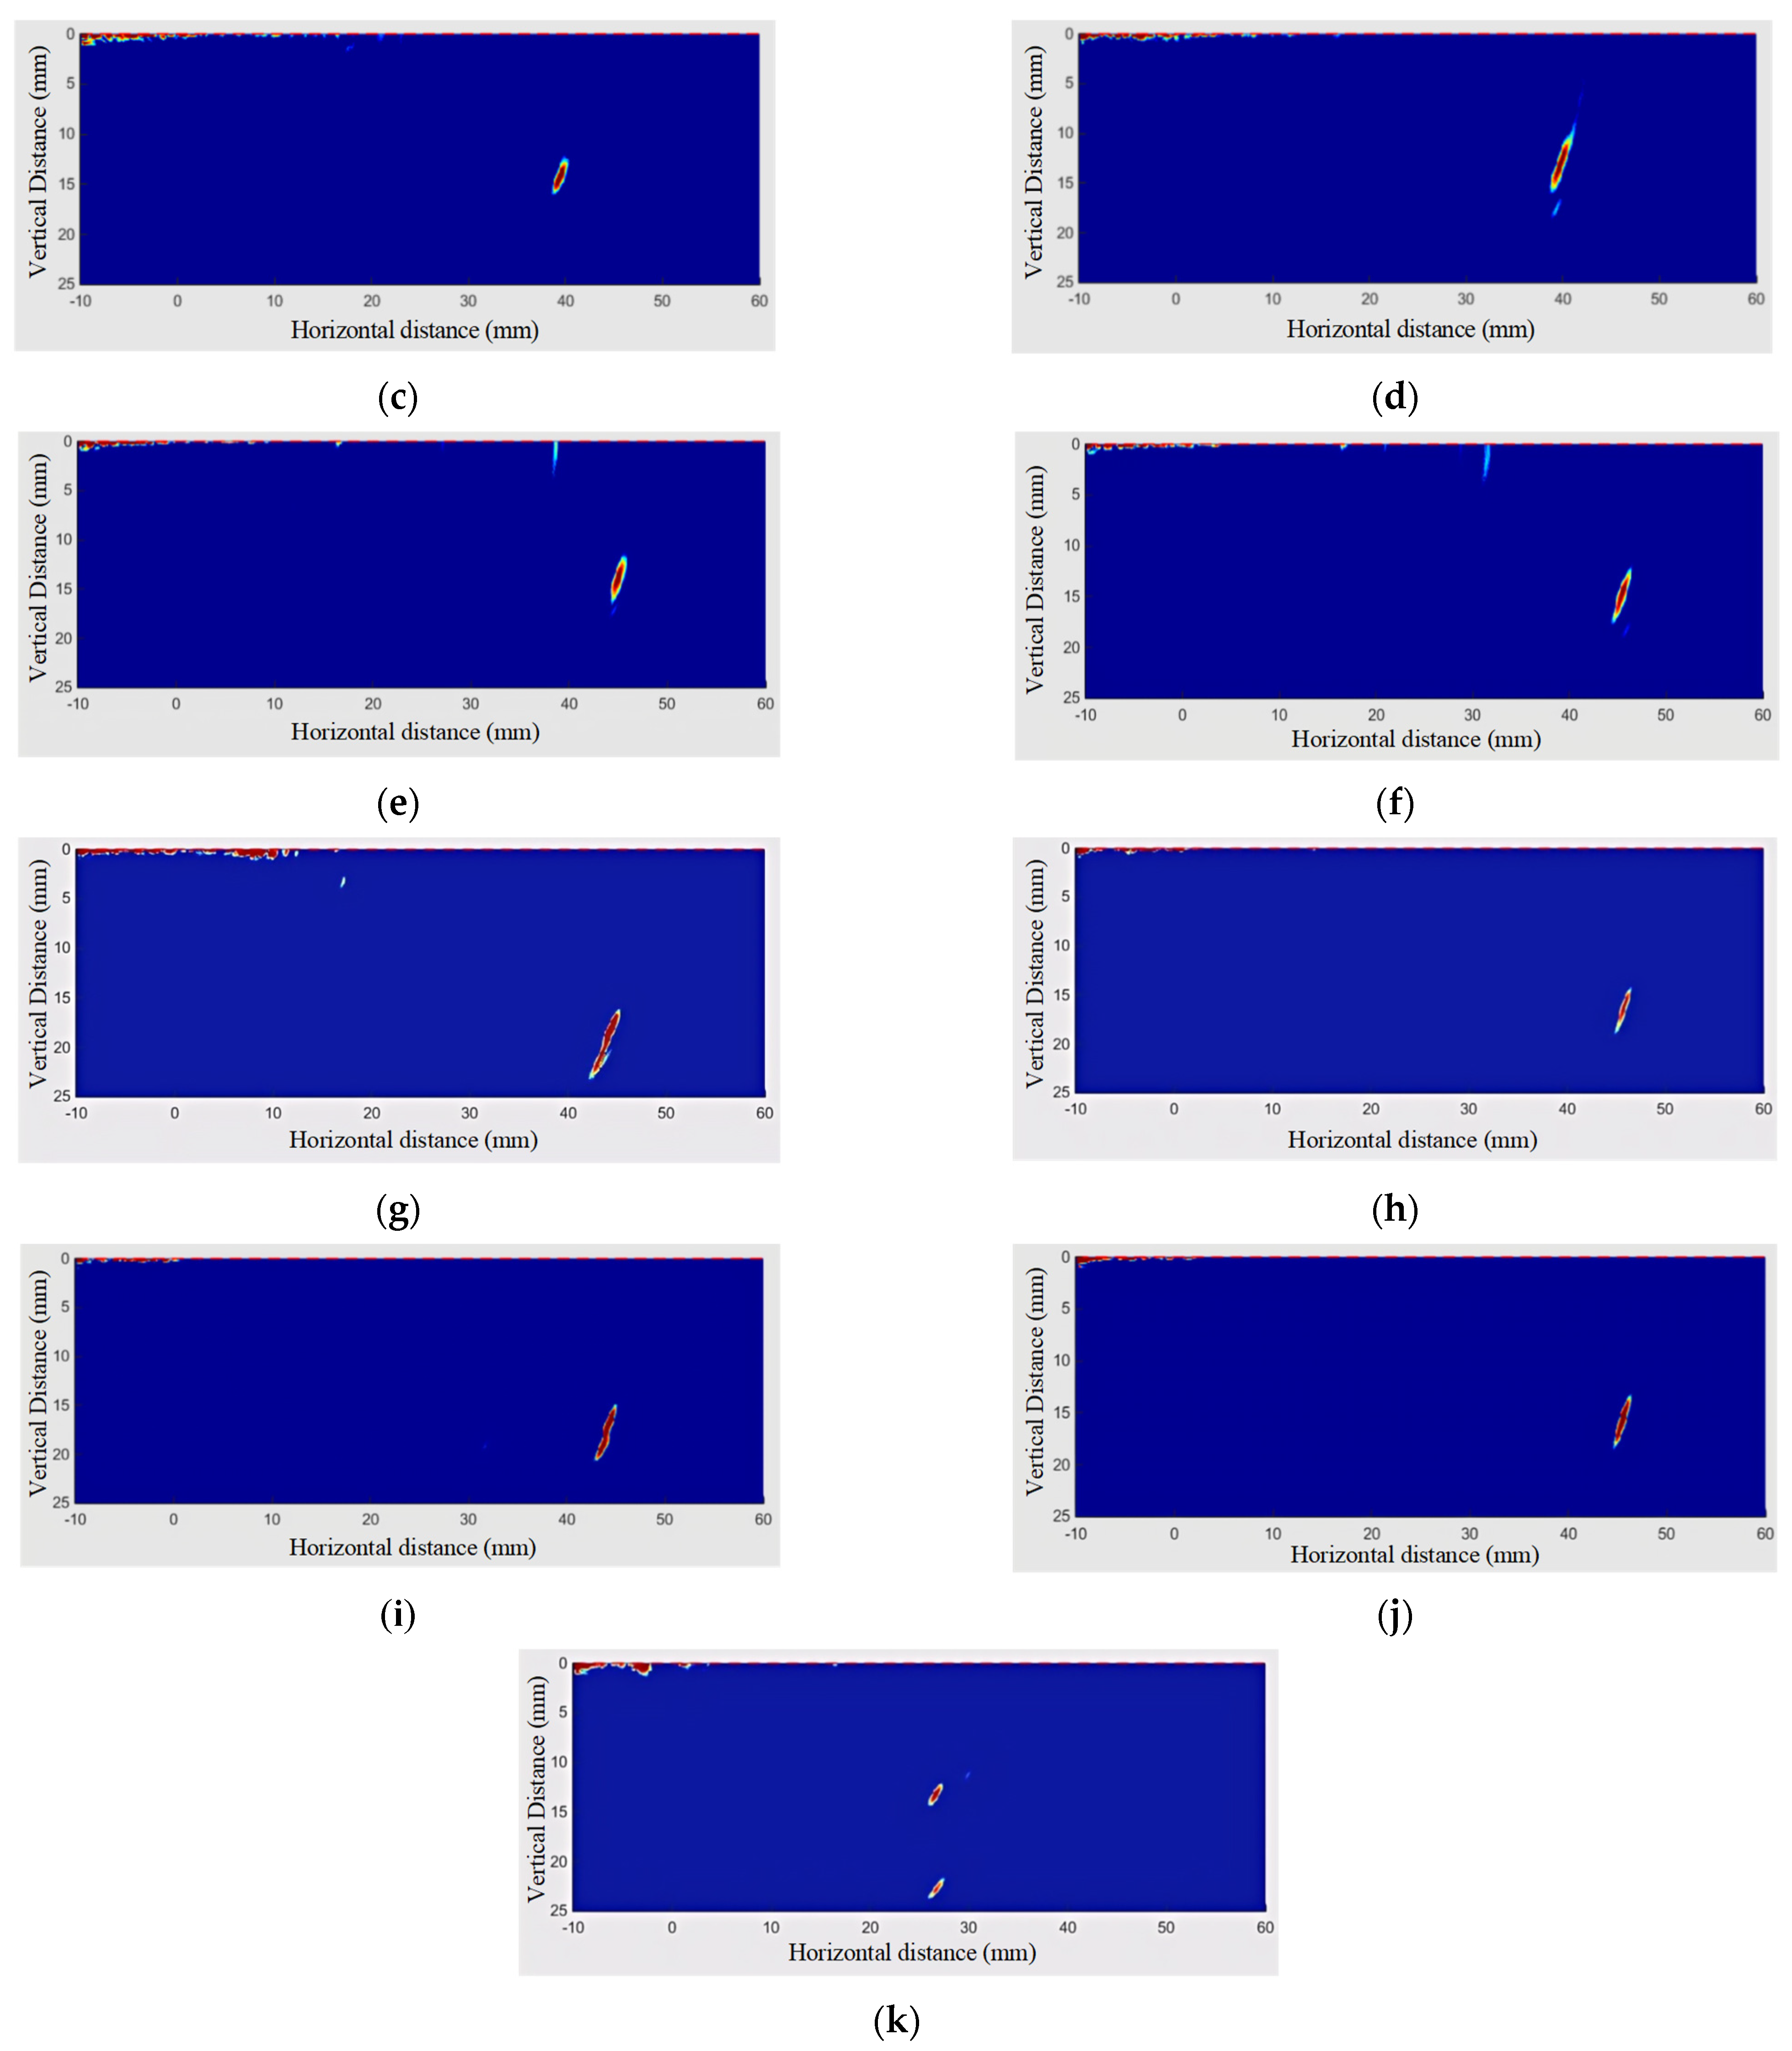
4. Results and Discussion

The TFM images of branch pipe fillet welds are denoised, as shown in Figure 9, respectively. Compared with the artifacts in Figure 3, it is obvious that the regional wavelet denoising algorithm has a good effect on the elimination of artifacts. After the post-processing of the algorithm, the image edge (detection contact surface) still has a small range of residual artifacts. The contact surface artifacts are mainly caused by the interface characteristics of ultrasonic testing, involving acoustic propagation characteristics and acoustic impedance characteristics. In addition, although the wavelet region denoising method can achieve the purpose of image segmentation and region denoising, the edge artifacts of the TFM image are serious, and the coefficients of the edge image generated by wavelet transform are higher than the set threshold, so the characteristics of the image edges are partially preserved. Because the defects that affect the quality of the weld are usually located at the root and inside of the weld, the existence of artifacts on the edge of the contact surface will not affect the characteristic analysis of the weld.
In Figure 9, the blue area represents the non-defect area, the yellow represents the defect transition area, and the red represents the defect area. The defect features obtained from the TFM image processed by the minimum matrix method are shown in Figure 10.
In Figure 10, the gray-white area represents the non-defect area, yellow represents the defect edge area, and red represents the defect core area. Finally, the minimum rectangle method is used to analyze the image defect characteristics combined with the welding process. The feature analysis results are shown in Table 2. In order to highlight the defect characteristics of the TFM image and avoid the interference of artifacts of adjacent contact surfaces, according to the c w and the T w in Table 1, the vertical coordinate of the defect location needs to be reduced by 11.7 mm.
According to Table 2, the effective detection rate is 100%, the size detection sensitivity is 0.1 mm, the length range of various defects is 2.3 mm–6.3 mm, the width range is 0.6 mm–0.8 mm, and the angle range is 52°–75°. Although the minimum rectangle method can simply and effectively implement the rectangular envelope of image features, it cannot accurately represent the range area and inevitably has errors, especially when the defect shape is extremely irregular. This method can lead to a large deviation between the rectangular envelope area and the actual defect area, which can result in a decrease in the accuracy of risk assessment.

5. Conclusions

Aiming to address the problems of low detection rate and serious artifacts of branch fillet weld defects, a regional wavelet denoising method based on FMC-TFM imaging is proposed. At the same time, the minimum rectangle method is used to extract the defect feature of the full-focus image.
The inspection of a fillet weld of a narrow diameter branch pipe (branch pipe diameter ≤ 50 mm) has always been a difficult problem in industrial inspections. In this paper, a real-time imaging detection system was developed based on the principle of FMC-TFM ultrasonic detection, and the fillet welds with a main pipe diameter of 90 mm and branch pipe diameter of 25 mm–45 mm were scanned and detected. At the same time, the images containing artifacts were saved. Then, regional wavelet denoising and adaptive denoising algorithms were used to denoise different regions of the image. Finally, the minimum rectangle method was used to extract the image features, and the location and size of weld defects were analyzed and combined with the welding process and pipe size information. The effective detection rate of various defects was 100%, the sensitivity of size quantization was 0.1 mm, and the sensitivity of angle quantization was 1°. The length range of various defects was 2.3 mm–6.3 mm, the width range was 0.6 mm–0.8 mm, and the angle range was 52°–75 °. The defect location was highly consistent with the welding area. The subregion fusion denoising method eliminated the artifacts in the weld and non-weld center region, while the artifact elimination rate at the edge was relatively low.
The work in this paper effectively reduces the interference of complex surface artifact features, further supports the defect recognition and intelligent classification of fmc-tfm images, and improves the detection rate and classification accuracy. However, there is the problem that the artifact elimination rate at the edge of the image was low, so it is necessary to eliminate the edge artifact further in order to realize the intelligent and accurate identification of branch fillet weld defects. In addition, the feature extraction method based on the minimum rectangle has the disadvantage of having a limited envelope. It is necessary to improve the envelope performance of the feature region further in order to more efficiently assist the risk assessment of the fillet weld of the branch pipe.

Author Contributions

Conceptualization, Y.W.; methodology, Y.L.; software, Y.B. and J.C.; validation, Y.W.; formal analysis, Y.L.; investigation, S.D.; resources, S.D.; data curation, Y.L.; writing—original draft preparation, Y.W.; writing—review and editing, Y.W.; visualization, Y.L.; supervision, S.D.; project administration, H.W.; funding acquisition, S.D. All authors have read and agreed to the published version of the manuscript.

Funding

This research was funded by the National Natural Science Foundation of China, grant number 51805542. The Science Foundation of China University of Petroleum, Beijing (No. 2462020YXZZ046 and 2462020XKJS01).

Institutional Review Board Statement

Not applicable.

Informed Consent Statement

Not applicable.

Data Availability Statement

The raw data supporting the conclusions of this article will be made available by the authors on request.

Conflicts of Interest

Author Yuqin Wang was employed by PipeChina North Pipeline Company. The remaining authors declare that the research was conducted in the absence of any commercial or financial relationships that could be construed as a potential conflict of interest.

References

  1. Hu, H.; Zhu, X.; Wang, C.; Zhang, L.; Li, X.; Lee, S.; Huang, Z.; Chen, R.; Chen, Z.; Wang, C.; et al. Stretchable ultrasonic transducer arrays for three-dimensional imaging on complex surfaces. Sci. Adv. 2018, 4, eaar3979. [Google Scholar] [CrossRef] [PubMed]
  2. Holmes, C.; Drinkwater, B.W.; Wilcox, P.D. Post-processing of the full matrix of ultrasonic transmit–receive array data for non-destructive evaluation. NDT E Int. 2005, 38, 701–711. [Google Scholar] [CrossRef]
  3. Velichko, A.; Wilcox, P.D.; Thompson, D.O.; Chimenti, D.E. Reversible back-propagation imaging algorithm for post processing of ultrasonic array data. AIP Conf. Proc. 2009, 1096, 634–641. [Google Scholar]
  4. Hunter, A.; Drinkwater, B.; Wilcox, P. Autofocusing ultrasonic imagery or non-destructive testing and evaluation of specimens with complicated geometries. NDT E Int. 2010, 43, 78–85. [Google Scholar] [CrossRef]
  5. Zhang, J.; Drinkwater, B.; Wilcox, P. Effects of array transducer inconsistencies on total focusing method imaging performance. NDT E Int. 2011, 44, 361–368. [Google Scholar] [CrossRef]
  6. Prashar, K.; Weston, M.; Drinkwater, B. Comparison and optimisation of fast array-based ultrasound testing. Insight-Non-Destr. Test. Cond. Monit. 2021, 63, 209–218. [Google Scholar] [CrossRef]
  7. Piedade, L.P.; Painchaud-April, G.; Le Duff, A.; Bélanger, P. Compressive Sensing Strategy on Sparse Array to Accelerate Ultrasonic TFM Imaging. IEEE Trans. Ultrason. Ferroelectr. Freq. Control. 2023, 70, 538–550. [Google Scholar] [CrossRef]
  8. Shi, B.Z.; Zhang, J.; Luo, G. F-TFM: Accelerating Total Focusing Method for Ultrasonic Array Imaging on FPGA. In Proceedings of the 2023 International Conference on Field Programmable Technology (ICFPT), Yokohama, Japan, 12–14 December 2023; pp. 280–281. [Google Scholar] [CrossRef]
  9. Stratoudaki, T.; Clark, M.; Wilcox, P.D. Full Matrix Capture and the Total Focusing ImagingAlgorithm Using Laser Induced Ultrasonic PhasedArrays. AIP Conf. Proc. 2017, 1806, 020022. [Google Scholar] [CrossRef]
  10. Kerr, W.; Pierce, S.; Rowe, P. Investigation of synthetic aperture methods in ultrasound surface imaging using elementary surface types. Ultrasonics 2016, 72, 165–176. [Google Scholar] [CrossRef]
  11. Chen, J.; Xiao, J.; Lisevych, D.; Fan, Z. Laser-Induced Full-Matrix Ultrasonic Imaging of Complex-Shaped Objects. IEEE Trans. Ultrason. Ferroelectr. Freq. Control. 2019, 66, 1514–1520. [Google Scholar] [CrossRef]
  12. Piedade, L.P.; Painchaud-April, G.; Le Duff, A.; Bélanger, P. Minimum transmission events for fast ultrasonic TFM imaging: A comparative study. NDT E Int. 2022, 128, 102627. [Google Scholar] [CrossRef]
  13. Zhu, W.; Xiang, Y.; Zhang, H.; Cheng, Y.; Fan, G.; Zhang, H. Research on ultrasonic sparse DC-TFM imaging method of rail defects. Measurement. 2022, 200, 111690. [Google Scholar] [CrossRef]
  14. Xu, Q.; Yang, X.; Ma, X.; Chu, J.; Hu, B.; Wang, H. Segmental Search Method for Ultrasonic Inspection of a Wedge Dual-Layer Medium Using Full Matrix Capture. Russ. J. Nondestruct. Test. 2023, 59, 320–331. [Google Scholar] [CrossRef]
  15. Zhu, W.; Xiang, Y.; Zhang, H.; Zhang, M.; Fan, G.; Zhang, H. Super-resolution ultrasonic Lamb wave imaging based on sign coherence factor and total focusing method. Mech. Syst. Signal Process. 2023, 190, 110121. [Google Scholar] [CrossRef]
  16. Xu, Q.; Wang, H.; Tian, G.; Li, X.; Hu, B.; Huang, D.; Chu, J.; Yang, X. Total Focusing Method Approach of Ultrasonic Phased Array Based on Compressed Sensing. Russ. J. Nondestruct. Test. 2022, 58, 355–368. [Google Scholar] [CrossRef]
  17. Ponseenivasan, S.; Kumar, A.; Rajkumar, K.V. Anisotropy Corrected FMC/TFM Based Phased Array Ultrasonic Imaging in an Austenitic Buttering Layer. Appl. Sci. 2023, 13, 5195. [Google Scholar] [CrossRef]
  18. Park, S. Aperture analysis of coarrays for focused ultrasound imaging. J. Korean Phys. Soc. 2015, 67, 329–332. [Google Scholar] [CrossRef]
  19. Lewandowski, M.; Walczak, M.; Witek, B.; Steifer, T. A GPU-based Ultrasound Phased-Array Research System for Non-destructive Testing. In Proceedings of the IEEE International Ultrasonics Symposium (IUS), Tours, France, 18–21 September 2016; pp. 18–21. [Google Scholar]
  20. Njiki, M.; Elouardi, A.; Bouaziz, S.; Casula, O.; Roy, O. A multi-FPGA architecture-based real-time TFM ultrasound imaging. J. Real-Time Image Process. 2019, 16, 505–521. [Google Scholar] [CrossRef]
  21. Tseng, P.; Chang, Y.; Lin, C.; Nien, W.; Chang, C.; Huang, C. A Study of Total Focusing Method for Ultrasonic Nondestructive Testing. ASTM Int. J. Test. Eval. 2013, 41, 557–563. [Google Scholar] [CrossRef]
  22. Yu, Z.; Chen, J.; Wu, S.; Xie, Y.; Wu, H.; Wang, H.; Peng, H. Adaptive ultrasonic full-matrix imaging of internal defects in CFRP laminates with arbitrary stacking sequences. Compos. B Eng. 2024, 275, 111309. [Google Scholar] [CrossRef]
  23. Le, J.; Robert, S.; Dumas, P.; Membre, A.; Prada, C. Adaptive Ultrasonic Imaging with the Total Focusing Method for Inspection of Complex Components Immersed in Water. AIP Conf. Proc. 2015, 1650, 1037–1046. [Google Scholar] [CrossRef]
  24. Rodrigues, J.; Bélanger, P. Probe Standoff Optimization Method for Phased Array Ultrasonic TFM Imaging of Curved Parts. Sensors 2021, 21, 6665. [Google Scholar] [CrossRef] [PubMed]
  25. Fan, C.; Caleap, M.; Pan, M.; Drinkwater, B. A comparison between ultrasonic array beamforming and super resolution imaging algorithms for non-destructive evaluation. Ultrasonics 2014, 54, 1842–1850. [Google Scholar] [CrossRef] [PubMed]
  26. Cantero, C.; Wilcox, P.; Croxford, A. A deep learning based methodology for artefact identification and suppression with application to ultrasonic images. NDT E Int. 2022, 126, 102575. [Google Scholar] [CrossRef]
  27. Teng, D.; Liu, L.; Xiang, Y.; Xuan, F. An optimized total focusing method based on delay-multiply-and-sum for nondestructive testing. Ultrasonics 2023, 128, 106881. [Google Scholar] [CrossRef] [PubMed]
  28. Bruder, D.; McGovern, M.; James, R.; Rinker, T.; Gattani, V. Assessment of Laser-Generated Ultrasonic Total Focusing Method for Battery Cell Foil Weld Inspection. Res. Nondestruct. Eval. 2023, 34, 83–100. [Google Scholar] [CrossRef]
  29. Wang, H.; Fan, Z.; Chen, X.; Cheng, J.; Chen, W.; Wang, Z.; Bu, Y. Automated Classification of Pipeline Defects from Ultrasonic Phased Array Total Focusing Method Imaging. Energies 2022, 15, 8272. [Google Scholar] [CrossRef]
  30. Zhao, J.; Yang, K.; Du, X.; Yao, S.; Zhao, Y. Automated quantification of small defects in ultrasonic phased array imaging using AWGA-gcForest algorithm. Nondestruct. Test. Eval. 2023, 39, 1495–1516. [Google Scholar] [CrossRef]
  31. Osman, A.; Hassler, U.; Kaftandjian, V.; Hornegger, J. Automated segmentation of ultrasonic volumetric data of composite materials. Insight-Non-Destructive Test. Cond. Monit. 2015, 57, 153–160. [Google Scholar] [CrossRef]
  32. Zhang, J.; Jiao, J.; Gao, X.; Wu, B.; He, C.; Chen, C. High-resolution ultrasonic imaging of the defects in coarse-grained steel by a weighted total focusing method. Insight-Non-Destructive Test. Cond. Monit. 2023, 65, 19–27. [Google Scholar] [CrossRef]
  33. He, H.; Sun, K.; Sun, C.; He, J.; Liang, E.; Liu, Q. Suppressing artifacts in the total focusing method using the directivity of laser ultrasound. Photoacoustics 2023, 31, 100490. [Google Scholar] [CrossRef] [PubMed]
  34. Molinier, N.; Painchaud-April, G.; Le Duff, A.; Toews, M.; Bélanger, P. Ultrasonic imaging using conditional generative adversarial networks. Ultrasonics 2023, 133, 107015. [Google Scholar] [CrossRef] [PubMed]
  35. Wang, S.; Zhang, Y.; Zhou, S.; Liu, W.; Du, F.; Wang, J.; Hui, F.; Yang, M. Visualizing defects of Irregular Weld Seams Based on MultiMode TFM Detection. Mater. Eval. 2024, 82, 46–54. [Google Scholar] [CrossRef]
  36. Liu, Z.; Chen, L.; Zhu, Y.; Liu, X.; Lu, Z.; He, C. Laser ultrasonic frequency-domain imaging and phase weighted optimization based on full matrix capture. Ultrasonics 2024, 141, 107321. [Google Scholar] [CrossRef] [PubMed]
  37. Qin, Y.; Xiong, X.; Chen, Y.; Wang, Y. Optimization Research on Defect Localization in Ultrasonic Images of Anisotropic and Multilayer CFRP Structures. IEEE Trans. Instrum. Meas. 2024, 73, 1–14. [Google Scholar] [CrossRef]
  38. Chen, M.; Xu, X.; Yang, K.; Wu, H. Full-Matrix Imaging in Fourier Domain towards Ultrasonic Inspection with Wide-Angle Oblique Incidence for Welded Structures. Sensors 2024, 24, 832. [Google Scholar] [CrossRef]
Figure 1. Working principle of FMC.
Applsci 14 09737 g001
Figure 2. TFM imaging model of branch pipe weld.
Applsci 14 09737 g002
Figure 3. Image denoising processing flow.
Applsci 14 09737 g003
Figure 4. Image feature extraction and analysis.
Applsci 14 09737 g004
Figure 5. Composition of detection system.
Applsci 14 09737 g005
Figure 6. Detection system.
Applsci 14 09737 g006
Figure 7. Detection model. (a) TT. (b) TTT. (c) TTTT.
Applsci 14 09737 g007
Figure 8. Branch pipe sample and inspection status.
Applsci 14 09737 g008
Figure 9. Weld defects. (a) Left side weld inspection (T-90-25-B). (b) Right side weld inspection (T-90-25-B). (c) Left side weld inspection (T-90-35-B). (d) Right side weld inspection (T-90-35-B). (e) Left side weld inspection (T-90-40-B). (f) Right side weld inspection (T-90-40-B). (g) Left side weld inspection (T-90-45-DC). (h) Right side weld inspection (T-90-45-DC). (i) Left side weld inspection (T-90-45-B). (j) Right side weld inspection (T-90-45-B). (k) Weld defects (Y-90-25-NB).
Applsci 14 09737 g009aApplsci 14 09737 g009b
Figure 10. Feature analysis. (a) Left side weld inspection (T-90-25-B). (b) Right side weld inspection (T-90-25-B). (c) Left side weld inspection (T-90-35-B). (d) Right side weld inspection (T-90-35-B). (e) Left side weld inspection (T-90-40-B). (f) Right side weld inspection (T-90-40-B). (g) Left side weld inspection (T-90-45-DC). (h) Right side weld inspection (T-90-45-DC). (i) Left side weld inspection (T-90-45-B). (j) Right side weld inspection (T-90-45-B). (k) Feature analysis (Y-90-25-NB).
Applsci 14 09737 g010
Table 1. The configuration of key parameters.
TypeNameConfiguration
Software
(GMRI-PA-V2.0)
ModeTT
Acquisition frequency (MHz)25
Number of sampling points1300
Pulse voltage (V)200
Pulse width (ns)100
Resolution (mm)0.1
Filter frequency (MHz)5
c w   (m/s)2337
Shear wave velocity (m/s)3100
Longitudinal wave velocity (m/s)5850
Mean value of T w   (us)5
HardwarePulse typeNegative square wave
Pulse Repetition Frequency1 Hz–20 KHz
Phased array pulse delay0–25,000 ns
Pulse rise time<5 ns
Bandwidth0.75 MHz–20 MHz (−3 dB)
Phased array receiving delay0–25,000 ns
Dynamic Deep Focusing100 MHz
ADC resolution12 bits
Amplitude resolution16 bits
DAC dynamic range0–60 dB
Table 2. Defect characteristics of welds.
Pipe TypeDefect TypeLength (mm)Width (mm)Center PositionAngle (°)Effectiveness
T-90-25-Bincomplete fusion3.900.70(43.90,15.10)72.0100%
slag inclusion3.200.70(42.60,14.20)69.0100%
T-90-35-Broot crack2.700.60(39.30,14.10)69.0100%
incomplete fusion4.800.70(39.80,13.10)71.0100%
T-90-40-Black of penetration3.800.80(45.00,13.90)73.0100%
undercut4.500.70(45.40,14.90)73.0100%
T-90-45-DClack of penetration6.300.70(43.90,19.40)72.0100%
incomplete fusion4.900.70(45.50,17.00)74.0100%
T-90-45-Bincomplete fusion5.600.70(44.40,16.80)75.0100%
incomplete fusion4.700.60(45.20,16.50)71.0100%
Y-90-25-NBslag inclusion2.300.60(26.80,22.60)52.0100%
Disclaimer/Publisher’s Note: The statements, opinions and data contained in all publications are solely those of the individual author(s) and contributor(s) and not of MDPI and/or the editor(s). MDPI and/or the editor(s) disclaim responsibility for any injury to people or property resulting from any ideas, methods, instructions or products referred to in the content.

