Article

CFD Analysis of the Thermal-Hydraulic Performance of Traditional and Alternative Oils for Transformer Cooling

1
FIM—Department of Physics, Informatics and Mathematics, University of Modena and Reggio Emilia, 41125 Modena, Italy
2
DISMI—Department of Sciences and Methods for Engineering, University of Modena and Reggio Emilia, 42122 Reggio Emilia, Italy
3
DIEF—Department of Engineering “Enzo Ferrari”, University of Modena and Reggio Emilia, 41125 Modena, Italy
*
Author to whom correspondence should be addressed.
Appl. Sci. 2024, 14(21), 9736; https://doi.org/10.3390/app14219736
Submission received: 21 September 2024 / Revised: 18 October 2024 / Accepted: 23 October 2024 / Published: 24 October 2024
(This article belongs to the Special Issue The Industrial Applications of Computational Fluid Dynamics)

Abstract

:
The search for alternative, more environmentally friendly coolants to replace mineral oils in power transformers represents a relevant challenge for the power industry. In this frame, a CFD analysis is carried out by means of an open-source, conjugate heat transfer Finite Volume solver to assess the heat transfer performance of different coolants in a disc-type winding of an oil-immersed power transformer, whose geometry is taken from a reference case in the literature. Four different oils are considered: two mineral oils widely established among power transformer manufacturers, a synthetic ester and a natural ester. The latter two represent environmentally friendly alternatives to mineral oils, of great interest for the specific sector. The influence of temperature-dependent thermophysical properties on the overall flow and on the location and value of the hot spots in the copper conductors is discussed, highlighting the strength and weaknesses of the four oils as transformer coolants. In particular, the natural ester exhibits the best heat transfer performance, whereas high hot-spot temperatures and strong fluctuations are found for both mineral oils and the synthetic ester.

1. Introduction

The pursuit of new, effective and more environmentally friendly dielectric liquids is a continuing task for the power industry. Transformers in electric power delivery systems are cooled with oils, which guarantee excellent electrical insulation and heat removal properties [1]. Petroleum-based mineral oils have been used for over a century because of their initial large availability, reasonable cost and good performance [2]. The quantity of oil required for the cooling system ranges from tens to tens of thousands of liters per transformer, and it is estimated that several billions of liters of mineral oils are in service in transformers only in the U.S. [3]. Although this is just a very little fraction of the total petroleum consumption, the rapid depletion of global reserves urges the search for mineral oil replacement. In addition, the toxicity and disposal problems of mineral oils at the end of transformer life further highlight their poor sustainability.
In light of the worldwide concerns about those issues, alternative sources of transformer oil are required. In recent years, a new family of insulating liquids, namely ester oils, appeared as an interesting alternative to mineral oils traditionally used as coolants in distribution and power transformers. These oils can be obtained either by refinement of natural seeds (natural esters) or by means of a chemical reaction called esterification (synthetic esters) [4,5]. Producers of both typologies boast very attractive environmental properties of their oils as compared with mineral oil, among which the most notable is a rapid and complete biodegradation.
At the same time, the field of oil-immersed power transformers poses great challenges in the design of effective cooling systems, for which the accurate evaluation of the thermal and hydraulic performance of the cooling medium is a crucial aspect. In particular, the prediction of the value and location of the so-called hot spot (i.e., the maximum temperature occurring in winding paper insulation) is of primary importance since it dictates reliability and life expectancy of transformers [6], and this, in turn, crucially depends on the coolant properties.
However, the availability of reliable and detailed data concerning the thermo-fluid dynamic behavior and heat removal performance of these oils in working conditions is still scarce. Nadolny and Dombek [7] provided experimental data on thermal properties of mixtures of mineral oil and natural esters, while Achille et al. [8] focused on palm kernel and castor oil methyl esters and compared the trends of their properties with those of a mineral oil. Salama et al. [9] considered three commercial types of environmentally friendly oils, providing an experimental characterization of their thermophysical properties as a function of temperature, and evaluated the impact of these oils on the hot-spot temperature of transformer windings using a simplified computational model. They found out that ester oils were competitive with respect to mineral oils in reducing the ageing of the transformers, while mineral oils still showed better performance in terms of heat transfer. On the contrary, Raeisian et al. [10] compared vegetable oil from cooking waste with mineral oil by means of numerical simulations of the flow and heat transfer in a finned transformer and found that vegetable oil exhibited a slightly better overall heat removal capacity in terms of both maximum and mean temperatures. A similar study was carried out by Garelli et al. [11], who developed a detailed model of a distribution transformer and took into account the non-uniform distribution of power losses in the magnetic core and the windings. Results indicated that slightly higher average temperatures are obtained for the windings (of 2–3 °C) and the fluid (1.5 °C) when a natural ester is used instead of mineral oil. The reason was attributed to the higher kinematic viscosity of the ester, which determined a lower velocity magnitude of the fluid inside the channels. Daghrah et al. [12] performed experiments with mineral oils and synthetic esters on disc-type windings for both natural and directed cooling modes to liquid-based transformers and found out that the synthetic ester gave more uniform flow distributions when in directed mode, while it developed lower flow rates (and, therefore, higher temperatures) in natural flow. Combined experimental and numerical analyses by Couto et al. [13] and computations by Santisteban et al. [14] inside disc-type windings showed that the operating conditions, such as loading and inlet flow rate, and the winding geometry affect the relative thermal performance of mineral oils and natural esters. The scarcity and sparseness of these results suggest that the behavior of these cooling media is far from being completely understood, since it depends also on the specific configuration and not only on the fluid itself.
In this work, a CFD analysis is brought forward to assess the heat transfer performance of different coolants in a disc-type winding configuration, representative of a typical power transformer winding geometry. The reference case is taken from a previous study in the literature [15,16], for which experimental and numerical data are available. Simulations are carried out on an axisymmetric domain using a previously validated open-source, conjugate heat transfer Finite Volume solver [17]. Heat generation in the copper and the presence of insulating paper around the windings are taken into account. Four different oils are considered, with different composition and origin: (i) the mineral oil used in reference works [15,16]; (ii) another mineral oil (Nytro Taurus), widely established among power transformer manufacturers [7]; (iii) a synthetic ester oil (Midel 7131); and (iv) a natural ester oil (Midel 1215) [9]. The influence of temperature-dependent thermophysical properties on the overall flow, on the average and maximum temperature of the copper and on the location of the hot spots is discussed, highlighting the strength and weaknesses of each of the four oils as transformer coolants.

2. Materials and Methods

2.1. Case Study

A schematic of the cross section of the disc-type winding investigated [16] is illustrated in Figure 1. The winding is composed of 4 passes, each containing 19 discs and 20 horizontal ducts. Vertical channels of different radial width are interposed between the discs and the surrounding cylinders (not represented in the figure). Cardboard washers 1 mm high are inserted in order to separate two consecutive passes at alternating inner and outer locations, thus blocking the oil passage in the inner and outer vertical duct, respectively, and inducing a zigzag flow. Washers are arranged so that the oil enters Pass 1 and leaves Pass 4 through the outer vertical channel. An entry region with 2 extra discs and 2 horizontal ducts is present below the first pass. Inlets to the entry region are located at both the inner and outer vertical channels. The internal structure of the discs is also considered; each disc is made of 18 copper conductors that are individually wrapped with paper insulation. Quantitative information on the relevant dimensions of the fluid and solid domains is reported in Section 2.4. The reader is referred to [16] for further details on the considered winding geometry.

2.2. Governing Equations and Discretization Schemes

The conservation equation of mass, momentum and energy can be written as follows:
ρ t + ρ u = 0
ρ u t + ρ u u   = p + μ u   + u T 2 3 u I + ρ g
ρ c p T t + ρ c p u T = k   T
To account for the temperature distribution inside the discs of windings, the heat conduction equation in a solid is solved:
ρ c p T t = k   T + S E
The source term SE, which represents the energy losses in the windings, is imposed in the copper conductors of the discs.
The above equations were numerically solved under the hypothesis of laminar flow via the open-source OpenFOAM computational toolbox [18], which is based on the Finite Volume method. A transient conjugate heat transfer solver (chtMultiRegionFoam, from OpenFOAM v7) was adopted, implementing the PIMPLE algorithm, i.e., a combination of the PISO (Pressure-Implicit with Splitting of Operators) algorithm, which handles time advancement, and the SIMPLE (Semi-Implicit Method for Pressure-Linked Equations) algorithm, which is used to iteratively solve the coupled pressure and velocity fields within a single time step. Second-order schemes were used for both spatial and temporal discretization.

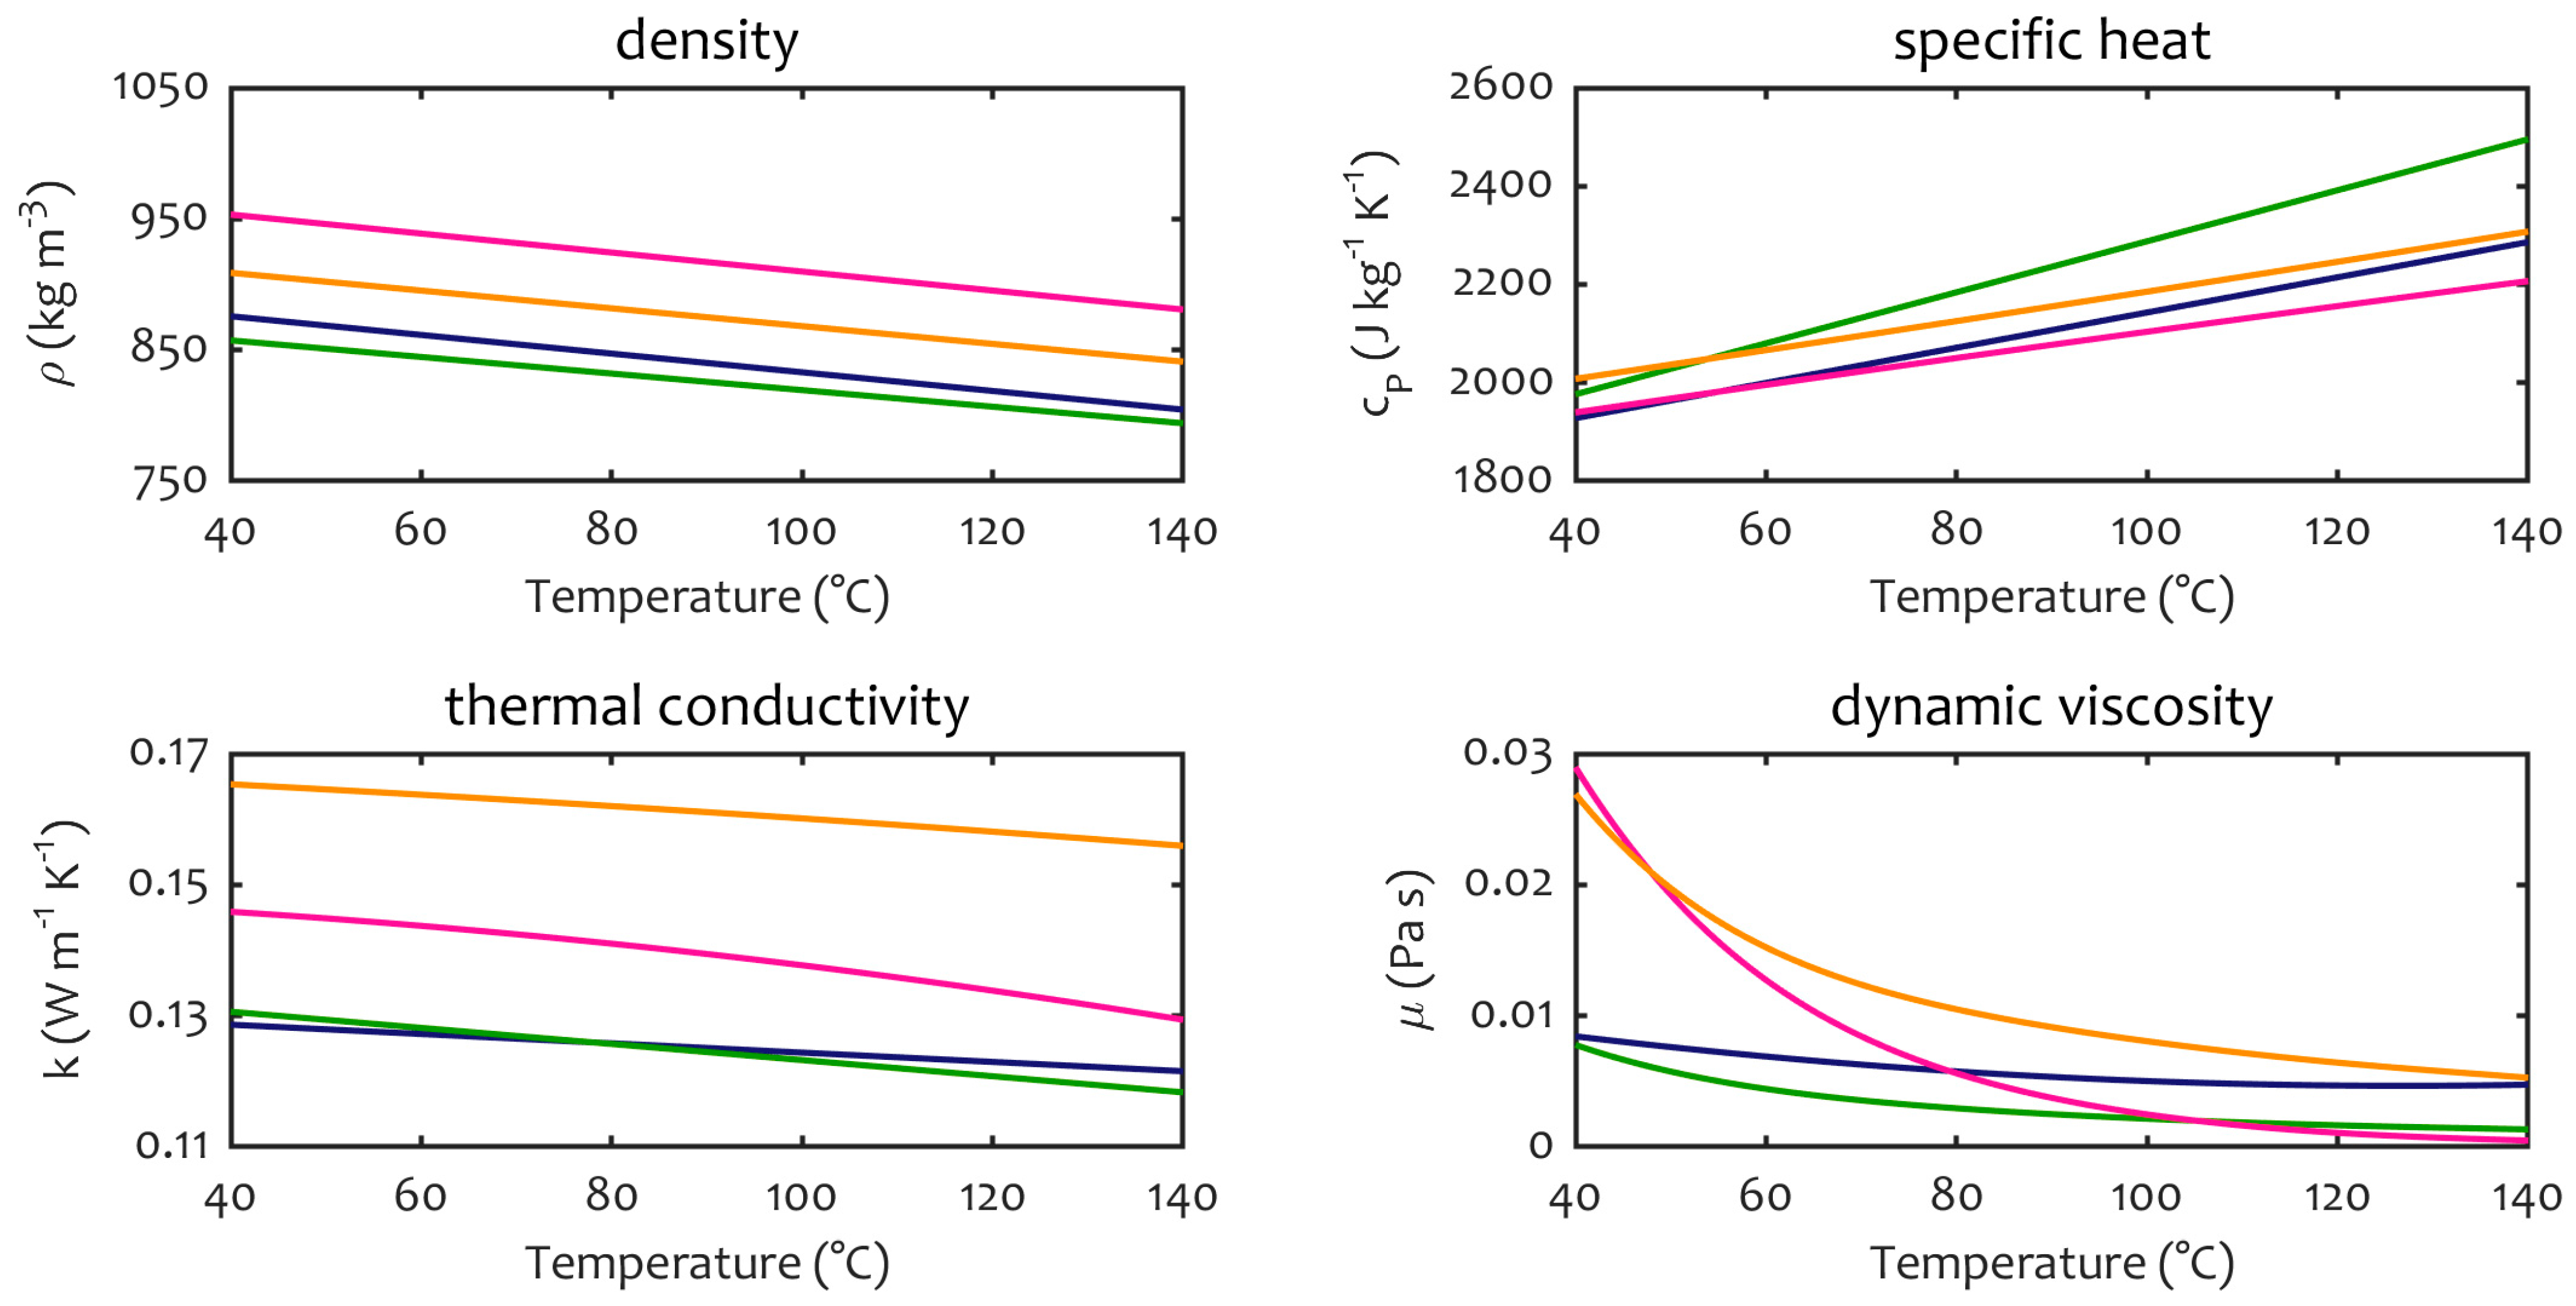
2.3. Thermophysical Model

The thermophysical properties of all the four oils were considered as temperature dependent. For ease of implementation, the original correlations [7,9,10] for the reference thermophysical properties were rearranged using polynomials (see Table 1):
f T = i = 0 n a n T n
and the resulting functions are also visualized in Figure 2. It is worth pointing out that the Boussinesq approximation cannot be considered valid in the present problem. In fact, temperature differences are estimated to be at least two times higher than those prescribed by the criteria in [19] for the introduction of acceptable errors in the equations.

2.4. Meshing and BCs

In order to reduce computational requirements, the problem is supposed to be axisymmetric. Therefore, only a thin slice of the winding with an angular extension of 4° was reproduced in the computational model (Figure 3a). As shown in Figure 3b, a block structured grid with non-uniform cell grading was used for meshing the domain, with non-conformal interfaces between fluid and solid regions, and with just one cell in the azimuthal direction, for a total cell count of more than 4.7 million cells. With respect to a previous work [17], a net saving of 15% of the cell count was achieved thanks to the adoption of non-conformal interfaces, without noticeably affecting the solution. The smallest cells (base cells) of the fluid zone, with a size Δc = 0.04 mm, are located at the sharp edges between the horizontal and vertical ducts, as shown in Figure 3b. Special attention was paid in controlling the mesh grading in horizontal ducts due to the possible onset of Rayleigh–Bénard-like flow structures.
A fixed inlet oil temperature of 46.7 °C was imposed for all the cases investigated in this work, as in [16]. At the two inlets of the entry region, a total mass flow rate of 0.78 kg/s was enforced by specifying the inlet bulk velocity. The mass flow rate, which is referred to a 360° cylindrical domain, was kept fixed for all the cases considered; therefore, slightly different inlet velocities were set from case to case to account for the appropriate density value at the inlet. An average pressure condition, pavg = 0, was imposed at the winding outlet. The no-slip condition was specified at all the fluid–solid boundaries, with all other solid walls set as adiabatic. The present model does not include the volume of oil below the first disc; hence, a constant heat transfer coefficient of 100 W m−2 K−1 was imposed on the bottom surface of the paper of the first disc to account for heat transfer toward the bottom oil, as in [16]. A uniform heat source was specified in the copper conductor region to reproduce the value of 676.9 W/disc, reported in [16], which is valid for a 360° domain, and corresponds to a heat flux of q” = 2560 W m−2 on the external surface of each disc. In the azimuthal direction, axial symmetry was imposed.
Further details on the numerical model, including a grid convergence study and validation, can be found in [17].

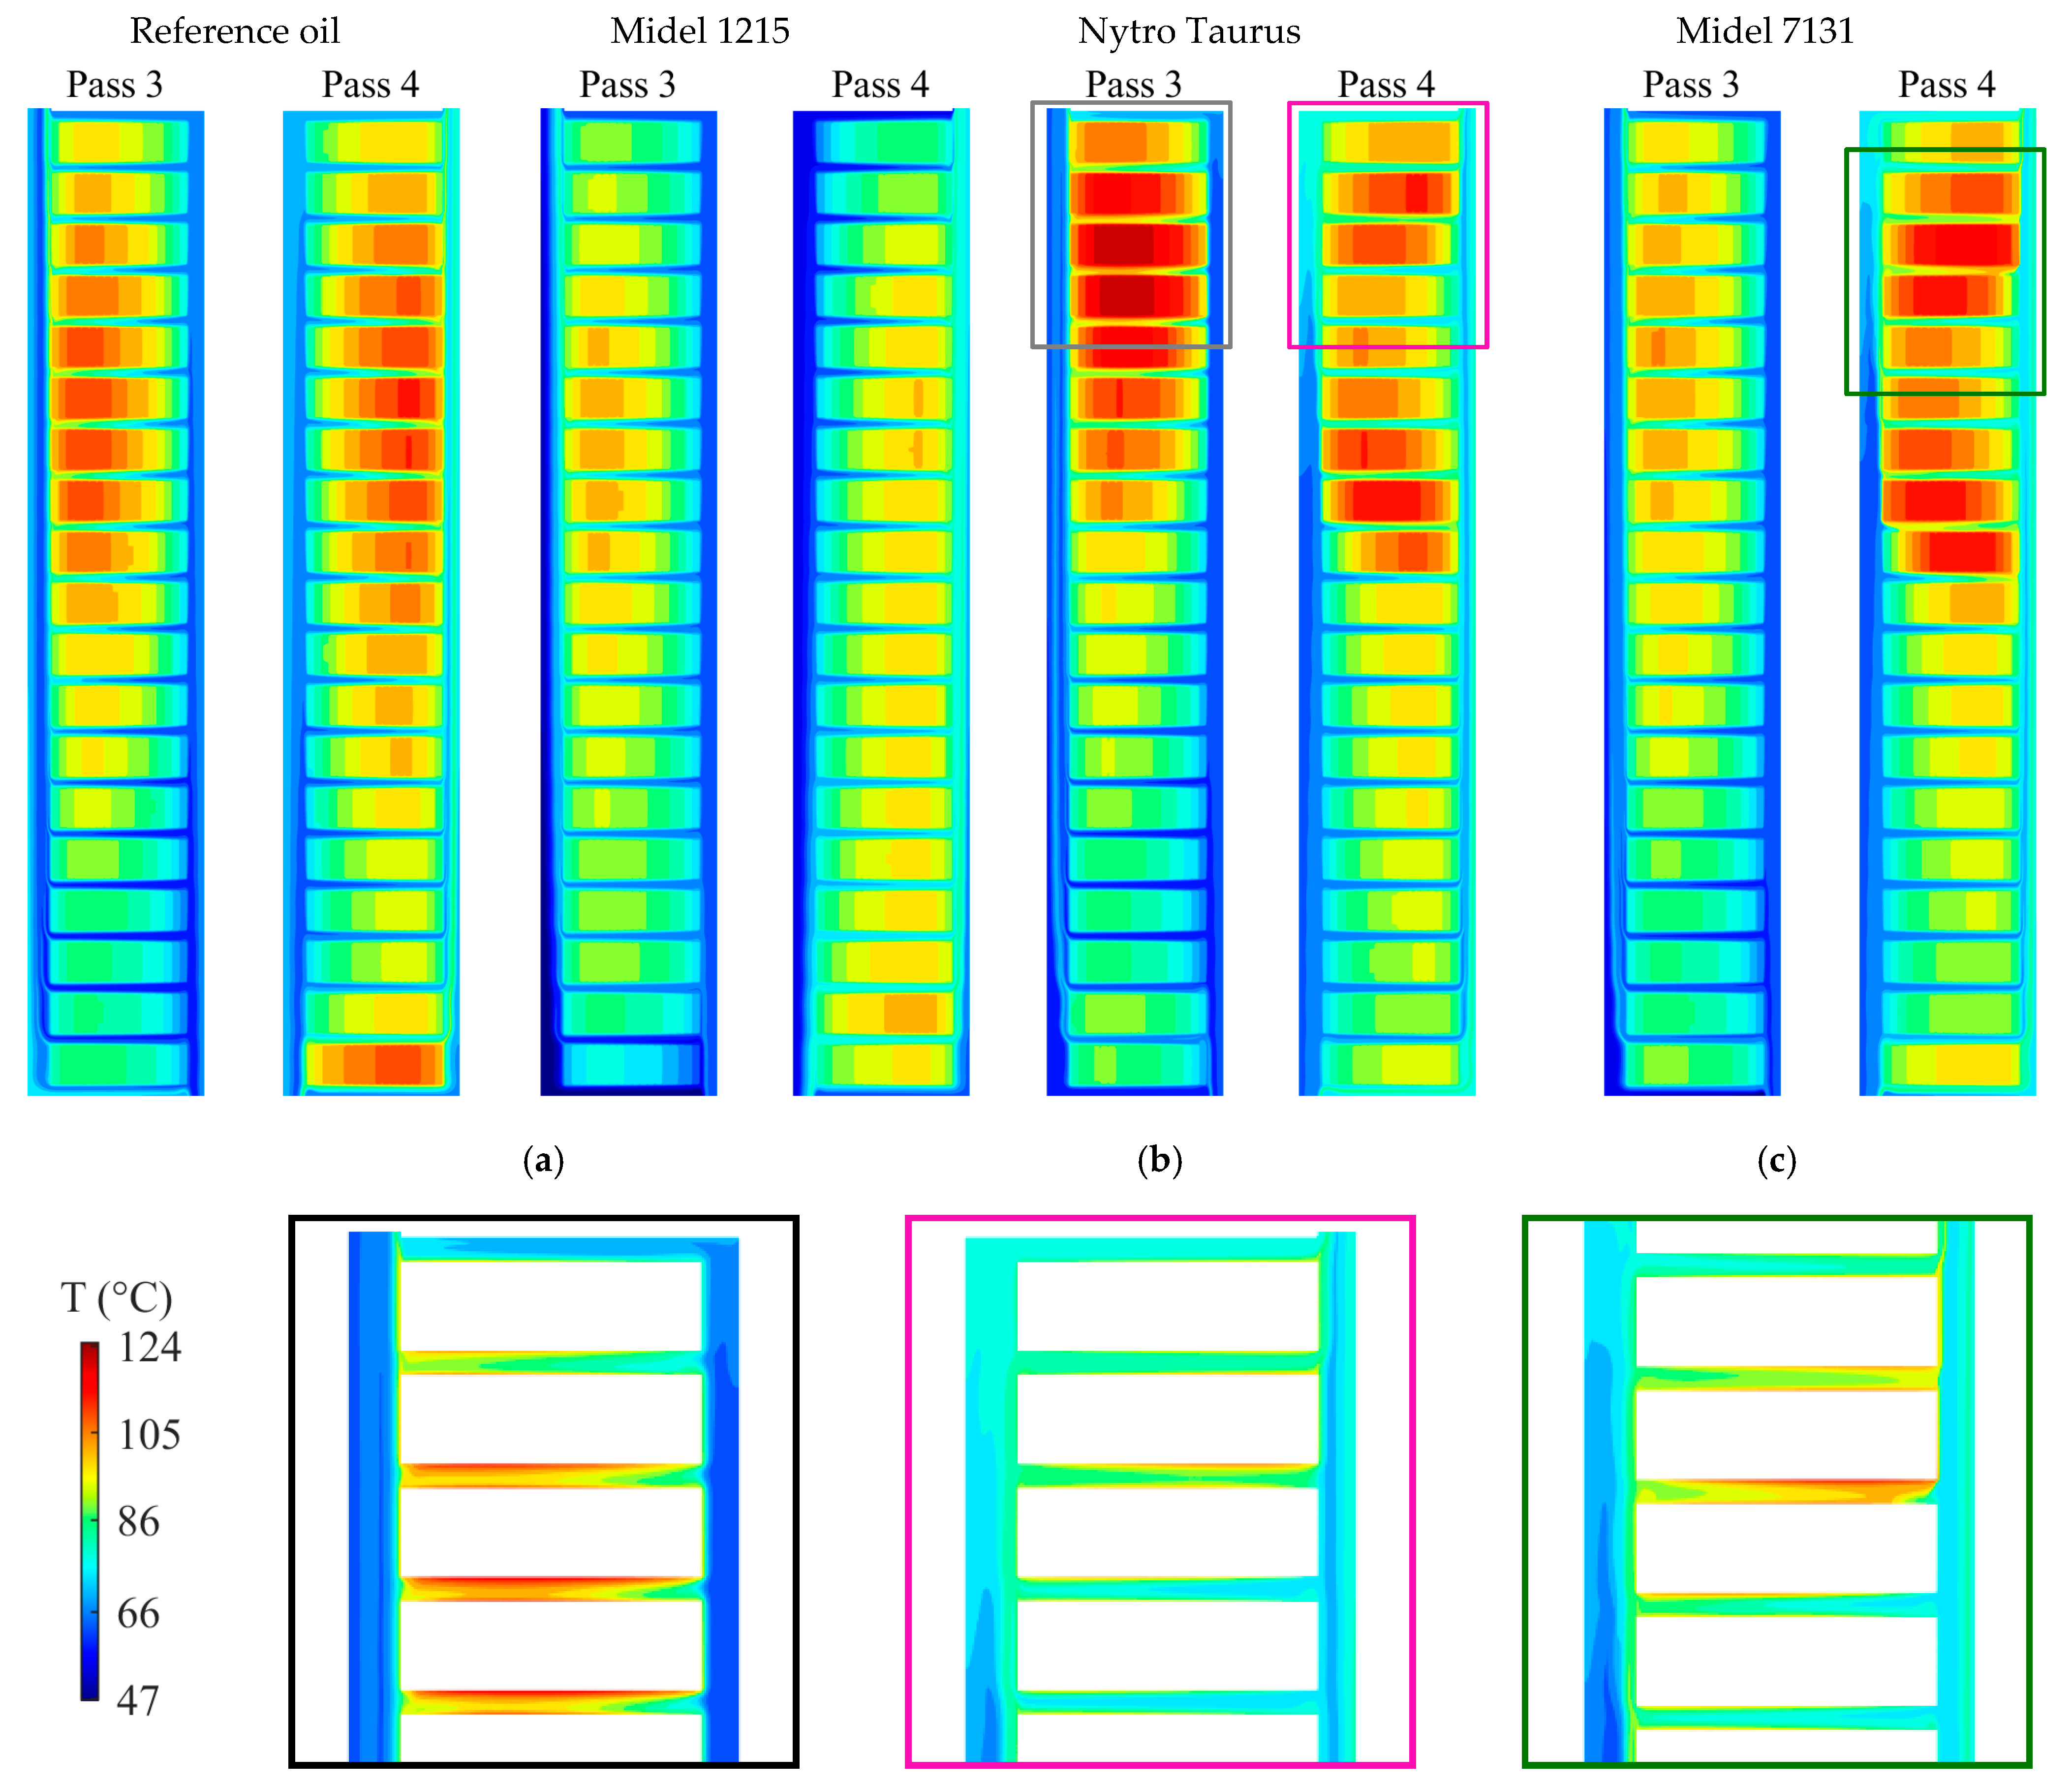
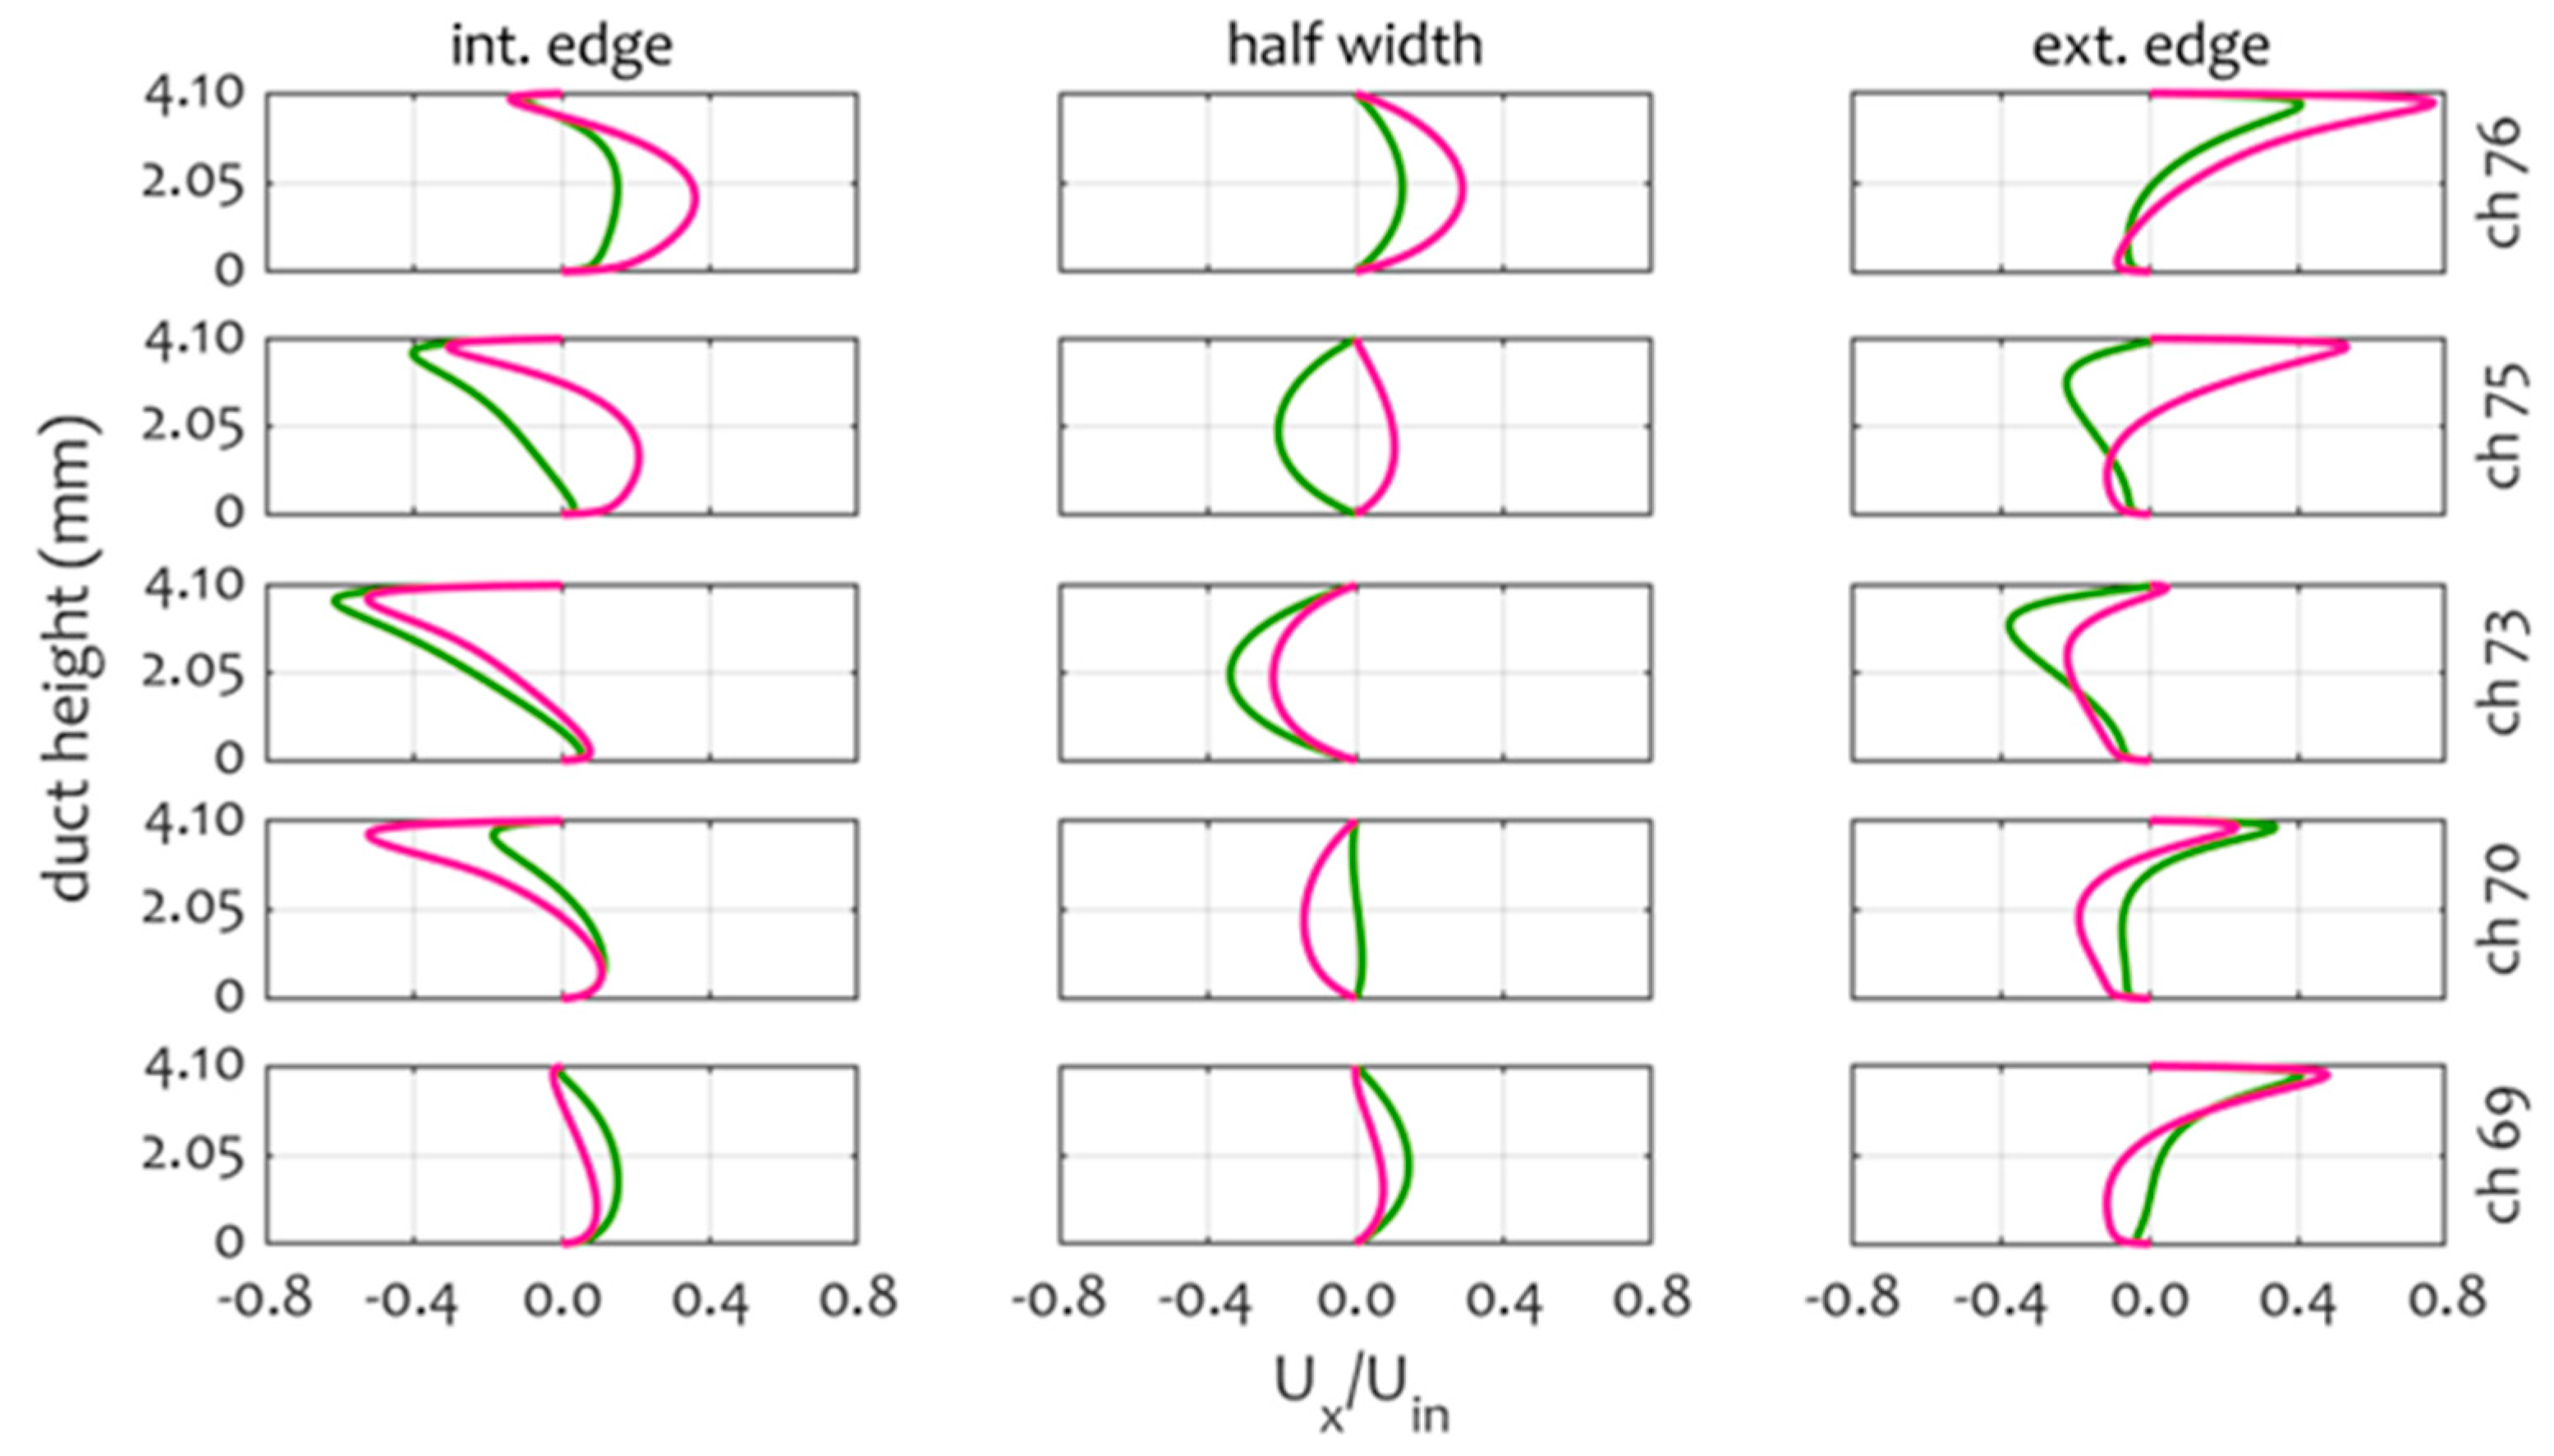
3. Results and Discussion

3.1. Asymptotic Behavior of the Numerical Solution

Numerical simulations for the four oils were initialized from preliminary steady-state runs; after reaching a quasi-stationary solution, the transient solver was activated. It is worth to point out that each oil exhibits a different dynamical behavior, ranging from an asymptotically steady-state solution (Midel 1215) mirroring the initial condition to weakly oscillatory regimes (reference oil and Midel 7131) and regimes where local instabilities are present over most of the domain (Nytro Taurus). As an example, Figure 4 reports colormaps of the temperature field in the oil region around the top discs of Pass 1. It can be observed that, for all the oils except Midel 1215, the temperature distributions reveal that the thermal boundary layers in the horizontal channels are locally disrupted by plume-like formations, typical of Rayleigh–Bénard convection, whose characteristic length scale is of the order of the channel height. Such structures appear to have a regular distribution in the cases of the reference oil and Midel 7131, indicating that the oscillatory behavior has the form of a traveling wave. On the contrary, the unsteady behavior of the Nytro Taurus is fully chaotic, as hinted at by the large high-temperature spots appearing in the channels.
These behaviors can be broadly correlated with the variation of fluid properties with temperature. In particular, by observing the trend of the Prandtl number as a function of temperature (Figure 5), it can be observed that, for Midel 1215, Pr always exceeds a value of 100 for temperatures below the maximum oil temperature (highlighted by circular markers in the graph). Such a value can stand as a possible threshold for the triggering of instabilities. In fact, all other oils show a transitional behavior already in the first pass of the winding, where locally the Prandtl number is already below such a threshold. This is most evident for the Nytro Taurus oil, where the solution is highly oscillatory, and the Prandtl number is already around 100 at the inlet.

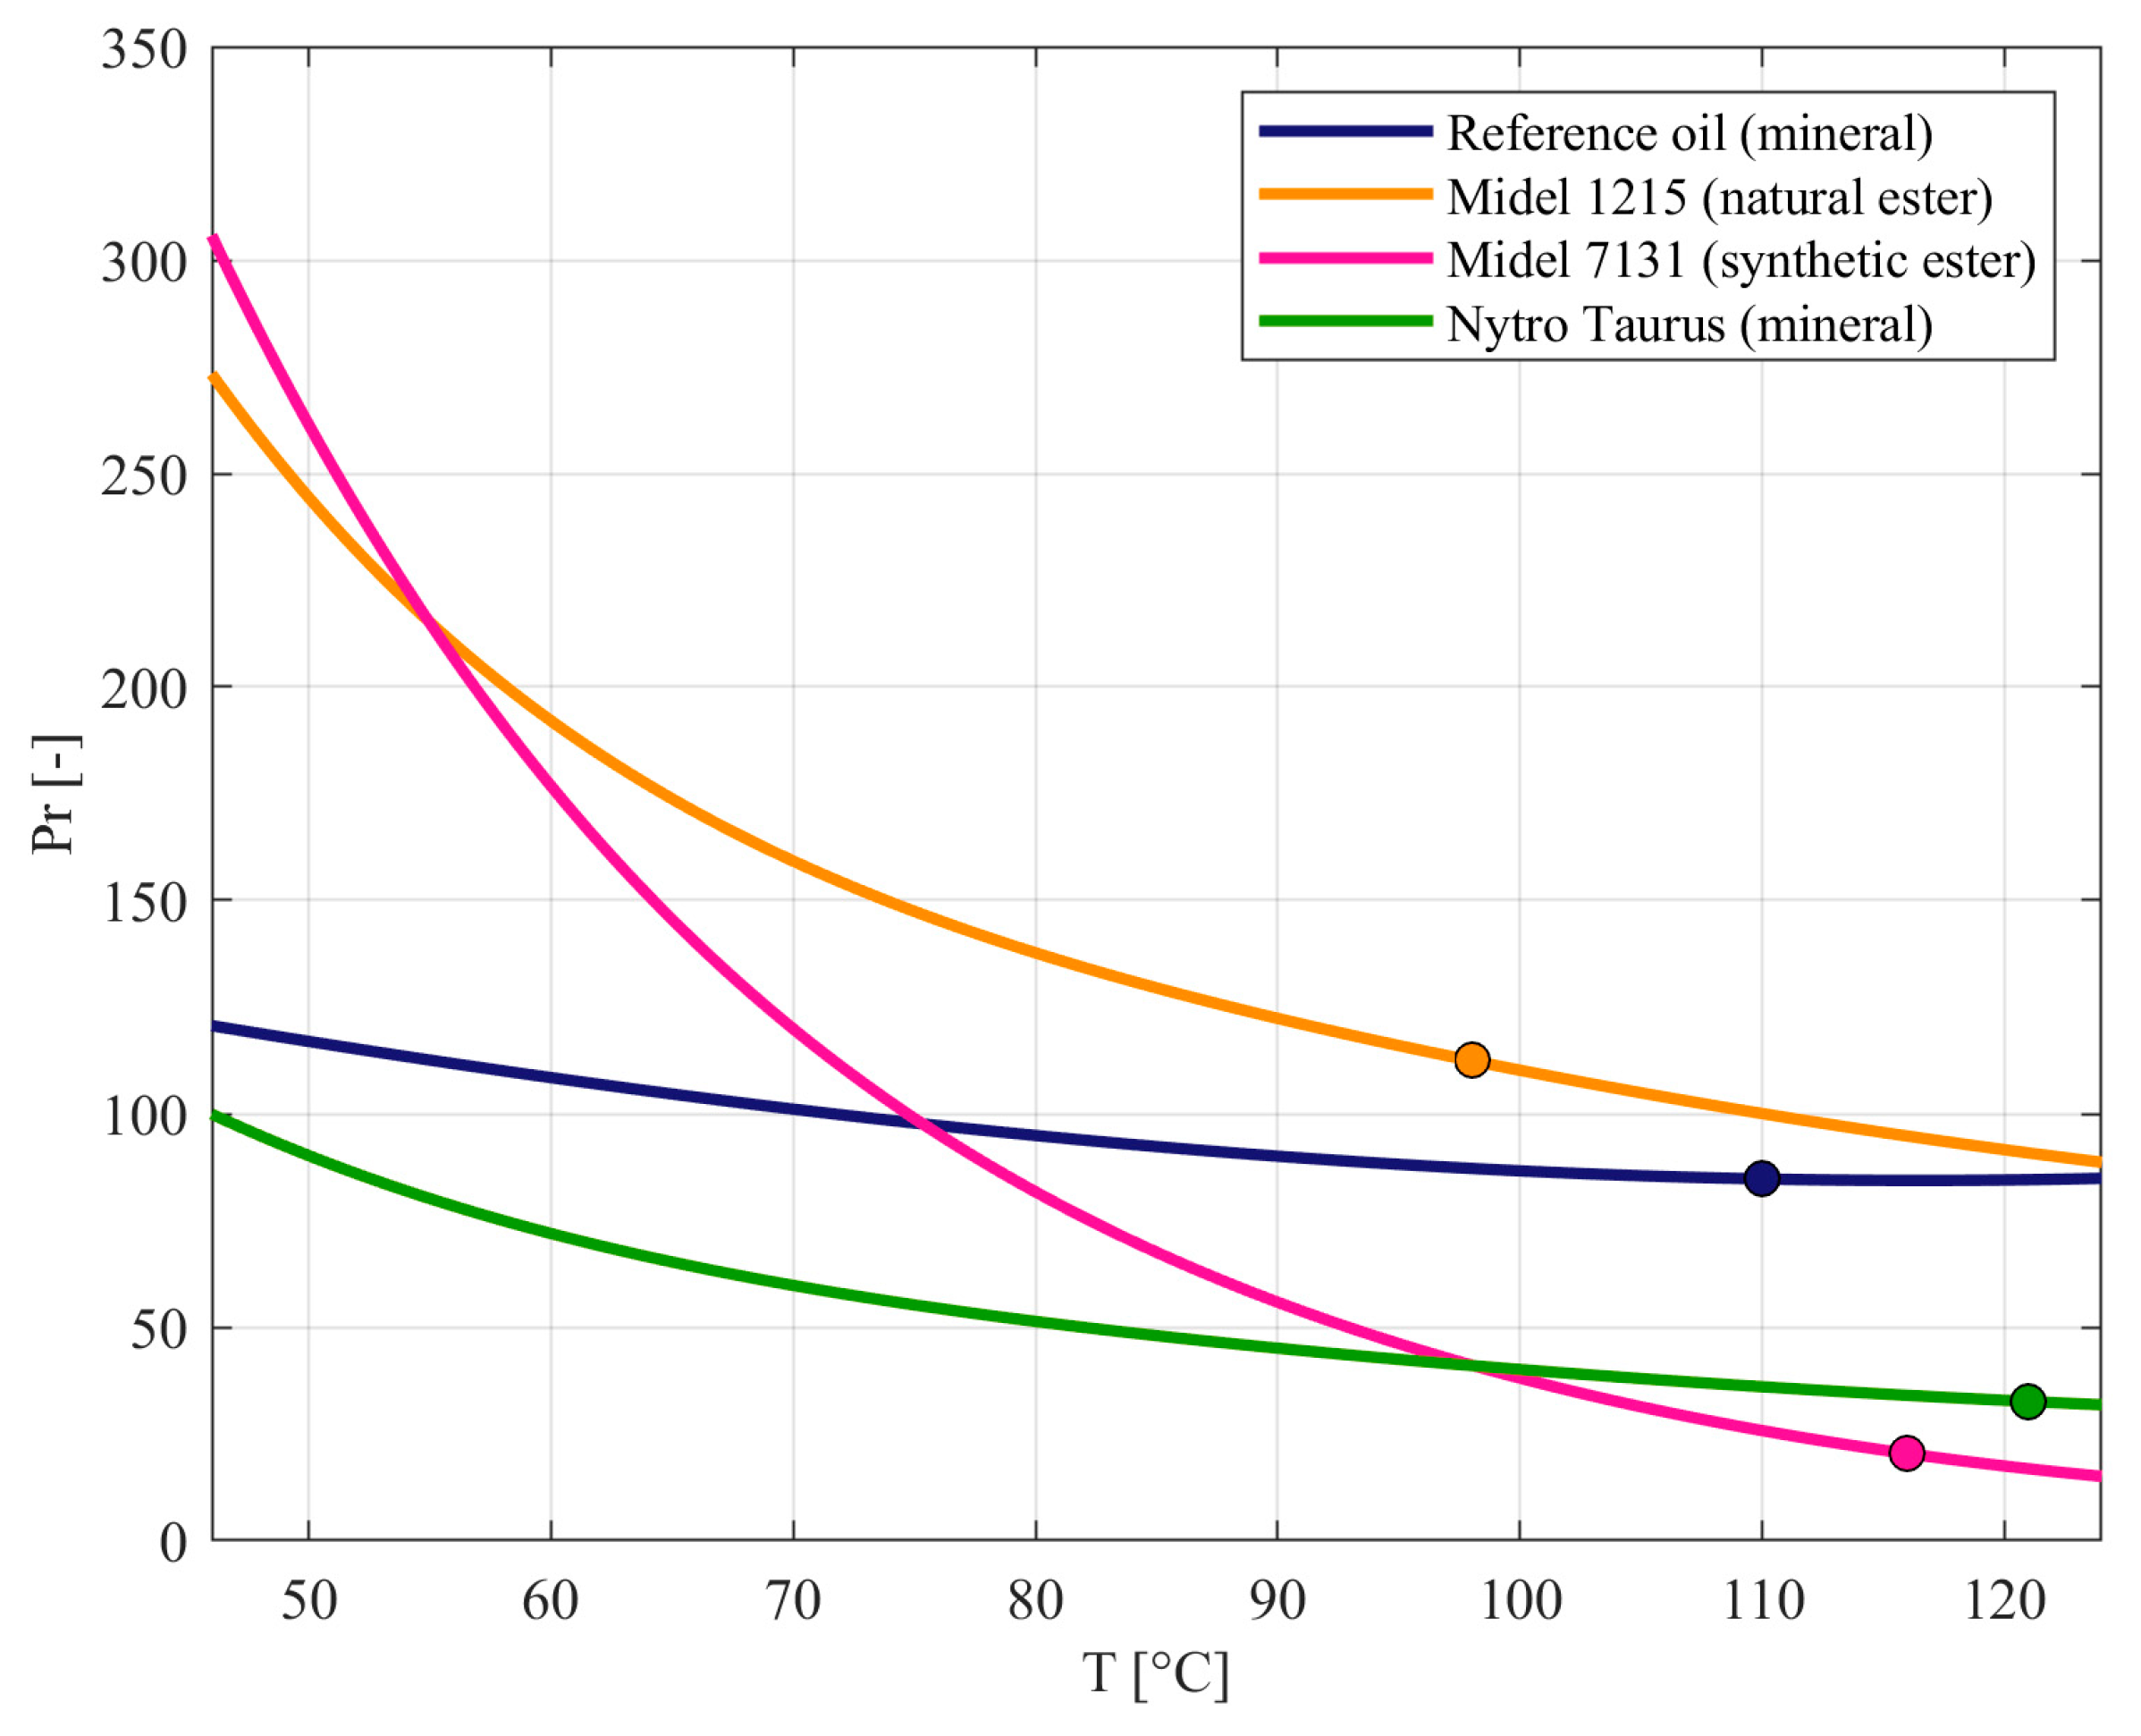
3.2. Thermal-Hydraulic Performance

In Figure 6, the average temperature (T) of the discs (Figure 6a) is displayed together with the mass flow rate (MFR) distribution of the oil in the horizontal channels (Figure 6b) for all the explored cases. As expected, the two distributions are interrelated: one or multiple local peaks of temperature are generated within each pass, associated, in general, to discs that are surrounded by a poor circulation of the oil. Exceptions to such a correspondence are encountered at the base of each pass, starting from the second one: in these regions, hot streaks are conveyed from a vertical channel to the opposite one by the oil flow, producing an increase in the temperature of the adjacent disc despite a relatively high MFR fraction. An example of such a phenomenon, also described in [17], is reported in Figure 7, which shows the thermal distribution in both fluid and solid regions in Pass 2 for the case of Midel 1215: the hot streak coming from the first pass is drawn by the flow into the first three channels and determines local hot spots in the first two discs, despite the relatively high flow rate. The same temperature levels are then observed in the central discs, for which the flow rate is significantly lower.
For what concerns the thermal performance of the four oils, Table 2 reports the location and value of the hot spots for each case. It can be observed that the best cooling performances for the present case study are obtained with the natural ester Midel 1215. As shown in Figure 6b, the mass flow rate distributes more equally in the various channels for this fluid, with a minimum MFR fraction that never falls below 1.5%, against the minimum value of 1.2% reached by the reference oil. Consequently, the temperature of the discs is kept low along the whole winding (Figure 6a). A hot spot of only 103.5 °C is generated at disc 51 (Pass 3), which is nearly 15% lower than the hot-spot value obtained for the reference oil (113.7 °C, disc 71, Pass 4).
On the contrary, by involving a hot-spot temperature of 124.8 °C at disc 54 (Pass 3), the mineral oil Nytro Taurus is the fluid that determines the worst thermal scenario. In particular, the occurrence of nearly zero flow across three consecutive horizontal channels in the third pass (MFR fraction ≤ 0.4%) is at the origin of the large peak encountered in the T distribution of the discs.
The superior performance of both natural and synthetic esters with respect to Nytro Taurus is also reflected in the lower average temperature of the copper conductors and, consequently, in the lower mean temperature gradient between copper and oil, resulting in a higher overall cooling effectiveness (i.e., a higher heat transfer coefficient; see again Table 2), whose increase with respect to the reference oil is particularly significant for the case of Midel 1215. Even more interestingly, such a performance increase comes at no additional cost from the point of view of hydraulic losses: as reported in Table 2, the required pumping power is substantially equal for all the considered coolants. Pressure losses are moderately higher for both Midel 1215 and 7131, but, in the frame of a constant imposed mass flow rate, they are compensated by the lower density of both Midel oils.

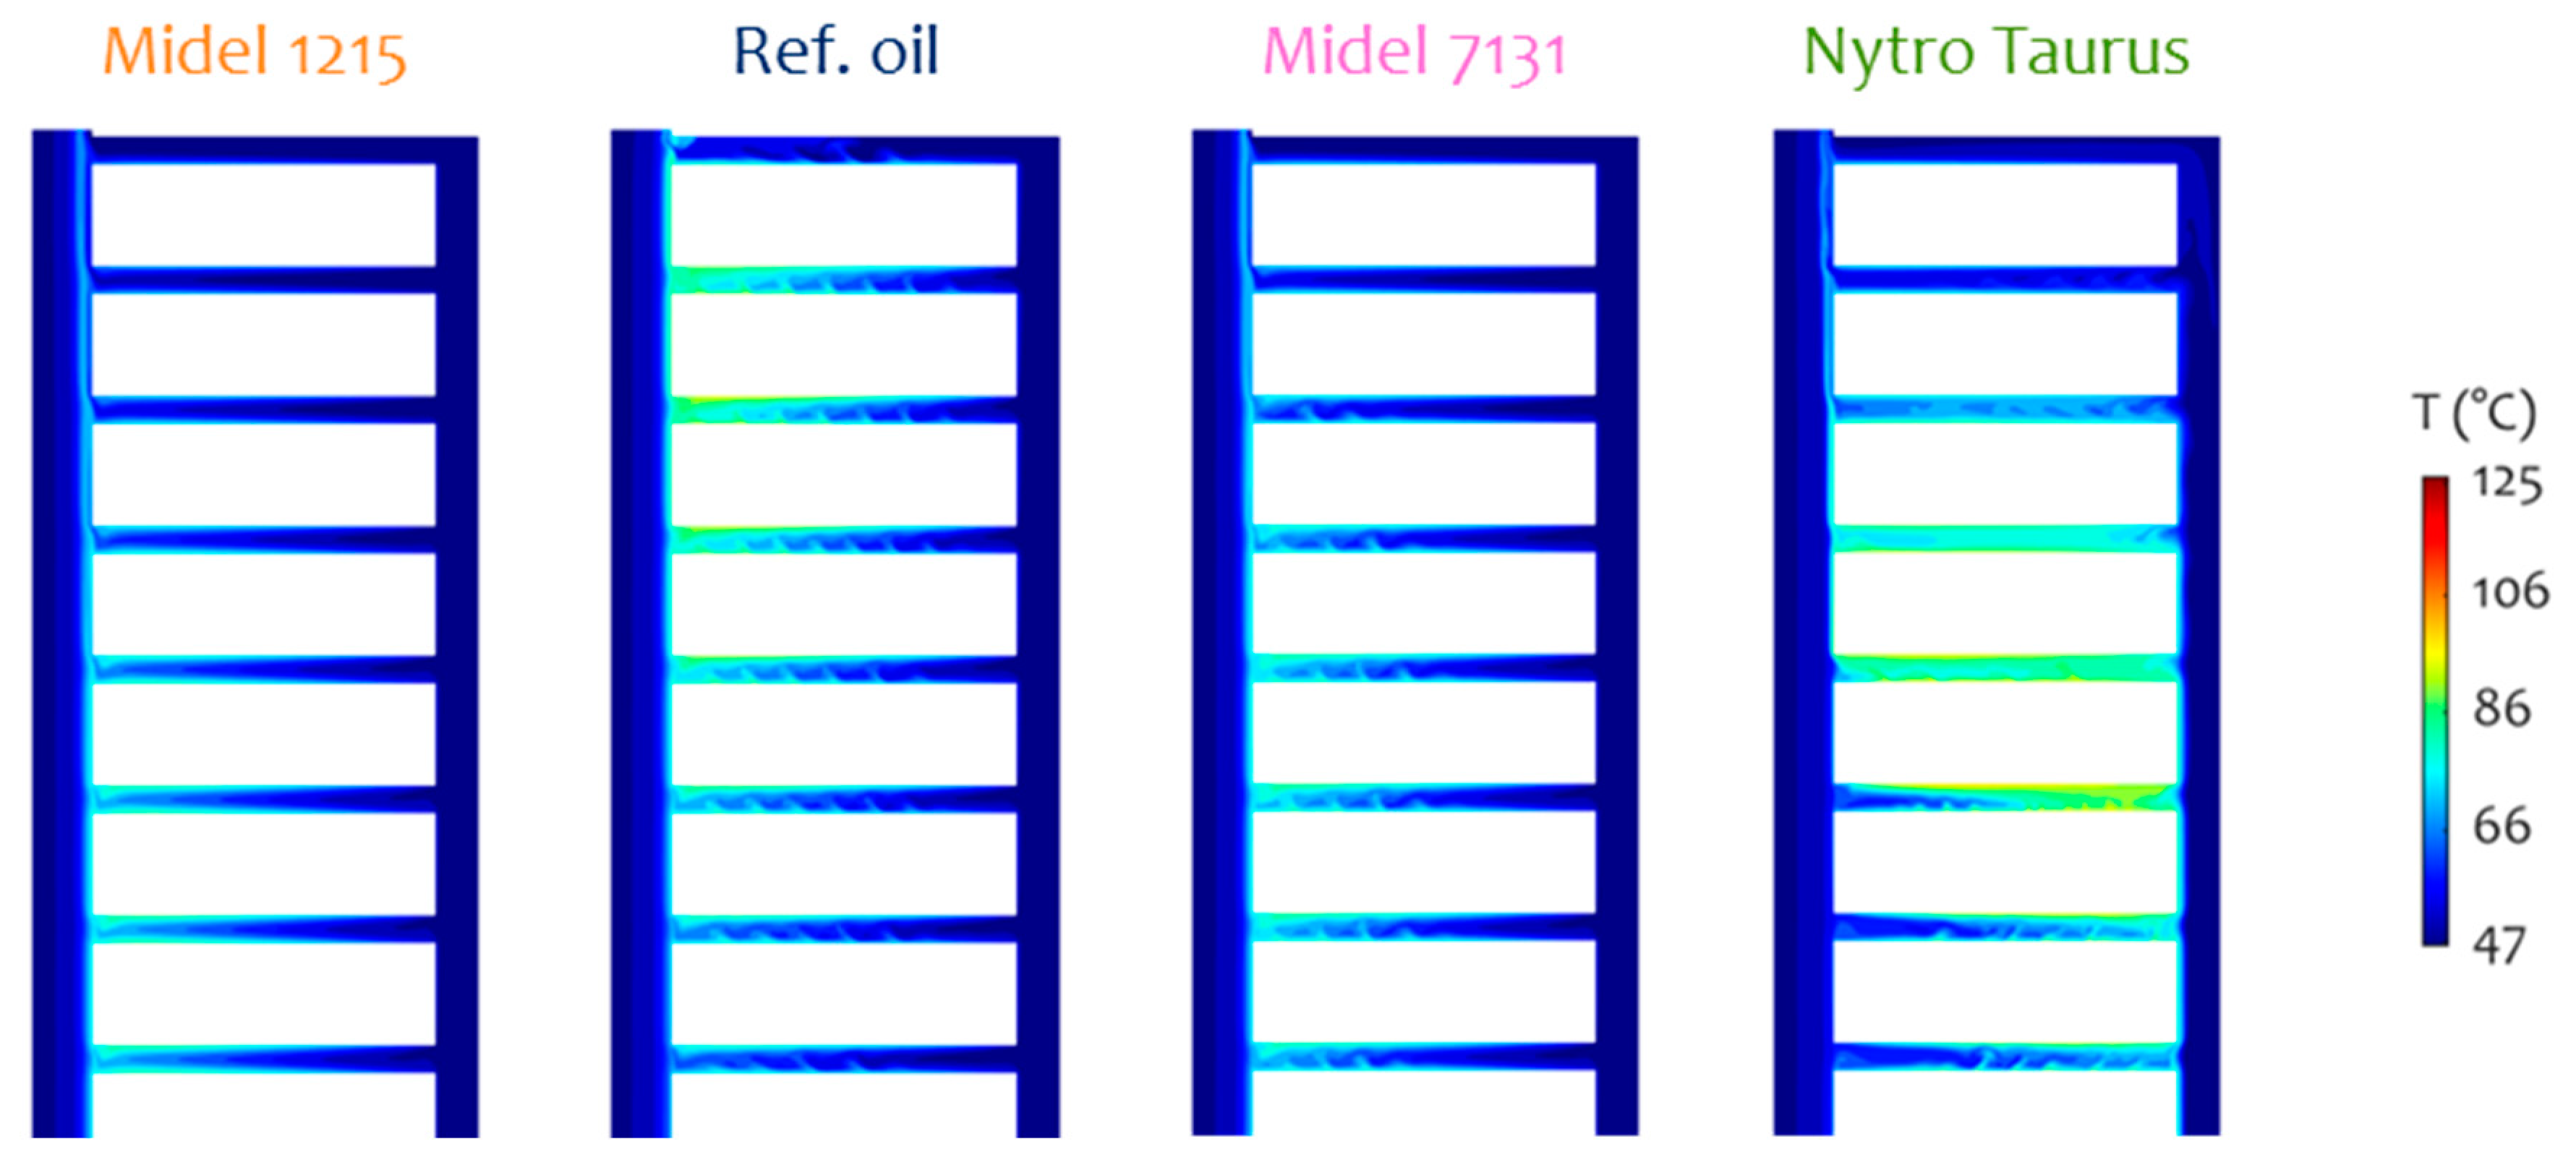
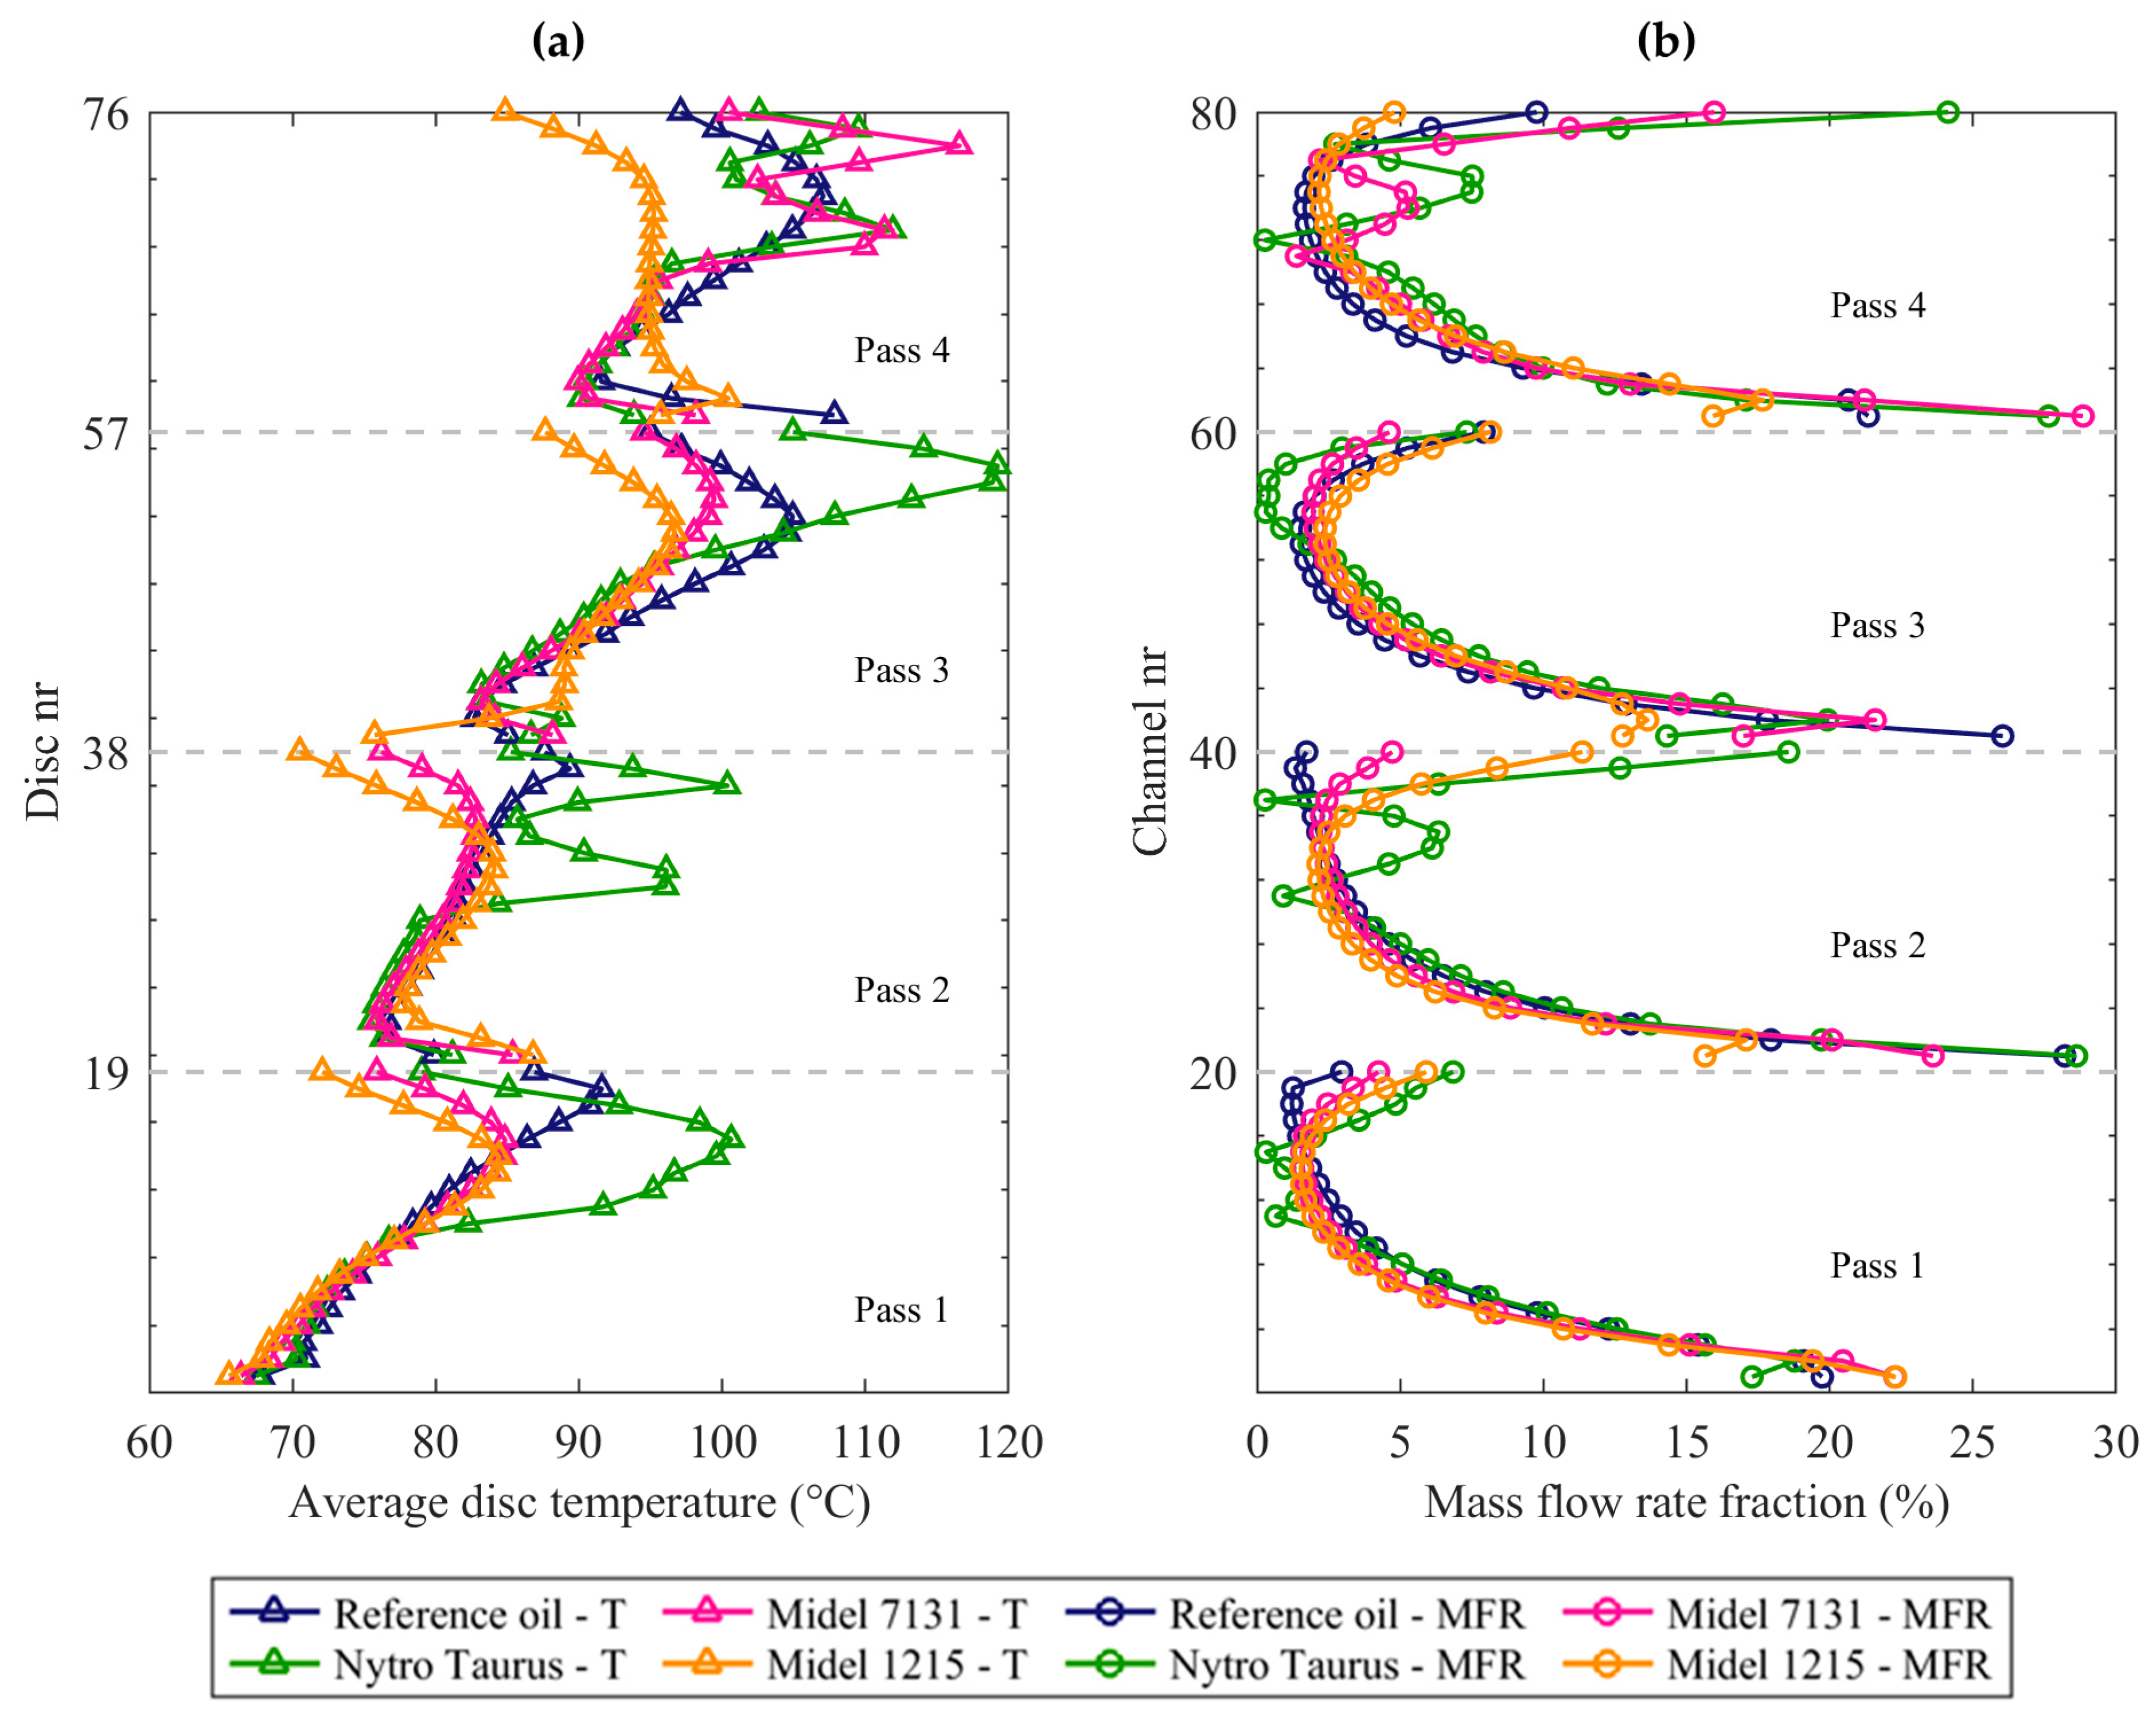
3.3. Temperature and Velocity Distributions

A deeper insight into the mean behavior described above can be gained by analyzing the detail of temperature and velocity distributions. The temperature maps reported in Figure 8 reveal that, in the horizontal channels of Pass 3, rapid expansion and coalescence of the upper and lower boundary layers occurs across a wide portion of the channels. Hence, the hottest temperature is reached at this height of the pass, although more stagnant flow can be found at lower positions. This occurrence is more evident for the cases exhibiting oscillatory behaviors and is a direct consequence of the formation of thermal instabilities like the ones depicted in Figure 4.
Another relevant aspect that can be inferred from the temperature maps, and which decisively affects thermal performance in the present case study, is the onset of flow reversals in some of the horizontal channels and, in particular, for the cases of Nytro Taurus and Midel 7131. The first trace of this phenomenon is the presence of a local minimum of the MFR fraction (see Figure 6b), which occurs in each pass for Nytro Taurus and only in Pass 4 for Midel 7131. A further hint of this feature is the formation and detachment of hot streaks along the vertical channel on the side of the pass inlet, as visible in Figure 8b. When the effect of flow reversal runs out, these hot streaks are conveyed to the opposite vertical channel contributing to the local temperature rise. A similar behavior can be noticed near the top of Pass 4 also with the synthetic ester Midel 7131 (Figure 8c). In this case, the combination of the hot streak with the coalescence of thermal boundary layers from two neighboring discs results in a hot-spot temperature as high as 120.0 °C at disc 74. Consequently, the overall cooling effectiveness of Midel 7131 must be considered worse than the one provided by the reference oil, even if its performances in the lower passes are superior, nearing those of the natural ester.
The occurrence of flow reversals can then evidently be observed in profiles of the horizontal velocity component, reported in Figure 9 for selected channels in the upper part of Pass 4. In that pass, the mean flow is positive (i.e., directed toward the positive x-direction, from the inner to the outer vertical channel). However, in channel no. 69, i.e., roughly at half the height of Pass 4, oil is nearly stagnating across most of the channel, although with a positive mean; moving upward, from channel no. 70 to 75, both oils show a reversal of the mean flow from the external edge of the channel to the internal one. The mean flow returns positive in channel no. 76. Such stagnation and reversal zones are due to the combined effect of flow distribution over the channels of the passes, which favors the extremal channels with respect to the more central ones, and the formation of buoyancy-induced convective flow structures in the channels, like the ones shown in Figure 4, which block the cooler fluid coming from the inner vertical channel. Such a phenomenon critically influences the position of the hot spot in the discs, making it sensitive to the entire variety of geometrical and flow parameters that characterize the cooling ducts of disc-type windings.

4. Concluding Remarks

The thermal performance of alternative oils versus mineral cooling oils on a reference case of a transformer winding geometry was investigated by means 2D axisymmetric simulation using a conjugate heat transfer solver. Four oils were considered, namely two mineral oils, a natural ester oil (Midel 1215) and a synthetic ester (Midel 7131). The comparison was carried out by considering the same mass flow rate for all the oils; while such a hypothesis can be, to a certain extent, unrealistic in practical cases, it still allows for a meaningful comparison on the same reference test case, assuming, for instance, that the oil flow is directed in the windings by a pump.
Results show that, generally, the natural ester (Midel 1215) not only determines a more stable flow, arguably thanks to its higher Prandtl number, but also exhibits the lowest overall maximum temperature in the conductors. A significantly poorer performance, with a much higher (by more than 20 °C) hot-spot temperature, is observed for the Nytro Taurus mineral oil. The behavior of the synthetic ester (Midel 7131) is similar to the one of the natural esters in the lower part of the domain, while it is aligned to the mineral oil in the upper passes, where oil temperatures rise, and the value of Pr rapidly decreases. All in all, it can be concluded that the influence of Pr is of primary concern for the comparison between these oils.
Another important aspect concerns the position of the hot spot, which is considered, by technical standards, to occur in the very last discs, for disc-type winding arrangements. Not only this does not happen in any of the cases considered here (except for the Midel 7131 oil), but for one of the two mineral oils (the Nytro Taurus), it does not even occur in the last pass of the zigzag cooling duct. Such a result underlines the importance of the use of advanced predictive tools for transformer cooling design.
Finally, even in this limited number of cases, a variety of dynamical behaviors, including instabilities and flow reversals, were observed, prompting future analyses relating these occurrences to the values of the main dimensionless flow parameters.

Author Contributions

Conceptualization, E.S. and D.A.; methodology, E.S., A.L., M.G. and D.A.; software, E.S., A.L. and M.G.; data curation, E.S. and A.L.; visualization, E.S. and A.L.; writing—original draft preparation, E.S., A.L. and D.A.; writing—review and editing, M.G., D.A. and M.A.C.; supervision, D.A. All authors have read and agreed to the published version of the manuscript.

Funding

This research received no external funding.

Institutional Review Board Statement

Not applicable.

Informed Consent Statement

Not applicable.

Data Availability Statement

The raw data supporting the conclusions of this article will be made available by the corresponding author on request.

Conflicts of Interest

The authors declare no conflicts of interest.

References

  1. Heathcote, M.J. The J & P Transformer Book; Newnes: Oxford, UK, 1998. [Google Scholar]
  2. Shen, Z.; Wang, F.; Wang, Z.; Li, J. A critical review of plant-based insulating fluids for transformer: 30-year development. Renew. Sustain. Energy Rev. 2021, 141, 110783. [Google Scholar] [CrossRef]
  3. Rouse, T.O. Mineral oil in transformers. IEEE Electr. Insul. Mag. 1998, 14, 6–16. [Google Scholar] [CrossRef]
  4. Fofana, I. 50 years in the development of insulating liquids. IEEE Electr. Insul. Mag. 2013, 29, 13–25. [Google Scholar] [CrossRef]
  5. Rafiq, M.; Lv, Y.Z.; Zhou, Y.; Ma, K.B.; Wang, W.; Li, C.R.; Wang, Q. Use of vegetable oils as transformer oils—A review. Renew. Sustain. Energy Rev. 2015, 52, 308–324. [Google Scholar] [CrossRef]
  6. IEC 60076-7:2018; Power Transformers—Part 7. International Electrotechnical Commission: Geneva, Switzerland, 2018.
  7. Nadolny, Z.; Dombek, G. Thermal properties of mixtures of mineral oil and natural ester in terms of their application in the transformer. E3S Web Conf. 2017, 19, 01040. [Google Scholar] [CrossRef]
  8. Achille, K.; Ghislain, M.M.; Louis, M.; Adolphe, M.I. Determination at Variable Temperatures and Analysis of the Physico-Thermal Properties of Palm Kernel and Castor Oil Methyl Esters as Dielectrics for Power Transformers. Int. J. Heat Technol. 2023, 41, 63–71. [Google Scholar] [CrossRef]
  9. Salama, M.M.M.; Mansour, D.-E.A.; Dagrah, M.; Abdelkasoud, S.M.; Abbas, A.A. Thermal performance of transformers filled with environmentally friendly oils under various loading conditions. Electr. Power Energy Syst. 2020, 118, 105743. [Google Scholar] [CrossRef]
  10. Raeisian, L.; Niazman, L.; Ebrahimnia-Bajestan, E.; Werle, P. Feasibility study of waste vegetable oil as an alternative cooling medium in transformers. Appl. Therm. Eng. 2019, 151, 308–317. [Google Scholar] [CrossRef]
  11. Garelli, L.; Rodriguez, G.A.R.; Kubiczek, K.; Lasek, P.; Stepien, M.; Smolka, J.; Storti, M.; Pessolani, F.; Amadei, M. Thermo-magnetic-fluid dynamics analysis of an ONAN distribution transformer cooled with mineral oil and biodegradable esters. Therm. Sci. Eng. Prog. 2021, 23, 100861. [Google Scholar] [CrossRef]
  12. Daghrah, M.; Yang, Z.; Hilker, A.; Gyore, A. Experimental Study of the Influence of Different Liquids on the Transformer Cooling Performance. IEEE Trans. Power Deliv. 2019, 34, 588–595. [Google Scholar] [CrossRef]
  13. Couto, S.; Ferreira, E.M.; Sá, D.; Corte-Real, C.; Lima, P.; Lopes, R.C.; Costa, A.; Sá, C.A.; Monteiro, P.; Soares, M. Comparison of the Thermal Performance of Mineral Oil and Natural Ester for Safer Eco-Friendly Power Transformers. RE&PQJ 2021, 19, 149–154. [Google Scholar]
  14. Santisteban, A.; Fernandez, F.O.; Delgado, I.F.F.; Ortiz, A.; Renedo, C.J. Thermal analysis of natural esters in a low-voltage disc-type winding of a power transformer. In Proceedings of the 19th IEEE International Conference on Dielectric Liquids (ICDL), Manchester, UK, 25–29 June 2017; pp. 1–4. [Google Scholar]
  15. Torriano, F.; Chaaban, M.; Picher, P. Numerical study of parameters affecting the temperature distribution in a disc-type transformer winding. Appl. Therm. Eng. 2010, 30, 2034–2044. [Google Scholar] [CrossRef]
  16. Torriano, F.; Picher, P.; Chaaban, M. Numerical investigation of 3D flow and thermal effects in a disc-type transformer winding. Appl. Therm. Eng. 2012, 40, 121–131. [Google Scholar] [CrossRef]
  17. Salerno, E.; Leonforte, A.; Angeli, D. Influence of the Thermophysical Model on the CFD Analysis of Oil-Cooled Transformer Windings. J. Phys. Conf. Ser. 2021, 1868, 012031. [Google Scholar] [CrossRef]
  18. Weller, H.G.; Tabor, G.; Jasak, H.; Fureby, C. A tensorial approach to computational continuum mechanics using object-oriented techniques. Comp. Phys. 1998, 12, 620–631. [Google Scholar] [CrossRef]
  19. Gray, D.D.; Giorgini, A. The validity of the Boussinesq approximation for liquids and gases. Int. J. Heat Mass Transf. 1976, 19, 545–551. [Google Scholar] [CrossRef]
Figure 1. Schematic view of a cross section of the investigated domain with indication on the numbering of passes, discs and channels.
Applsci 14 09736 g001
Figure 2. Thermophysical properties as a function of temperature for the four considered oils: reference oil (blue lines), Nytro Taurus (green lines), Midel 7131 (magenta lines) and Midel 1215 (orange lines).
Applsci 14 09736 g002
Figure 3. (a) Three-dimensional view of the entire computational domain; (b) detail of the fluid and solid domains of the first pass and entry region, with indication of the main geometrical dimensions and details of the mesh topology; (c) view of the upper part of the computational domain and mesh of the first pass.
Applsci 14 09736 g003
Figure 4. Instantaneous oil temperature colormaps in the top region of Pass 1 for all the four oils considered. Thermal structures in the horizontal channel hint at the occurrence of instabilities and oscillatory behaviors.
Applsci 14 09736 g004
Figure 5. Prandtl number versus temperature for the 4 oils investigated. The maximum temperature value reached for each of the oils is highlighted by a circular marker.
Applsci 14 09736 g005
Figure 6. (a) Average disc temperature (T) and (b) mass flow rate (MFR) distributions. Entry region not included.
Applsci 14 09736 g006
Figure 7. Time-averaged temperature colormaps in Pass 2 for the case of Midel 1215. Hot streaks are visible in the blow-up.
Applsci 14 09736 g007
Figure 8. Temperature colormaps for Pass 3 and Pass 4 of all the explored cases. In the blow-ups, the fluid domain is represented only for the uppermost portion of (a) Pass 3—Nytro Taurus, (b) Pass 4—Nytro Taurus and (c) Pass 4—Midel 7131.
Applsci 14 09736 g008
Figure 9. Time-averaged horizontal velocity profiles normalized by the inlet velocity across different locations of selected channels in the upper half of Pass 4 for the cases of Midel 7131 (magenta lines) and Nytro Taurus (green lines).
Applsci 14 09736 g009
Table 1. Thermophysical properties of oils: coefficients used in Equation (5).
Density, ρ [kg m−3]Dynamic Viscosity, μ [Pa s]
a0a1a0a1a2a3a4a5
Reference oil1098.72−0.7120.08467−4 × 10−45 × 10−7---
Midel 12151121.09−0.67844.41−0.5752.99 × 10−3−7.76 × 10−61.01 × 10−8−5.24 × 10⁻¹²
Midel 71311180.20−0.72436.81−0.4652.36 × 10−3−6.00 × 10−67.66 × 10−9−3.92 × 10⁻¹²
Nytro Taurus1055.27−0.63211.68−0.1527.88 × 10−4−2.05 × 10−62.68 × 10−9−1.40 × 10⁻¹²
Specific Heat, cp [J kg−1 K−1] Thermal Conductivity, k [W m−1 K−1]
a0a1a2 a0a1a2
Reference oil807.23.580- 0.15097.10 × 10−5-
Midel 121512002.2671 × 10−3 0.17153.65 × 10−51.80 × 10⁻⁷
Midel 7131898.13.824−1.59 × 10⁻³ 0.10443.58 × 10−4−7.19 × 10⁻⁷
Nytro Taurus352.45.187- 0.1691−1.23 × 10⁻⁴-
Table 2. Main integral thermal-hydraulic results for the four cases considered.
Symbol/FormulaUnitRef. OilMidel
1215
Nytro
Taurus
Midel
7131
Hot-spot temperature Ths°C113.7103.5
(−15.2%)
124.8
(+16.6%)
120.0
(+9.4%)
Hot-spot location--disc 71
(Pass 4)
disc 51
(Pass 3)
disc 54
(Pass 3)
disc 74
(Pass 4)
Average disc temperature Tave,Cu°C89.085.3
(−8.7%)
90.9
(+4.5%)
87.5
(−3.5%)
Bulk outlet oil temperatureTout,oil°C80.382.079.080.4
Average bulk oil temperatureTave,oil°C63.564.362.863.6
Mean Cu-oil gradientΔTCu-oil = Tave,Cu − Tave,oil°C25.520.9
(−17.9%)
28.1
(+10.1%)
24.0
(−6.1%)
Hot-spot factorHSF = (Ths − Tave,oil)/ΔTCu-oil-1.961.87
(−5.0%)
2.21
(+12.1%)
2.36
(+19.7%)
Overall heat transfer coefficientU = q”/ΔTCu-oilW m−2 °C−1100.4122.2
(+21.7%)
91.1
(−9.2%)
106.9
(+6%)
Overall pressure dropΔp = pin − poutkPa12.8713.47
(+4.7%)
12.60
(−2.1%)
14.06
(+9.3%)
Pumping power L ˙ W11.511.611.511.6
Disclaimer/Publisher’s Note: The statements, opinions and data contained in all publications are solely those of the individual author(s) and contributor(s) and not of MDPI and/or the editor(s). MDPI and/or the editor(s) disclaim responsibility for any injury to people or property resulting from any ideas, methods, instructions or products referred to in the content.

