
Research on Attack Detection for Traffic Signal Systems Based on Game Theory and Generative Adversarial Networks


Abstract
1. Introduction
- (1)
- Since defenders cannot accurately understand the attack locations, this article transforms the game into a complete yet imperfect information game for analysis. It is necessary to calculate the probability of the TSM and UC being attacked, solve for the pure-strategy Bayesian–Nash equilibrium and mixed-strategy Bayesian–Nash equilibrium points of the attacker, clarify the true attack locations, and further select defense measures.
- (2)
- A generative adversarial network model is used to learn traffic flow data and current detection data to achieve anomaly detection and data recovery, generating three common types of network attack behaviors: denial of service, tampering attacks, and replay attacks. This approach aims to generate key target data attackers use to influence traffic control for their own purposes, while also achieving comparative effectiveness.
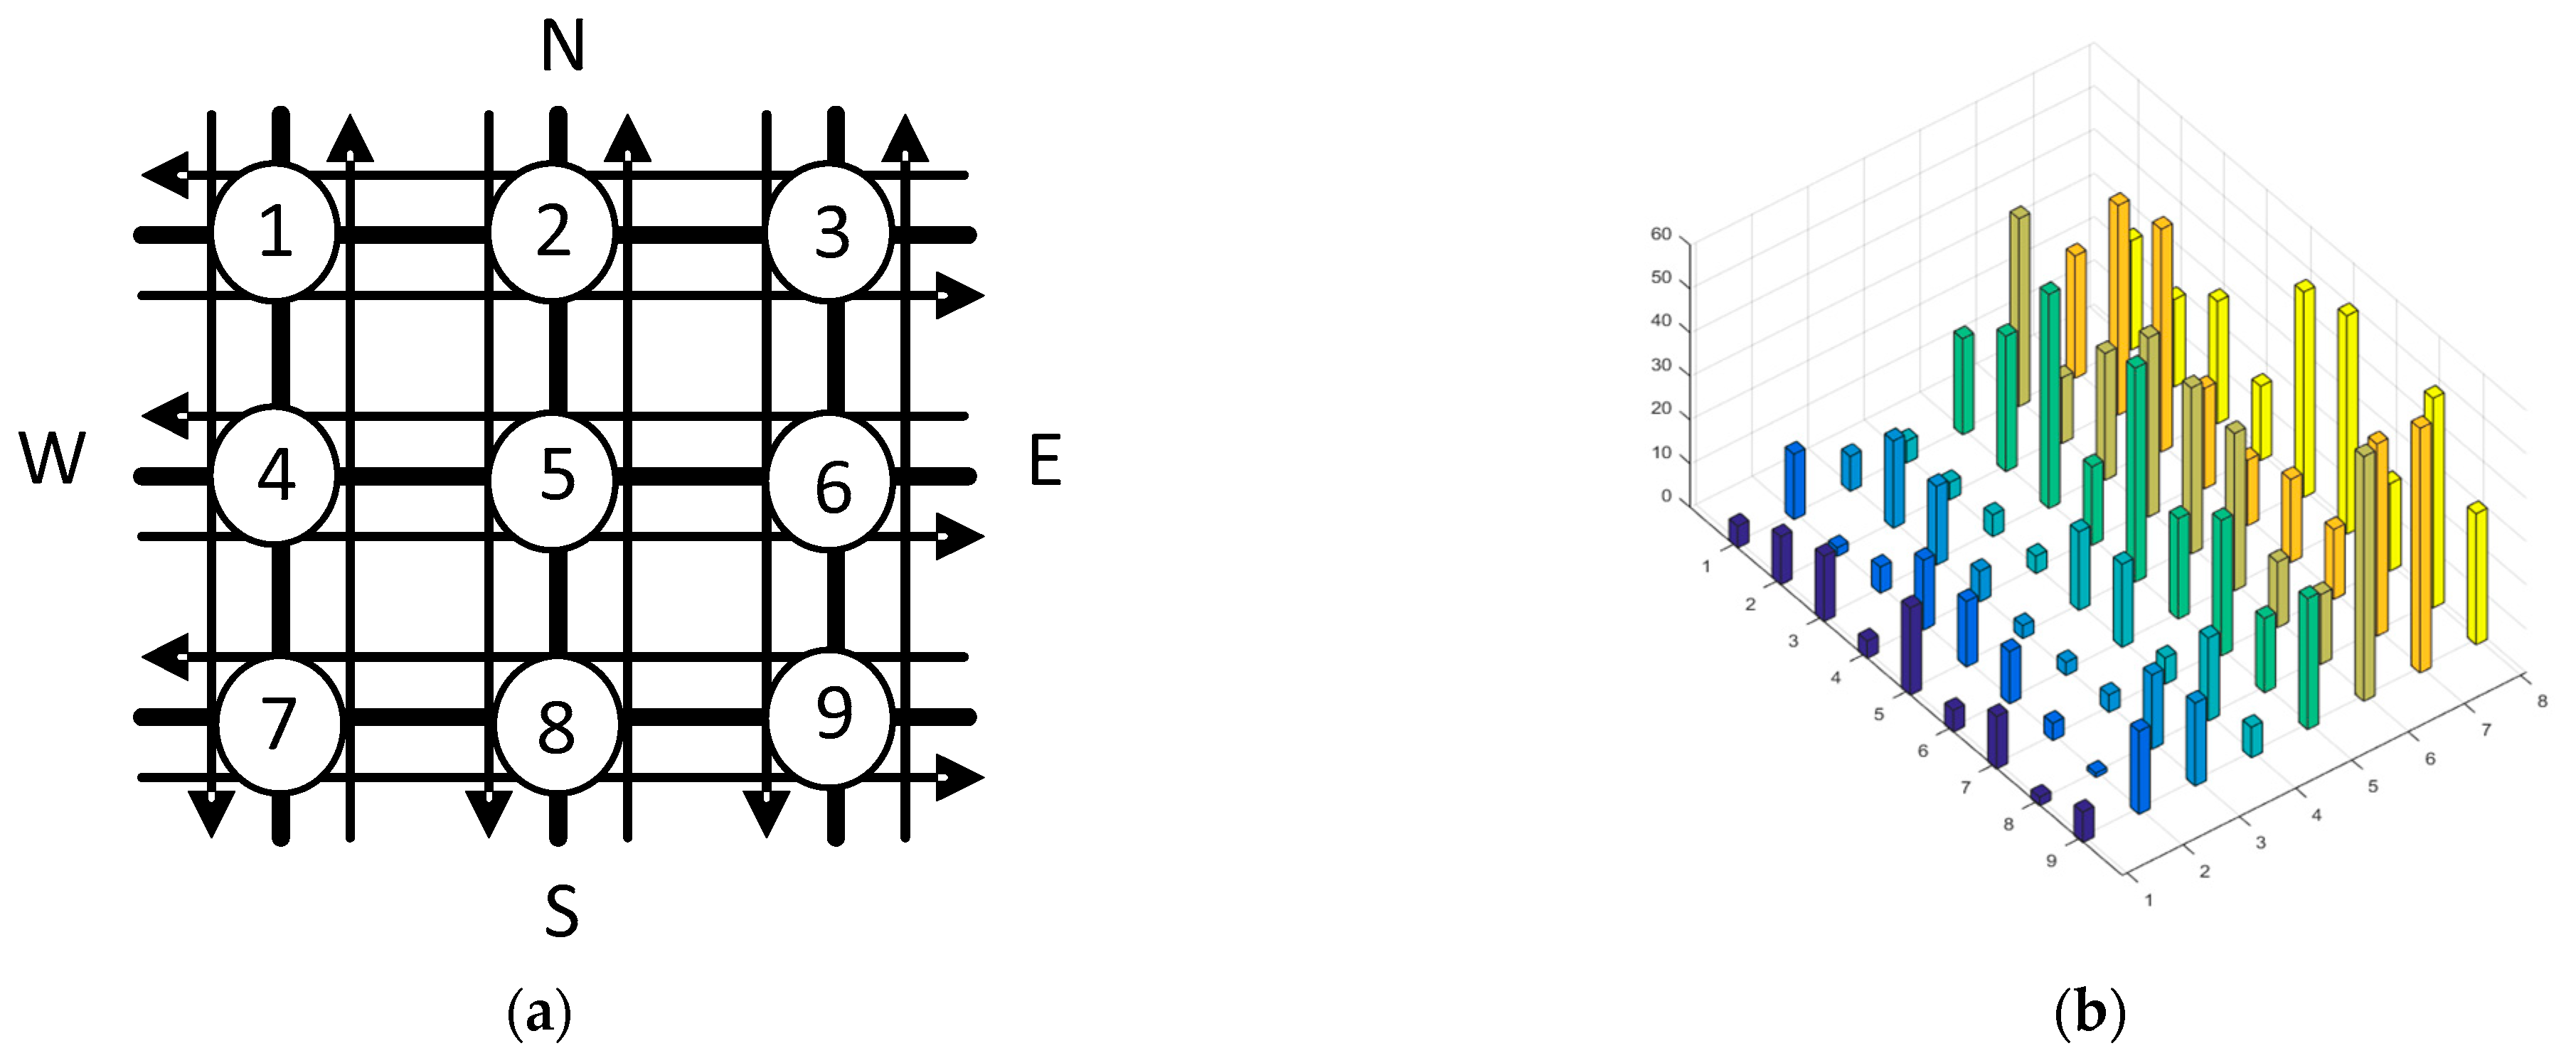
2. Attack Position Assessment
2.1. Bayesian Game Model
2.2. Calculation of Attack Position
- (1)
- When the attacker chooses the pure strategies of and , there is no Bayesian–Nash equilibrium for pure strategies and no Bayesian–Nash equilibrium for mixed strategies.
- (2)
- When and , there exists a pure strategy as a Bayesian–Nash equilibrium; when , there exists a mixed-strategy Bayesian–Nash equilibrium, with the attack position being the UC.
- (3)
- When and , there exists a pure strategy as a Bayesian–Nash equilibrium; when , there exists a mixed-strategy Bayesian–Nash equilibrium, with the attack position being the TSM.
3. Modeling and Dataset Building
3.1. Traffic GAN Model
3.2. Traffic Flow Sample Data Collection
3.3. Attack Sample Data Collection
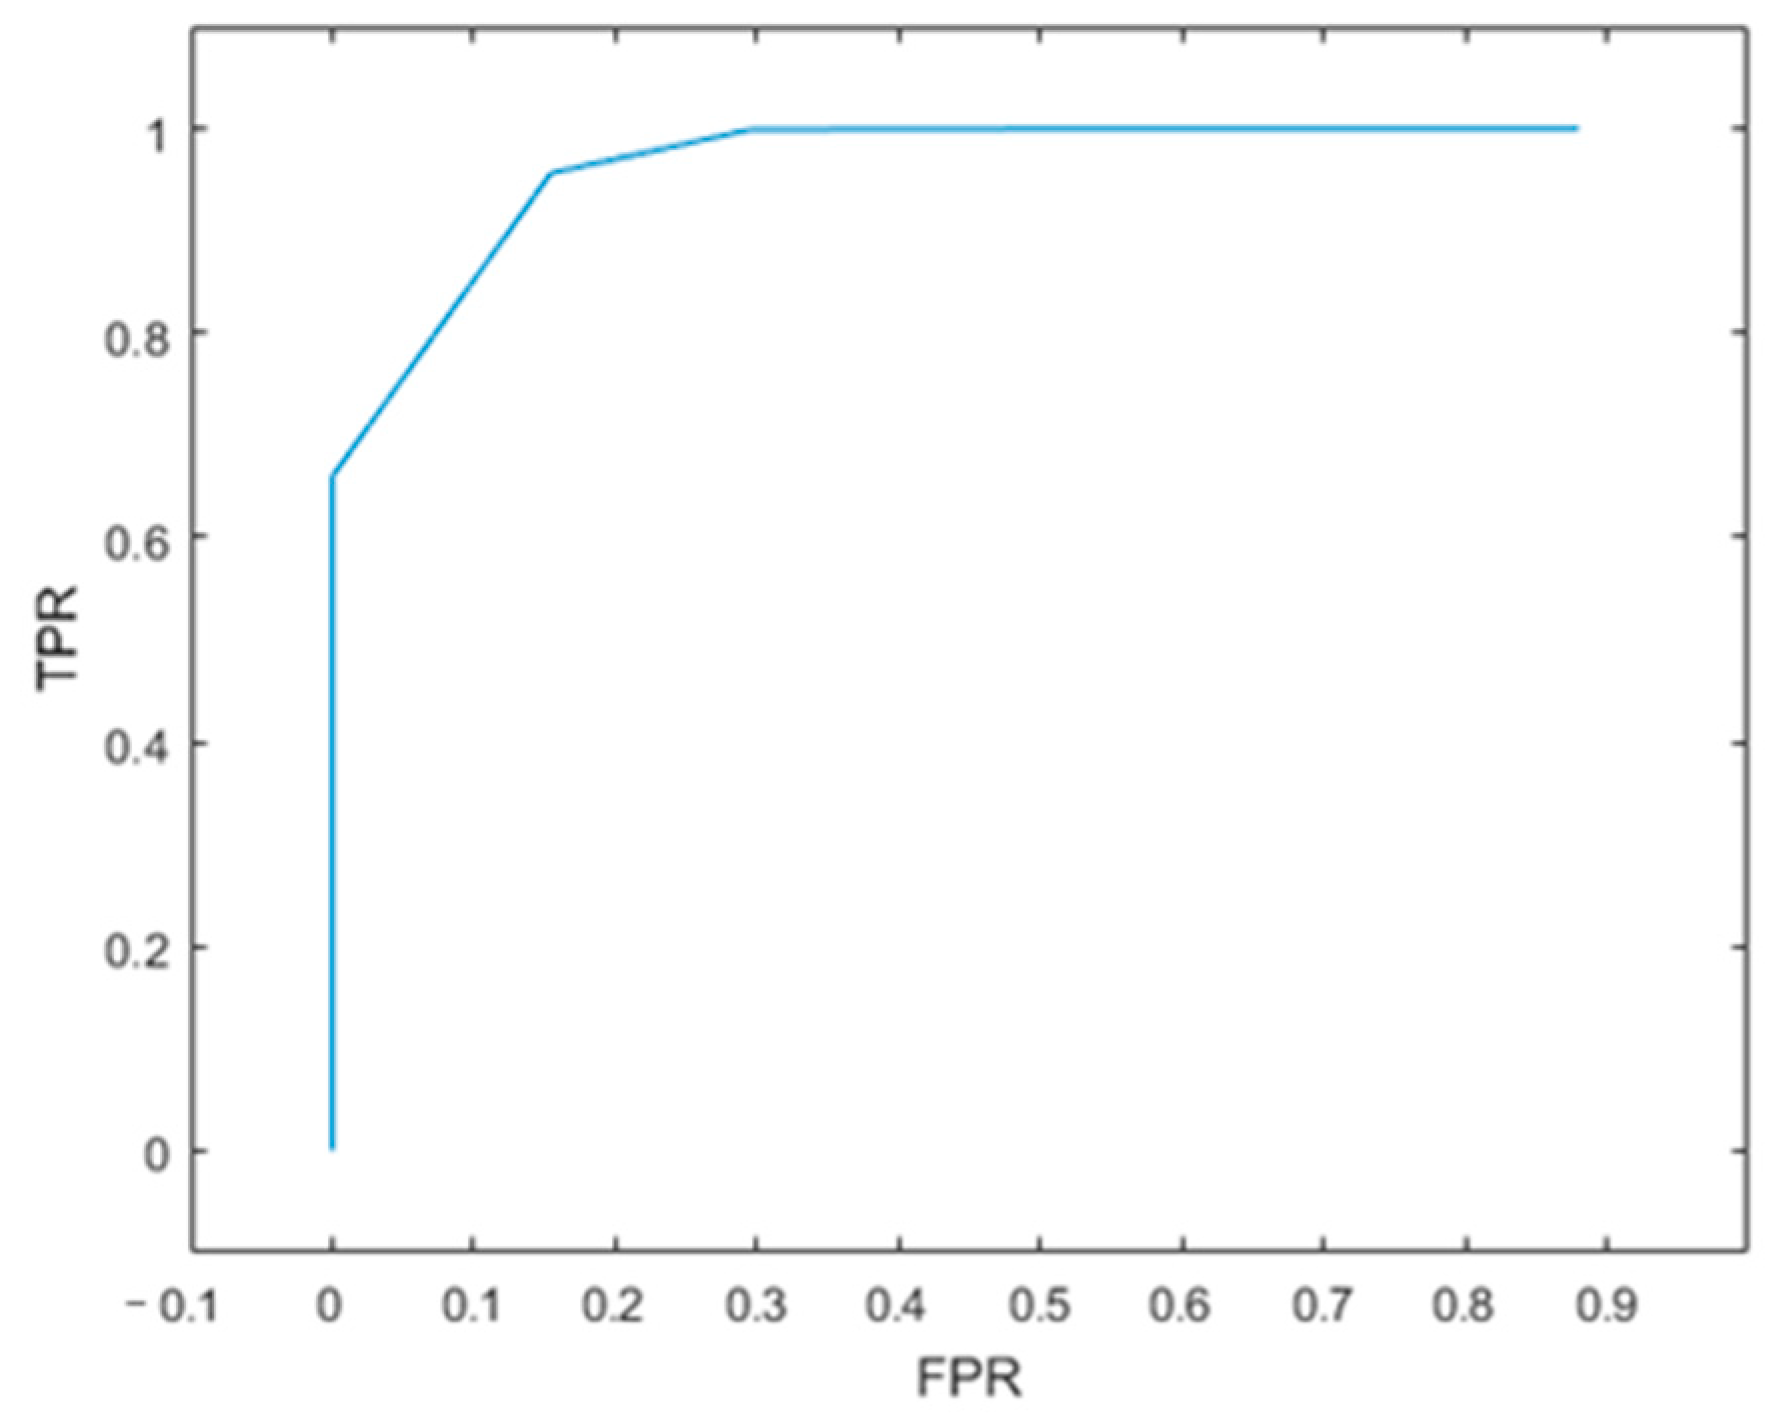
4. Analysis of Experimental Results
4.1. Determining the Detection Threshold
- False Positive (FP), the number of abnormal samples incorrectly identified as normal;
- True Positive (TP), the number of normal samples correctly identified as normal;
- False Negative (FN), the number of normal samples incorrectly identified as abnormal;
- True Negative (TN), the number of abnormal samples correctly identified as abnormal.
4.2. Comparison of Experimental Results
5. Conclusions
Author Contributions
Funding
Institutional Review Board Statement
Informed Consent Statement
Data Availability Statement
Conflicts of Interest
References
- Elassy, M.; Al-Hattab, M.; Takruri, M.; Badawi, S. Intelligent transportation systems for sustainable smart cities. Transp. Eng. 2024, 16, 100252. [Google Scholar] [CrossRef]
- Abirami, S.; Pethuraj, M.; Uthayakumar, M.; Chitra, P. A systematic survey on big data and artificial intelligence algorithms for intelligent transportation system. Case Stud. Transp. Policy 2024, 17, 101247. [Google Scholar] [CrossRef]
- Li, Z.; Jin, D.; Hannon, C.; Shahidehpour, M.; Wang, J. Assessing and mitigating cybersecurity risks of traffic light systems in smart cities. IET Cyber-Phys. Syst. Theory Appl. 2017, 1, 60–69. [Google Scholar] [CrossRef]
- Li, Z.; Shahidehpour, M. Deployment of cybersecurity for managing traffic efficiency and safety in smart cities. Electr. J. 2017, 30, 52–61. [Google Scholar] [CrossRef]
- Haddad, J.; Mirkin, B. Resilient Perimeter Control of Macroscopic Fundamental Diagram Networks under Cyberattacks. Transp. Res. Part B Methodol. 2020, 132, 44–59. [Google Scholar] [CrossRef]
- Haddad, J.; Mirkin, B. Resilient Perimeter Control of Macroscopic Fundamental Diagram Networks under Cyberattacks—ScienceDirect. Transp. Res. Procedia 2019, 38, 56–76. [Google Scholar] [CrossRef]
- Khattak, Z.H.; Park, H.; Hong, S.; Boateng, R.A.; Smith, B.L. Investigating Cybersecurity Issues In Active Traffic Management Systems. Transp. Res. Rec. 2018, 2672, 79–90. [Google Scholar] [CrossRef]
- Cerrudo, C. Hacking US Traffic Control Systems. Proc. Defcon. 2014, 22, 1–15. [Google Scholar]
- Ghena, B.; Beyer, W.; Hillaker, A.; Pevarnek, J.; Halderman, J.A. Green Lights Forever: Analyzing the Security of Traffic Infrastructure. In Proceedings of the 8th USENIX Conference on Offensive Technologies, San Diego, CA, USA, 19 August 2014. [Google Scholar]
- Goldberg, S.; Kenealy, B.; Shepherd, K. Traffic Hackers Get the Green Light. Available online: https://www.businessinsurance.com/off-beat-traffic-hackers-get-the-green-light/ (accessed on 1 April 2023).
- Ahmad, F.; Shah, Z.; Al-Fagih, L. Applications of evolutionary game theory in urban road transport network: A state of the art review. Sustain. Cities Soc. 2023, 98, 104791–104825. [Google Scholar] [CrossRef]
- Cheng, P.; Pan, J.; Zhang, Y. Adaptive unknown input observer-based detection and identification method for intelligent transportation under malicious attack. Meas. Control. 2023, 56, 1377–1386. [Google Scholar] [CrossRef]
- Sun, R.; Luo, Q.; Chen, Y. Online transportation network cyber-attack detection based on stationary sensor data. Transp. Res. Part C Emerg. Technol. 2023, 149, 104058. [Google Scholar] [CrossRef]
- Zhang, C.; Costa-Pérez, X.; Patras, P. Adversarial Attacks Against Deep Learning-Based Network Intrusion Detection Systems and Defense Mechanisms. IEEE ACM Trans. Netw. 2022, 30, 1294–1311. [Google Scholar] [CrossRef]
- Hou, Y.; He, R.; Dong, J.; Yang, Y.; Ma, W. IoT Anomaly Detection Based on Autoencoder and Bayesian Gaussian Mixture Model. Electronics 2022, 11, 3287. [Google Scholar] [CrossRef]
- Huang, X.; Dong, J. An Adaptive Secure Control Scheme for T–S Fuzzy Systems Against Simultaneous Stealthy Sensor and Actuator Attacks. IEEE Trans. Fuzzy Syst. 2021, 29, 1978–1991. [Google Scholar] [CrossRef]
- Zhang, Y.; Malacaria, P. Bayesian Stackelberg games for cyber-security decision support. Decis. Support Syst. 2021, 148, 113599. [Google Scholar] [CrossRef]
- Pasqualetti, F.; Dorfler, F.; Bullo, F. Cyber-Physical Security via Geometric Control: Distributed Monitoring and Malicious Attacks. In Proceedings of the 2012 IEEE 51st IEEE Conference on Decision and Control (CDC), Maui, HI, USA, 10–13 December 2012; pp. 3418–3426. [Google Scholar]
- Amin, S.; Cárdenas, A.A.; Sastry, S.S. Safe and Secure Networked Control Systems under Denial-of-Service Attacks. In International Workshop on Hybrid Systems: Computation and Control; Springer: Berlin/Heidelberg, Germany, 2009. [Google Scholar]
- Mo, Y.; Kim, T.H.; Brancik, K.; Dickinson, D.; Lee, H.; Perrig, A.; Sinopoli, B. Cyber–Physical Security of a Smart Grid Infrastructure. Proc. IEEE 2012, 100, 195–209. [Google Scholar]
- Zhu, M.; Martinez, S. On the Performance Analysis of Resilient Networked Control Systems Under Replay Attacks. IEEE Trans. Autom. Control 2014, 59, 804–808. [Google Scholar] [CrossRef]
- Shombot, E.S.; Dusserre, G.; Bestak, R.; Ahmed, N.B. An application for predicting phishing attacks: A case of implementing a support vector machine learning model. Cyber Secur. Appl. 2023, 2, 100036. [Google Scholar] [CrossRef]


| Problem Summary | Research Basis |
|---|---|
| System defect | System security vulnerabilities; issues with insufficient network security facilities. For example, there is a need to enhance the construction of network security facilities. |
| Hardware is attacked | System security vulnerabilities; issues with insufficient network security facilities. For example, there is a need to enhance the construction of network security facilities. |
| The system is attacked | System security vulnerabilities; issues with insufficient network security facilities. For example, there is a need to enhance the construction of network security facilities. |
| , | , | , | , | |
| 0, 0 |
| Type | Prototype | Optimized | Remarks |
|---|---|---|---|
| Y-shaped intersection | 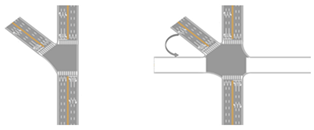 | Move inclined sections to horizontal | |
| T-shaped intersection | 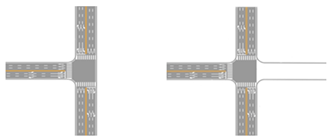 | Perform zero-padding for traffic data where sections do not exist | |
| Boundary segment | 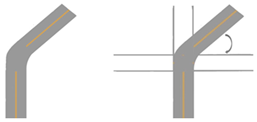 | Move inclined sections to horizontal and perform zero-padding for non-existent sections | |
| Attack Behaviors | Data Set |
|---|---|
| Denial of Service | |
| Tampering attacks | |
| Replay attacks |
| Norm | SVM/% | GAN Model/% |
|---|---|---|
| precision | 100 | 86.7 |
| recall | 78.4 | 95.7 |
| F1 score | 87.9 | 90.1 |
| Norm | GAN/% |
|---|---|
| determine Accuracy Rate | 97.6 |
| RMSE | 13.9 |
Disclaimer/Publisher’s Note: The statements, opinions and data contained in all publications are solely those of the individual author(s) and contributor(s) and not of MDPI and/or the editor(s). MDPI and/or the editor(s) disclaim responsibility for any injury to people or property resulting from any ideas, methods, instructions or products referred to in the content. |
© 2024 by the authors. Licensee MDPI, Basel, Switzerland. This article is an open access article distributed under the terms and conditions of the Creative Commons Attribution (CC BY) license (https://creativecommons.org/licenses/by/4.0/).
Share and Cite
Li, K.; Pan, K.; Xiu, W.; Li, M.; He, Z.; Wang, L. Research on Attack Detection for Traffic Signal Systems Based on Game Theory and Generative Adversarial Networks. Appl. Sci. 2024, 14, 9709. https://doi.org/10.3390/app14219709
Li K, Pan K, Xiu W, Li M, He Z, Wang L. Research on Attack Detection for Traffic Signal Systems Based on Game Theory and Generative Adversarial Networks. Applied Sciences. 2024; 14(21):9709. https://doi.org/10.3390/app14219709
Chicago/Turabian StyleLi, Kailong, Ke Pan, Weijie Xiu, Min Li, Zhonghe He, and Li Wang. 2024. "Research on Attack Detection for Traffic Signal Systems Based on Game Theory and Generative Adversarial Networks" Applied Sciences 14, no. 21: 9709. https://doi.org/10.3390/app14219709
APA StyleLi, K., Pan, K., Xiu, W., Li, M., He, Z., & Wang, L. (2024). Research on Attack Detection for Traffic Signal Systems Based on Game Theory and Generative Adversarial Networks. Applied Sciences, 14(21), 9709. https://doi.org/10.3390/app14219709