Abstract
Adding an insulating sheath to the exposed metal part of the outer insulation of a roof cable terminal can extend the creepage distance of the leakage current and significantly reduce the probability of pollution flashover on the outer insulation of the equipment. However, during the actual operation of the locomotive, the inner surface of the insulating sheath is discharged, resulting in cable insulation breakdown, the mechanism of which is unclear. This paper establishes a cable terminal–sheath electric field simulation model and studies the interface air gap, the interface with wet pollution, and the distribution of damp pollution on the outer surface and other factors on the electric field distribution of the cable terminal–sheath structure and the interface discharge, revealing the mechanism of discharge on the inner surface of the cable terminal’s insulation sheath. A voltage of 25 kV rms is applied, and the simulation results show that when the outer surface of the cable terminal is clean and there are air gaps and wet dirt on the inner surface, the maximum distortion electric field at the inner surface is 0.8 × 10⁵~3.4 × 10⁵ V/m, and the value of the electric field at this time is not enough to cause a partial discharge; when there is a uniform layer of wet dirt on the outer surface of the cable terminal, the electric field on the inner surface averages 1.5 × 10⁵ V/m, which is about 275% higher than the average electric field when the outer surface is clean; when there is wetting or an air gap on the inner surface at the same time, the maximum aberration electric field on the inner surface is 1.8 × 10⁵~1.9 × 10⁶ V/m. The wetting on the outer surface of the cable terminal strengthens the non-uniformity degree of the distribution of the electric field, and when there is wetting and an air gap on the inner surface, the over-voltage on the cable terminal inevitably leads to a discharge phenomenon in the air gap. This provides a theoretical basis for optimizing the insulation sheath structure to solve the discharge problem.
1. Introduction
In recent years, with the full implementation of the strategic blueprint of ‘One Belt, One Road’, the high-speed development of China’s electrified railway construction has ushered in unprecedented opportunities. In electric locomotives and EMUs in the operation process, the roof high-voltage equipment is often exposed to the external environment, in which the on-board cable terminal is important electrical equipment for high-voltage equipment of rolling stock, used to connect different electrical equipment and ensure the normal operation of various electrical equipment in the car, with good waterproof characteristics. This offers good insulating and shielding properties in a normal environment [1,2,3,4], but when the train encounters high humidity, high haze, and other harsh environments, the external insulation properties of the roof cable terminals are seriously reduced, the surface discharge voltage is greatly reduced, and pollution flashover occurs. This results in small overvoltages or even operating voltages causing discharges along the outer surface, aggravating the aging of the equipment and greatly reducing the service life of the equipment [5].
An effective way to solve this problem is to extend the creepage distance, and a previous study [6] mentions the installation of insulating sheaths on the top outgoing parts and the base flanges of cable terminals, surge arresters, etc. This scheme can effectively extend the flow path of the leakage currents, which in turn improves their flashover voltage. The authors of Reference [7] tightly wrapped the upper and lower fittings of the locomotive insulators with the same insulating sheath as in Reference [6], and used a finite element software simulation of the insulator after the installation of the insulating sheath on the electric field along the surface of the impact. The conclusions showed that installing insulators at both ends of the insulator after the insulating sheath can reduce the insulator surface of the maximum electric field strength, and, at the same time, reduce the cost of replacement of the equipment, saving the height of the insulating equipment to increase the additional technical costs. Therefore, this type of structure is widely used in electric locomotives and EMUs.
Although the application of an insulating sheath structure improves the pollution flashover voltage on the surface of cable terminations on the roof of electric locomotives and rolling stock, it also brings new safety hazards. In the actual operation of the train, there are different degrees of discharge problems on the cable terminal’s umbrella skirt column, wrapped by the insulating sheath. Part of the cable terminal discharge setup of the umbrella skirt sheath can be seriously damaged and even burned to the cable body of the sheath layer, which means that the discharge phenomenon on the inner surface of the insulating sheath becomes a new difficulty to solve. Aiming at this problem, related scholars have carried out a series of studies. References [8,9] used multi-physics field simulation software to study the terminal electric field strength when there is an air gap defect inside the cable terminal, indicating that the existence of an air gap inside the terminal is one of the key factors leading to breakdown inside the terminal; Reference [10] establishes an assessment method and criterion for the severity of partial discharge in air gap defects of the cable terminals; Reference [11] proposed a classification model based on wavelet transform (WT) and the deep belief network (DBN) classification model, which provides a basis for the accurate and fast identification of corona discharges in the partial discharge signals of vehicle-mounted cable terminals. Reference [12] established a flat profile control model for cable joints and simulated the electric field distribution of cable joints with scratches in the main insulation or with air gaps in the main insulation, and the electric field distribution of joints with air gap defects, focusing on the partial discharge characteristics of joints containing air gap defects. Reference [13] used the irreversibility of solid insulation defects to propose a critical care system for tracking suspected partial discharge signals and observing the long-term accumulation of discharge spectra. The authors of Reference [14] developed a high-speed data acquisition device to obtain the raw discharge waveform data of partial discharges, which is used to suppress noise and improve the diagnostic efficiency and accuracy of the diagnostic system. The authors of Reference [15] proposed a new PD signal denoising method combining Aquila optimizer–variational mode decomposition (AO-VMD) and K-singular value decomposition (K-SVD) algorithms. The results of both demonstrate that the algorithm proposed by this paper has superior noise reduction and signal extraction performance. The authors of Reference [16] proposed a machine learning-based method for the identification and separation of partial discharge (PD) and two typical pulse interference (PI) signals from the onboard cable terminals of high-speed rolling stock. Reference [17] proposes a filth-test method that applies a step voltage in a single test so that multiple flashovers occur in the test, thus improving the speed and accuracy of the salt-spray filth test. The authors of Reference [18] studied the effect of the length and location of clean and polluted areas on the insulator’s surface on the leakage current and arc length and established a theoretical model to calculate the gap impedance, gap transfer voltage, and leakage current. However, the majority of studies have focused on the individual cable terminal structure and the extraction of partial discharge signals, and there is still a lack of research on the overall cable terminal–sheath structure and the study of the complete discharge mechanism, as well as much work yet to be performed in the study of the discharge mechanism on the inner surface of the sheath.
In this paper, starting from the electric field distribution characteristics of the cable terminal–sheath structure, the COMSOL simulation software establishes a geometrical model of the high-voltage terminal-insulation sheath on the roof of the vehicle, and determines the influence of the air gap, external wet dirt, and interface wet dirt on interface electric field distribution under the application of the RMS 25 kV industrial frequency voltage through simulation, finally obtaining the discharge mechanism of the inner surface of the insulating sheath of the terminal of the vehicle-mounted cable, based on the simulation results.
The rest of the paper is organized as follows: Section 2 describes the establishment of the simulation model of the cable termination–sheath structure in the COMSOL simulation software. Section 3 analyzes the distribution of the interfacial electric field under the influence of the interfacial wet dirt, external wet dirt, and air gap, and establishes the maximum value of distortion of the interfacial electric field. Section 4 summarizes and analyzes the simulation results, and then derives the discharge mechanism on the inner surface of the insulating sheath of the terminal of the vehicle cable.
2. Establishment of a Simulation Model of the Cable Terminal Sheath Structure
2.1. Governing Equations Employed for the Simulations
In the study of electric fields in the outer insulation structures of high-voltage electrical equipment, the electrostatic fields and AC constant fields at low frequencies are the most common types of electric fields. When applying Maxwell’s equations to the analysis, the term in them can be neglected and is called an electrically quasi-static field. Electrically quasi-static fields should be used as much as possible when simulating fouling flash on insulated equipment [19]. According to Maxwell’s equations, for an isotropic linear medium, Poisson’s equation for the relevant potential is Equation (1):
Here, ρ denotes the charge density at any point; ε denotes the dielectric constant of the dielectric, and φ denotes the potential.
When ρ = 0, i.e., there is no space charge in the solution domain, then the equation becomes Laplace’s equation:
The structure of electrical insulation is generally a combination of multiple dielectrics. At this time, the potential function of each dielectric in the structure can be expressed by Poisson’s equation and Laplace’s equation and should satisfy Formulas (3) and (4) on the different dielectric boundary surfaces:
Here, σ denotes the surface charge density at the interfaces of different dielectric manifolds.
An important condition in solving the Poisson or Laplace equations for the potentials derived above is the boundary conditions. Knowing the boundary conditions and the initial conditions, the specific solution of the partial differential equation can be solved. For electrostatic fields and constant electric fields in the dielectric surrounding a conductor, there are usually three types of boundary conditions, as follows [20].
Boundary conditions of the first type involve the known potential of the boundary .
Boundary conditions of the second type are the known potential normal derivatives of the boundary .
n is the outer normal of the boundary.
Type III boundary conditions are a combination of Type I boundary conditions and Type II boundaries, i.e., known potentials on the boundary and normal derivatives of the potentials on another part of the boundary .
Using the finite element method, the first thing to do is to transform the above margin problem for the electrostatic field into a variational problem.
The field is discretized into N partition elements, and the function of the variational problem can be rewritten by assuming a triangular partitioning of the elements:
Let the interpolation function be:
Set the interpolation potential corresponding to the three nodes of the triangular cell e to be , which leads to the following system of equations:
Solving the system of equations yields the values of the coefficients a, b, c. Substituting these values into Equation (10) yields the interpolating function:
After collation, the interpolation function can be expressed as follows:
This gives the gradient vector of the interpolating function as:
Replacing Formula (8) and φ Formula (9) with the gradient of the interpolating function and the interpolating function , respectively, gives us the following:
Included among these are:
According to the number synthesis rule, the unit stiffness matrix can be combined into the overall stiffness matrix , which is a positive definite matrix; the unit vector can be combined into the overall column vector , which leads to the approximate expression of the generalized function, as follows:
Based on the boundary conditions, the overall stiffness matrix and the overall column vectors are processed, resulting in a system of linear equations for which there exists a unique solution, i.e., an approximate solution for the electric field in the field, due to the positive definite stiffness matrix.
2.2. Establishment of a Geometric Model of the Roof Cable Terminal
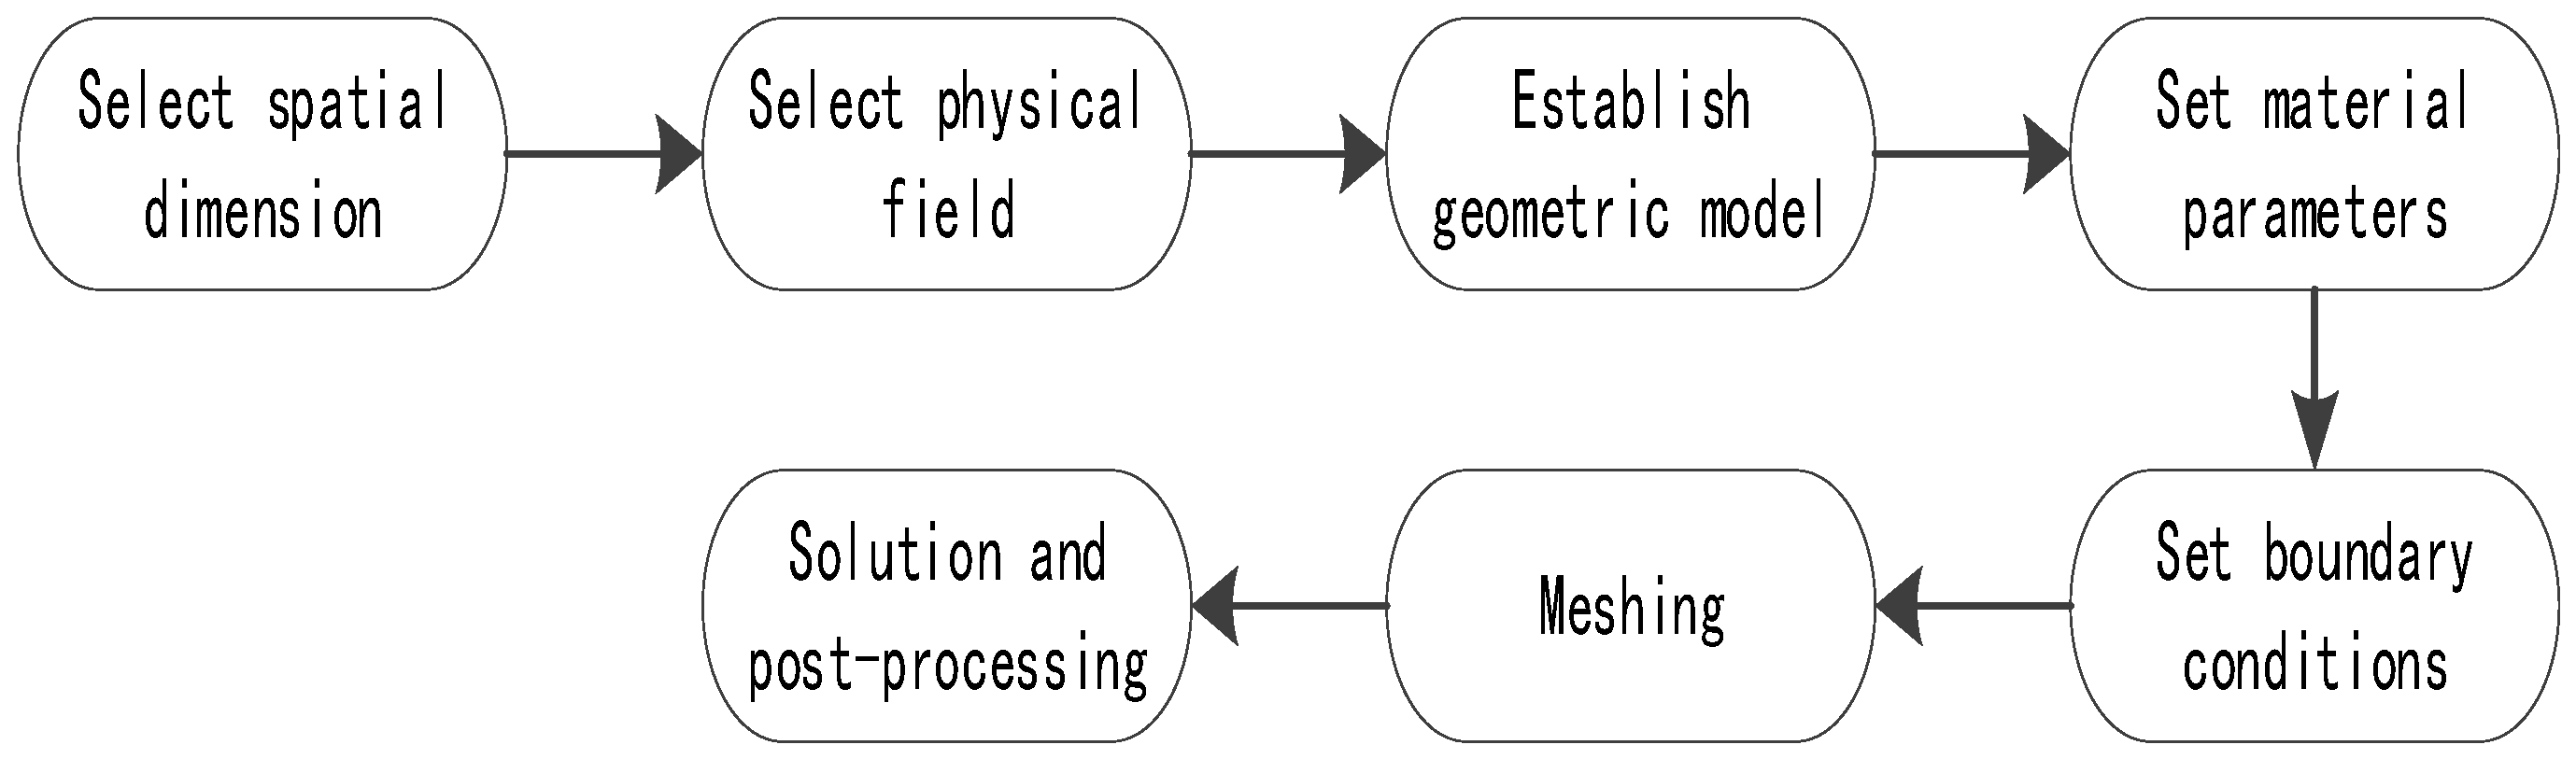
With the gradual deepening and maturity of finite element ideas, a variety of physical field programs based on finite elements have appeared on the market. COMSOL 4.6.2 Multiphysics software stands out among the many software types with its powerful multi-physical field coupling simulation function and has become one of the most important physical field simulation and analysis programs now available. It was originally a toolkit in the MATLAB R2020a software and has developed into an independent software package integrating electromagnetic field, acoustics, heat transfer, structural mechanics, optics, and other simulation analysis. Figure 1 shows the basic steps of physical model simulation when COMSOL 4.6.2 software is used. Users do not need to establish partial differential equations by themselves. Just by the user selecting the appropriate physical field and setting the initial and boundary conditions, the background program can process the grid and analyze and solve by itself. The final results will be displayed graphically so that the physical parameters of the established model can be seen intuitively.
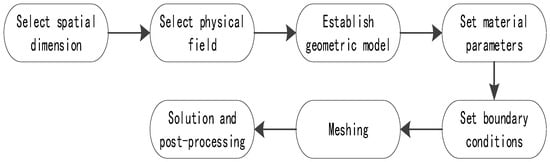
Figure 1.
COMSOL software simulation flow chart.
This study takes the cable terminal as the object through the electric field simulation of the cable terminal with sheath, obtains its electric field distribution characteristics, finds out the electric field concentration point near the insulating sheath, and lays a theoretical foundation for analyzing the discharge mechanism of the insulating sheath of the cable terminal. The actual cable terminal can be considered as an approximately three-dimensional symmetrical structure. To facilitate the simulation calculations with COMSOL software and improve the simulation efficiency, the spatial dimension of the physical model in this study adopts the axisymmetric structure of the cable terminal.
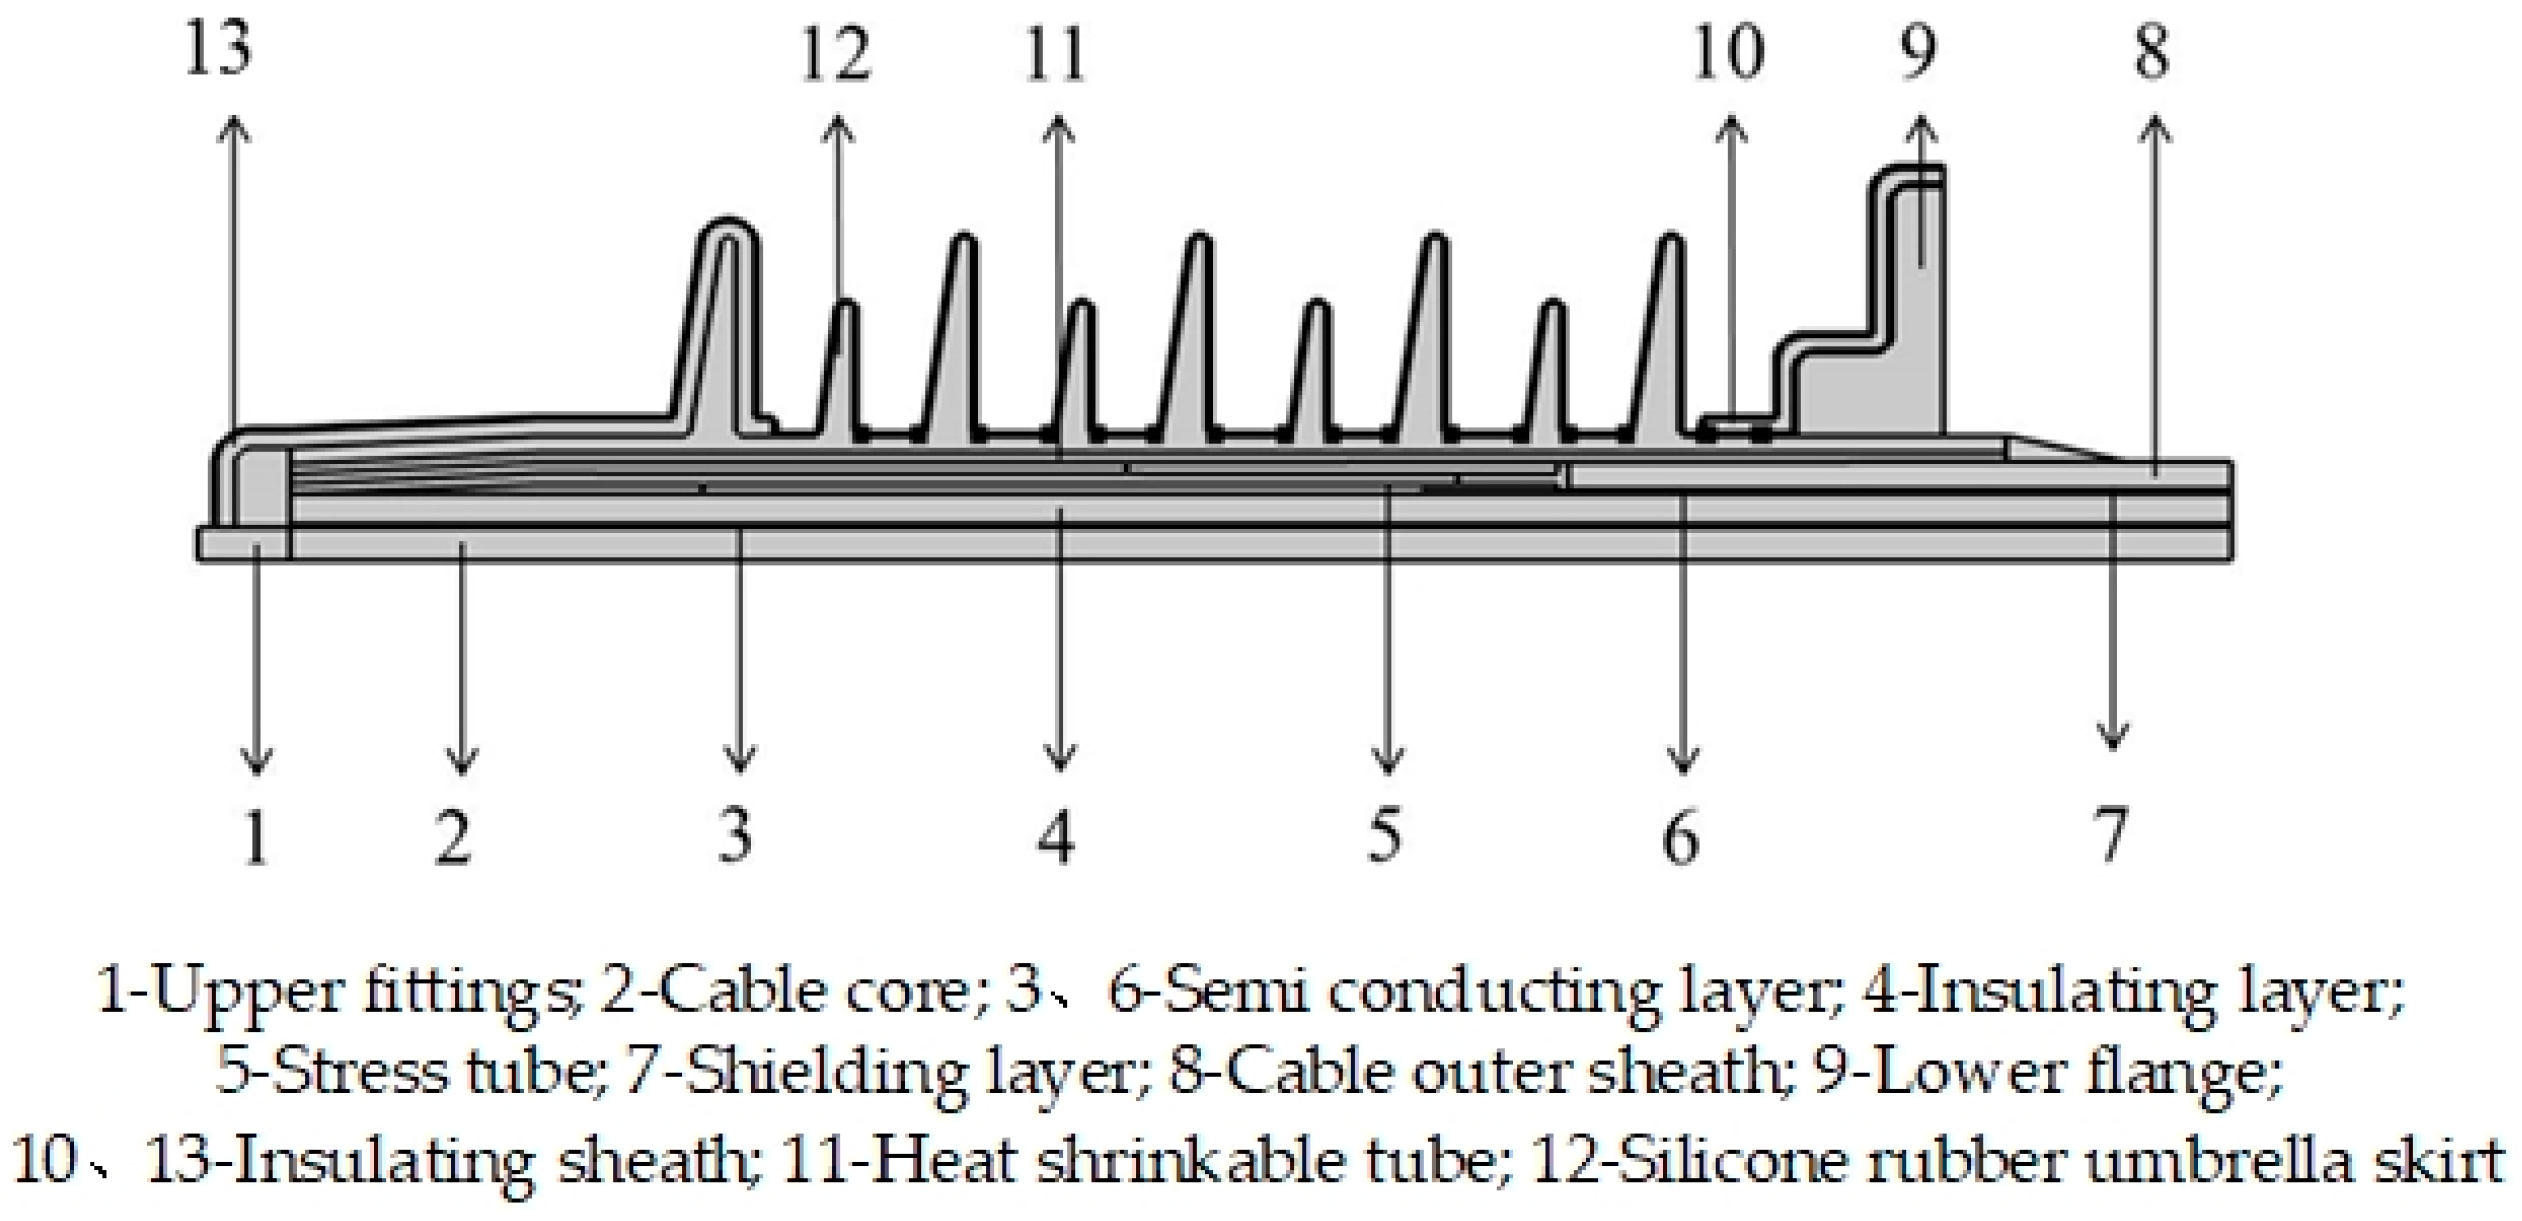
In this paper, the two-dimensional axisymmetric model of cable terminal insulation sheath structure has been established with AutoCAD_2016_64bit software, and the built model structure is imported into the geometric module of the COMSOL software. Figure 2 shows the geometric model of the cable terminal insulation sheath structure.
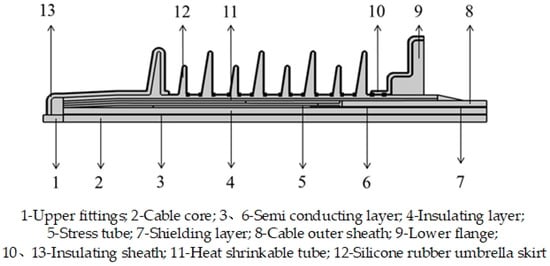
Figure 2.
Geometric model of the cable’s terminal-insulating sheath structure.
2.3. Defining Material Parameters and Boundary Conditions
After establishing the geometric model, it is necessary to configure the electric field-related electrical parameters of each material, including the relative dielectric constant ε and conductivity σ. COMSOL software users can add empty materials by themselves, and can then configure the parameters of the relevant materials. The umbrella skirt and insulating sheath are made from the same silicone rubber material, and the cable core and shielding layer are made from copper. The electrical parameters of the simulation model are set as shown in Table 1.

Table 1.
Electrical parameter settings of the model.
The current field of the COMSOL software defines the boundary conditions by adding the terminals, and since the normal operating voltage of an electric locomotive is 25 kV, a voltage value with an effective value of 25 kV is applied to the fittings at the top of the cable termination. The frequency is defined as 50 Hz in the study, and the flange and the shielding at the bottom of the cable termination are set as being grounded.
2.4. Meshing
An important step in using the finite element method for calculation is to mesh the field. The COMSOL software provides a special mesh generation module. Users can choose automatic mesh generation according to the physical field or divide the mesh themselves according to their needs. Generally speaking, in areas with radians or tip areas, the meshing should be dense, and the meshing for regular geometry should be sparse. This not only ensures the accuracy of simulation calculation but also saves calculation time [21]. As shown in Figure 3, the grid division of the cable terminal insulation sheath model has been carried out. The grid division is relatively dense at the root and at the top of the umbrella skirt, the interface between the insulation sheath and the column, and the tip area, while the grid division of the air, cable core, and other materials is relatively sparse.
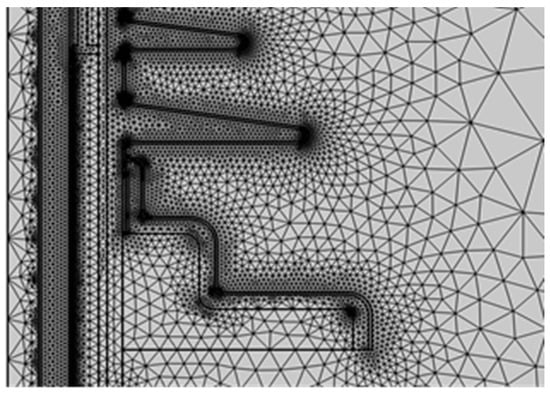
Figure 3.
Partial meshing diagram of the cable terminal–sheath model.
3. Cable Terminal–Sheath Structure Electric Field Simulation Research
In the process of train operation, good insulation equipment and internal fixtures tend not to cause partial discharge, and partial discharge occurring in the area is often due to the interfacial bonding not being good or some of the media production being poor, resulting in the emergence of an air gap. The existence of an air gap will lead to distortion of the electric field near the air gap. The electric field inside the air gap is concentrated, it is easy to trigger air gap breakdown and a breakdown caused by thermal effects. Corrosive substances will intensify the carbonation of the material, resulting in the further expansion of the air gap, which may result in overall material breakdown; at the same time, due to the insulating jacket using an open movable structure, the external water vapor will travel along the gaps into the inner surface of the jacket. The presence of water vapor will greatly change the surface conductivity and dielectric constant of the interface, resulting in the effect of interfacial wet contamination; finally, as the roof cable terminals are often exposed to rising damp and wet weather such as fog, drizzle, etc., under such weather, the outer surface of the cable termination umbrella skirt often adheres to water droplets or a layer of water film, resulting in a significant increase in leakage currents along the outer surface of the umbrella skirt and the occurrence of surface discharging phenomena [22,23,24,25].
Therefore, to investigate the root cause of the discharge, based on this speculation, this chapter starts with the electric field distribution characteristics of the cable termination–sheath structure, and the simulation analysis of the interfacial electric field distribution in various working conditions under the influence of the air gap, interfacial wet contamination, external wet contamination, and other factors.
3.1. Distribution of the Electric Field in the Cable Termination–Sheath Structure When No Sheath Is Installed
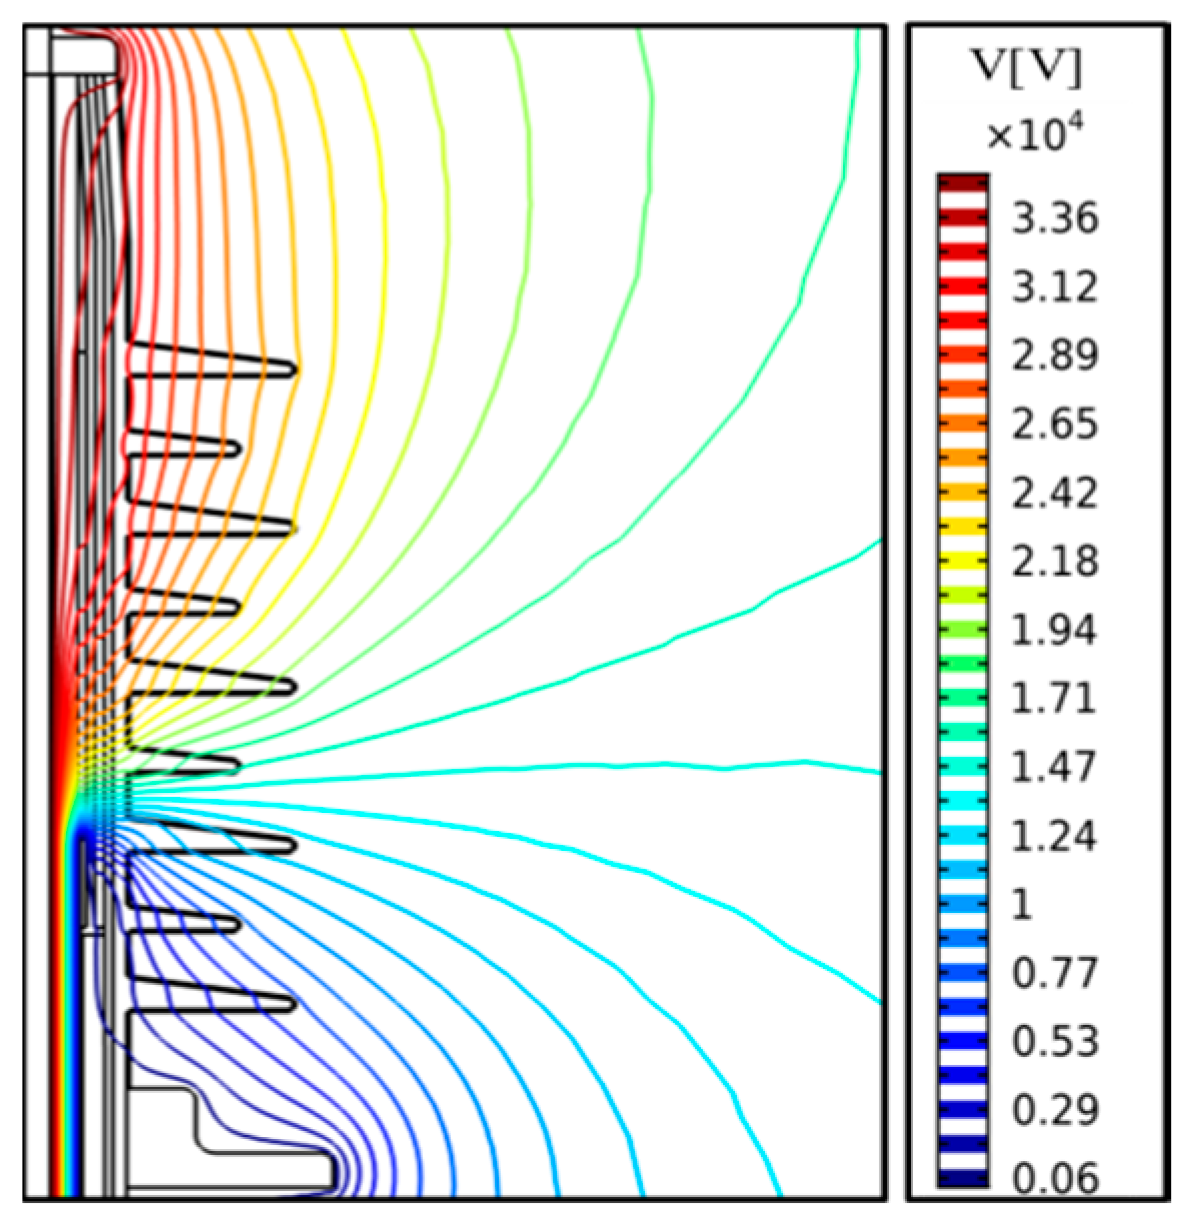
Firstly, a situation where the upper and lower fittings of the cable terminal are not equipped with an insulating sheath is simulated. According to the requirements of the allowable fluctuation range of traction network power supply voltage, the small increase in power frequency voltage has little impact on the interface electric field, so the voltage applied in the subsequent simulation is the power frequency’s effective value of 25 kV [26,27]. Figure 4 shows the equipotential line diagram when the outer surface of the cable terminal structure is free of pollution. It can be seen that its high field strength is concentrated in the interior of the insulating layer between the two semi-conductive layers inside the insulating sheath and at the fracture of the semi-conductive shielding layer, while, on the outer surface of the cable terminal, there is a high electric field value near the edges of the upper and lower fittings and at the same height as the fracture of the semi-conductive shielding layer.
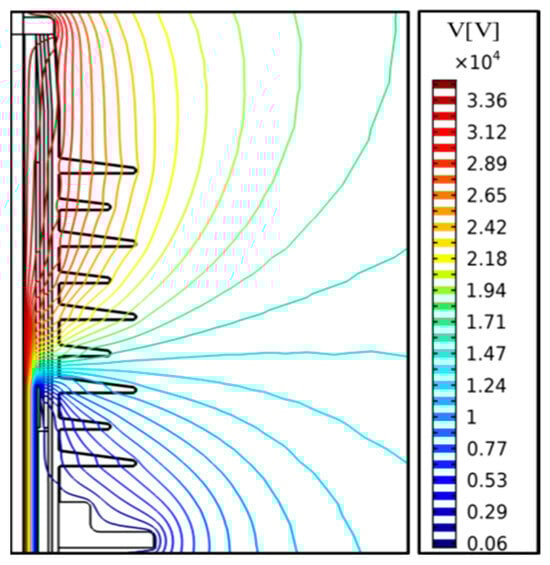
Figure 4.
Equipotential line diagram with a clean outer surface of the cable terminal.
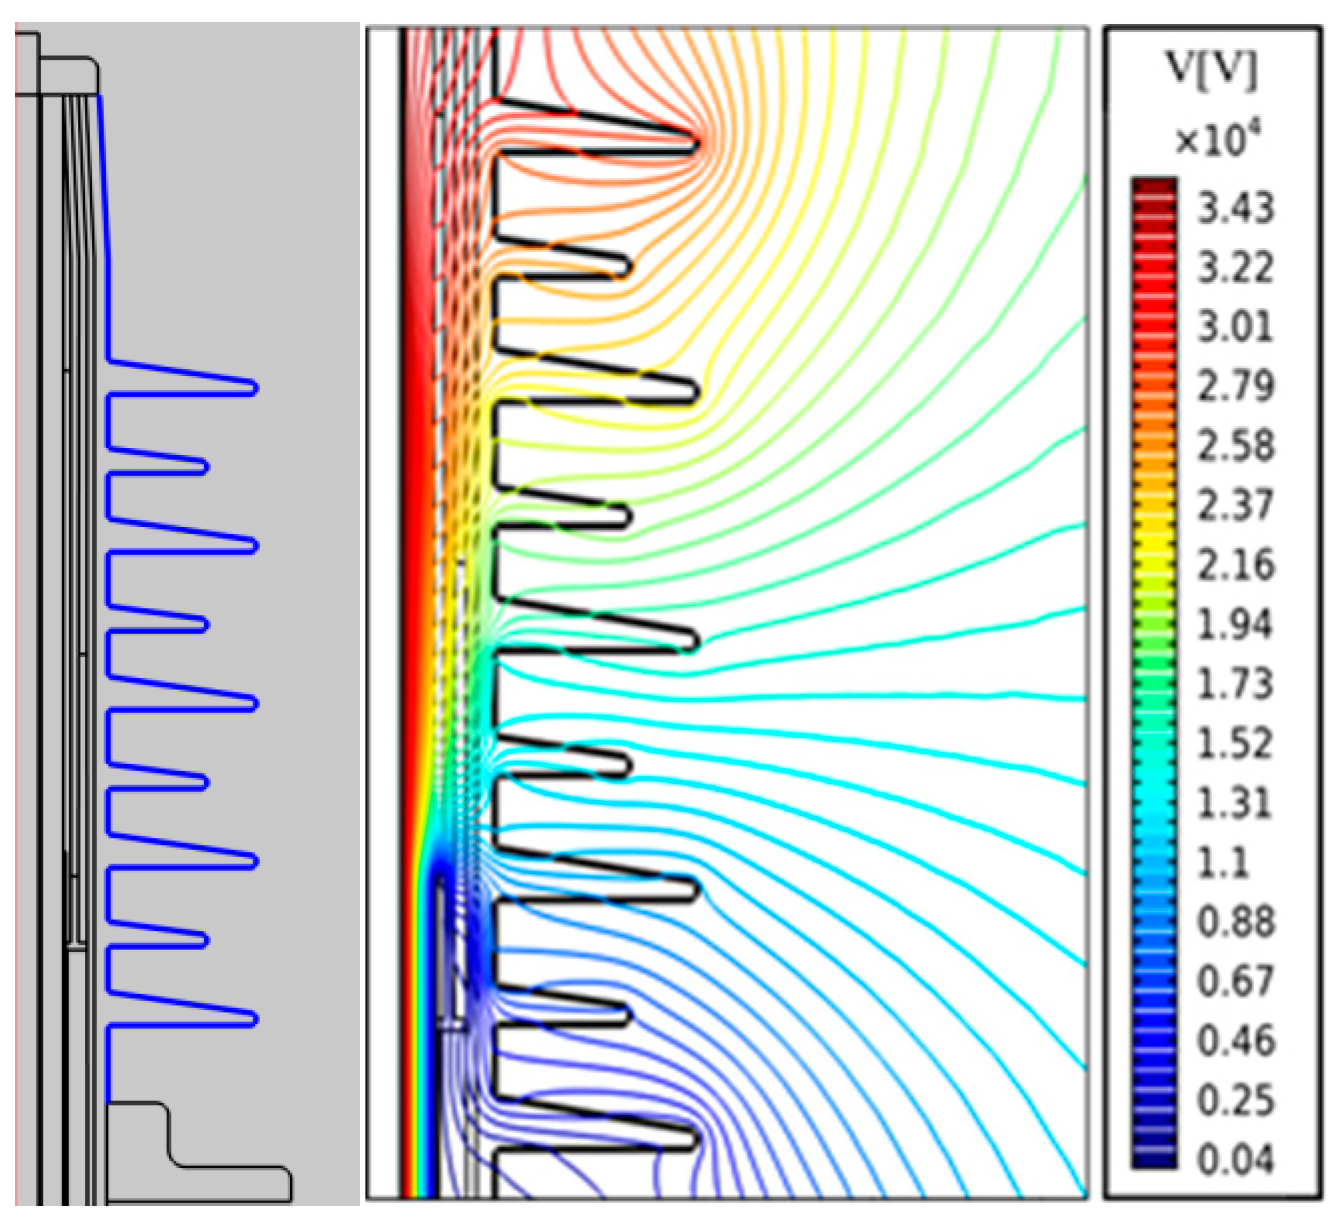
First, we apply uniformly wet dirt to the outer surface of the cable terminal. The wet pollution area’s conductivity is set to 0.6 s/m, the relative dielectric constant is set to 81 [28,29,30,31], and the wet dirt’s position is shown in Figure 5 (left). Figure 5 (right) shows the equipotential diagram when the outer surface of the cable terminal structure is uniformly wet and dirty.
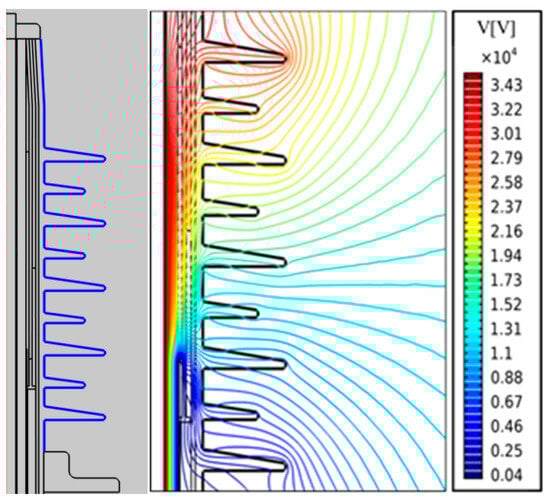
Figure 5.
Equipotential line diagram when the outer surface of the terminal is covered by evenly distributed wet dirt.
It can be seen that the potential distribution of the cable terminal changes greatly due to the existence of external wet contamination. For example, in the first umbrella skirt, when the outer surface is clean, the equipotential line of the umbrella skirt is almost parallel to the axial direction, and the potential distribution decreases from the root of the umbrella skirt to the top of the umbrella skirt. When the outer surface is uniformly wet, the equipotential line inside the first umbrella skirt is almost parallel to the axial direction, and the potential decreases from the upper surface of the umbrella skirt to the lower surface of the umbrella skirt. The reason for this phenomenon is that when there is no pollution, the potential distribution of the cable terminal structure is mainly determined by the equivalent capacitance. Because the cable core has the highest potential, the farther away the measurement point is from the cable core, the lower the potential. Therefore, when there is no pollution, the potential distribution inside the first umbrella skirt is distributed along a radial direction. When there is uniform pollution on the outer surface of the cable terminal, the electric field distribution outside the cable terminal is mainly determined by the wet pollution resistance. Since the highest potential on the outer surface can be found in the upper fittings and cable core, the farther away they are from the upper fittings and cable core, the lower the potential. In addition, at the top of the first umbrella skirt, due to its small radius of curvature, the potential line is relatively dense in uniform wet pollution, so the electric field here is very high.
3.2. Electric Field Distribution of a Cable Termination–Sheath Structure Without External Moisture Contamination
3.2.1. No Air Gaps Are Present Between Cable Terminals and Jackets, with No Interfacial Moisture Contamination
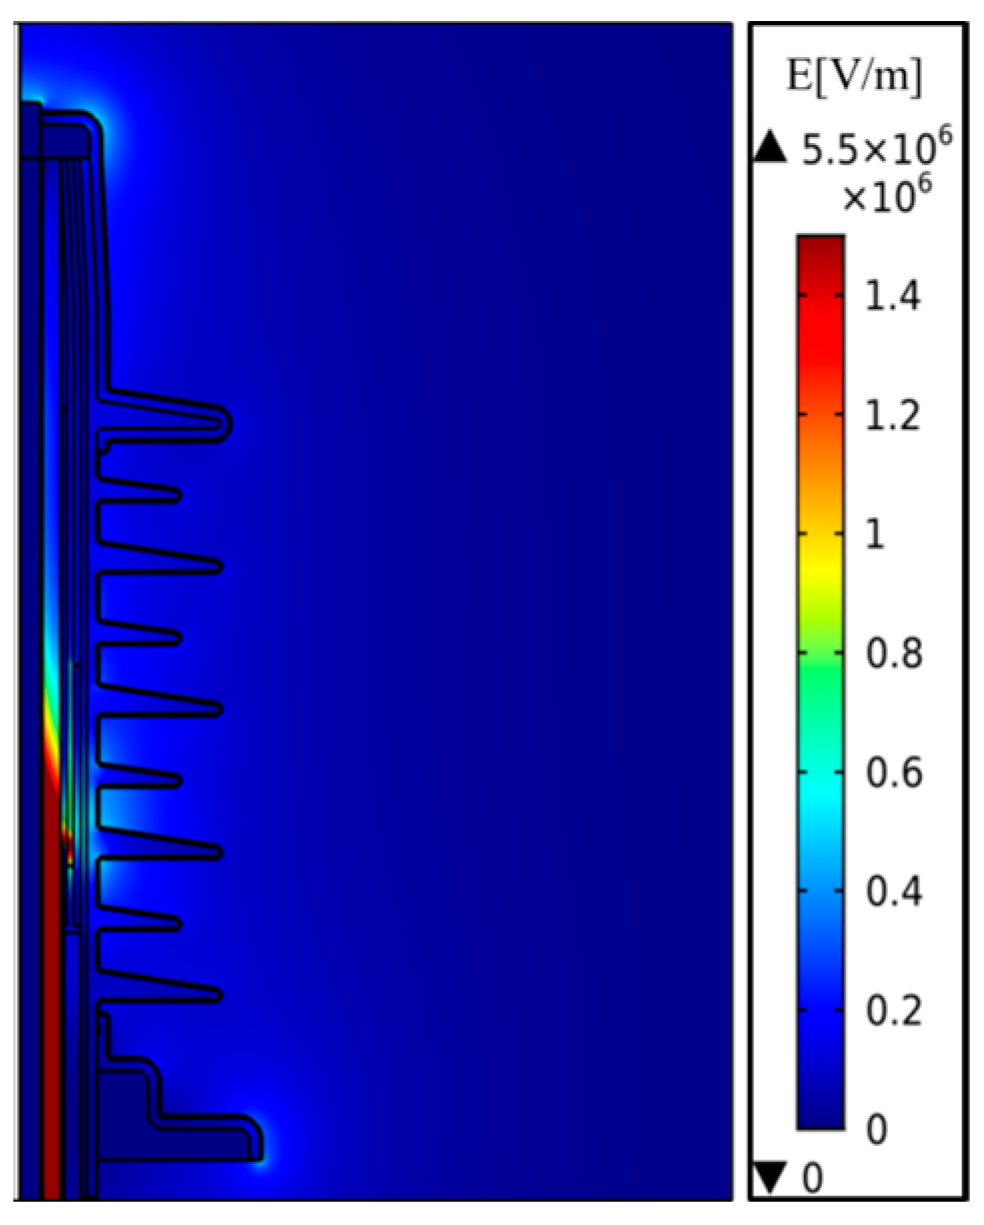
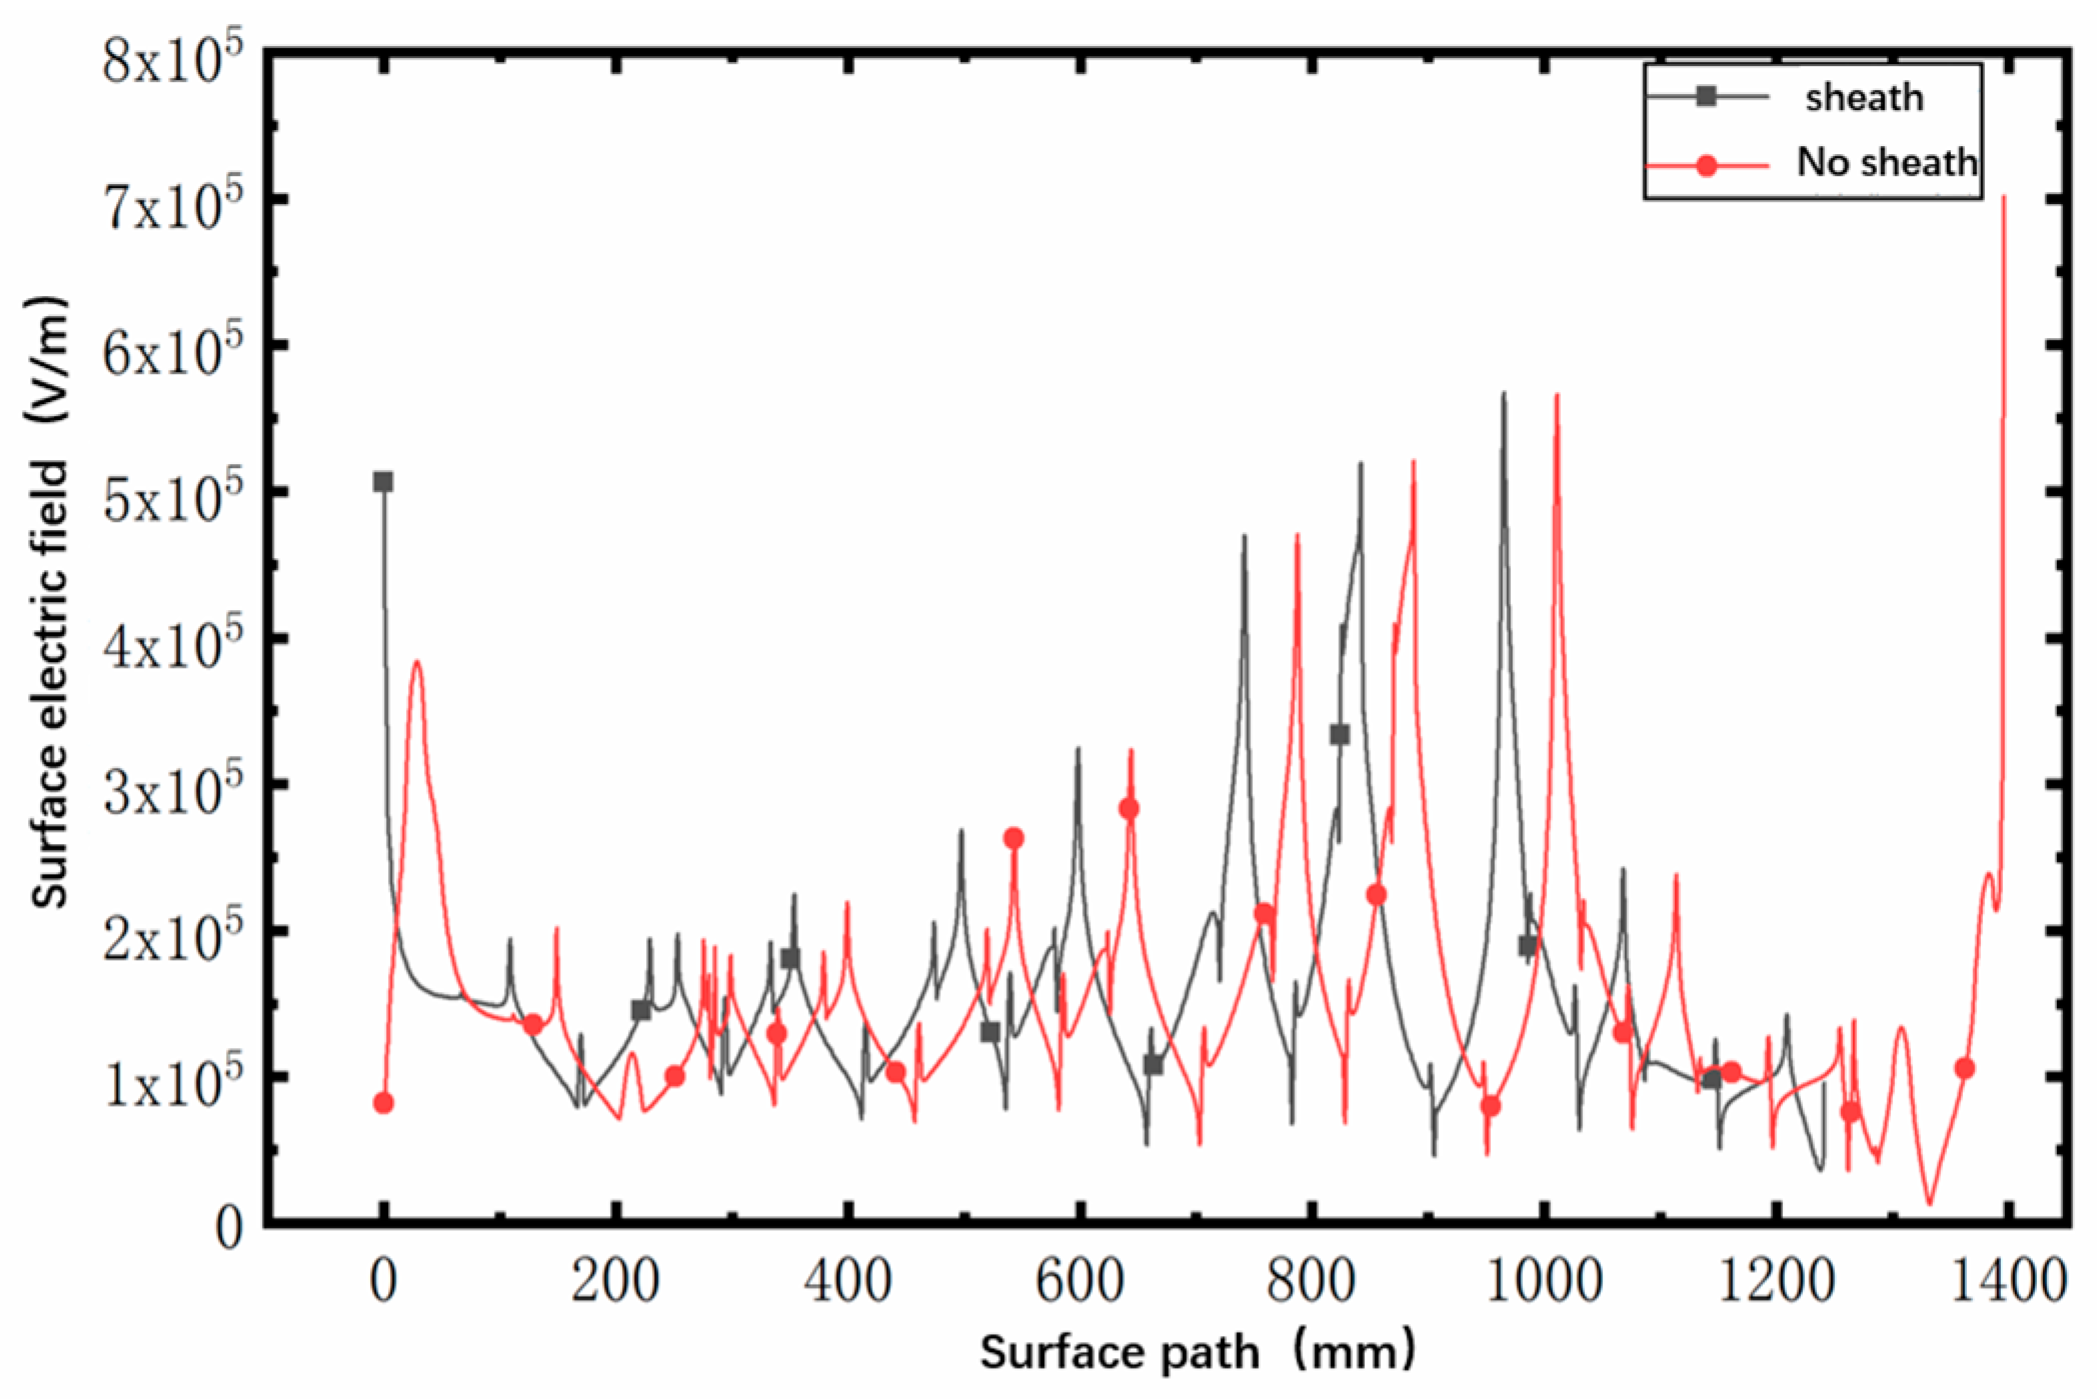
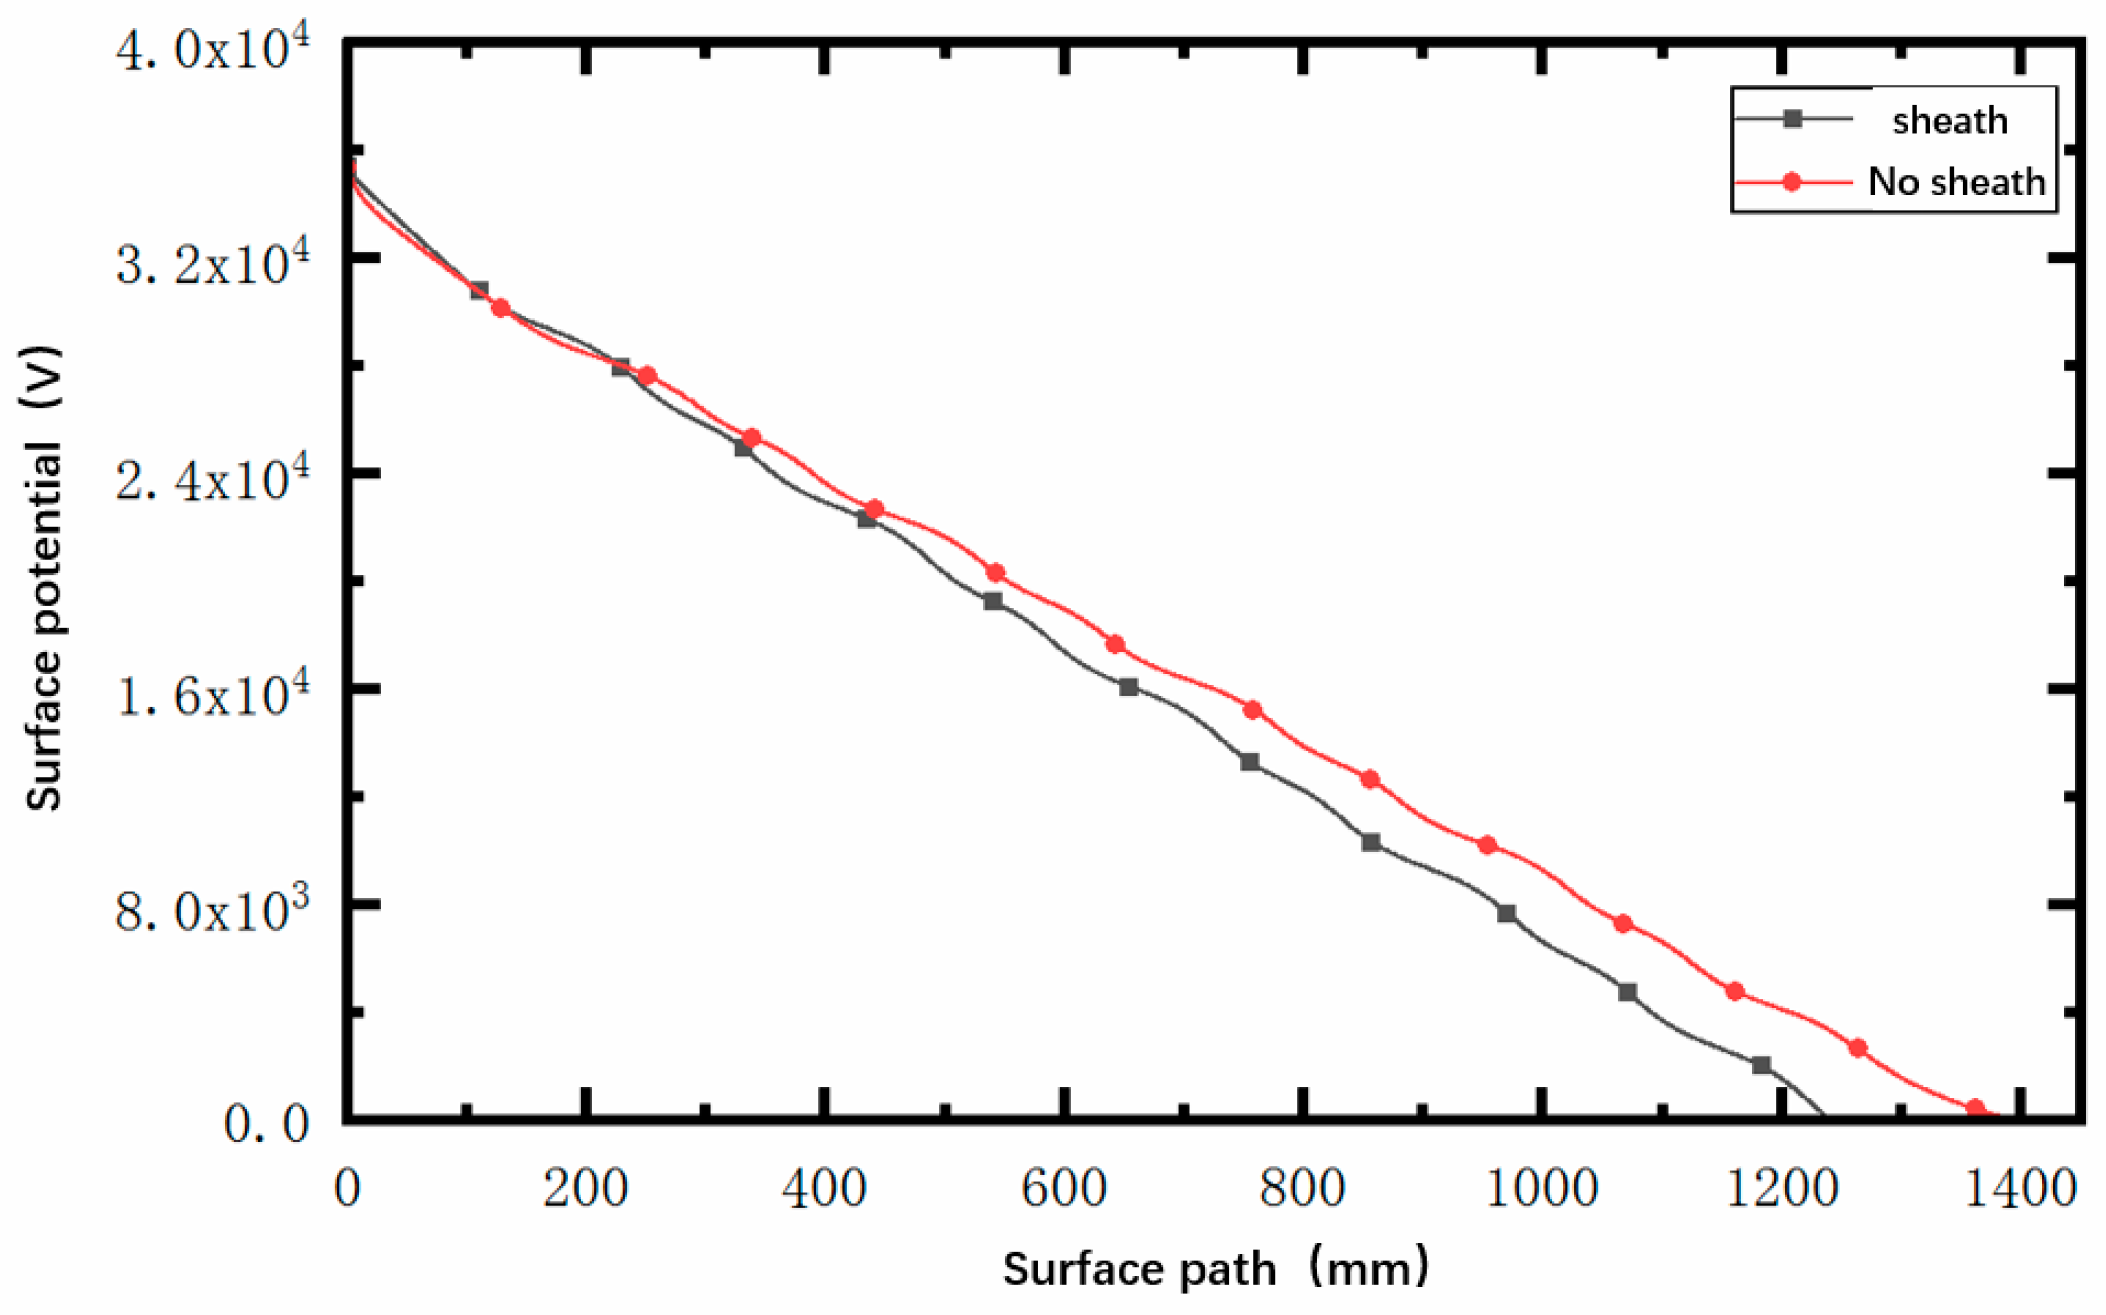
The inner surface of a well-installed insulating sheath structure should fit well with the umbrella skirt column and metal flange of the cable terminal, and there should be no wet dirt and air gap defects on its interface. Here, the electric field was simulated when an insulating sheath was installed on the upper and lower fittings of the cable terminal. Figure 6 shows the electric field cloud diagram when the outer surface of the cable terminal sheath structure is free of dirt, and Figure 7 shows the distribution diagram of the electric field along the surface with and without a sheath, respectively. It can be seen that under the conditions of no pollution on the outer surface, the electric field distribution of the cable terminal after installing the sheath is basically not very different from that without the sheath, and the voltage distributed on the sheath is very small. With the insulating sheath, the leakage current mainly flows through the lower flange through the insulating sheath. At this point, the leakage current is mainly a capacitive current, and at this time, the presence or absence of the sheath will not affect the electric field on the surface of the cable terminal.
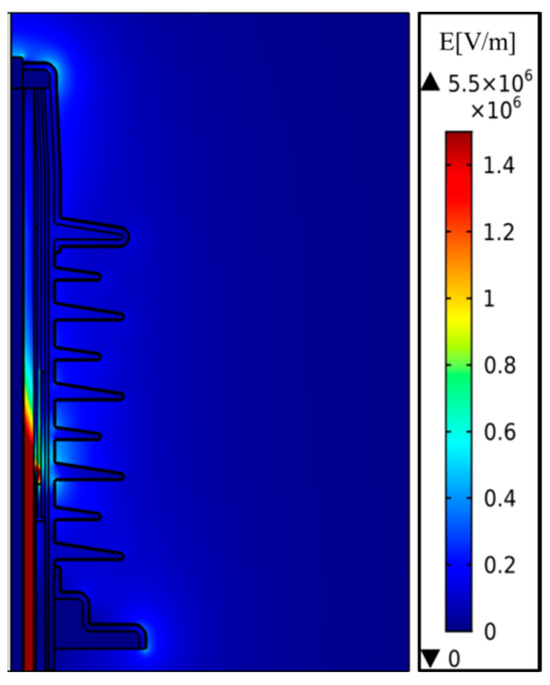
Figure 6.
Electric field cloud diagram with a clean outer surface on the sheathed terminal.
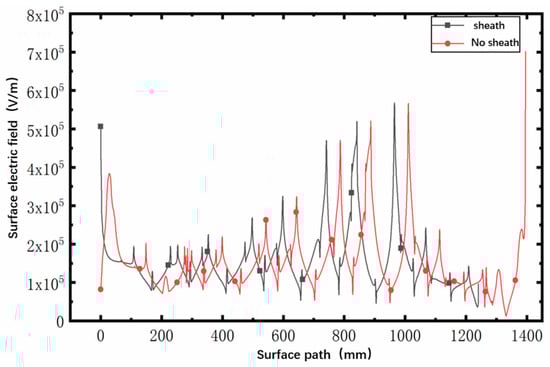
Figure 7.
The influence of the sheath on the creeping electric field with a clean outer surface on the terminal.
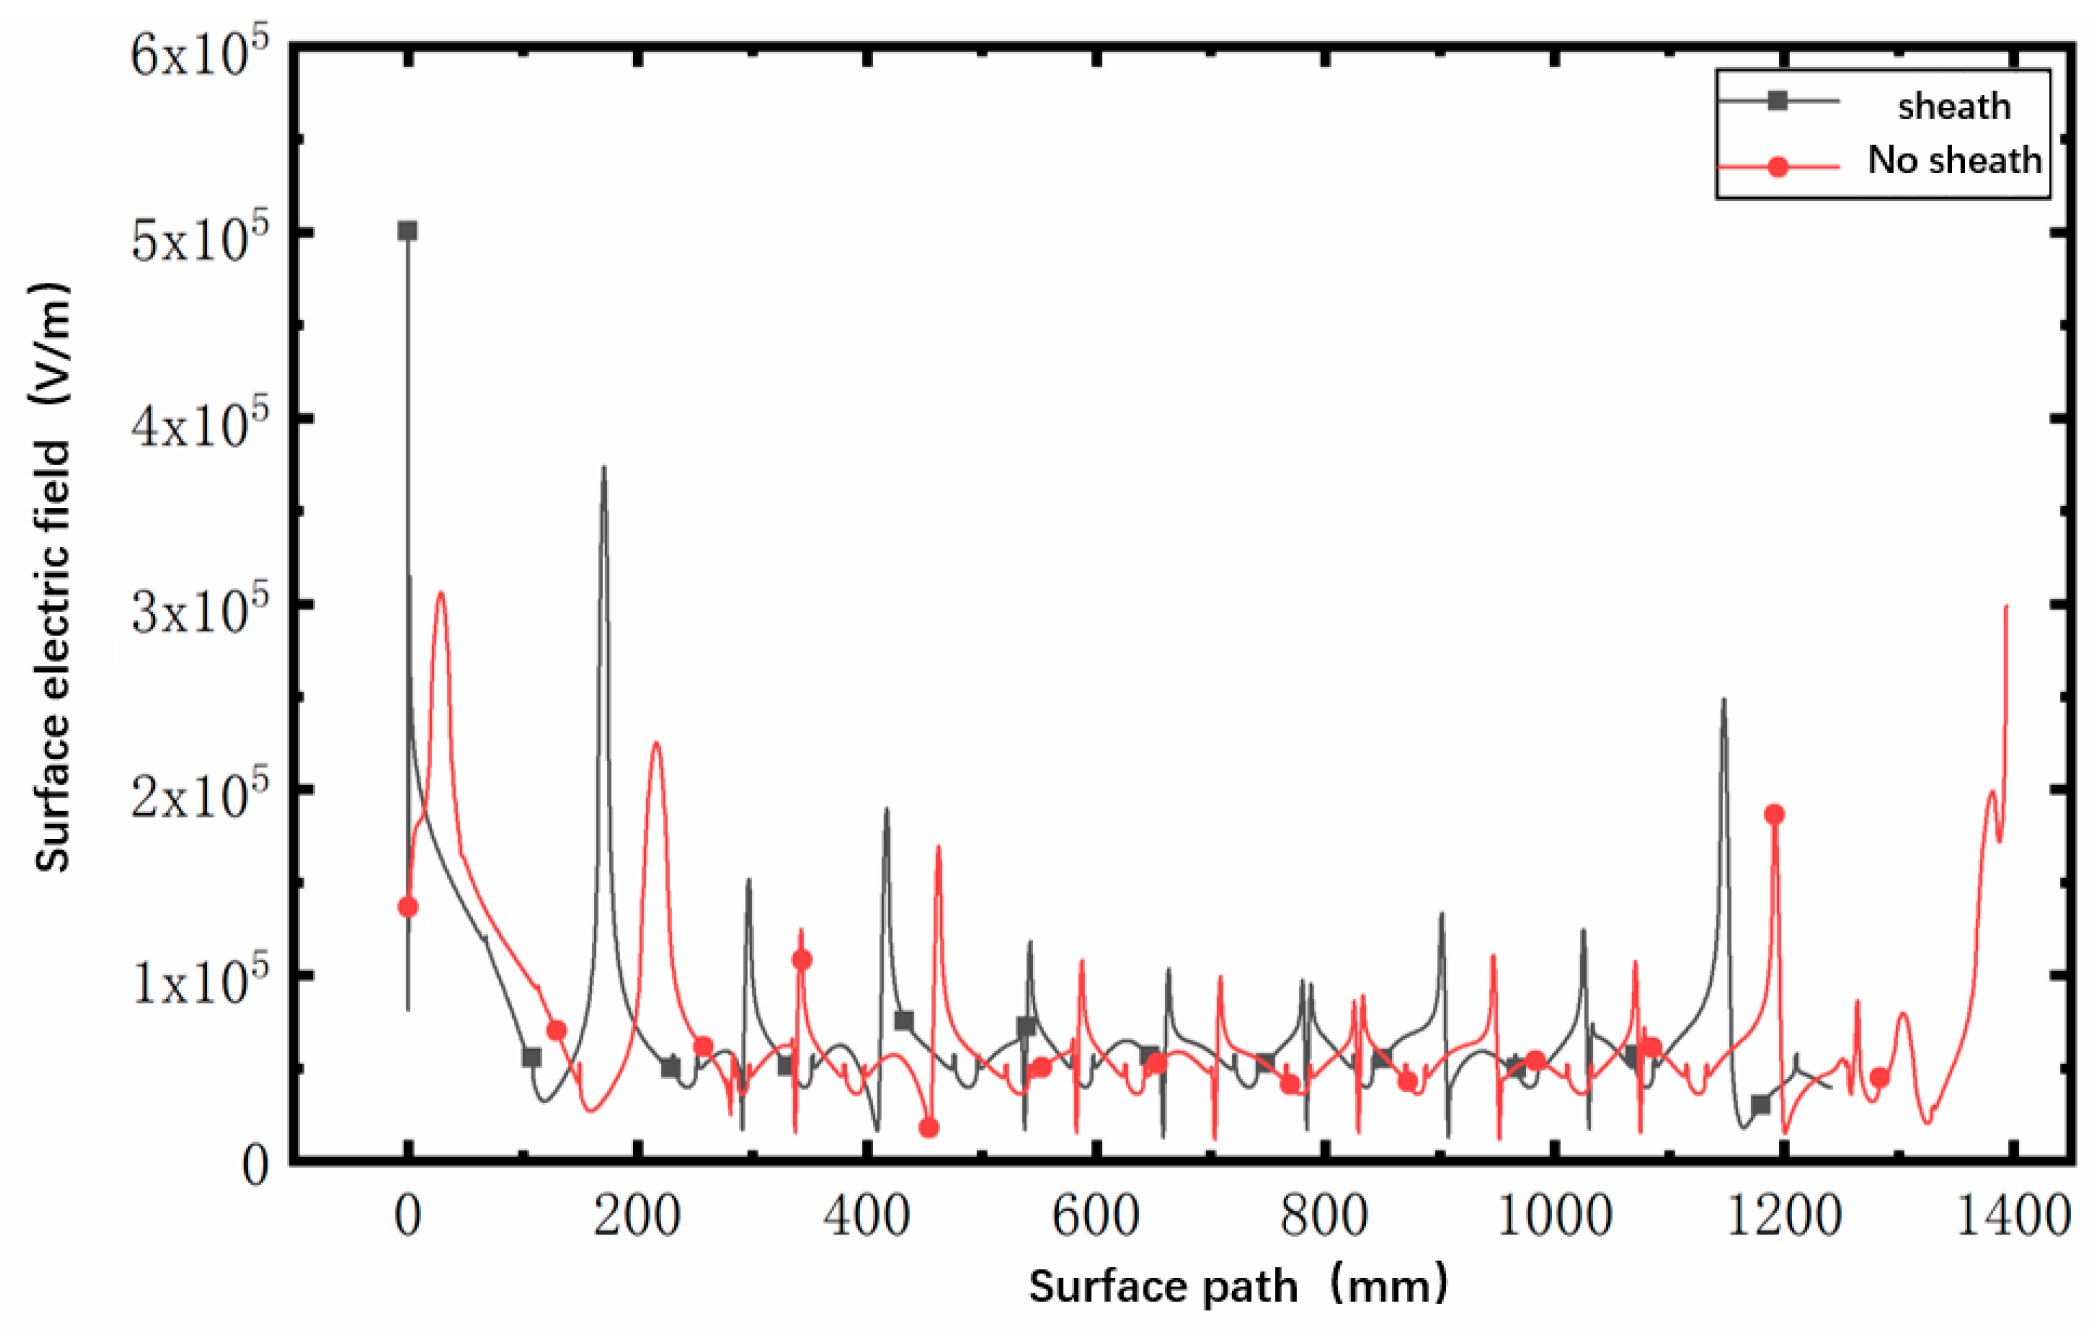
We installed a uniform pollution layer on the outer surface of the cable terminal–sheath structure, with the size of the pollution layer the same as that in Section 2.1, to analyze the potential and electric field under wet pollution conditions after installing the insulating sheath. As shown in Figure 8 and Figure 9, the potential diagram and electric field diagram along the outer surface of the pollution layer when the outer surface of the cable terminal sheath structure is uniformly wet. It can be seen that after the installation of the insulating sheath, due to the increase in surface leakage distance, the decline of surface potential slows down, and the electric field of the wet polluted surface decreases as a whole. Among the fields, the electric field at the top of the first umbrella skirt decreases the most, and the electric field at the root of each umbrella skirt decreases. This shows that the existence of a sheath can indeed reduce the probability of surface flashover at cable terminals.
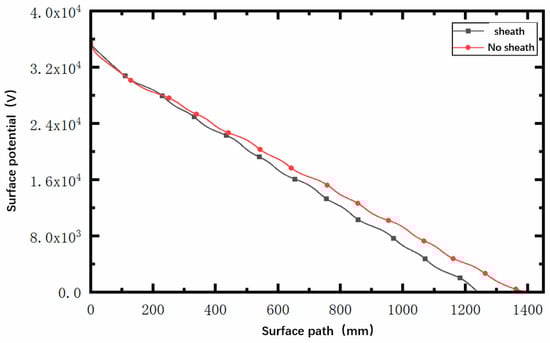
Figure 8.
The electric potential along the surface when the outer surface of the sheathed cable terminal is covered by evenly distributed wet dirt.
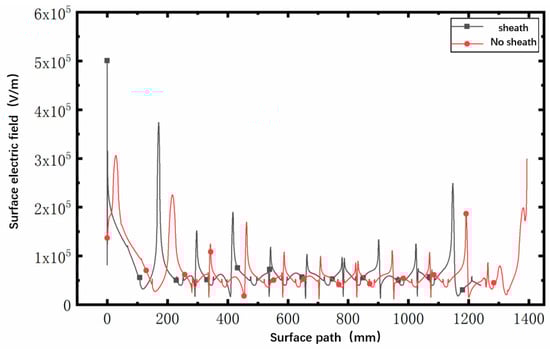
Figure 9.
The electric field along the surface when the outer surface of the sheathed cable terminal is covered by evenly distributed wet dirt.
3.2.2. Air Gap between the Cable Terminals and Sheath, with No Interfacial Wetting
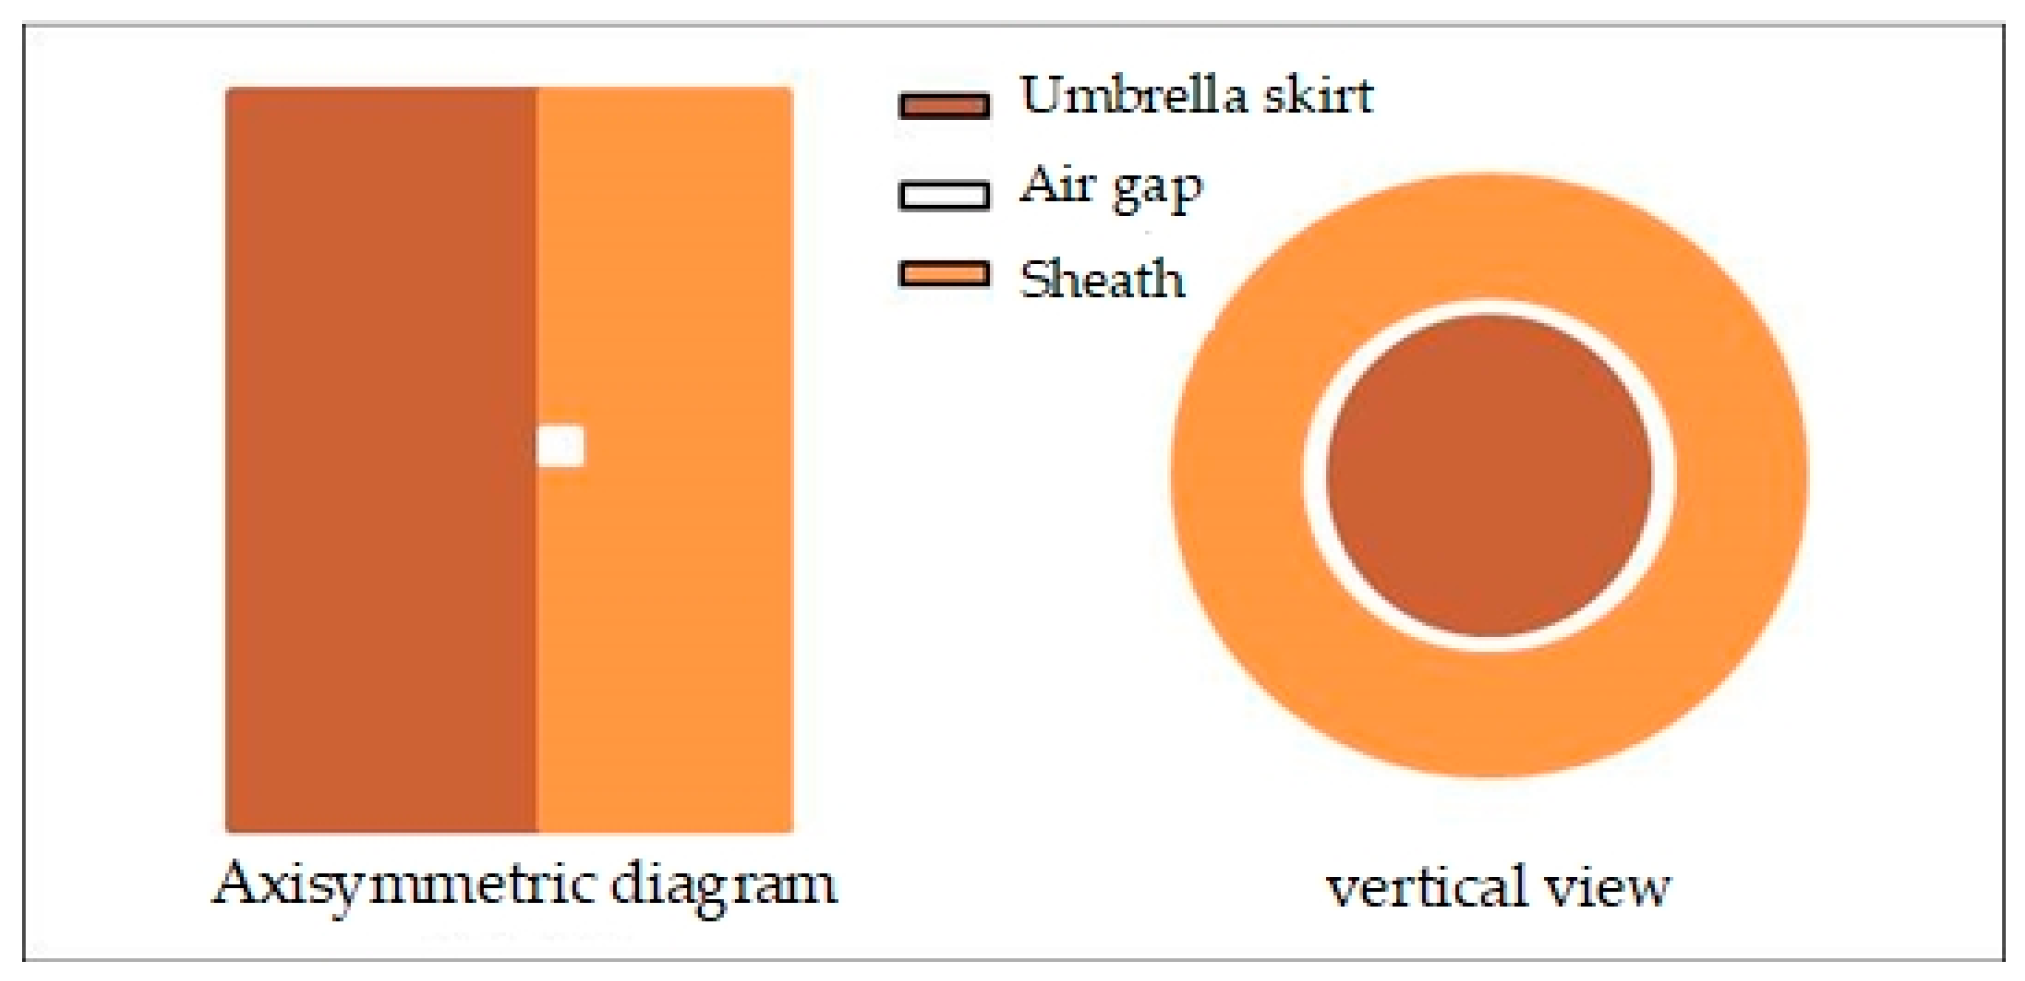
In order to facilitate the simulation calculation, the air gap model is simplified in this study, and the leakage current flowing through the interface is completely cut off by the air gap analyzed; that is, the radian of the air gap is 360°, as shown in Figure 10. The dark orange part represents the umbrella skirt column of the cable terminal, the light orange part represents the installed insulating sheath, and the white part represents the air gap defect. In this paper, the influence of different lengths of air gaps on the interface electric field and external surface electric field is analyzed when there is only an air gap at the interface between the insulating sheath and umbrella skirt column.
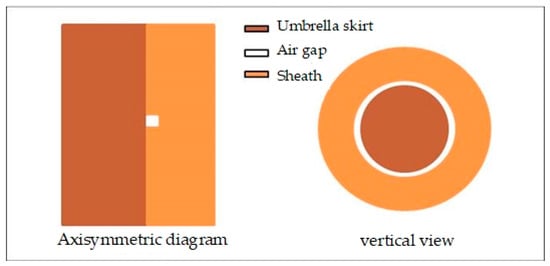
Figure 10.
The position of the air gap at the interface between the umbrella skirt column and the insulating sheath.
- (1)
- Effect of different air gap positions on electric field distribution in cable termination–sheath structures
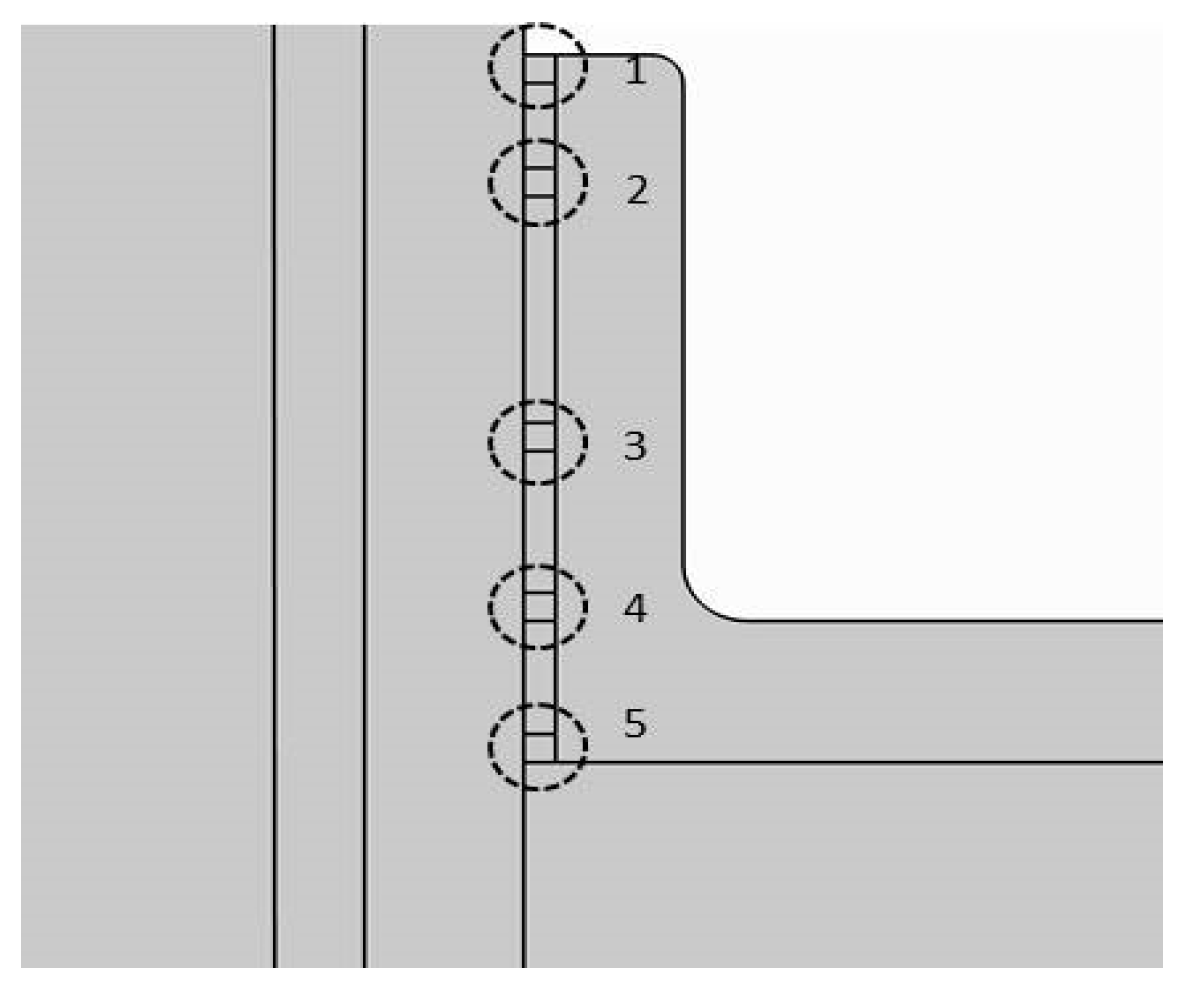
As shown in Figure 11, five air gaps with a thickness of 1 mm are set on the interface between the insulating sheath and the umbrella skirt column, with the numbers 1, 2, 3, 4, and 5 assigned from top to bottom. Among them, No. 1 air gap is set at the top of the insulating sheath, and No. 5 air gap is set at the three junction points of the intersection of the insulating sheath, umbrella skirt column, and lower flange. The length and thickness of the air gap remain unchanged at 1 mm. We only changed the position of the air gap to study its influence on the interface electric field and the electric field along the outer surface.
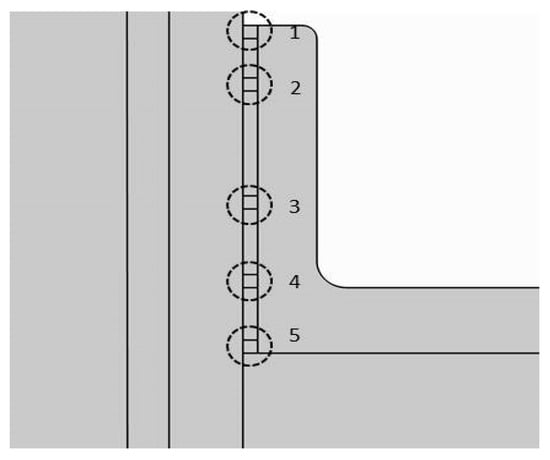
Figure 11.
Diagram of air gap position distribution.
The frequency domain electric field simulation when there is no air gap at the sub-interface, No. 1 air gap at the interface, No. 2 air gap, No. 3 air gap, No. 4 air gap, and No. 5 air gap at the effective value of 25 kV power frequency is then carried out, and the electric field cloud diagram of the insulating sheath and its vicinity is obtained, as shown in Figure 12. As can be seen from the figure, compared with the scenario without an air gap, the existence of an air gap distorts the electric field near the air gap. In addition, when the air gap is in position 1, the maximum electric field inside the air gap appears in the lower right corner of the air gap block; that is, the inner surface of the insulating sheath and its electric field strength is about 8 × 10⁴ V/m. When the air gap is at position 5, the maximum electric field inside the air gap appears in the lower left corner of the air gap block; that is, the outer surface of the umbrella skirt and its electric field intensity is also 8 × 10⁴ V/m. When the air gap is at positions 2, 3, and 4, the electric field distribution in the air gap is more uniform.
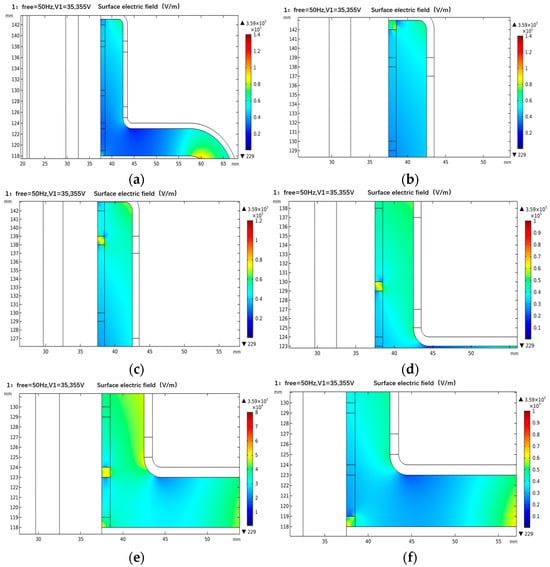
Figure 12.
The electric field cloud image on the interface when the air gap position is different. (a) No air gap; (b) air gap position 1; (c) air gap position 2; (d) air gap position 3; (e) air gap position 4; (f) air gap position 5.
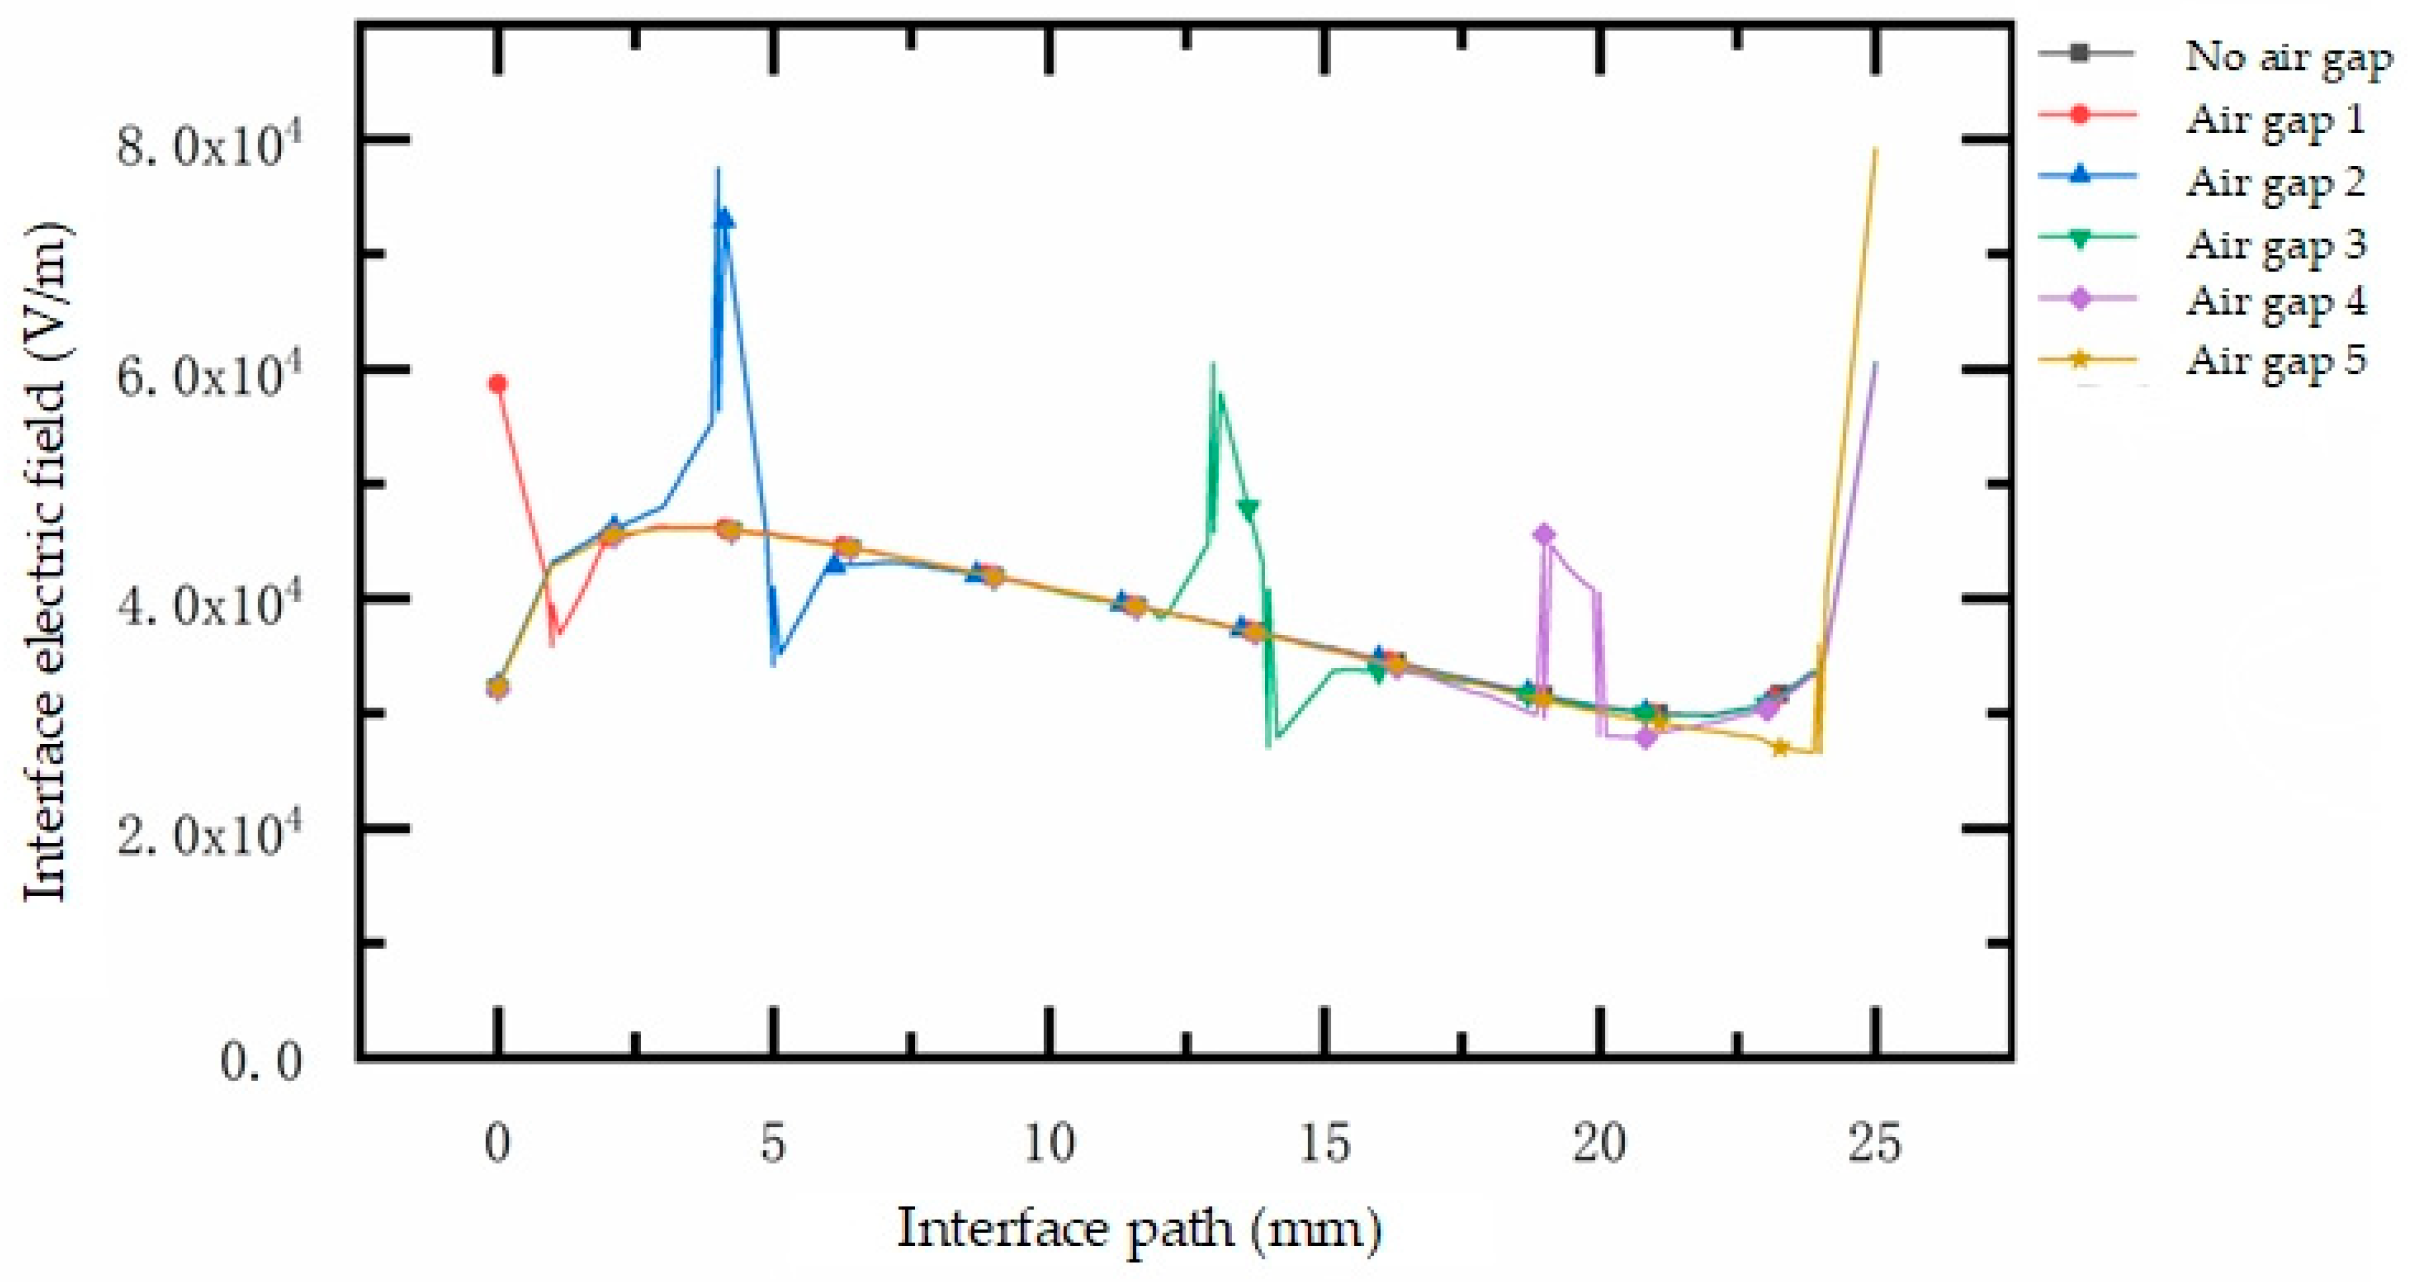
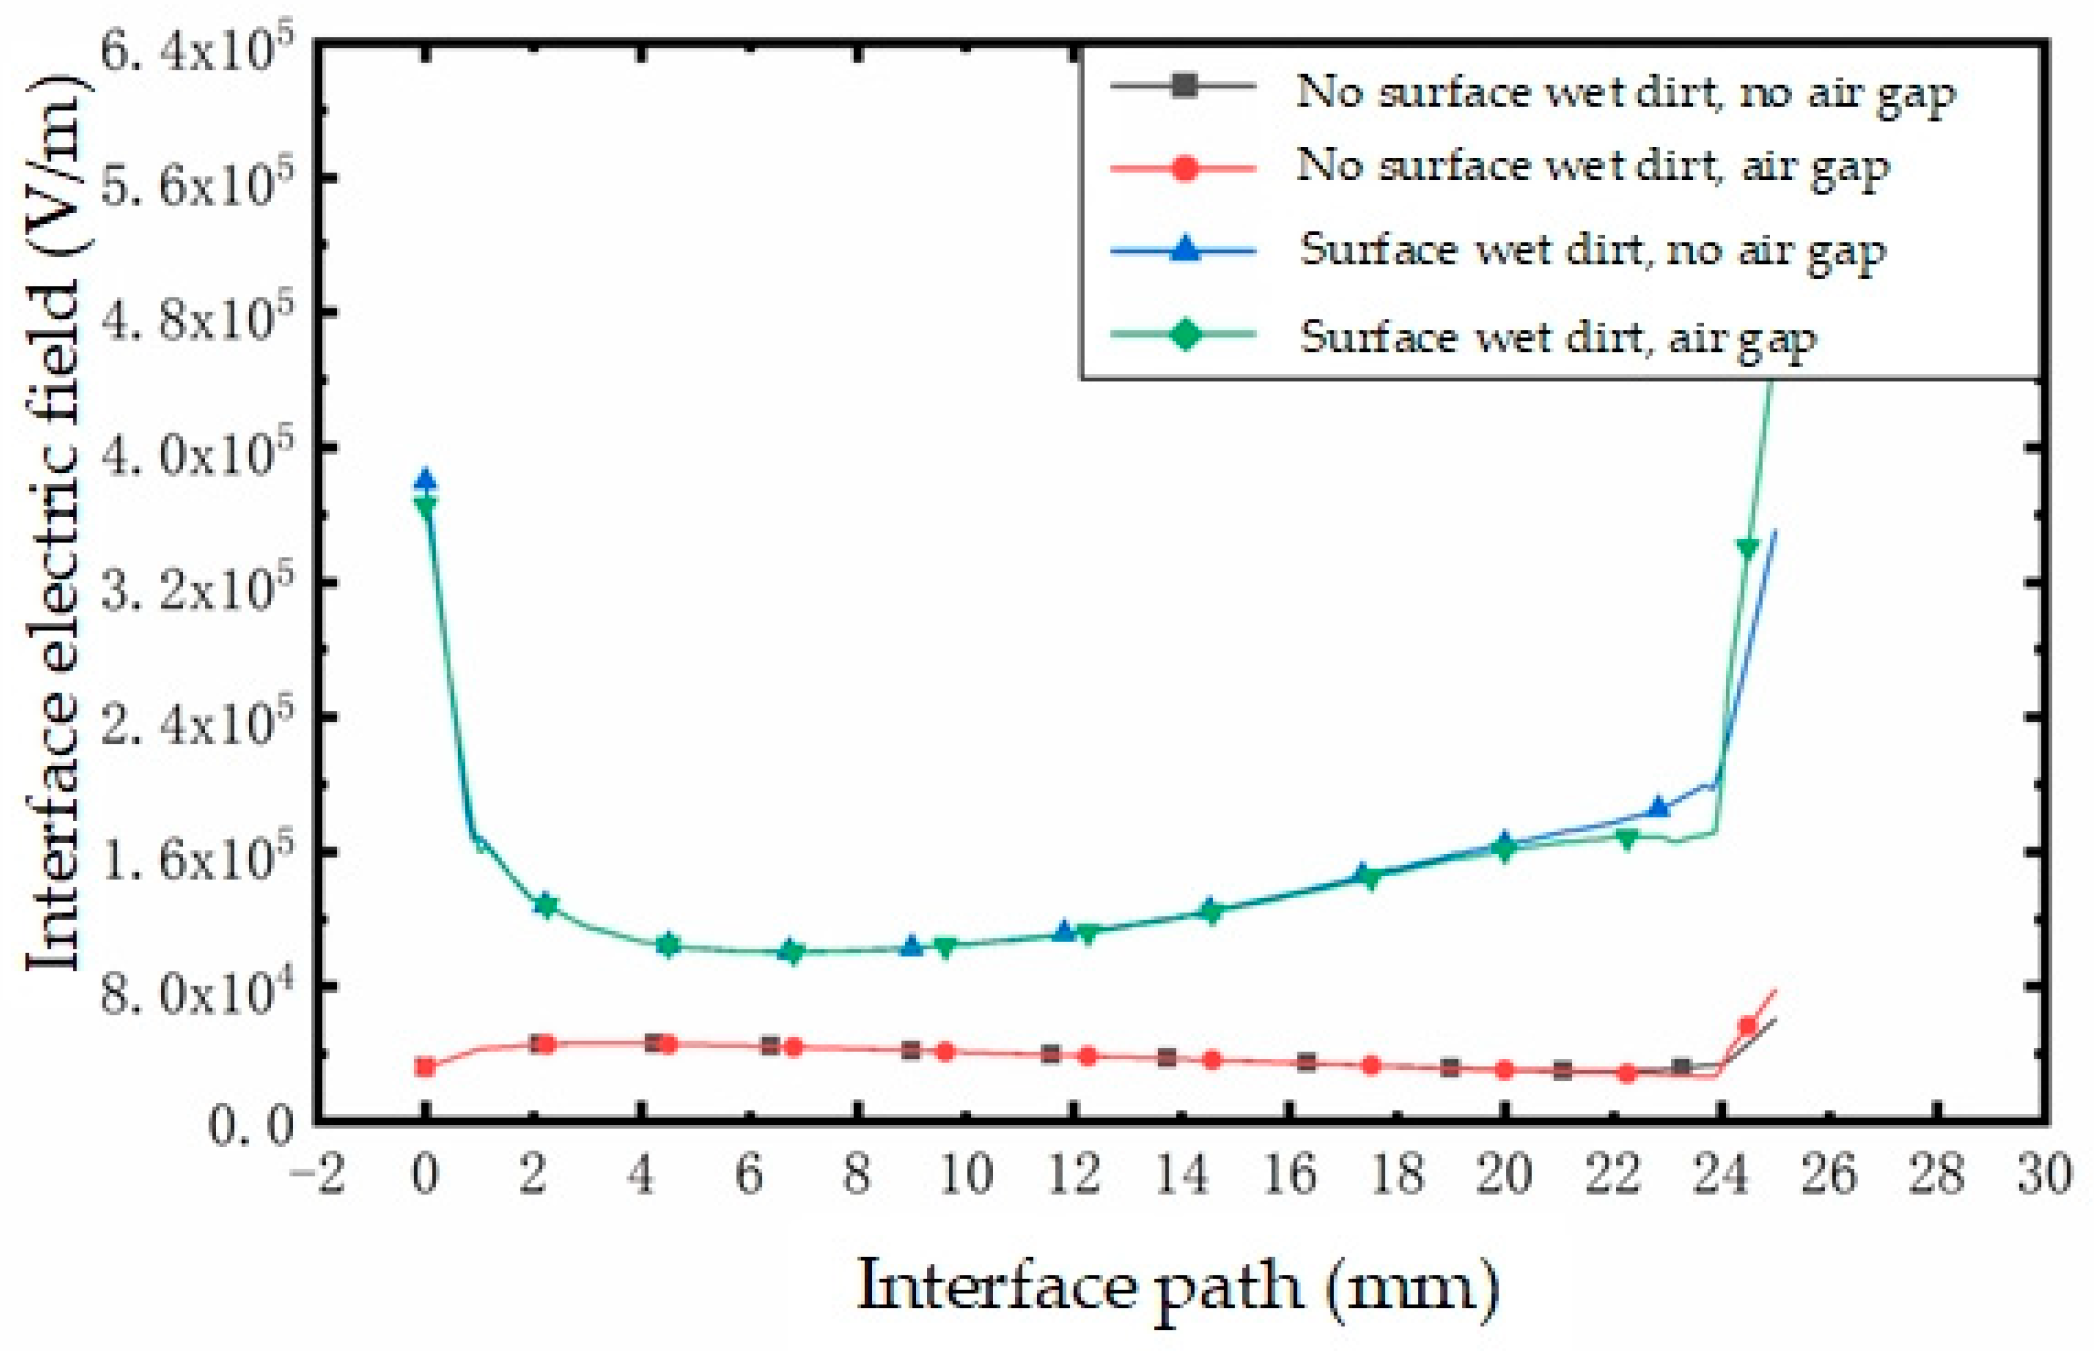
Figure 13 shows the electric field distribution diagram on the interface between the sheath and the umbrella skirt column. From the figure, we can intuitively see the distortion of the air gap and the electric field at the interface. Compared with the position without an air gap, the electric field seen at the same position with an air gap is about 1.7 times that without an air gap. Among the fields, when the air gap is at position 2 and position 5, the maximum electric field at the interface is about 8 × 10⁴ V/m, which is far less than the breakdown field strength of the air gap of 3 × 10⁶ V/m. It can be seen that under normal working voltage, there is no dirt on the outer surface of the cable terminal, and the water vapor does not penetrate the inner surface of the insulating sheath. Even when there is an air gap at the interface, this does not lead to partial discharges within the air gap.
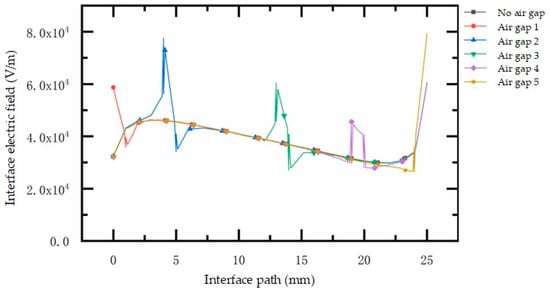
Figure 13.
The influence of different air gap positions on the interface electric field.
- (2)
- Effect of different air gap lengths on electric field distribution in cable termination–sheath structures
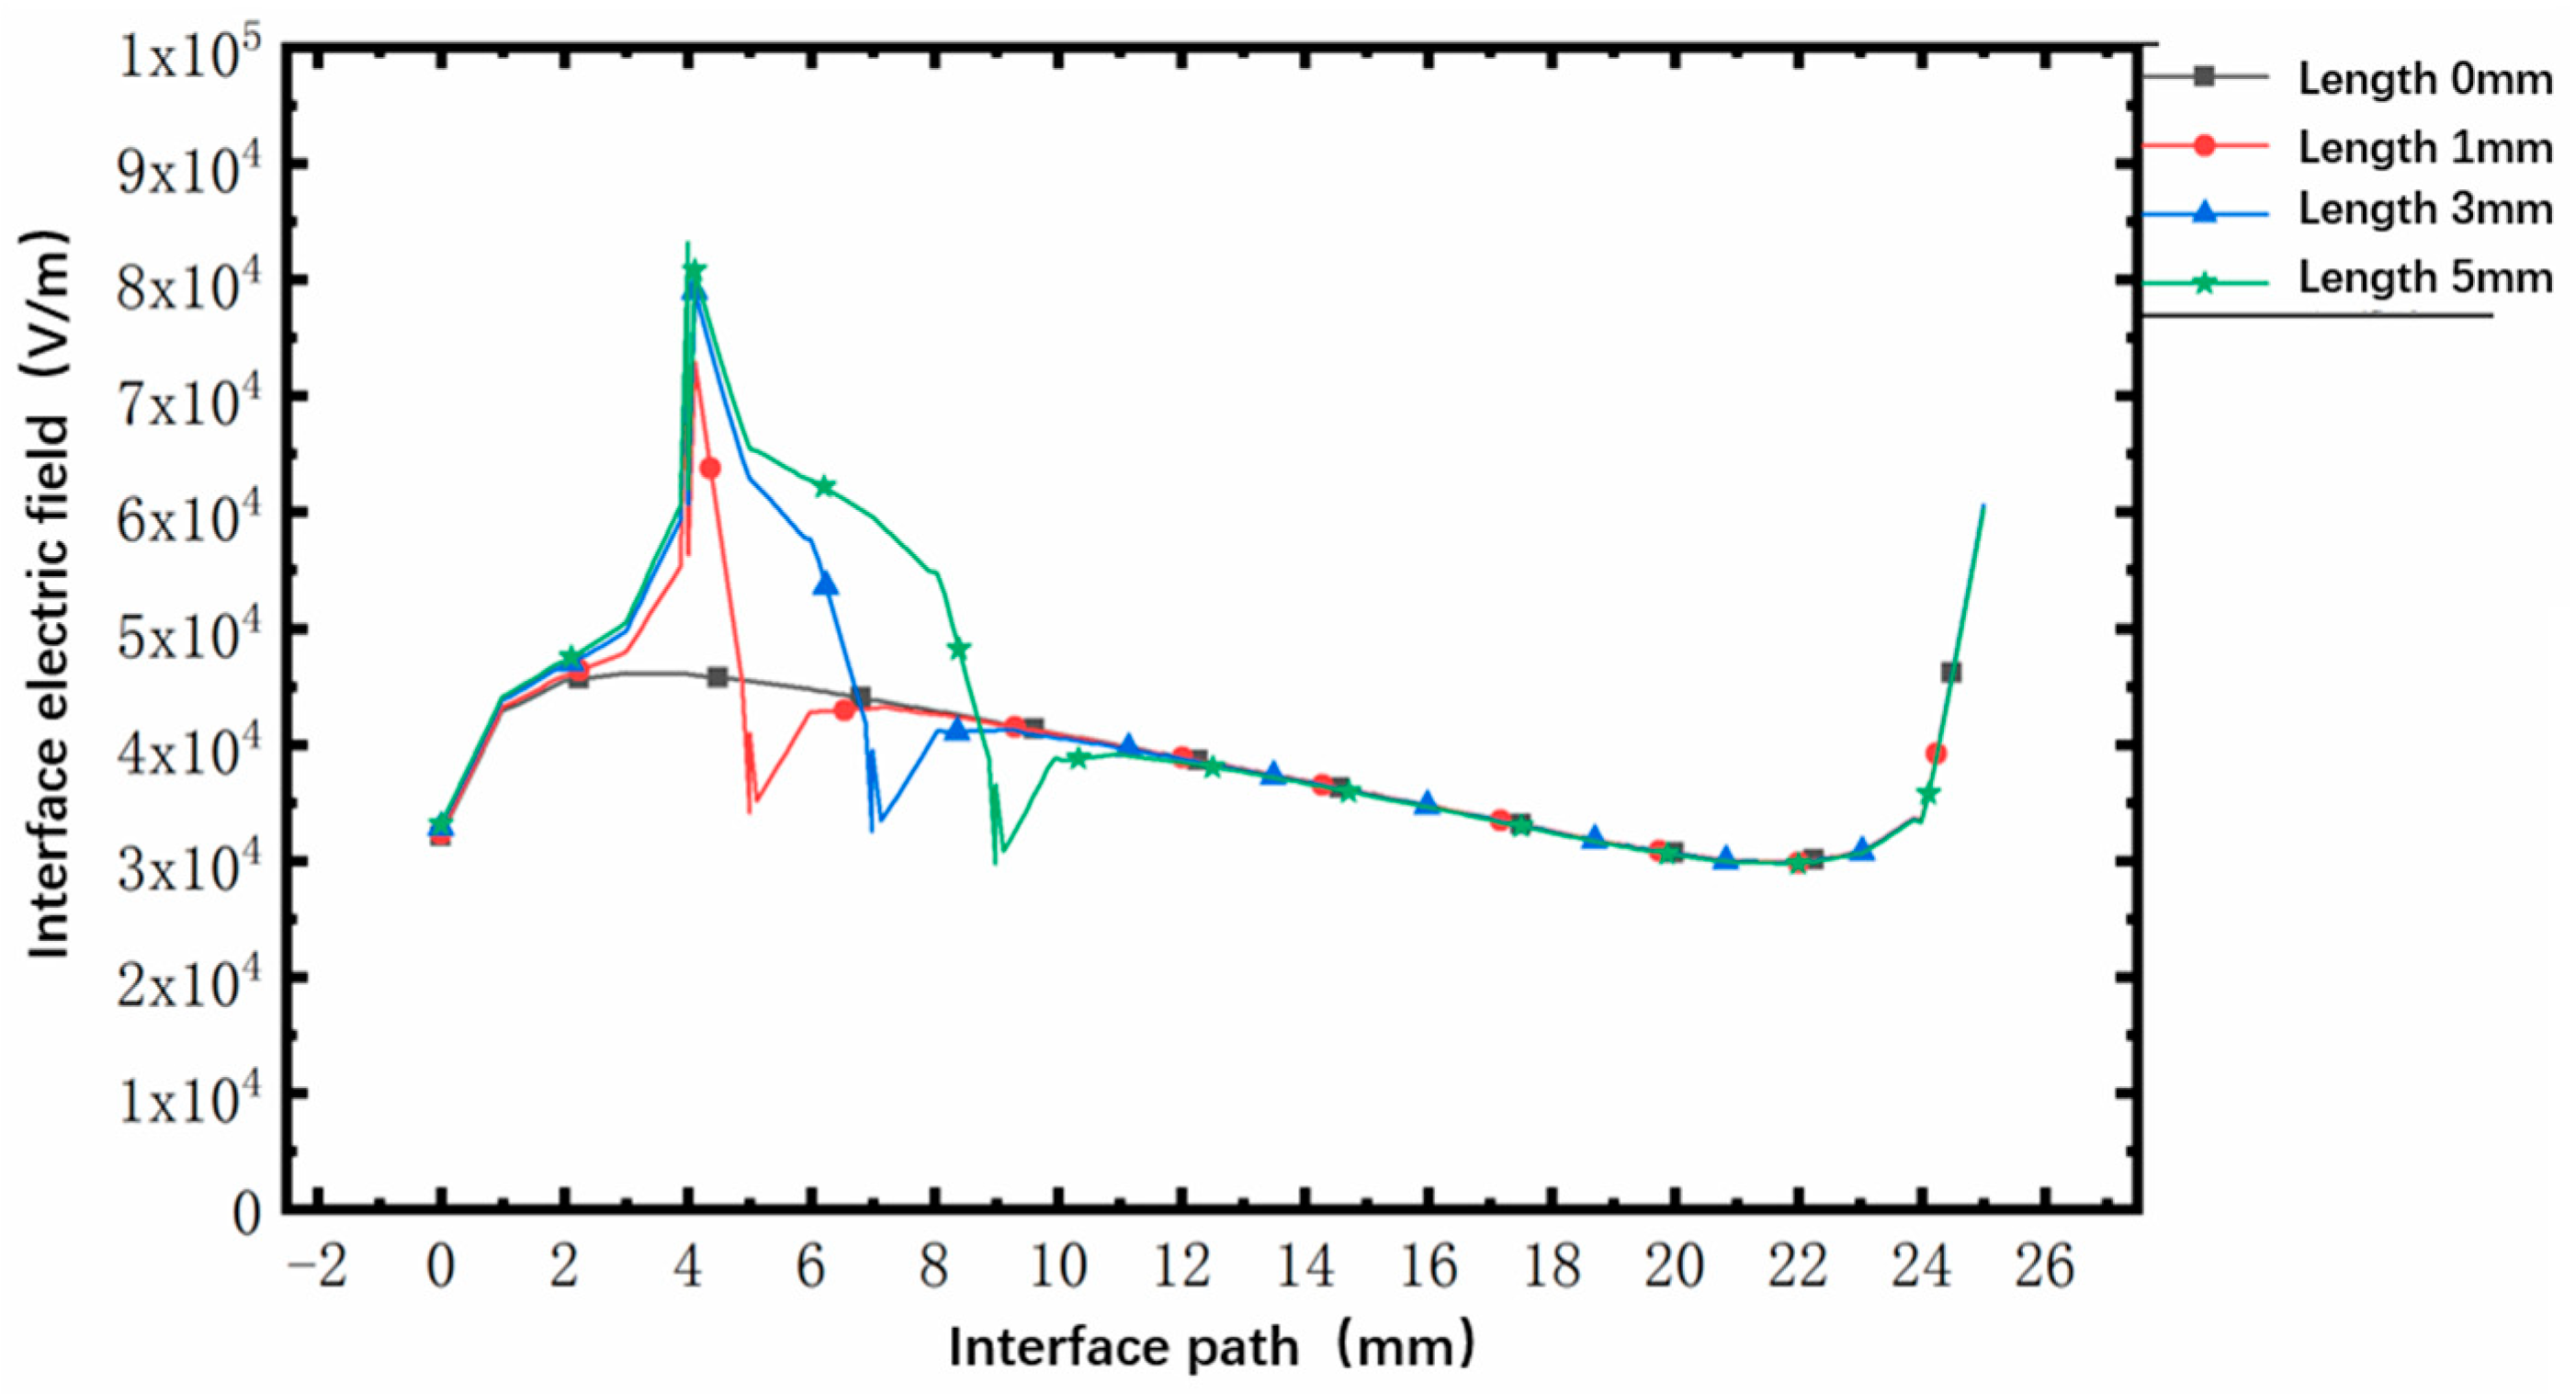
To fix the air gap at position 2, we keep the thickness of the air gap unchanged at 1 mm; the lengths of the air gaps are 1 mm, 3 mm, and 5 mm, respectively, to analyze the influence of different air gap lengths on the interface electric field. As shown in Figure 14, with the increase in air gap length, the maximum electric field and average electric field inside the air gap increase. When the air gap length is 1 mm, the maximum distorted electric field is 7 × 10⁴ V/m. When the air gap length is 3 mm, the maximum distorted electric field is 7.9 × 10⁴ V/m. When the air gap length is 5 mm, the maximum distorted electric field is 8.1 × 10⁴ V/m. It can be seen that with the increase in air gap length, the maximum electric field near the air gap gradually increases, but the increasing range gradually slows down. In general, the size of the air gap has little effect on the electric field distortion at the sub-interface. Therefore, in the subsequent simulation analysis, when considering the air gap on the interface, the length of the air gap is 1 mm, and the thickness of the air gap is 1 mm.
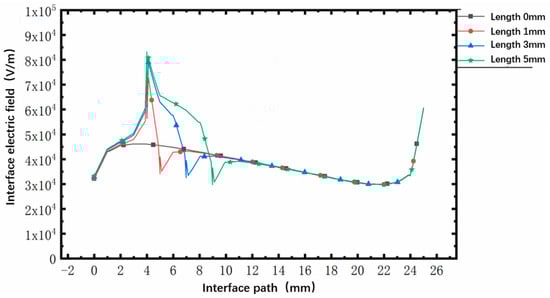
Figure 14.
The influence of the length of the air gap on the interface’s electric field.
3.2.3. The Interface between the Cable Terminal and the Sheath Is Wet, and There Is No Air Gap
Since the insulating sheath structure exhibits an open removable structure, the sealing part of the sheath easily develops poor adhesion, and external water vapor will enter the inner surface of the sheath along the gap. The existence of water vapor will greatly change the surface conductivity and dielectric constant at the interface. Therefore, it is necessary to consider the effect of wet contamination at the cable terminal–sheath interface on the electric field distribution that is found at the interface.
- (1)
- Effect of interfacial wet contamination at different locations on the electric field of cable termination–sheath structures
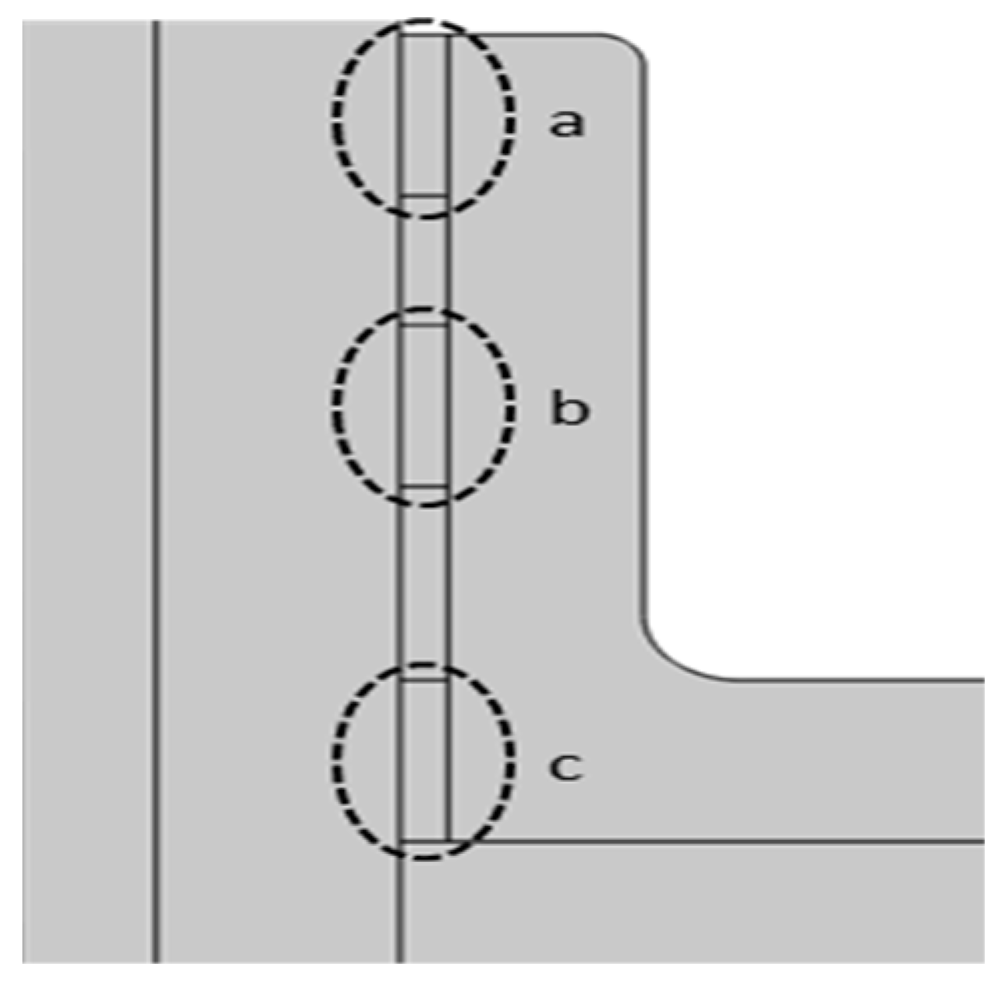
In this paper, the more serious situation is selected for the simulation. The internal wet pollution area is regarded as a layer of water-based film; its relative dielectric constant is set to 81 and the conductivity is set to 0.6 s/m. To ensure the generality of the simulation results, three internal wet pollution areas are set on the inner surface of the sheath, as shown in Figure 15. The internal wet pollution areas are numbered as a, b, and c from top to bottom. The length of the internal wet pollution area is set to 5 mm and the thickness of the internal wet pollution area is set to 1 mm. Position a, position b, and position c are set as the internal wet pollution area, and their influence on the interface’s electric field distribution is simulated.
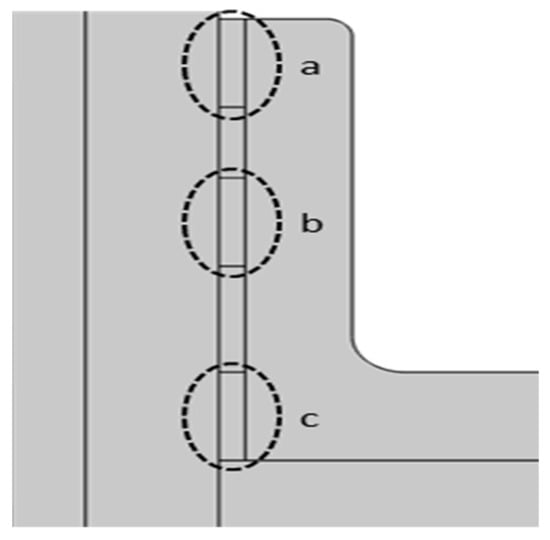
Figure 15.
Distribution diagram of the internal wet dirt. a is the upper internal wet stain on the inner surface of the sheath, b is the middle internal wet stain on the inner surface of the sheath, and c is the lower internal wet stain on the inner surface of the sheath. The dash circle is the setting range of the inner wet dirt.
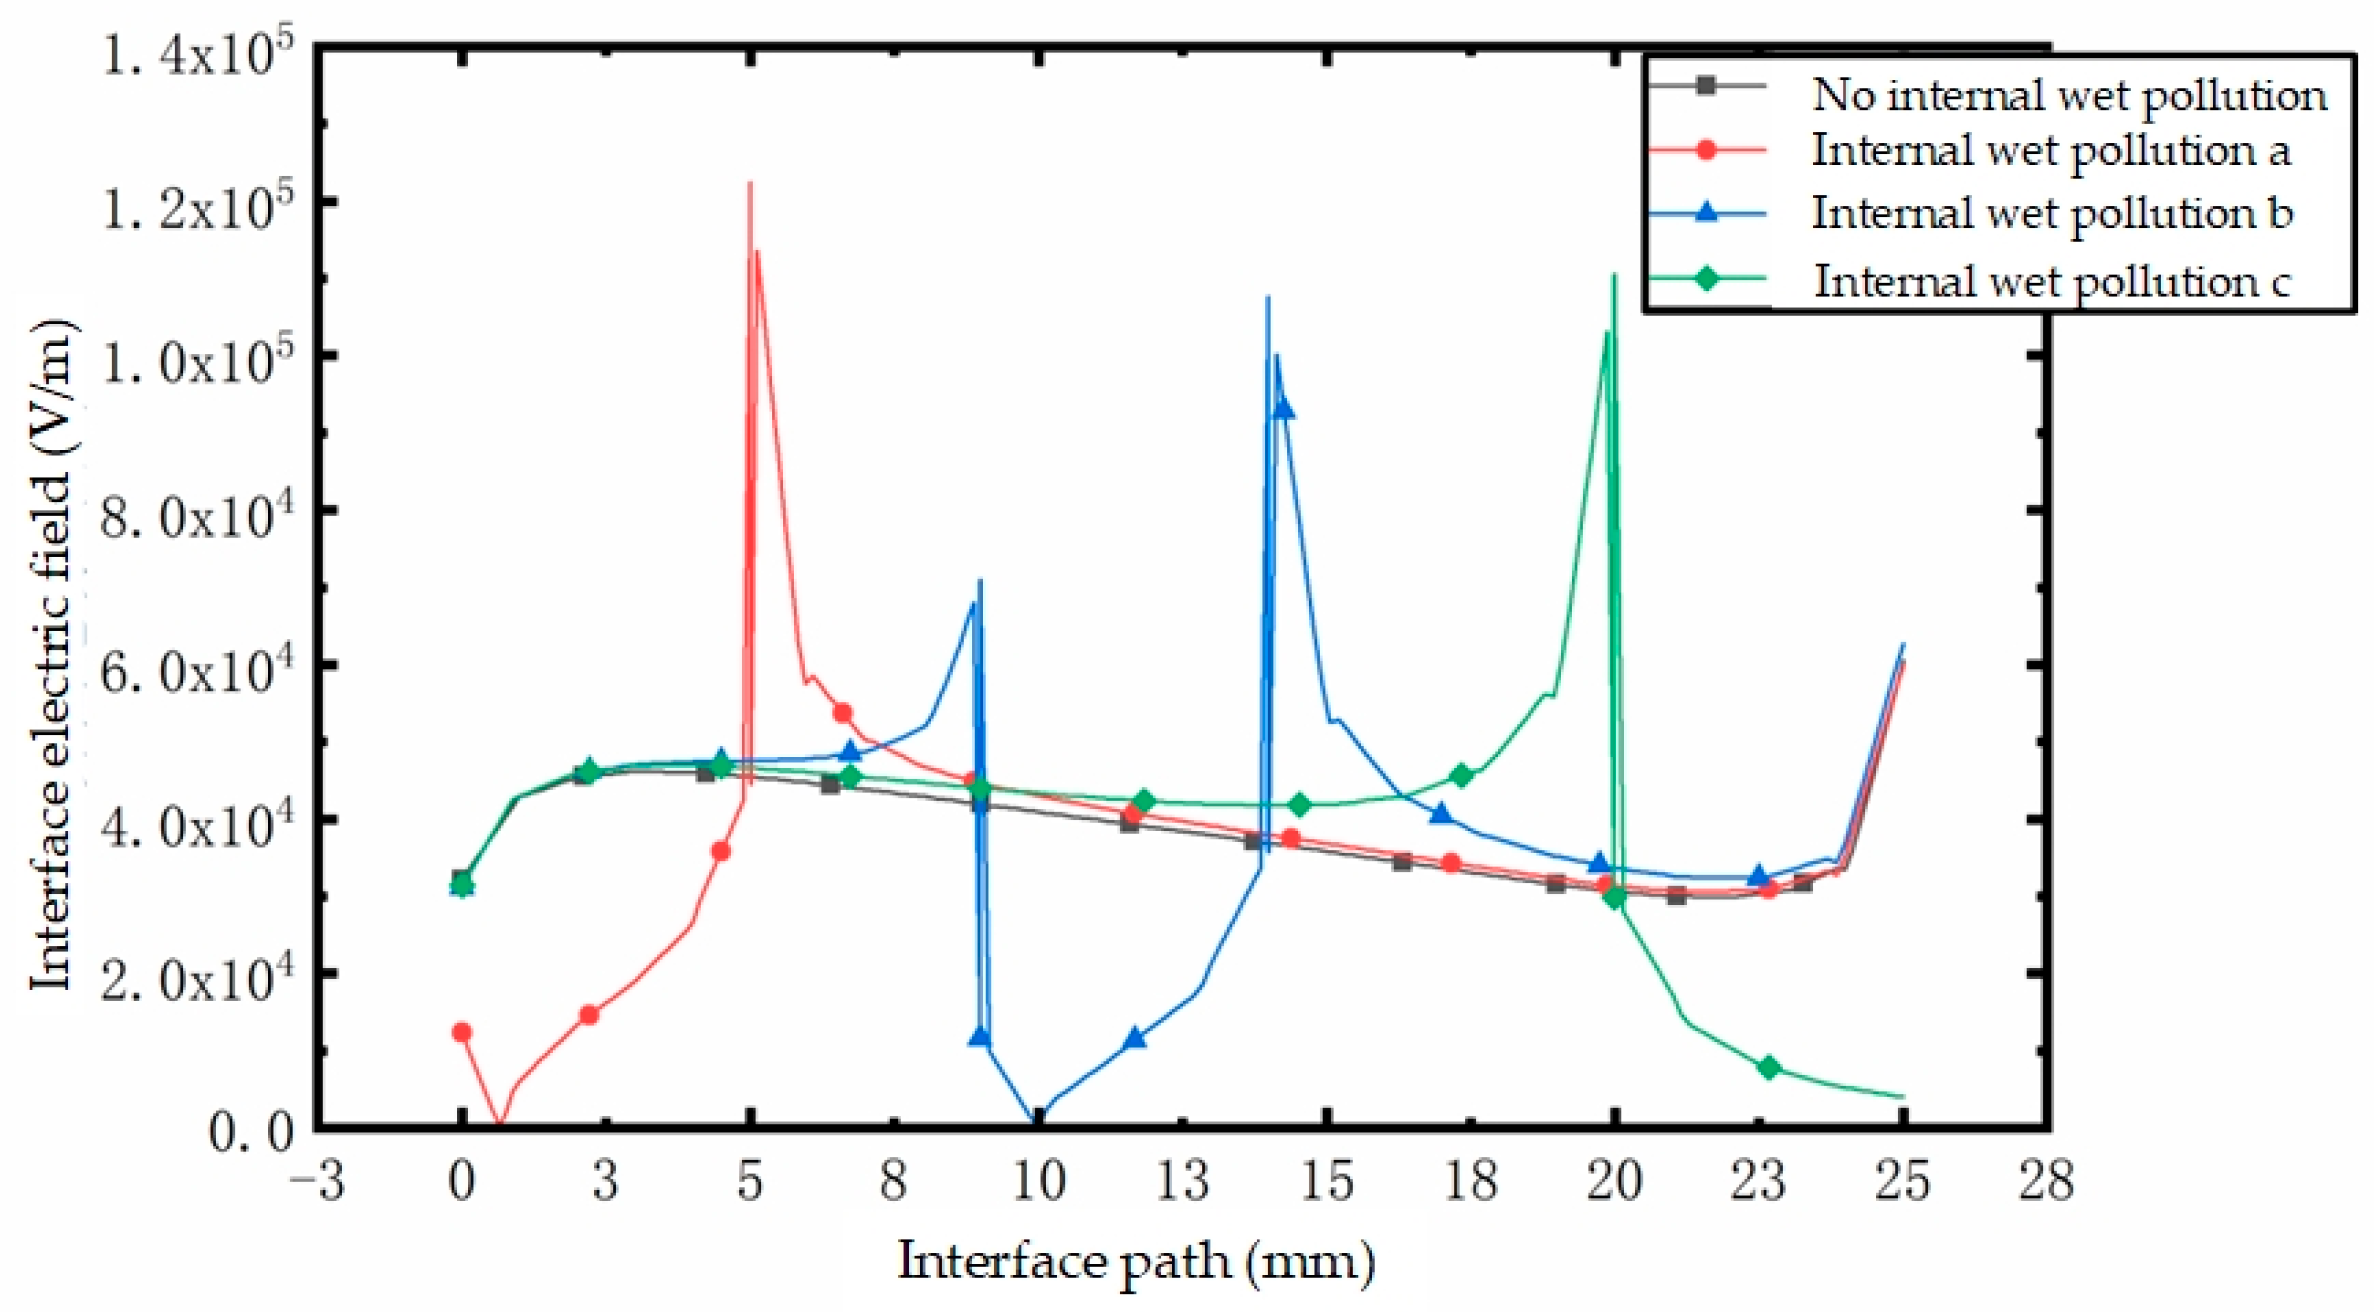
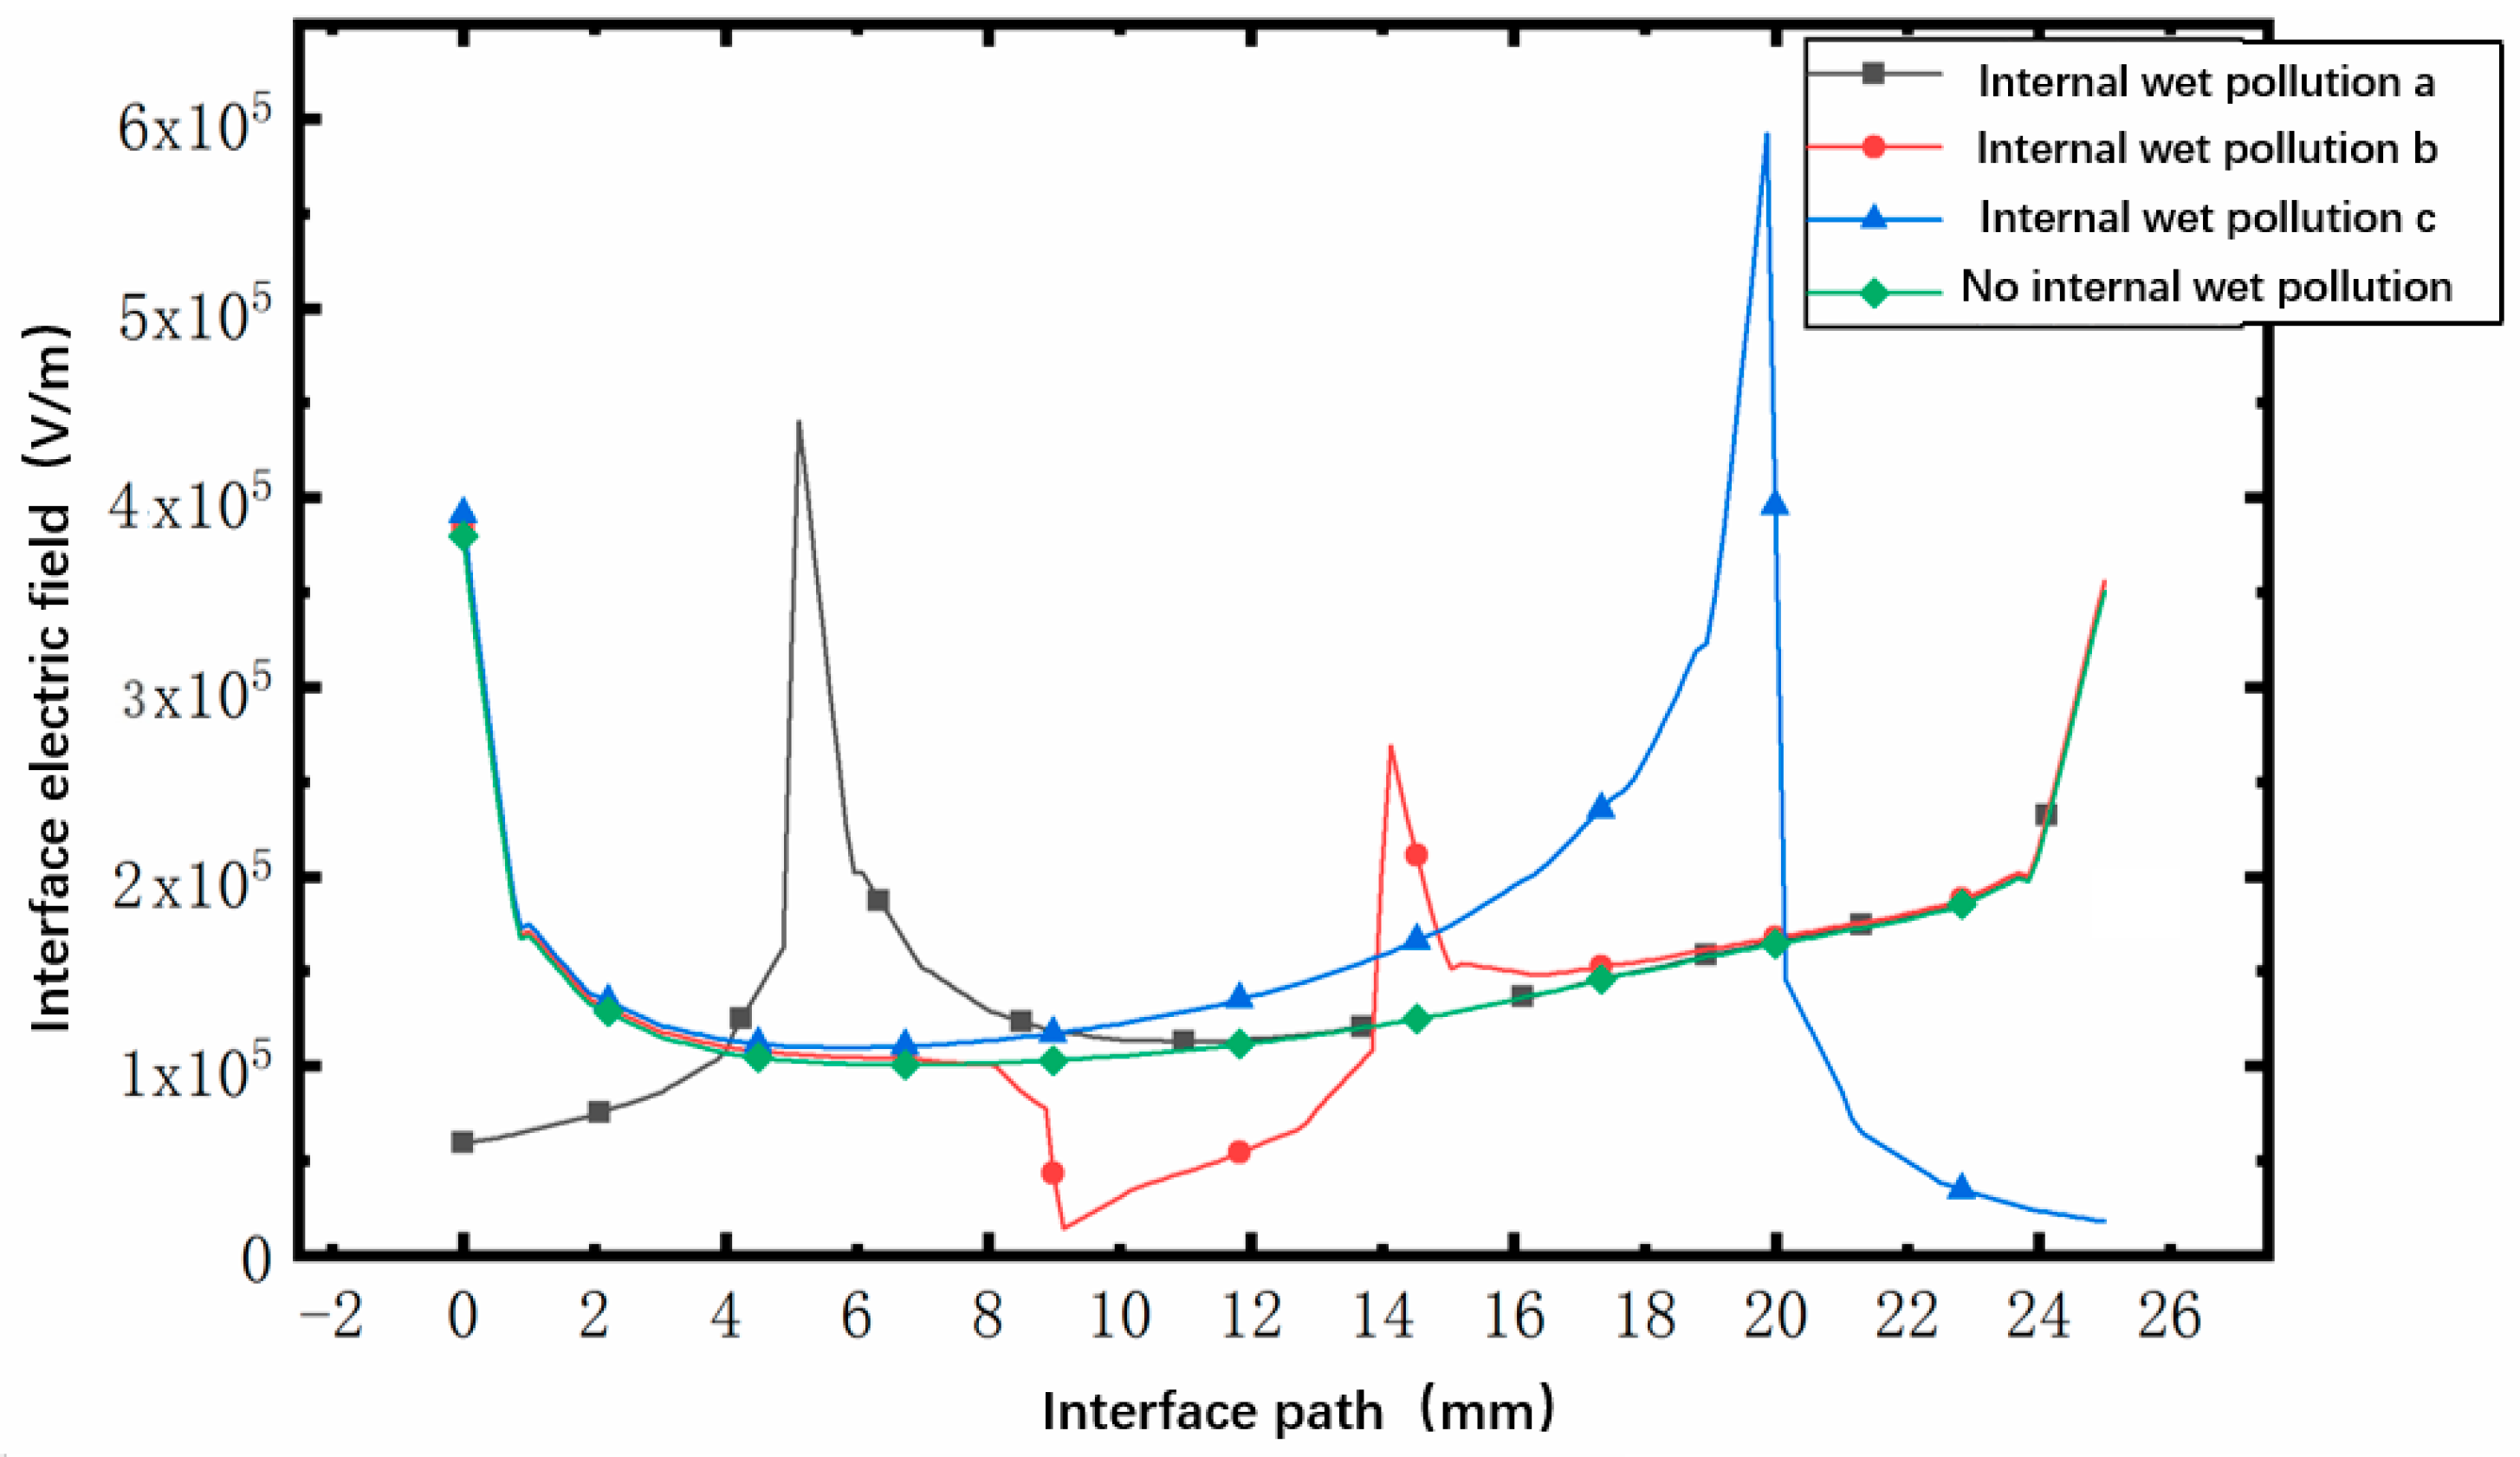
The most marked distortion of the wet electric field exists at the top of the wet electric field area. Because there is no voltage drop in the internal wet pollution, the electric field between the upper and lower vertices of the internal wet pollution area is very small, and the existence of the two vertices is equivalent to two tips with a very small radius of curvature, resulting in a relatively dense equipotential line and a large corresponding potential gradient. Therefore, the electric field at the two vertices is very high. As shown in Figure 16, when the internal wet pollution area is in position a, there is a maximum electric field at the lower vertex of the internal wet pollution area. Compared with the scenario without internal wet pollution, the electric field intensity increases by about 167%.
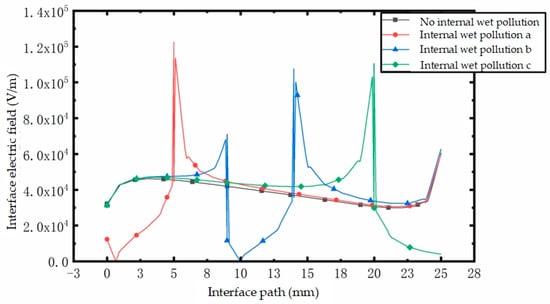
Figure 16.
Diagram of the influence of different internal wet contamination positions on the interfacial electric field.
- (2)
- Effect of interfacial wet contamination of different lengths on the electric field of cable termination–sheath structures
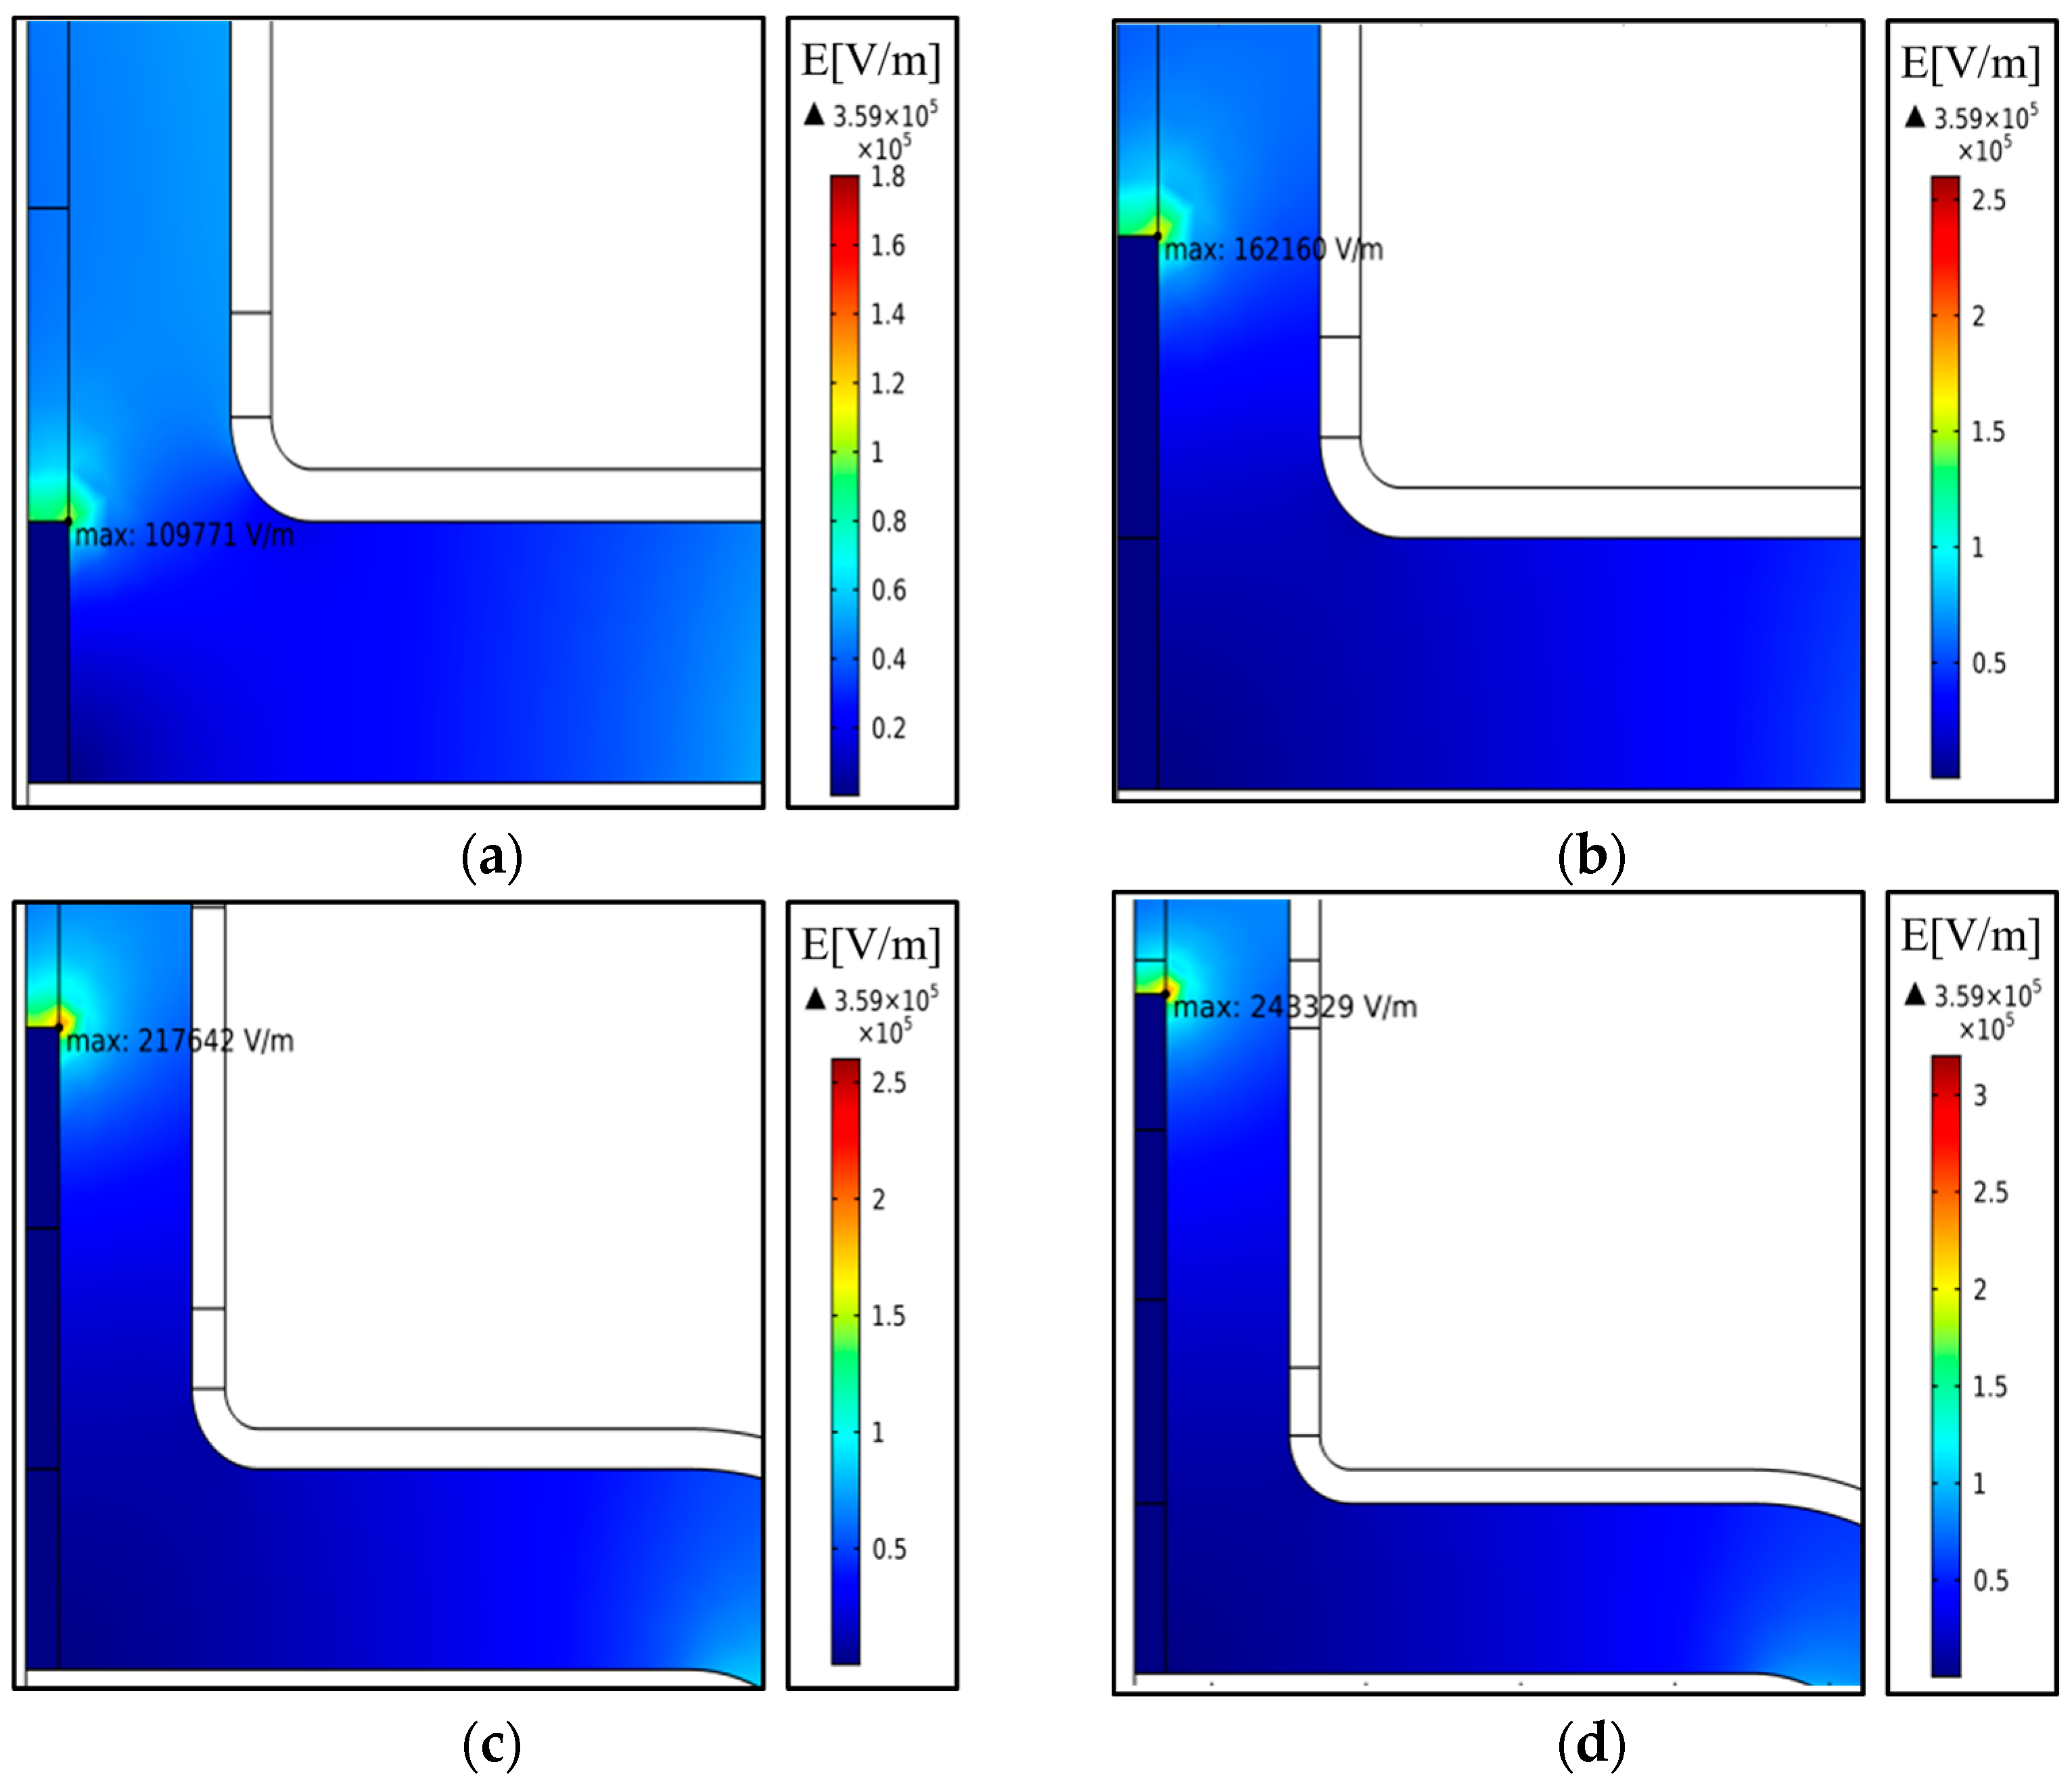
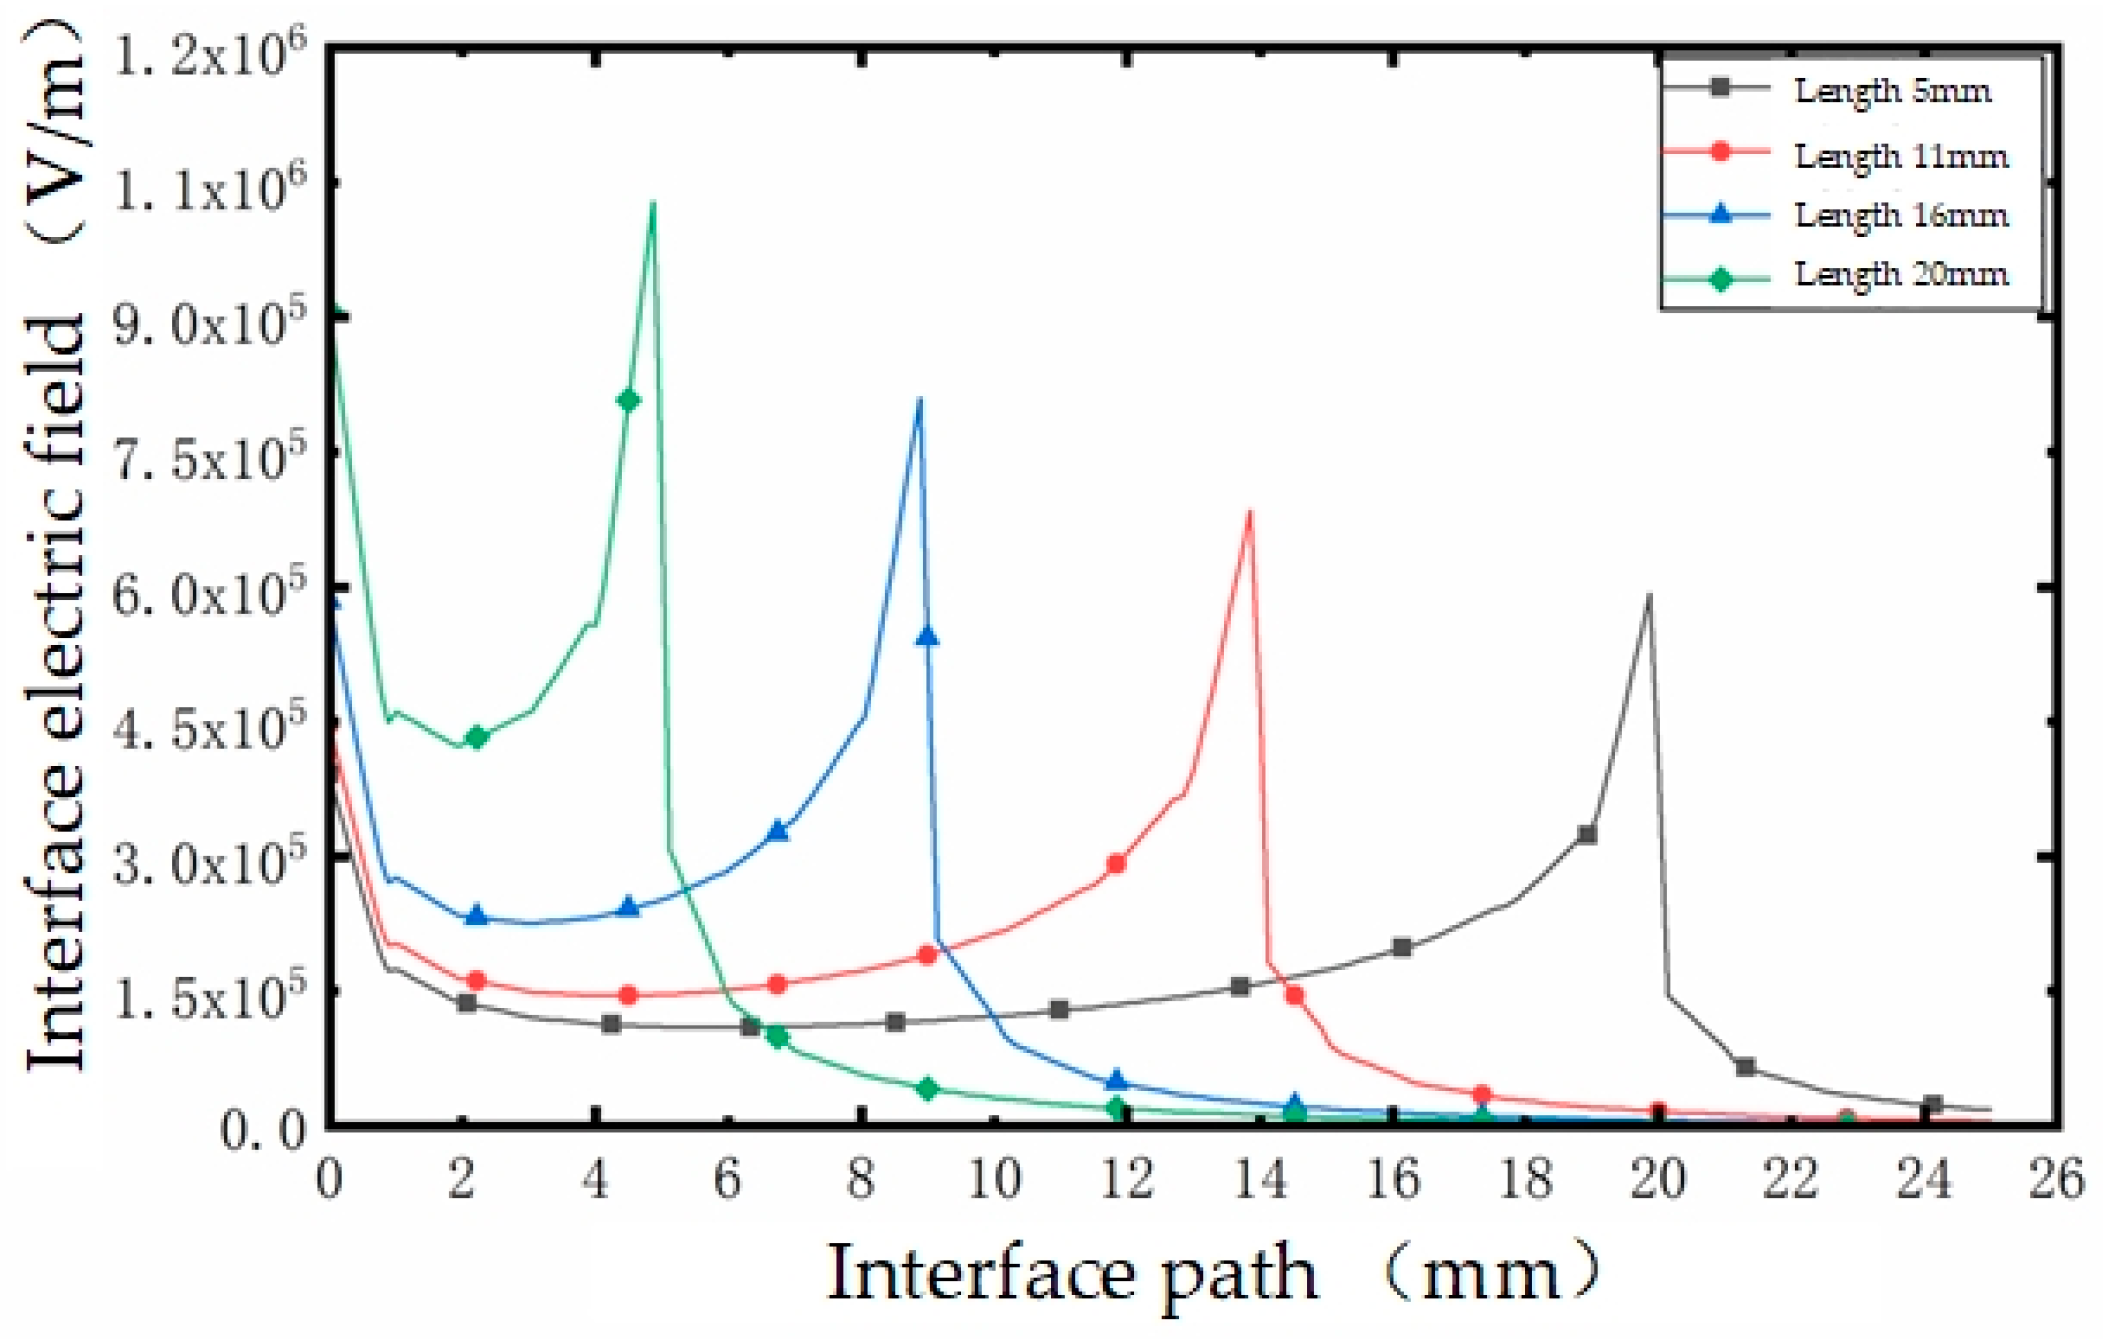
Due to the randomness of the location of the internal wet pollution area, the length of the internal wet pollution area is also uncertain. The length of the wet sheath has different effects on the structure of the wet sheath. Therefore, taking position C as the benchmark, the electric field distribution of the sheath structure and its interface is simulated when the internal wet pollution area length is 5 mm, 11 mm, 16 mm, and 20 mm. The maximum electric field inside the sheath changes when the length of wet dirt in the sheath is different. The maximum electric field appears in the upper right corner of the inner wet pollution area. As shown in Figure 17, when the length of the inner wet pollution area is 5 mm, the maximum electric field near the inner wet pollution area is 1.10 × 10⁵ V/m. When the length of the internal wet pollution area is 11 mm, the maximum electric field near it is 1.62 × 10⁵ V/m. When the length of the internal wet pollution area is 16 mm, the maximum electric field near it is 2.18 × 10⁵ V/m. When the length of the internal wet pollution area is 20 mm, the maximum electric field value near the internal wet pollution area is 2.43 × 10⁵ V/m.

Figure 17.
The electric field cloud diagram of the sheath with different lengths of internal wet dirt. (a) Length 5 mm. (b) Length 11 mm. (c) Length 16 mm. (d) Length 20 mm.
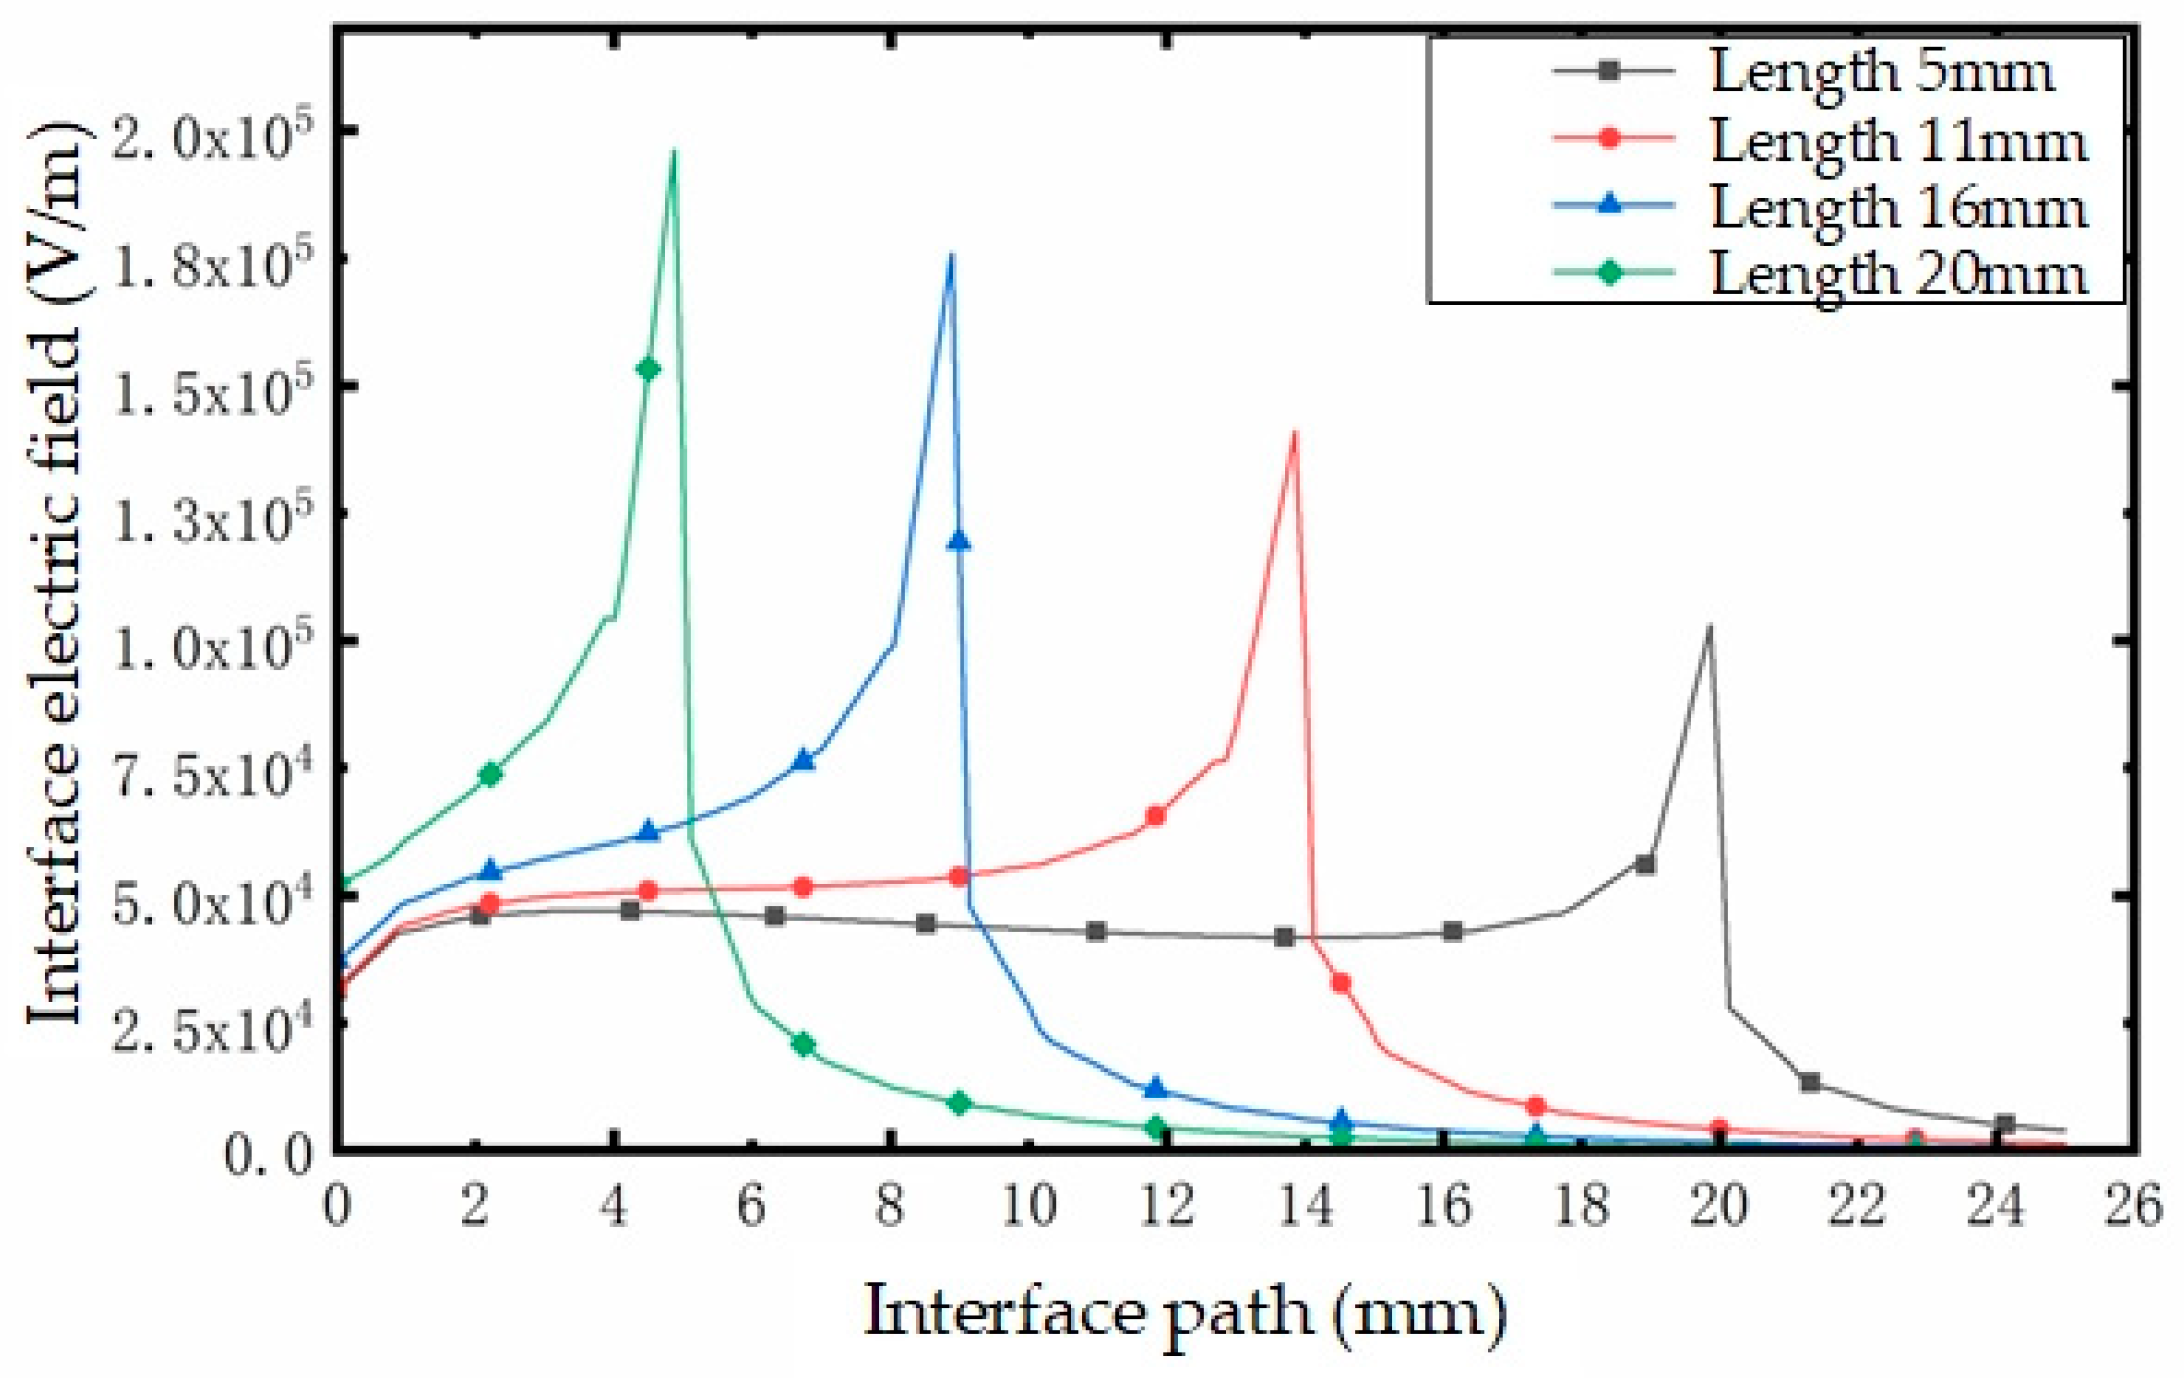
Figure 18 shows the distribution of potential and electric field at the interface between the umbrella skirt column and sheath when the length of the internal wet pollution area is different. It can be seen that due to the increase in the length of the internal wet dirt, the potential at the top of the insulating sheath decreases; that is, the voltage distributed on the insulating sheath decreases, but the degree of voltage reduction is not as good as that of the equivalent resistance on the interface, so the potential gradient increases along the interface. The voltage mainly falls on the interface without internal wet pollution, resulting in an increase in electric field intensity on the interface without internal wet pollution. In the upper part of the internal wet pollution area, the potential gradient is the largest, so the electric field distortion at this position is the most marked. In Figure 18, with the increase in the length of the internal wet pollution area, the maximum distorted electric field on the interface increases linearly, which is equivalent to an increase in the maximum electric field near the internal wet pollution area. When the length of the internal wet pollution area is 20 mm, the maximum electric field on the interface is about twice that of the internal wet pollution area, with a length of 5 mm.
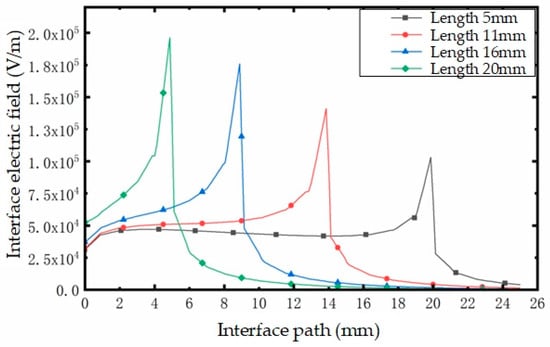
Figure 18.
Diagram of the influence of different internal wet dirt area lengths.
3.2.4. The Cable Termination and Sheath Have Interfacial Wetting and Air Gaps
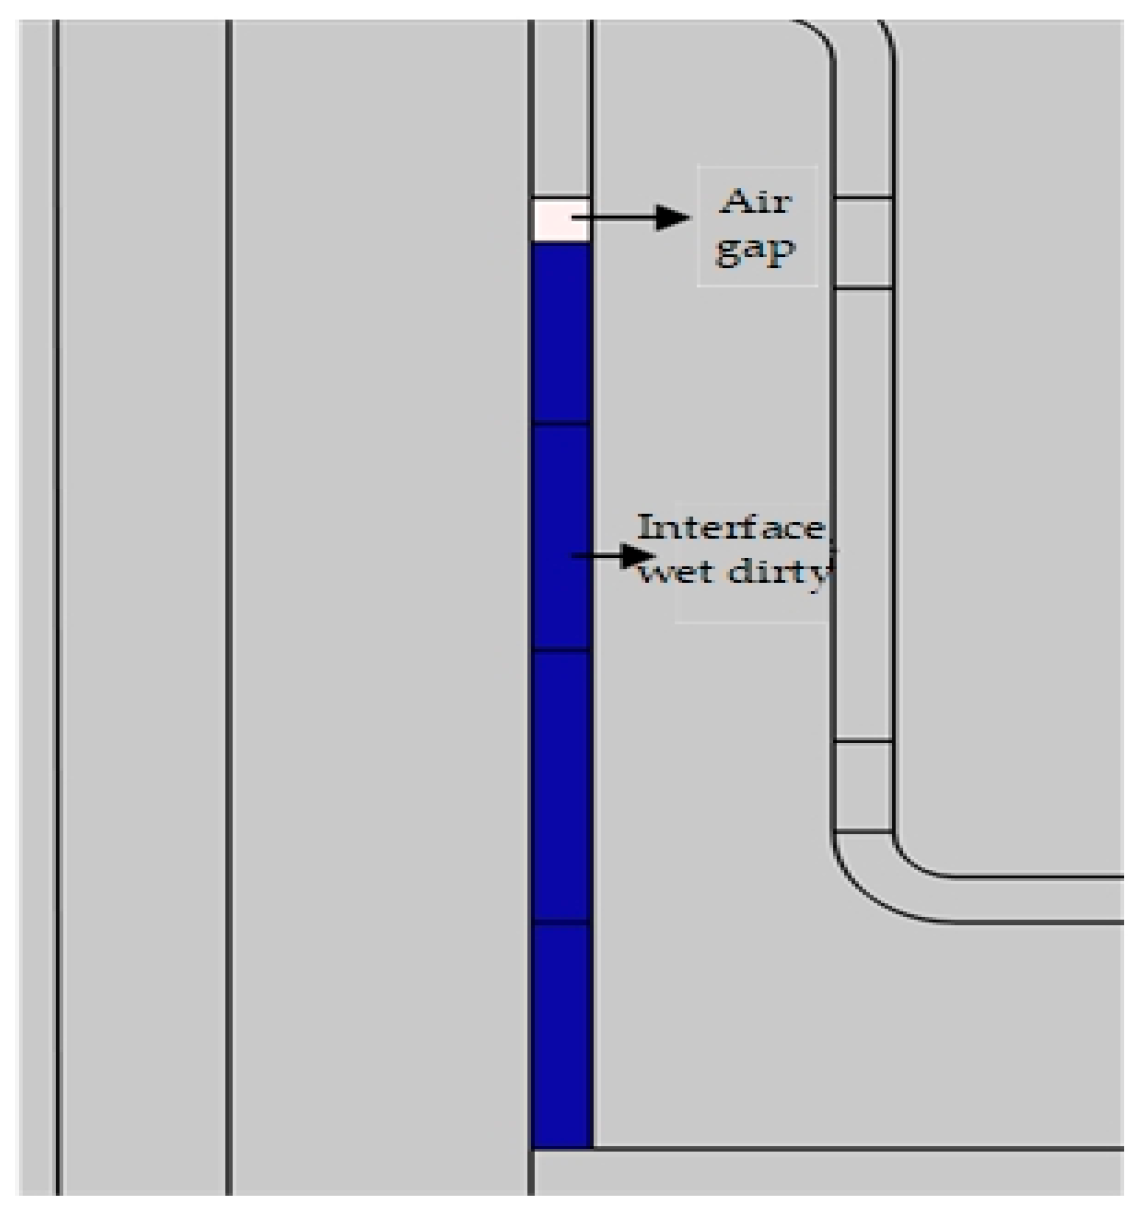
In general, the precondition for water vapor to enter the inner surface of the sheath is that there is an air gap channel; that is, the internal wet pollution area and air gap often exist at the interface at the same time. Therefore, it is necessary to analyze the electric field distribution of the sheath structure when the internal wet pollution area is accompanied by the air gap. In order not to lose generality, as shown in Figure 19, we fix the air gap position at the white part of the position (position 2), and set the wet pollution area (blue part) between the air gap and the lower flange to analyze the electric field distribution inside and near the air gap during the period with the most marked effect on the interface.
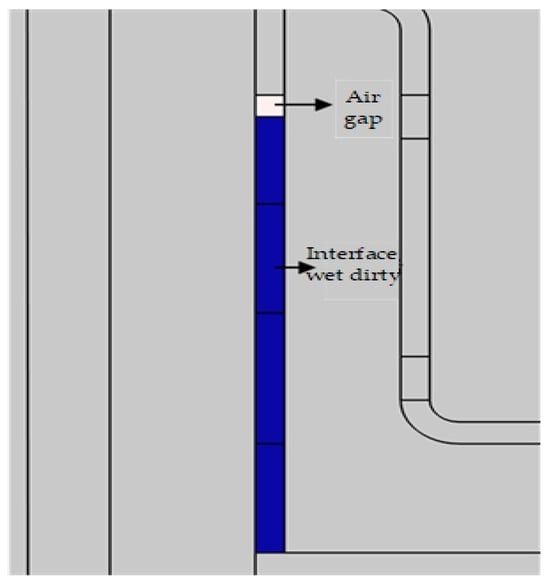
Figure 19.
Distribution map of the internal humidity and the air gap.
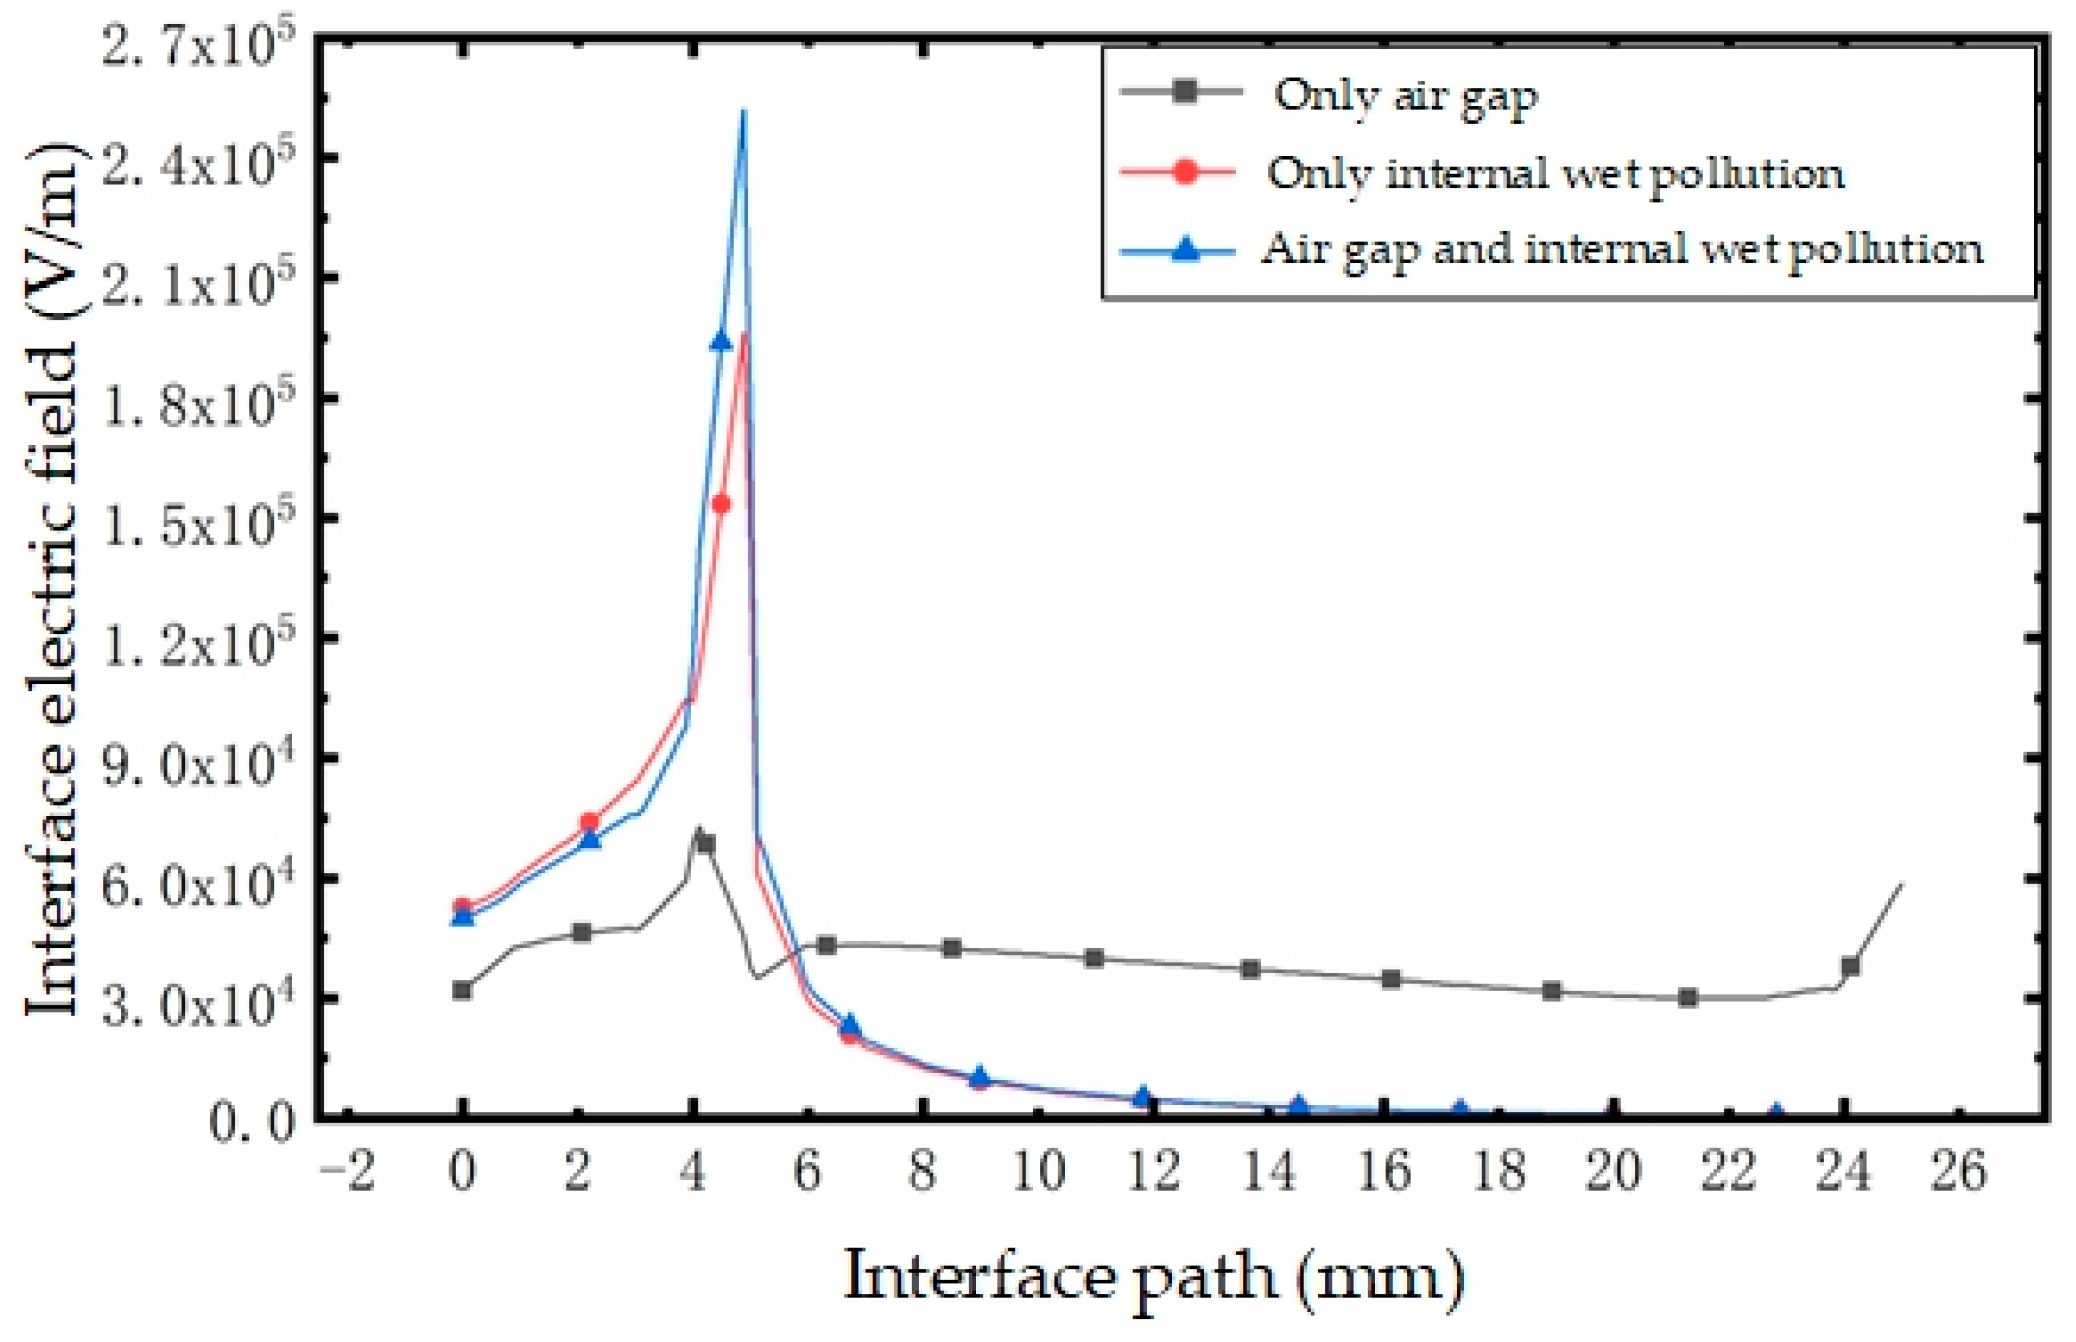
The electric field distribution of the time-division interface with only an air gap, only an internal wet pollution area, and the simultaneous existence of the air gap and internal wet pollution area are compared. As shown in Figure 20, it can be seen that when the internal wet pollution area and air gap exist at the same time, the electric field distortion at the interface is the most marked, and the maximum electric field at the junction of the internal wet pollution and air gap can reach 2.55 × 10⁵ V/m, which is nearly an order of magnitude greater than that when there is only air gap, and nearly 33.3% higher than that when there is only internal wet pollution. This is because the conductivity and relative dielectric constant of the air gap are lower than that of the insulating sheath made from silicone rubber, and the conductivity and dielectric constant are inversely proportional to the electric field strength. Therefore, when the internal wet pollution area is accompanied by the air gap, the existence of the air gap replaces the position of the original part of the insulating sheath; that is, the dielectric constant and conductivity decrease, increasing the electric field strength. Thus, the simulation results are consistent with the theory.
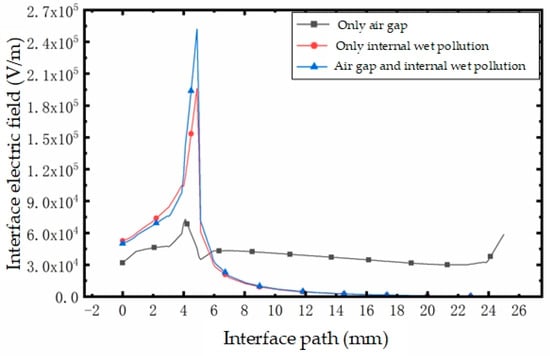
Figure 20.
Interface electric field diagram showing different defects on the interface.
3.3. Electric Field Distribution of the Cable Termination–Sheath Structure in the Presence of External Moisture Contamination
According to real-world investigations, the burning discharge of the roof cable’s terminal sheath structure is often seen in high-tide wet weather, such as fog and drizzle. In this weather, the outer surface of the cable terminal umbrella skirt is often in contact with water droplets or with a layer of water in a film, resulting in a significant increase in the leakage current along the outer surface of the umbrella skirt; finally, the surface discharge phenomenon occurs. The existence of the water film will also increase the voltage distributed on the insulating sheath and will then increase the electric field intensity at the interface between the umbrella skirt column and the sheath.
As shown in Figure 21, the outer surface of the cable’s terminal structure with an insulating sheath is assumed to be covered with a layer of wet dirt of uniform thickness. The thickness of the wet dirt layer is set to 1 mm. The conductivity and relative dielectric constant of the wet dirt will be relatively high. To analyze a more serious scenario, we select the relative dielectric constant of the external wet dirt as 81 and the conductivity as 0.6 S/m, to simulate and analyze the electric field distribution on the sub-interface under various conditions.
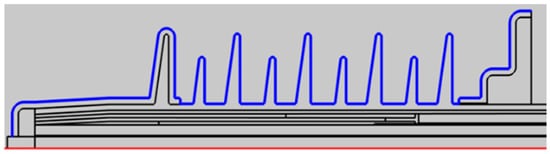
Figure 21.
Distribution diagram of the positions of the wet and dirty layers.
- (1)
- No interfacial wetting of the cable termination and sheath, with no air gaps
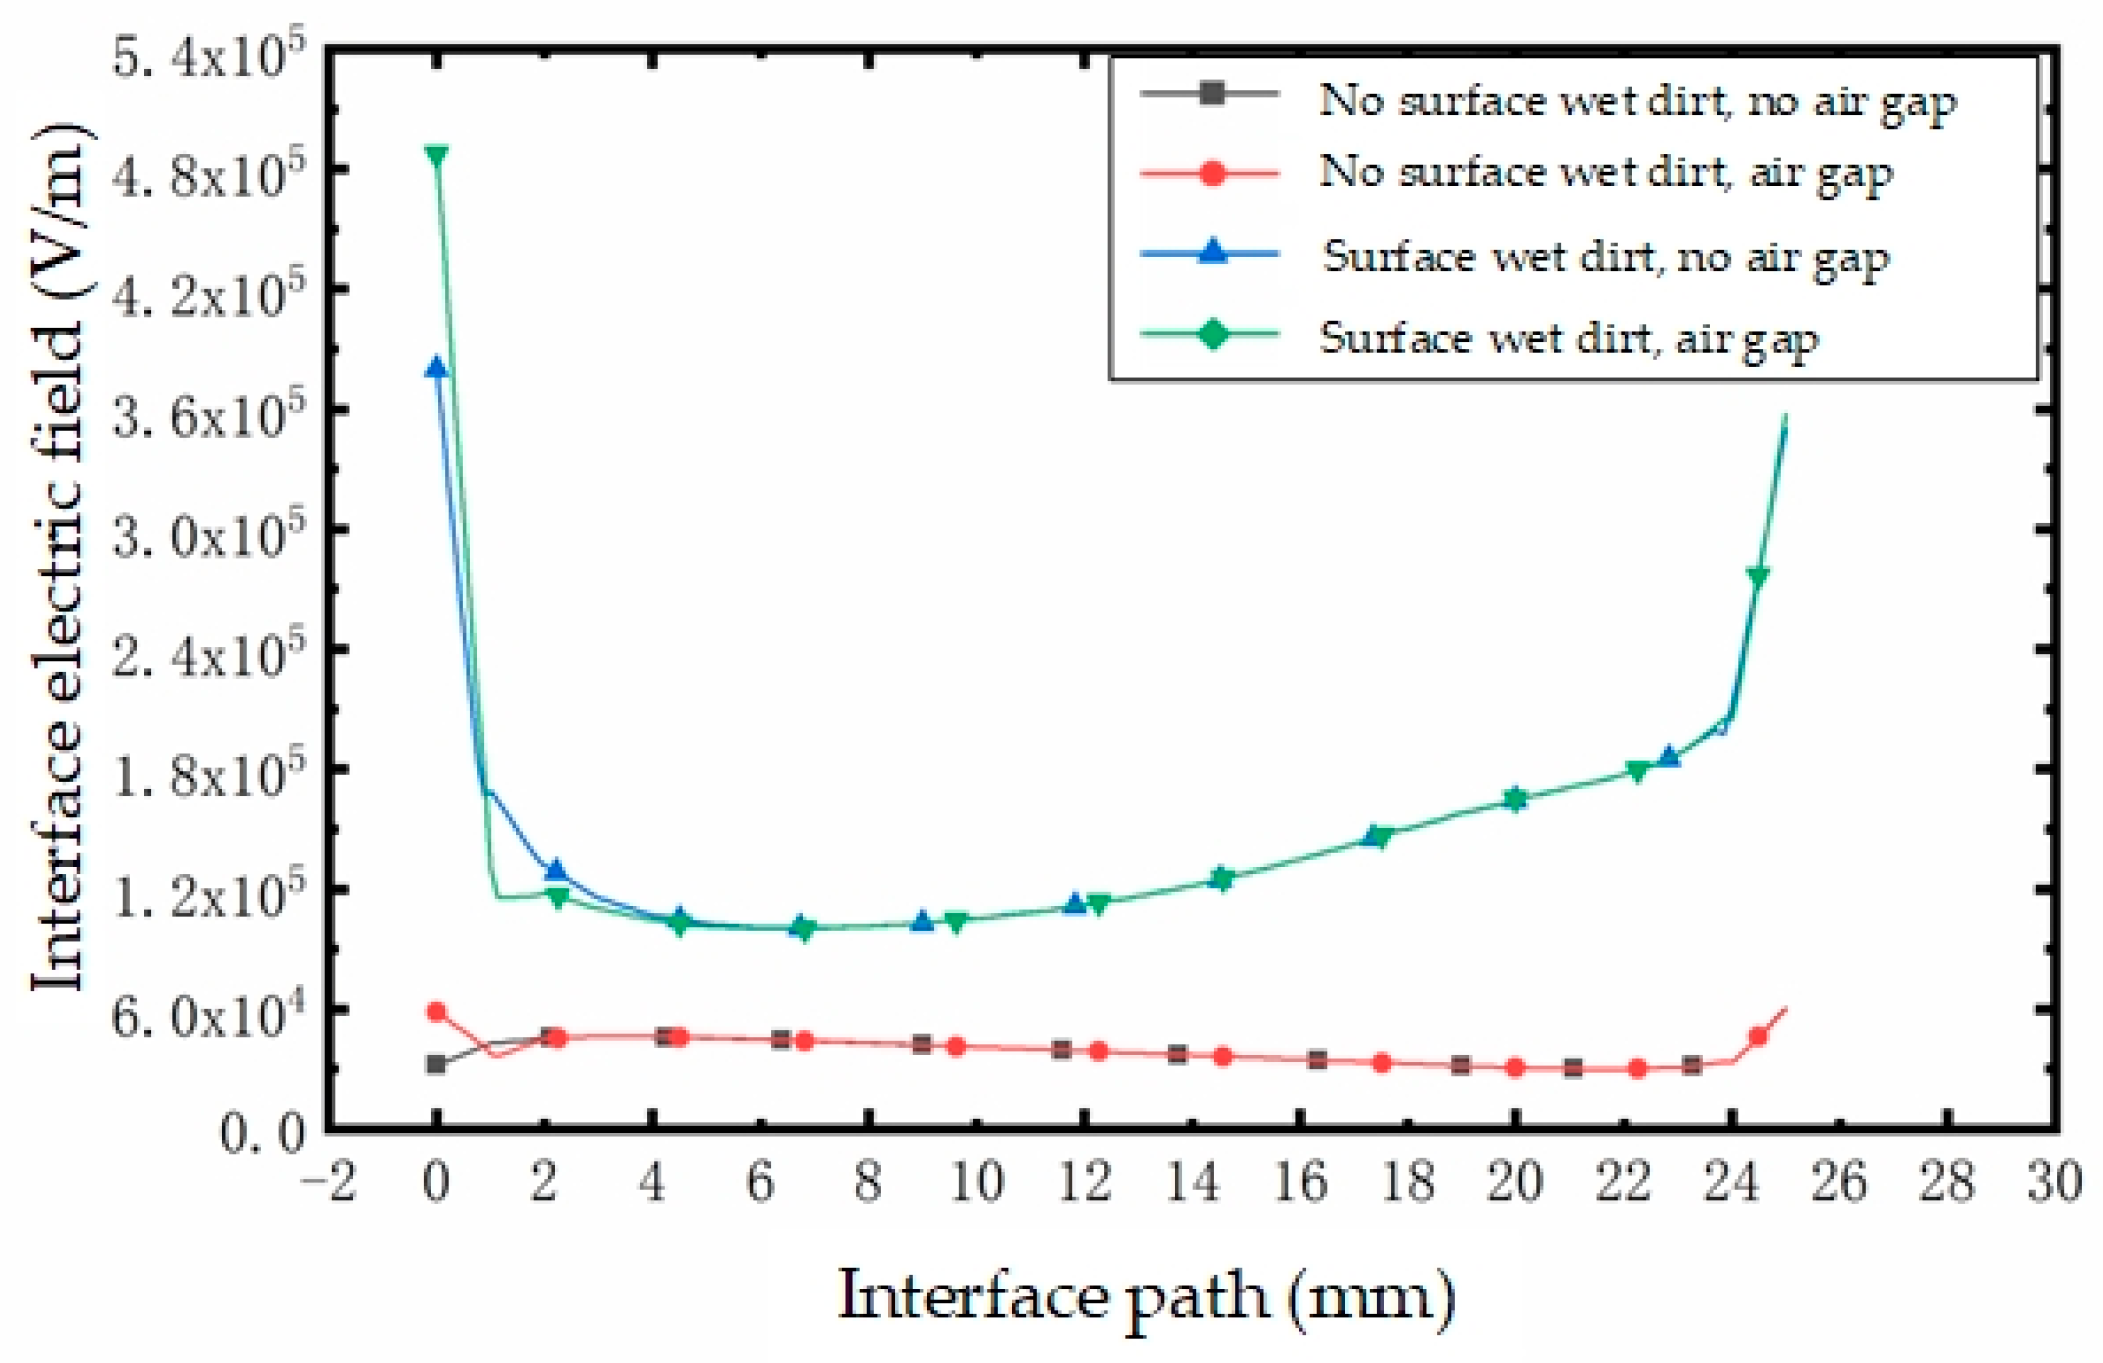
From the simulation, we know that the existence of an air gap will produce great distortion in the electric field near the air gap. Therefore, in the presence of external wet pollution, air gap position 1, air gap position 3, and air gap position 5 are selected on the interface for the simulation. Figure 22, Figure 23 and Figure 24 show the influence of the air gap in positions 1, 3, and 5 on the interface electric field when there is wet dirt on the outer surface of the cable terminal and compare it with the scenario without external wet dirt. It can be seen that the existence of external wet pollution increases the overall interface electric field, resulting in a larger internal electric field in the air gap than when there is no external wet pollution. Under wet conditions, when the air gap is in position 1, the maximum electric field near the air gap is about 5.0 × 10⁵ V/m, which is nearly an order of magnitude larger than the electric field near the air gap without external wet pollution.
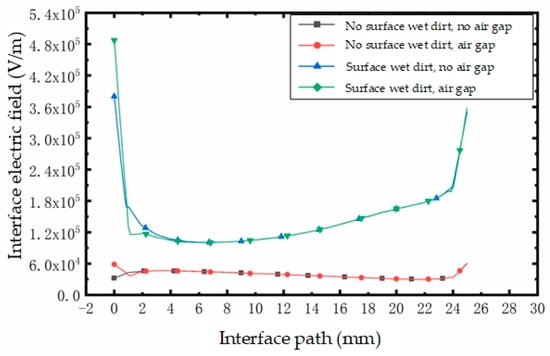
Figure 22.
The influence of the air gap at position 1 on the interfacial electric field.
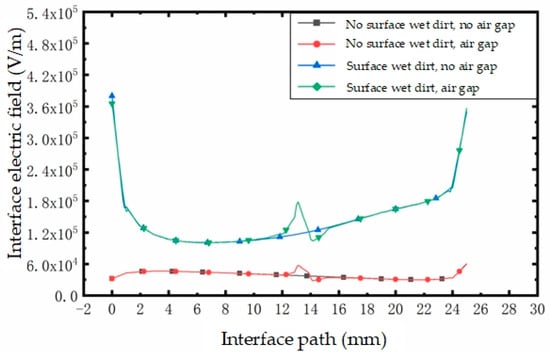
Figure 23.
The influence of the air gap at position 3 on the interfacial electric field.
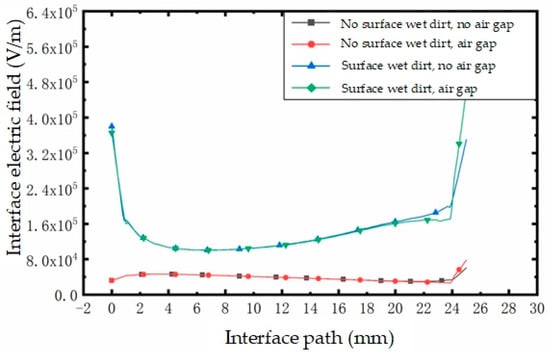
Figure 24.
The influence of the air gap at position 5 on the interfacial electric field.
- (2)
- The cable termination and sheath have interfacial wetting, with no air gaps
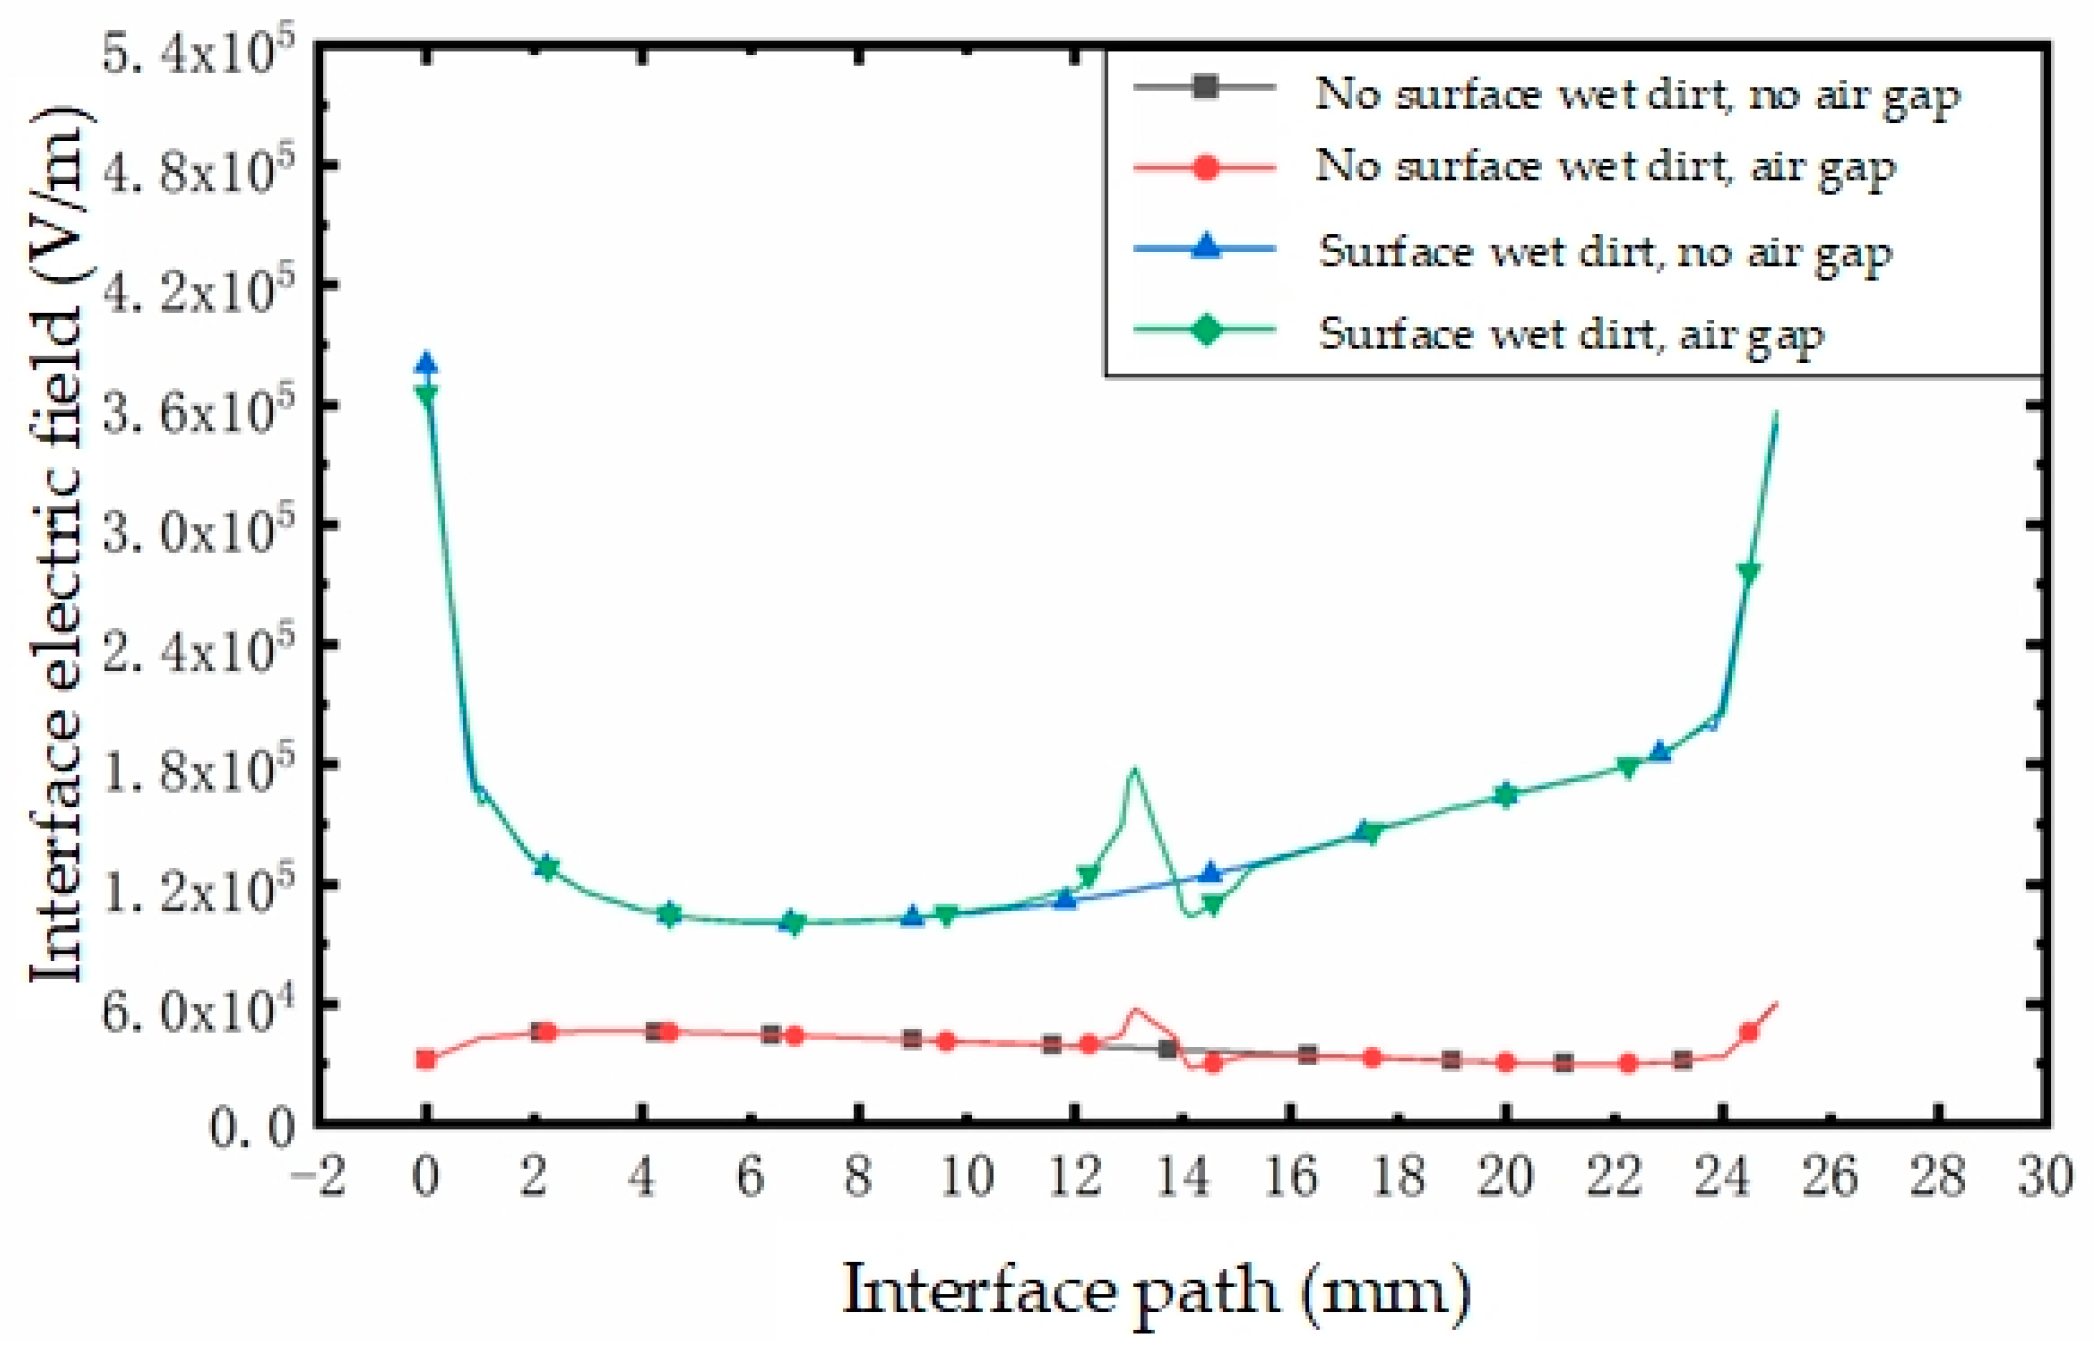
On the interface, the wet dirt areas are set at position A, position B, and position C, respectively. The length of the inner wet dirt area is 5 mm, and its relative dielectric constant and conductivity are the same as those of the outer wet dirt area. Figure 25 shows the influence of three internal wet pollution positions on the interface electric field in the presence of external wet pollution. It can be seen that compared with the scenario without external wet pollution, the maximum electric field near the wet pollution increases. When the wet pollution area is at position C, the maximum electric field increases most markedly, and the maximum distorted electric field is about 6.0 × 10⁵ V/m.
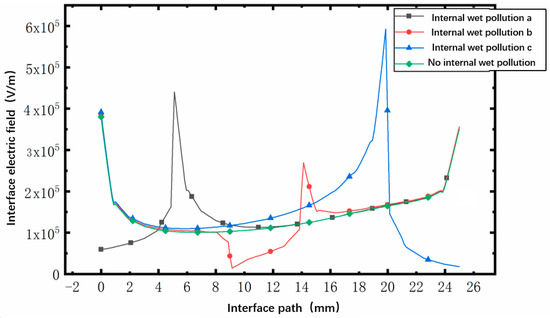
Figure 25.
Diagram of the influence of different internal wet dirt positions on the interfacial electric field.
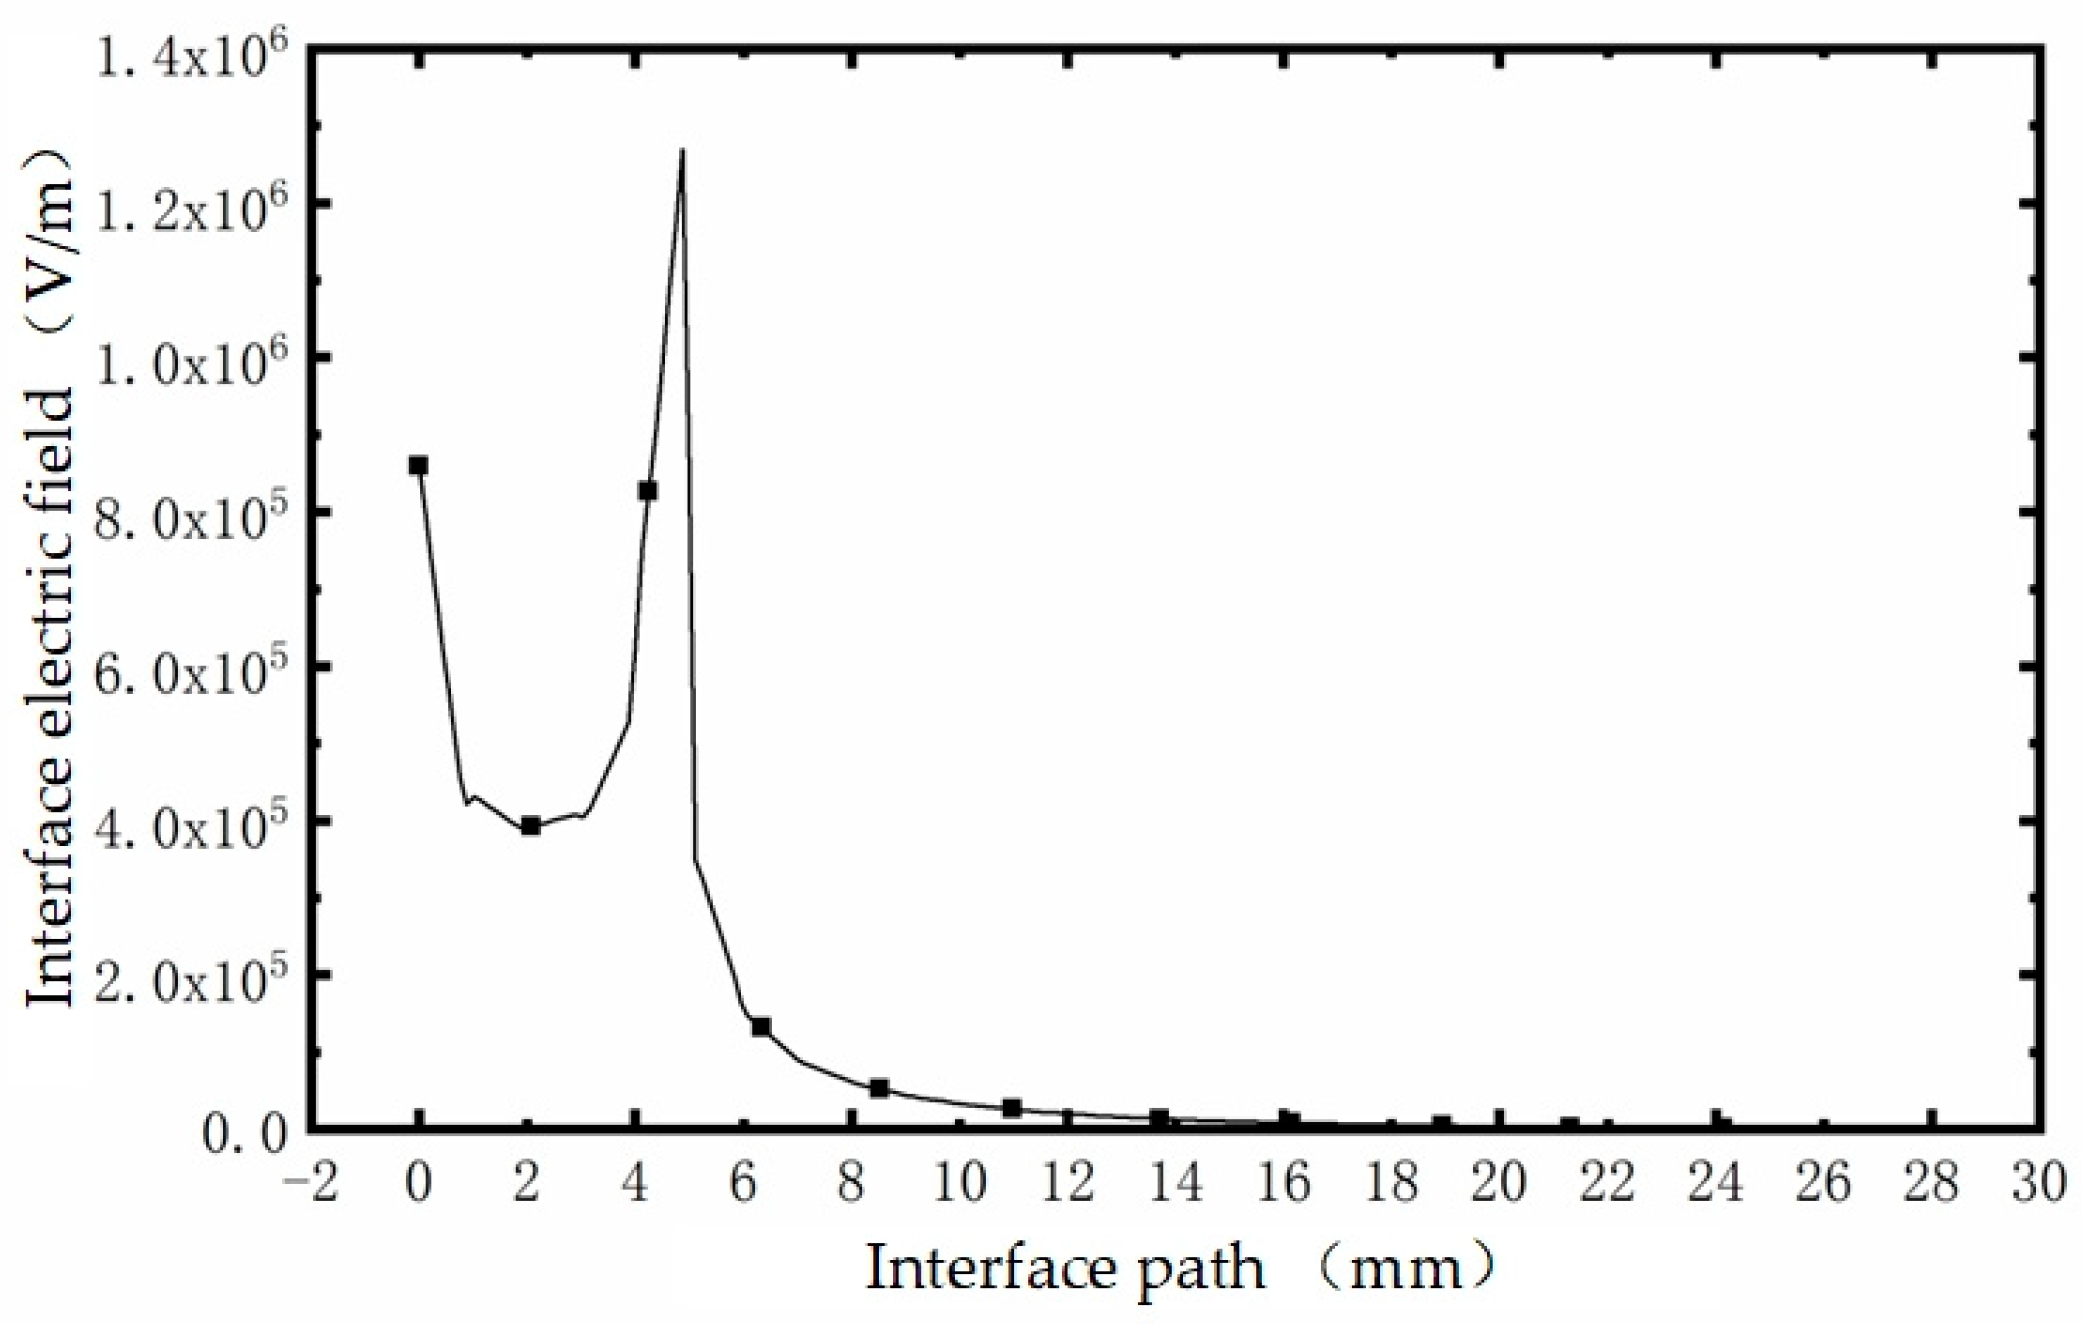
We set position C as a wet pollution area and change the length of the wet pollution area to 5 mm, 11 mm, 16 mm, and 20 mm to analyze the influence of the length of the internal wet pollution area on the interface electric field in the case of external wet pollution. At this point, the voltage distribution on the outer surface of the cable terminal structure is mainly determined by the resistance of the wet dirt on the outer surface. For this reason, with the increase in the length of the internal wet pollution area, the voltage at the position without internal wet pollution on the interface decreases faster, and its electric field intensity is greater than that without external wet pollution, which is reflected in Figure 26. The increase in the length of the internal wet pollution area is equivalent to the decrease in the effective interface length. Due to the constant voltage, the electric field intensity of the score interface increases, and the maximum distorted electric field at the top of the internal wet pollution area also increases with the increase in the length of the internal wet pollution area. When the length of the internal wet pollution area is 20 mm, the maximum electric field on the maximum score interface can reach 1.1 × 10⁶ V/m.
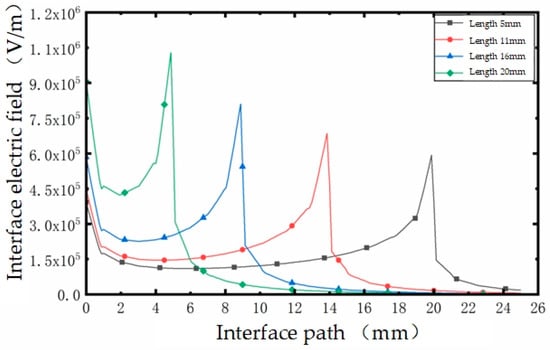
Figure 26.
The influence of different internal wet pollution area lengths on the interface’s electric field.
- (3)
- The cable termination and sheath have interfacial wetting and air gaps
When there is both internal wet dirt and an air gap on the interface, we set the interface between the air gap and the lower flange as internal wet dirt with a thickness of 1 mm. The field is concentrated at the root and inside the air gap, especially at the junction of the wet pollution area, the air gap, and the inner surface of the sheath. Under an extremely uneven electric field, when overvoltage occurs on the cable terminal, it will inevitably lead to discharge in the air gap. Figure 27 is an electric field data diagram on the interface in this scenario. It can be seen that the existence of an air gap increases the maximum distorted electric field at the interface by about 26.6% compared with that without an air gap, with maximum electric field values up to 1.9 × 10⁶ V/m.
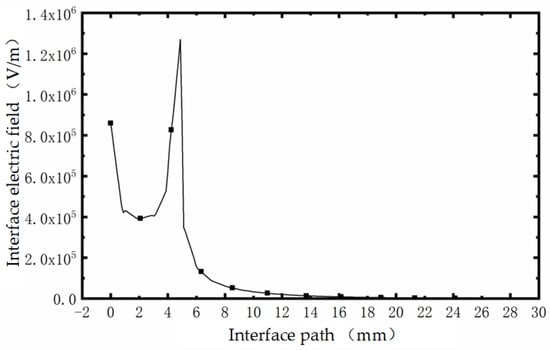
Figure 27.
Interfacial electric field diagram for internal wet dirt and an air gap.
4. Conclusions
This paper takes the overall structure of the high-voltage cable’s terminal sheath on the roof of an electric locomotive as the research object, establishes the simulation model of the cable terminal sheath in COMSOL, and studies the influence of the air gap, external wet dirt, and interfacial wet dirt on the distribution of the electric field at the interface of the cable terminal and sheath using simulation analysis, then investigates the mechanism of the occurrence of inner-surface discharge, and draws the following main conclusions:
- (1)
- When the outer surface of the cable terminal is clean and dry, the insulating sheath has no obvious effect. When the outer surface of the terminal has serious wet pollution issues, the insulating sheath can extend the leakage on the current creepage path, which reduces the leakage current along the surface, thus reducing the probability of the partial discharge of cable terminals.
- (2)
- The position and size of the air gap affect the electric field distribution at the cable terminal–sheath interface. Compared with the positioning without an air gap, the electric field in the same position but with an air gap is about 1.7 times that without an air gap; when the position of the air gap is located at the edge of the cable terminal, the distortion of the electric field distribution is more serious, and the length of the air gap is increased; the maximal electric field and the average electric field within the air gap are also increased, but the magnitude of the increase is slowed down gradually. In general, the size of the air gap has little effect on the electric field distortion at the sub-interface.
- (3)
- The location and length of the interfacial wet contamination area affect the electric field distribution at the cable terminal–sheath interface. When interfacial wet contamination exists at the interface, the point of maximum electric field strength generally occurs at the interfacial wet contamination point, and the maximum increase in electric field strength is about 167 percent compared with the scenario without interfacial wet contamination. With an increase in the interface wet contamination length, the maximum aberration electric field on the interface is basically increased linearly. When the length of the interfacial wet contamination is 20 mm, the maximum electric field at the interface is about twice that of the interfacial wet contamination area, with a length of 5 mm.
- (4)
- Moisture contamination on the outer surface of the cable termination greatly enhances the non-uniformity of the electric field’s distribution on the surface. When there is no wet contamination at the interface and there is an air gap at the interface, the air gap is located at position 1, where the electric field near the air gap is the largest, about 5.0 × 10⁵ V/m, which is nearly an order of magnitude larger than the electric field near the air gap when there is no external wet contamination; When there is a wet pollution area at the interface but there is no air gap at the interface, the interfacial electric field is maximum when the wet pollution area is located at position C and the length of the interfacial wet pollution area is 20 mm, and it can reach 1.1×10⁶ V/m. When there are both interfacial wet pollution areas and air gaps at the interface, the presence of air gaps increases the maximum distortion electric field of interfacial wet pollution areas by about 26.6% compared to that in the absence of air gaps, and the maximum value of the electric field can be as high as 1.9 × 10⁶ V/m. This makes the air gaps susceptible to partial discharges.
This paper establishes a simulation model for a cable terminal–sheath system, simulates and analyzes the distribution of the interfacial electric field under the influence of interfacial wet contamination, external wet contamination, and air gap, respectively, and obtains the maximum value of distortion of the interfacial electric field. The simulation results are summarized and analyzed: wet pollution on the outer surface of the cable terminal increases the uneven distribution of the electric field of the cable terminal–sheath structure, making the voltage drop on the outer surface of the sheath gradually slow down, while the voltage drop on the interface between the terminal and the sheath remains unchanged, which makes the potential difference between the outer surface of the sheath and the inner surface at the same height greater and greater; as the lower flange maintains zero potential, the equipotential lines inside the insulating sheath become progressively denser when approaching the lower flange, and, thus, the electric field strength increases in this part. At this time, if also accompanied by interface wet dirt and an air gap, it is easy for it to happen that the air gap is punctured, triggering partial discharge. This conclusion provides a theoretical basis for optimizing the insulation sheath structure to solve the discharge problem.
Author Contributions
Methodology, J.C.; Software, Y.Y.; Validation, S.Z.; Investigation, F.T.; Resources, H.Z. All authors have read and agreed to the published version of the manuscript.
Funding
This research received no external funding.
Institutional Review Board Statement
Not applicable.
Informed Consent Statement
Not applicable.
Data Availability Statement
The original contributions presented in the study are included in the article, further inquiries can be directed to the corresponding author.
Conflicts of Interest
Authors Huanqing Zou and Juan Chen were employed by the company CRRC ZhuZhou Locomotive Co., Ltd. The remaining authors declare that the research was conducted in the absence of any commercial or financial relationships that could be construed as a potential conflict of interest.
References
- Meng, X.; Mei, H.; Chen, C.; Wang, L.; Guan, Z.; Zhou, J. Research on characteristics of streamer propagation along insulation surfaces. Proc. CSEE 2013, 33, 155–165. [Google Scholar]
- Bai, L.L.; Zhou, L.J.; Cao, W.D. Characteristics of partial discharge in air gap defects in EPR cable termination under −40 °C condition’. High Volt. Eng. 2020, 46, 3605–3614. [Google Scholar]
- Du, B.X.; Han, T.B.; Su, J.G. Tree characteristics in silicone rubber/SiO2 nanocomposites under low temperature. IEEE Trans. Dielectr. Electr. Insul. 2014, 21, 503–510. [Google Scholar] [CrossRef]
- Wang, T.; Li, J.; Liu, K.; Yuan, D.; Gao, G.; Xin, D. Effect of Air Gap Defects on the Electric Field Distribution and Partial Discharge Characteristics of Vehicle-Mounted High-Voltage Cable Terminals. In Proceedings of the 2023 Panda Forum on Power and Energy (PandaFPE), Chengdu, China, 27–30 April 2023; pp. 837–843. [Google Scholar]
- Zhao, Z. High Voltage Technology; China Electric Power Press: Beijing, China, 2013. (In Chinese) [Google Scholar]
- Lin, H. Research on anti-fog flash system of HXD3C electric locomotive. Intern. Combust. Engines Accessories 2020, 140–141. [Google Scholar] [CrossRef]
- Cheng, B.; Kang, M.; Zheng, W. Analysis of the effect of anti-fouling flash insulation sheaths on the electric field distribution of supported insulators. Electr. Locomot. Urban Rail Veh. 2016, 39, 21–24. (In Chinese) [Google Scholar]
- Chen, Z.; Liu, G.; Chen, C.; Lu, G. Test and study of 10 kV XLPE power cables’ typical defects based on Oscillating Wave Test System. In Proceedings of the 2010 IEEE International Symposium on Electrical Insulation, San Diego, CA, USA, 6–9 June 2010. [Google Scholar]
- Liu, G.; Liu, Y.; Wang, C.; Yi, Z. The study on evaluation model for prefabricated HV stress cone of cable terminations weakness based on finite element. In Proceedings of the Conference Record of the IEEE International Symposium on Electrical Insulation, Toronto, ON, Canada, 11–14 June 2006. [Google Scholar]
- Gao, G.; Li, B.; He, M.; Liu, K.; Tang, Y.; Xin, D. Evaluation of Partial Discharge Severity for Air Gap Defects in Vehicle Cable Terminals. In Proceedings of the 2022 IEEE International Conference on High Voltage Engineering and Applications (ICHVE), Chongqing, China, 25–29 September 2022; pp. 1–4. [Google Scholar]
- Liu, Z.; Li, J.; Zhang, T.; Chen, S.; Xin, D.; Liu, K.; Chen, K.; Liu, Y.-C.; Sun, C.; Gao, G.; et al. Accurate Identification of Partial Discharge Signals in Cable Terminations of High-Speed Electric Multiple Unit Using Wavelet Transform and Deep Belief Network. Appl. Sci. 2024, 14, 4743. [Google Scholar] [CrossRef]
- Zhu, Z.; Huang, C.; Yu, Y.; Zhang, M.; Qin, Y. Research on partial discharge mechanism and characteristics for 10kV cable joint with air gap defect. In Proceedings of the 2014 China International Conference on Electricity Distribution (CICED), Shenzhen, China, 23–26 September 2014; pp. 1246–1250. [Google Scholar]
- Liu, J.; Wei, D.; Zhao, Z.; Li, G. Research on Intensive Care Technique for Partial Discharge in High Voltage Cable. In Proceedings of the 2020 IEEE International Conference on Power, Intelligent Computing and Systems (ICPICS), Shenyang, China, 28–30 July 2020; pp. 44–48. [Google Scholar]
- Tsai, P.-C.; Hsueh, Y.-M.; Chen, C.-K.; Kuo, C.-C. Research on a Partial Discharge Expert System for the Diagnosis of Damaged Transformation Equipment. Appl. Sci. 2024, 14, 1195. [Google Scholar] [CrossRef]
- Zhong, J.; Liu, Z.; Bi, X. Partial Discharge Signal Denoising Algorithm Based on Aquila Optimizer–Variational Mode Decomposition and K-Singular Value Decomposition. Appl. Sci. 2024, 14, 2755. [Google Scholar] [CrossRef]
- Yang, Y.; Li, J.; Chen, Z.; Liu, Y.-C.; Chen, K.; Liu, K.; Xin, D.-L.; Gao, G.; Wu, G. Classification of Partial Discharge in Vehicle-Mounted Cable Termination of High-Speed Electric Multiple Unit: A Machine Learning-Based Approach. Electronics 2024, 13, 495. [Google Scholar] [CrossRef]
- Lambeth, P.J. Variable-voltage application for insulator pollution tests. IEEE Trans. Power Deliv. 1988, 3, 2103–2111. [Google Scholar] [CrossRef]
- Mekhaldi, A.; Namane, D.; Bouazabia, S.; Beroual, A. Flashover of discontinuous pollution layer on HV insulators. IEEE Trans. Dielectr. Electr. Insul. 1999, 6, 900–906. [Google Scholar] [CrossRef]
- Xu, Z.; Lv, F.; Li, H. Influencing factors of finite element analysis method for insulator electric field and its optimisation. High Volt. Technol. 2011, 37, 944–951. [Google Scholar]
- Feng, C.; Ma, X. Introduction to Engineering Electromagnetic Fields; Higher Education Press: Beijing, China, 2000. [Google Scholar]
- Tian, Y.; Du, Z.; Liu, S. A method for fine control of the model surface mesh during finite element electric field calculations. Power Autom. Equip. 2019, 39, 205–210. (In Chinese) [Google Scholar]
- Boggs, S.; Densley, J. Fundamentals of partial discharge in the context of field cable testing. IEEE Electr. Insul. Mag. 2000, 16, 13–18. [Google Scholar] [CrossRef]
- Liu, G.; Chen, Z. Test of air gap defect in main insulation of 10 kV XLPE cable terminal. High Volt. Technol. 2012, 38, 678–683. (In Chinese) [Google Scholar]
- Song, M. Application of Finite Element Analysis in electric Field Analysis of catenary Insulator. J. Electr. Eng. 2019, 14, 108–114. (In Chinese) [Google Scholar]
- Chen, C.; Chen, Z.; Shi, X.; She, M.; Liu, Z.; Xin, Y. Effect of “three junction points” on the impact flashover voltage of insulator along the surface. Electr. Porcelain Arrester 2018, 197–201. (In Chinese) [Google Scholar] [CrossRef]
- Gorur, R.S.; Montesinos, J. Electrical performance of cycloaliphatic epoxy materials and insulators for outdoor use. IEEE Trans. Power Deliv. 2000, 15, 1274–1278. [Google Scholar] [CrossRef]
- Liu, M. High Voltage Insulation and Test Technology of Electrified Railway; Southwest Jiaotong University Press: Chengdu, China, 2001. (In Chinese) [Google Scholar]
- Li, L. Study on Pollution Accumulation Characteristics and Electric Field Distribution of roof Insulators of EMU; China Mining University: Xuzhou, China, 2020. (In Chinese) [Google Scholar]
- Yang, Z.; Wu, M. Introduction to Rail Transit Electrification; Introduction to Rail Transit Electrification; China Railway Press: Beijing, China, 2013. (In Chinese) [Google Scholar]
- Yang, Z. Introduction to High-Speed Railway Technology; Tsinghua University Press: Beijing, China, 2015. (In Chinese) [Google Scholar]
- Skopec, A.; Wankowicz, J.G.; Sikorski, B. Electric field calculation for an axially-symmetric insulator with surface contamination. IEEE Trans. Dielectr. Electr. Insul. 1994, 1, 332–339. [Google Scholar] [CrossRef]


Disclaimer/Publisher’s Note: The statements, opinions and data contained in all publications are solely those of the individual author(s) and contributor(s) and not of MDPI and/or the editor(s). MDPI and/or the editor(s) disclaim responsibility for any injury to people or property resulting from any ideas, methods, instructions or products referred to in the content. |
© 2024 by the authors. Licensee MDPI, Basel, Switzerland. This article is an open access article distributed under the terms and conditions of the Creative Commons Attribution (CC BY) license (https://creativecommons.org/licenses/by/4.0/).