Abstract
Cellular materials such as aluminum and polyurethane foams are recognized for their effectiveness in energy absorption. They commonly serve as crushable cores in sacrificial cladding for blast mitigation purposes. This study delves into the effectiveness of autoclaved aerated concrete (AAC), a lightweight, porous material known for its energy-absorbing properties as a crushable core in sacrificial cladding. The experimental set-up features a rigid frame made of steel measuring 1000 × 1000 × 15 mm3 with a central square opening (300 × 300 mm2) holding a 2 mm thick aluminum plate representing the structure. The dynamic response of the aluminum plate is captured using two high-speed cameras arranged in a stereoscopic configuration. Three-dimensional digital image correlation is used to compute the transient deformation fields. Blast loading is achieved by detonating 20 g of C4 explosive set at 250 mm from the plate’s center. The study assesses the mineral foam’s absorption capacity by comparing out-of-plane displacement and mean permanent deformation of the aluminum plate with and without the protective solution. Six foam configurations (A to F) are tested experimentally and numerically, varying in the foam’s free space for expansion relative to its total volume. Results show positive protective effects, with configuration F reducing maximum deflection by at least 30% and configuration C by up to 70%. Foam configuration influences energy dissipation, with an optimal lateral surface-to-volume ratio (ζ) enhancing protective effects, although excessive ζ leads to non-uniform foam crushing. To address the influence of front skin deformability, a non-deformable front skin has been adopted. The latter demonstrates an increased effectiveness of the sacrificial cladding, particularly for ζ values above the optimal value obtained when using a deformable front skin. Notably, using a non-deformable front skin increases maximum deflection reduction and foam energy absorption by up to approximately 30%.
1. Introduction
As a consequence of the escalating occurrence of terrorist attacks and accidental explosions over the preceding decades, it has become imperative to implement preventive measures and make use of blast-resistant techniques to safeguard the structural integrity and survivability of infrastructures. The main idea of blast protection involves interposing a structure between a target and a detonation point [1]. This structure is engineered to achieve several objectives, including mitigating explosive detonation [2,3,4], disrupting blast wave propagation [1,5,6,7,8], or providing passive target protection [9,10,11,12,13,14,15,16]. Bulk water [2], mist [3], or aqueous foam [4] are some of the strategies for mitigating explosive detonation. Conversely, materials of various layers exploit impedance mismatches between layers to disperse the blast wave throughout the structure [5]. Geometry-based designs, including V-shaped plates [6], arrays of cylindrical pipes [7], or three-dimensional grid panels [1], can deflect or disrupt incoming blast waves. Sacrificial cladding (SC) is a passive protective measure that dissipates blast wave energy, enhancing target protection against blast loading [17]. It comprises a crushable core sandwiched between the target structure and a front skin [17,18]. The front skin is meant to evenly distribute blast pressure onto the crushable core, facilitating uniform compression [10,17,19]. The deformation of the crushable core occurs progressively under constant low stress relative to the target’s resistance, absorbing most of the blast-induced energy and potentially protecting the target [20].
Various types of crushable cores with diverse topologies have been proposed, including tubular configurations [21,22,23], honeycomb structures [20,24,25,26], auxetic cores [24], [27,28,29] or cellular solids such as metallic [30,31,32,33], polymeric [16,17,34,35], or mineral foams [36,37,38,39]. The findings of these studies demonstrate that the SC, incorporating these different core types, exhibits significantly higher energy dissipation capabilities in comparison to the unprotected structure [40]. Moreover, comprehensive investigations through experimental studies and numerical simulations have been conducted to thoroughly explore SC’s energy dissipation, response, and failure modes under blast loads. Ma and Ye [9] have developed a load-cladding structure model (LCSM) to assess the foam cladding’s protective effects on main structures subjected to blast loads. This model uses a single degree of freedom (SDOF) system. In the LCSM, the applied blast loading is assumed to be identical both with and without the sacrificial cladding, as the foam’s thickness is negligible compared to the standoff distance. Additionally, two nondimensional parameters are introduced to characterize the relationship between the foam cladding and the protected structure. The investigation revealed that significant improvement in structural resistance against blast loads could be achieved by wisely considering the strength compatibility between the protected structure and the foam core. For instance, SC made of an aluminum foam to reduce blast effects on a simply supported reinforced concrete slab was used by Wu et al. [30]. They evaluated the effectiveness of aluminum foam protection using an SDOF model and a full-field experiment. Results revealed partial compaction of the aluminum foam and significant cracking in the slab throughout its depth and length. The observed results were attributed to the high plateau stress transmitted to the slab.
Addressing the issue of strength mismatch between the protected structure and the foam core, Sun et al. [31] proposed a solution involving a graded core density. Various front skin materials (steel alloy, aluminum alloy, and carbon fiber-reinforced plastic—CFRP) with 1 mm thickness were used when conducting the blast tests. The research indicated that sandwich panels with CFRP face sheets exhibited superior performance, probably due to the lightweight, high stiffness-to-weight and strength-to-weight ratios of CFRP face sheets. Furthermore, it was demonstrated that panels with a positive core density gradient (decreasing core density along the blast direction) had better blast resistance than those with uniform core density. In contrast, a negative core density gradient resulted in the worst blast resistance.
Although numerous studies rely on the LCS model [17,21,24,27,30,31,35,41], it is worth noting that the foam thickness can no longer be neglected compared to the standoff distance when dealing with close-in explosions [42]. Maintaining a constant distance between the detonation point and the protected structure results in a systematically increased blast-induced energy (referred to as energy input hereafter) transfer to the system upon adding SC. Aminou et al. [36,37] experimentally and numerically studied the influence of the mineral foam thickness in sacrificial cladding while maintaining a constant standoff distance between a fixed aluminum plate (representing the protected structure) and the explosive charge. The mineral foam is sandwiched between the protected structure and a front skin made of aluminum. Blast loading is induced by detonating 20 g of C4 explosive positioned 250 mm from the protected structure’s center. Two configurations of mineral foam with different thicknesses, 60 mm and 120 mm, were examined. Their findings suggest that compartmentalized configurations with appropriate spacing between foam volumes can enhance energy dissipation, thereby improving blast mitigation of the SC. Despite the increased energy input associated with the thickness of the mineral foam layer, the results demonstrate a reduction of at least 50% of the maximum deflection at the plate’s center when the foam is added. However, Zhou et al. [42] reported results regarding the protective performance of SC that may not be expected. They investigated increased blast-induced energy on the cladding structure system through experimental tests and numerical simulations. Initial blast tests were performed on steel plates with and without SC, using TNT equivalent charge masses of 400 and 1400 g. The concept of positive and negative protection effects of sacrificial cladding was introduced. A positive protective effect means less energy is transmitted to the steel plate with cladding than to the plate without cladding. Otherwise, it is a negative protection effect. The results indicated a positive effect with the 400 g charge mass but a negative effect with the 1400 g charge mass. Subsequent numerical simulations validated by experimental data were conducted to explore blast mitigation performance. The simulations revealed that using SC significantly increases the energy transferred to the cladding structure system during close-in detonation. A negative protection effect is observed when the transferred energy exceeds the SC’s energy absorption capacity. Factors such as front skin thickness, core density, and standoff distance were investigated, indicating that a close-in detonation with a reduced standoff distance and the same explosive charge mass could lead to a negative protection effect. To obtain a positive protection effect with the SC, enhancing core density and increasing front skin thickness are viable measures that simultaneously reduce energy input and improve energy absorption capacity. In a numerical study, Kostopoulos et al. [19] compared two SCs with different core configurations, namely conical-array and single-volume cores, subjected to the same blast loading. The conical-array core is more effective than the single-volume core in distributing the blast load over time and keeping the peak force low. The current investigation aims to assess the protective effectiveness of a calcium-silicate-based mineral foam SC through experimental and numerical means. The energy absorption of the core is investigated through a compartmentalized foam configuration. Experimental evaluation involves studying the reduction in maximum deflection of a fixed aluminum plate (representing the protected structure) under blast loading conditions. Initially, the dynamic response of a bare aluminum plate subjected to blast loading is examined, followed by studies with the addition of three different configurations of mineral foam layers. The study maintains a constant explosive charge mass and distance from the structure to the detonation center, reducing the standoff distance upon adding the SC, thereby increasing the energy transfer to the cladding structure system. Using a validated numerical model provided in [37], the influence of factors such as explosive charge mass and mineral foam core configuration is evaluated.
This paper is structured into four primary sections. First, a detailed description of the air-blast experiments, along with the corresponding experimental findings, is provided. In the Section 3, the numerical modeling approach is presented. This is followed by a comparative analysis between the experimental and numerical results, complemented by a parametric study. Finally, the concluding remarks are presented.
2. Air-Blast Experiments
2.1. Main Structure and Front Skin Materials
The main structure and the front skin are made from aluminum plates of the EN AW 1050A-H24 alloy. This alloy, composed of 99.5% pure aluminum, undergoes annealing and work hardening through rolling. Uni-axial tensile tests on samples of 2 mm thickness to study their static mechanical properties were conducted by Louar et al. [43]. The material mechanical properties along the longitudinal (0°) and transversal (90°) directions relative to the rolling direction are compared. They found that the material exhibits nearly isotropic properties with slight variations in failure strain and yield stress. This aluminum alloy’s mechanical properties are as follows: Young’s modulus of 69 GPa, yield strength of 75 MPa and tensile strength of 115 MPa.
2.2. Calcium-Silicate-Based Mineral Foam as Crushable Core
The crushable core used in this study is made from autoclaved aerated concrete (AAC). This material features a brittle, closed-cell microstructure and is classified as mineral foam with a density of 110 kg/m3 and a porosity of 95%. The foam composition includes 70–80% by weight of calcium-silicate hydrate, less than 2% of quartz, 15–20% of calcite, and 3–8% gypsum. This mixture is stabilized in an autoclave at 12-bar pressure and approximately 190 °C. Uni-axial quasi-static compression tests were performed at a 1 mm/min crushing velocity for static properties. The foam exhibits Young’s modulus of 30 ± 2 MPa, a plateau stress of 237 ± 11 kPa and a densification strain of 72 ± 1% [37].
2.3. Experimental Set-Up
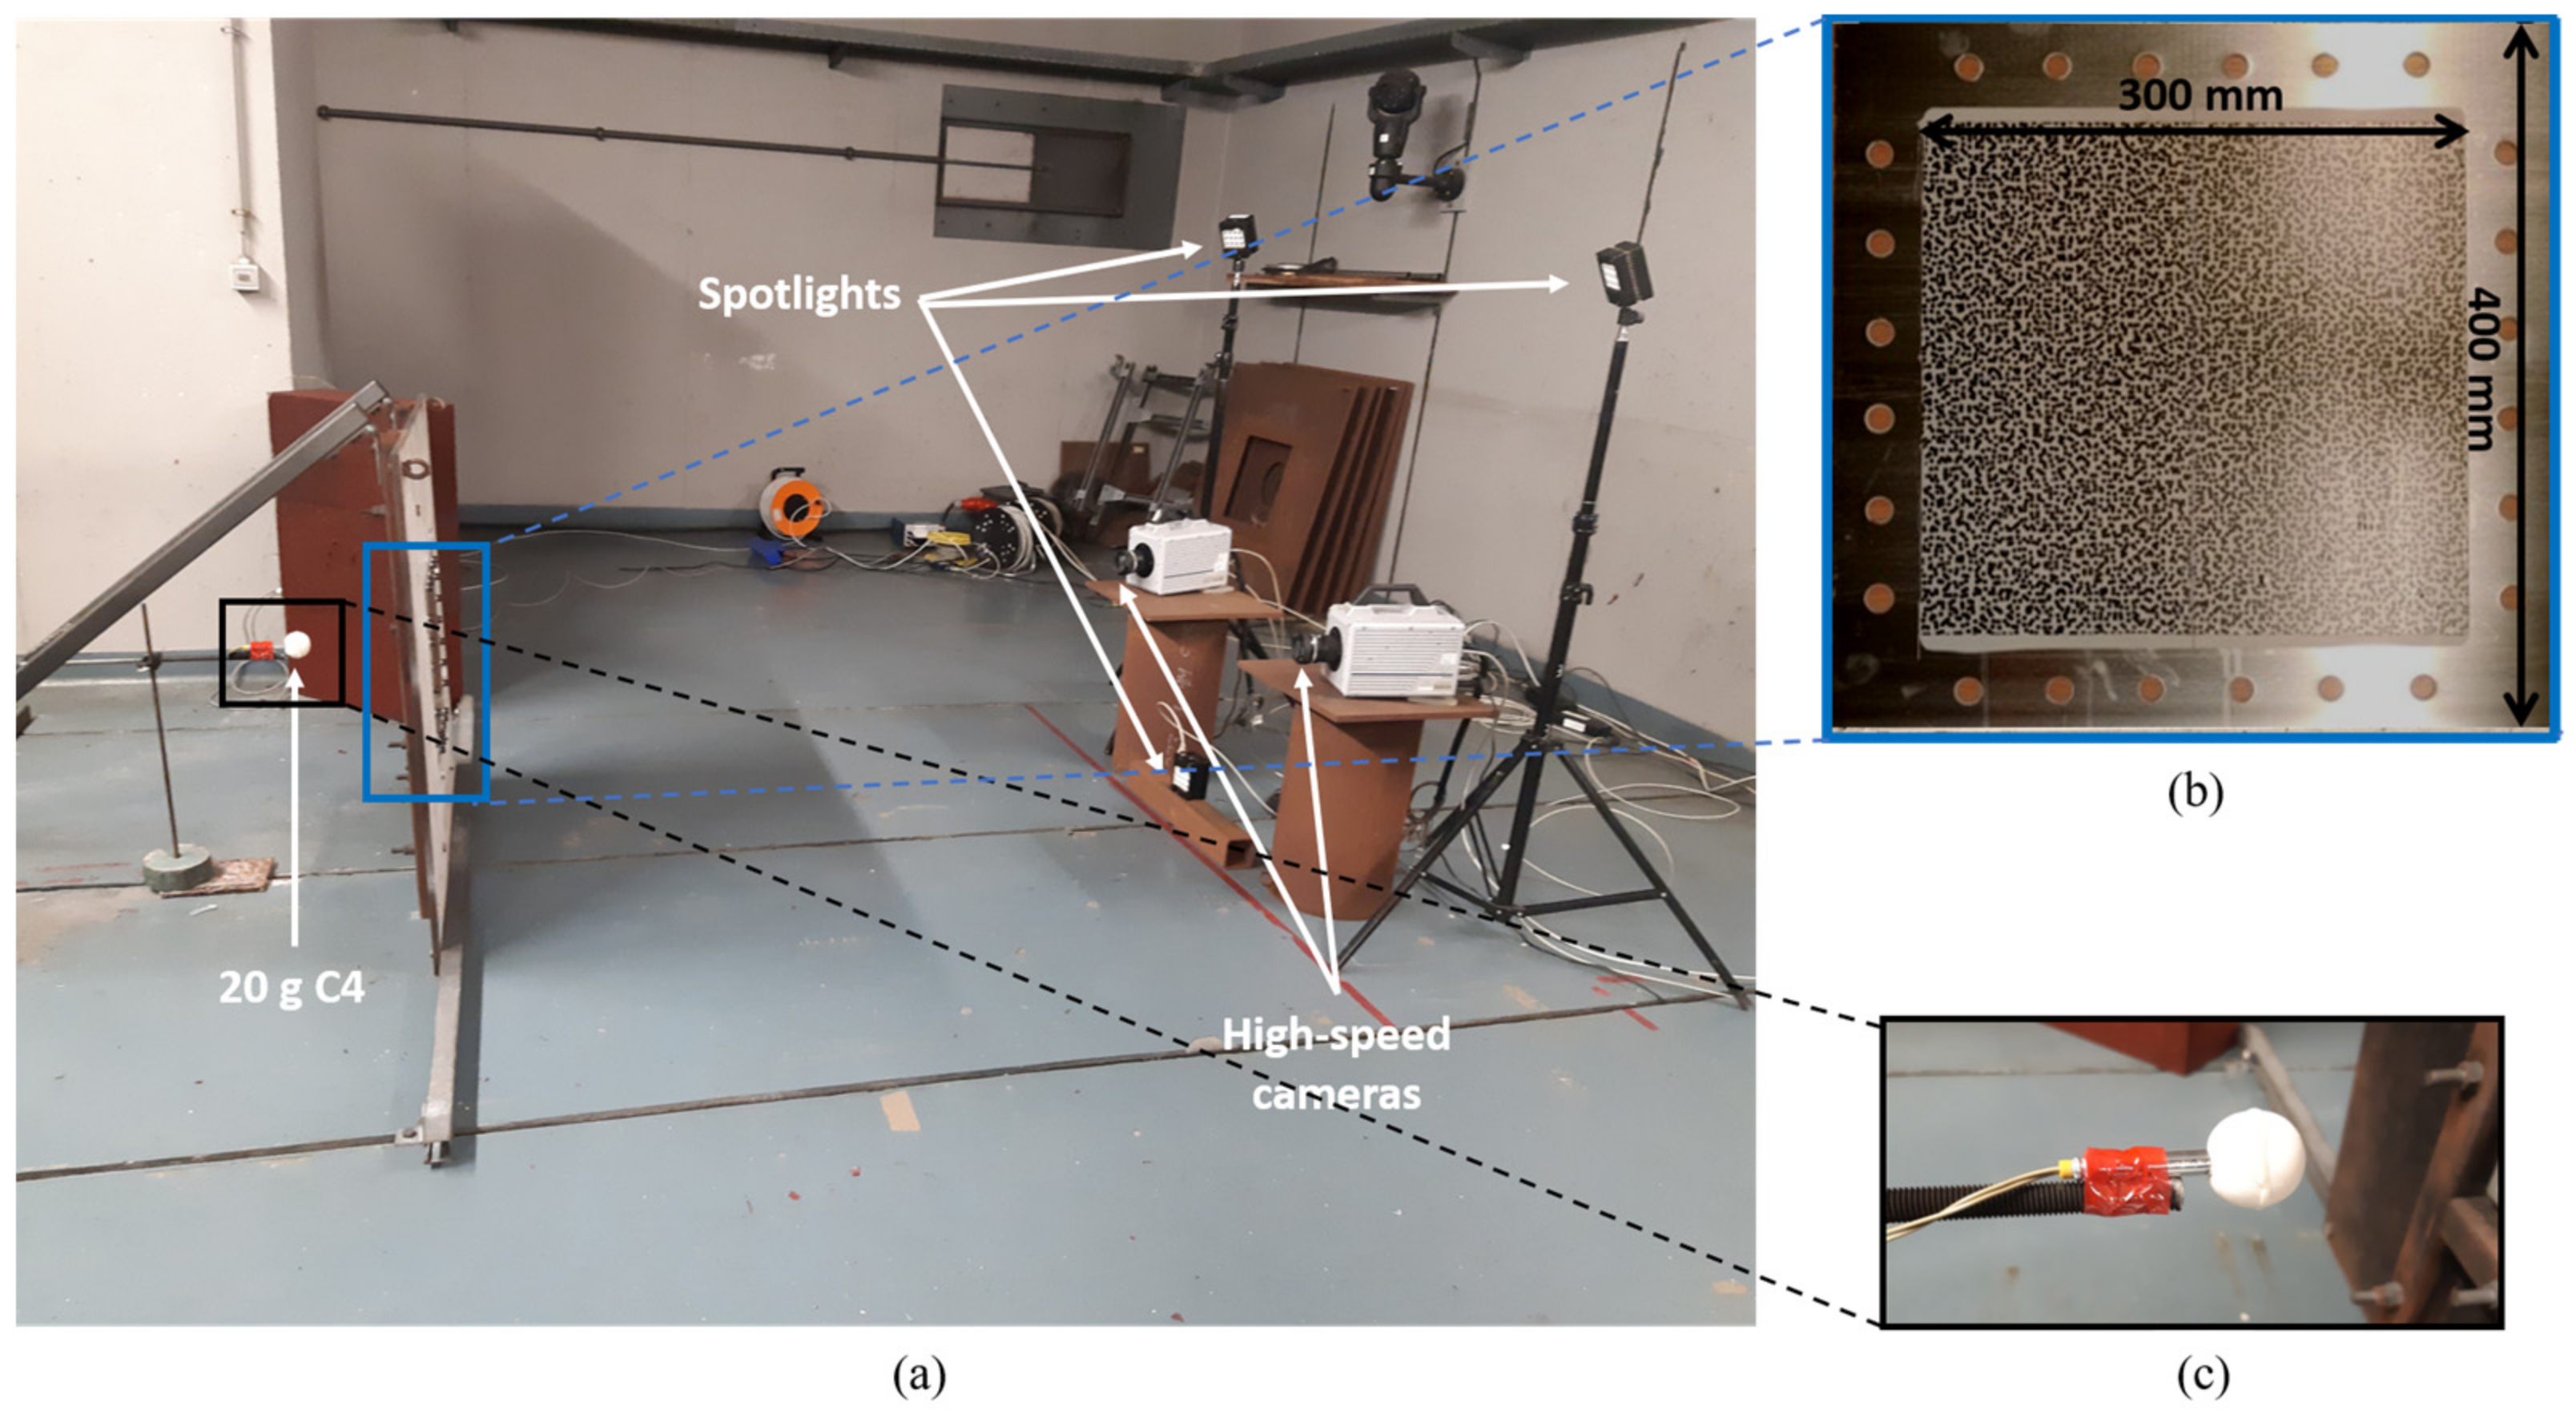
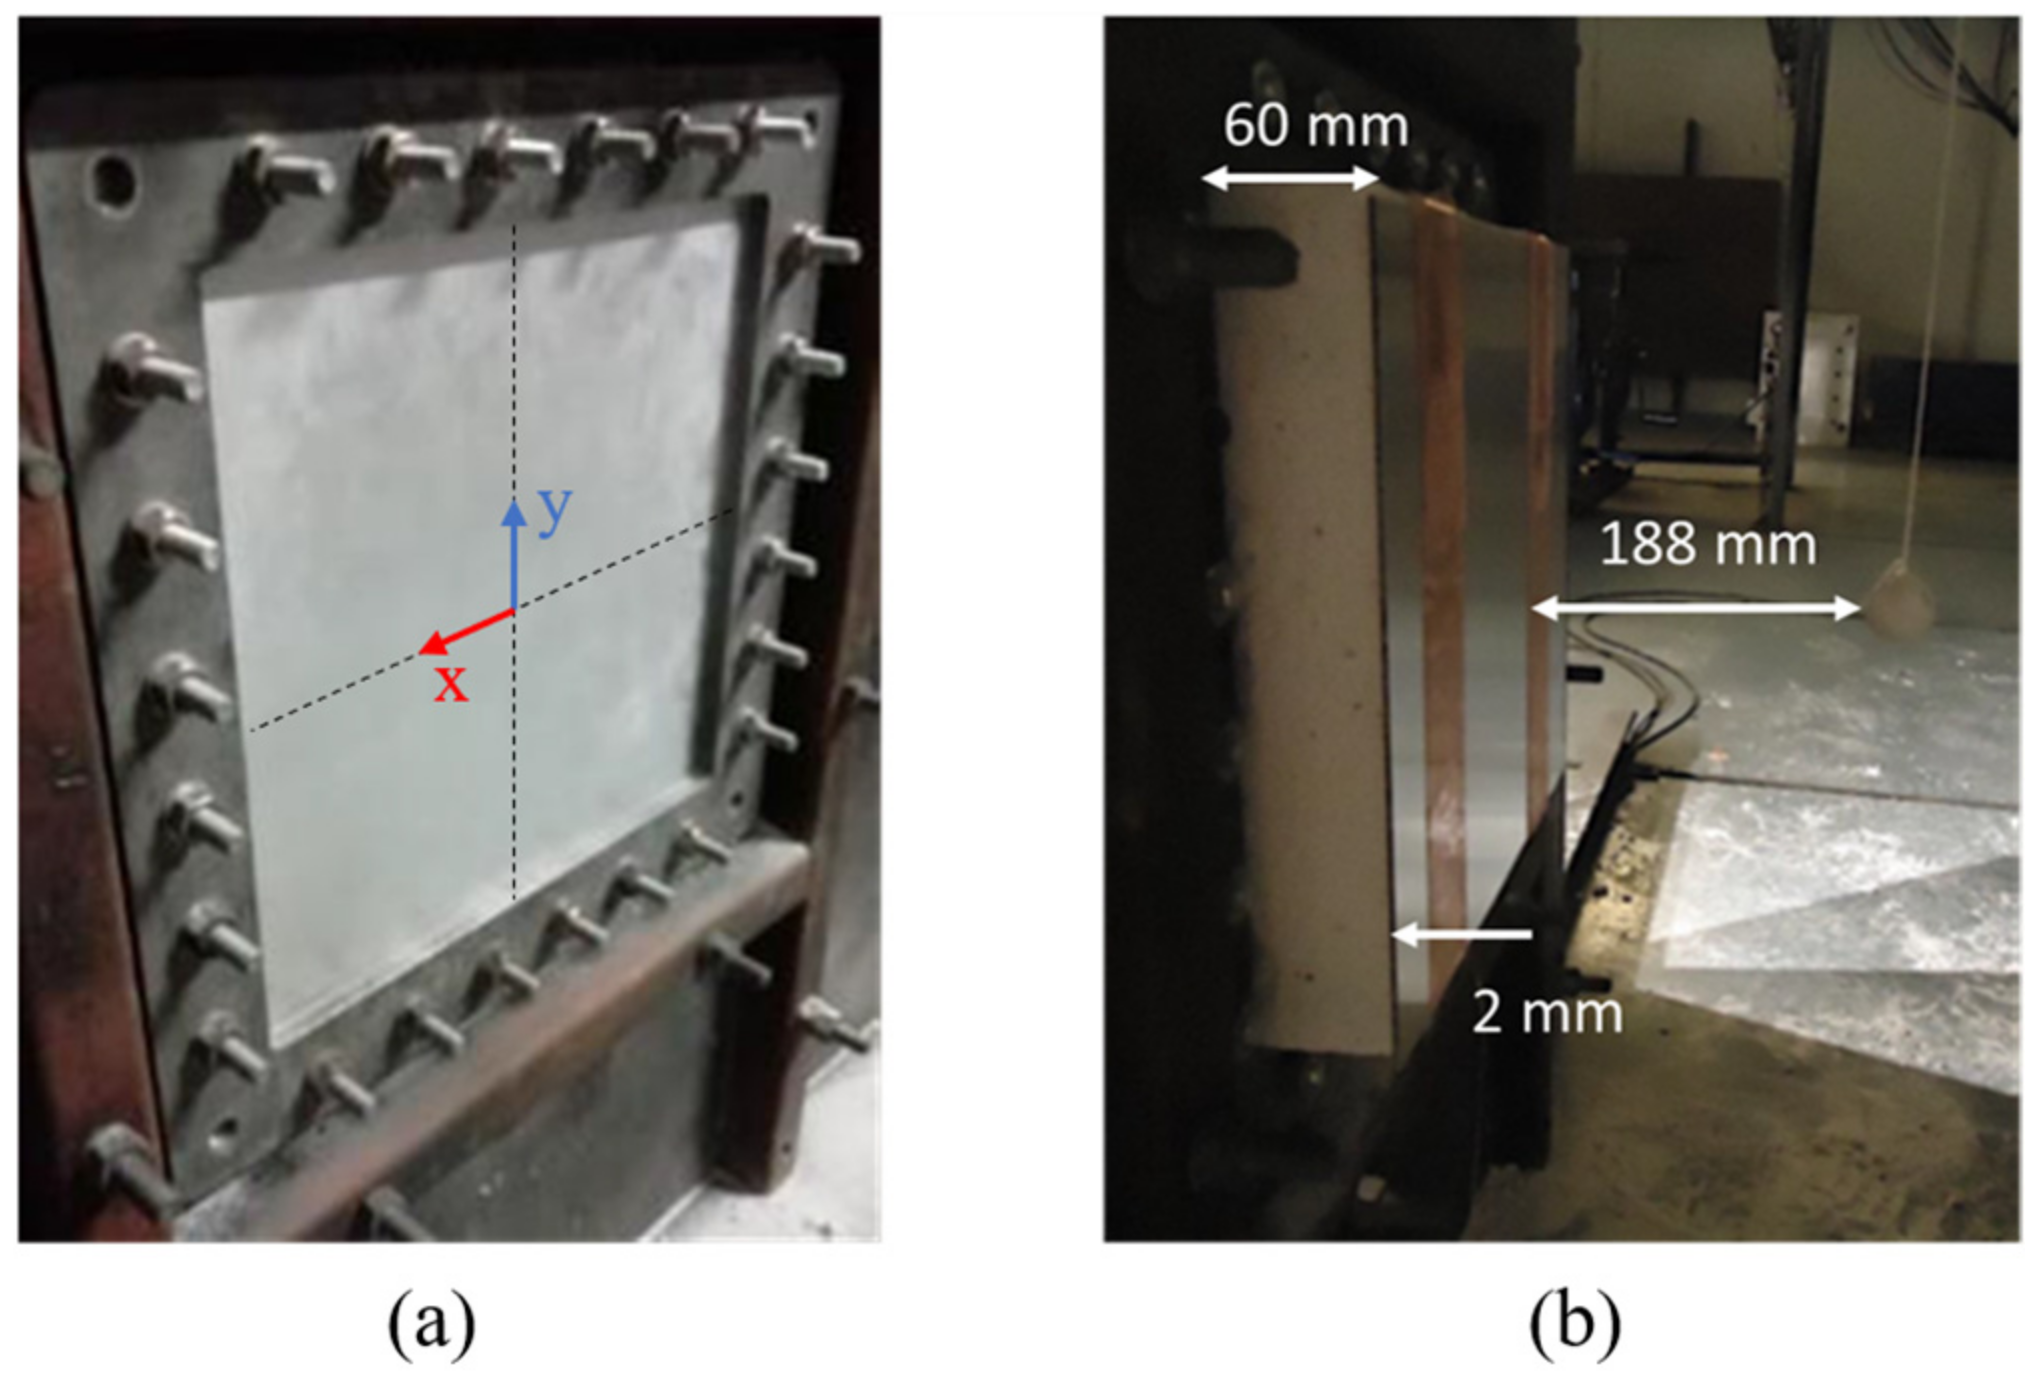
The experimental set-up shown in Figure 1a is used to investigate the absorption capacity of the calcium-silicate-based mineral foam. It comprises a rigid frame made from steel measuring 1000 × 1000 × 15 mm3, featuring a central square opening of 300 × 300 mm2. Within this frame, a square aluminum plate sample (Figure 1b), measuring 400 × 400 mm2 with a thickness of 2 mm, is securely clamped. By using bolted connections and a clamping frame (Figure 2a), clamping is achieved to establish fixed boundary conditions. A wrench is used to tighten the bolts, applying a torque of 100 Nm. Following the recommendation for M12 bolts [44], this torque corresponds to a preloading force of 41 kN.
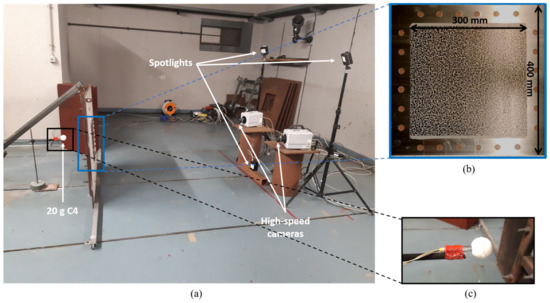
Figure 1.
(a) Overview of the set-up showing the steel frame, two high-speed cameras (Photron Fastcam SA5, Photron, Bucks, UK) arranged stereoscopically, and three LED spots; (b) speckle pattern applied on the aluminum backplate (EN AW-1050 A H24, Thyssenkrupp, Brussels, Belgium) enabling measuring the displacement and in-plane strain fields; and (c) 20 g of C4 explosive charge in a spherical shape and electric detonator.
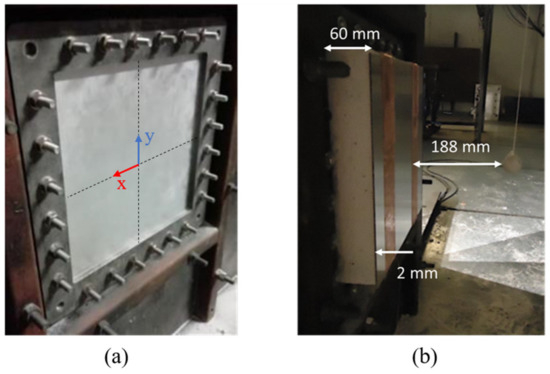
Figure 2.
Tested samples (a) backplate without foam and (b) backplate with mineral foam of 60 mm thickness and front skin of 2 mm thickness.
Two Photron Fastcam SA5 high-speed cameras (Photron) are arranged stereoscopically. Each is positioned 1100 mm from the aluminum plate’s center. Images are recorded at 20,000 frames per second. Recording begins when an electric circuit is intentionally disrupted during detonation. The selected shutter time is 25 microseconds. Anticipating significant out-of-plane displacements (OPDs), the camera apertures are reduced to increase the depth of field. To compensate for the reduced aperture, the area of interest is illuminated using three high-intensity LED lights (Correlated Solutions, Irmo, SC, USA). The captured images have a resolution of 512 × 512 pixels to cover the 400 × 400 mm2 plate surface, resulting in a pixel size of 0.78 mm/pixel. A subset size of 21 × 21 pixels with a subset spacing of 3 pixels and a strain filter of 15 is used for the digital image correlation (DIC) process using VIC 3D 2007 software.
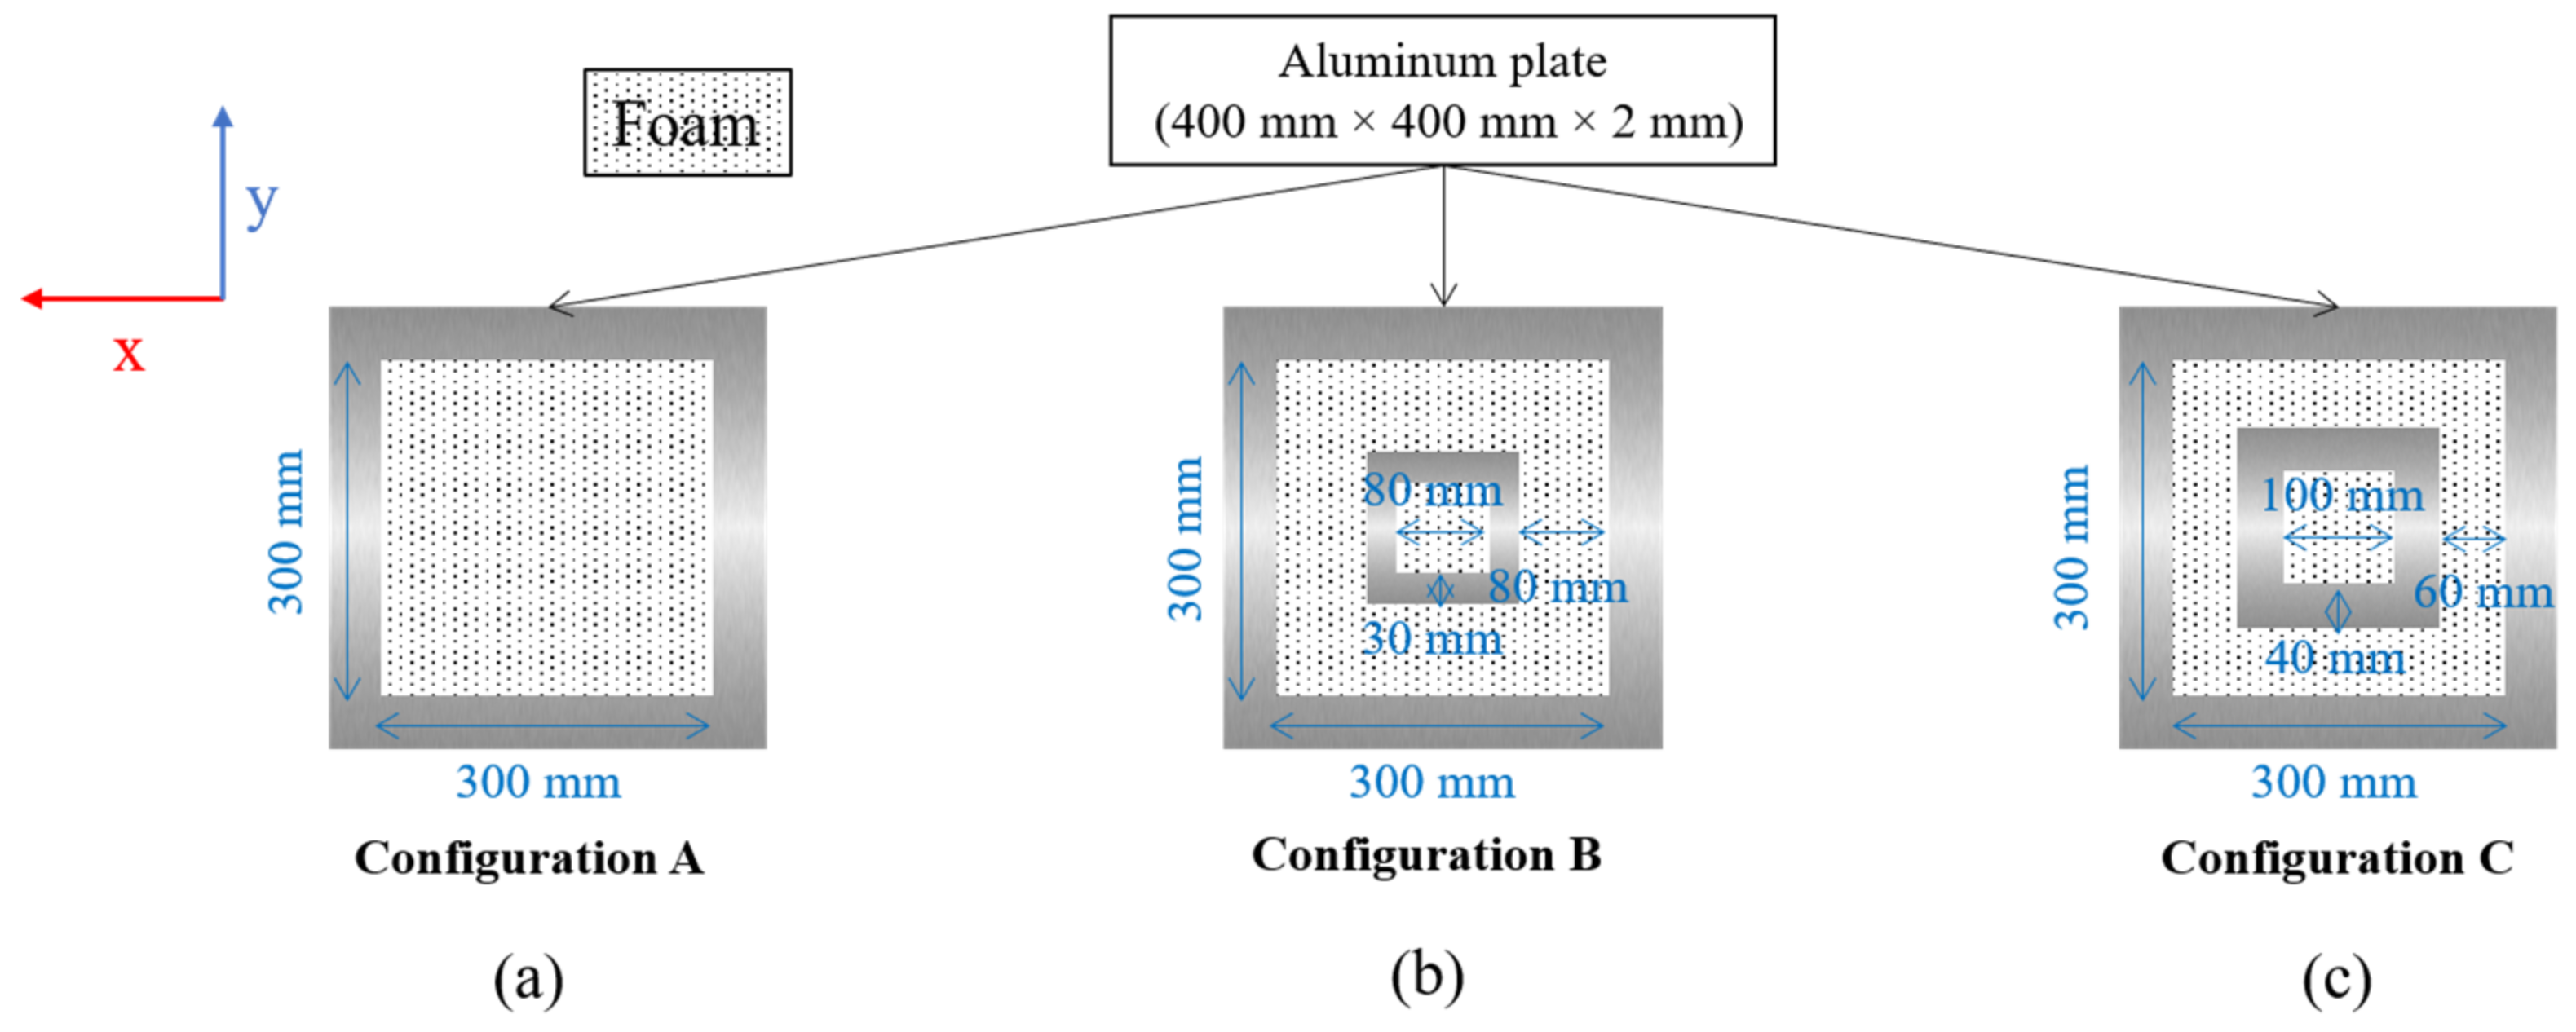
The response of the bare aluminum plate to that of the plate protected with three distinct configurations of mineral foam, as shown in Figure 3, are compared to evaluate the effectiveness of the SC. The difference between the three foam configurations lies in the free space available for the foam to expand compared to the total volume of the foam. Therefore, the ratio ζ, denoting the ratio between the lateral surface for the foam to expand and the total volume of the foam is introduced.
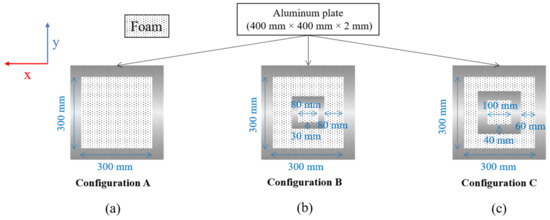
Figure 3.
60 mm thick foam in single-volume (a) and spaced foam (b,c) configurations adopted for the experimental tests.
The values of ζ are increased progressively from configuration A to configuration C. Three tests are performed per configuration to evaluate the repeatability of the measurements. The loading is generated by detonating 20 g of C4 (25 g TNT equivalent) positioned 250 mm from the tested plates’ center. The selection of explosive mass and standoff distance is intended to induce significant inelastic deformation of the aluminum plate. The detonation is initiated using an electric detonator containing 1 g of PETN. Figure 1c provides a detailed view of the explosive charge, detonator and their respective positions.
The foam samples are extracted from panels with a 60 mm thickness, resulting in a standoff distance of 188 mm (considering the 2 mm thick front skin made of aluminum, as illustrated in Figure 2). A double-sided self-adhesive tape is used to secure the mineral foam. This tape is applied to both the aluminum backplate and the front skin. Attaching the foam in this manner ensures a secure bond between the foam and the aluminum components while avoiding any increase in the overall structural strength.
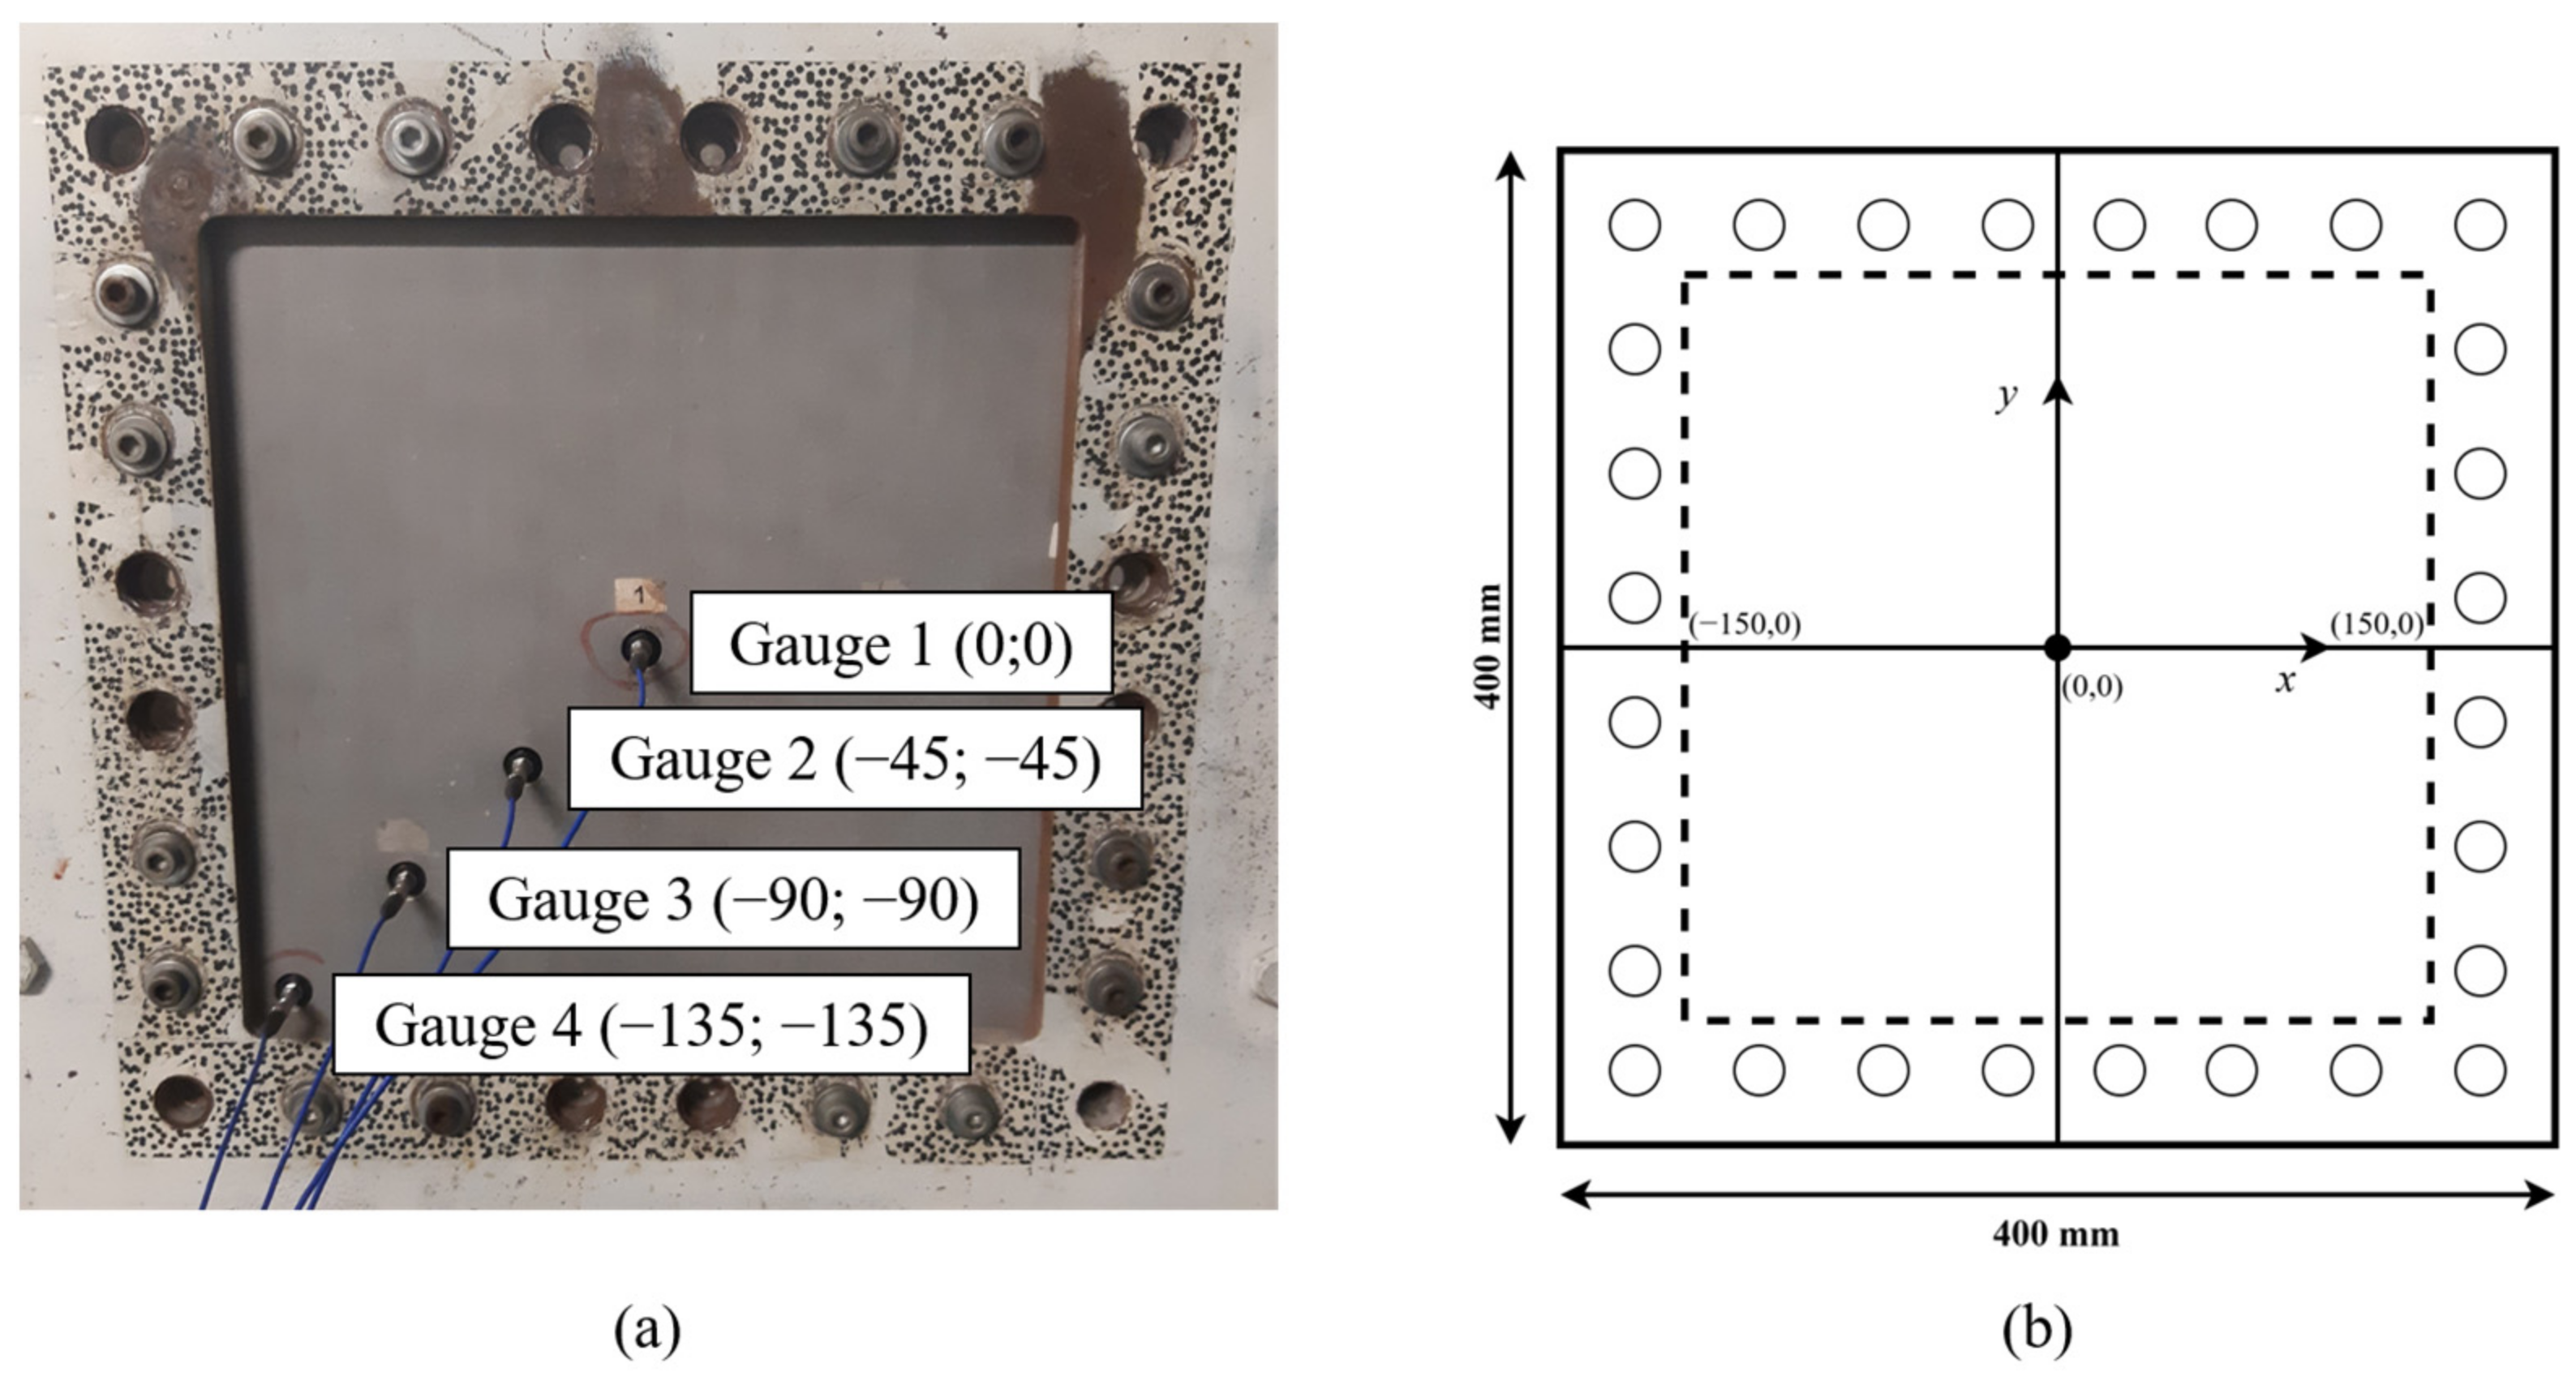
To prepare for testing the 2 mm thick aluminum plates under blast conditions, preliminary experiments were conducted using a 15 mm thick aluminum plate. The primary aim of these experiments was to assess the pressure distribution across a rigid plate, which was then used to analyze how this distribution changes on the front surface as the standoff distance varies. The reflected pressure–time data were recorded with piezoelectric pressure sensors embedded in the plate. These tests employed a 20 g C4 explosive charge placed at distances of 250, 188, and 128 mm, corresponding to scenarios with no foam, a 60 mm foam layer and a 120 mm foam layer, respectively. Figure 4a details the positions of the four high-pressure transducers (PCB QUARTZ ICP 102B04, PCB® piezotronics, Depew, NY, USA), located at coordinates (0, 0), (−45, −45), (−90, −90), and (−135, −135) relative to the axes shown in Figure 4b. To ensure the reliability of the results, each test at the specified distances was repeated three times.
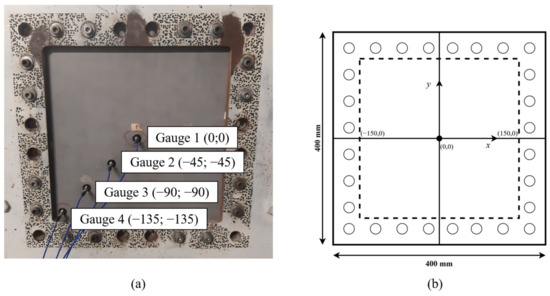
Figure 4.
(a) Thick aluminum plate equipped with four high-pressure transducers; and (b) Schematic of the geometry of aluminum plate specimen.
2.4. Results from Experiments
2.4.1. Blast Loading
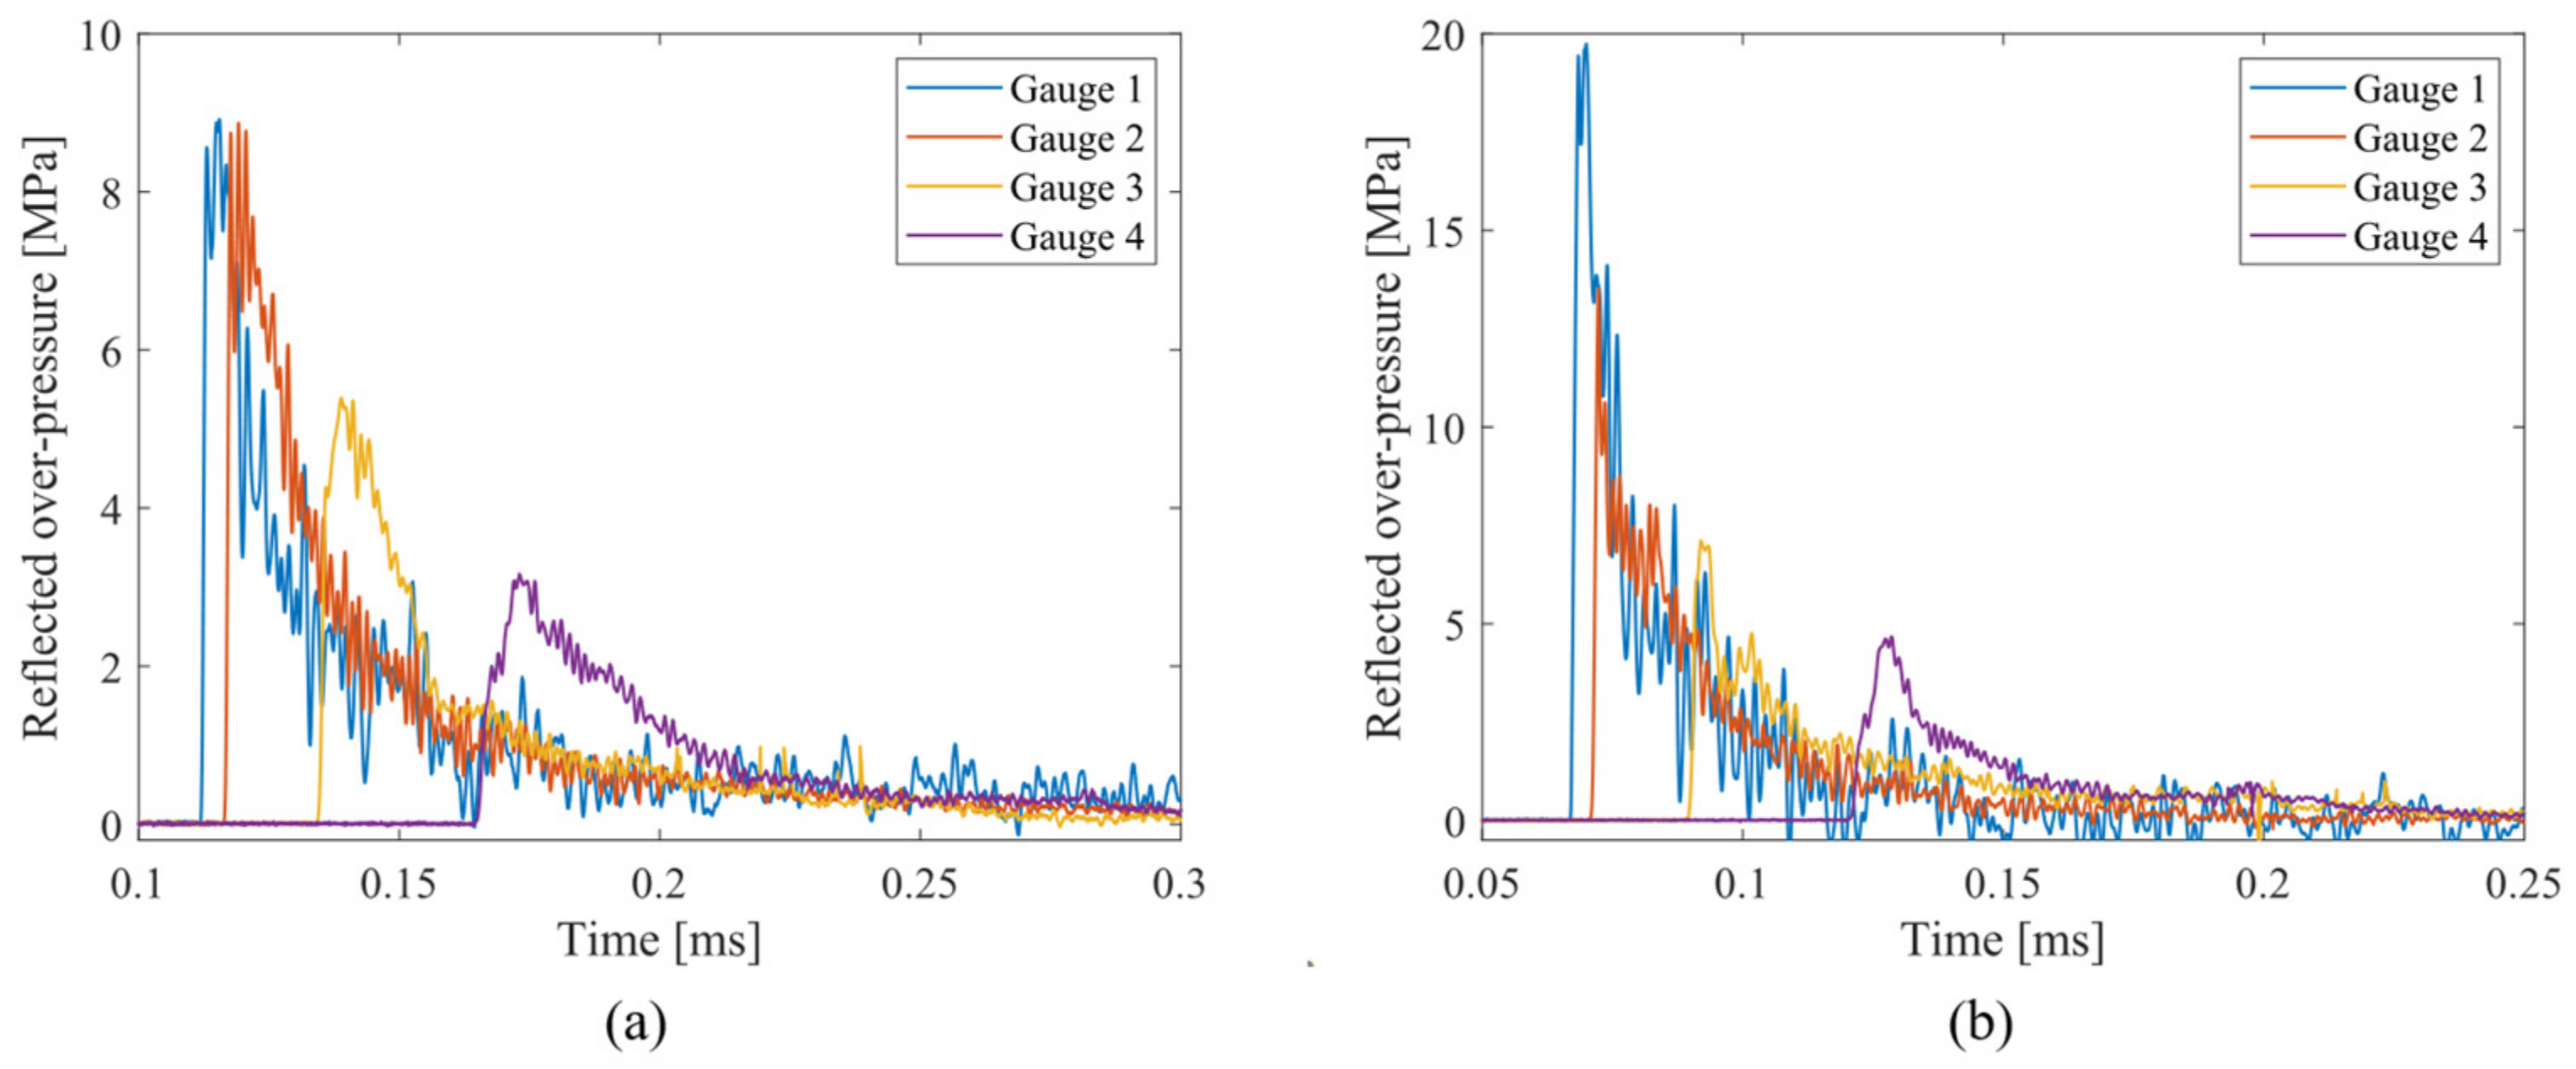
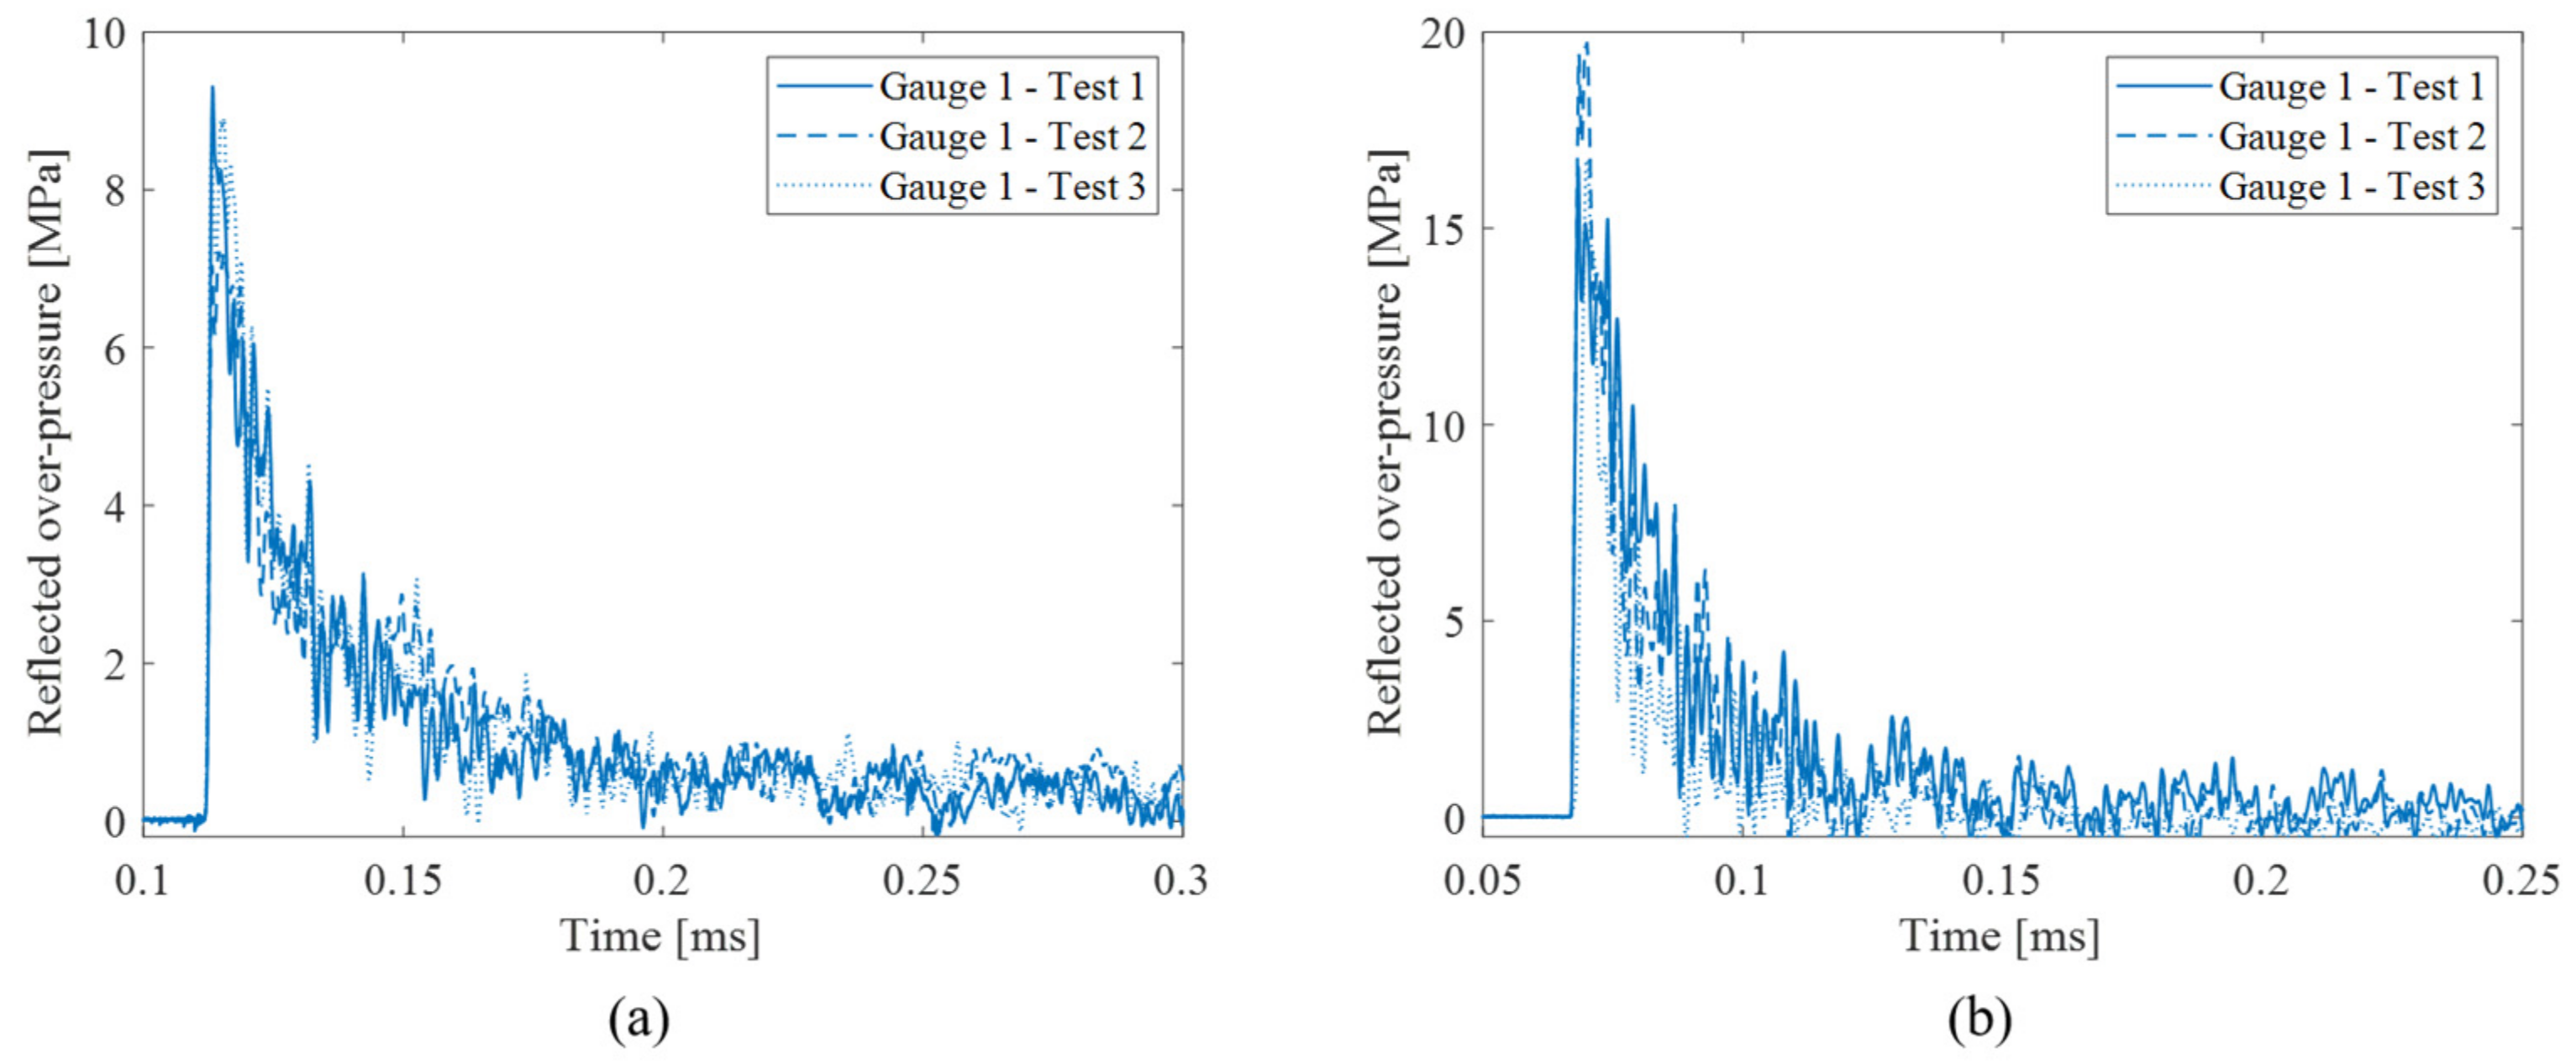
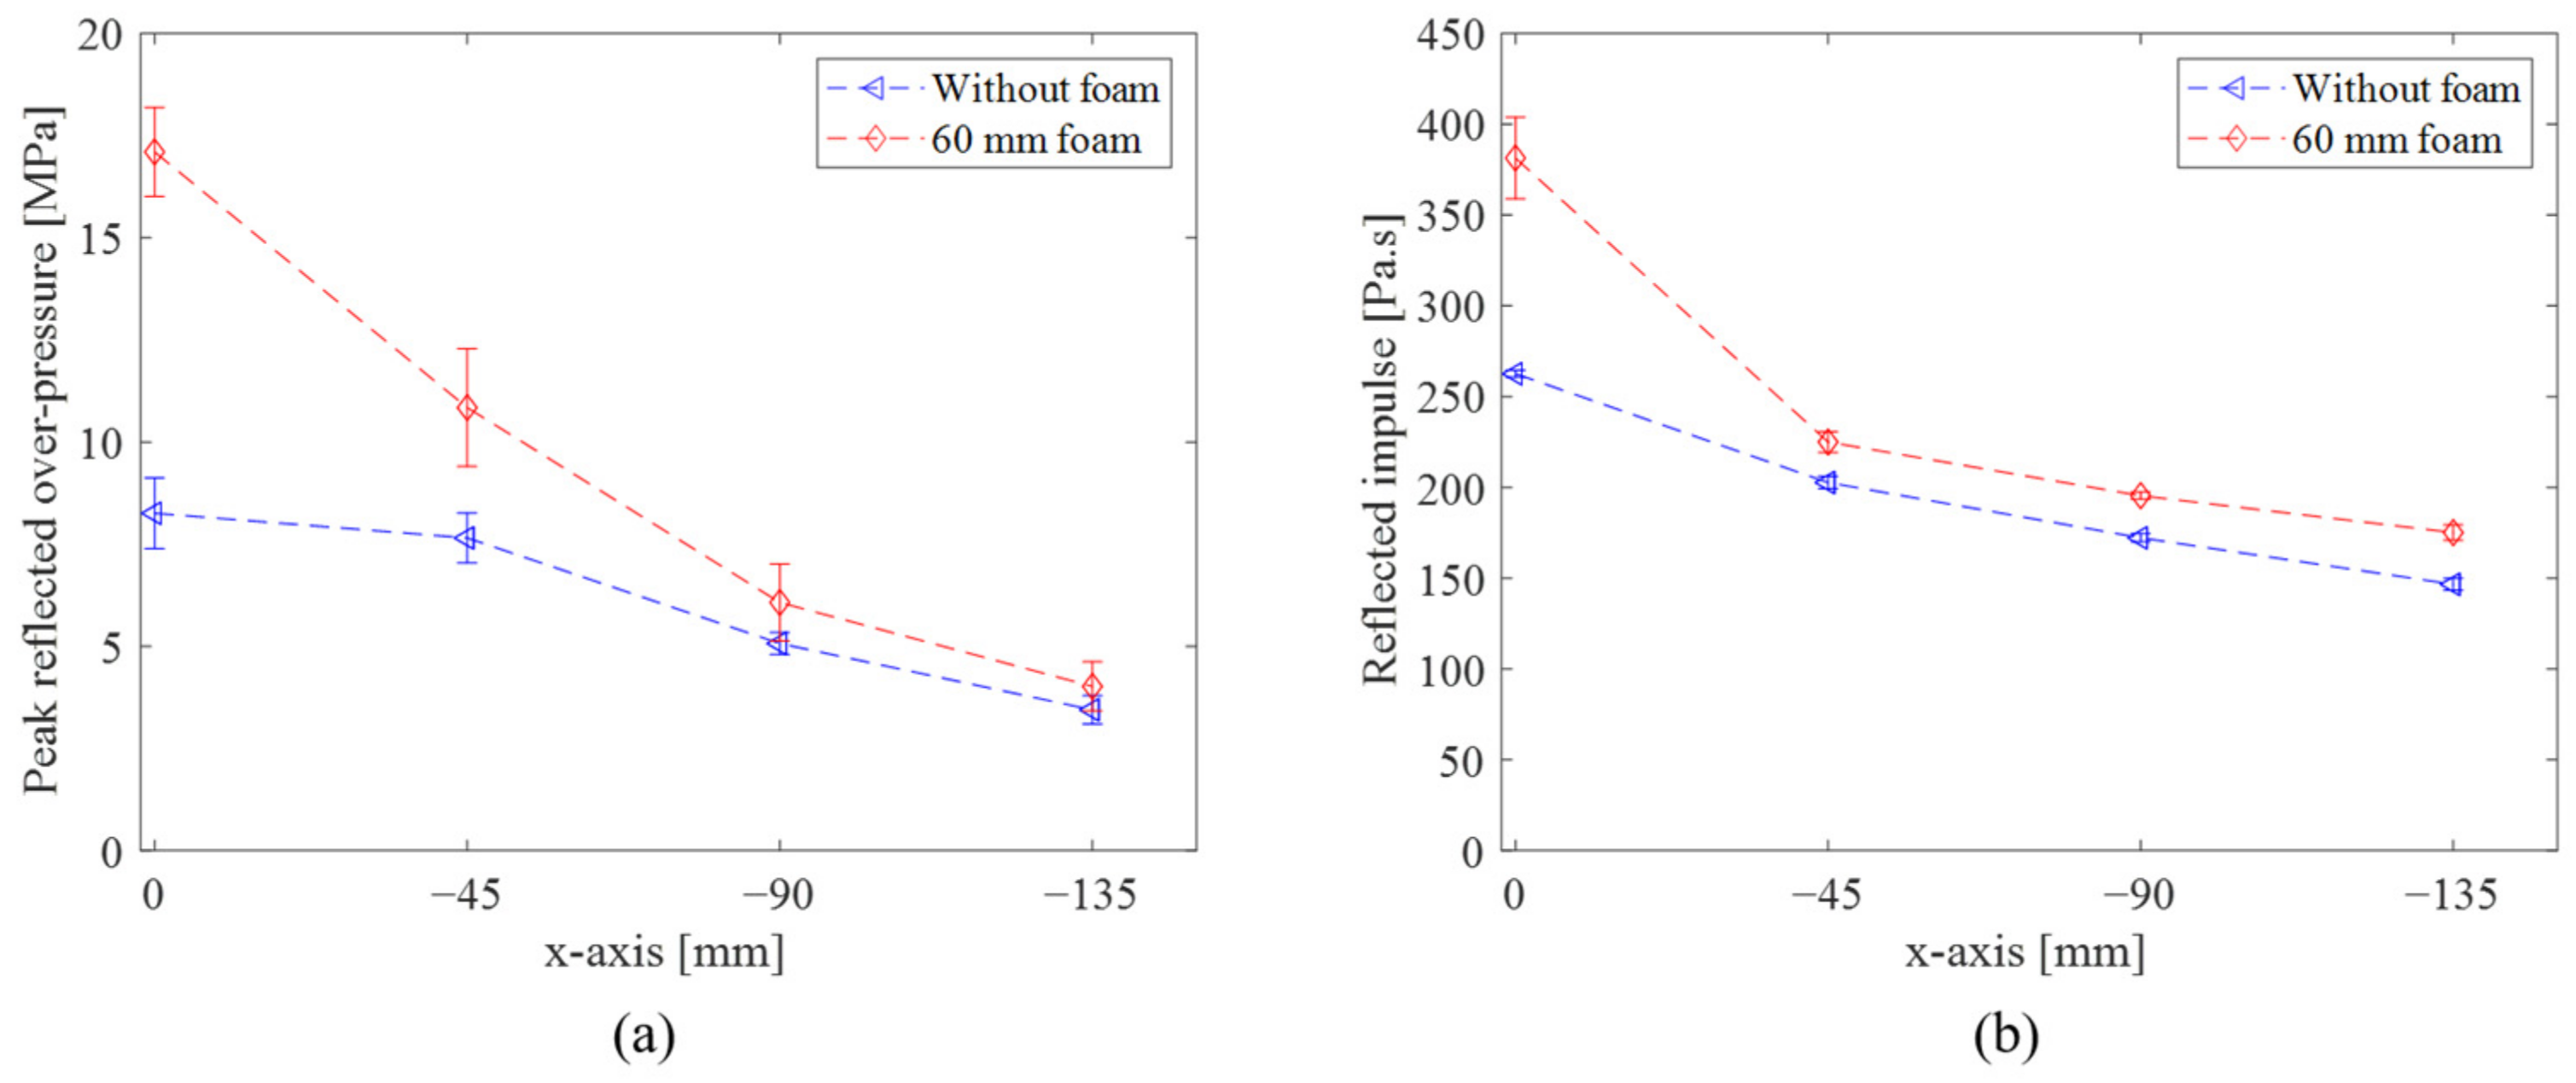
Figure 5 presents the pressure–time profiles captured by the various sensors, while Figure 6 illustrates the repeatability of the measurements. For clarity, only the data from Gauge 1 are shown in Figure 6 to avoid overcrowding the graph. Moreover, Figure 7 depicts the mean reflected peak over-pressures and impulses, along with their standard deviations, under the two different loading conditions. The measured maximum reflected over-pressure and impulse without the protective foam are 8.3 ± 0.9 MPa and 263 ± 2 Pa.s, respectively. Upon adding a 60 mm foam layer, the reflected pressure and impulse increase to 17.6 ± 1.1 MPa and 381 ± 18 Pa.s, respectively.
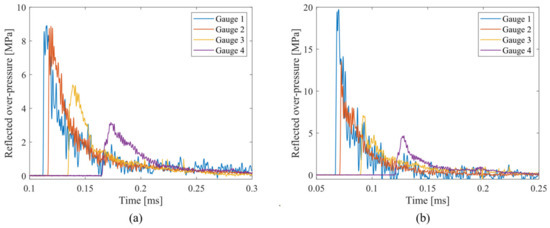
Figure 5.
Pressure–time histories for 20 g of C4 set at (a) 250 mm and (b) 188 mm.
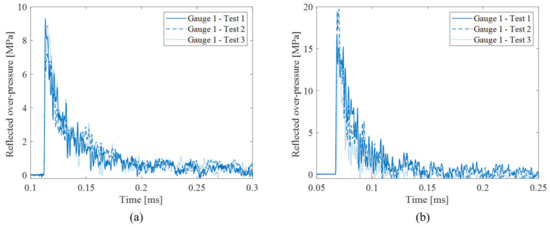
Figure 6.
Pressure–time histories from Gauge 1 in three different tests to assess the reproducibility of 20 g of C4 set at (a) 250 mm and (b) 188 mm.
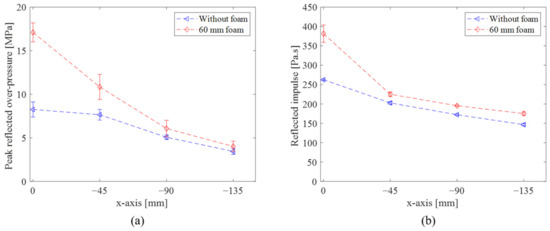
Figure 7.
Mean (a) peak pressures and (b) impulses along with their standard deviations with and without the sacrificial cladding.
2.4.2. Response of the Bare Aluminum Plate
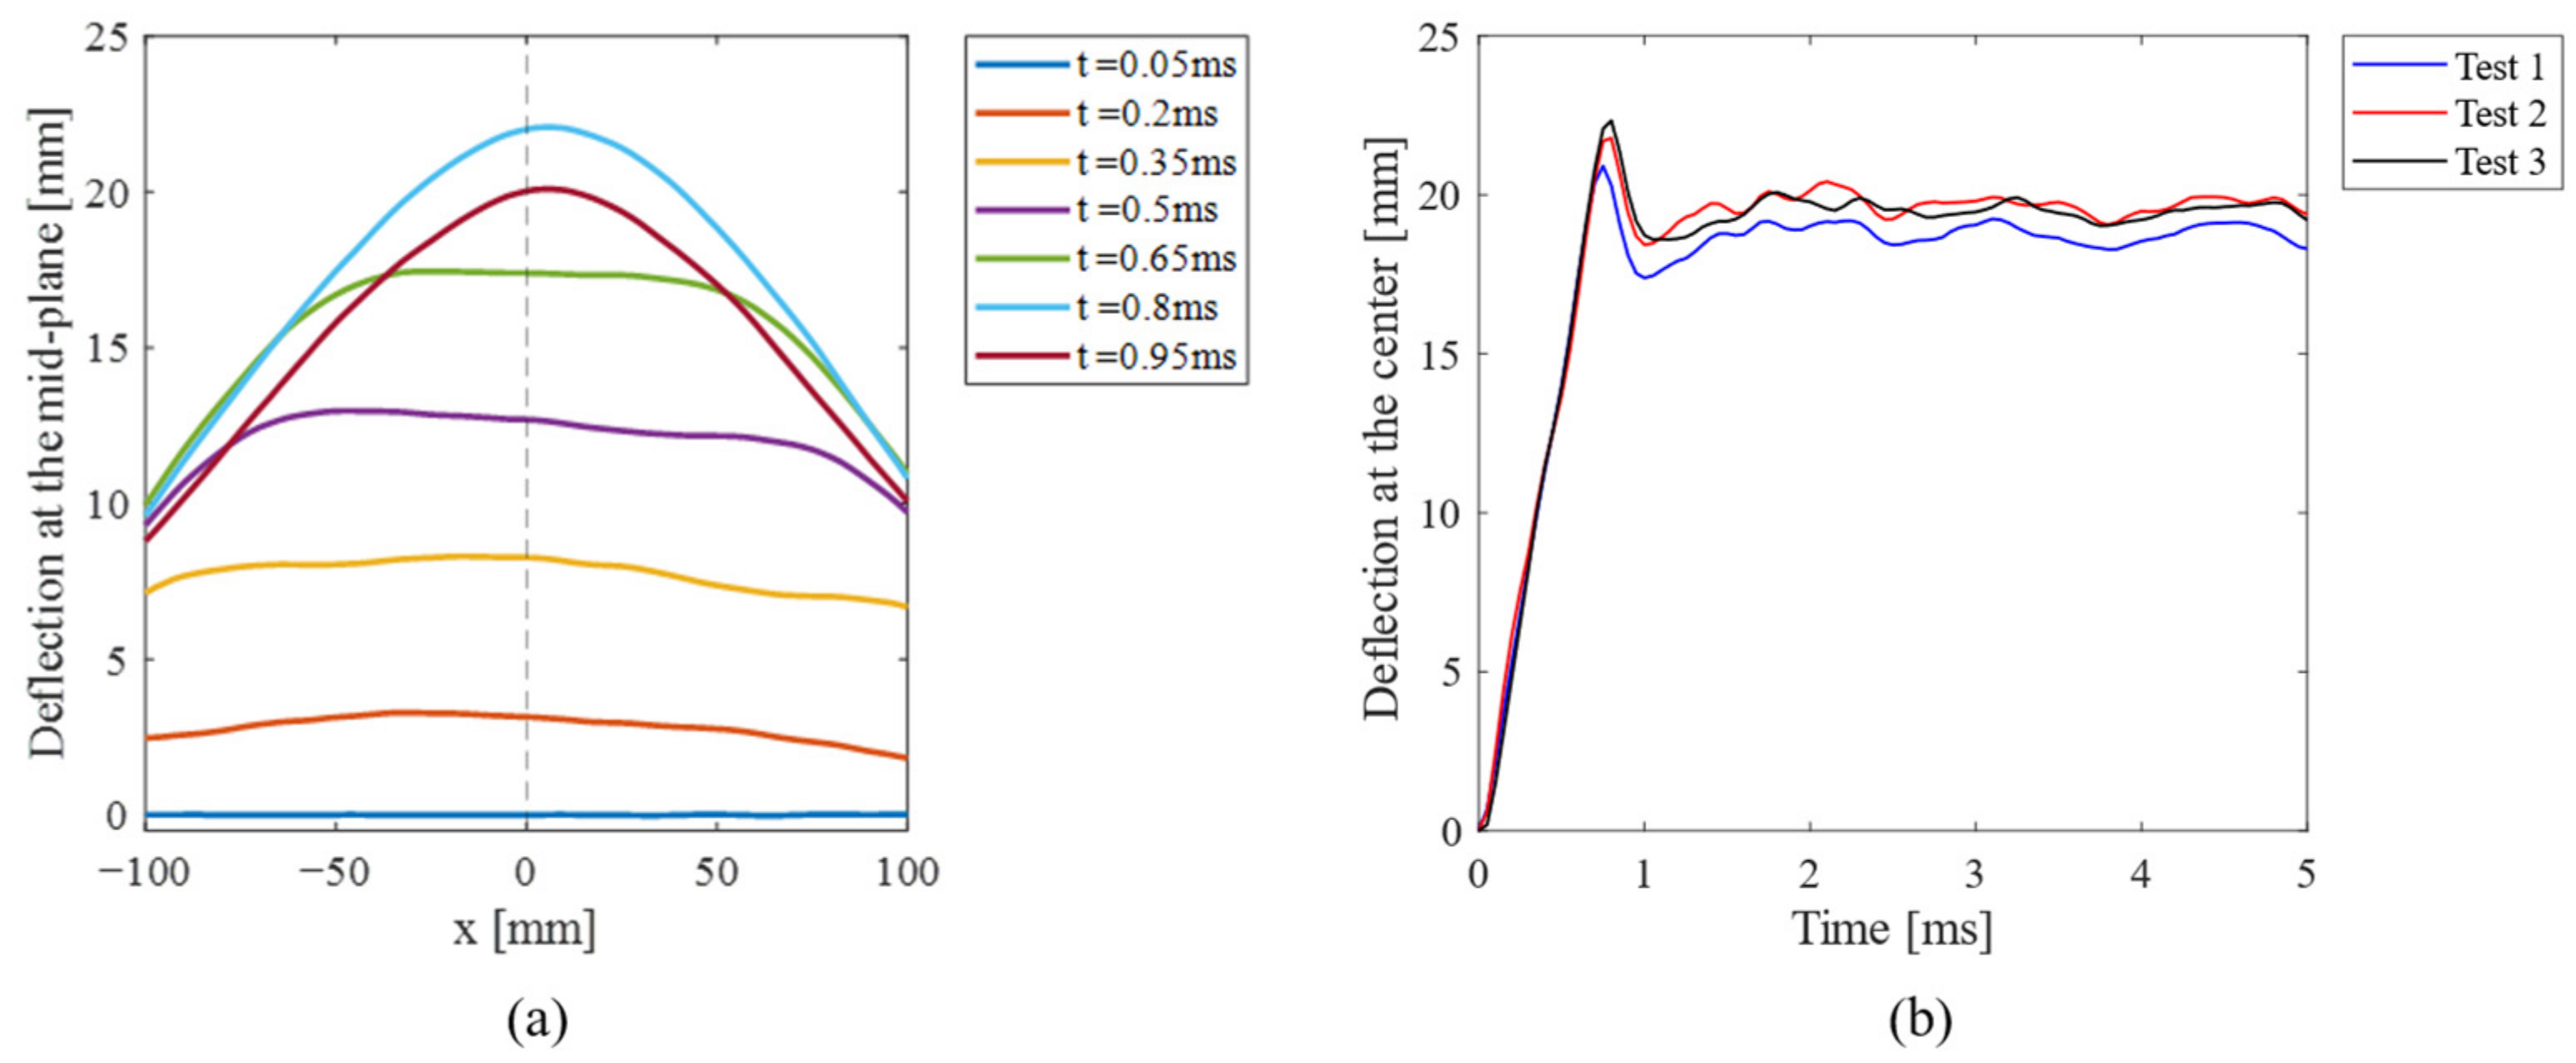
The out-of-plane deflection (OPD) at the mid-plane and the deflection at the center of the unprotected backplate are shown in Figure 8, deduced from the DIC measurements. As described in [36], the plate’s response can essentially be divided into two stages. Initially, when the shock impulse occurs, all material points on the plate move out-of-plane with initial velocities. Subsequently, after the shock wave dissipates, additional plate deformation arises solely from the imparted momentum and the clamping conditions. As depicted in Figure 8b, the central OPD reaches its peak value, i.e., around 21 mm, within the first millisecond, followed by an elastic rebound (recovery phase [45]) and subsequent elastic oscillations. Ultimately, a degree of plastic deformation becomes evident.
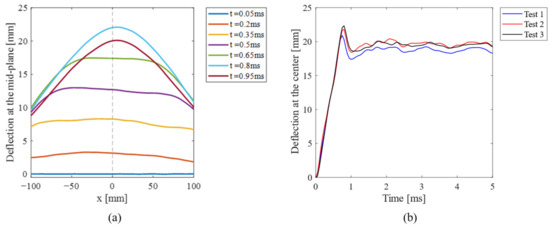
Figure 8.
Response of the unprotected backplate (a) deflection profiles for test 2 and (b) mid-span deflections.
2.4.3. Response of the Aluminum Backplate with the Protective Foam
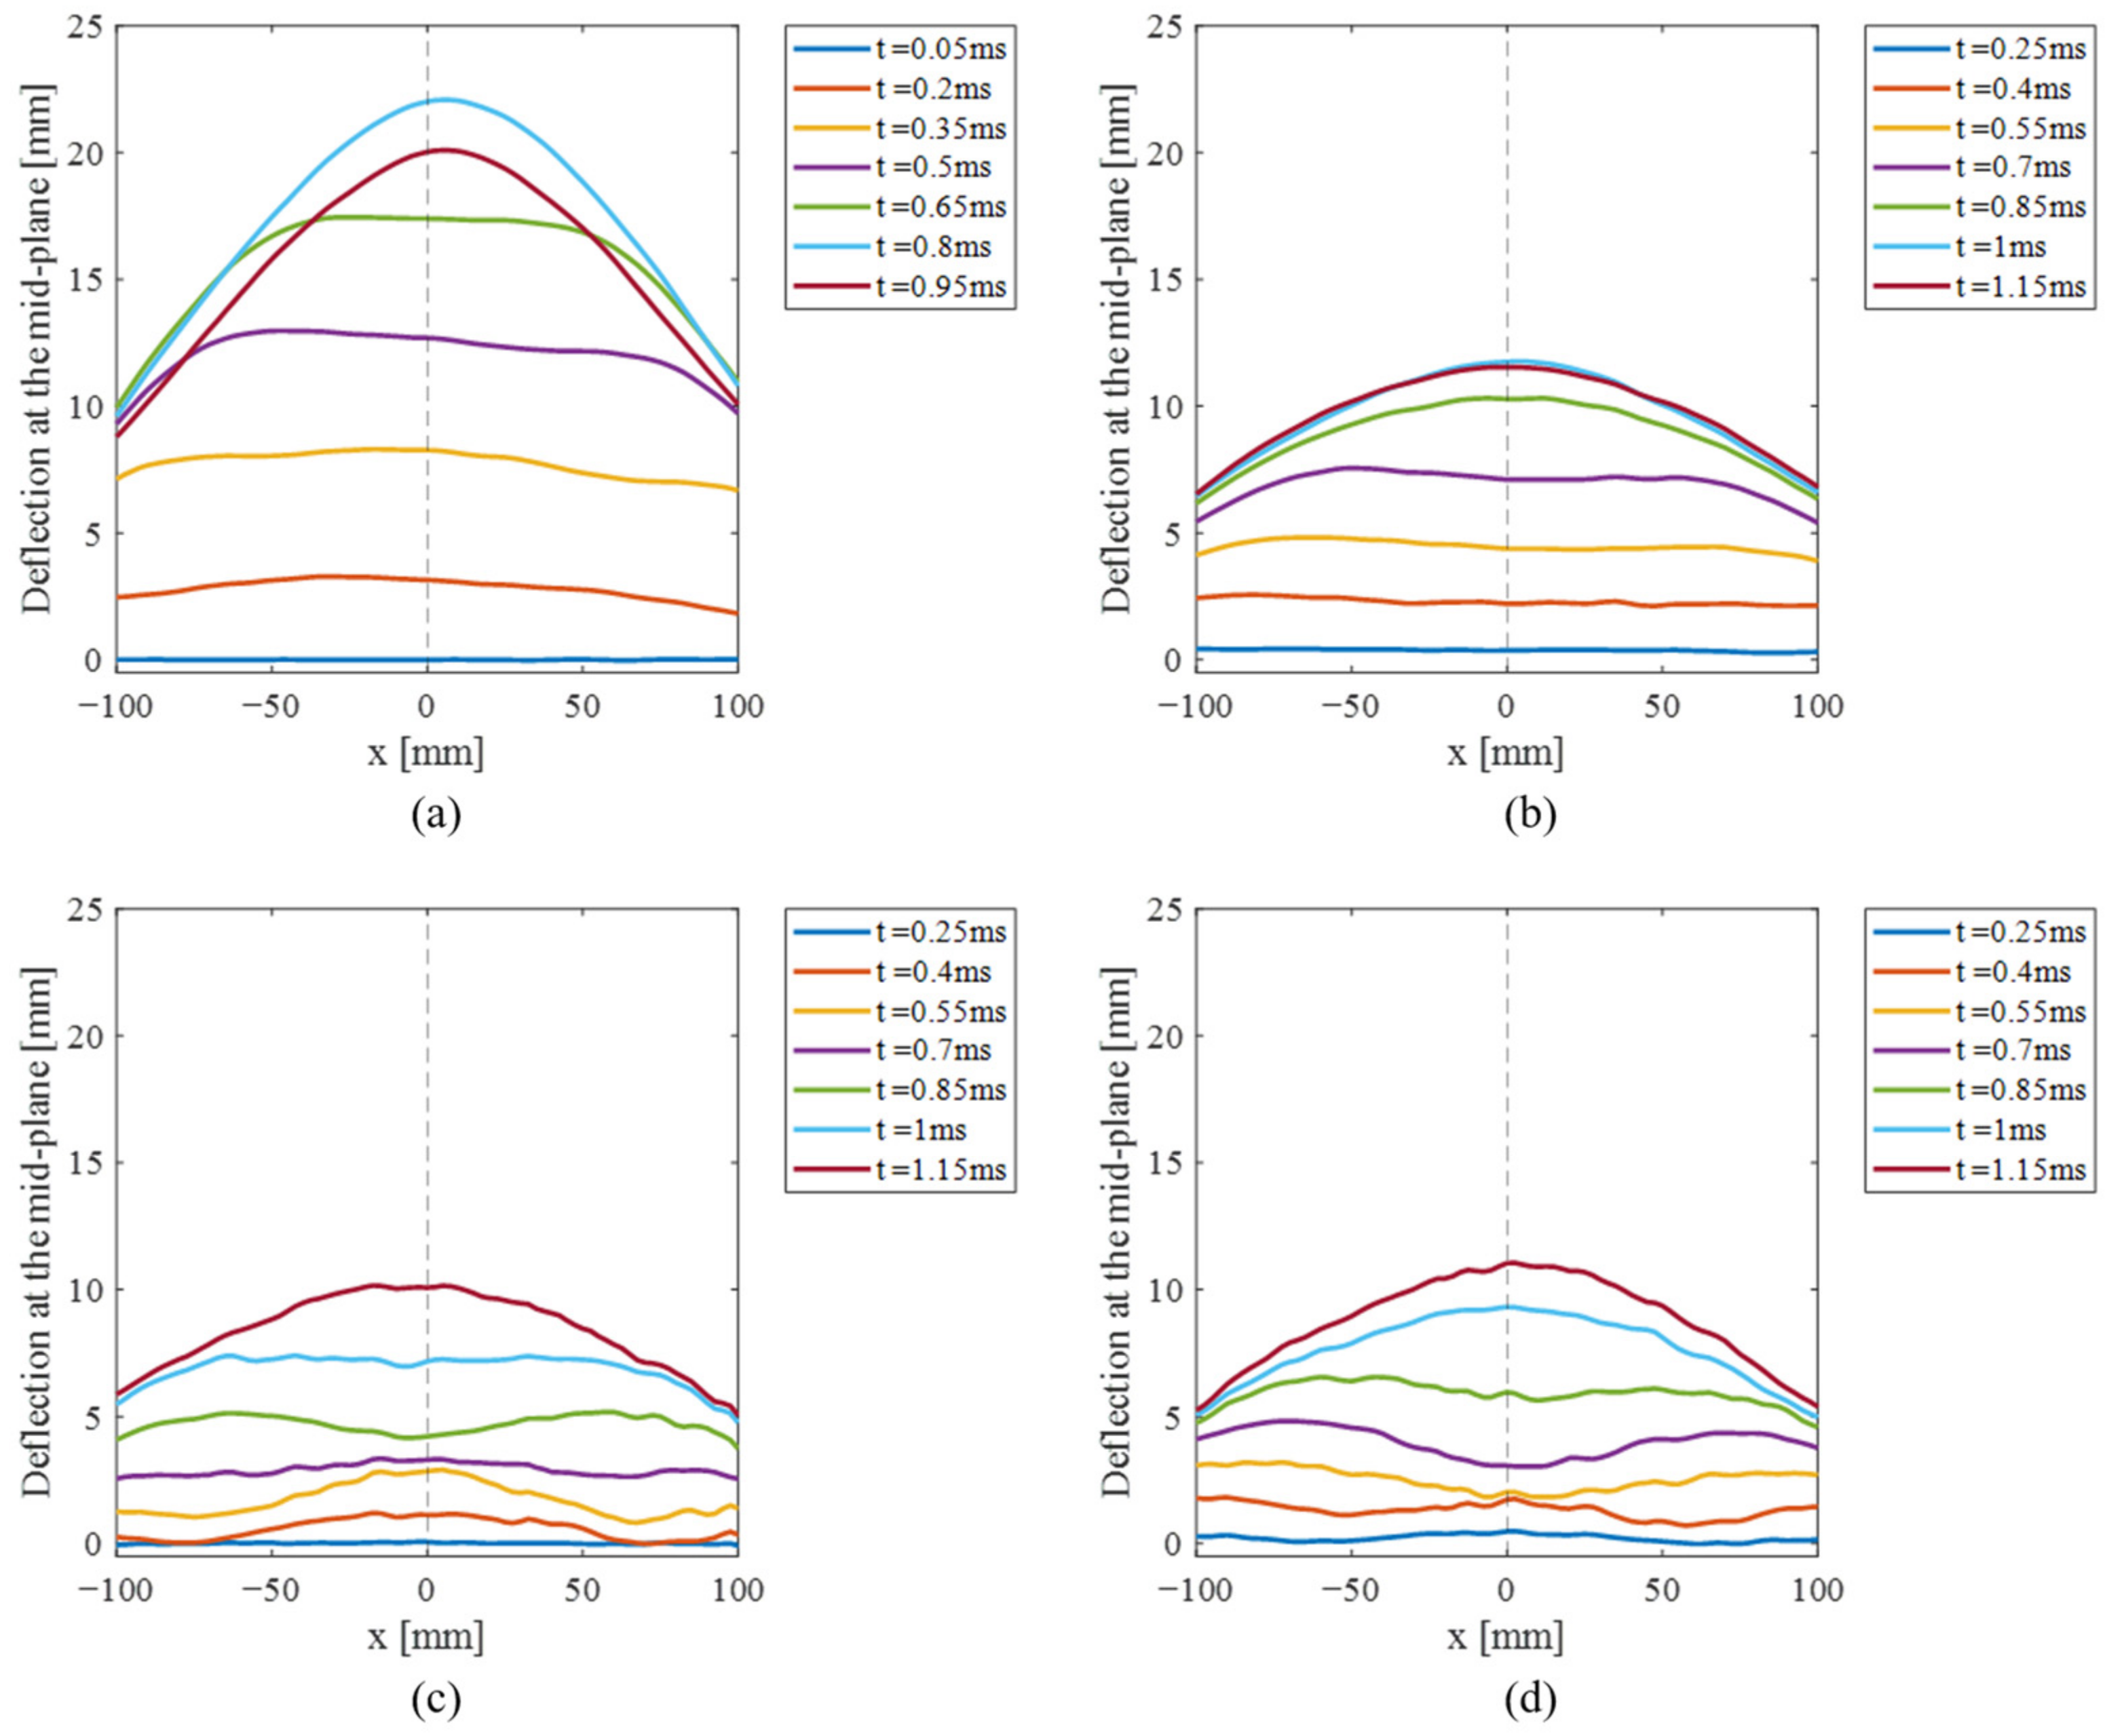
This section analyzes the mineral foam’s influence on the backplate’s response. Figure 9 depicts a comparison of the OPD profiles when the protective foam is added.
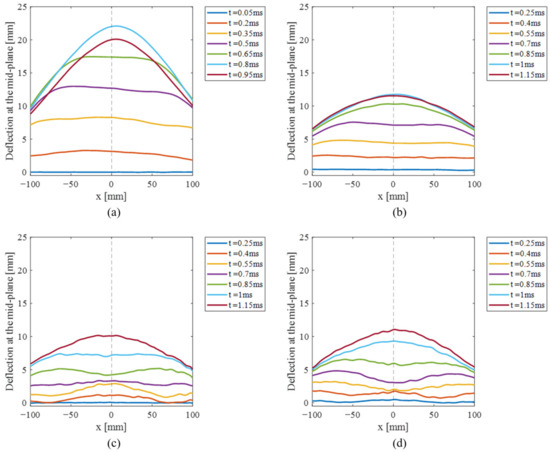
Figure 9.
Experimental deflection profiles for tests 1: (a) Without the protective foam, (b) in Configuration A, (c) in Configuration B, and (d) in Configuration C.
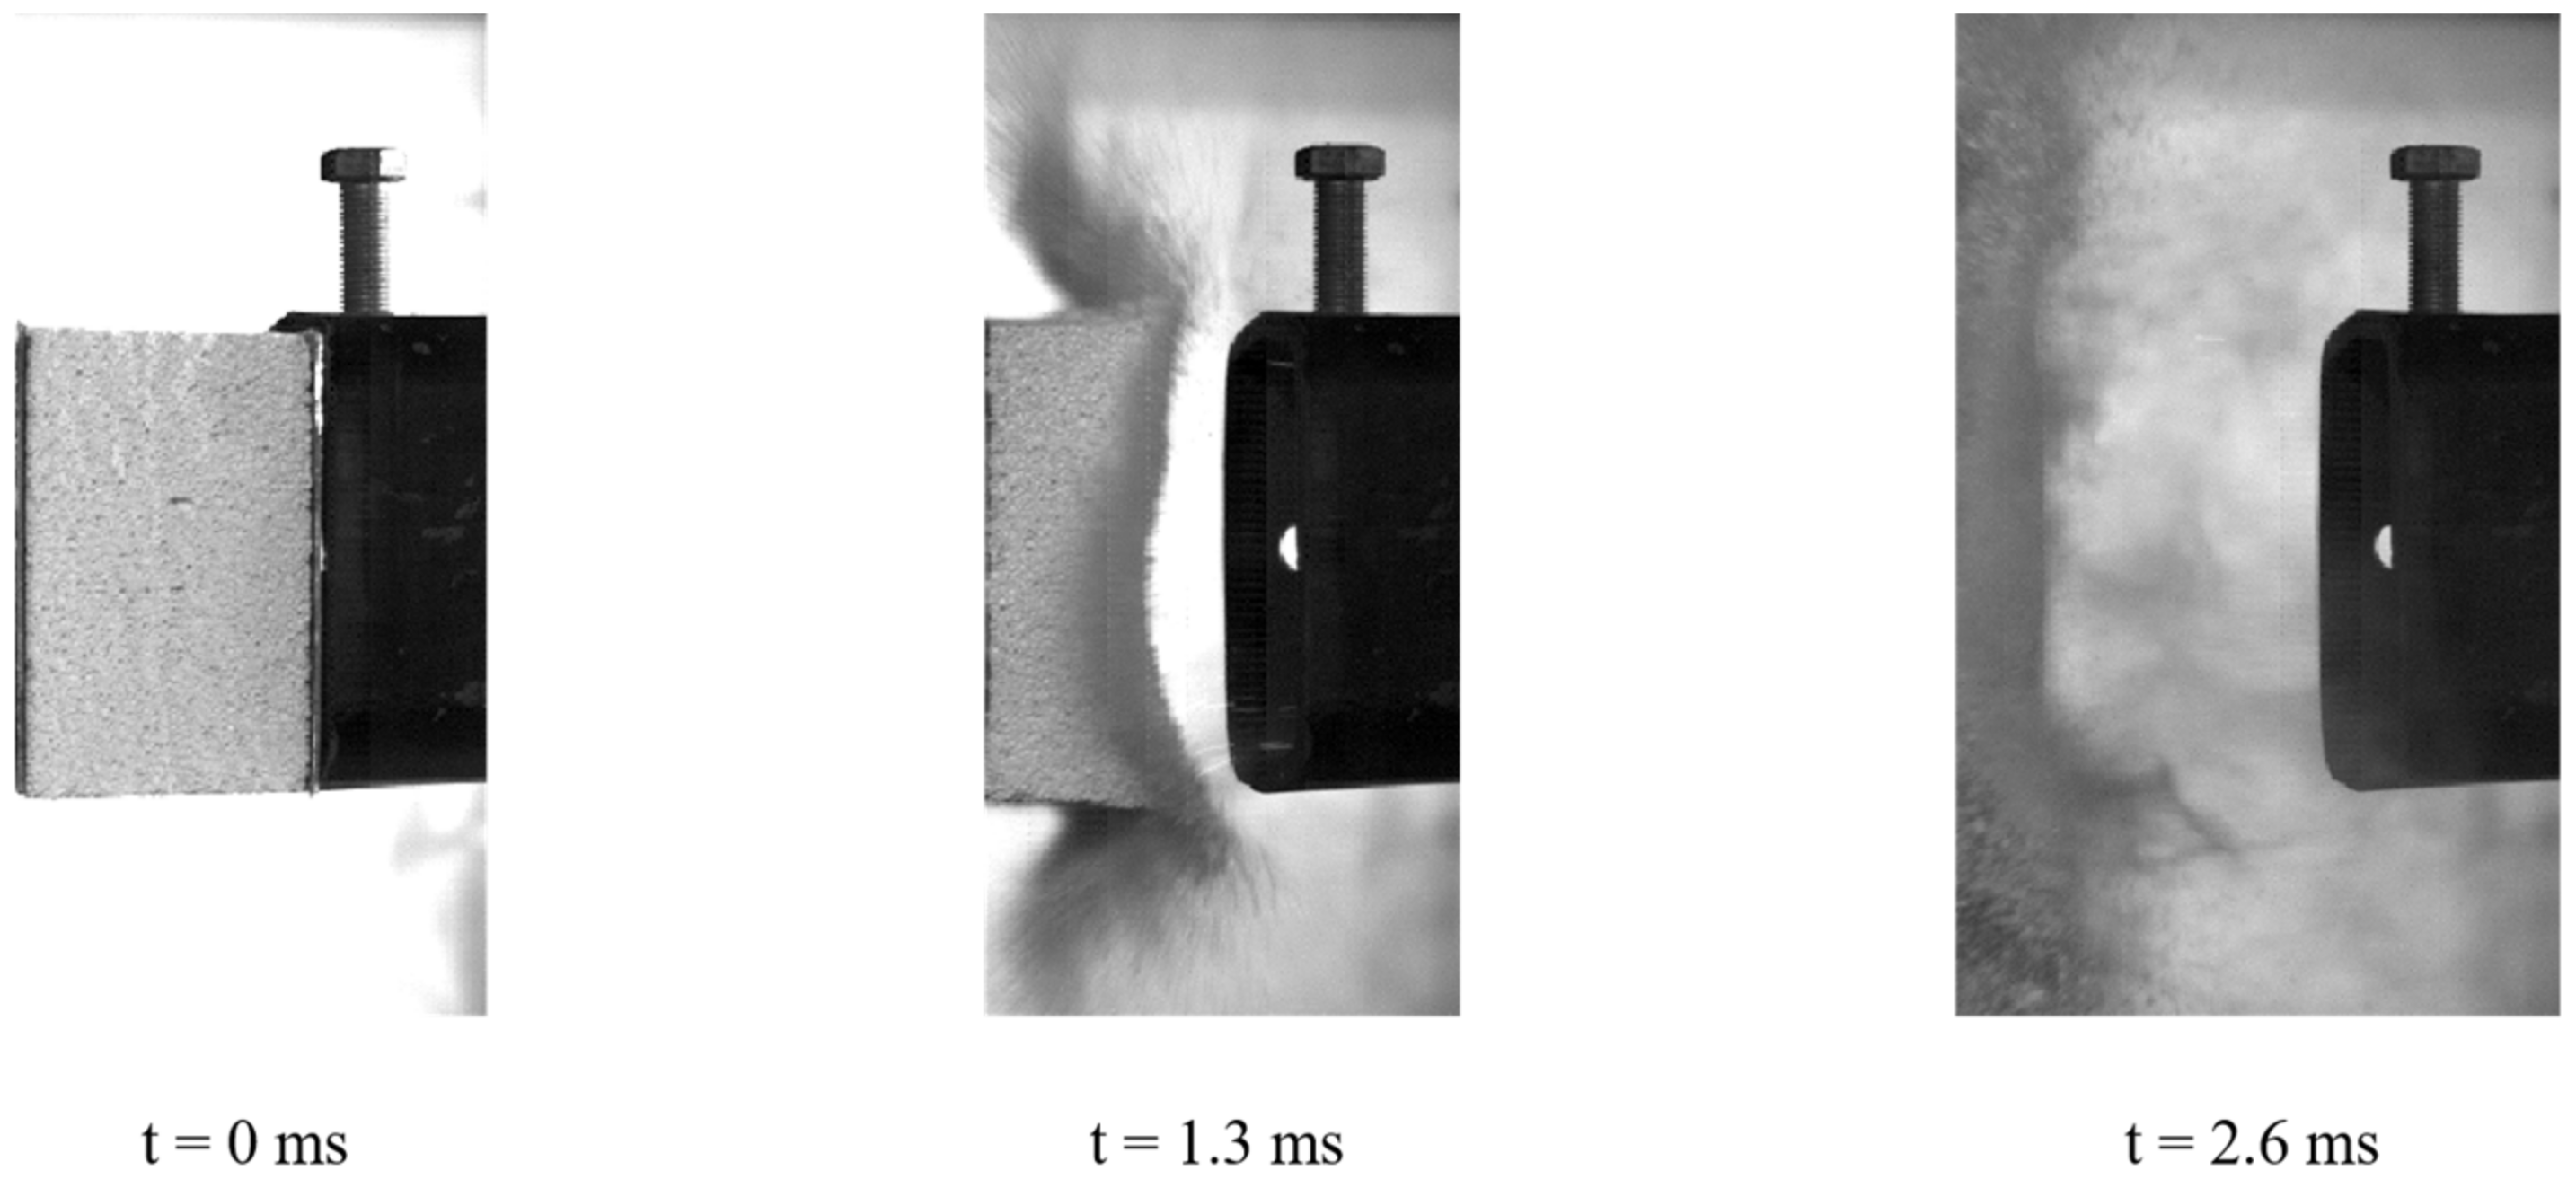
The OPD profiles exhibit similarities to those observed without foam protection, though there is a slight delay due to the increased time required for the shock wave to travel through the mineral foam. When the protective foam is added, the reflected overpressure and impulse increase by 123 and 66%, respectively. However, the deflection at the backplate’s center is reduced by approximately 50%, measuring around 11.6, 10.9 and 10.6 mm for configurations A, B, and C, respectively. The SC is expected to mitigate the blast load through pulverization of the mineral foam, as illustrated in Figure 10.
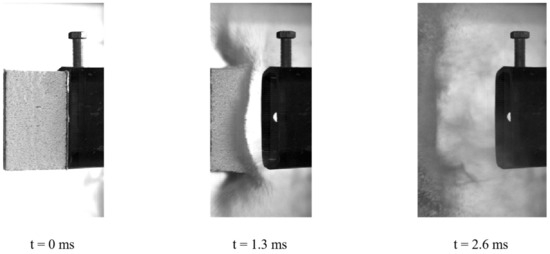
Figure 10.
Mitigation of the blast load through pulverization of the mineral foam.
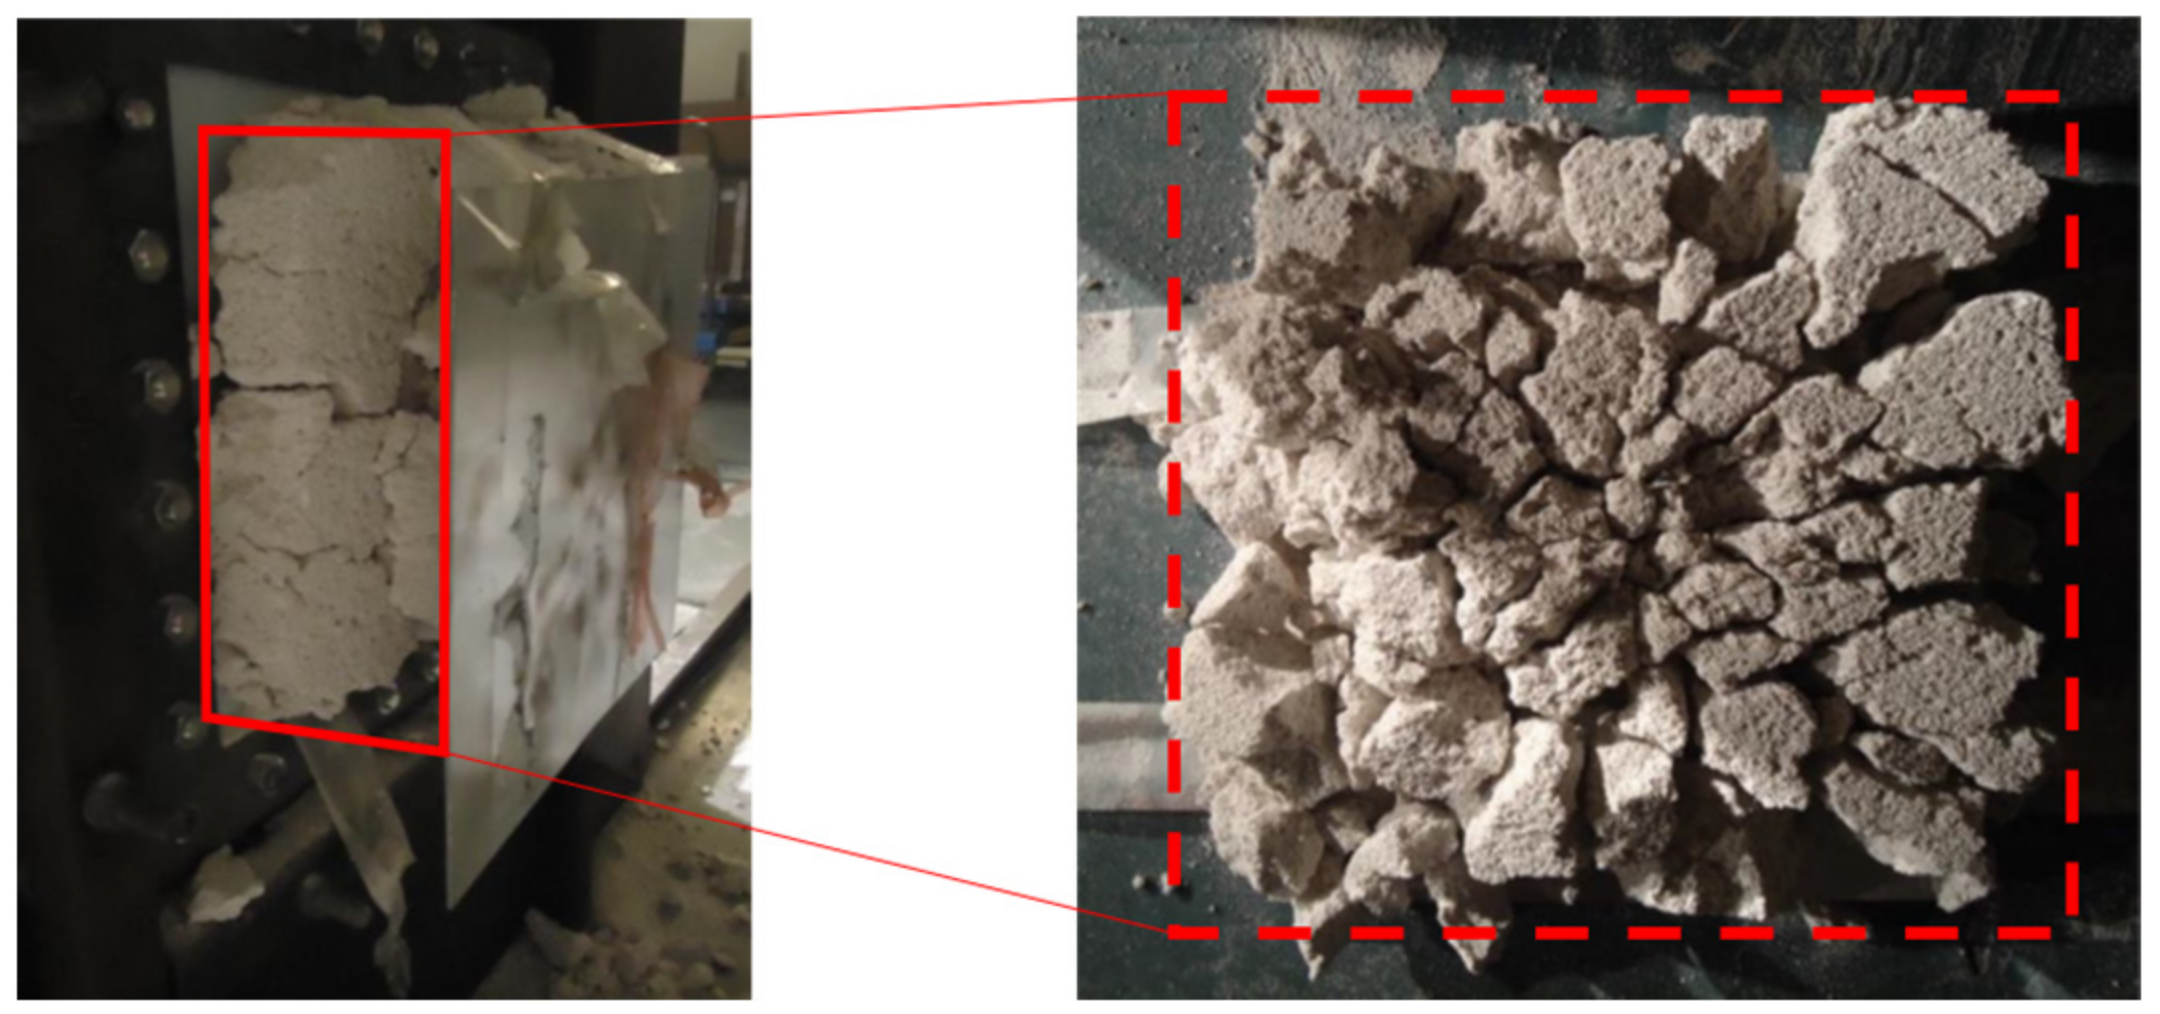
However, a post-mortem visual inspection of the tested foams in configuration A reveals suboptimal use of the mineral foam, characterized by the presence of numerous large uncrushed lumps, as illustrated in Figure 11.
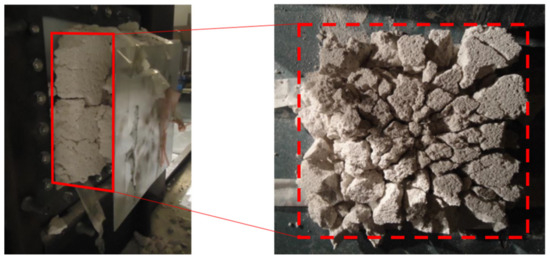
Figure 11.
Post-mortem visual inspection of the fractured foam layer for configuration A.
Figure 10 illustrates a case where the foam is crushed optimally. It corresponds to a ζ value of 50 m−1, while for configuration A, ζ value is 13.3 m−1. To increase the foam’s crushing effectiveness, ζ should be increased as well. Therefore, configurations B and C have been implemented, where ζ values are increased to 27.1 and 34.3 m−1, respectively. Kostopoulos et al. [19] also demonstrated that increasing the effectiveness of the SC by playing on the core configuration can be achieved.
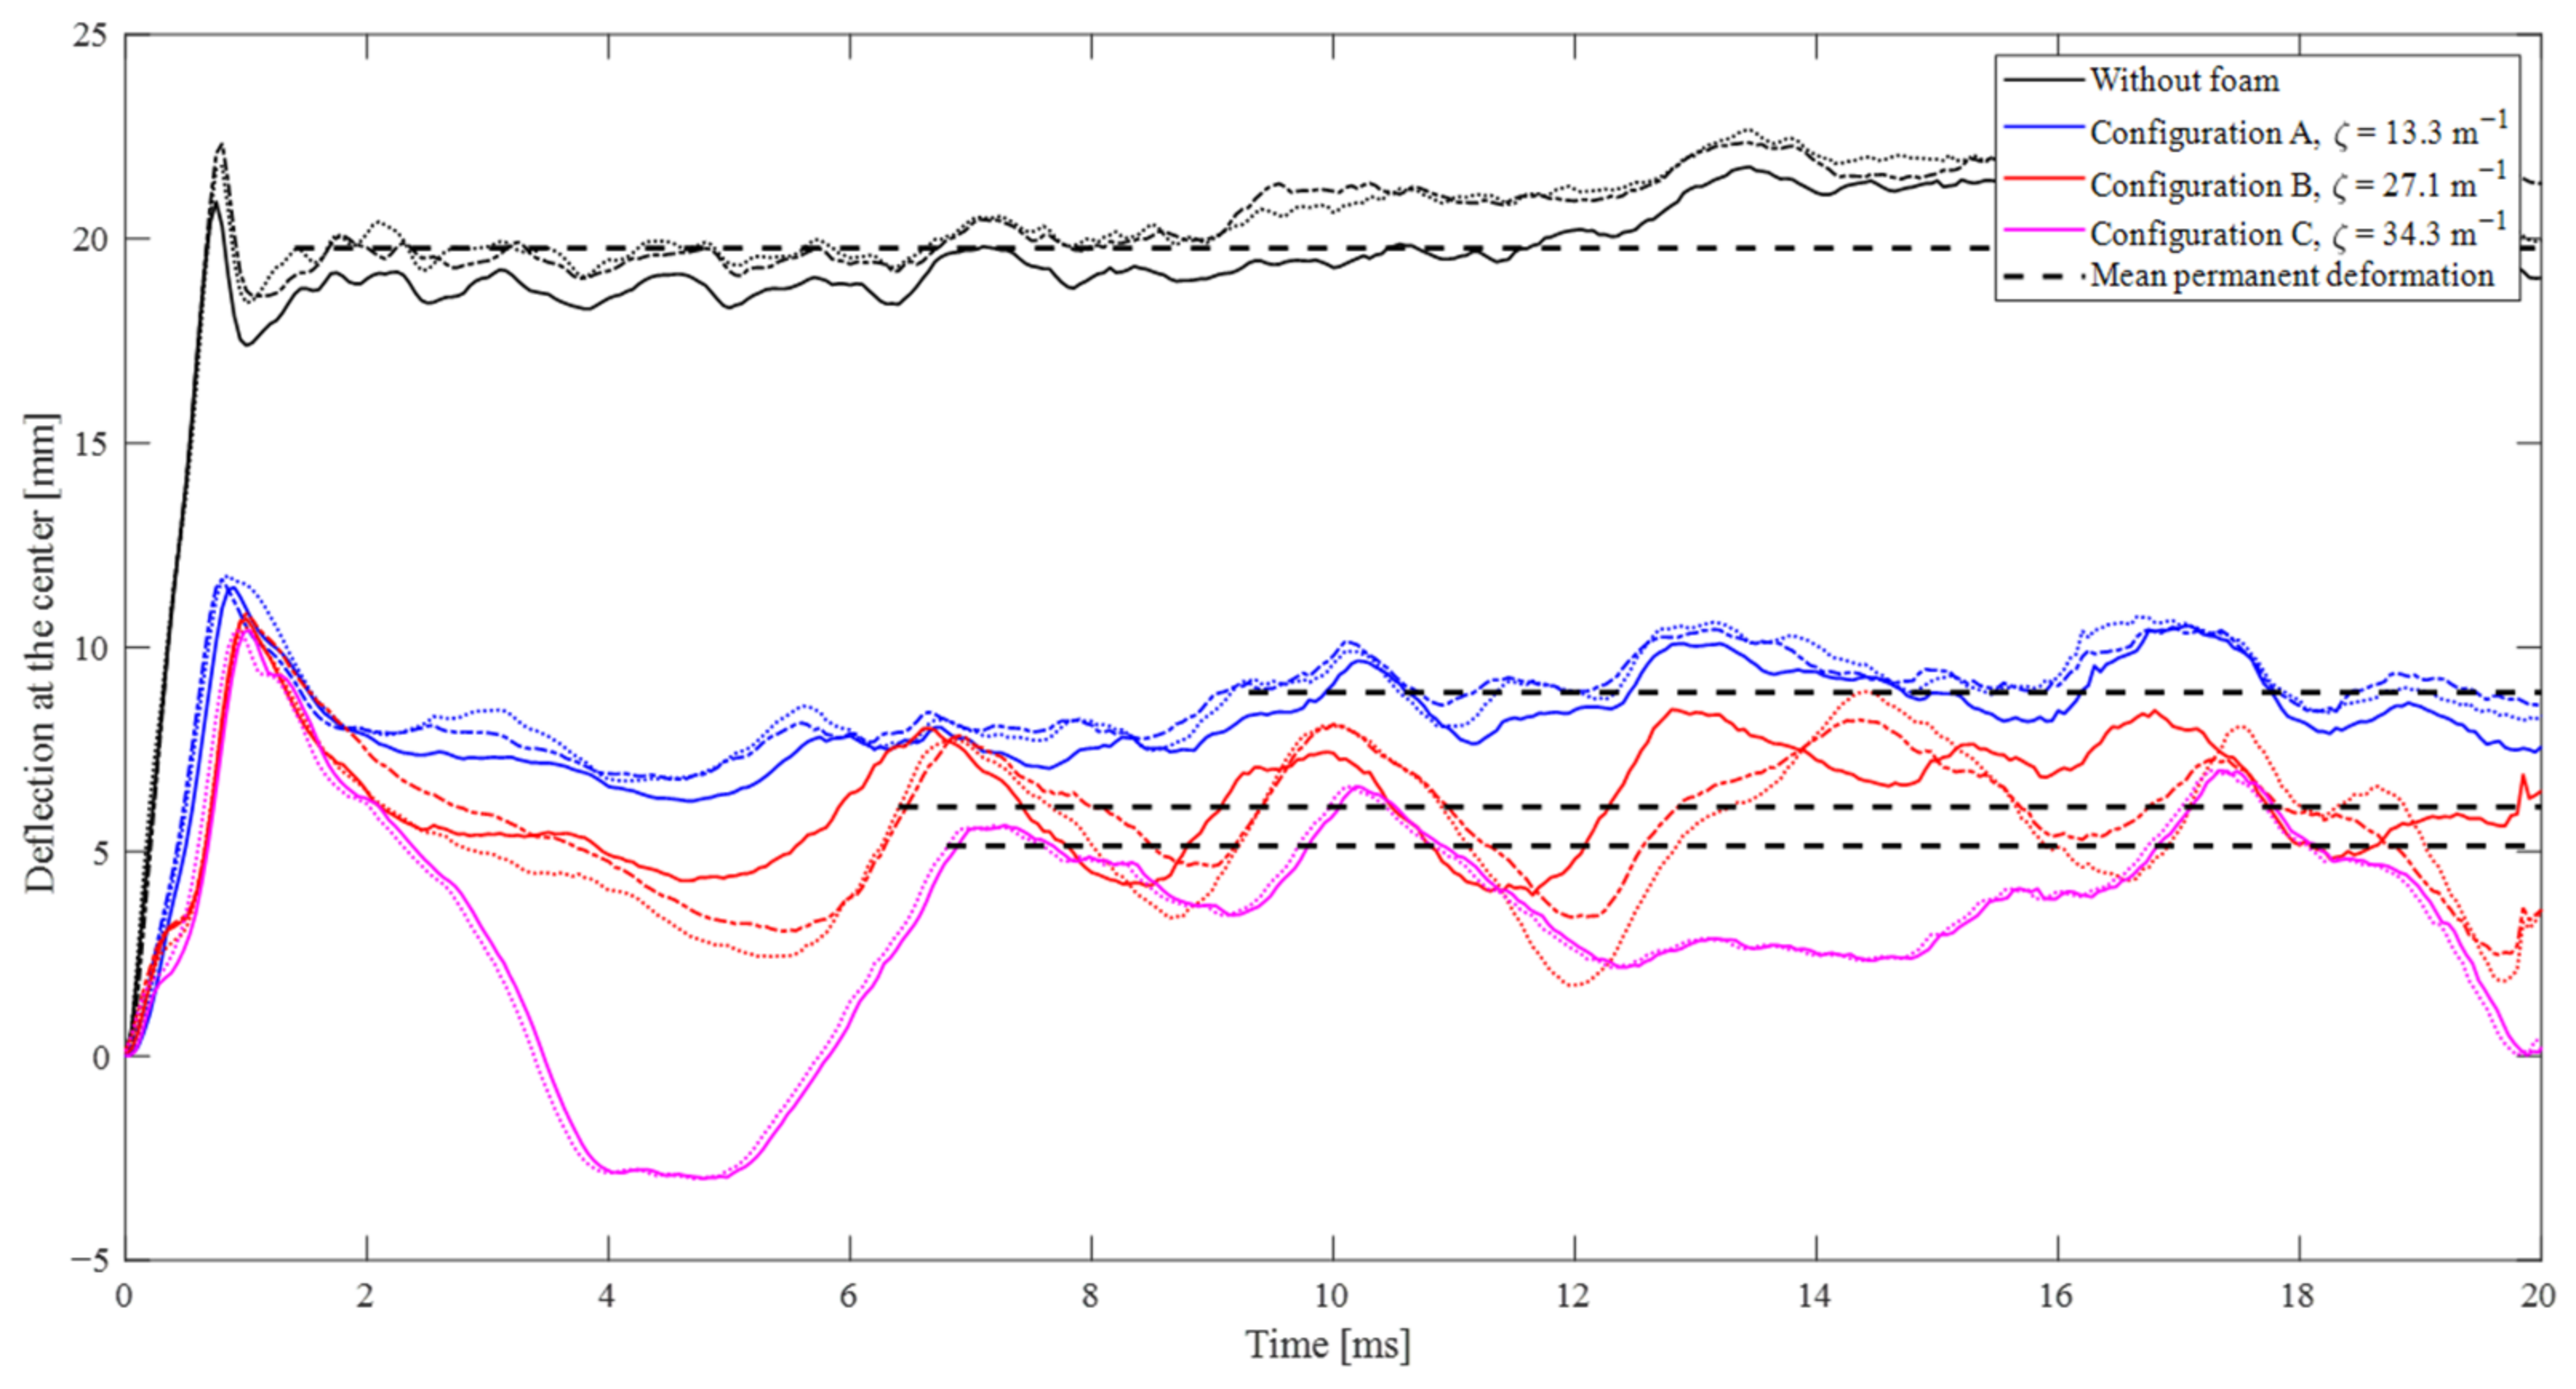
Figure 12 shows the OPD of the center of the plate, the mean permanent deformation δ after the tests and summarizes the results of the different configurations for comparison. The results for both configurations, B and C, are very similar in terms of the maximum deflection of the plate compared to that of configuration A, i.e., a reduction of 50% compared to the maximum deflection of the unprotected plate. Configuration C, also the lighter solution, is the most effective in reducing the OPD at the center of the plate, as shown in Table 1.
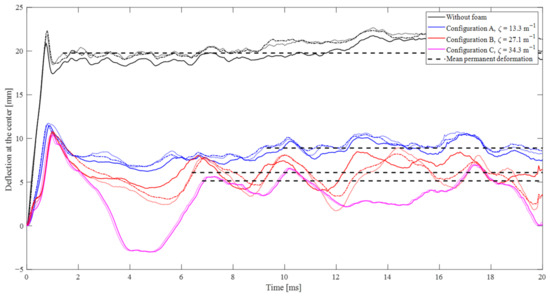
Figure 12.
Mid-span deflection of the backplate with and without the protective foam. Tests 1 are shown with a solid line, Tests 2 with a dotted line and Tests 3 with dash-dot line.

Table 1.
Maximum OPD and mean permanent deformation of the backplate with and without the protective foam.
3. Numerical Modeling
To further explore the influence of foam spacing on the effectiveness of the SC, numerical simulations are performed using LS-DYNA R10.0, leveraging the model built and validated in [37].
3.1. Modeling Method
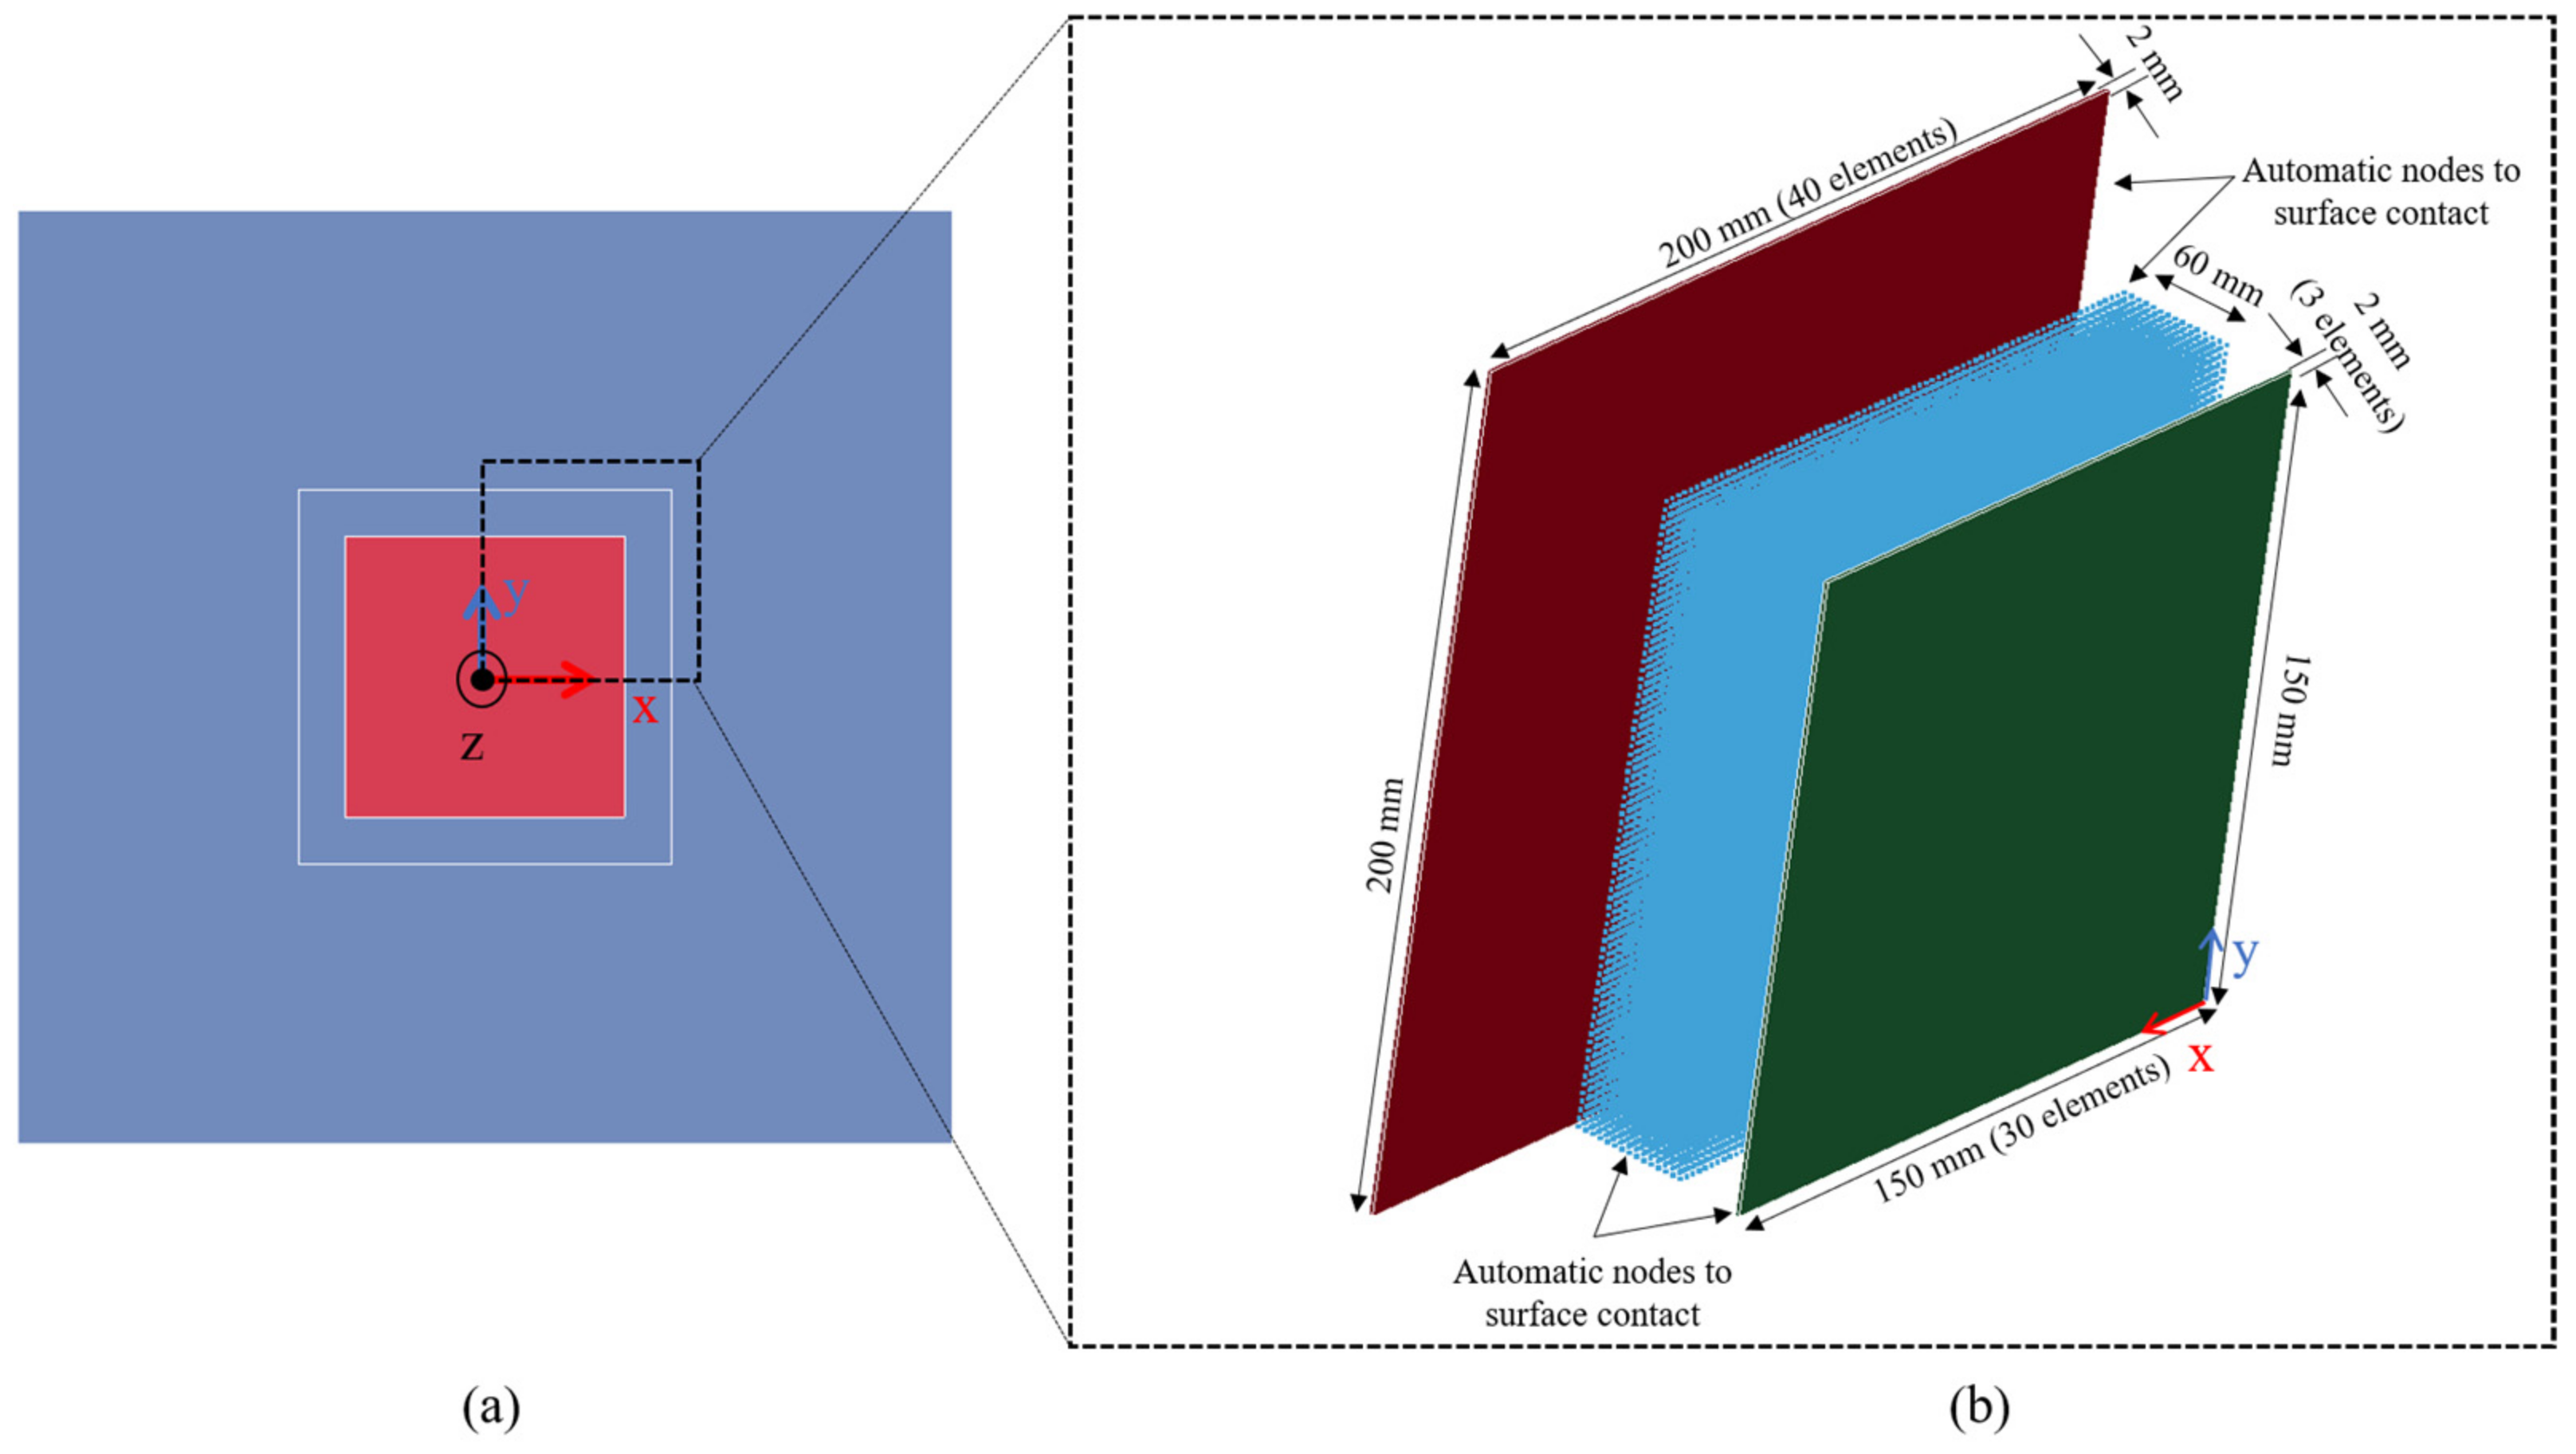
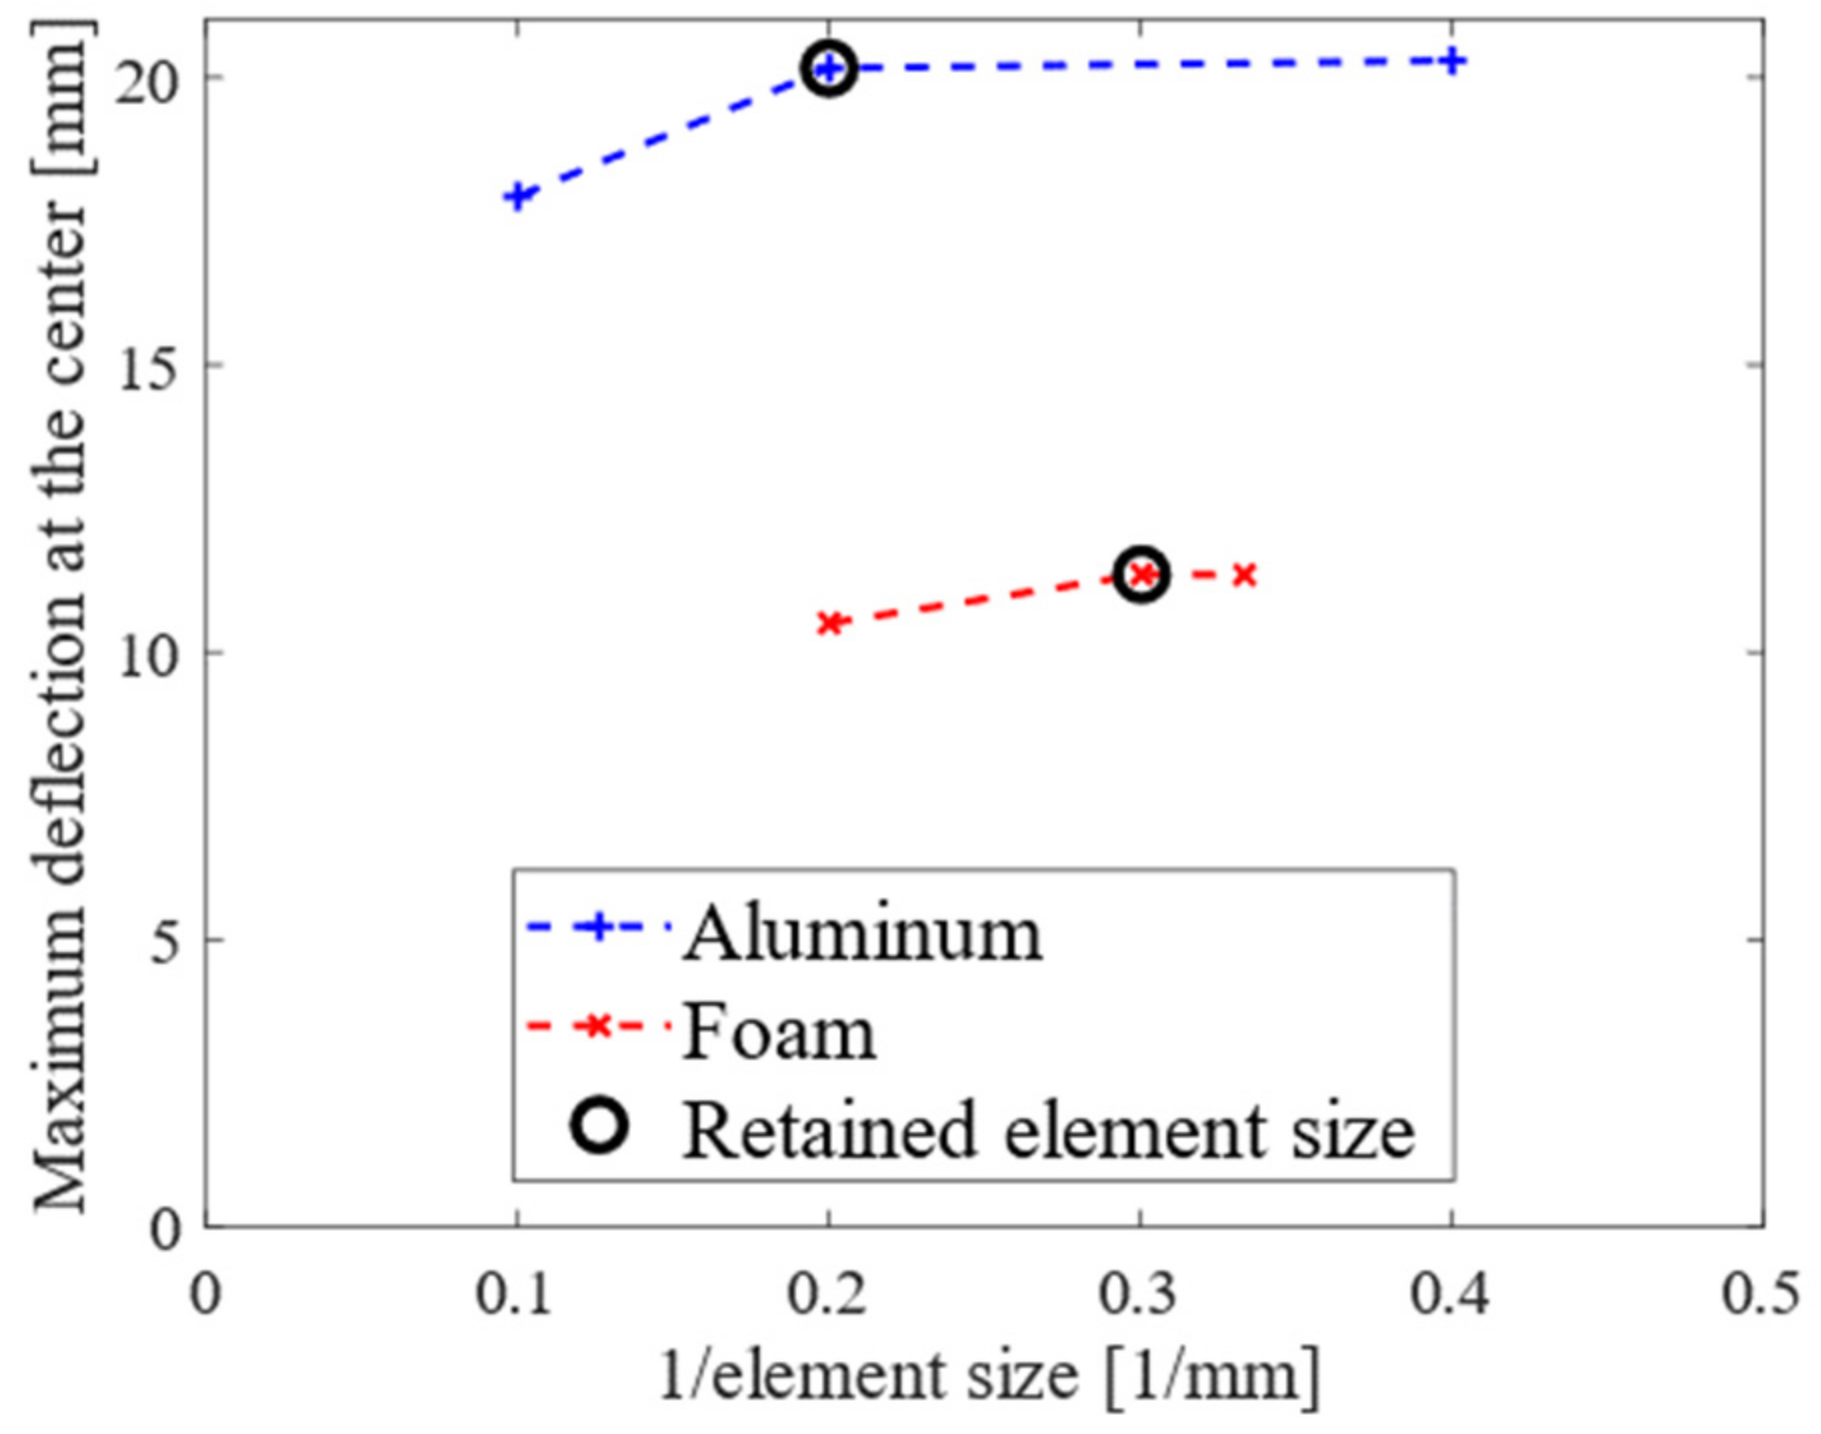
Figure 13 encompasses the entire set-up for numerical modeling using a Lagrangian approach. Shell elements (Belytschko-Li-Tsay) of 5 mm × 5 mm × 15 mm are used to model the steel frame. Aluminum components (front plate and backplate) are modeled using fully integrated (ELFORM-2) solid elements measuring 5 mm × 5 mm × 0.67 mm. The meshless smooth particle hydrodynamics (SPH) approach simulates the 60 mm thick mineral foam. To ensure the stability of calculations, it is recommended to have a minimum of four SPH nodes along each face of the Lagrangian element that is in contact with the SPH nodes [46]. This requirement, alongside a mesh convergence study (see Figure 14), essentially governs the overall particle number in the model, which is 36,450 particles. All nodes in the front plate and the foam have unconstrained degrees of freedom.
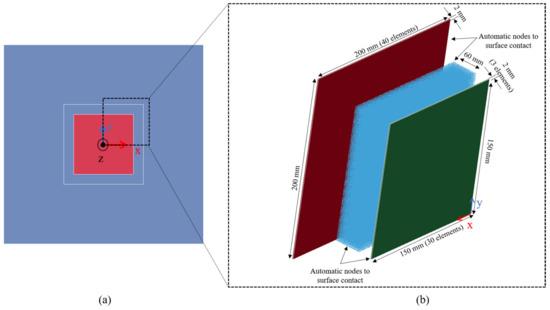
Figure 13.
(a) Front view of the experimental set-up in finite element model and (b) One-quarter of the SC solution with the foam in SPH viewed from the rear of the set-up (front skin in green-foam-backplate in red).
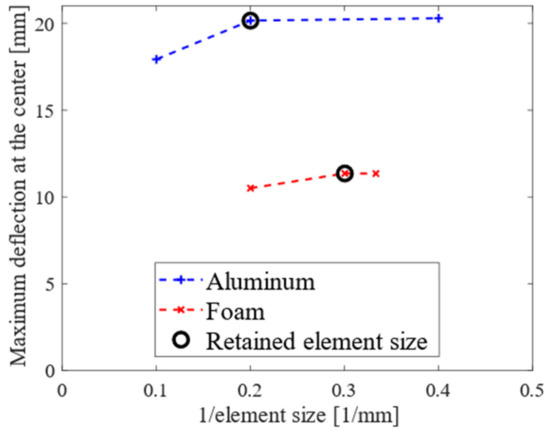
Figure 14.
Convergence study of the mesh size on the aluminum plates and the mineral foam.
*CONTACT_AUTOMATIC_NODES_TO_SURFACE card is defined, enabling the transfer of compressive loads between materials with soft characteristics and those exhibiting rigidity [46]. A soft constraint-based formulation is adopted between all aluminum components and the foam to handle significant elastic bulk modulus differences (Foam/Aluminum) [47]. The blast load is applied by using the LOAD_BLAST_ENHANCED card.
3.2. Material Modeling
Experimental findings indicate that both the clamping plate and the rigid steel frame endure elastic deformation throughout the process [37]. Therefore, these components are modeled using a linear elastic material model (*MAT_1). This material model parameters are as follows: density of 7850 kg/m3, Young’s modulus of 210 GPa and Poisson’s ratio of 0.3.
Due to the intense blast loading, the aluminum plates deform significantly. The modified Johnson–Cook material model (*MAT_107) is used to capture the strain rate effect, incorporating strain hardening and thermal softening. Equation (1) describes the corresponding yield stress, dependent on strain, strain rate and temperature:
The material parameters , , , , , , , , and govern the modified Johnson–Cook model. These parameters account for the plastic strain rate , quasi-static threshold strain rate , ambient temperature , and fusion temperature . The specific values used for the aluminum plates are detailed in Table 2, derived from the literature [43].

Table 2.
Modified Johnson–Cook parameters used for the aluminum plates [42].
Ma et al. [9,11] and Zhou et al. [42] showed that the deformability of the front skin influences the stress distribution within the crushable core, thereby influencing the energy absorption of the SC. Consequently, to explore how the front skin’s deformability influences the effectiveness of the calcium-silicate-based SC, a rigid constitutive law, i.e., *MAT_20, is also considered while maintaining constant front skin mass. The parameter values used in the adopted material model are as follows: density of 2710 kg/m3, Young’s modulus of 69 GPa and Poisson’s ratio of 0.33.
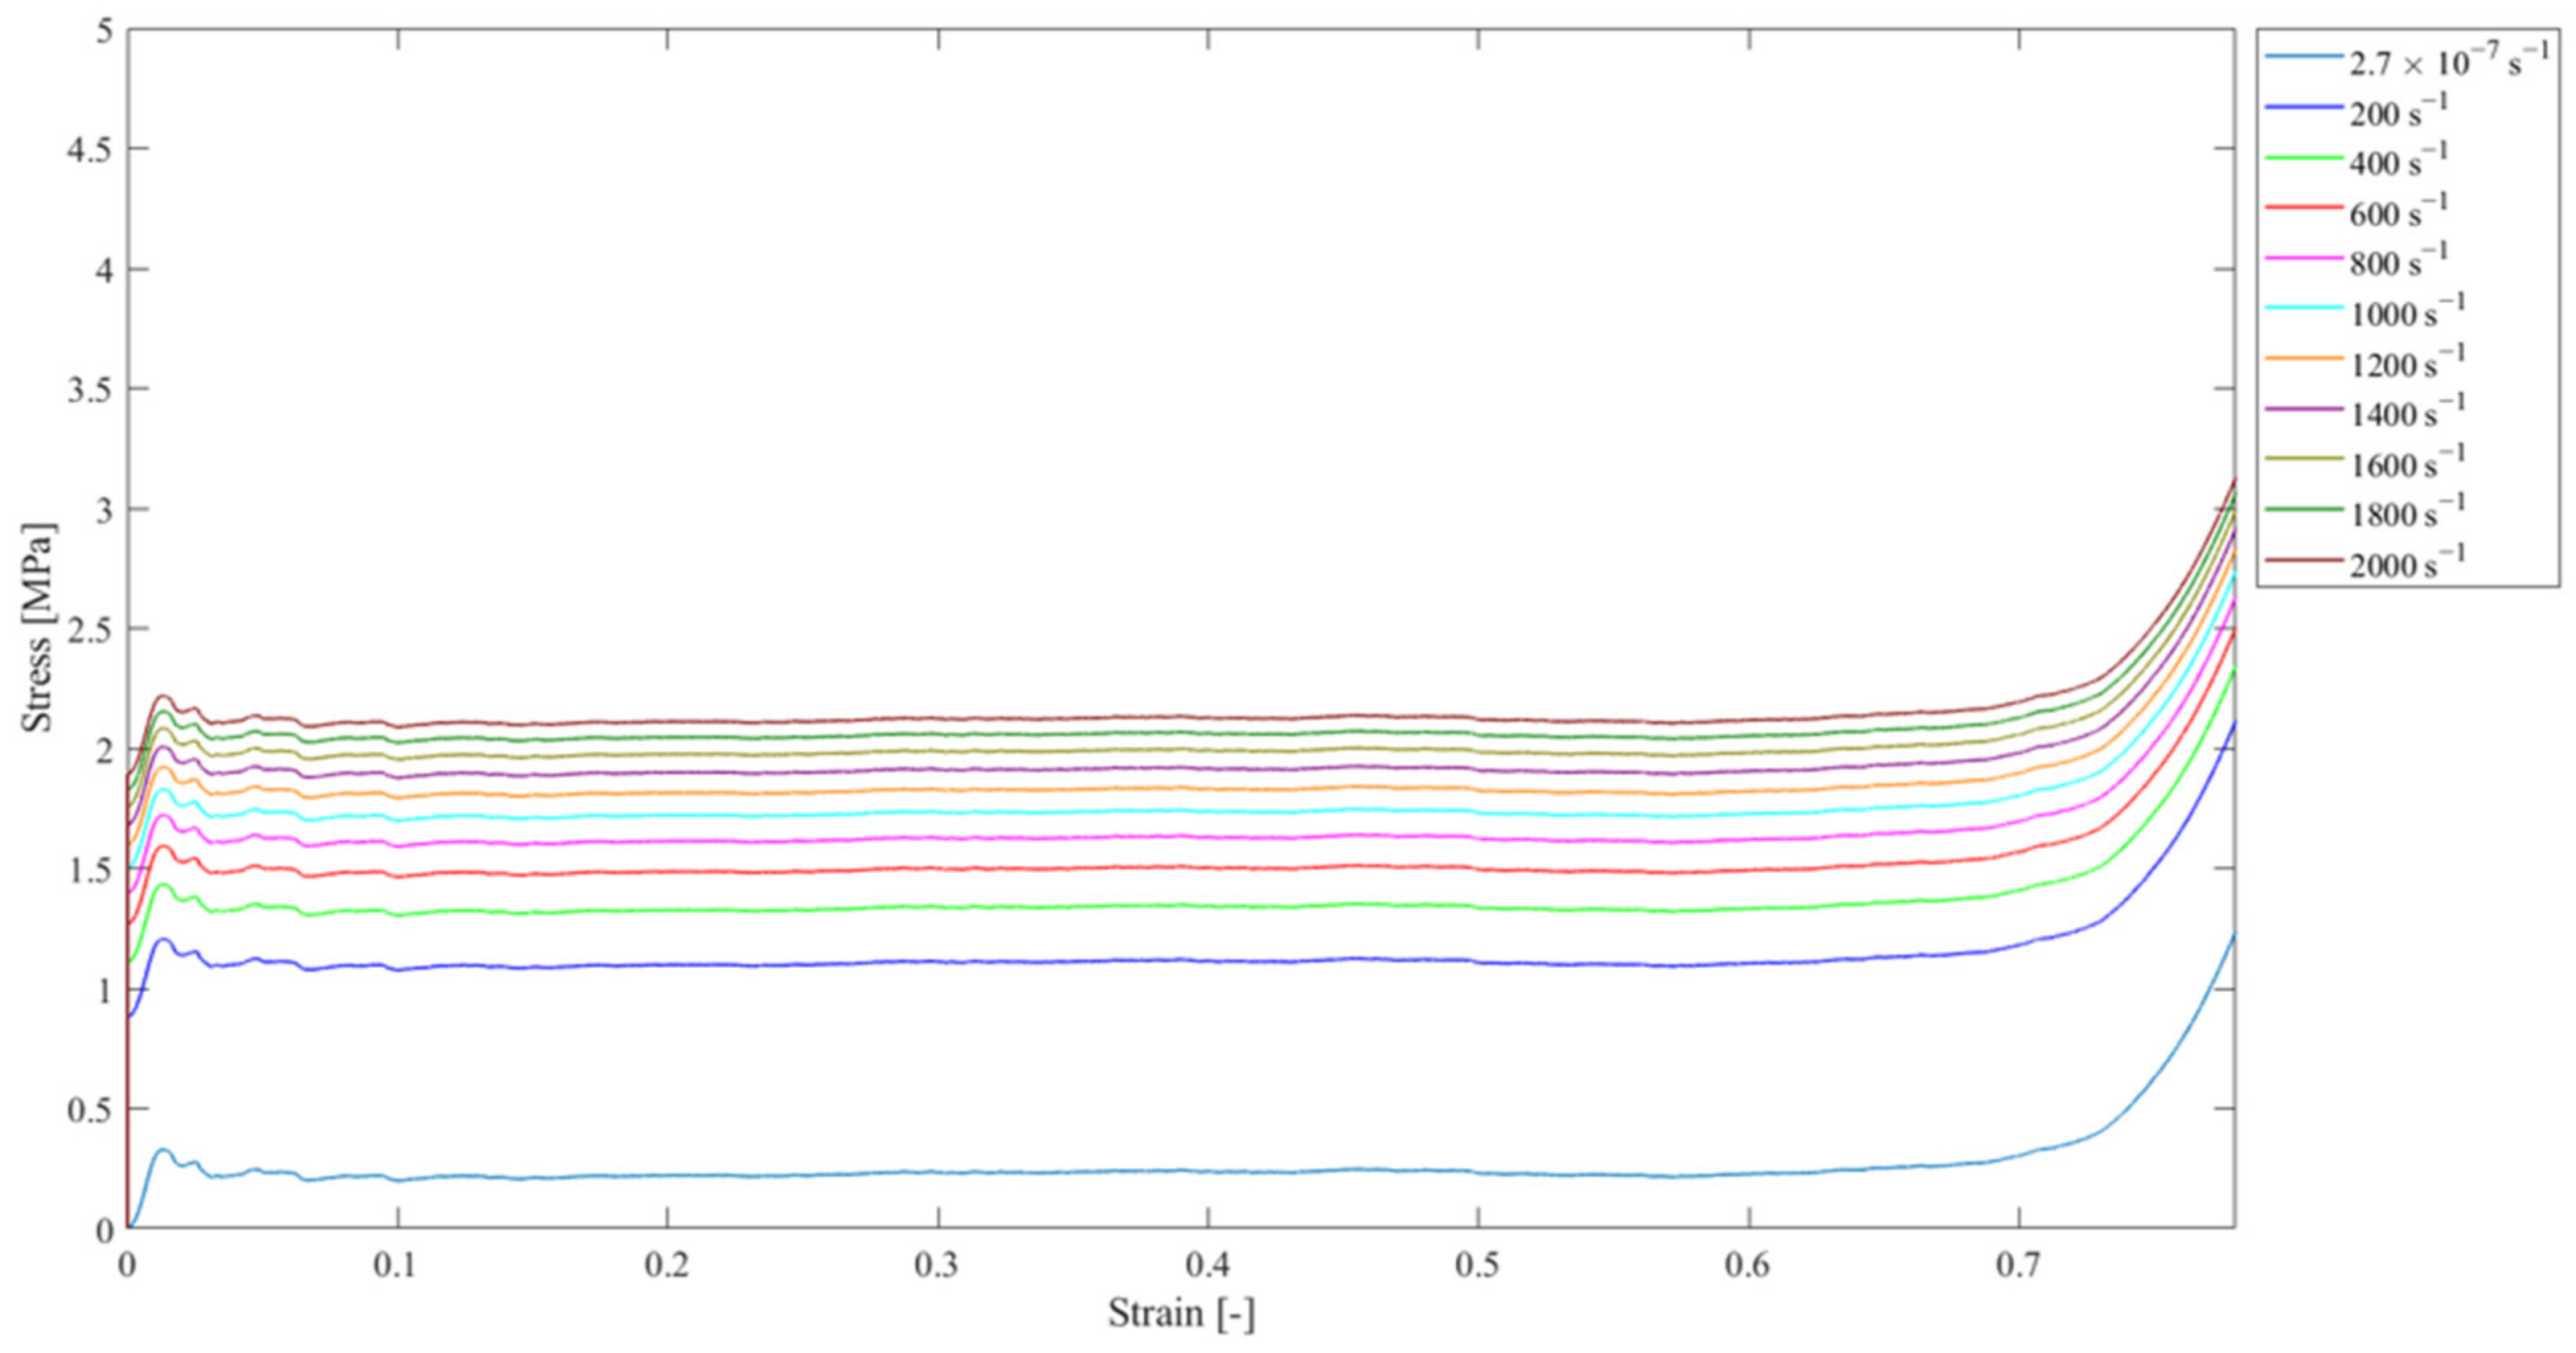
The Fu Chang Foam (*MAT_083) and the Crushable Foam (*MAT_63) material models are used for modeling the mineral foam in this study. Fu Chang Foam is a one-dimensional model assuming zero Poisson’s ratio, allowing uni-axial or tri-axial compression strain with strain rate effects considered for uni-axial compression. The input parameters for *MAT_083 are derived from [37] and presented in Table 3. Contrary to the Fu Chang Foam material model, the Crushable Foam material model does not consider strain rate effects. However, from the simulations in [37], it is known that in these test-specific conditions, the foam is crushed at a mean strain rate of about 800 s−1. Therefore, a single stress- strain curve at this strain rate is input in the Crushable Foam material model.

Table 3.
Fu Chang Foam parameters used for the mineral foam [37].
Table 3.
Fu Chang Foam parameters used for the mineral foam [37].
| (kg/m−3) | (GPa) | Strain Rate Effects |
|---|---|---|
| 110 | 30 | Tabulated stress-strain curves for various ranges (See Figure 15) |
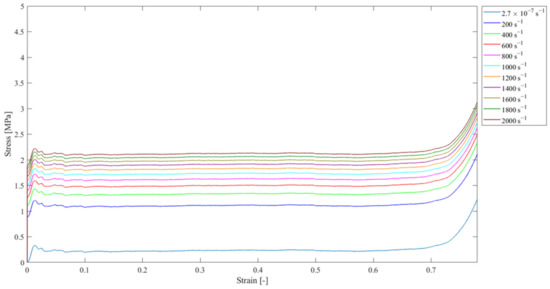
Figure 15.
Quasi-static and dynamic compression stress-strain curves that were inserted as a table for the Fu Chang Foam material model.
Figure 15.
Quasi-static and dynamic compression stress-strain curves that were inserted as a table for the Fu Chang Foam material model.
4. Results from Simulations
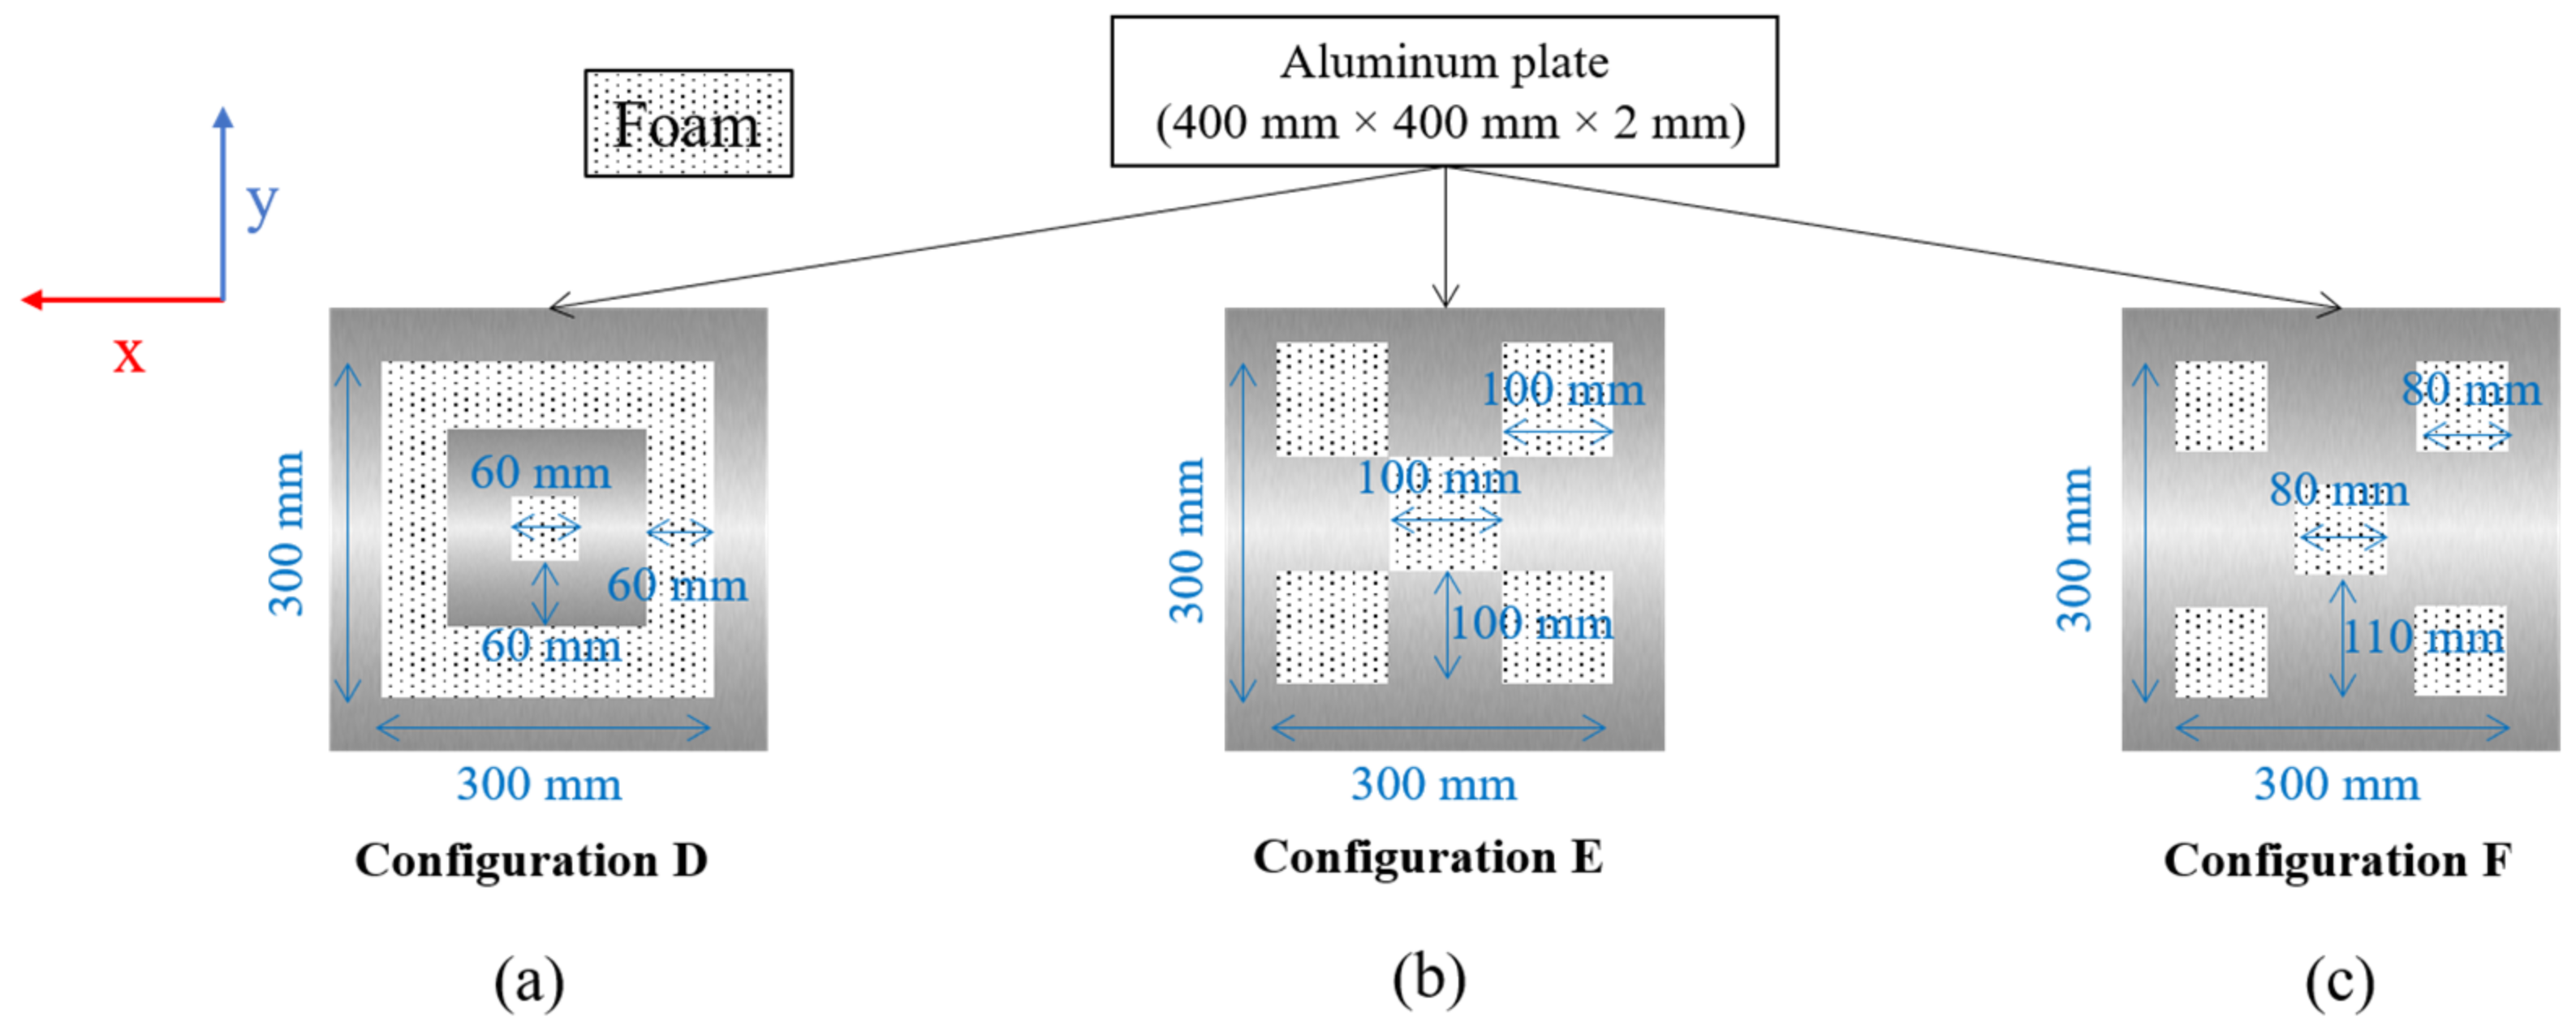
The numerical simulations encompass a broader spectrum of charge masses and mineral foam configurations than those tested experimentally. Simulated configurations matching the experiments are compared to validate the finite element modeling. Additional simulations (virtual experiments) investigate the influence of increasing the spacing for the foam to expand (see Figure 16) and elucidate details about the influence of the charge mass and the mineral foam configuration on the effectiveness of each solution. In the following, 27 simulations for charge masses M of 25 g (20 g C4), 35, and 50 g of TNT are run. The distance between the structure and the center of the charge is fixed. Therefore, the standoff distance R decreases when a foam layer is added. The internal energy corresponds to the deformation energy in both the front skin (FS) and the backplate (BP), whereas for the foam, it is the absorbed energy. The numerical results summarized in Table 4 will be discussed further.
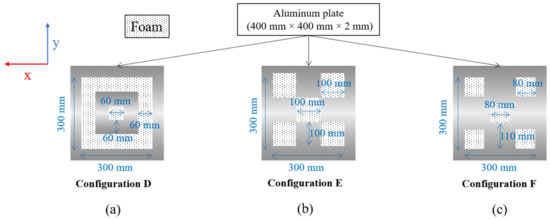
Figure 16.
Additional configurations adopted for numerical simulation: (a) Configuration D, (b) Configuration E, and (c) Configuration F.

Table 4.
Summary of the results from the parametric study.
4.1. Validation of the Blast Loading
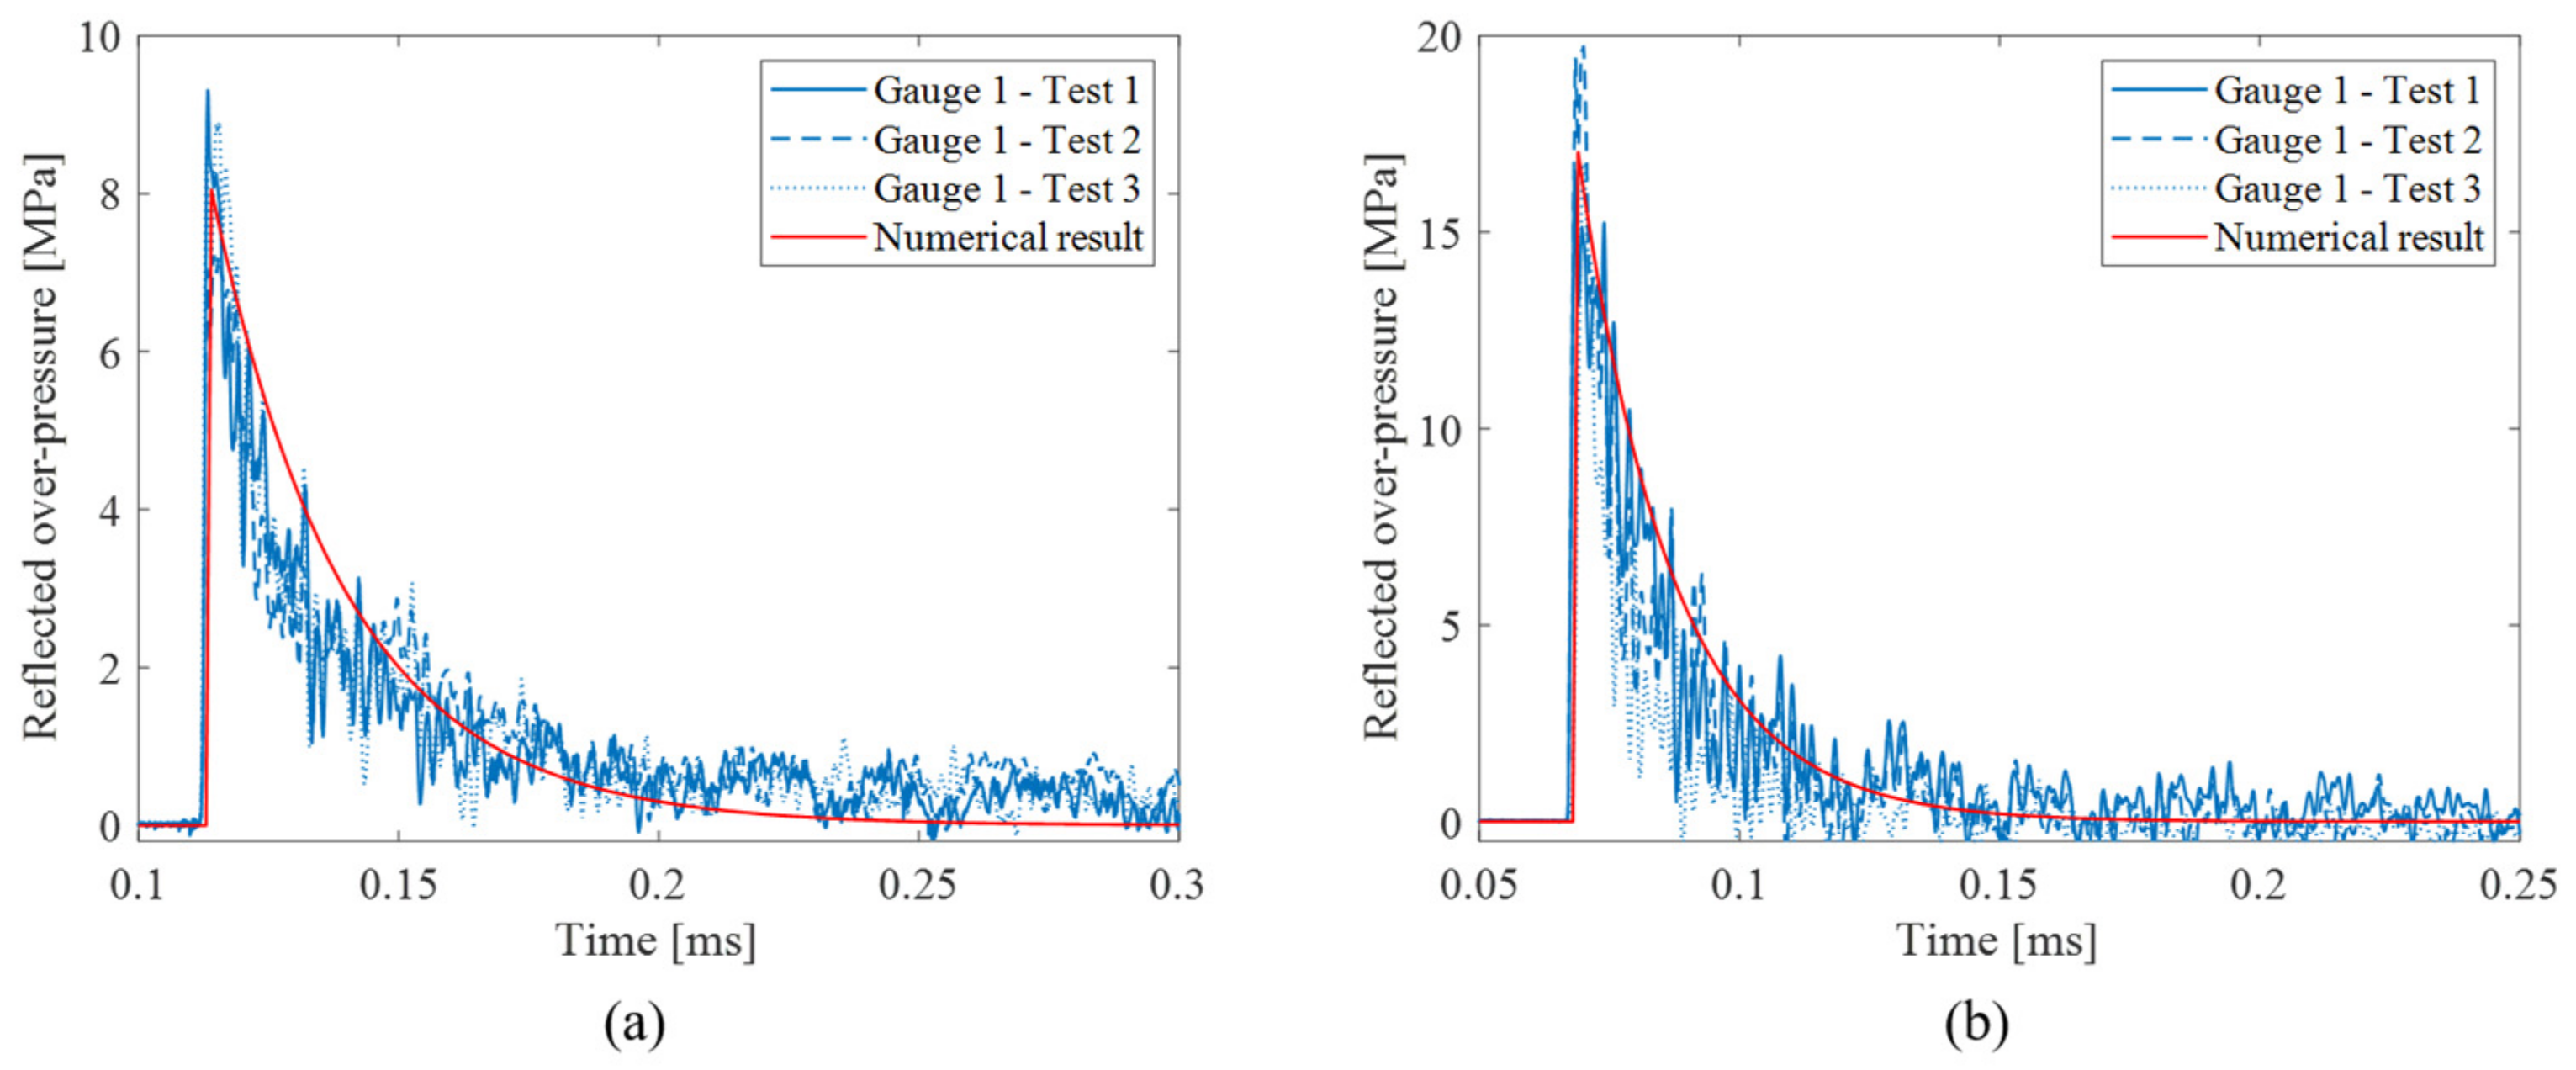
Figure 17 shows the pressure–time histories from the experiments in comparison to the results of the numerical simulation (only shown for Gauge 1). Without the sacrificial cladding (Figure 16a), the computed reflected peak over-pressure and impulse are 8 MPa and 241 Pa.s, respectively. When the foam is added, the computed reflected peak over-pressure and impulse are 17.6 MPa and 353 Pa.s, respectively. The relative difference in the peak reflected over-pressures between the finite element model and the average measured data are equal to 3.6 and 3.4% without and with the protective foam, respectively. Similarly, the relative differences in the reflected impulses are 8.4 and 7.3%.
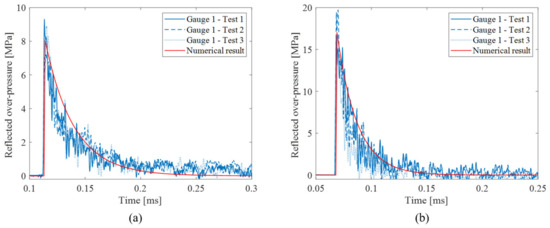
Figure 17.
Comparison of numerical and experimental reflected over-pressure measured by Gauge 1. (a) Results without the protective foam and (b) results with 60 mm thick foam cladding.
4.2. Comparison Between Experimental and Numerical Results
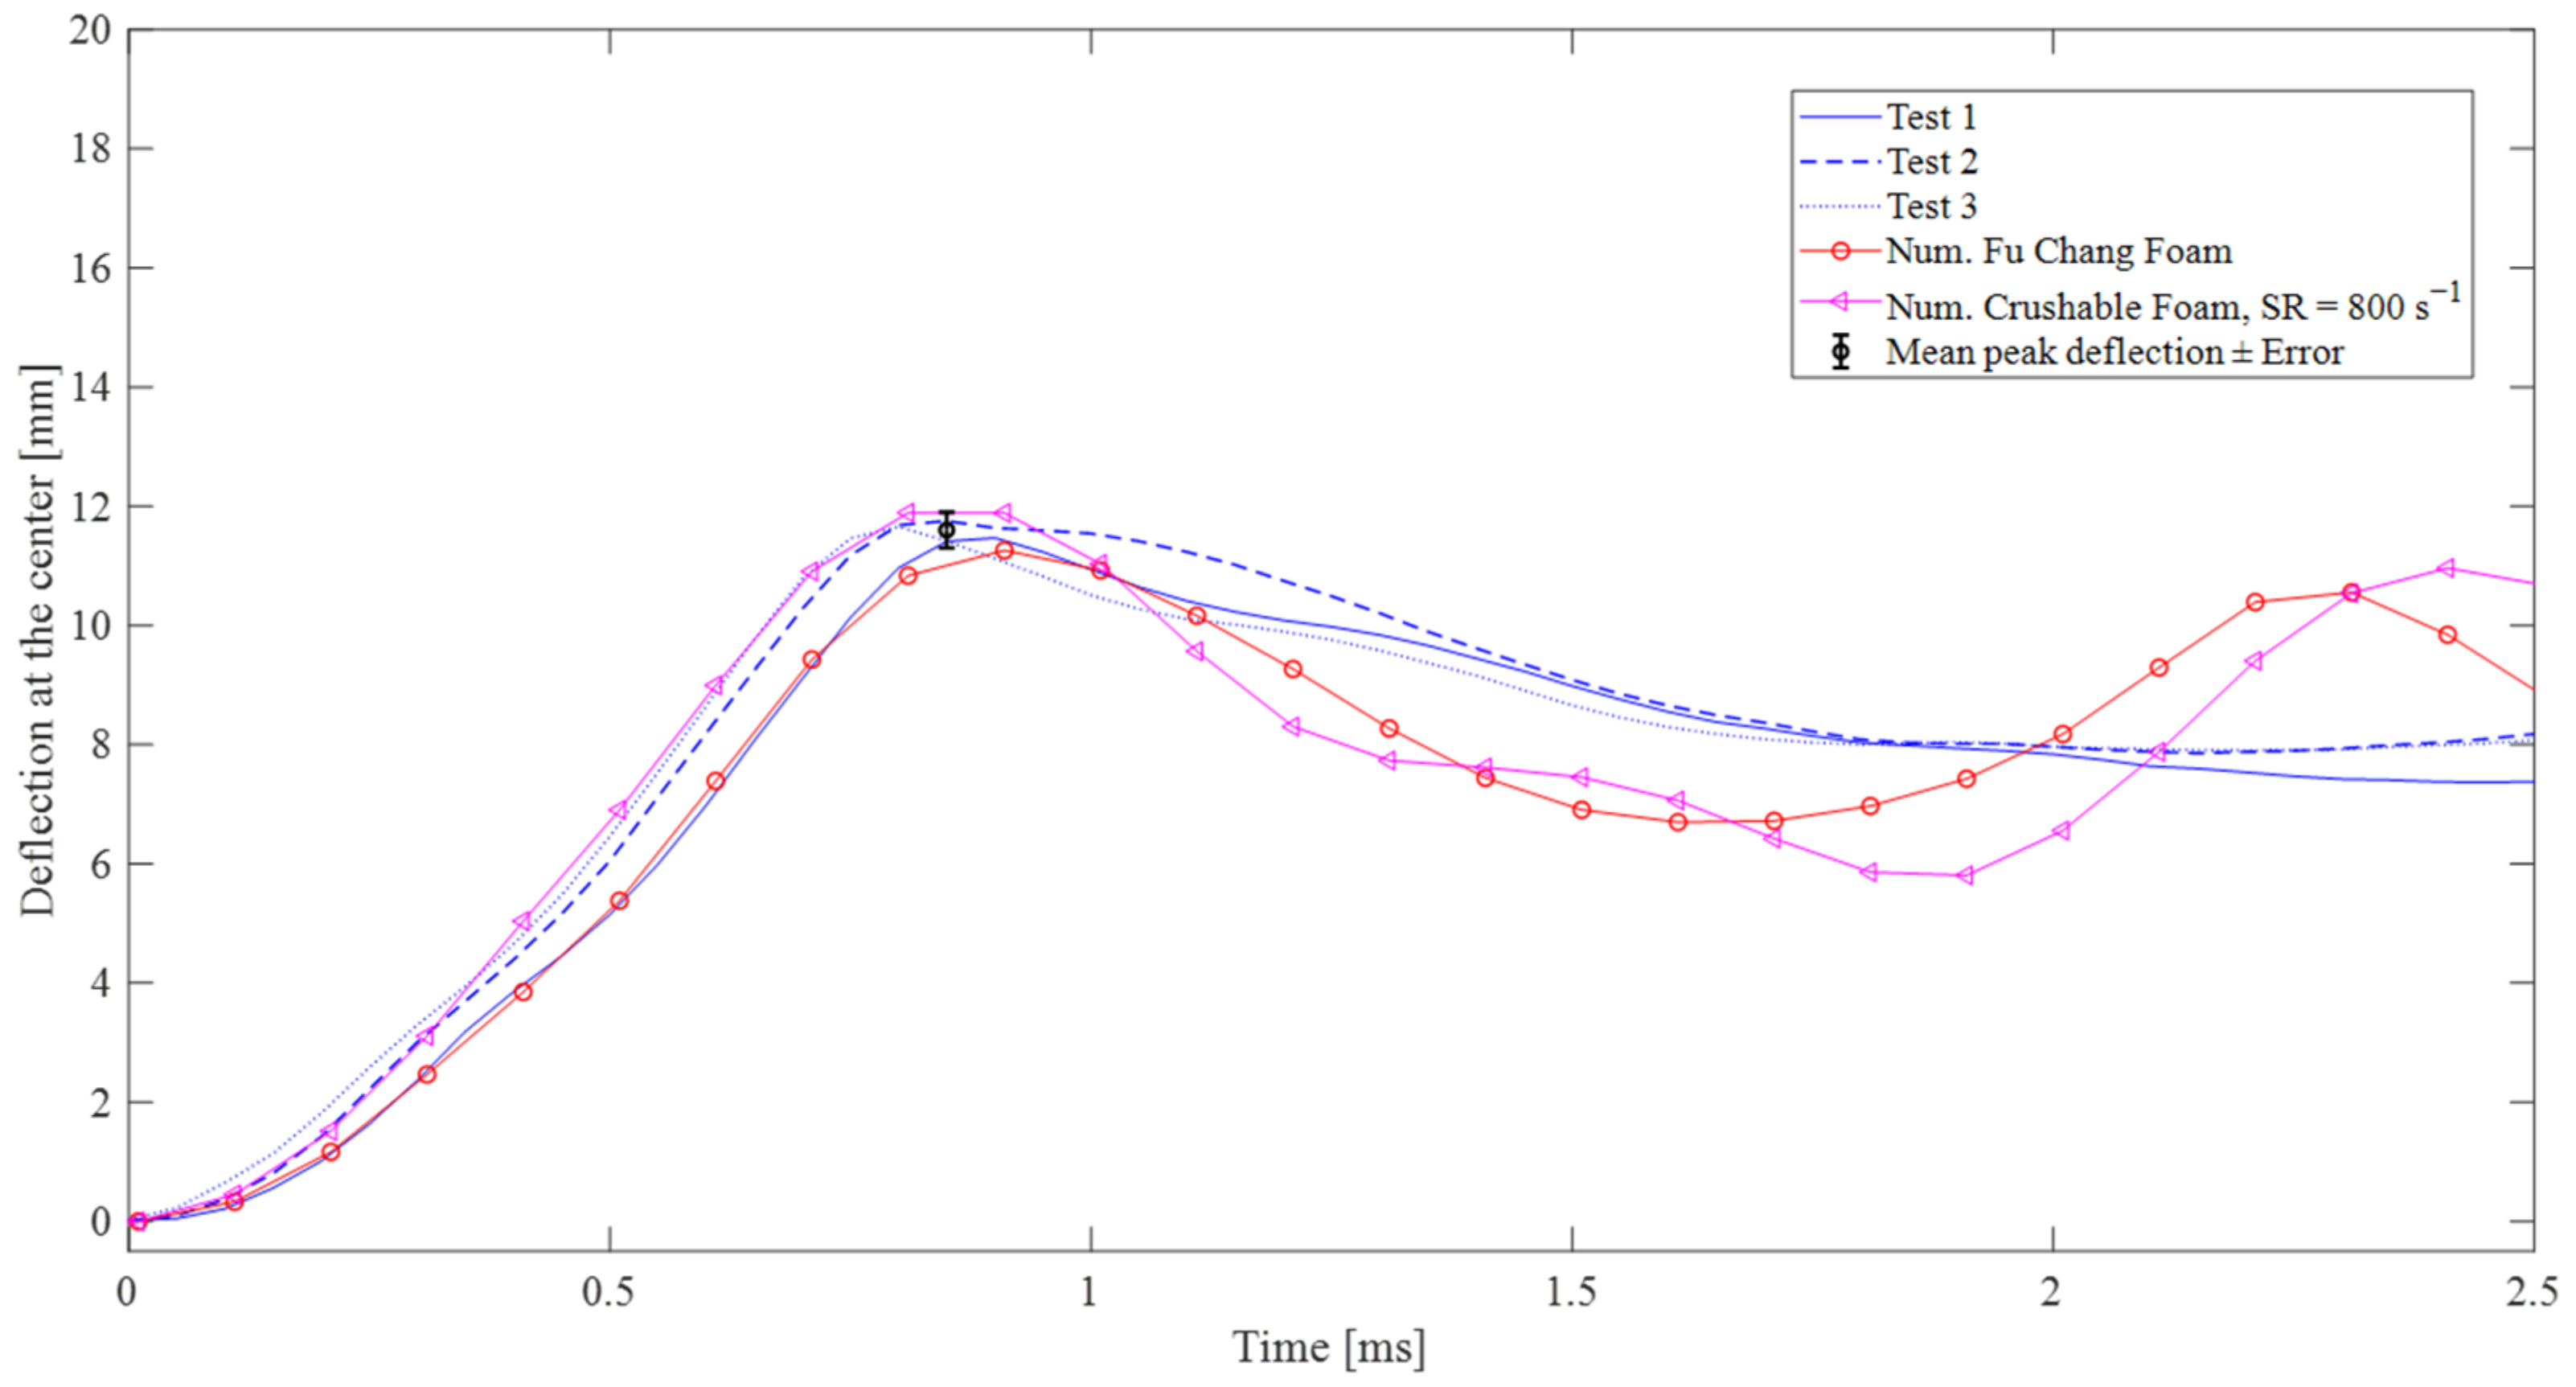
Figure 18 compares deflections at the center of the backplate between the experimental and numerical results for configuration A. The SPH method is a robust approach for predicting the deflection at the backplate’s center. The Fu Chang Foam and Crushable Foam material models predict maximum deflections of 11.9 and 11.3 mm, respectively, with a relative error of 3% compared to the mean experimental data of 11.6 mm. Furthermore, the Crushable Foam model considers a mean strain rate, yet it performs commendably. However, for practical design applications, the Fu Chang Foam model offers excellent suitability due to its consideration of a range of strain rates rather than a single value. Therefore, the Fu Chang Foam material model is adopted for further discussion in subsequent sections.
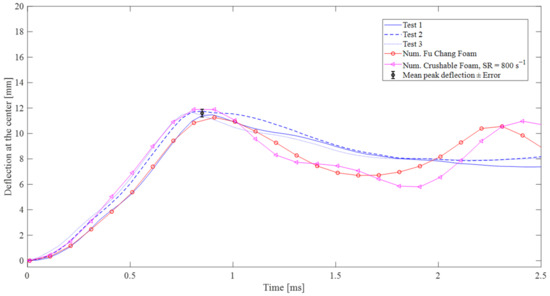
Figure 18.
Comparison between the experimental and numerical deflection at the backplate’s center with the protective foam for configuration A.
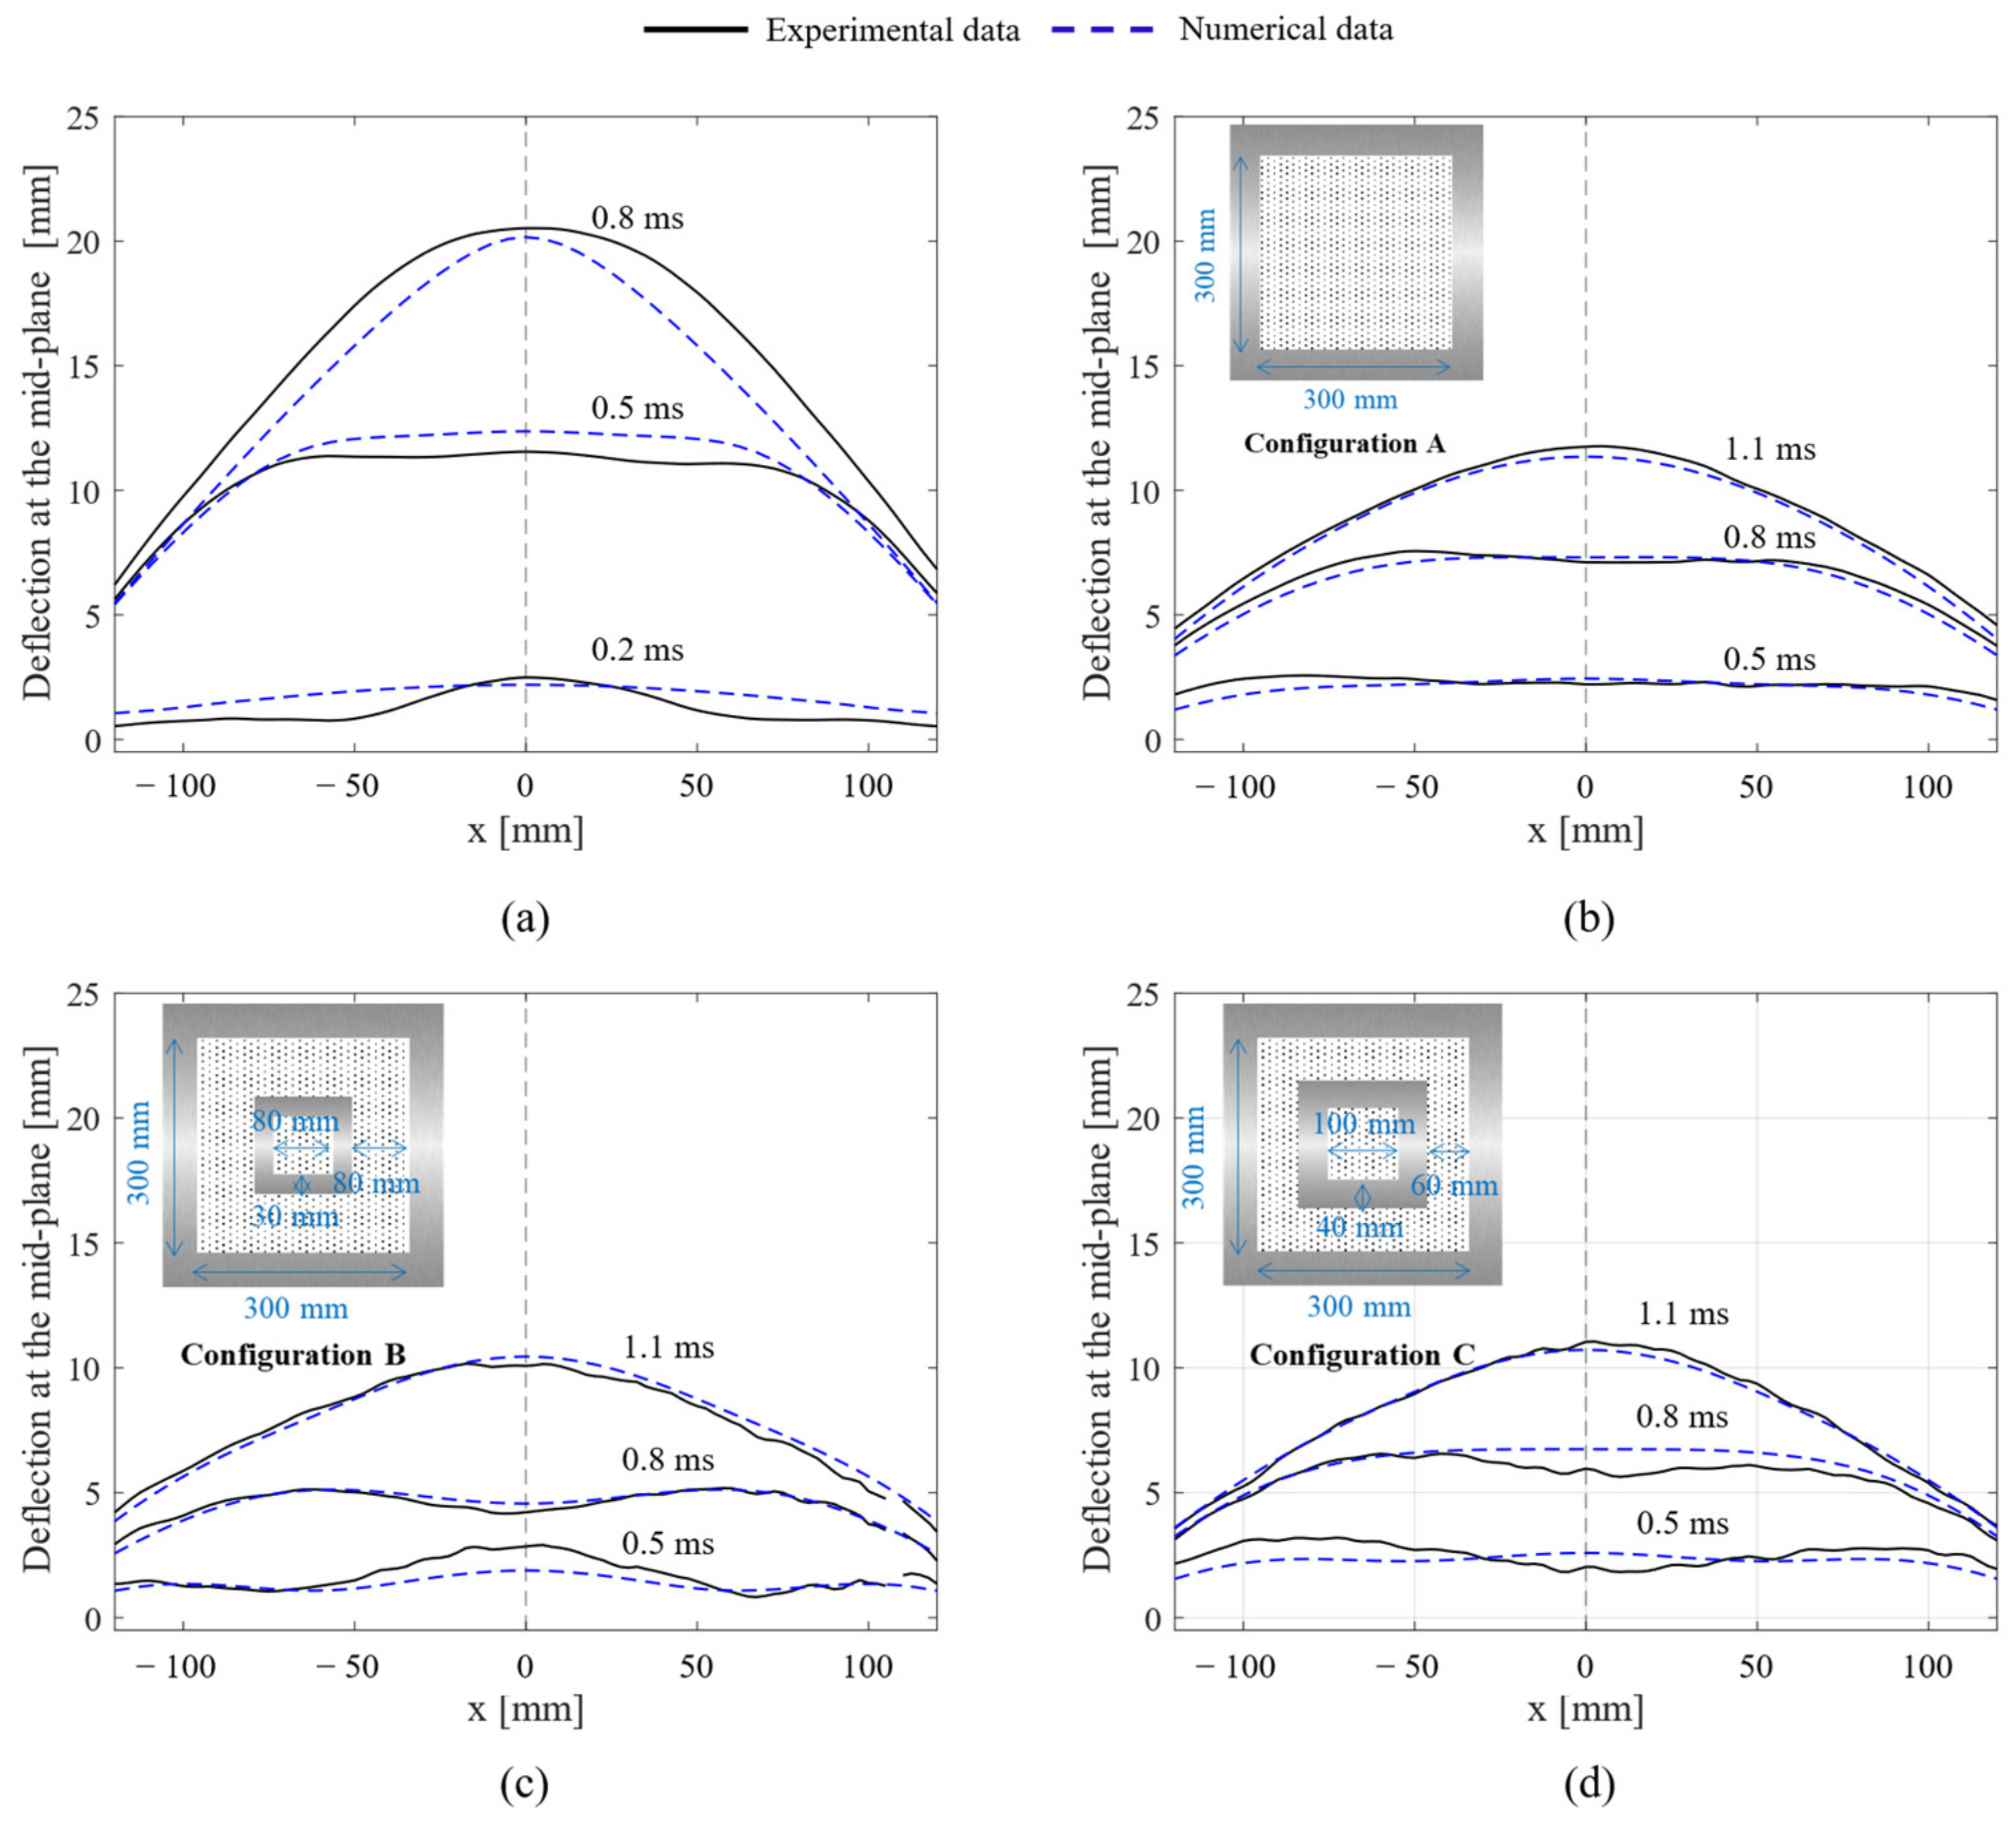
Figure 19 compares the deflection profiles from the numerical simulations to the experimental curves for configurations A to C. The simulations can predict the experimental results regarding deflection profiles with a relative error of about 5%.
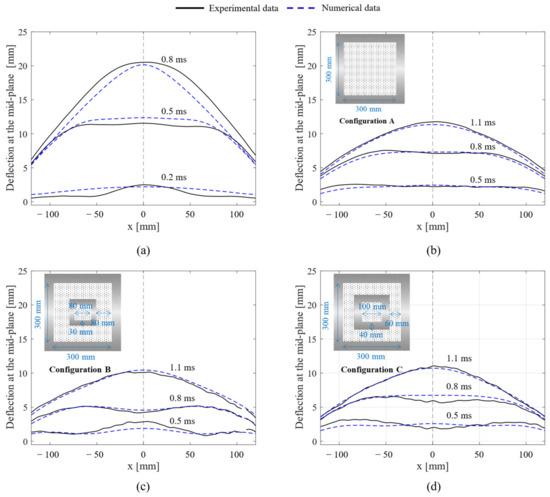
Figure 19.
Experimental and numerical deflection profiles: (a) Without the protective foam, (b) Configuration A, (c) Configuration B, and (d) Configuration C.
4.3. Parametric Study
4.3.1. Influence of the Core Configuration
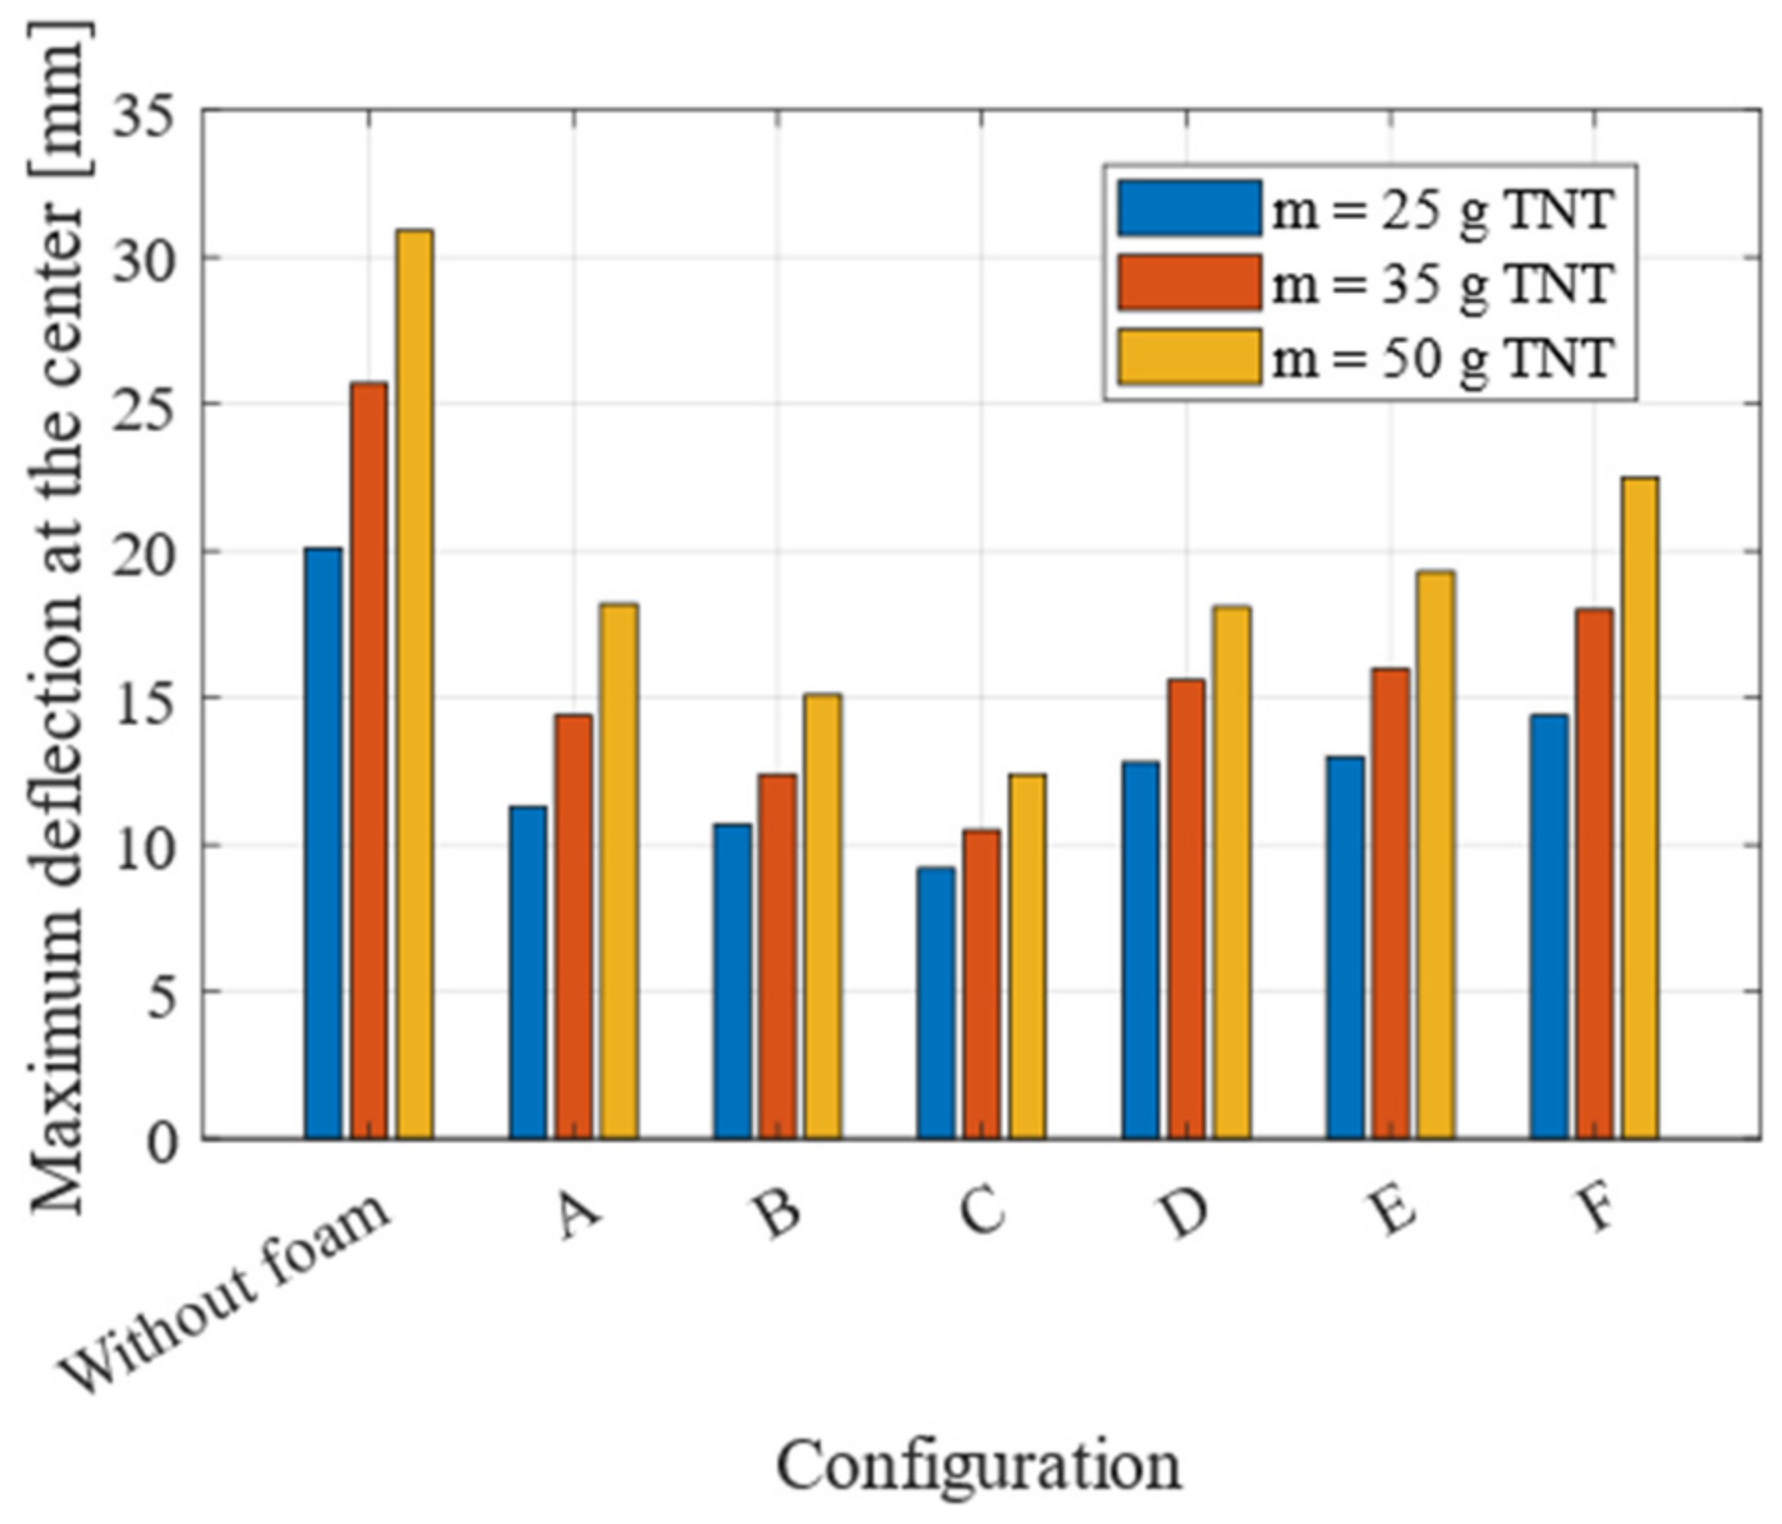
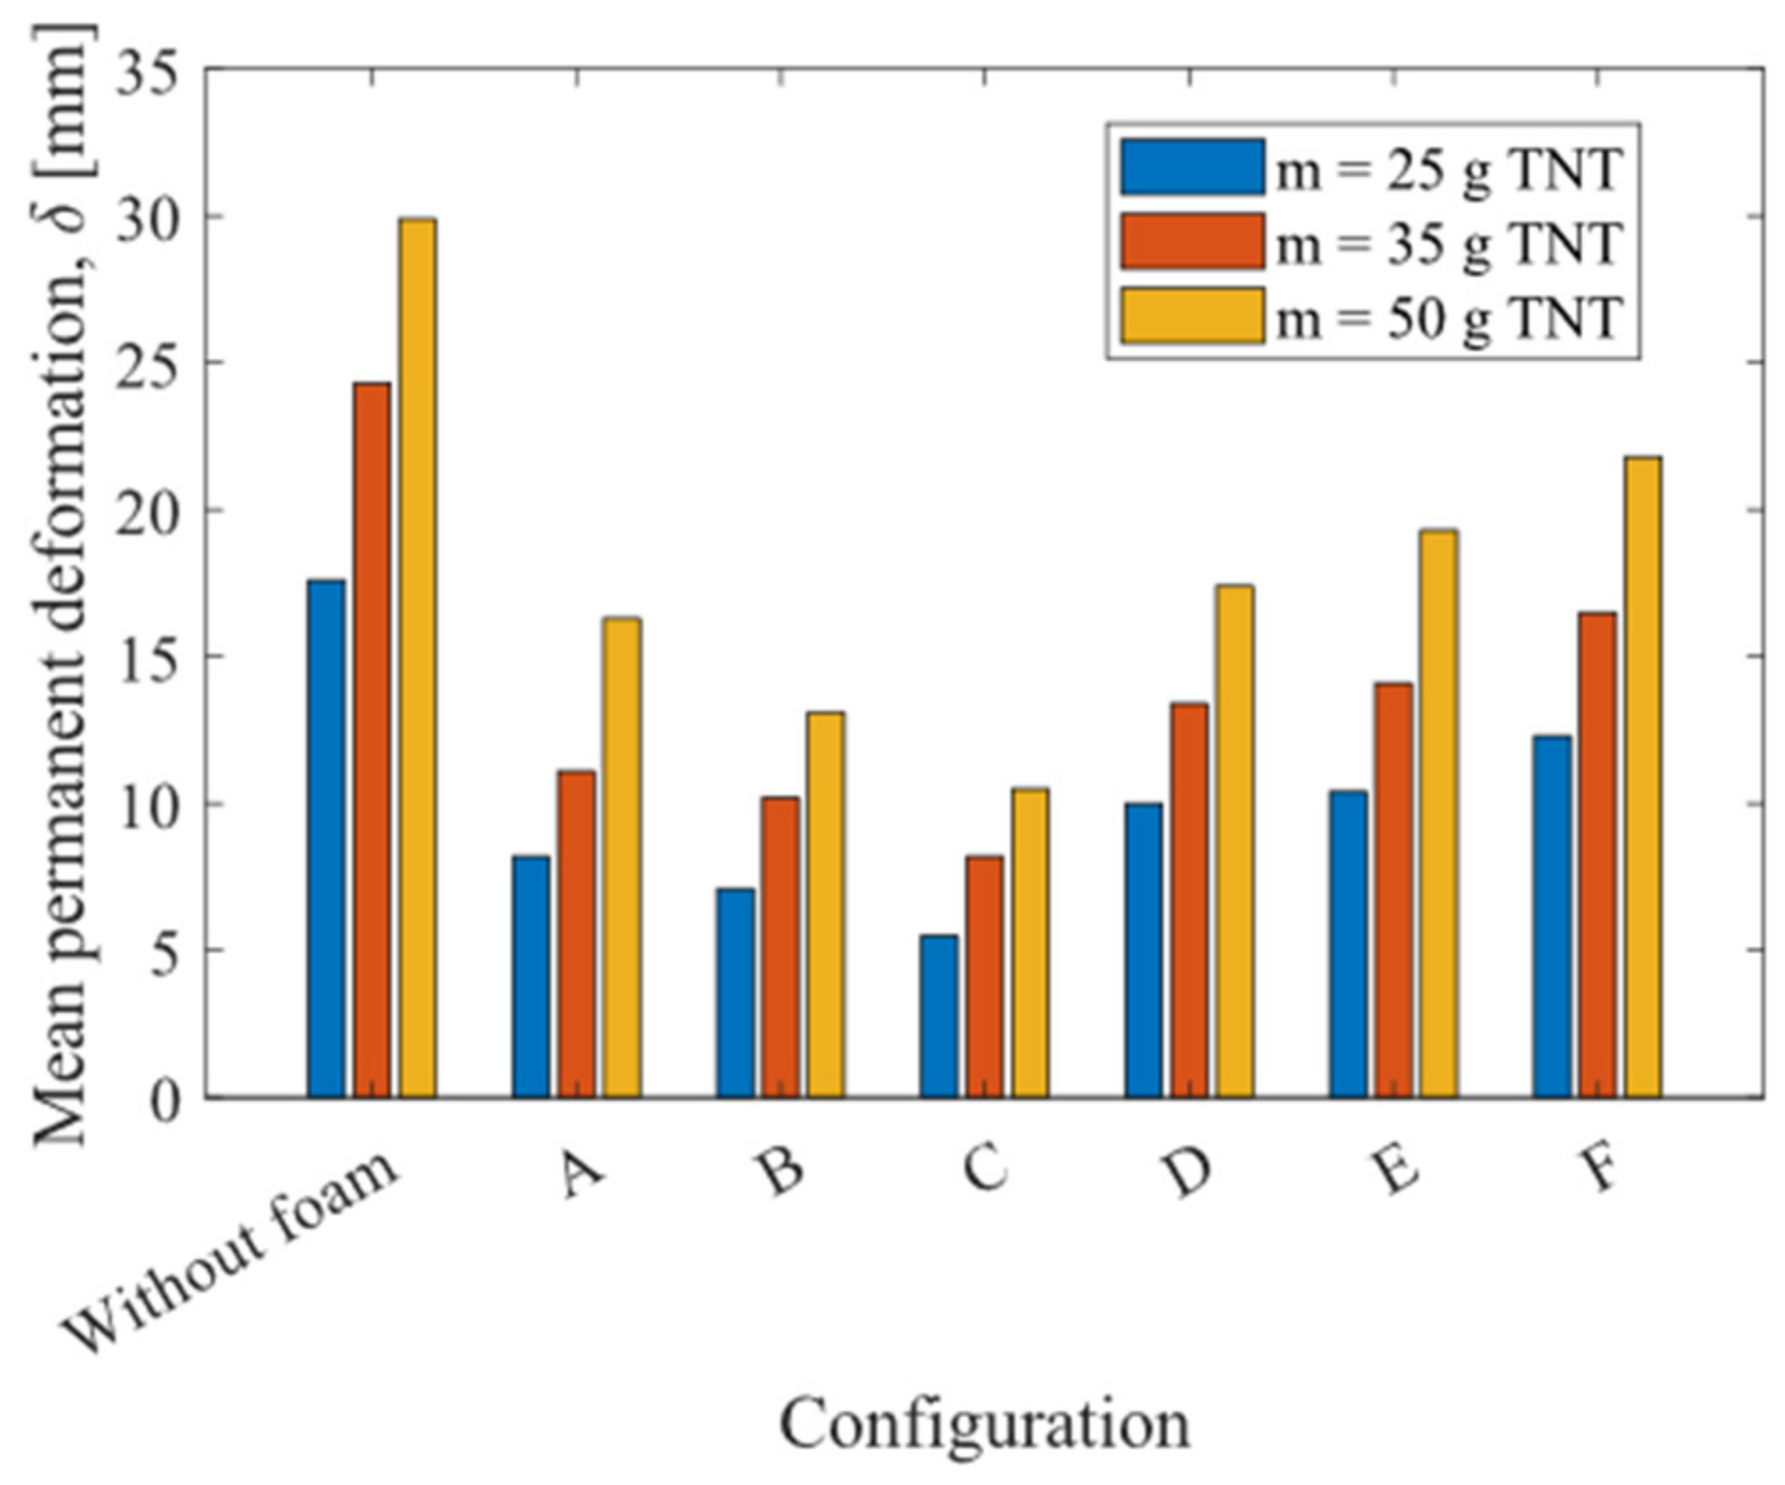
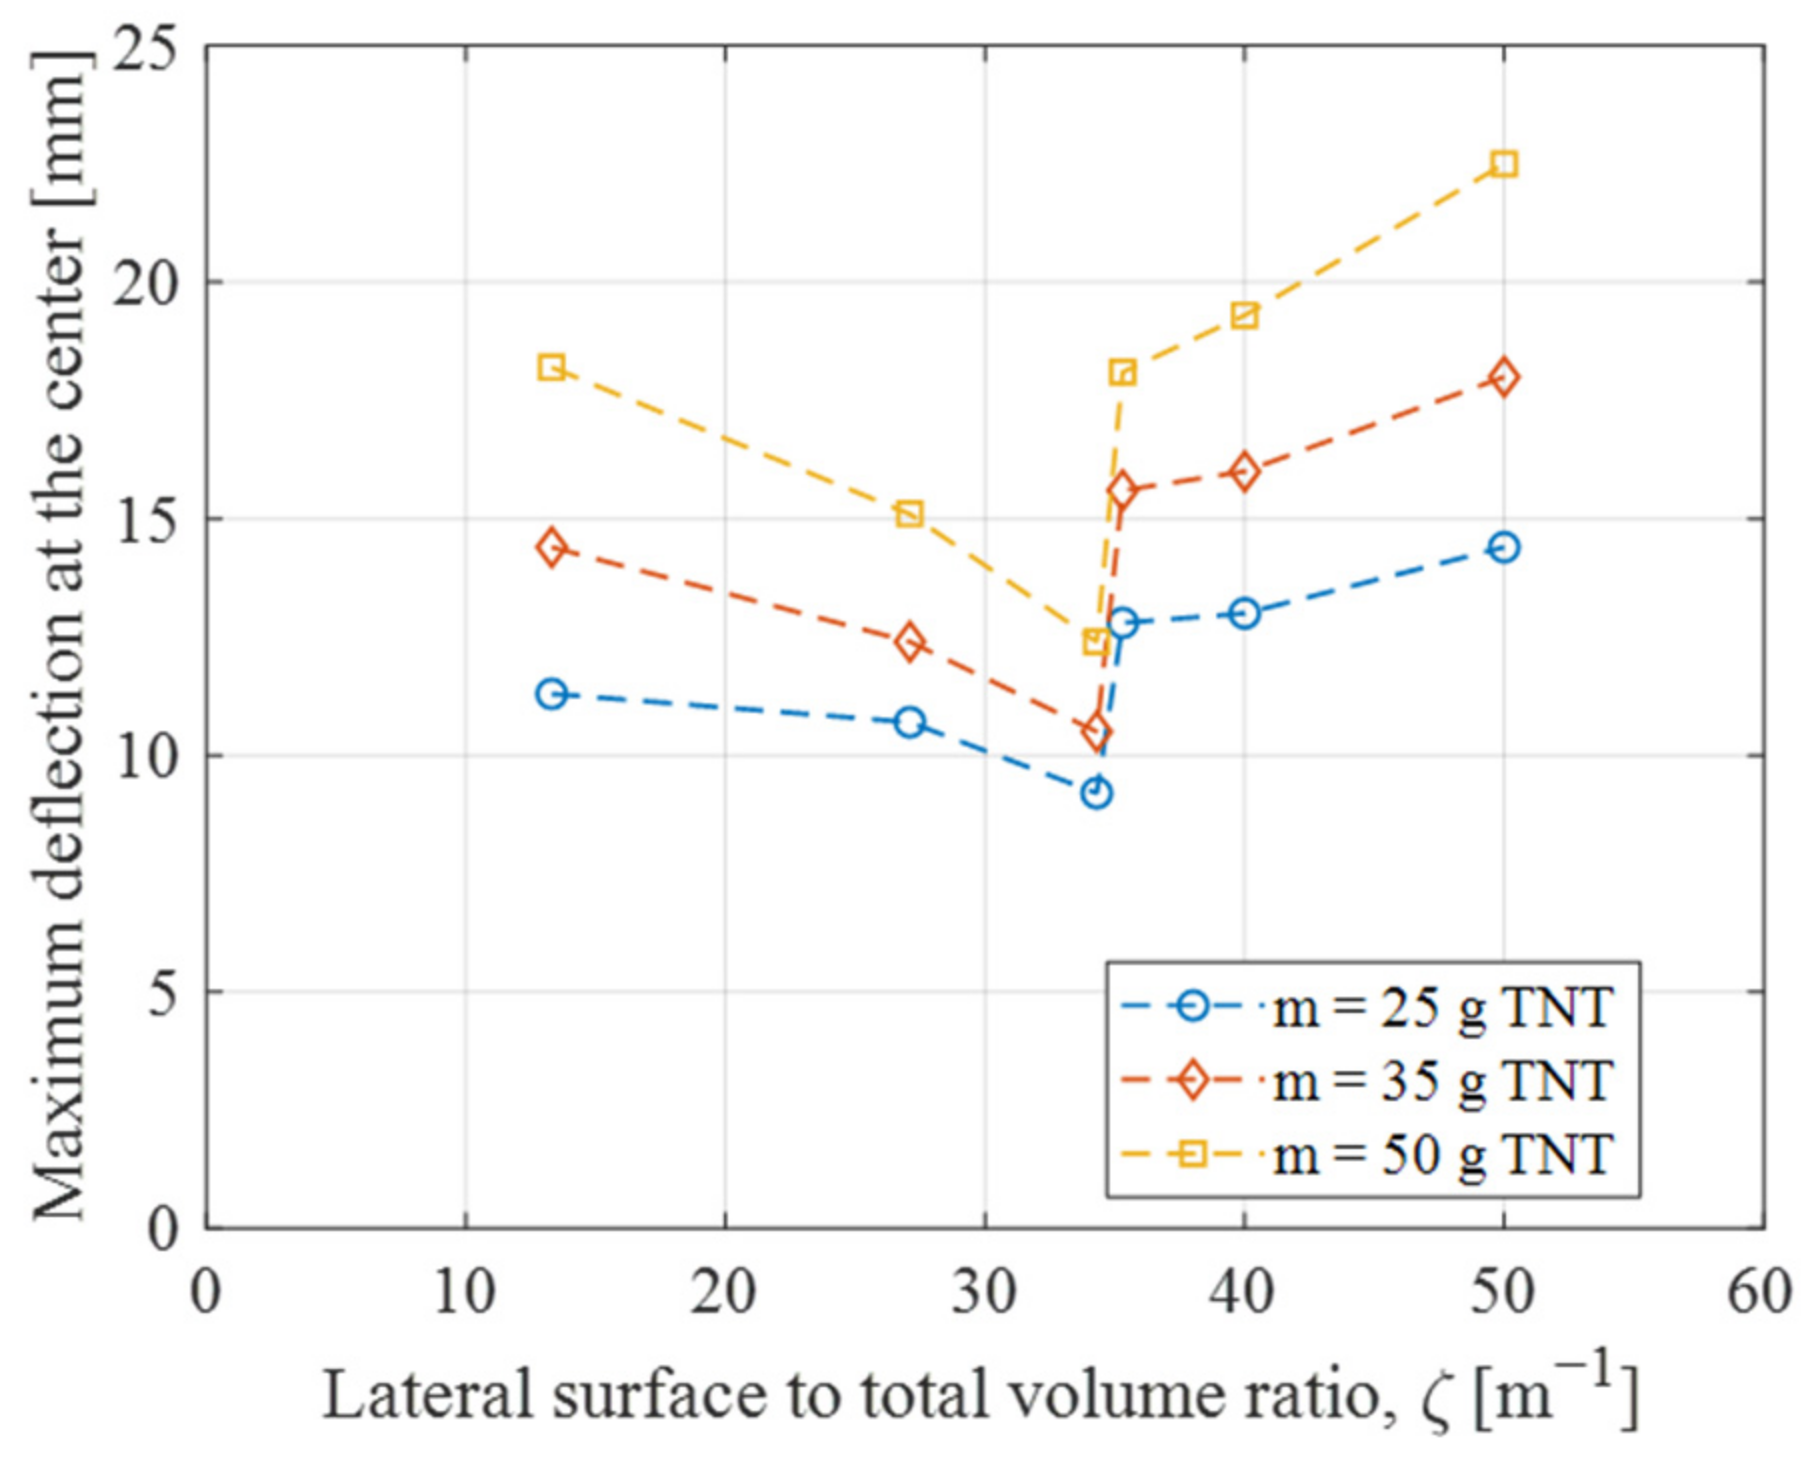
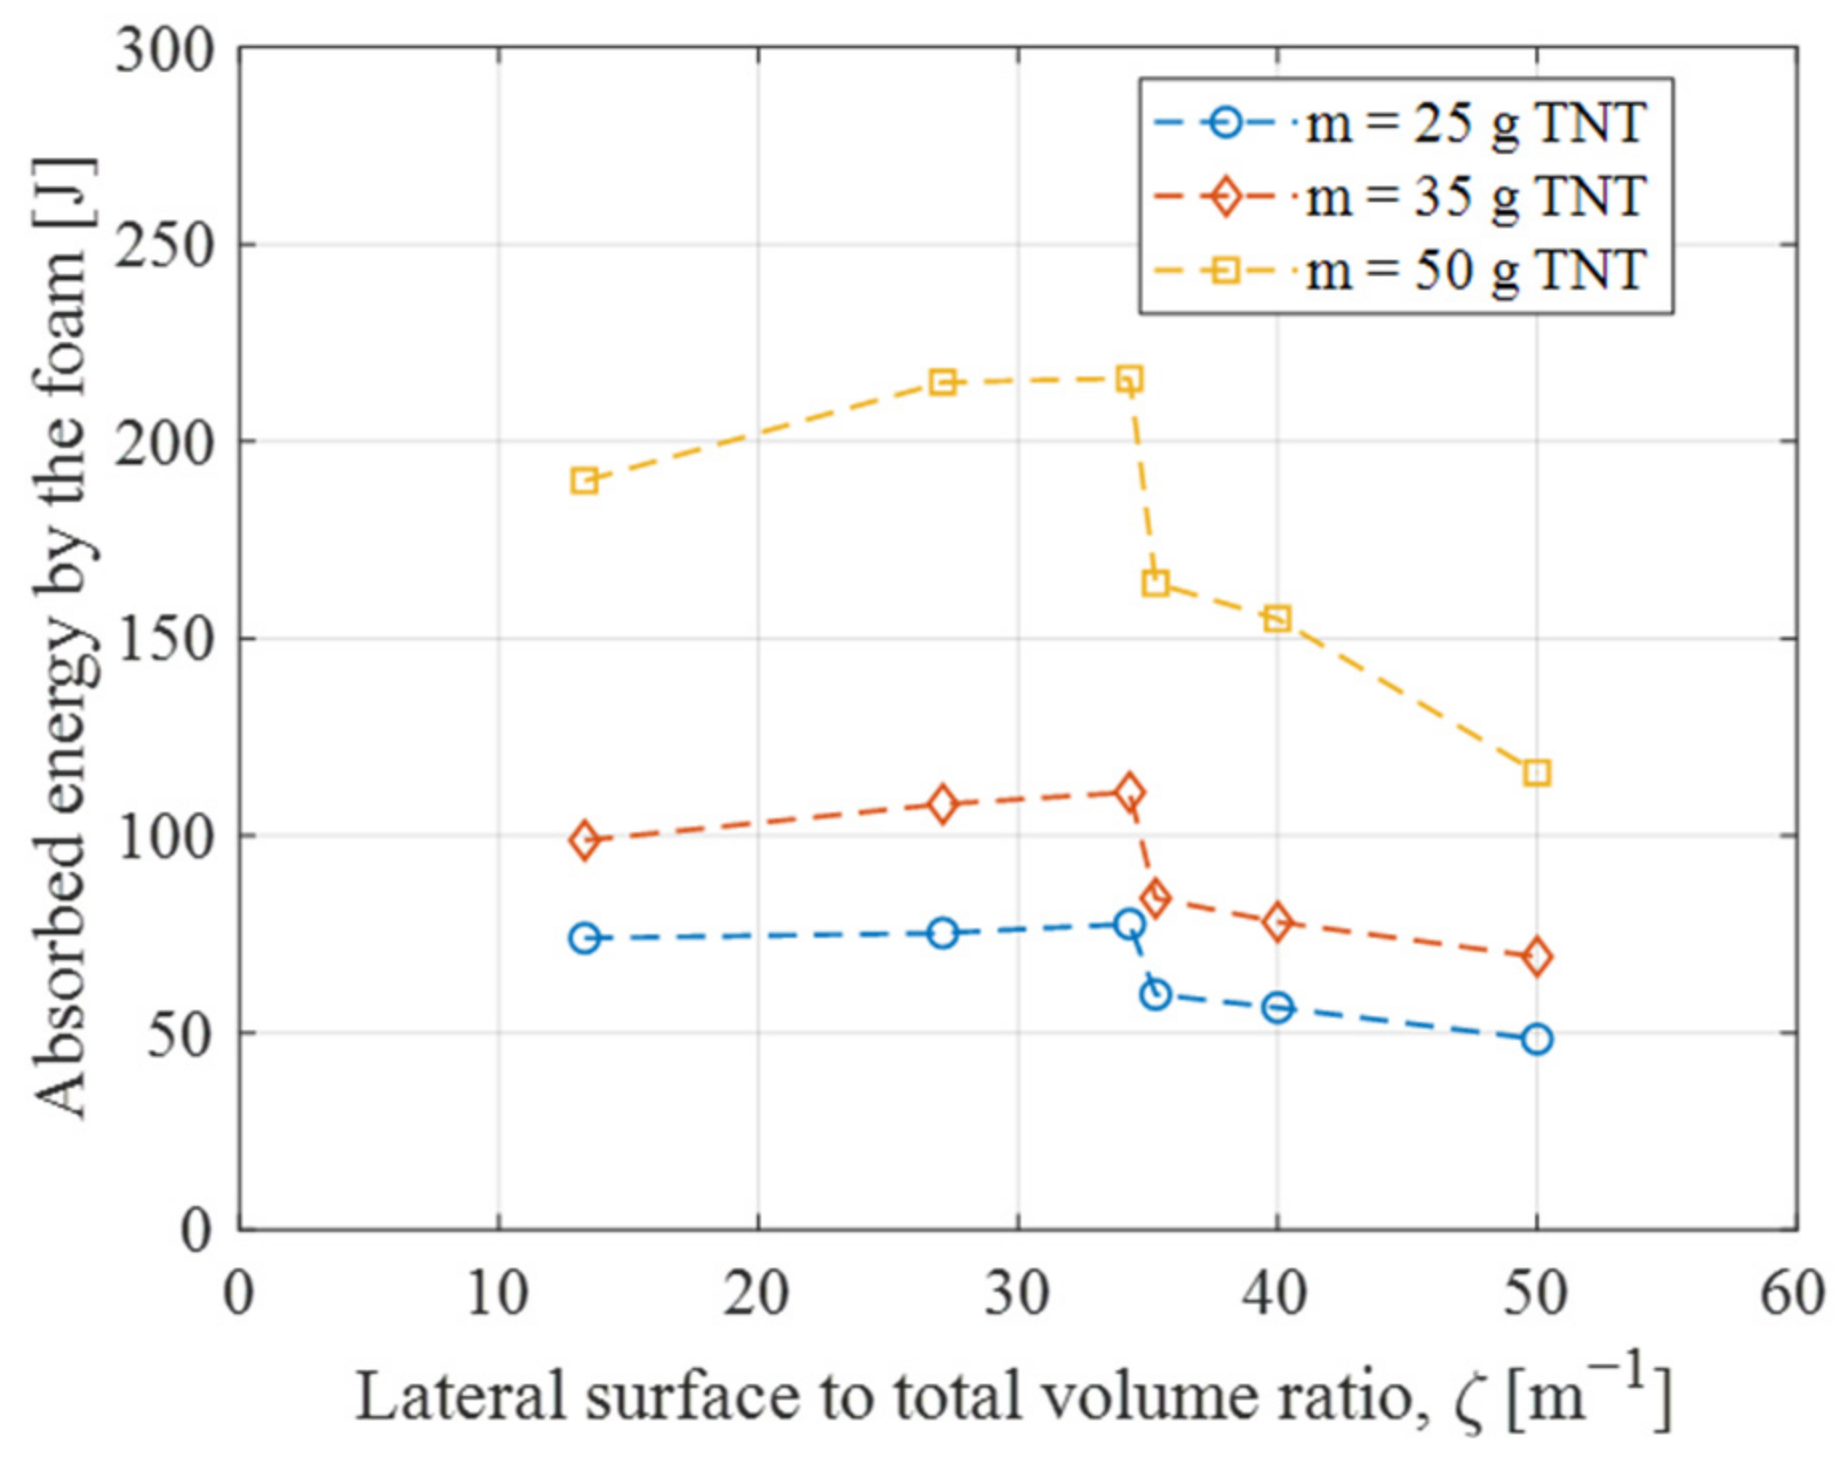
As shown in the experimental results in Section 2.4.3, the effectiveness of the SC is influenced by the core geometry. By increasing the ζ value from configuration A to C, the maximum deflection of the backplate is decreased. Therefore, three extra configurations (D to F) with higher values of ζ are included in this study. The effectiveness of each solution is assessed based on reductions in maximum OPD at the backplate’s center, mean permanent deformation and the absorbed energy by the foam. Figure 20 and Figure 21 present the maximum deflection and mean permanent deformation at the backplate’s center. Contrary to the findings of Zhou et al. [42], this study does not reveal any negative protection effects of the SC. Adding a foam layer consistently decreases maximum deflection and mean permanent deformation for all the considered configurations. Regardless of the charge mass, the minimum reduction in terms of maximum deflection and mean permanent deformation at the center is about 30% obtained with configuration F. In comparison, the maximum reduction is about 60 and 70%, respectively, obtained with configuration C. Figure 22 and Figure 23 highlight an optimal value of ζ (corresponding to configuration C) that minimizes deflection while maximizing the absorbed energy by the foam. This optimal value remains even with higher explosive charge masses.
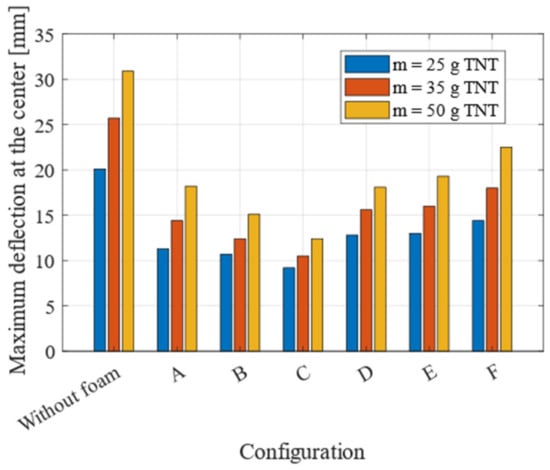
Figure 20.
Bar chart illustrating the maximum deflection of the backplate’s center across various configurations and three charge masses.
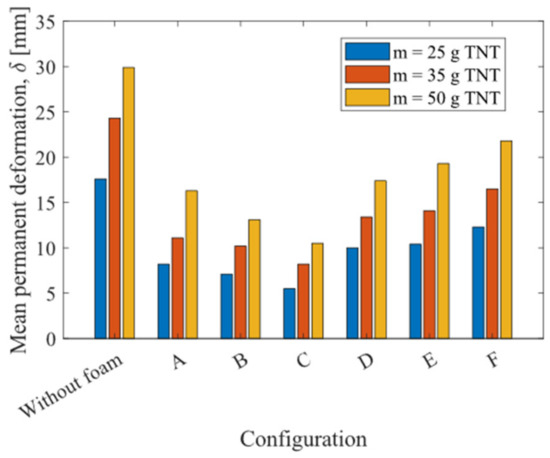
Figure 21.
Bar chart illustrating the mean permanent deformation of the backplate’s center across various configurations and three charge masses.
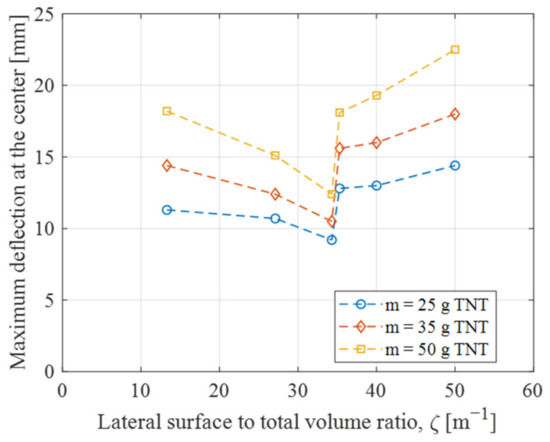
Figure 22.
Maximum deflection at the backplate’s center as a function of ζ and for different explosive charge masses.
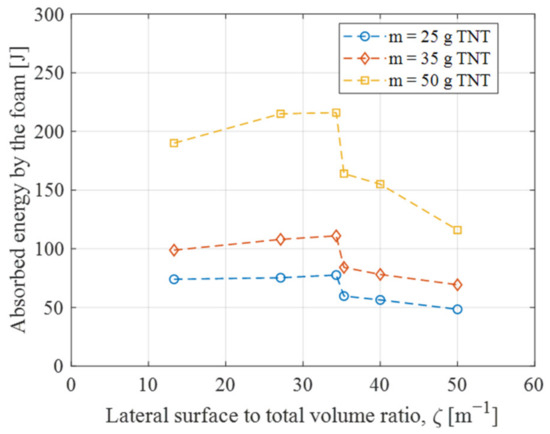
Figure 23.
Absorbed energy by the foam as a function of ζ and for different explosive charge masses.
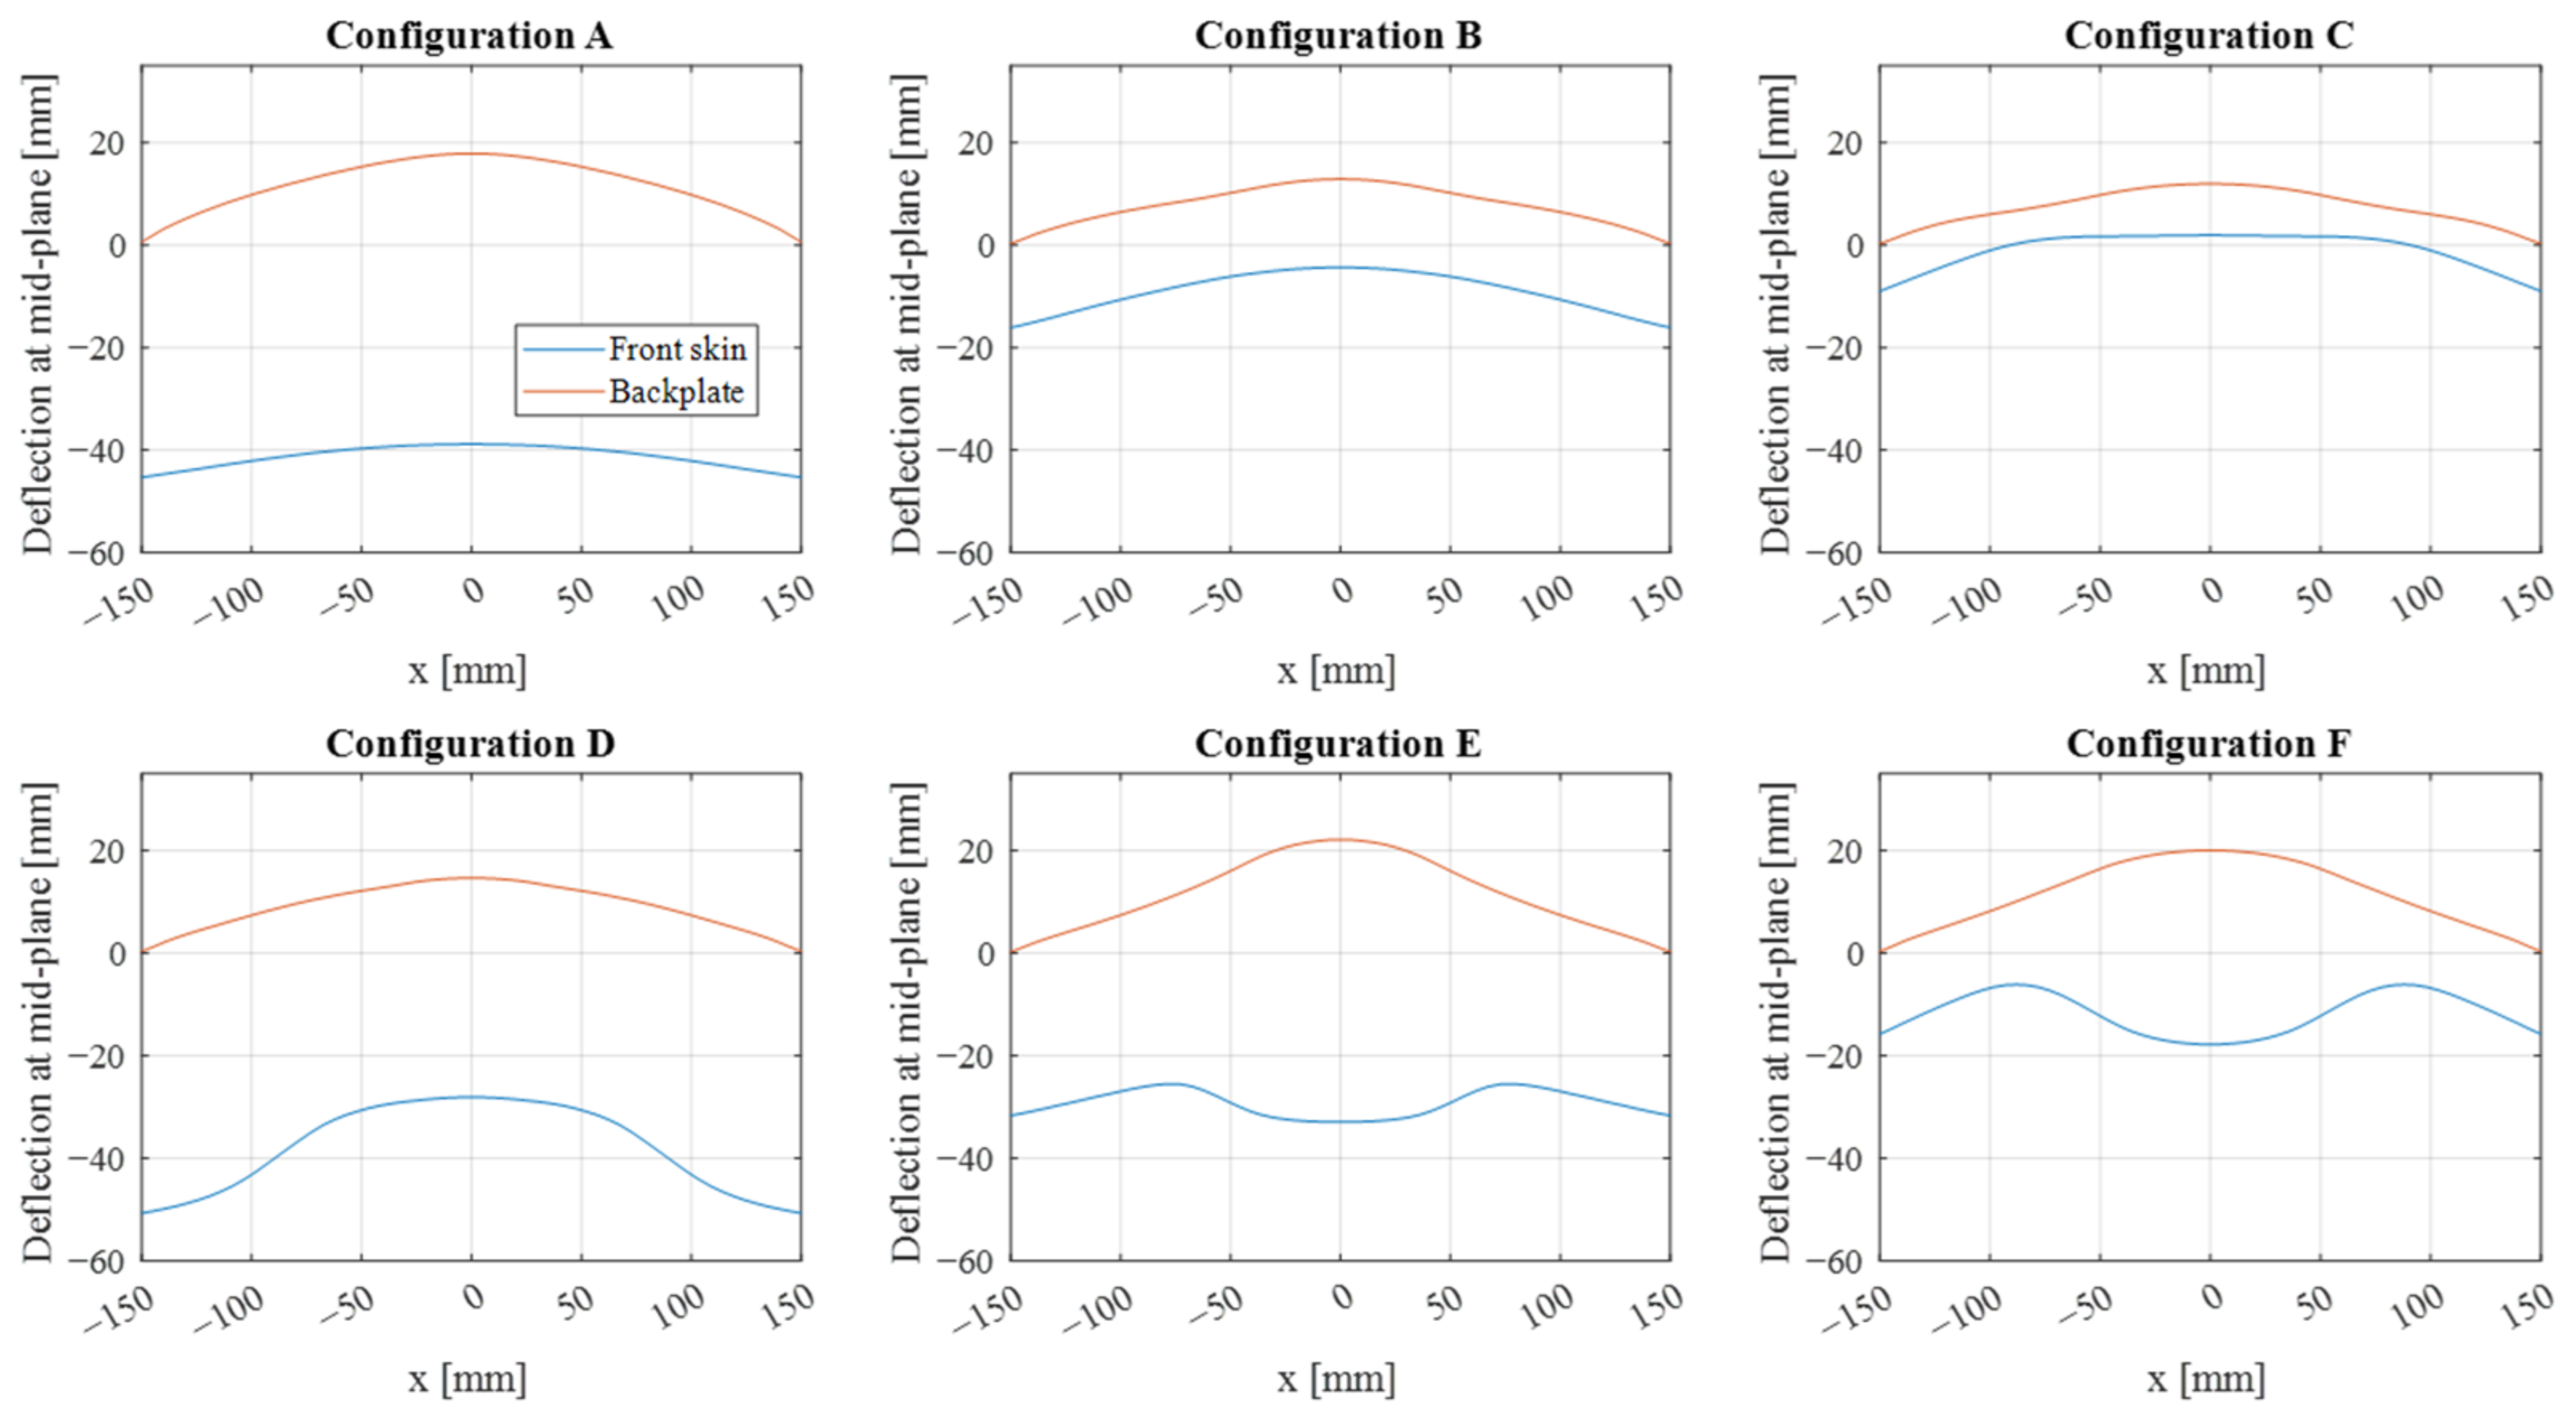
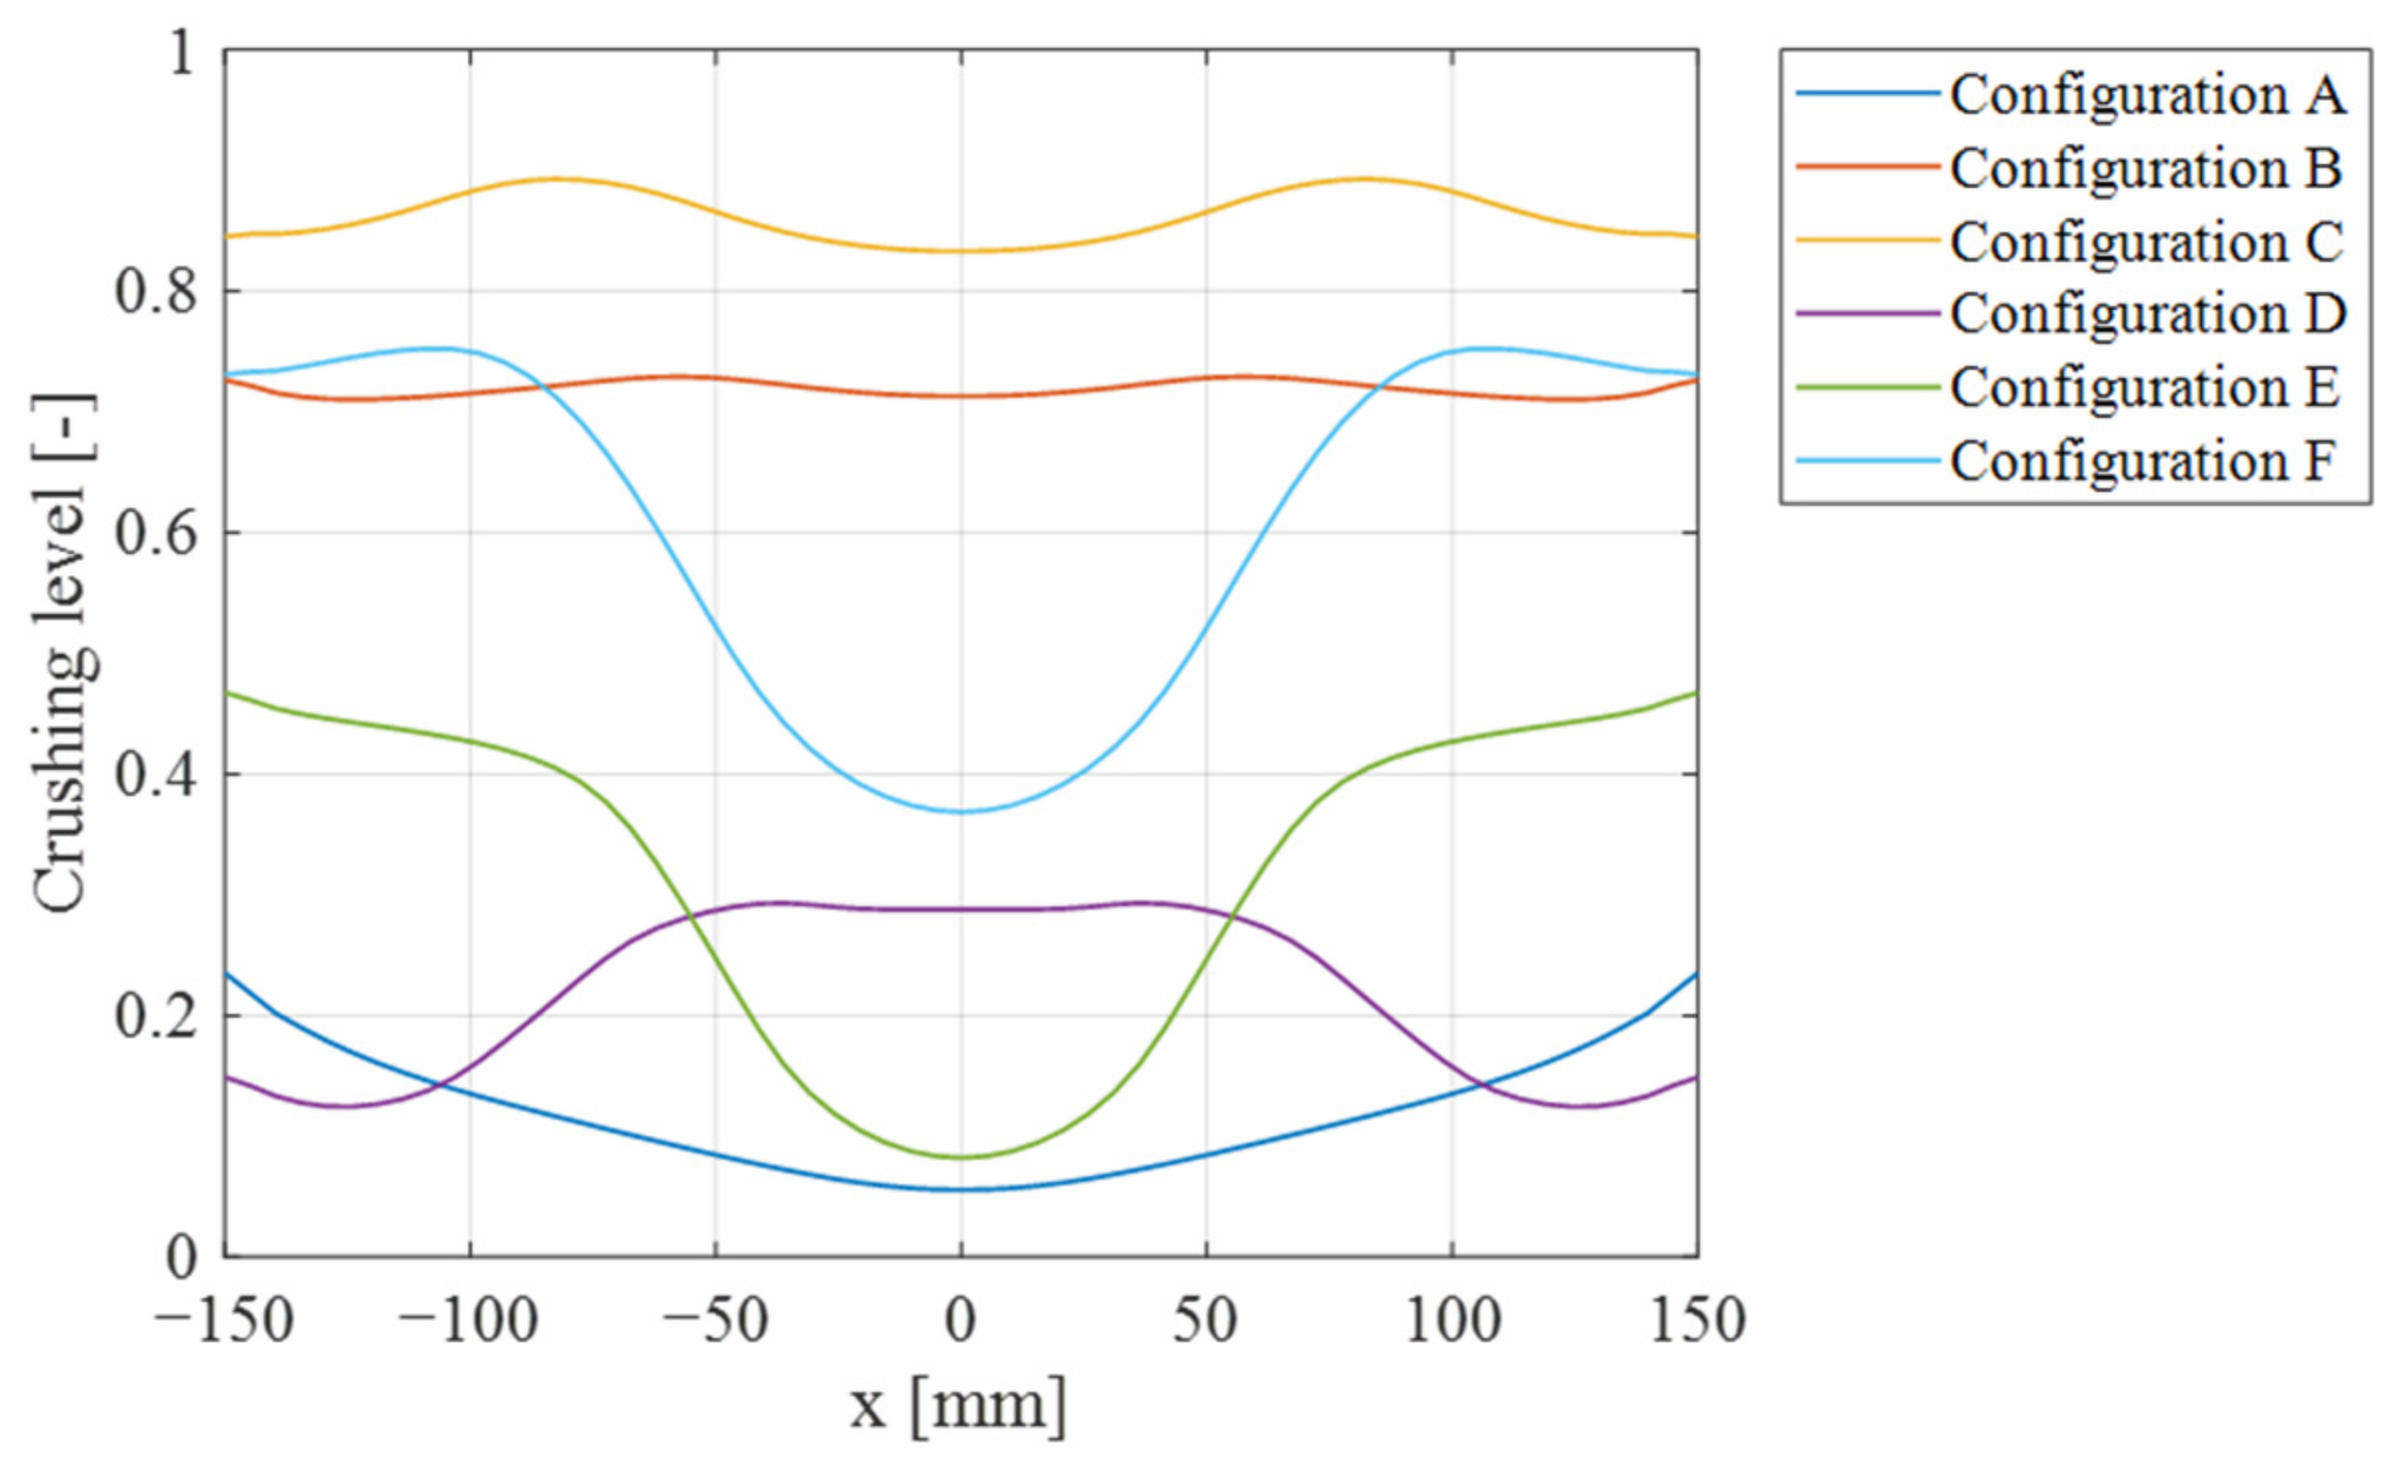
To gain further insight into the underlying phenomena, an analysis of the deformation of the backplate and front skin, and crushing level of the foam is performed in Figure 24, Figure 25, Figure 26 and Figure 27. The curves in Figure 26 corresponding to the crushing level of the foam are obtained using Equation (2):
where is the deformation of the backplate, is the deformation of the front skin, and 60 is the thickness of the foam (see Figure 25). A crushing level of 1 means that the foam has reached full densification.
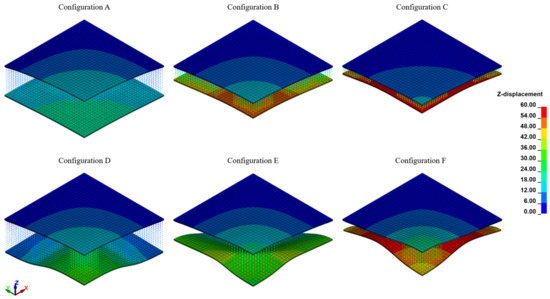
Figure 24.
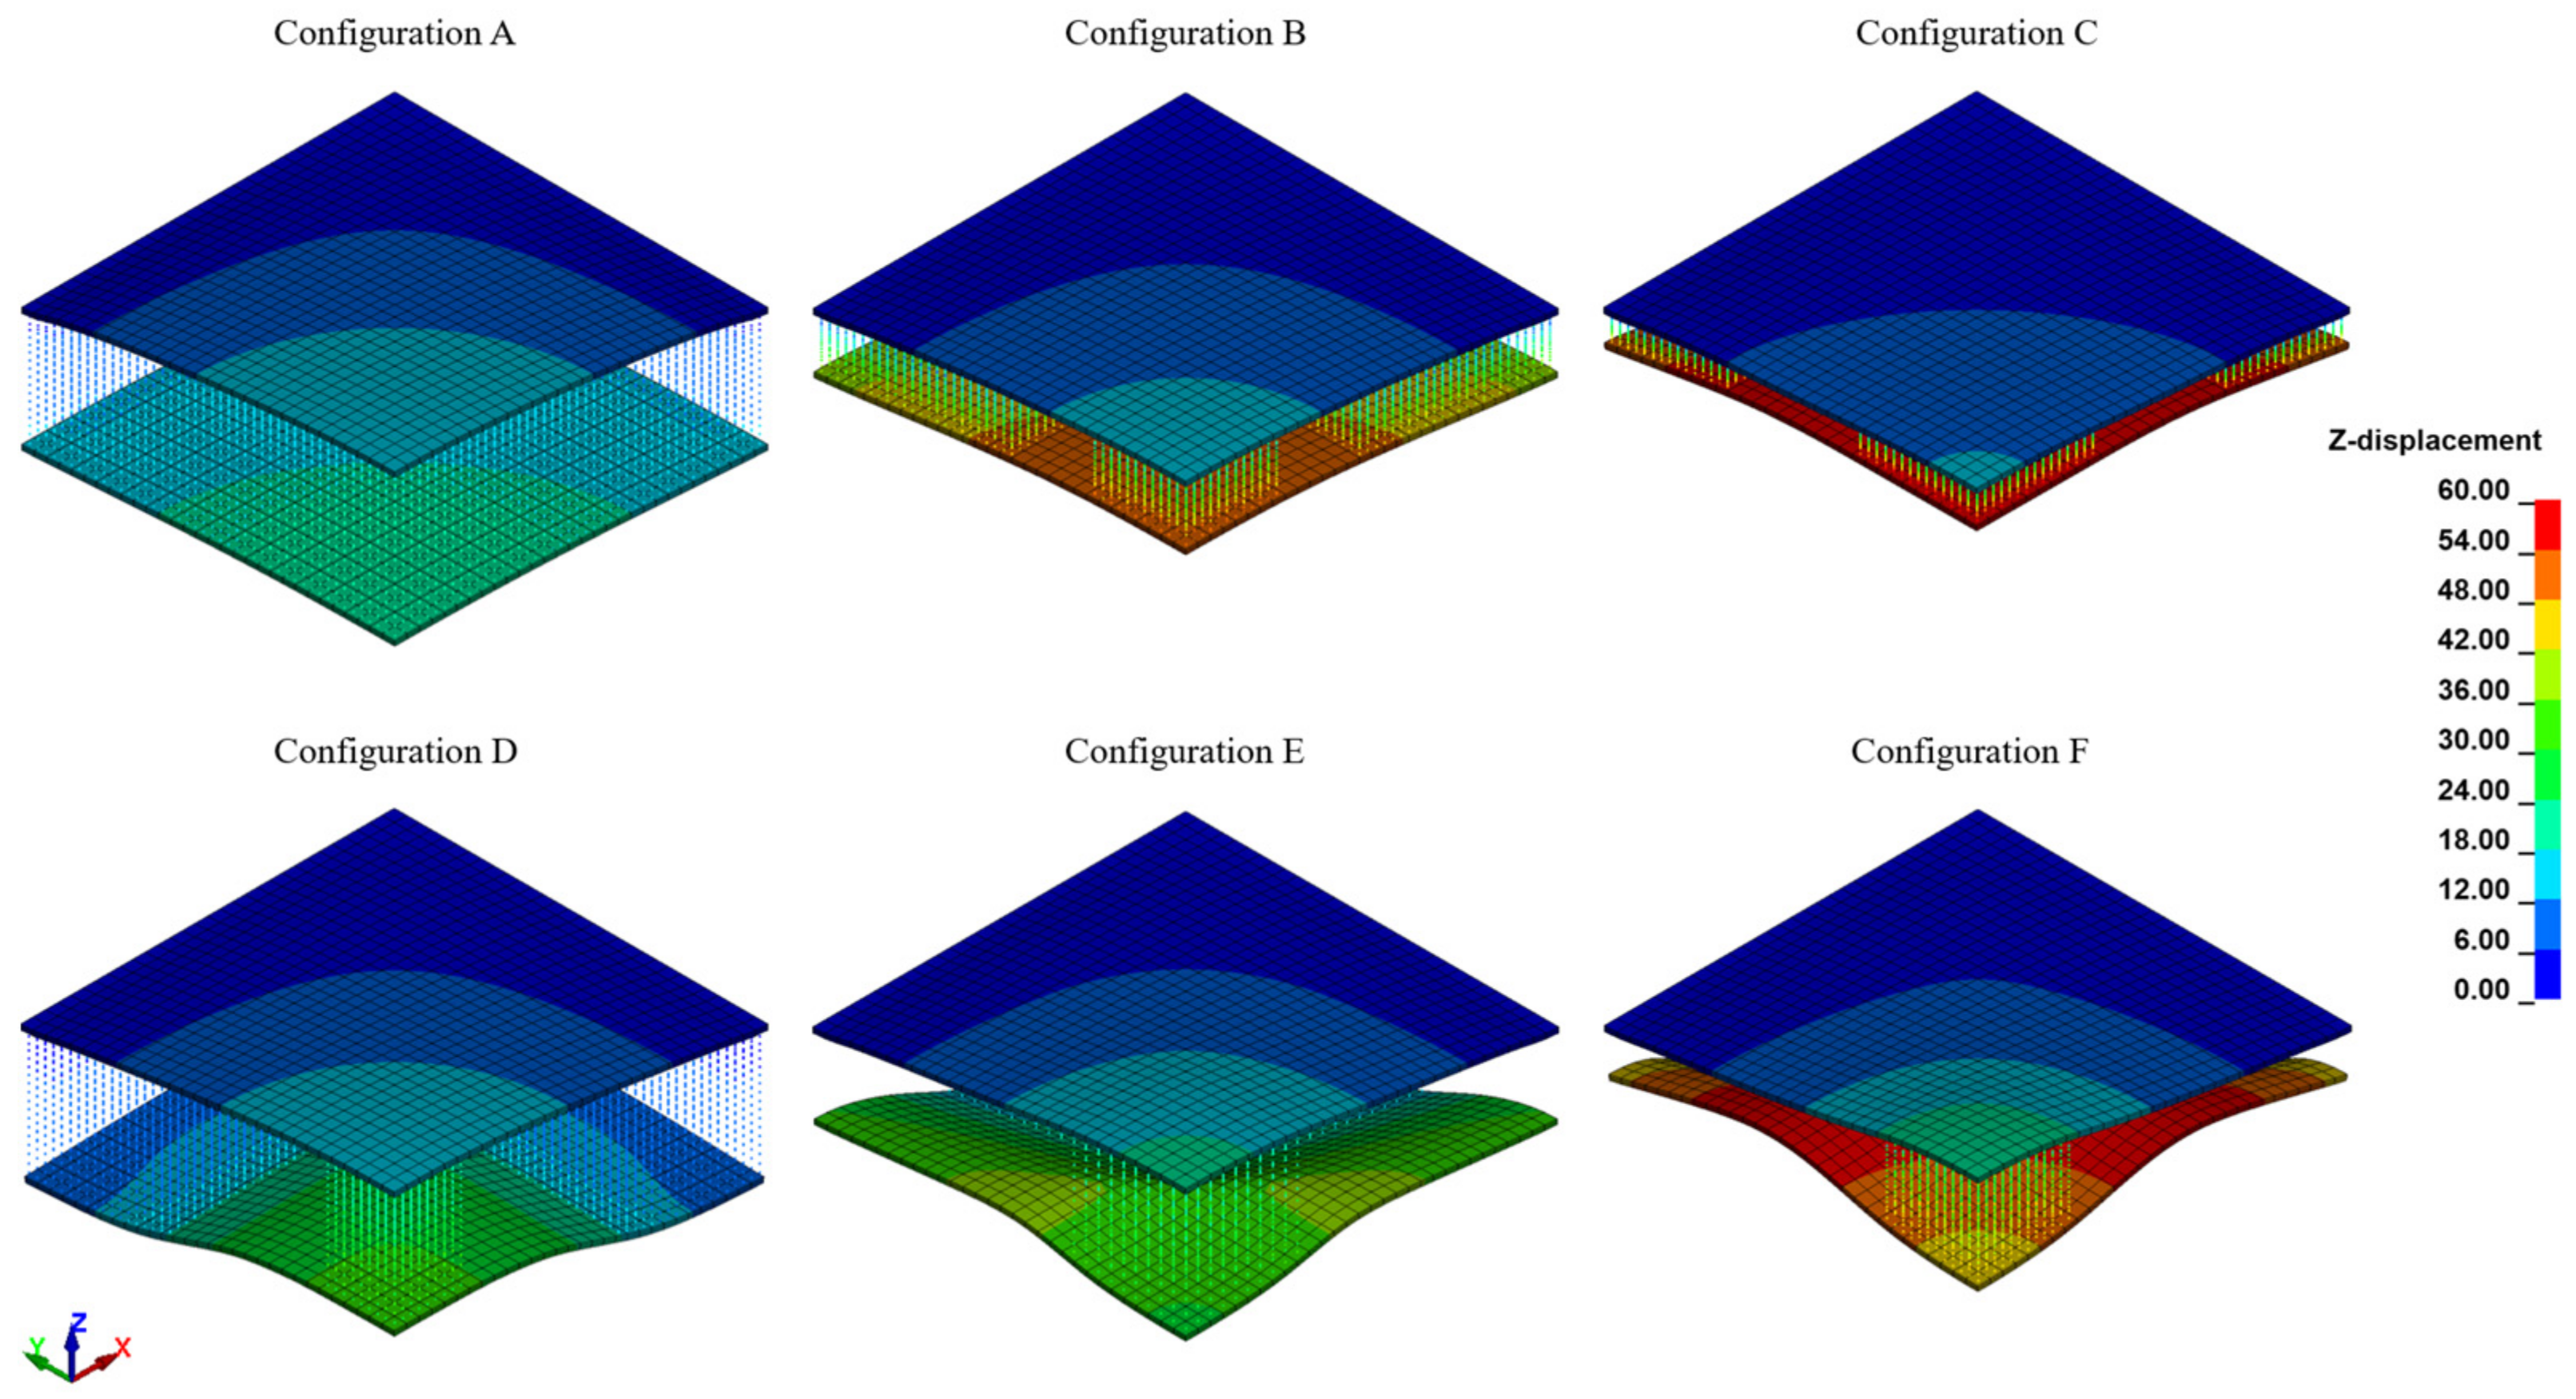
Isometric view of the out-of-plane displacements (in mm) of the backplate (top plate), foam and front skin of the different configurations.
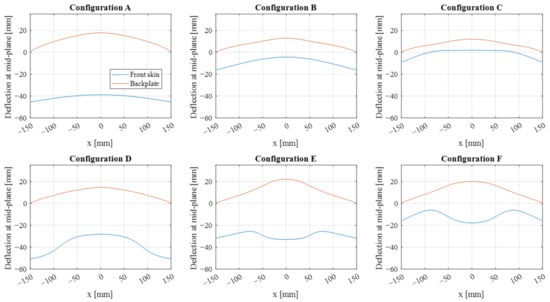
Figure 25.
Deflection profiles at mid-plane of the backplate and the front skin.
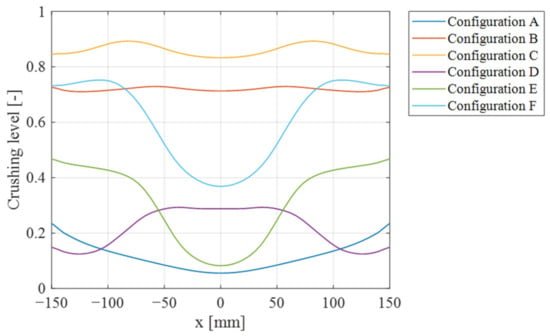
Figure 26.
Foam level of crushing across various foam configurations and a charge mass of 50 g TNT equivalent.
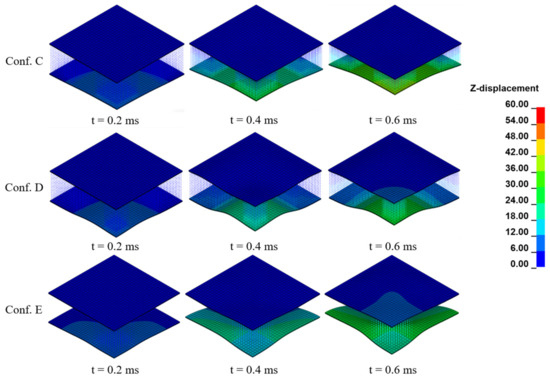
Figure 27.
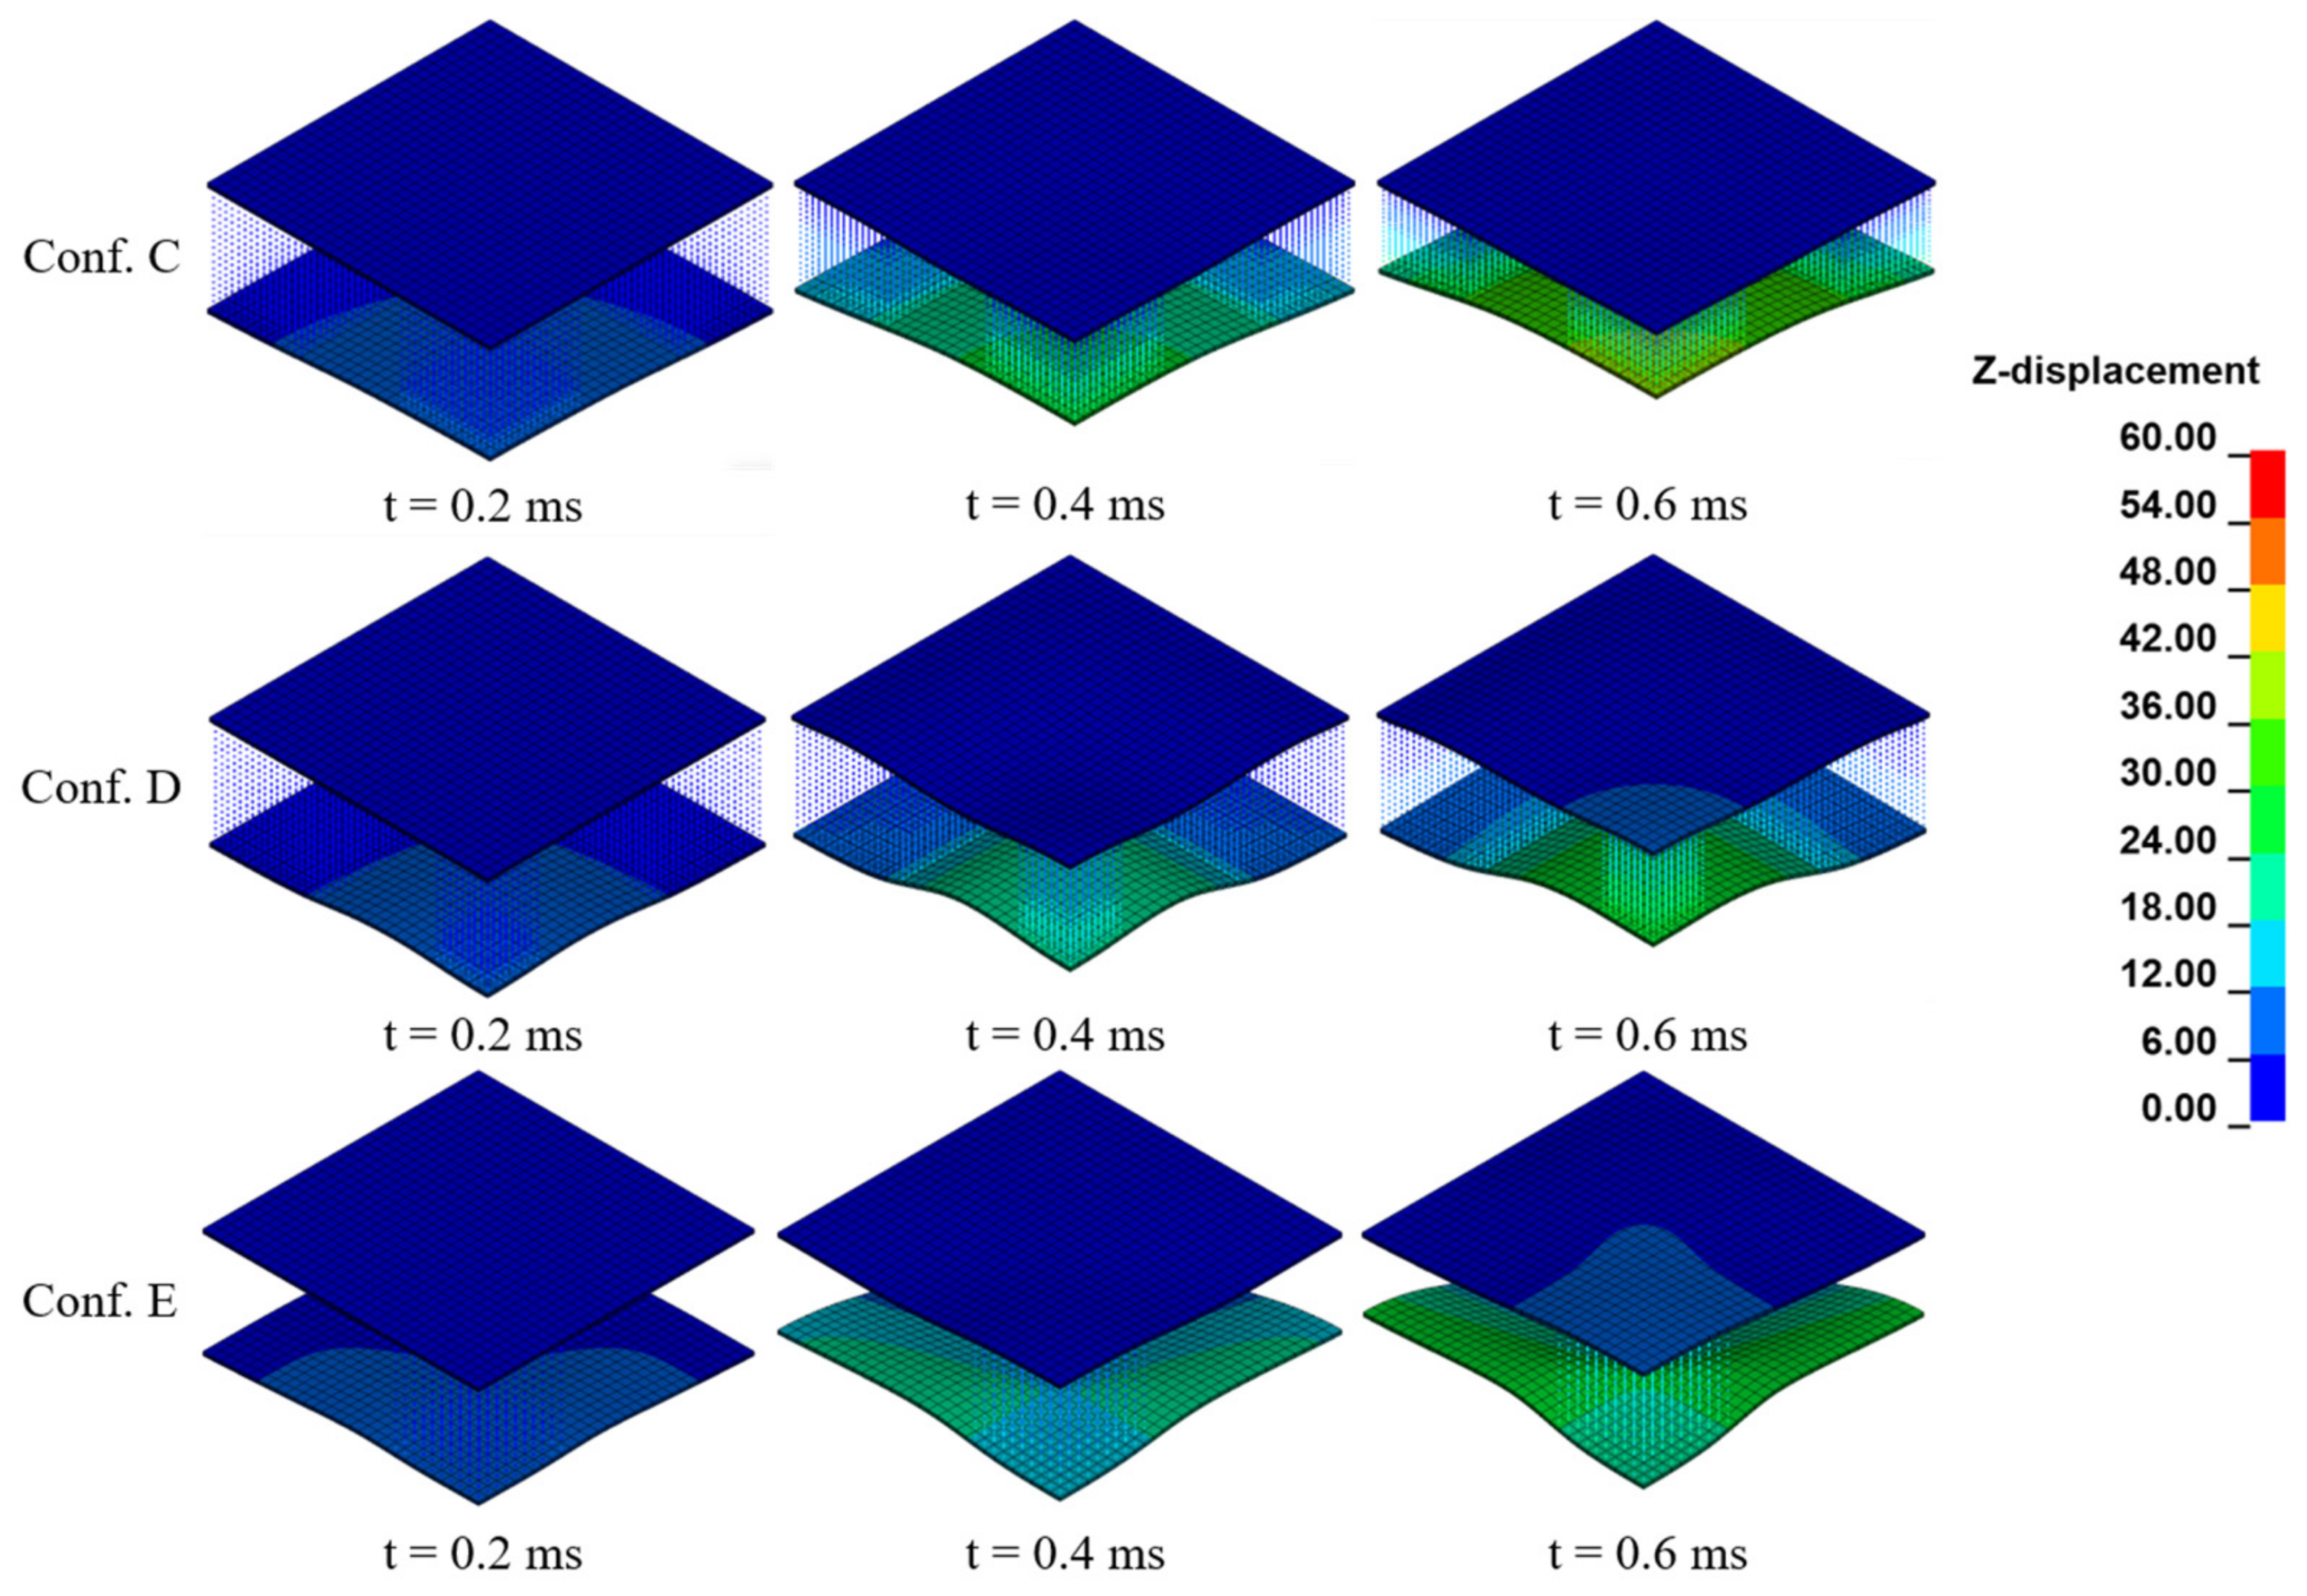
Evolution up to 0.6 ms in an isometric view of the out-of-plane displacements (in mm) of the backplate (top plate), foam and front skin of the different configurations for configurations C, D, and E.
Figure 24 provides an isometric view of the OPD of the backplate (top plate), foam and front skin for the considered configurations at the maximum values. Configuration C demonstrates less than 2% of the area with displacement values exceeding 12 mm and 65% of the area below 6 mm. Furthermore, the entire front skin has moved more than 54 mm. This means the foam has nearly reached full densification, as shown in Figure 26. It must be highlighted that foam crushing is relatively uniform from configuration A to C.
Figure 27 illustrates the out-of-plane displacement evolution up to 0.6 ms of the backplate, foam and front skin for configurations C, D, and E. Configurations C and D exhibit a similar architectural layout, differing primarily in the size of the foam core, which is smaller in configuration D compared to configuration C. Research by Xia et al. [33] demonstrates that the size of the foam sample influences its plateau stress. The lower plateau stress for the foam core in configuration D (cross-section of ) compared to configuration C (cross-section of ) explains the premature crushing observed in configuration D. The combination of this premature crushing with excessive front skin deformation leads to non-uniform foam crushing. Although configurations C and E have identical foam core sizes, architectural layout differences result in excessive front skin deformation, leading to suboptimal foam crushing. Notably, configuration F reinforces this excessive front skin deformation.
According to Ma et al. [9,11] and Zhou et al. [42], the deformability of the front skin influences the stress distribution within the crushable core, thereby influencing the energy absorption of the SC. The previous results align with the findings of Zhou et al. [42]. To further investigate the influence of the deformability on the considered SC configurations, a comparative analysis is conducted for all configurations where the front skin is numerically modeled as non-deformable while maintaining the same front skin mass.
4.3.2. Influence of the Deformability of the Front Skin
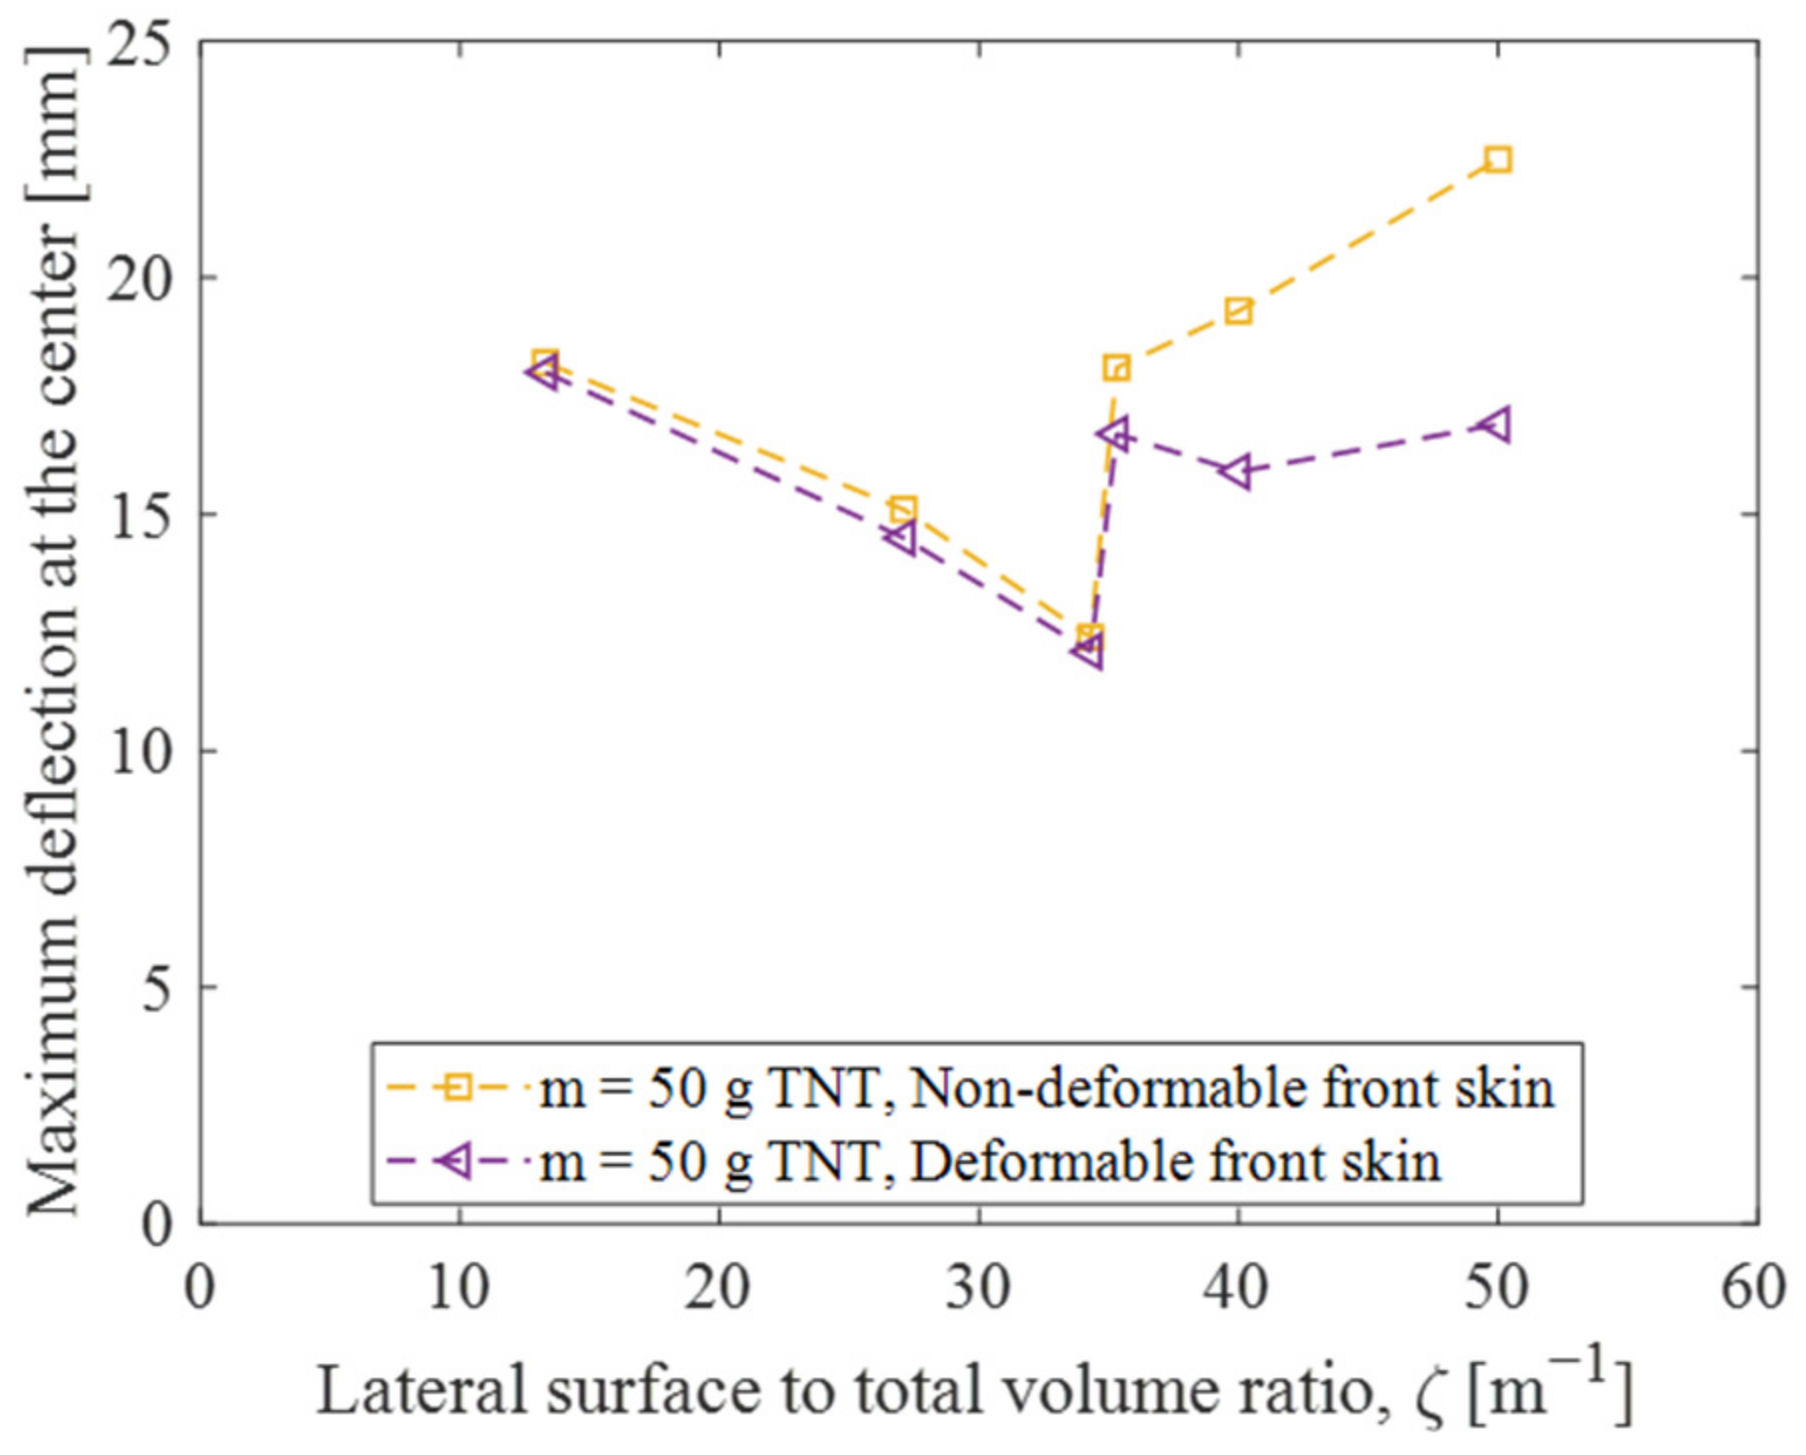
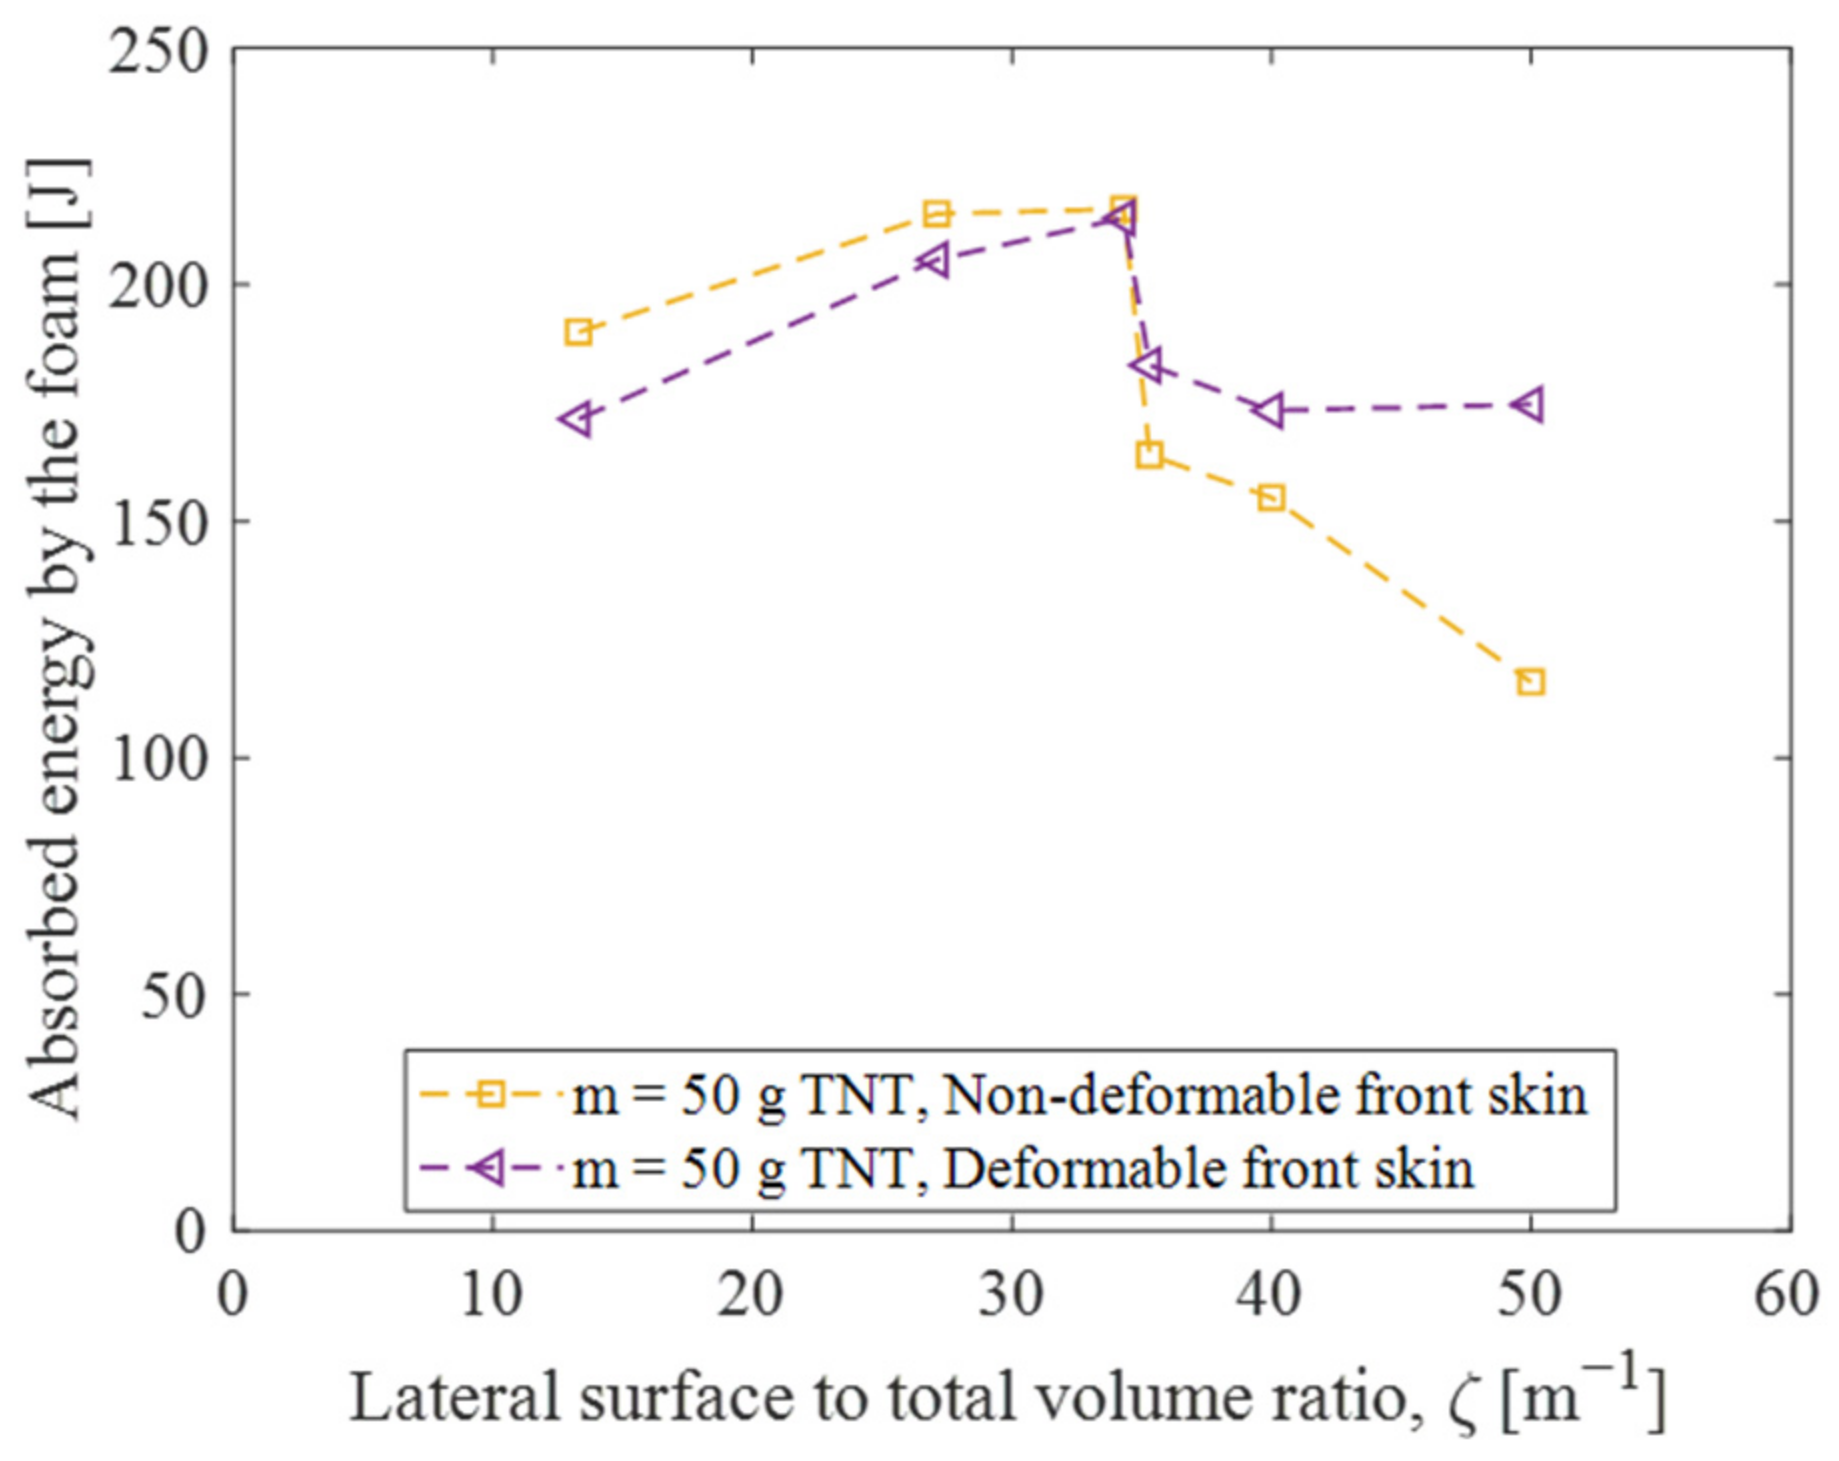
Figure 28 and Figure 29 present the maximum deflection at the backplate’s center and the absorbed energy by the foam when using a non-deformable front skin. Notably, the results reveal that providing free space for foam expansion outperforms a single foam volume when using a non-deformable front skin. In the previous section, the optimal ζ value that minimizes maximum deflection and maximizes foam energy absorption corresponds to ζ = 34.3 m−1 for configuration C. Similar observations are made with a non-deformable front skin. For ζ values ≤ 34.3 m−1, the SC shows comparable effectiveness in terms of reducing maximum deflection regardless of the front skin deformability. However, as ζ exceeds 34.3 m−1, using a non-deformable front skin increases the performance of the SC by 14, 29, and 33% for configurations D, E, and F, respectively. Similarly, the absorbed energy by the foam is increased by less than 10% for ζ ≤ 34.3 m−1 but rises notably by 22, 24, and 34% for configurations D, E ,and F, respectively, when using a non-deformable front skin. Furthermore, configuration E demonstrates superior performance over configuration D when using a non-deformable front skin, contrasting with results observed under the same conditions with a deformable front skin. This disparity can be attributed to the enhanced strength of the foam core in configuration E.
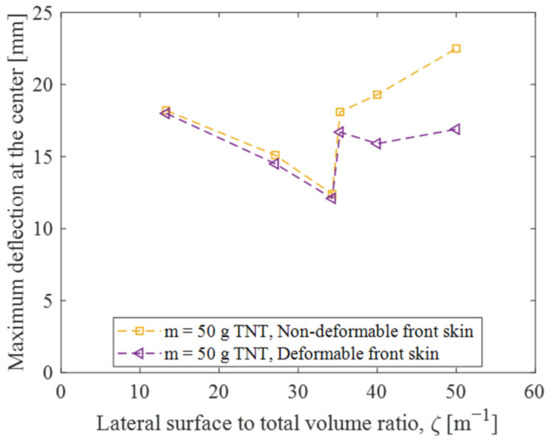
Figure 28.
Influence of front skin deformability on the maximum deflection at the backplate’s center across various foam configurations.
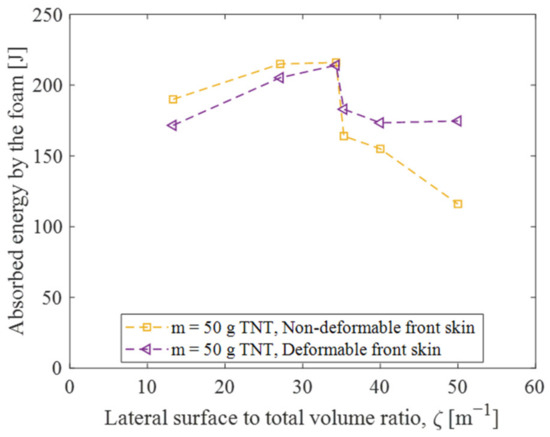
Figure 29.
Influence of front skin deformability on the absorbed energy by the foam for different foam configurations.
5. Conclusions
This study presents an experimental and numerical investigation of the near-field blast protection of aluminum plates by using AAC-based mineral foam as a crushable core in sacrificial cladding. Blast tests are conducted using 20 g of C4 (25 g TNT equivalent) explosive, both with and without the sacrificial cladding, positioned 250 mm from the backplate’s center. Maintaining a constant distance between the explosive and the structure increases the blast load applied to the front skin. Six configurations of 60 mm thick foam are considered. Moreover, the influence of the foam configurations and the charge mass on the effectiveness of the sacrificial cladding is explored by performing numerical simulations.
The findings reveal the following:
- (1)
- The numerical model accurately reproduces the deflection profile at mid-span with a relative error of about 5%. Notably, the SPH approach proves to be robust in predicting the experimental results.
- (2)
- The sacrificial cladding exhibits a favorable protective effect on the aluminum plate, reducing the maximum deflection and mean permanent deformation at the center of the plate by at least 30% in configuration F and up to 70% in configuration C.
- (3)
- The foam configuration significantly influences the energy dissipation of the sacrificial cladding. Specifically, increasing the ζ value, denoting the ratio of the foam’s lateral surface to its total volume, results in an enhanced protective effect of the cladding. However, when ζ exceeds an optimal value, the performance of the SC is decreased. This optimal ζ value minimizes the maximum deflection and permanent deformation while maximizing the absorbed energy by the foam. The SC’s decrease in effectiveness is primarily due to excessive front skin deformation leading to non-uniform foam crushing.
- (4)
- Non-deformable front skin has been adopted to address the influence of front skin deformability. This latter demonstrates an increased effectiveness of the SC, particularly for ζ values above the optimal value obtained when using a deformable front skin. Notably, non-deformable front skin increases maximum deflection reduction and foam energy absorption by up to approximately 30%.
- (5)
- Positive protection effects are observed for all loading conditions examined.
In summary, this study demonstrates the effectiveness of using calcium-silicate mineral foam-based sacrificial cladding for near-field blast protection of aluminum plates. The experimental and numerical findings shed light on the influence of foam configuration and charge mass on the protective performance of the sacrificial cladding. These insights contribute to advancing the understanding of blast mitigation techniques and have practical implications for designing and implementing protective measures in relevant applications. Specifically, this solution is expected to be a cost-effective and lightweight protection concept for standard ISO container shelters in international operations.
Author Contributions
Conceptualization, D.L.; methodology, A.A., M.B.R., B.B. and H.O.; software, A.A. and B.B.; validation, A.A. and H.O.; investigation, A.A., M.B.R. and B.B.; resources, D.L.; data curation, A.A., M.B.R. and B.B.; writing—original draft preparation, A.A.; writing—review and editing, A.A., D.L. and L.P.; visualization, A.A.; supervision, D.L. and L.P.; project administration, D.L. and L.P.; funding acquisition, D.L. All authors have read and agreed to the published version of the manuscript.
Funding
This research received no external funding.
Institutional Review Board Statement
Not applicable.
Informed Consent Statement
Not applicable.
Data Availability Statement
The original contributions presented in the study are included in the article, further inquiries can be directed to the corresponding author.
Acknowledgments
The authors are grateful to the staff of the Laboratory of Structures and Effects of Explosion Department of the Royal Military Academy in Brussels for their support and assistance in performing the different steps of the experimental work.
Conflicts of Interest
The authors declare no conflicts of interest.
References
- Schunck, T.; Eckenfels, D.; Sinniger, L. Blast disruption using 3D grids/perforated plates for vehicle protection. Def. Technol. 2023, 25, 60–68. [Google Scholar] [CrossRef]
- Xu, H.B.; Chen, L.K. Mitigation effects on the reflected overpressure of blast shock with water surrounding an explosive in a confined space. Def. Technol. 2021, 17, 1071–1080. [Google Scholar] [CrossRef]
- Schunck, T.; Bastide, M.; Eckenfels, D.; Legendre, J.F. Blast mitigation by water mist: The effect of the detonation configuration. Shock Waves 2020, 30, 629–644. [Google Scholar] [CrossRef]
- Breda, C.; Kerampran, S.; Sturtzer, M.O.; Arrigoni, M.; Legendre, J.F. Analysis of planar and spherical shock-wave mitigation by wet aqueous foams. In Shock Wave Interactions; RaiNew 2017; Kontis, K., Ed.; Springer: Cham, Switzerland, 2018. [Google Scholar] [CrossRef]
- Luo, X.; Aref, A.J.; Dargush, G.F. Optimal Design of Bundled Layered Elastic Stress Wave Attenuators. J. Comput. Civ. Eng. 2012, 26, 387–395. [Google Scholar] [CrossRef]
- Li, Y.; Lv, Z.; Wang, Y. Blast response of aluminum foam sandwich panel with double V-shaped face plate. Int. J. Impact Eng. 2020, 144, 103666. [Google Scholar] [CrossRef]
- Berger, S.; Sadot, O.; Ben-Dor, G. Experimental investigation on the shock-wave load attenuation by geometrical means. Shock Waves 2010, 20, 29–40. [Google Scholar] [CrossRef]
- Igra, O.; Falcovitz, J.; Houas, L.; Jourdan, G. Review of methods to attenuate shock/blast waves. Prog. Aerosp. Sci. 2012, 58, 1–35. [Google Scholar] [CrossRef]
- Ye, Z.Q.; Ma, G.W. Effects of Foam Claddings for Structure Protection against Blast Loads. J. Eng. Mech. 2007, 133, 41–47. [Google Scholar] [CrossRef]
- Aleyaasin, M.; Harrigan, J.J.; Reid, S.R. Air-blast response of cellular material with a face plate: An analytical-numerical approach. Int. J. Mech. Sci. 2015, 91, 64–70. [Google Scholar] [CrossRef]
- Ma, G.W.; Ye, Z.Q. Analysis of foam claddings for blast alleviation. Int. J. Impact Eng. 2007, 34, 60–70. [Google Scholar] [CrossRef]
- Lan, X.K.; Feng, S.S.; Huang, Q.; Zhou, T. Blast response of continuous-density graded cellular material based on the 3D Voronoi model. Def. Technol. 2018, 14, 433–440. [Google Scholar] [CrossRef]
- Ding, Y.; Wang, S.; Zhao, K.; Zheng, Z.; Yang, L.; Yu, J. Blast Alleviation of Cellular Sacrificial Cladding: A Nonlinear Plastic Shock Model. Int. J. Appl. Mech. 2016, 8, 1650057. [Google Scholar] [CrossRef]
- Li, Z.; Chen, W.; Hao, H. Blast mitigation performance of cladding using square dome-shape kirigami folded structure as core. Int. J. Mech. Sci. 2018, 145, 83–95. [Google Scholar] [CrossRef]
- Van Paepegem, W.; Palanivelu, S.; Degrieck, J.; Vantomme, J.; Reymen, B.; Kakogiannis, D.; Van Hemelrijck, D.; Wastiels, J. Blast performance of a sacrificial cladding with composite tubes for protection of civil engineering structures. Compos. B Eng. 2014, 65, 131–146. [Google Scholar] [CrossRef]
- Vavilala, S.; Shirbhate, P.; Mandal, J.; Goel, M.D. Blast mitigation of RC column using polymeric foam. Mater. Today Proc. 2019, 26, 1347–1351. [Google Scholar] [CrossRef]
- Ousji, H.; Belkassem, B.; Louar, M.A.; Reymen, B.; Pyl, L.; Vantomme, J. Experimental Study of the Effectiveness of Sacrificial Cladding Using Polymeric Foams as Crushable Core with a Simply Supported Steel Beam. Adv. Civ. Eng. 2016, 2016, 8301517. [Google Scholar] [CrossRef]
- Langdon, G.S.; Karagiozova, D.; Theobald, M.D.; Nurick, G.N.; Lu, G.; Merrett, R.P. Fracture of aluminium foam core sacrificial cladding subjected to air-blast loading. Int. J. Impact Eng. 2010, 37, 638–651. [Google Scholar] [CrossRef]
- Kostopoulos, V.; Kalimeris, G.D.; Giannaros, E. Blast protection of steel reinforced concrete structures using composite foam-core sacrificial cladding. Compos. Sci. Technol. 2022, 230, 109330. [Google Scholar] [CrossRef]
- Rebelo, H.B.; Lecompte, D.; Cismasiu, C.; Jonet, A.; Belkassem, B.; Maazoun, A. Experimental and numerical investigation on 3D printed PLA sacrificial honeycomb cladding. Int. J. Impact. Eng. 2019, 131, 162–173. [Google Scholar] [CrossRef]
- Abada, M.; Ibrahim, A.; Jung, S.J. Improving Blast Performance of Reinforced Concrete Panels Using Sacrificial Cladding with Hybrid-Multi Cell Tubes. Modelling 2021, 2, 149–165. [Google Scholar] [CrossRef]
- Bonsmann, J.; Fourney, W.L. Mitigation of Accelerations Caused by Blast Loading Utilizing Polymeric-Coated Metallic Thin-Walled Cylinders. J. Dyn. Behav. Mater. 2015, 1, 259–274. [Google Scholar] [CrossRef]
- Palanivelu, S.; Van Paepegem, W.; Degrieck, J.; Reymen, B.; Ndambi, J.-M.; Vantomme, J.; Kakogiannis, D.; Wastiels, J.; Van Hemelrijck, D. Close-range blast loading on empty recyclable metal beverage cans for use in sacrificial cladding structure. Eng. Struct. 2011, 33, 1966–1987. [Google Scholar] [CrossRef]
- Imbalzano, G.; Linforth, S.; Ngo, T.D.; Lee, P.V.S.; Tran, P. Blast resistance of auxetic and honeycomb sandwich panels: Comparisons and parametric designs. Compos. Struct. 2018, 183, 242–261. [Google Scholar] [CrossRef]
- Patel, M.; Patel, S.; Ahmad, S. Blast analysis of efficient honeycomb sandwich structures with CFRP/Steel FML skins. Int. J. Impact Eng. 2023, 178, 104609. [Google Scholar] [CrossRef]
- Tiwari, G.; Khaire, N. Ballistic performance and energy dissipation characteristics of cylindrical honeycomb sandwich structure. Int. J. Impact Eng. 2022, 160, 104065. [Google Scholar] [CrossRef]
- Usta, F.; Türkmen, H.S.; Scarpa, F. Low-velocity impact resistance of composite sandwich panels with various types of auxetic and non-auxetic core structures. Thin-Walled Struct. 2021, 163, 107738. [Google Scholar] [CrossRef]
- Bohara, R.P.; Linforth, S.; Nguyen, T.; Ghazlan, A.; Ngo, T. Anti-blast and -impact performances of auxetic structures: A review of structures, materials, methods, and fabrications. Eng. Struct. 2023, 276, 115377. [Google Scholar] [CrossRef]
- Bohara, R.P.; Linforth, S.; Nguyen, T.; Ghazlan, A.; Ngo, T. Dual-mechanism auxetic-core protective sandwich structure under blast loading. Compos. Struct. 2022, 299, 116088. [Google Scholar] [CrossRef]
- Wu, C.; Zhou, Y. Simplified Analysis of Foam Cladding Protected Reinforced Concrete Slabs against Blast Loadings. Int. J. Prot. Struct. 2011, 2, 351–365. [Google Scholar] [CrossRef]
- Sun, G.; Wang, E.; Zhang, J.; Li, S.; Zhang, Y.; Li, Q. Experimental study on the dynamic responses of foam sandwich panels with different facesheets and core gradients subjected to blast impulse. Int. J. Impact Eng. 2020, 135, 103327. [Google Scholar] [CrossRef]
- Shen, J.; Lu, G.; Wang, Z.; Zhao, L. Experiments on curved sandwich panels under blast loading. Int. J. Impact Eng. 2010, 37, 960–970. [Google Scholar] [CrossRef]
- Xia, X.; Zhao, W.; Wei, Z.; Wang, Z. Effects of specimen aspect ratio on the compressive properties of Mg alloy foam. Mater. Des. 2012, 42, 32–36. [Google Scholar] [CrossRef]
- Gabriel, S.; von Klemperer, C.J.; Yuen, S.C.K.; Langdon, G.S. Towards an understanding of the effect of adding a foam core on the blast performance of glass fibre reinforced epoxy laminate panels. Materials 2021, 14, 7118. [Google Scholar] [CrossRef] [PubMed]
- Sandhu, I.S.; Thangadurai, M.; Alegaonkar, P.S.; Saroha, D.R. Mitigation of Blast Induced Acceleration using open cell natural rubber and Synthetic Foam. Def. Sci. J. 2019, 69, 53–57. [Google Scholar] [CrossRef]
- Aminou, A.; Rhouma, M.B.; Belkassem, B.; Ousji, H. Blast Absorption Capacity of Brittle Mineral Foam: An Experimental Evaluation. Hormigón Y Acero Sep. 2023. [Google Scholar] [CrossRef]
- Aminou, A.; Belkassem, B.; Atoui, O.; Pyl, L.; Lecompte, D. Numerical modeling of brittle mineral foam in a sacrificial cladding under blast loading. Mech. Ind. 2023, 24, 27. [Google Scholar] [CrossRef]
- Liu, C.; Hou, J.; Hao, Y.; Hao, H.; Meng, X. Effect of high strain rate and confinement on the compressive properties of autoclaved aerated concrete. Int. J. Impact Eng. 2021, 156, 103943. [Google Scholar] [CrossRef]
- Li, Z.; Chen, W.; Hao, H. Mechanical properties of carbon foams under quasi-static and dynamic loading. Int. J. Mech. Sci. 2019, 161–162, 105039. [Google Scholar] [CrossRef]
- Matsagar, V.A. Comparative performance of composite sandwich panels and non-composite panels under blast loading. Mater. Struct. Mater. Et Constr. 2016, 49, 611–629. [Google Scholar] [CrossRef]
- Brekken, K.A.; Reyes, A.; Børvik, T.; Berstad, T.; Langseth, M. Sandwich panels with polymeric foam cores exposed to blast loading: An experimental and numerical investigation. Appl. Sci. 2020, 10, 9061. [Google Scholar] [CrossRef]
- Zhou, H.; Zhang, X.; Wang, X.; Du, X.; Yu, S.; Wang, Y.; Jiang, J. Protection effectiveness of sacrificial cladding for near-field blast mitigation. Int. J. Impact Eng. 2022, 170, 104361. [Google Scholar] [CrossRef]
- Louar, M.A.; Belkassem, B.; Ousji, H.; Spranghers, K.; Pyl, L.; Vantomme, J. Estimation of the Strain Rate Hardening of Aluminium Using an Inverse Method and Blast Loading. J. Dyn. Behav. Mater. 2017, 3, 347–361. [Google Scholar] [CrossRef]
- Eccles, W. Design Guidelines for Torque Controlled Tightening of Bolted Joints. SAE Int. 1993. [Google Scholar] [CrossRef]
- Aune, V.; Fagerholt, E.; Hauge, K.O.; Langseth, M.; Børvik, T. Experimental study on the response of thin aluminium and steel plates subjected to airblast loading. Int. J. Impact Eng. 2016, 90, 106–121. [Google Scholar] [CrossRef]
- Bojanowski, C. Numerical modeling of large deformations in soil structure interaction problems using FE, EFG, SPH, and MM-ALE formulations. Arch. Appl. Mech. 2014, 84, 743–755. [Google Scholar] [CrossRef]
- LSTC. Ls-Dyna® Keyword User’s Manual Volume I. July 2017. Available online: www.lstc.com (accessed on 24 February 2021).
Disclaimer/Publisher’s Note: The statements, opinions and data contained in all publications are solely those of the individual author(s) and contributor(s) and not of MDPI and/or the editor(s). MDPI and/or the editor(s) disclaim responsibility for any injury to people or property resulting from any ideas, methods, instructions or products referred to in the content. |
© 2024 by the authors. Licensee MDPI, Basel, Switzerland. This article is an open access article distributed under the terms and conditions of the Creative Commons Attribution (CC BY) license (https://creativecommons.org/licenses/by/4.0/).

