
Motor Imagery Classification Improvement of Two-Class Data with Covariance Decentering Eigenface Analysis for Brain–Computer Interface Systems


Abstract
1. Introduction
2. Materials and Methods
3. Results and Discussion
4. Conclusions
Author Contributions
Funding
Institutional Review Board Statement
Informed Consent Statement
Data Availability Statement
Conflicts of Interest
References
- Khademi, S.; Neghabi, M.; Farahi, M.; Shirzadi, M.; Marateb, H.R. A comprehensive review of the movement imaginary brain-computer interface methods: Challenges and future directions. In Artificial Intelligence-Based Brain-Computer Interface, Bajaj, V., Sinha, G.R., Eds.; Academic Press: Cambridge, MA, USA, 2022; pp. 23–74. [Google Scholar]
- Boutros, N.N. Standard EEG: A Research Roadmap for Neuropsychiatry; Springer: Berlin/Heidelberg, Germany, 2013. [Google Scholar]
- Schalk, G.; McFarland, D.J.; Hinterberger, T.; Birbaumer, N.; Wolpaw, J.R. BCI2000: A general-purpose brain-computer interface (BCI) system. IEEE Trans. Biomed. Eng. 2004, 51, 1034–1043. [Google Scholar] [CrossRef] [PubMed]
- Suetens, P. Fundamentals of Medical Imaging; Cambridge University Press: Cambridge, UK, 2017. [Google Scholar]
- Jung, U.; Ryu, J.; Choi, H. Optical Light Sources and Wavelengths within the Visible and Near-Infrared Range Using Photoacoustic Effects for Biomedical Applications. Biosensors 2022, 12, 1154. [Google Scholar] [CrossRef] [PubMed]
- Hendee, W.R.; Ritenour, E.R. Medical Imaging Physics; John Wiley & Sons: Hoboken, NJ, USA, 2003. [Google Scholar]
- Ullah, M.; Pratiwi, E.; Park, J.; Lee, K.; Choi, H.; Yeom, J. Wavelength discrimination (WLD) TOF-PET detector with DOI information. Phys. Med. Biol. 2019, 65, 055003. [Google Scholar] [CrossRef] [PubMed]
- Choi, H.; Shin, S.-H. Mathematical algorithm for magnetic resonance imaging. J. Nonlinear Convex Anal. 2024, 25, 1511–1518. [Google Scholar]
- Choi, H.; Shin, S.-H. Secured computed tomography scanner using a random bit. Technol. Health Care 2023, 31, 55–59. [Google Scholar] [CrossRef]
- Jinyi, L.; Yuanqing, L.; Hongtao, W.; Tianyou, Y.; Jiahui, P.; Feng, L. A Hybrid Brain Computer Interface to Control the Direction and Speed of a Simulated or Real Wheelchair. IEEE Trans. Neural Syst. Rehabil. Eng. 2012, 20, 720–729. [Google Scholar]
- Lemm, S.; Blankertz, B.; Curio, G.; Muller, K. Spatio-spectral filters for improving the classification of single trial EEG. IEEE Trans. Biomed. Eng. 2005, 52, 1541–1548. [Google Scholar] [CrossRef]
- Schalk, G.; Mellinger, J. A Practical Guide to Brain–Computer Interfacing with BCI2000: General-Purpose Software for Brain-Computer Interface Research, Data Acquisition, Stimulus Presentation, and Brain Monitoring; Springer Science & Business Media: Berlin/Heidelberg, Germany, 2010. [Google Scholar]
- Nam, C.S.; Nijholt, A.; Lotte, F. Brain–Computer Interfaces Handbook: Technological and Theoretical Advances; CRC Press: Boca Raton, FL, USA, 2018. [Google Scholar]
- Han, Y.; Bin, H. Brain-Computer Interfaces Using Sensorimotor Rhythms: Current State and Future Perspectives. IEEE Trans. Biomed. Eng. 2014, 61, 1425–1435. [Google Scholar] [CrossRef]
- Choi, H.; Park, J.; Lim, W.; Yang, Y.-M. Active-beacon-based driver sound separation system for autonomous vehicle applications. Appl. Acoust. 2021, 171, 107549. [Google Scholar] [CrossRef]
- Dressler, O.; Schneider, G.; Stockmanns, G.; Kochs, E.F. Awareness and the EEG power spectrum: Analysis of frequencies. Br. J. Anaesth. 2004, 93, 806–809. [Google Scholar] [CrossRef]
- Blankertz, B.; Muller, K.; Curio, G.; Vaughan, T.M.; Schalk, G.; Wolpaw, J.R.; Schlogl, A.; Neuper, C.; Pfurtscheller, G.; Hinterberger, T.; et al. The BCI competition 2003: Progress and perspectives in detection and discrimination of EEG single trials. IEEE Trans. Biomed. Eng. 2004, 51, 1044–1051. [Google Scholar] [CrossRef] [PubMed]
- Hellström-Westas, L.; De Vries, L.S.; Rosén, I. Atlas of Amplitude-Integrated EEGs in the Newborn; CRC Press: Boca Raton, FL, USA, 2008. [Google Scholar]
- Subasi, A.; Ismail Gursoy, M. EEG signal classification using PCA, ICA, LDA and support vector machines. Expert Syst. Appl. 2010, 37, 8659–8666. [Google Scholar] [CrossRef]
- Tan, D.; Nijholt, A. Brain-Computer Interfaces and Human-Computer Interaction; Springer: New York, NJ, USA, 2010. [Google Scholar]
- Lotte, F.; Congedo, M.; Lécuyer, A.; Lamarche, F.; Arnaldi, B. A review of classification algorithms for EEG-based brain–computer interfaces. J. Neural Eng. 2007, 4, R1. [Google Scholar] [CrossRef] [PubMed]
- Vidaurre, C.; Krämer, N.; Blankertz, B.; Schlögl, A. Time Domain Parameters as a feature for EEG-based Brain–Computer Interfaces. Neural Netw. 2009, 22, 1313–1319. [Google Scholar] [CrossRef] [PubMed]
- Kundu, S.; Ari, S. P300 detection with brain–computer interface application using PCA and ensemble of weighted SVMs. IETE J. Res. 2018, 64, 406–414. [Google Scholar] [CrossRef]
- Yang, Y.-M.; Lim, W.; Kim, B. Eigenface analysis for brain signal classification: A novel algorithm. Int. J. Telemed. Clin. Pract. 2017, 2, 148–153. [Google Scholar] [CrossRef]
- Kato, K.; Takahashi, K.; Mizuguchi, N.; Ushiba, J. Online detection of amplitude modulation of motor-related EEG desynchronization using a lock-in amplifier: Comparison with a fast Fourier transform, a continuous wavelet transform, and an autoregressive algorithm. J. Neurosci. Methods 2018, 293, 289–298. [Google Scholar] [CrossRef]
- Bostanov, V. BCI competition 2003-datasets Ib and IIb: Feature extraction from event-related brain potentials with the continuous wavelet transform and the t-value scalogram. IEEE Trans. Biomed. Eng. 2004, 51, 1057–1061. [Google Scholar] [CrossRef]
- Huang, N.E. Hilbert-Huang Transform and Its Applications; World Scientific: London, UK, 2014. [Google Scholar]
- Saha, S.; Mamun, K.A.; Ahmed, K.; Mostafa, R.; Naik, G.R.; Darvishi, S.; Khandoker, A.H.; Baumert, M. Progress in Brain Computer Interface: Challenges and Opportunities. Front. Syst. Neurosci. 2021, 15, 578875. [Google Scholar] [CrossRef]
- Lu, H.; Eng, H.-L.; Guan, C.; Plataniotis, K.N.; Venetsanopoulos, A.N. Regularized common spatial pattern with aggregation for EEG classification in small-sample setting. IEEE Trans. Biomed. Eng. 2010, 57, 2936–2946. [Google Scholar]
- Kachenoura, A.; Albera, L.; Senhadji, L.; Comon, P. ICA: A potential tool for BCI systems. IEEE Signal Process Mag. 2007, 25, 57–68. [Google Scholar] [CrossRef]
- Choi, H.; Park, J.; Yang, Y.-M. Whitening Technique Based on Gram-Schmidt Orthogonalization for Motor Imagery Classification of Brain-Computer Interface Applications. Sensors 2022, 22, 6042. [Google Scholar] [CrossRef] [PubMed]
- Kevric, J.; Subasi, A. Comparison of signal decomposition methods in classification of EEG signals for motor-imagery BCI system. Biomed. Signal Process. 2017, 31, 398–406. [Google Scholar] [CrossRef]
- Husain, A.M.; Sinha, S.R. Continuous EEG Monitoring: Principles and Practice; Springer: Berlin/Heidelberg, Germany, 2017. [Google Scholar]
- Kumar, Y.; Kumar, J.; Sheoran, P. Integration of cloud computing in BCI: A review. Biomed. Signal Process. Control 2024, 87, 105548. [Google Scholar] [CrossRef]
- Blankertz, B.; Muller, K.-R.; Krusienski, D.J.; Schalk, G.; Wolpaw, J.R.; Schlogl, A.; Pfurtscheller, G.; Millan, J.R.; Schroder, M.; Birbaumer, N. The BCI competition III: Validating alternative approaches to actual BCI problems. IEEE Trans. Neural Syst. Rehabil. Eng. 2006, 14, 153–159. [Google Scholar] [CrossRef]
- Lotte, F.; Cuntai, G. Regularizing Common Spatial Patterns to Improve BCI Designs: Unified Theory and New Algorithms. IEEE Trans. Biomed. Eng. 2011, 58, 355–362. [Google Scholar] [CrossRef]
- BCI Competition II Dataset. Available online: https://www.bbci.de/competition/ii/ (accessed on 28 October 2024).
- BCI Competition III Dataset. Available online: https://www.bbci.de/competition/iii/ (accessed on 28 October 2024).
- BCI Competition IV Dataset. Available online: https://www.bbci.de/competition/iv/ (accessed on 28 October 2024).
- Brunner, C.; Leeb, R.; Müller-Putz, G.; Schlögl, A.; Pfurtscheller, G. BCI Competition 2008—Graz Data Set A; Institute for Knowledge Discovery (Laboratory of Brain-Computer Interfaces), Graz University of Technology: Styria, Austria, 2008; Volume 16, pp. 1–6. [Google Scholar]
- Choi, H.; Park, J.; Yang, Y.-M. A Novel Quick-Response Eigenface Analysis Scheme for Brain-Computer Interfaces. Sensors 2022, 22, 5860. [Google Scholar] [CrossRef]


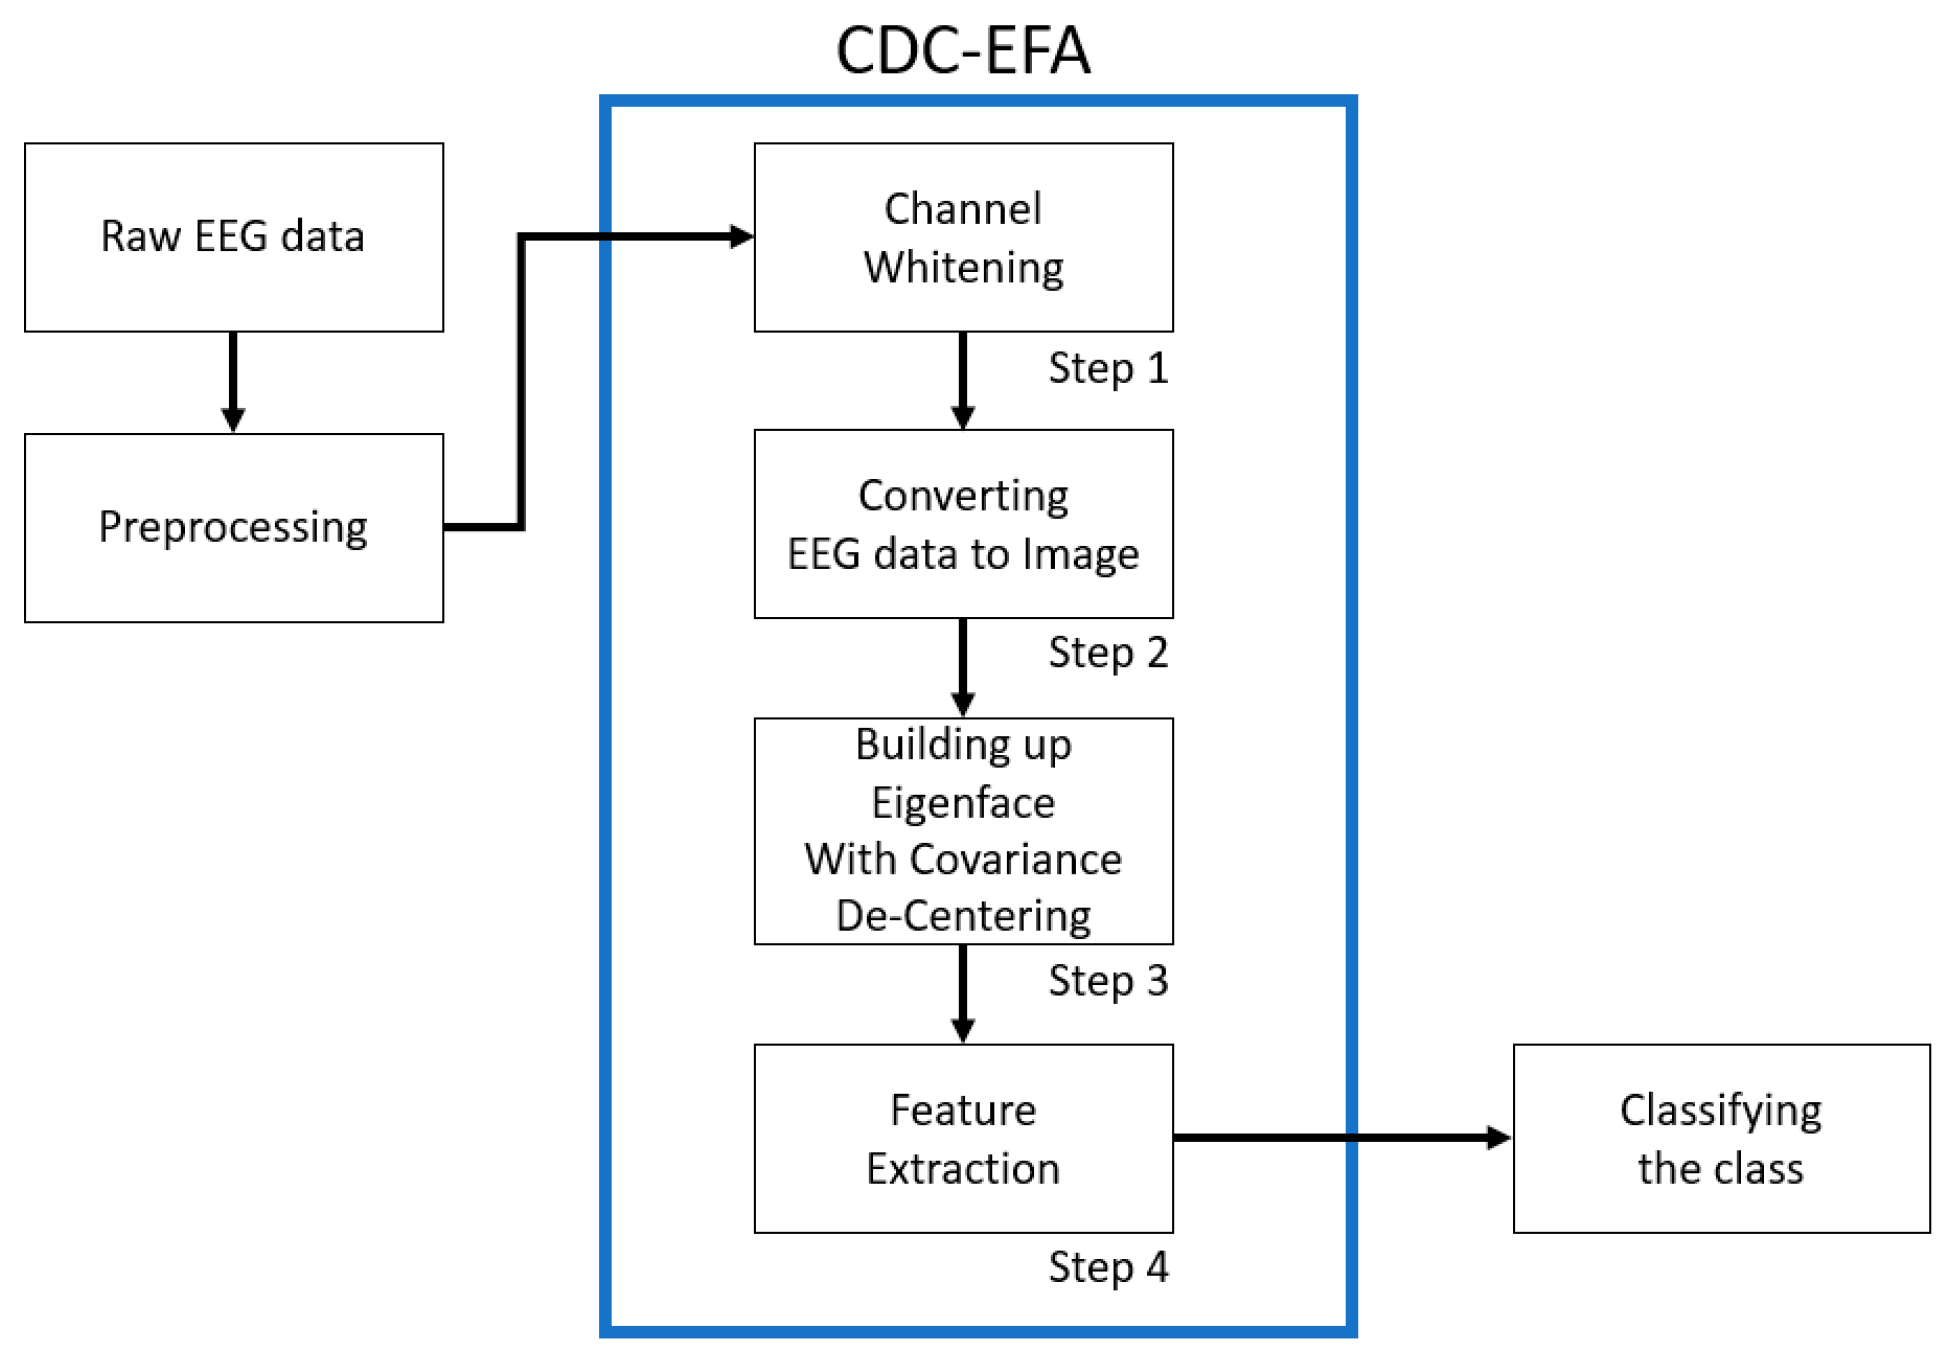
| Whitening | Eigenface After Decentering | |
|---|---|---|
| EFA | X | X |
| Ver. 1 | X | O |
| Ver. 2 | ICA | X |
| Ver. 3 | O | X |
| Ver. 4 | ICA | O |
| Ver. 5 | O | O |
| Label | ||
|---|---|---|
| Class 1, Left Hand | Class 2, Right Hand | |
| Class 1, Left Hand | A, True | B, False |
| Class 2, Right Hand | C, False | D, True |
| Subjects | |||||
|---|---|---|---|---|---|
| A1 | A2 | A3 | Average | ||
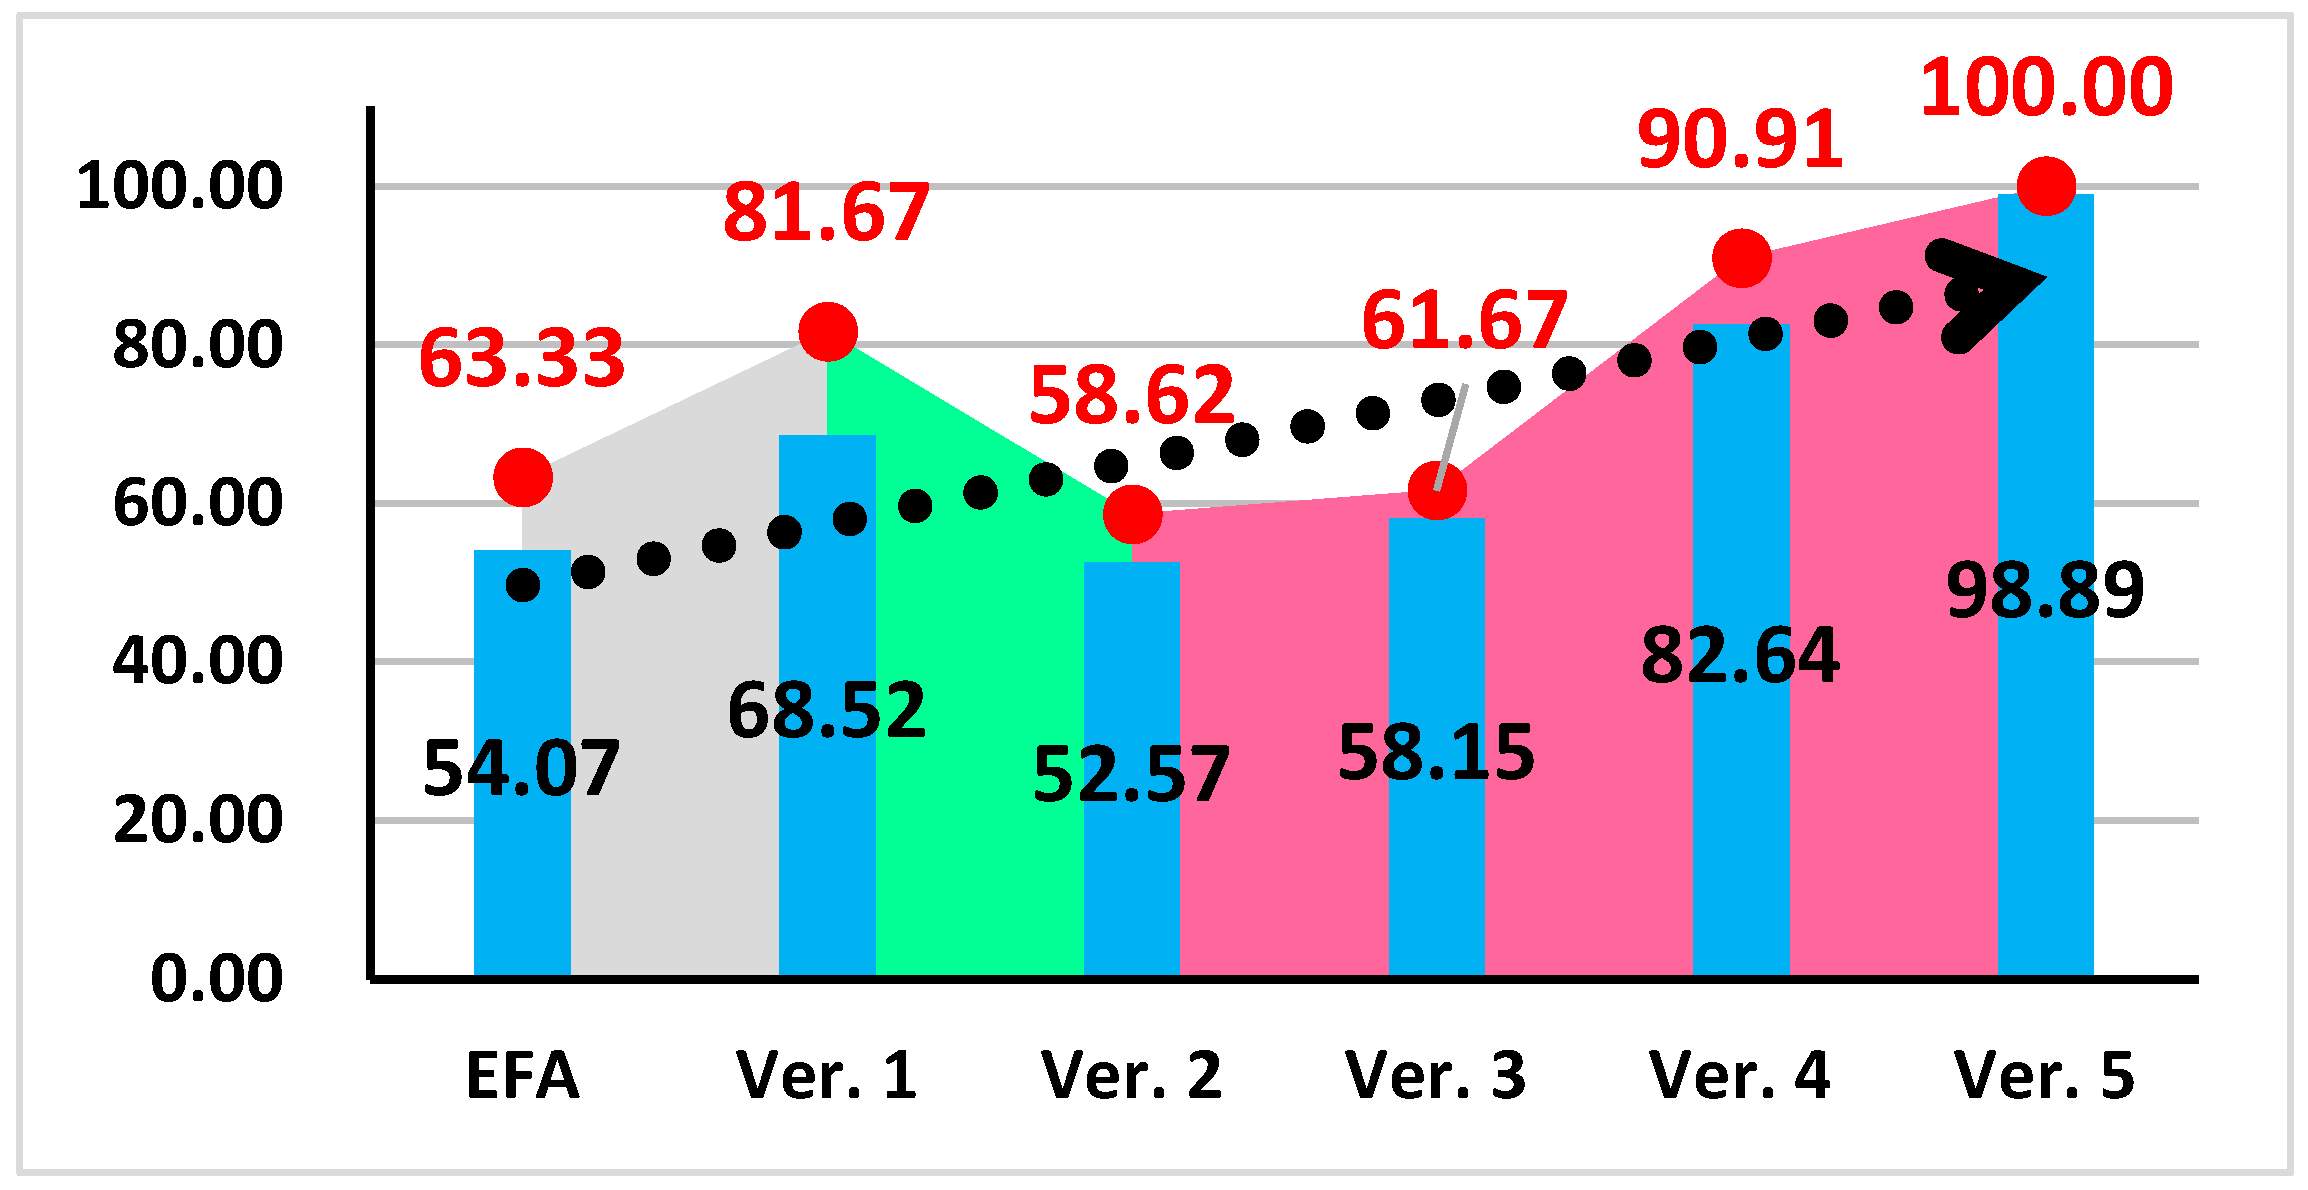
| Accuracy (%) | EFA | 52.22 | 46.67 | 63.33 | 54.07 |
| Ver. 1 | 55.56 | 81.67 | 68.33 | 68.52 | |
| Ver. 2 | 58.62 | 49.10 | 50.00 | 52.57 | |
| Ver. 3 | 57.78 | 55.00 | 61.67 | 58.15 | |
| Ver. 4 | 87.36 | 90.91 | 69.64 | 82.64 | |
| Ver. 5 | 100 | 98.33 | 98.33 | 98.89 | |
| BCI Competition III | |||||||||
| Dataset IIIa | Dataset IVa | ||||||||
| Sub | A1 | A2 | A3 | B1 | B2 | B3 | B4 | B5 | |
| CSP | 95.56 | 61.67 | 93.33 | 66.07 | 96.43 | 47.45 | 71.88 | 49.6 | |
| EFA | 53.33 | 48.33 | 63.33 | 98.21 | 78.57 | 86.94 | 62.5 | 75 | |
| CDC-EFA | 100 | 98.33 | 98.33 | 90.18 | 96.43 | 94.05 | 92.86 | 100 | |
| BCI Competition IV | |||||||||
| Dataset IIa | |||||||||
| Sub | C1 | C2 | C3 | C4 | C5 | C6 | C7 | C8 | C9 |
| CSP | 88.89 | 51.39 | 96.53 | 70.14 | 54.86 | 71.53 | 81.25 | 93.75 | 93.75 |
| EFA | 52.78 | 52.78 | 54.56 | 60.42 | 57.64 | 50.69 | 54.17 | 56.94 | 53.47 |
| CDC-EFA | 100 | 100 | 98.61 | 99.31 | 99.31 | 97.22 | 49.31 | 97.92 | 94.44 |
| Overall | |||
|---|---|---|---|
| Mean | Median | Standard Deviation | |
| CSP | 75.53 | 71.88 | 18.17 |
| EFA | 62.33 | 56.94 | 14.08 |
| CDC-EFA | 94.49 | 98.33 | 11.99 |
| Accuracy | ||
|---|---|---|
| Subjects | EFA | CDC-EFA |
| 1 | 48.61 | 100 |
| 2 | 54.86 | 100 |
| 3 | 57.64 | 100 |
| 4 | 60.42 | 100 |
| 5 | 55.56 | 100 |
| 6 | 56.25 | 100 |
| 7 | 57.64 | 45.14 |
| 8 | 57.64 | 100 |
| 9 | 54.17 | 100 |
Disclaimer/Publisher’s Note: The statements, opinions and data contained in all publications are solely those of the individual author(s) and contributor(s) and not of MDPI and/or the editor(s). MDPI and/or the editor(s) disclaim responsibility for any injury to people or property resulting from any ideas, methods, instructions or products referred to in the content. |
© 2024 by the authors. Licensee MDPI, Basel, Switzerland. This article is an open access article distributed under the terms and conditions of the Creative Commons Attribution (CC BY) license (https://creativecommons.org/licenses/by/4.0/).
Share and Cite
Choi, H.; Park, J.; Yang, Y.-M. Motor Imagery Classification Improvement of Two-Class Data with Covariance Decentering Eigenface Analysis for Brain–Computer Interface Systems. Appl. Sci. 2024, 14, 10062. https://doi.org/10.3390/app142110062
Choi H, Park J, Yang Y-M. Motor Imagery Classification Improvement of Two-Class Data with Covariance Decentering Eigenface Analysis for Brain–Computer Interface Systems. Applied Sciences. 2024; 14(21):10062. https://doi.org/10.3390/app142110062
Chicago/Turabian StyleChoi, Hojong, Junghun Park, and Yeon-Mo Yang. 2024. "Motor Imagery Classification Improvement of Two-Class Data with Covariance Decentering Eigenface Analysis for Brain–Computer Interface Systems" Applied Sciences 14, no. 21: 10062. https://doi.org/10.3390/app142110062
APA StyleChoi, H., Park, J., & Yang, Y.-M. (2024). Motor Imagery Classification Improvement of Two-Class Data with Covariance Decentering Eigenface Analysis for Brain–Computer Interface Systems. Applied Sciences, 14(21), 10062. https://doi.org/10.3390/app142110062