
A Survey System for Artificial Intelligence-Based Painting Using Generative Adversarial Network Techniques

Abstract
1. Introduction
- (1)
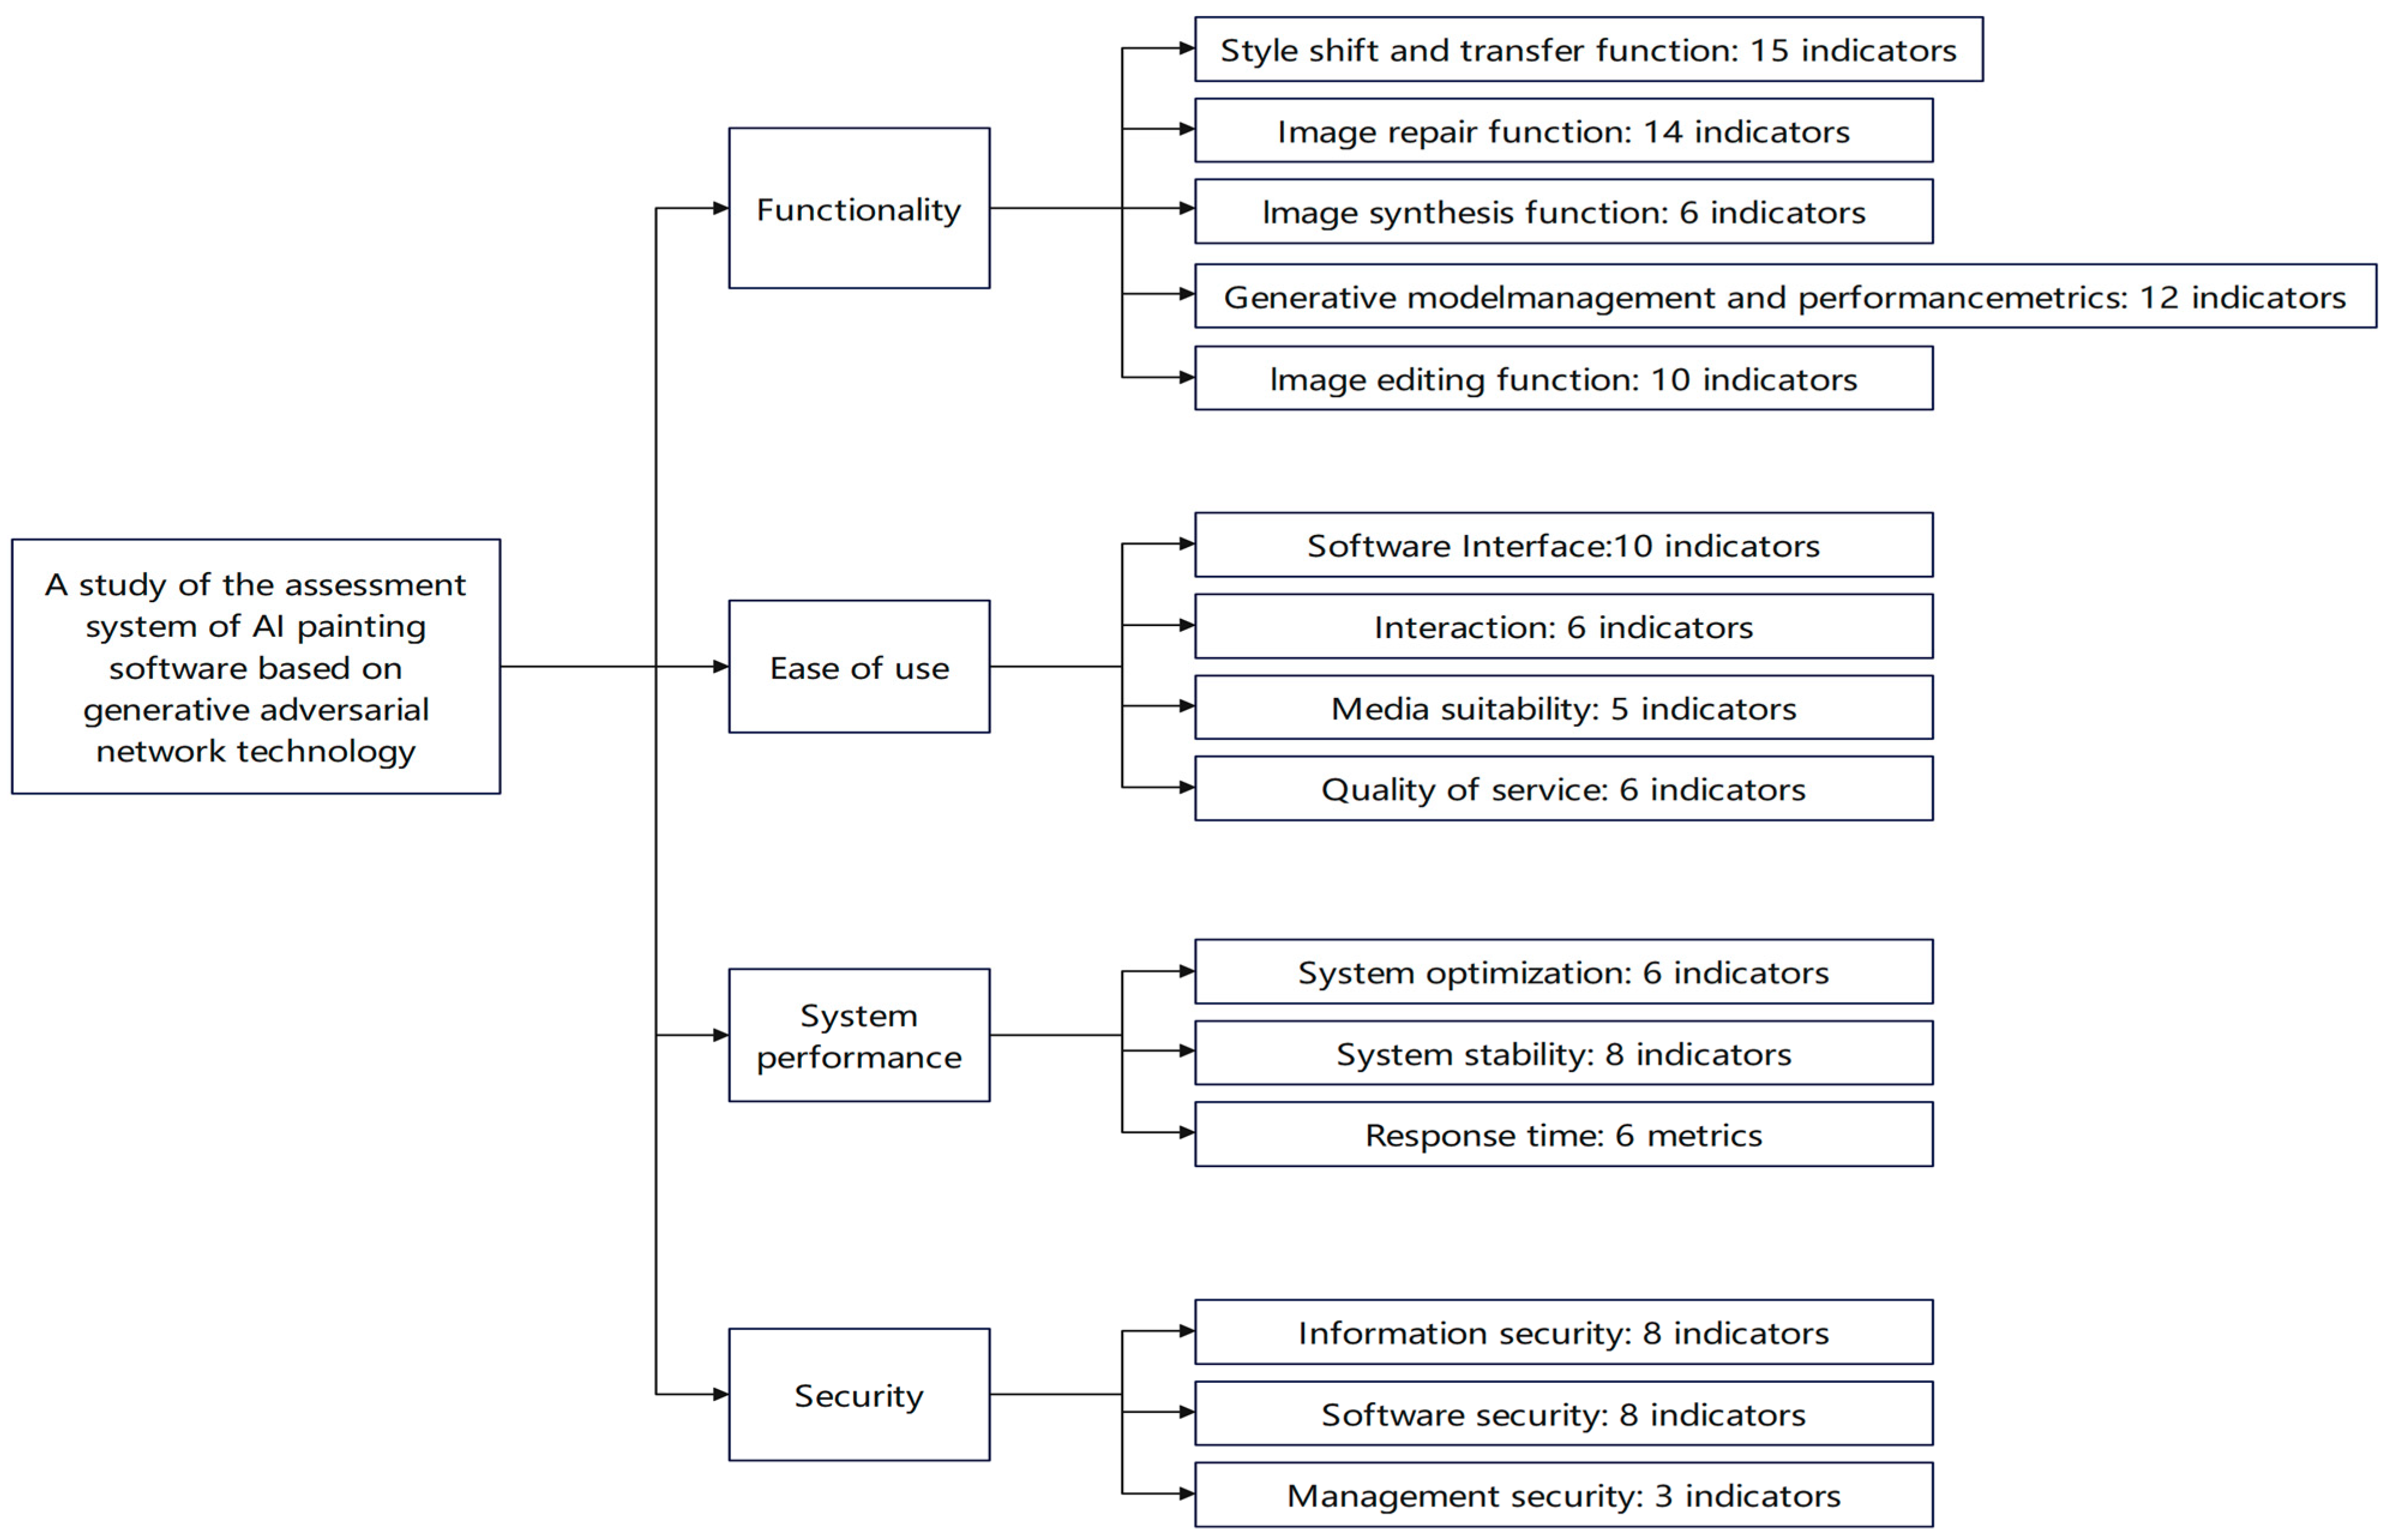
- To optimize AI painting software based on GAN technology in terms of functionality, ease of use, system performance, and security so as to make it more rich in functionality, more convenient in operation, more stable in performance, and more reliable in security.
- (2)
- To establish an evaluation system for AI painting software based on GAN technology to ensure that the software can fully integrate the four requirements of functionality, ease of use, system performance, and security.
- (3)
- To rank the functionality, ease of use, system performance, and security of the software in order of importance through further research, which will help companies to invest more R&D time in the more important aspects.
2. Literature Review
2.1. Early Studies on AI Drawing Software
2.2. Current Status of AI Drawing Software
3. Research Design and Method
3.1. Introduction to the Theory
3.1.1. Generating Adversarial Networks
3.1.2. AI Drawing Software
3.1.3. Evaluation System
3.2. Research Architecture
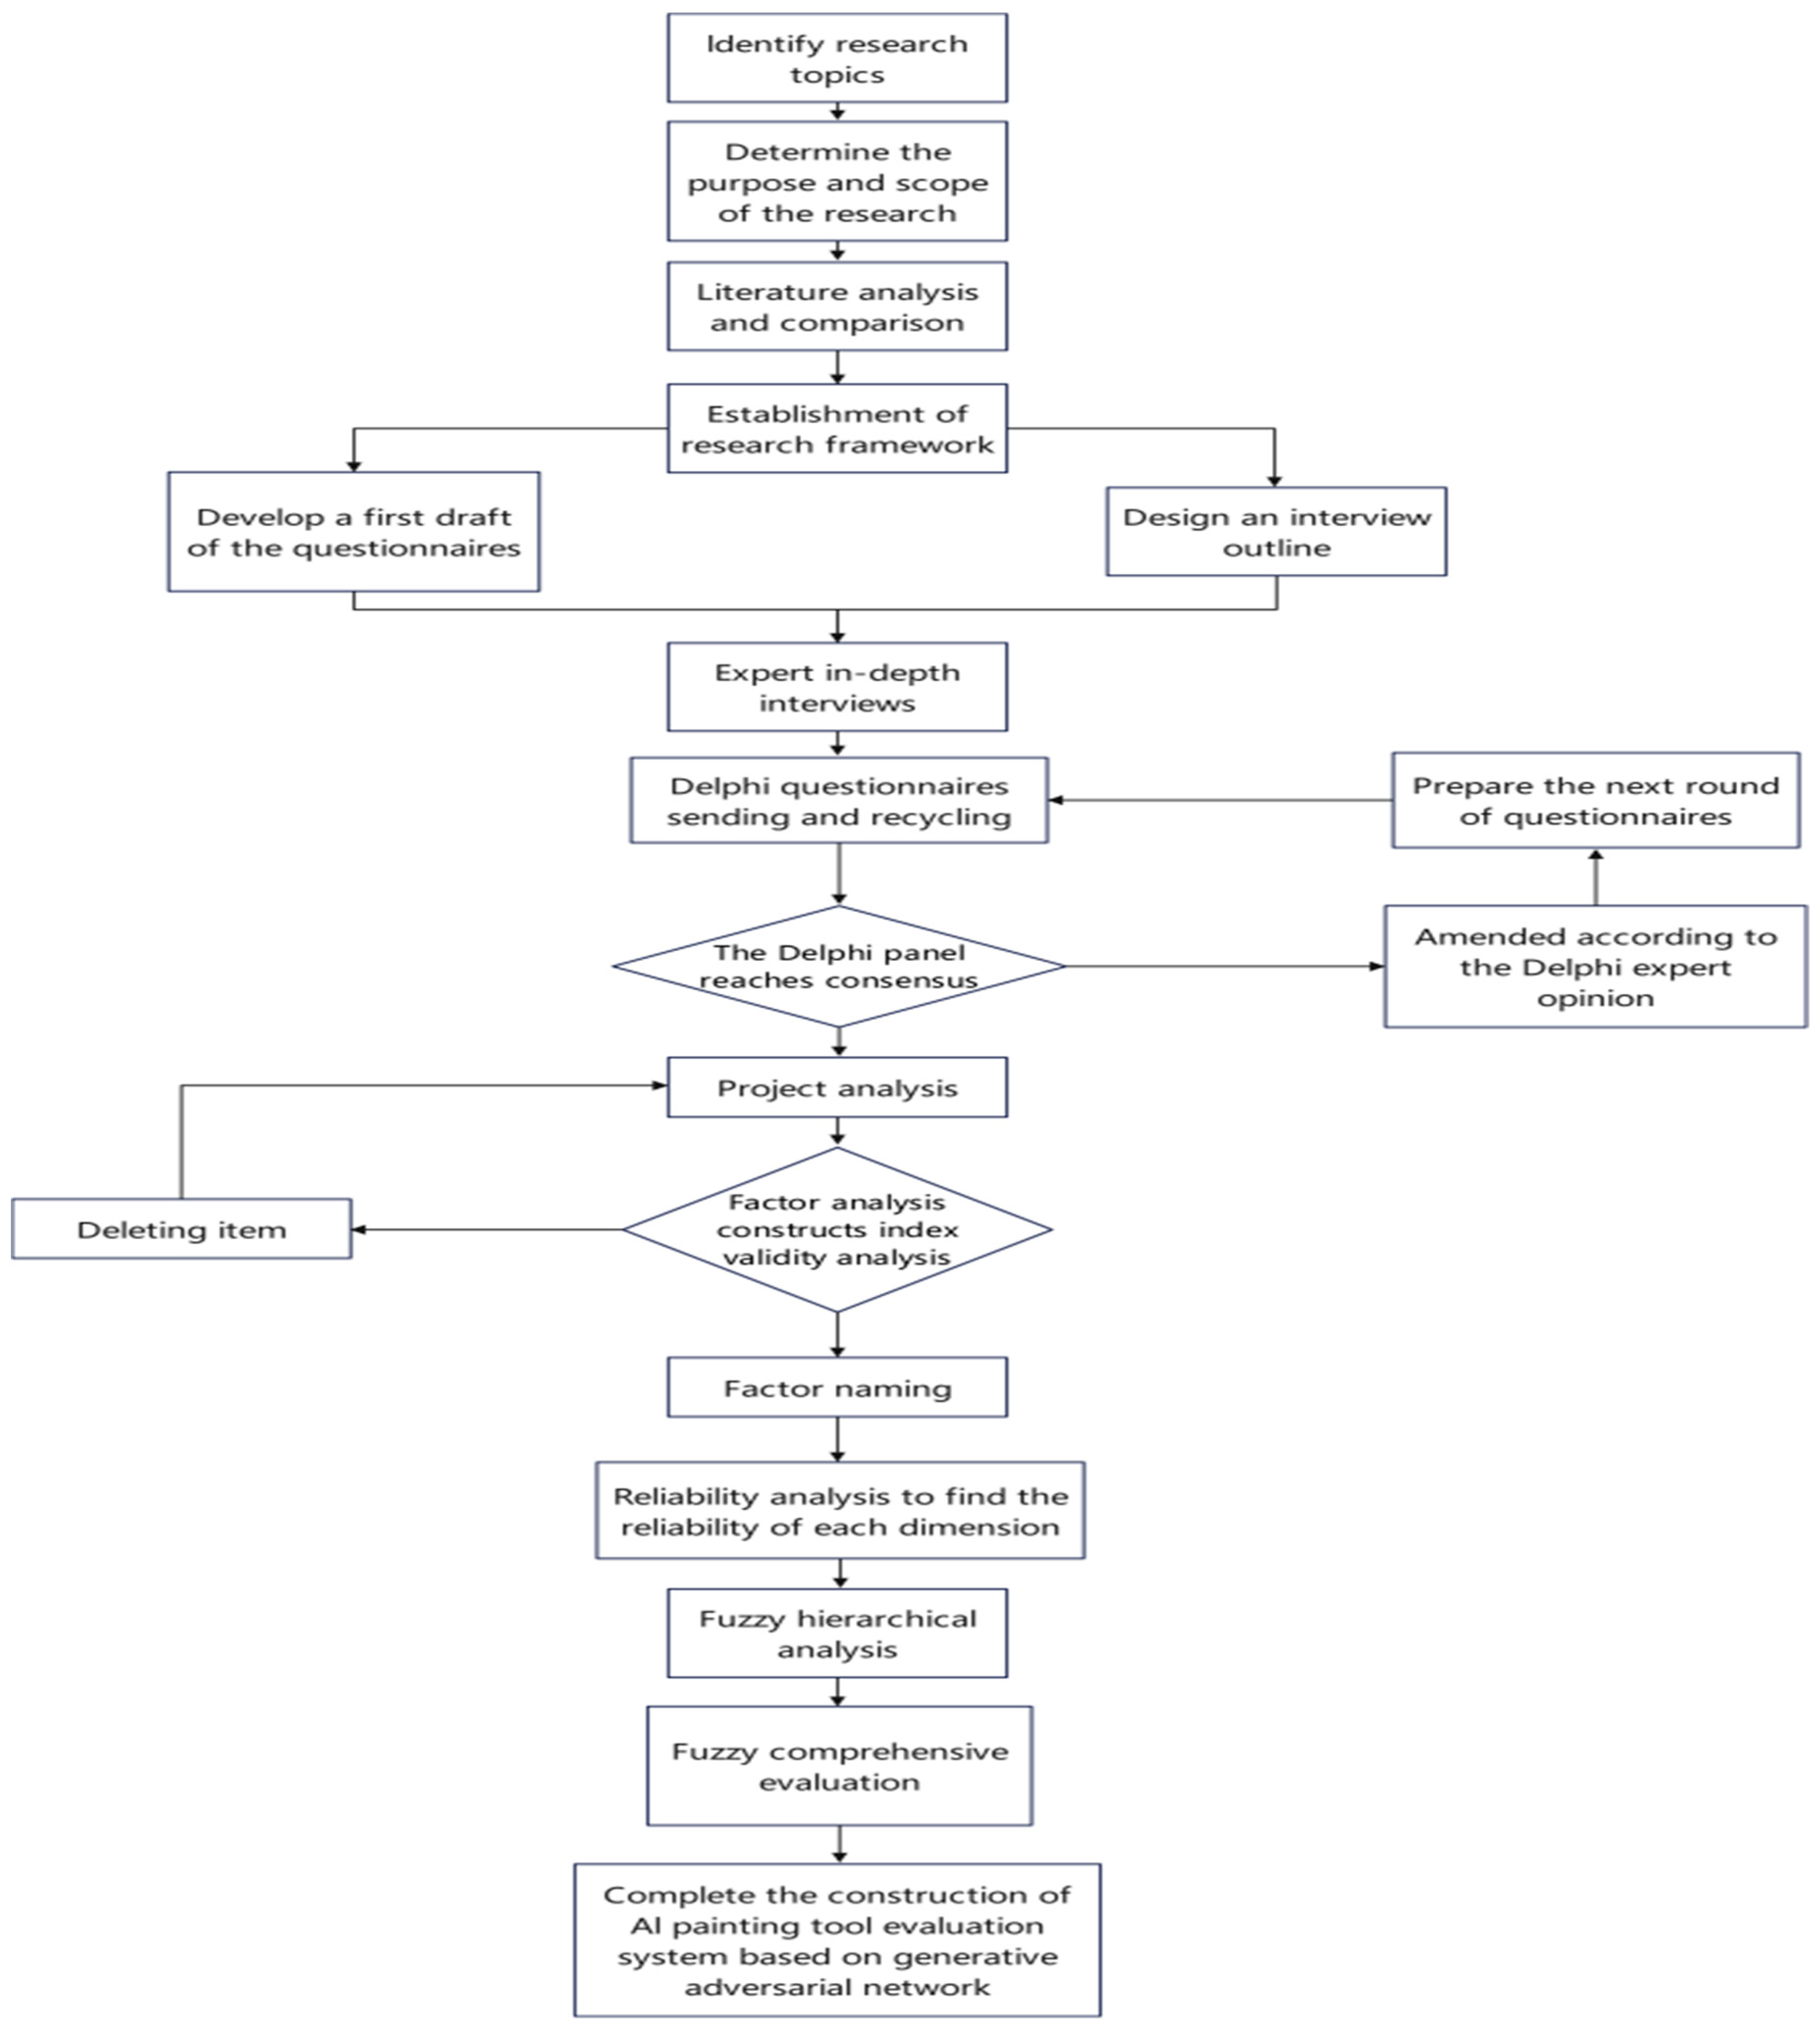
3.3. Implementing Procedures
3.4. Establishment of Evaluation System
3.5. Fuzzy Hierarchy Analysis
3.5.1. To Establish the Complementary Judgment Matrix
3.5.2. Determining the Weights of Complementary Judgment Matrices
3.6. Calculation of Fuzzy Integrated Evaluation
3.6.1. Establishment of Indicator Set
3.6.2. Establish the Evaluation Set
3.6.3. Determining the Vector of Weights for Primary and Secondary Indicators to Establish the Complementary Judgment Matrix
3.6.4. The Construction of a Fuzzy Evaluation Matrix
3.6.5. Deriving the Matrix of Fuzzy Integrated Evaluation
3.6.6. Calculation of the Scoring Results
4. Results and Discussion
4.1. Research Results
4.1.1. Establishment of Integrated Evaluation System
4.1.2. Fuzzy Analytical Hierarchical Process to Calculate the Weights of the Indicators
4.1.3. Evaluation of Fuzzy Integration
4.2. Integrated Discussion
4.2.1. Establishment and Analysis of the Evaluation System
4.2.2. Indicator Importance Ranking Results and Analysis
5. Conclusions
Author Contributions
Funding
Institutional Review Board Statement
Informed Consent Statement
Data Availability Statement
Conflicts of Interest
References
- Heidrich, D.; Schreiber, A. Visualizing source code as comics using generative AI. In Proceedings of the 2023 IEEE Working Conference on Software Visualization, Melbourne, Australia, 3–4 October 2023. [Google Scholar] [CrossRef]
- Phillips, C.; Jiao, J.; Clubb, E. Testing the capability of AI art tools for urban design. In Proceedings of the IEEE Computer Graphics and Applications Conference, Singapore, 17–19 March 2024. [Google Scholar] [CrossRef]
- Chen, F.; Zhu, F.; Wu, Q.; Zheng, J.; Zhang, X. A review of generative adversarial networks and their applications in image generation. J. Comput. Sci. 2021, 44, 347–369. [Google Scholar]
- Qiu, R.; Cao, Y.; Law, S.O.; University, N. On Copyright Protection of AI Creation. J. Nanchang Univ. (Humanit. Soc. Sci.) 2019, 2, 35–43+113. [Google Scholar]
- Yin, H.; Zhang, Z.; Liu, Y. The exploration of integrating the midjourney artificial intelligence generated content tool into design systems to direct designers towards future-oriented innovation. Systems 2023, 11, 566. [Google Scholar] [CrossRef]
- Hanafy, N.O. Artificial intelligence’s effects on design process creativity: A study on used AI Text-to-Image in architecture. J. Build. Eng. 2023, 80, 107999. [Google Scholar] [CrossRef]
- Zhang, B.; Zhou, Y.; Zhang, M.; Chen, H.; Li, J. Review of research on improvement and application of generative adversarial networks. Appl. Res. Comput. 2023, 40, 649–658. [Google Scholar]
- Rumelhart, D.E.; Hinton, G.E.; Williams, R.J. Learning representations by back-propagating errors. Nature 1986, 323, 533–536. [Google Scholar] [CrossRef]
- Kingma, D.P. Auto-encoding variational bayes. arXiv 2013, arXiv:1312.6114. [Google Scholar]
- Vincent, P.; Larochelle, H.; Lajoie, I.; Bengio, Y.; Manzagol, P.-A.; Bottou, L. Stacked denoising autoencoders: Learning useful representations in a deep network with a local denoising criterion. J. Mach. Learn. Res. 2010, 11, 3371–3408. [Google Scholar]
- Van Den Oord, A.; Vinyals, O. Neural discrete representation learning. Adv. Neural Inf. Process. Syst. 2017, 30. [Google Scholar] [CrossRef]
- Radford, A.; Kim, J.W.; Hallacy, C.; Ramesh, A.; Goh, G.; Agarwal, S.; Sastry, G.; Askell, A.; Mishkin, P.; Clark, J.; et al. Learning transferable visual models from natural language supervision. In Proceedings of the International Conference on Machine Learning, Vienna, Austria, 18–24 July 2021. [Google Scholar]
- Ramesh, A.; Pavlov, M.; Goh, G.; Gray, S.; Voss, C.; Radford, A.; Chen, M.; Sutskever, I. Zero-shot text-to-image generation. In Proceedings of the International Conference on Machine Learning, Vienna, Austria, 18–24 July 2021. [Google Scholar]
- O’Meara, J.; Murphy, C. Aberrant AI creations: Co-creating surrealist body horror using the DALL-E Mini text-to-image generator. Convergence 2023, 29, 1070–1096. [Google Scholar] [CrossRef]
- García-Ull, F.J.; Melero-Lázaro, M. Gender stereotypes in AI-generated images. Prof. De La Inf. 2023, 32, 5. [Google Scholar] [CrossRef]
- Liu, V.; Chilton, L.B. Design guidelines for prompt engineering text-to-image generative models. In Proceedings of the 2022 CHI Conference on Human Factors in Computing Systems, New Orleans, LA, USA, 29 April–5 May 2022. [Google Scholar] [CrossRef]
- Sukkar, A.W.; Fareed, M.W.; Yahia, M.W.; Abdalla, S.B.; Ibrahim, I.; Senjab, K.A.K. Analytical evaluation of Midjourney architectural virtual lab: Defining major current limits in AI-generated representations of Islamic architectural heritage. Buildings 2024, 14, 786. [Google Scholar] [CrossRef]
- Zhang, Y.; Liu, C. Unlocking the potential of artificial intelligence in fashion design and e-commerce applications: The case of Midjourney. J. Theor. Appl. Electron. Commer. Res. 2024, 19, 654–670. [Google Scholar] [CrossRef]
- Zhang, Z.; Wang, T.; Guo, X.; Liu, Z.; Chen, Y. Survey of AI painting. J. Front. Comput. Sci. Technol. 2024, 18, 1404–1420. [Google Scholar] [CrossRef]
- Goodfellow, I.; Pouget-Abadie, J.; Mirza, M.; Xu, B.; Warde-Farley, D.; Ozair, S.; Courville, A.; Bengio, Y. Generative adversarial networks. Commun. ACM 2020, 63, 139–144. [Google Scholar] [CrossRef]
- Zhang, Y. A survey on generative adversarial networks. Electron. Des. Eng. 2018, 26, 34–37. [Google Scholar] [CrossRef]
- Odena, A.; Olah, C.; Shlens, J. Conditional image synthesis with auxiliary classifier GANs. In Proceedings of the International Conference on Machine Learning, Sydney, Australia, 6–11 August 2017. [Google Scholar]
- Cheng, X.; Xie, L.; Zhu, J.; Chen, X. Review of Generative Adversarial Network. Comput. Sci. 2019, 3, 74–81. [Google Scholar] [CrossRef]
- Tao, F. Artificial intelligence visual arts research. Lit. Debate 2019, 7, 73–81. [Google Scholar]
- Liu, S. On the impact of AI painting on the field of cultural creativity. Contemp. Animat. 2023, 2, 91–95. [Google Scholar]
- Schetinger, V.; Di Bartolomeo, S.; El-Assady, M.; McNutt, A.; Miller, M.; Passos, J.P.A.; Adams, J.L. Doom or deliciousness: Challenges and opportunities for visualization in the age of generative models. Comput. Graph. Forum 2023, 42, 423–435. [Google Scholar] [CrossRef]
- Liu, W.; Wang, Y.; Zhao, M.; Zhang, X.; Sun, X. Developing evaluative indicators for educational games. Open Educ. Res. 2017, 2, 111–120. [Google Scholar] [CrossRef]
- Huang, B.; Yang, X.; Lu, M. Construction and application research of evaluation index system of platform education App. Chin. J. ICT Educ. 2019, 16, 75–81. [Google Scholar]
- Liu, Z.; Yu, Y.; Wang, Y.; Li, X.; He, Q. Design and application of enterprise IT service quality evaluation index system. J. Hubei Univ. (Nat. Sci.) 2013, 4, 527–532. [Google Scholar] [CrossRef]
- Liu, R.; Meng, X. Information system security evaluation method. J. Liaoning Tech. Univ. (Nat. Sci.) 2013, 11, 1517–1522. [Google Scholar] [CrossRef]
- Zhao, Y.; Liu, Z.; Liu, W.; Sun, X.; Wang, X. Building the evaluation index for creative open data competitions: A case study on the project of digital humanities. J. Libr. Sci. China 2020, 2, 75–95. [Google Scholar] [CrossRef]
- Xu, Z. Algorithm for priority of fuzzy complementary judgment matrix. J. Syst. Eng. 2001, 4, 311–314. [Google Scholar] [CrossRef]

| Basis of Judgment (Ca) | Quantified Value | Familiarity (Cs) | Quantified Value |
|---|---|---|---|
| Practical experience | 0.8 | Very familiar | 1 |
| Theoretical analysis | 0.6 | Familiarize | 0.8 |
| Peer understanding | 0.4 | General | 0.4 |
| Intuition | 0.2 | Less familiar | 0.2 |
| Scales | Description of Relative Importance |
|---|---|
| 0.5 | |
| 0.6 | |
| 0.7 | |
| 0.8 | |
| 0.9 | |
| 0.1~0.4 | The inverse of the above comparison |
| No | Subscale of Factors | No. of Items | Cronbach’s α | Cronbach’s α of Subscale |
|---|---|---|---|---|
| 1 | Image repair function | 5 | 0.927 | 0.912 |
| 2 | Image editing function | 4 | 0.866 | |
| 3 | Style conversion and transfer function | 4 | 0.915 | |
| 4 | Multi-layer image repair | 3 | 0.802 | |
| 5 | Visual harmony | 4 | 0.926 | 0.923 |
| 6 | Service quality | 3 | 0.931 | |
| 7 | Interaction | 3 | 0.811 | |
| 8 | Media suitability | 3 | 0.854 | |
| 9 | Pattern recognition | 3 | 0.881 | |
| 10 | Service stability | 5 | 0.922 | 0.931 |
| 11 | System response time | 2 | 0.947 | |
| 12 | Access security | 7 | 0.932 | 0.929 |
| 13 | Privacy security | 1 | 0.911 | |
| 14 | Coefficient of Cronbach’s alpha for the whole scales | 47 | 0.952 |
| Primary Index | Secondary Index | Three-Level Index | I.D. |
|---|---|---|---|
| Functionality | Image repair function | 1-2-4 Image Completion: Complete the missing parts of the image to make the image complete. | a124 |
| 1-2-6 Smart Contrast repair: Automatically adjust the contrast of images to improve image clarity. | a126 | ||
| 1-2-7 Color Repair: Repair damaged colors in images and restore true colors. | a127 | ||
| 1-2-10 Automatic Image Enhancement: The model automatically enhances all aspects of the image. | a1210 | ||
| 1-2-11 Intelligent Local repair: Intelligent repair for image local defects. | a1211 | ||
| Image editing function | 1-5-2 Transparency Adjustment: Adjust the transparency of the elements in the image to achieve a cascading effect. | a152 | |
| 1-5-4 Contrast and brightness adjustment: Adjust the contrast and brightness of images to optimize visual effects. | a154 | ||
| 1-5-5 Image Cutting and pasting: Precise cutting of images and pasting them into other images. | a155 | ||
| 1-5-6 Color Balance Adjustment: Balance the colors in the image, adjusting hue, saturation, and brightness. | a156 | ||
| Style conversion and transfer function | 1-1-3 Convert to oil painting Effect: Convert the image to an artistic effect that mimics an oil painting to enhance the artistic sense of the image. | a113 | |
| 1-1-4 Sketch Conversion: Transform images into a sketch style that highlights lines and outlines. | a114 | ||
| 1-1-6 Specific artist style: Imitate the creative style of specific artists, such as Van Gogh, Picasso, etc. | a116 | ||
| 1-1-7 Era style conversion: Transform images into styles of different historical eras, such as retro, futuristic, etc. | a117 | ||
| Multi-layer image repair | 1-2-12 Multi-model repair comparison: Use multiple models for image repair and compare. | a1212 | |
| 1-2-14 Image repair mode selection: Provide different repair modes for users to choose to meet different needs. | a1214 | ||
| 1-5-8 Multi-Layer editing: Allows you to create and edit multiple layers on an image for more complex designs. | a158 | ||
| Ease of use | Visual harmony | 2-1-1 color coordination: To ensure the entire interface’s color coordination, and to avoid the color being too harsh or not matching the combination. | a211 |
| 2-1-2 Color and theme matching: The color of the interface should match the theme and positioning of the image generation model. | a212 | ||
| 2-1-3 Font: Select a suitable font so that users can easily read and understand the text information on the interface. | a213 | ||
| 2-1-10 Consistent distribution of modules: Ensure the consistent distribution of modules in the interface of the image generation model so that users can easily find similar layouts under different pages or functions. | a2110 | ||
| Service quality | 2-4-2 Service Usefulness: The interface provides high service quality and helps to solve current problems. | a242 | |
| 2-4-4 Service integration: The services provided by the interface and the interface are integrated together. | a244 | ||
| 2-4-5 Service intelligence: The interface can help users solve questions with intelligent question-answering robots. | a245 | ||
| Interaction | 2-2-2 Component arrangement: The components in the picture are placed reasonably, in line with learners’ habits, and are easy to operate. | a222 | |
| 2-2-4 Interaction in a timely manner: Ensures that the user’s interaction with the model can be responded within a reasonable time, avoiding the user’s feelings of delay or waiting. | a224 | ||
| 2-2-6 Interactive personalization: Provide personalized interactive experience according to the user’s preferences and usage habits. | a226 | ||
| Media suitability | 2-3-3 Sound: Clear sound and good sound quality. | a233 | |
| 2-3-4 Video animation: The video animation is clear and smooth. | a234 | ||
| 2-3-5 Synchronization of text, pictures, sound and video animation: it means that the music, text and the content of the picture are displayed in the same rhythm. | a235 | ||
| Pattern recognition | 2-1-5 Humanistic elements: Integrate humanistic elements into the interface, such as ICONS, illustrations, etc., to enhance users’ emotional resonance and sense of participation. | a215 | |
| 2-1-6 Pattern and theme matching: Ensure that the pattern in the interface matches the theme of the image generation model. | a216 | ||
| 2-1-7 Pattern esthetics: The design of the pattern should meet esthetic standards. | a217 | ||
| System performance | Service stability | 3-2-1 No flash or crash: The image generation model does not flash or crash during operation. | a321 |
| 3-2-2 Links are valid: The links provided by the image generation model are valid, and users can access and use the related resources smoothly. | a322 | ||
| 3-2-3 Stable provision of resources: Resources (such as data, model files, etc.) required for image generation models can be provided to users stably and reliably. | a323 | ||
| 3-2-4 Complete service: Analyze user needs, design and develop complete functional modules, constantly optimize and improve service content, and provide comprehensive solutions. | a324 | ||
| 3-2-6 Effective service: Continuously improve the algorithm and model, optimize the service process and user experience, and improve the accuracy and quality of the generated effect to ensure the effectiveness of the service. | a326 | ||
| System response time | 3-3-2 Stable response time: Ensure that the response time of the image generation model remains stable under different loads and situations to avoid a decline in user experience due to load fluctuations. | a332 | |
| 3-3-3 Timely response rate: Measures the system’s ability to respond immediately to user requests, ensuring that users can quickly receive processing and feedback after submitting requests. | a333 | ||
| Security | Access security | 4-1-1 Authentication: Verify the user’s identity through a valid authentication method. | a411 |
| 4-1-2 Access Control: Manage and control user access to image generation models, ensuring that only authorized users can perform certain actions. | a412 | ||
| 4-1-3 Information Encryption: Encrypts sensitive information during transmission and storage to protect user data security. | a413 | ||
| 4-1-4 Anti-repudiation: Prevent users from denying their operations in the system, and ensure that users’ operations are traceable and immutable. | a414 | ||
| 4-1-6 Data Privacy Settings: Provides users with Settings to control the level of privacy of their data. | a416 | ||
| 4-1-7 Anti-Cheating measures: Prevent users or systems from being affected by fraud or misconduct. | a417 | ||
| 4-1-8 Identity ambiguity: Provides ambiguity to protect the identity of a user or object. | a418 | ||
| Privacy security | 4-2-3 Application Software Security: Protect the application software used by the image generation model from malicious attacks, exploits, and unauthorized access. | a423 |
| Dimension | Factor Naming | Item Number | Sum of Problems | Factor Load | Communality | Eigenvalue | Explanatory Variance | Cumulative Explanatory Variance |
|---|---|---|---|---|---|---|---|---|
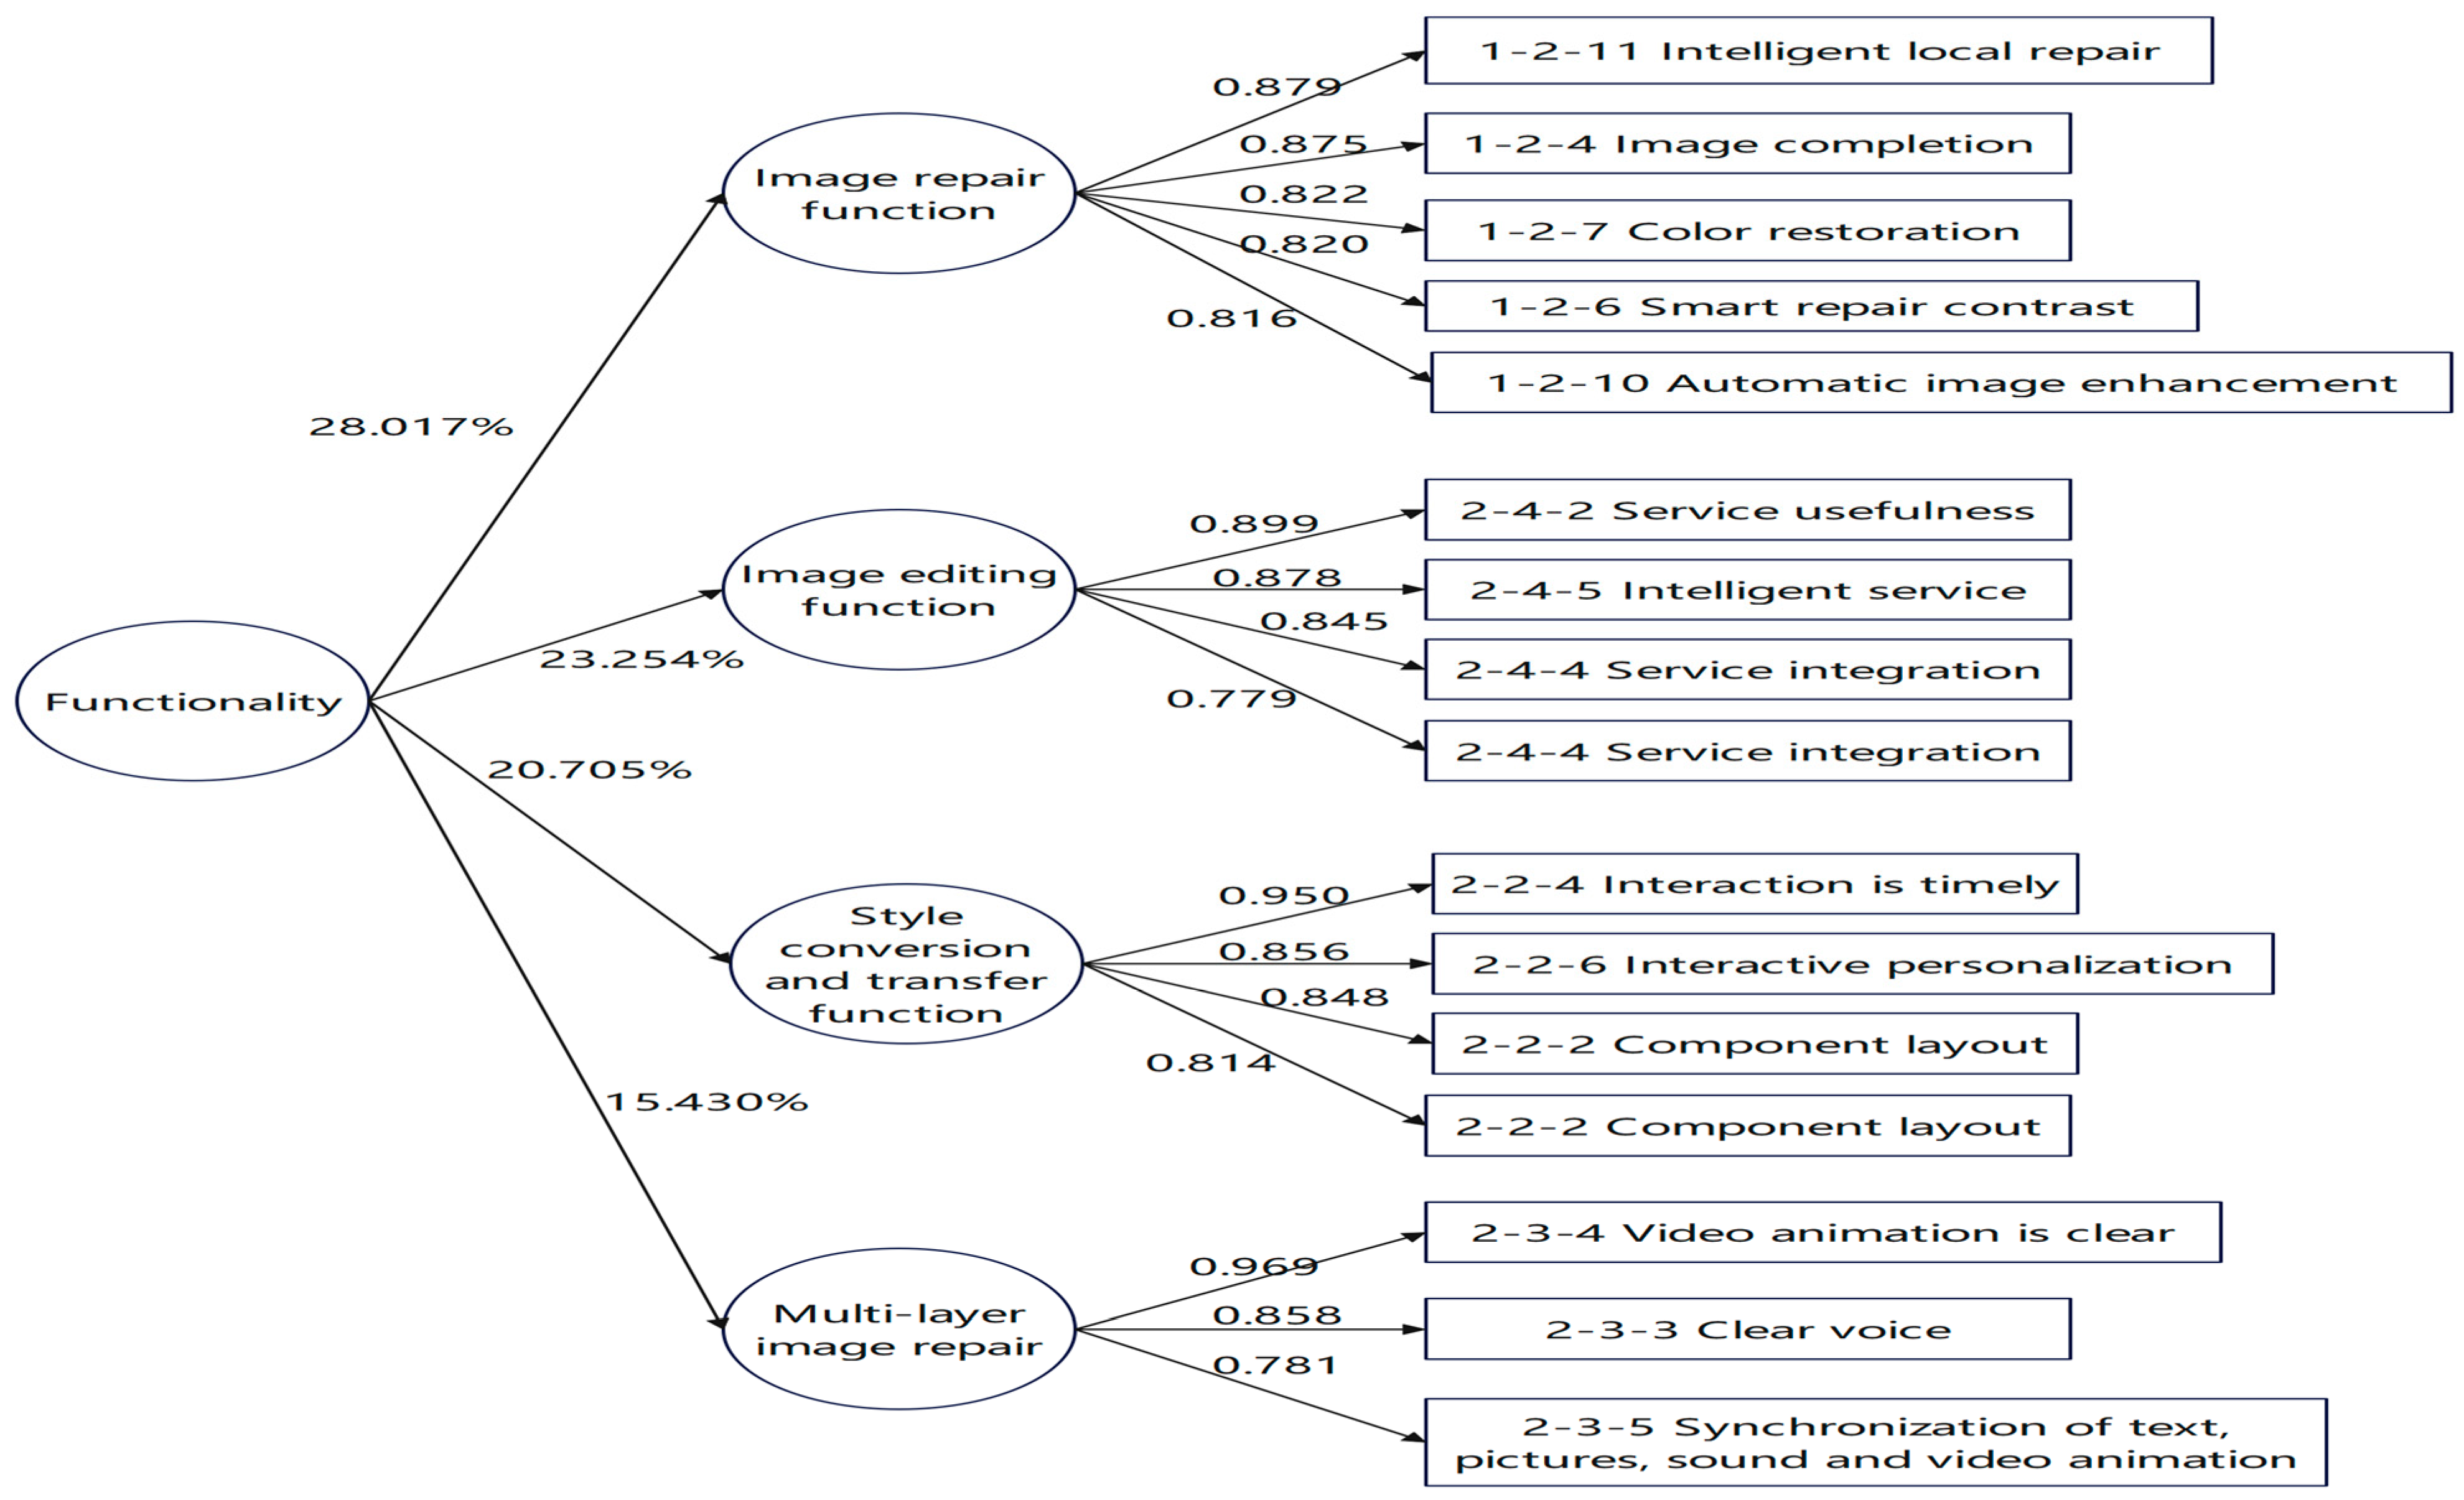
| Functionality | Image repair function | a1211 | 5 | 0.879 | 0.858 | 7.709 | 28.017% | 87.405% |
| a1210 | 0.875 | 0.930 | ||||||
| a124 | 0.822 | 0.907 | ||||||
| a127 | 0.820 | 0.919 | ||||||
| a126 | 0.816 | 0.802 | ||||||
| Image editing function | a152 | 4 | 0.899 | 0.838 | 4.706 | 23.254% | ||
| a156 | 0.878 | 0.841 | ||||||
| a155 | 0.845 | 0.848 | ||||||
| a154 | 0.779 | 0.771 | ||||||
| Style conversion and transfer function | a117 | 4 | 0.950 | 0.963 | 3.147 | 20.705% | ||
| a116 | 0.856 | 0.868 | ||||||
| a114 | 0.848 | 0.849 | ||||||
| a113 | 0.814 | 0.843 | ||||||
| Multilayer image repair | a1214 | 3 | 0.969 | 0.979 | 2.163 | 15.430% | ||
| a1212 | 0.858 | 0.931 | ||||||
| a158 | 0.781 | 0.789 | ||||||
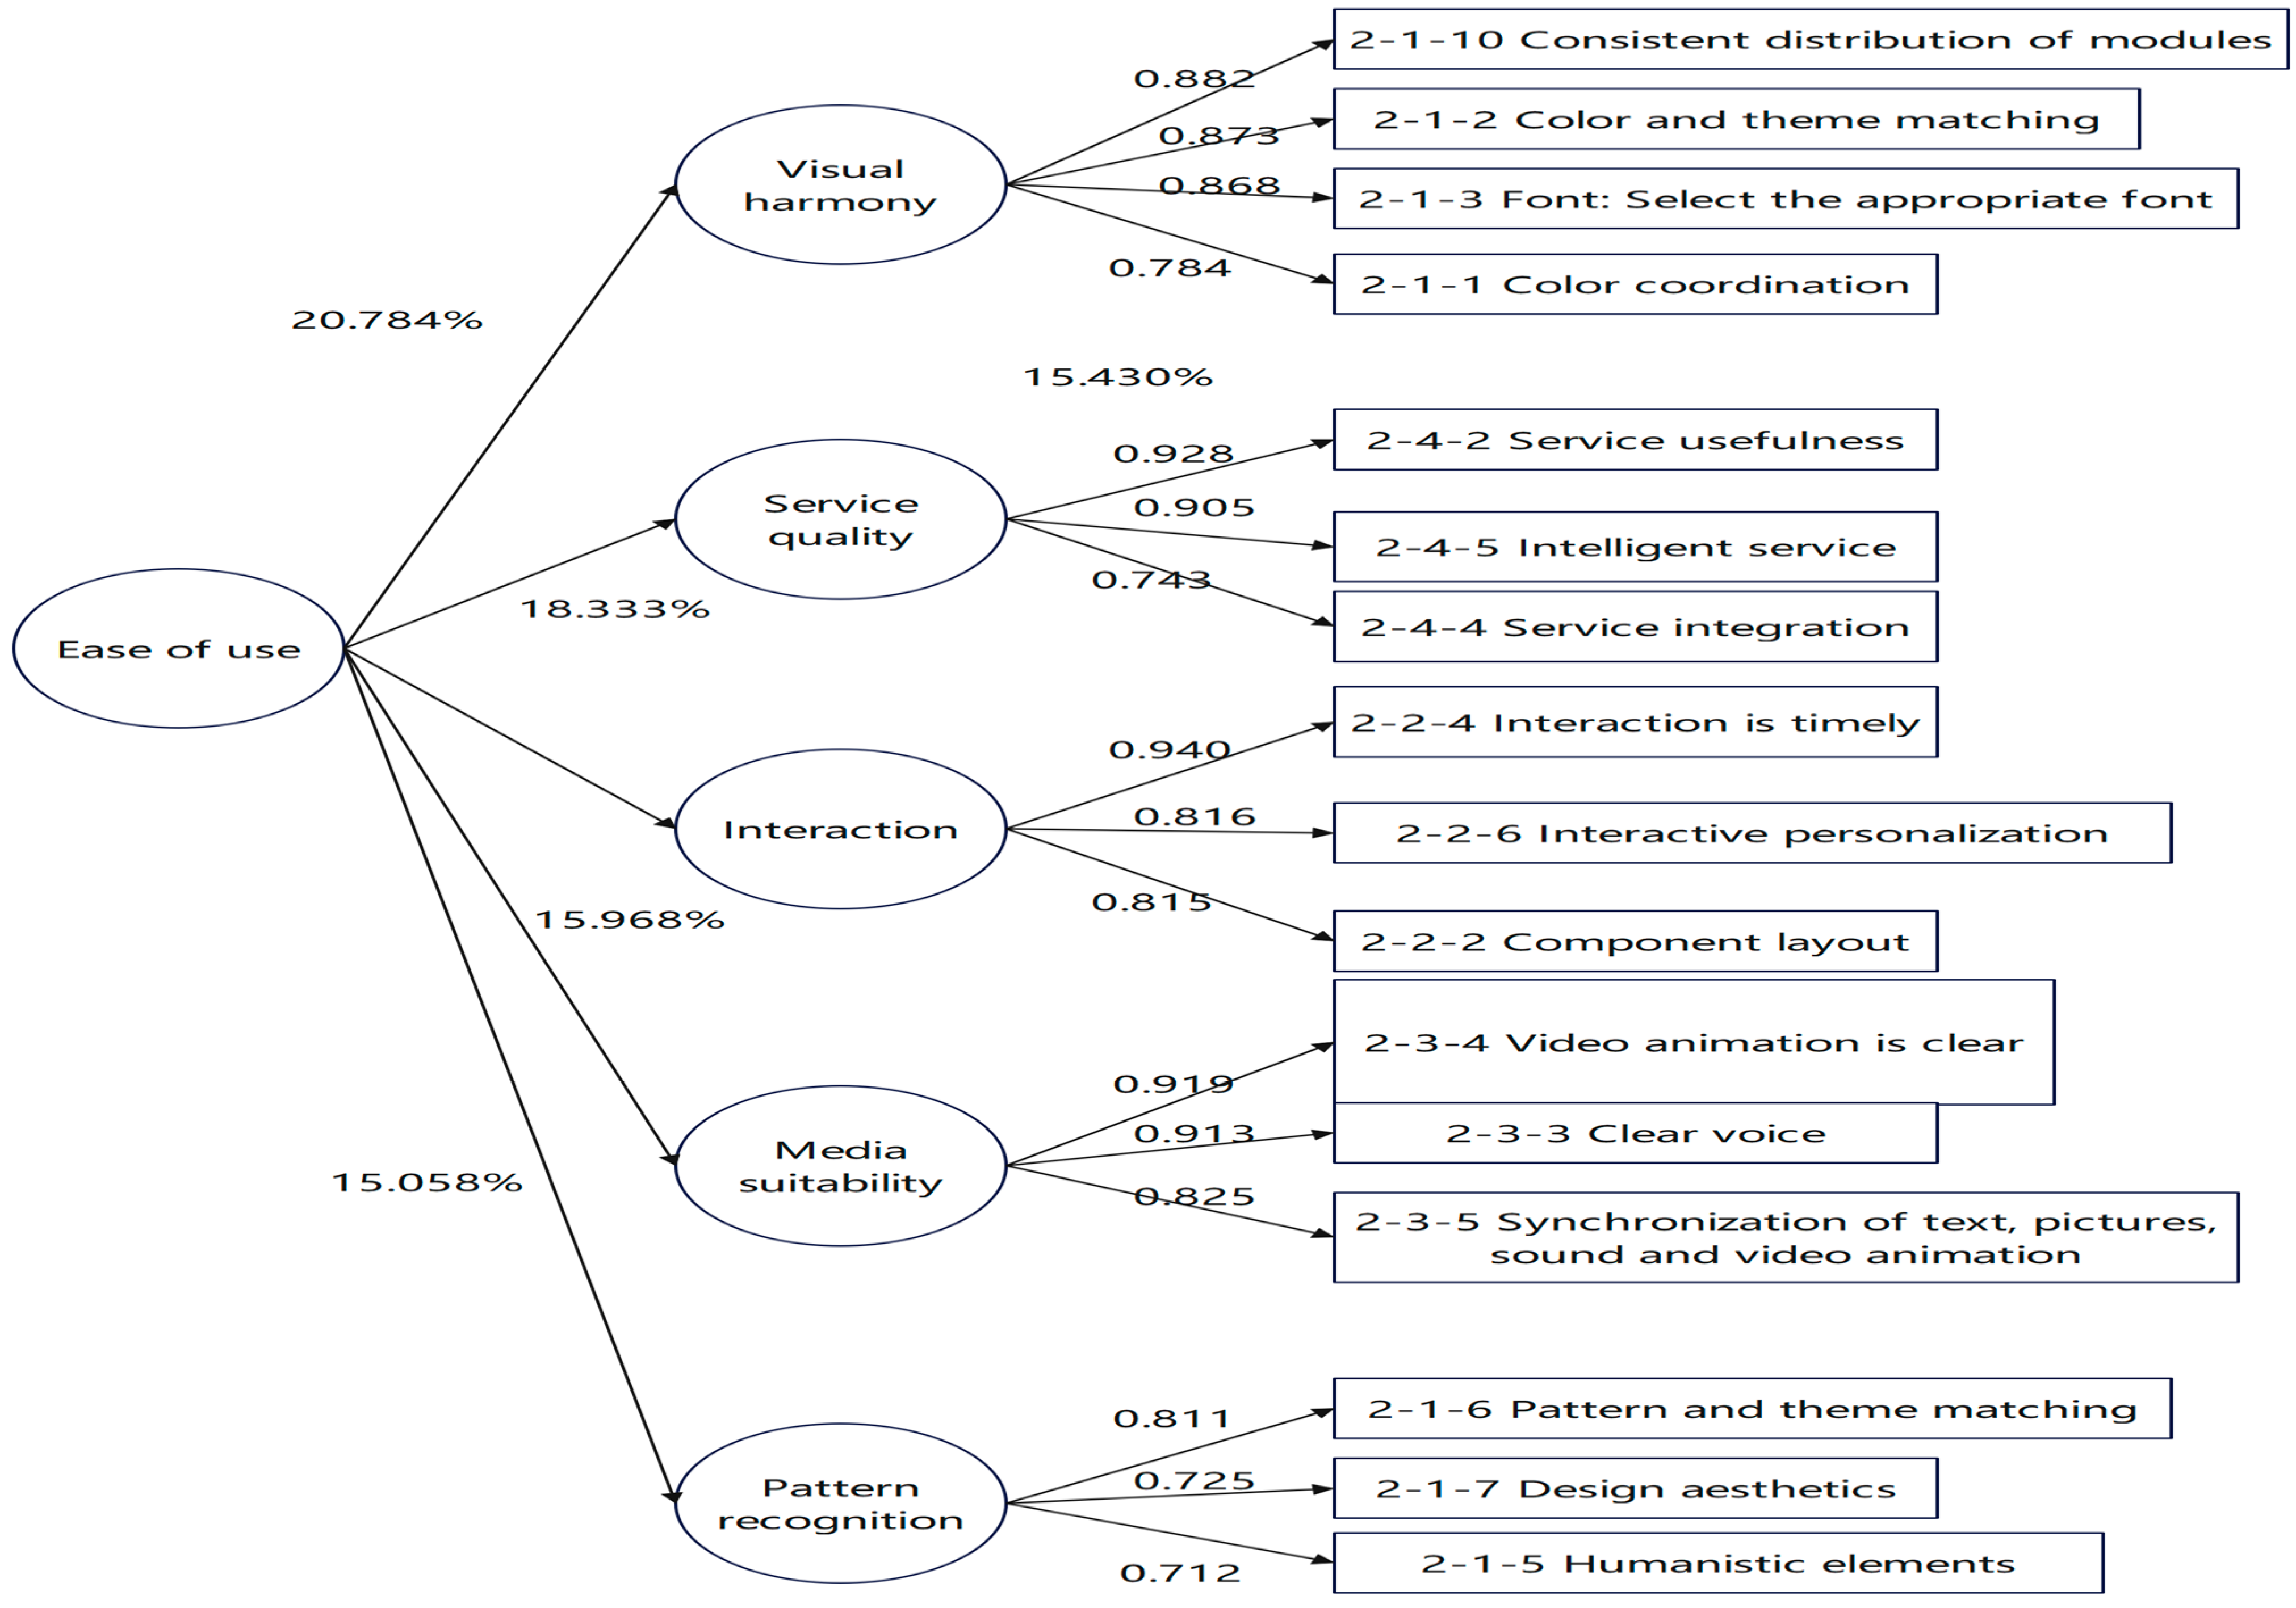
| Ease of use | Visual harmony | a213 | 4 | 0.882 | 0.846 | 5.006 | 20.784% | 84.897% |
| a2110 | 0.873 | 0.875 | ||||||
| a212 | 0.868 | 0.825 | ||||||
| a211 | 0.784 | 0.836 | ||||||
| Service quality | a242 | 3 | 0.928 | 0.985 | 4.248 | 18.333% | ||
| a245 | 0.905 | 0.881 | ||||||
| a244 | 0.743 | 0.703 | ||||||
| Interaction | a224 | 3 | 0.940 | 0.946 | 2.310 | 15.968% | ||
| a226 | 0.816 | 0.933 | ||||||
| a222 | 0.815 | 0.954 | ||||||
| Media suitability | a234 | 3 | 0.919 | 0.928 | 1.915 | 15.058% | ||
| a233 | 0.913 | 0.905 | ||||||
| a235 | 0.825 | 0.826 | ||||||
| Pattern recognition | a216 | 3 | 0.811 | 0.777 | 1.803 | 14.755% | ||
| a215 | 0.725 | 0.667 | ||||||
| a217 | 0.712 | 0.844 | ||||||
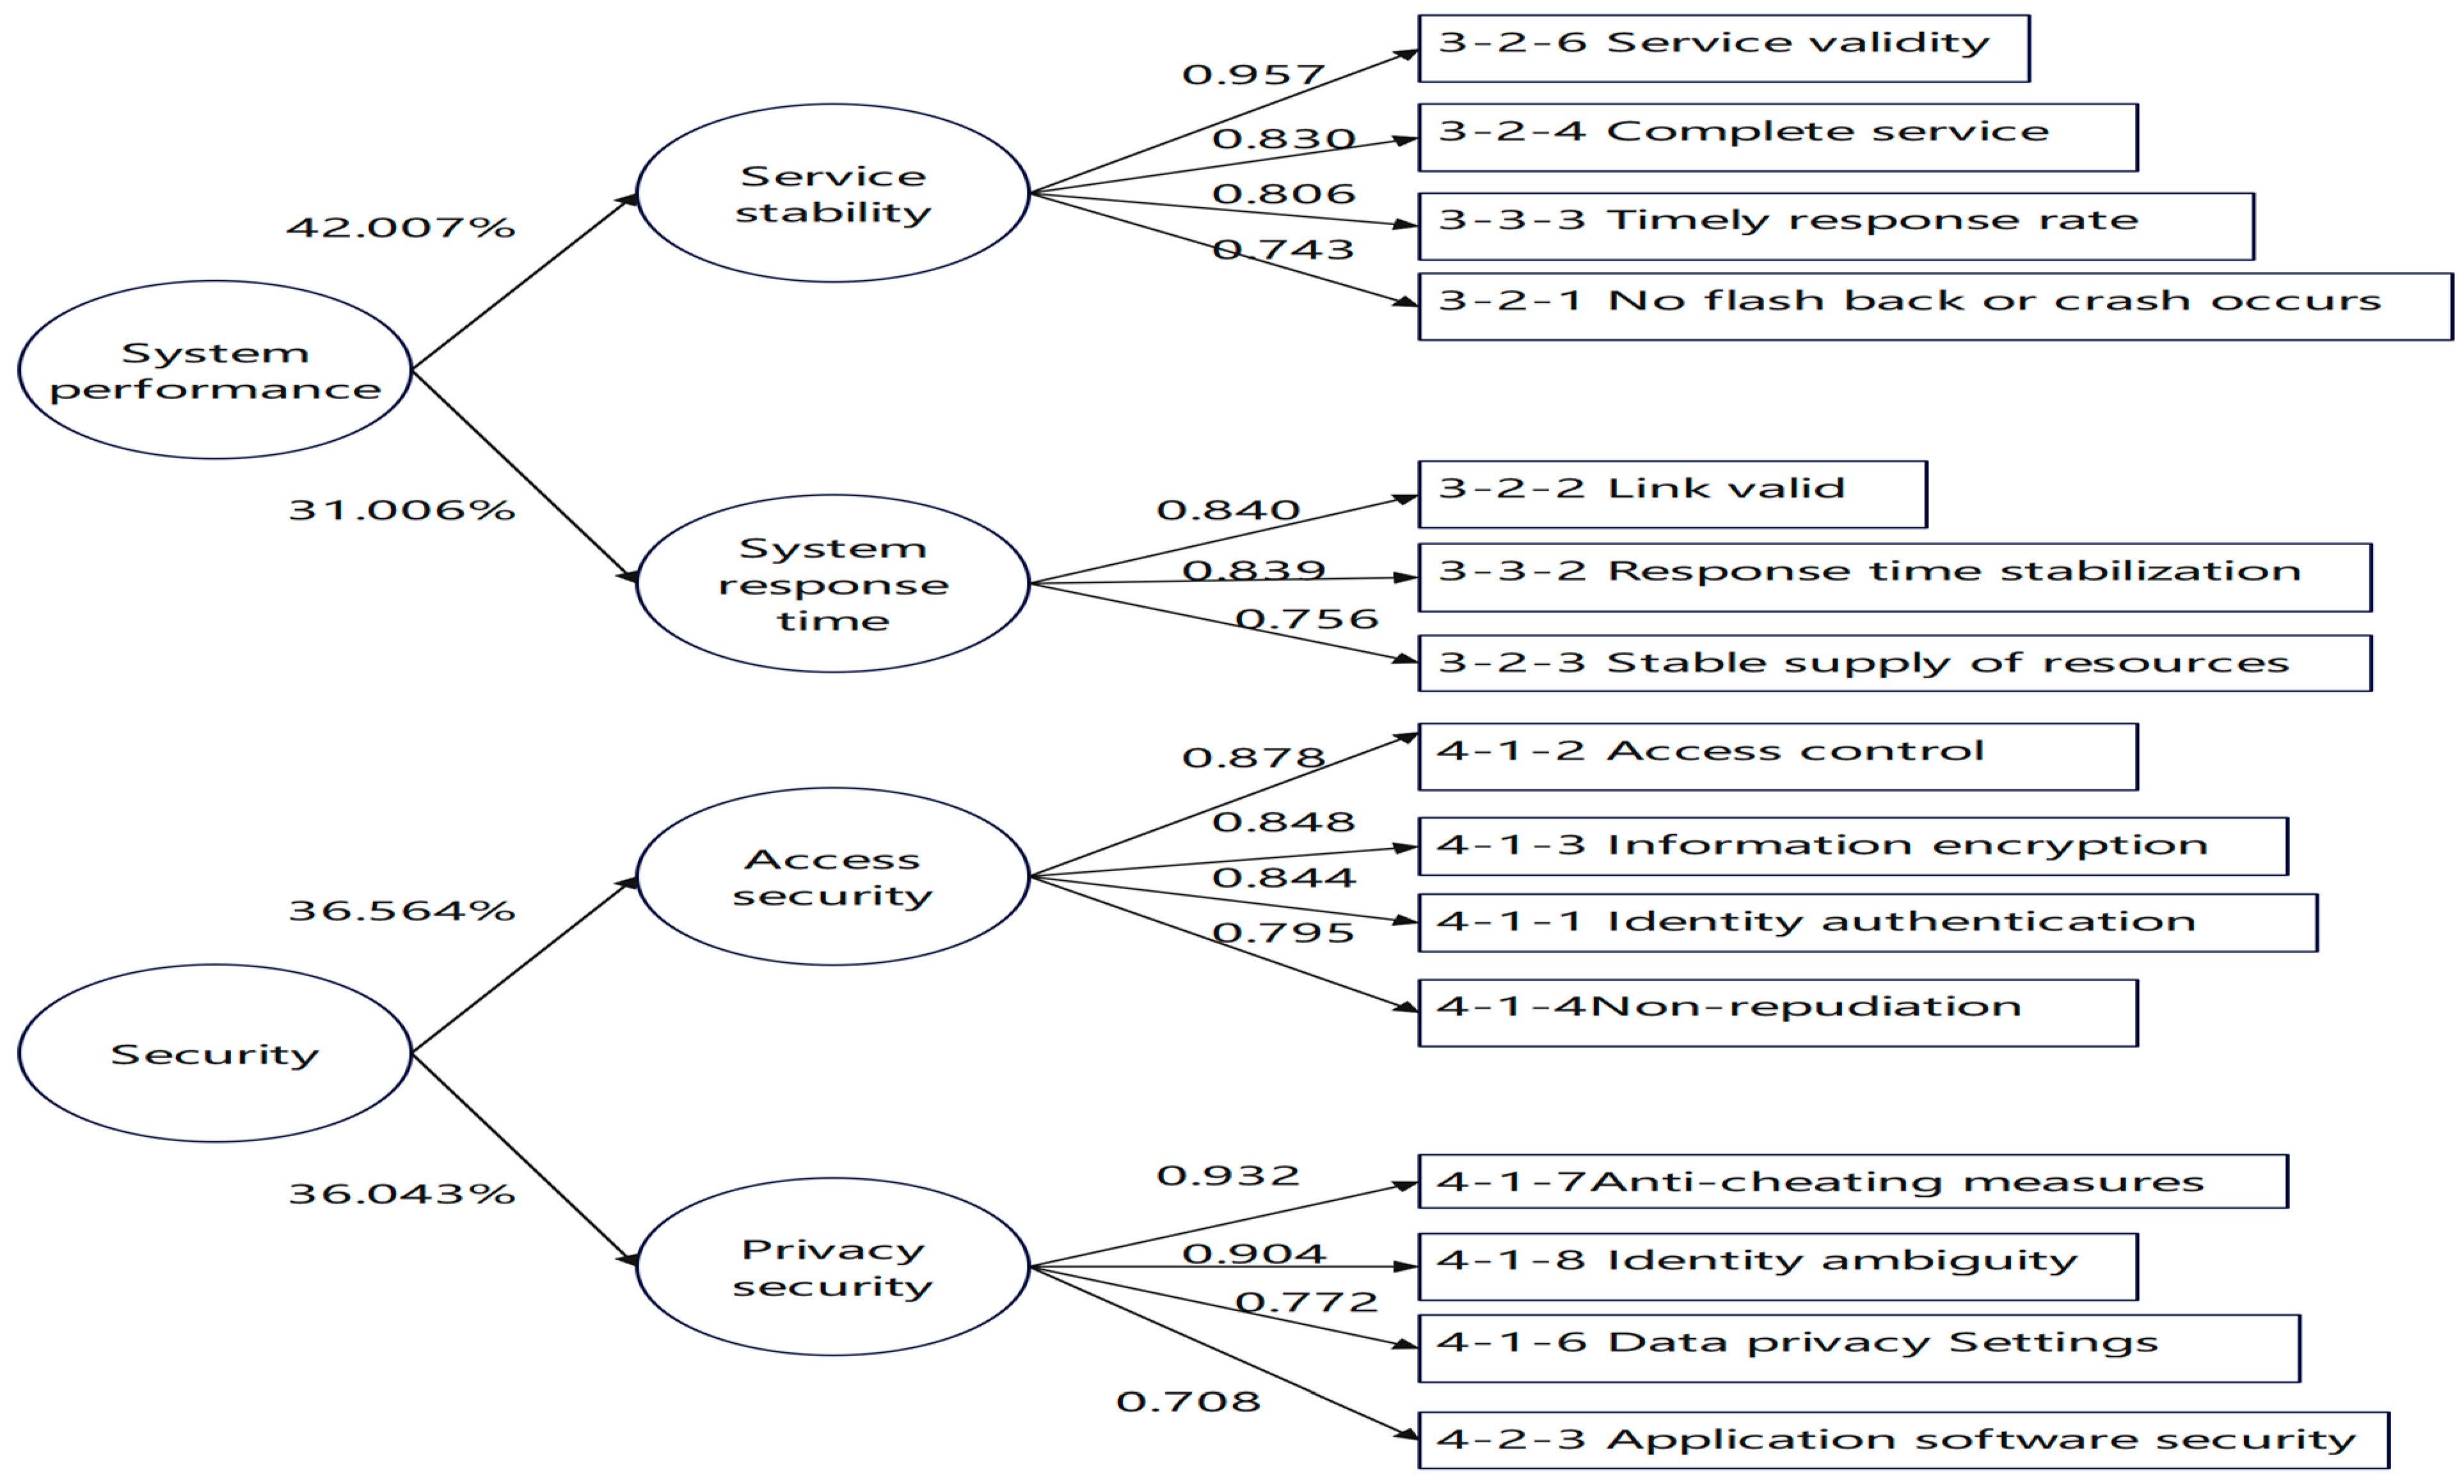
| System performance | Service stability | a326 | 4 | 0.957 | 0.918 | 3.573 | 42.007% | 73.013% |
| a324 | 0.83 | 0.774 | ||||||
| a333 | 0.806 | 0.720 | ||||||
| a321 | 0.743 | 0.584 | ||||||
| System response time | a322 | 3 | 0.84 | 0.705 | 1.538 | 31.006% | ||
| a332 | 0.839 | 0.782 | ||||||
| a323 | 0.756 | 0.628 | ||||||
| Security | Access security | a412 | 4 | 0.878 | 0.772 | 3.186 | 36.564% | 72.606% |
| a413 | 0.848 | 0.740 | ||||||
| a411 | 0.844 | 0.790 | ||||||
| a414 | 0.795 | 0.633 | ||||||
| Privacy security | a417 | 4 | 0.932 | 0.873 | 2.623 | 36.043% | ||
| a418 | 0.904 | 0.857 | ||||||
| a416 | 0.772 | 0.637 | ||||||
| a423 | 0.708 | 0.507 |
| Scale Valuer | Functionality | Ease of Use | System Performance | Security | |
|---|---|---|---|---|---|
| Functionality | 0.50 | 0.65 | 0.80 | 0.69 | 0.30 |
| Ease of use | 0.35 | 0.50 | 0.65 | 0.54 | 0.25 |
| System performance | 0.20 | 0.35 | 0.50 | 0.39 | 0.20 |
| Security | 0.31 | 0.46 | 0.61 | 0.50 | 0.24 |
| Functionality | Scale valuer | Multilayer image repair | Style transfer and transfer function | Image editing function | Image repair function | ||||||
| Multi-layer image repair | 0.5 | 0.42 | 0.22 | 0.2 | 0.19 | ||||||
| Style transfer and transfer function | 0.58 | 0.5 | 0.3 | 0.28 | 0.22 | ||||||
| Image editing function | 0.78 | 0.7 | 0.5 | 0.48 | 0.29 | ||||||
| Image repair function | 0.8 | 0.72 | 0.52 | 0.5 | 0.3 | ||||||
| Ease of Use | Scale valuer | Media suitability | Service quality | Interaction | Visual harmony | Pattern recognition | |||||
| Media suitability | 0.5 | 0.43 | 0.45 | 0.17 | 0.53 | 0.18 | |||||
| Service quality | 0.57 | 0.5 | 0.52 | 0.24 | 0.6 | 0.2 | |||||
| Interaction | 0.55 | 0.48 | 0.5 | 0.22 | 0.58 | 0.19 | |||||
| Visual harmony | 0.83 | 0.76 | 0.78 | 0.5 | 0.86 | 0.26 | |||||
| Pattern recognition | 0.47 | 0.4 | 0.42 | 0.14 | 0.5 | 0.17 | |||||
| System Performance | Scale valuer | Service stability | System response time | ||||||||
| Service stability | 0.5 | 0.65 | 0.57 | ||||||||
| System response time | 0.35 | 0.5 | 0.43 | ||||||||
| Security | Scale valuer | Privacy security | Access security | ||||||||
| Privacy security | 0.5 | 0.29 | 0.4 | ||||||||
| Access security | 0.71 | 0.5 | 0.6 | ||||||||
| Destination Layer | Synthesis Score | Primary Index | Score of Each Indicator |
|---|---|---|---|
| The assessment system of AI painting software based on GAN technology; 1 | 82.23 | Functionality; | 89.53 |
| Ease of use; | 83.1 | ||
| System performance; | 75.48 | ||
| Security; | 77.32 |
Disclaimer/Publisher’s Note: The statements, opinions and data contained in all publications are solely those of the individual author(s) and contributor(s) and not of MDPI and/or the editor(s). MDPI and/or the editor(s) disclaim responsibility for any injury to people or property resulting from any ideas, methods, instructions or products referred to in the content. |
© 2024 by the authors. Licensee MDPI, Basel, Switzerland. This article is an open access article distributed under the terms and conditions of the Creative Commons Attribution (CC BY) license (https://creativecommons.org/licenses/by/4.0/).
Share and Cite
Zhang, C.; Li, X.; Jean, M.-D. A Survey System for Artificial Intelligence-Based Painting Using Generative Adversarial Network Techniques. Appl. Sci. 2024, 14, 10060. https://doi.org/10.3390/app142110060
Zhang C, Li X, Jean M-D. A Survey System for Artificial Intelligence-Based Painting Using Generative Adversarial Network Techniques. Applied Sciences. 2024; 14(21):10060. https://doi.org/10.3390/app142110060
Chicago/Turabian StyleZhang, Chaoyang, Xiang Li, and Ming-Der Jean. 2024. "A Survey System for Artificial Intelligence-Based Painting Using Generative Adversarial Network Techniques" Applied Sciences 14, no. 21: 10060. https://doi.org/10.3390/app142110060
APA StyleZhang, C., Li, X., & Jean, M.-D. (2024). A Survey System for Artificial Intelligence-Based Painting Using Generative Adversarial Network Techniques. Applied Sciences, 14(21), 10060. https://doi.org/10.3390/app142110060